Shape and Pace of Change in the Electricity Transition: Sectoral dynamics and indicators of progress
Change is not linear.
Time and again, industries, policymakers and commentators have been caught off-guard by the pace of change that can erupt in markets, technologies, and societies. From propellers to jet engines, landlines to cell phones, CDs to streaming – the speed and scale of market transformation can be seismic.
Now, new analysis commissioned by the We Mean Business coalition and conducted by UCL Institute for Sustainable Resources (UCL ISR) details the exponential rate of change underway in renewable power, highlighting the need for businesses and governments to harness the growth opportunity to help reach the most ambitious goals of the Paris Agreement.
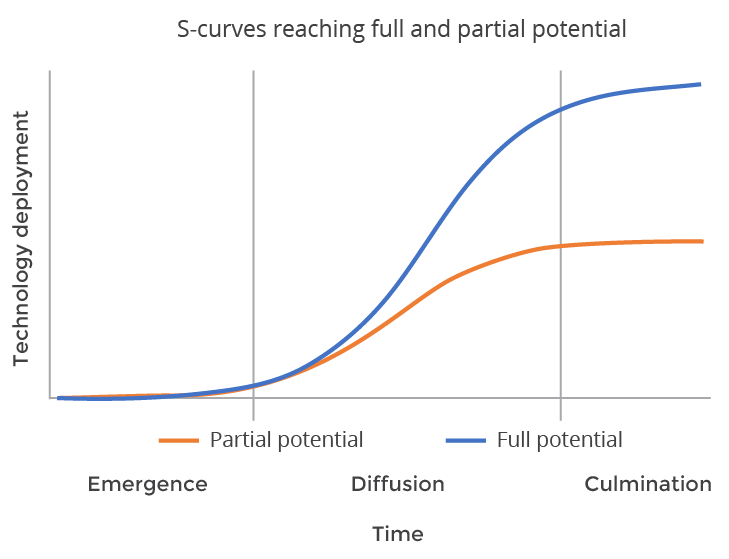
The report, Shape and Pace of Change in the Electricity Transition: Sectoral dynamics and indicators of progress, finds the adoption of renewable power to date fits with the dynamics of the ‘S-curve’ pattern. It highlights that renewable adoption is at a critical phase and urgent action is needed to help the emerging technology reach widespread uptake by harnessing exponential growth rates.
Harnessing the potential of the ‘S-curve’ is vital to drive the pace and scale of change necessary, helping to reduce greenhouse gas emissions in the power sector, in line with the 1.5ºC trajectory. Failure to do so could risk competitiveness and jobs at a time when the economy needs it most – in the wake of the Covid-19 pandemic. While continuing investment in fossil fuels risks stranded assets stalling the economic recovery.
This first report on the dynamics of ‘S-curves’ focuses on the renewable power because of the electricity sector’s critical role in leading the global transition to a net-zero carbon future and tackling the escalating climate crisis.
Pursuing efforts to limit warming to 1.5°C, as set out in the Paris Agreement, requires global power sector CO2 emissions to reach net-zero before 2050, with most studies showing that solar and wind are likely to become dominant sources of zero-carbon power. Many assessments of deployment levels to date are pessimistic at best, extrapolating linear growth and looking at the absolute contribution from renewable energy sources, which though growing, is still limited.
This report probes deeper and anchors its analysis in the more commonly observed nonlinear dynamics of technological transition, comparing the trends since 2010 with the pace of transition required, as can be seen in the graph below.
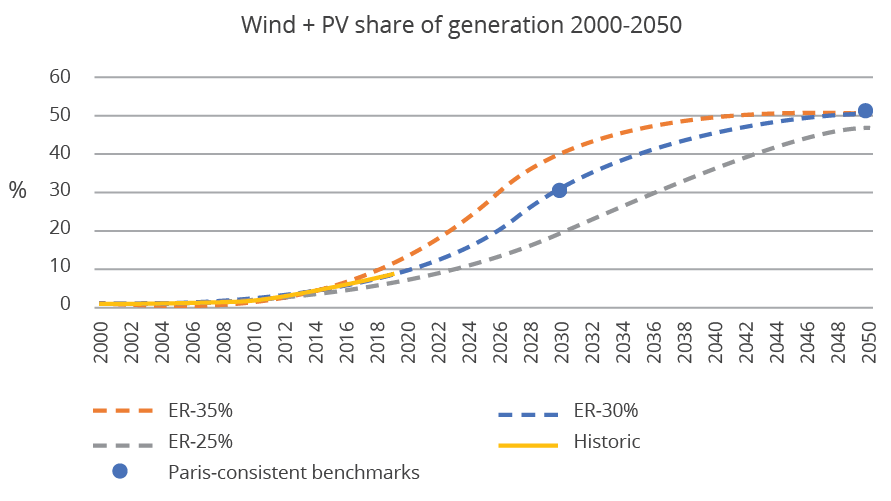 *ER – Emergence Rate
The results bring clarity to where progress is being made and where and how it needs to be pushed faster. A rapid transition is under way and appears now unstoppable, though its pace and depth will depend on how policy makers and businesses harness the potential. Find out more and download the full report below.