Technology
How Do Big Tech Giants Make Their Billions?


How Do Big Tech Giants Make Their Billions?
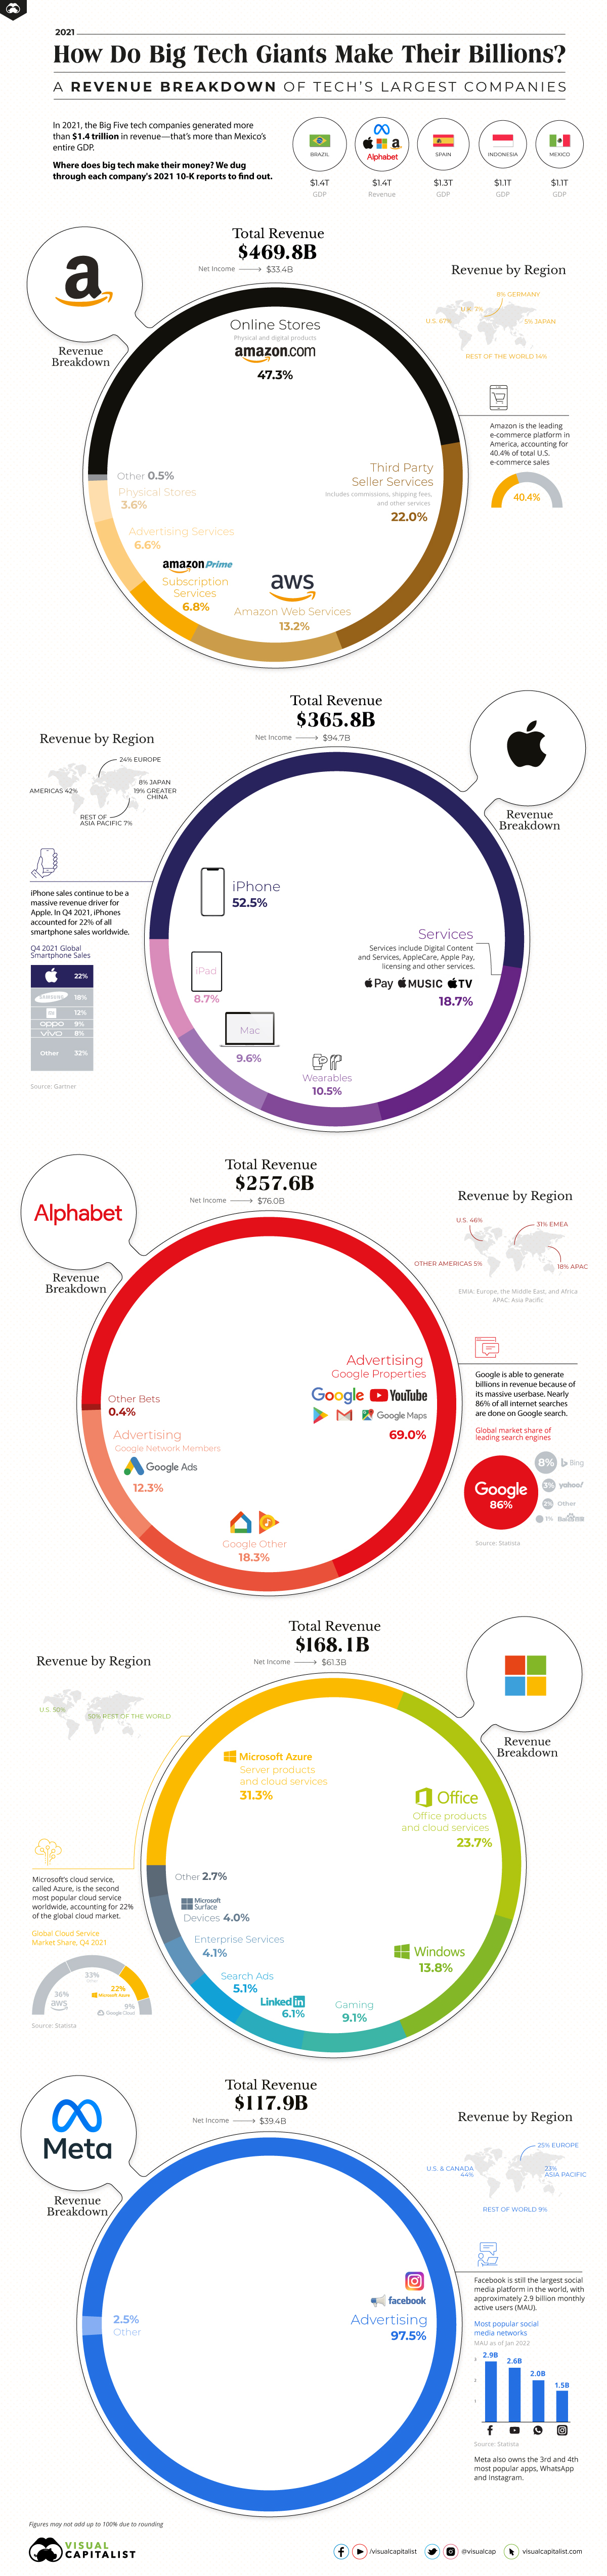
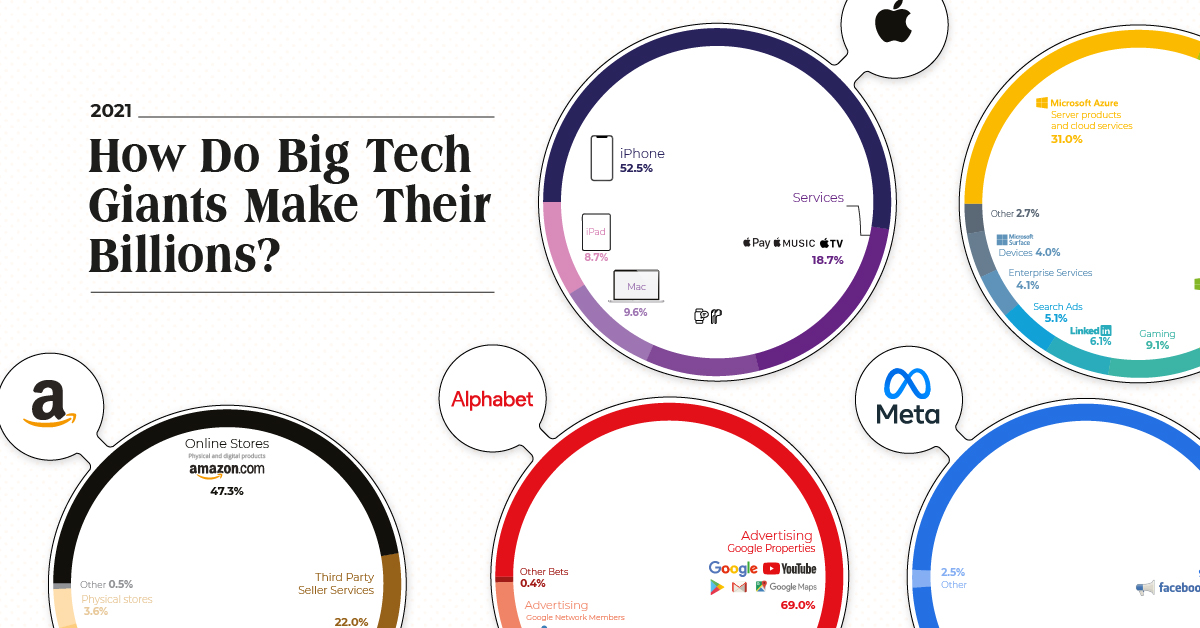
In 2021, the Big Five tech giants—Apple, Amazon, Google (Alphabet), Meta, and Microsoft—generated a combined $1.4 trillion in revenue.
What are the sources of this revenue, and how does it breakdown?
Below, we’ll dive into the main ways that these big tech giants generate revenue, and take a look at how much their revenues have increased in recent years.
Breaking Down Big Tech’s Revenue Streams
As we’ve mentioned in previous editions of this graphic, there are two main ways that big tech companies generate revenue:
- They either sell you a product
- Or sell you as the product to advertisers
Apple, Microsoft, and Amazon fall into the first category—like most traditional businesses, these companies offer customers a physical (or digital) product in exchange for money. More than half of Apple’s revenue comes from iPhone sales, Azure cloud services generate almost a third of Microsoft’s total, and Amazon’s online stores account for nearly 50% of the company’s revenue.
On the other hand, Meta and Alphabet do things a bit differently. Rather than selling an actual product, these two tech giants make most of their money by selling their audience’s attention. Nearly 98% of Meta’s revenue comes from Facebook ads, and 81% of Google’s revenue comes from advertising on various Google products.
However, despite their varying ways of generating sales, these companies all have one thing in common: revenues have soared in recent years.
The Pandemic Has Sped Up Growth
Amidst rising unemployment and pandemic-induced chaos, the Big Five still managed to see a significant revenue uptick.
In 2019 (pre-pandemic), big tech’s combined revenue grew by 12%. The following year, throughout the onset of the global pandemic and the various economic challenges that came with it, big tech still increased its combined revenue by 19%.
And in the 2021 fiscal year, big tech saw a 27% growth in combined revenue, year-over-year.
| Company | Revenue (FY 2020) | Revenue (FY 2021) | Growth (YoY) |
|---|---|---|---|
| Apple | $274.5 billion | $365.8 billion | 33% |
| Amazon | $386.1 billion | $469.8 billion | 22% |
| Alphabet | $182.5 billion | $257.6 billion | 41% |
| Microsoft | $143.1 billion | $168.1 billion | 17% |
| Meta | $86.0 billion | $117.9 billion | 37% |
| Combined | $1.1 trillion | $1.4 trillion | 27% |
How did these companies continue to thrive throughout economic turmoil and global chaos? It was made possible because the societal changes triggered by COVID-19 ended up driving demand for big tech’s products and services.
For example, lockdown restrictions forced people to shop online, causing e-commerce sales to escalate. Demand for laptops and cloud-based services grew as offices shut down and companies pivoted to fully remote workspaces.
Is Growth Here to Stay?
These days, COVID-19 restrictions have eased in most countries, and the world has slowly returned to normalcy.
But that doesn’t mean growth for big tech will stop. In fact, the pandemic-induced changes to our work and shopping habits will likely stick around, meaning the increased demand for big tech’s offerings could be here to stay.
Two-thirds of employees from a global survey said their company would likely make remote work a permanent option. And global e-commerce sales are expected to grow steadily over the next few years to reach $7 trillion by 2025.


Technology
Countries With the Highest Rates of Crypto Ownership
While the U.S. is a major market for cryptocurrencies, two countries surpass it in terms of their rates of crypto ownership.


Countries With the Highest Rates of Crypto Ownership
This was originally posted on our Voronoi app. Download the app for free on iOS or Android and discover incredible data-driven charts from a variety of trusted sources.
This graphic ranks the top 10 countries by their rate of cryptocurrency ownership, which is the percentage of the population that owns crypto. These figures come from crypto payment gateway, Triple-A, and are as of 2023.
Data and Highlights
The table below lists the rates of crypto ownership in the top 10 countries, as well as the number of people this amounts to.
| Country | % of Population Who Own Crypto | # of Crypto Owners |
|---|---|---|
| 🇦🇪 United Arab Emirates | 30.4 | 3M |
| 🇻🇳 Vietnam | 21.2 | 21M |
| 🇺🇸 U.S. | 15.6 | 53M |
| 🇮🇷 Iran | 13.5 | 12M |
| 🇵🇭 Philippines | 13.4 | 16M |
| 🇧🇷 Brazil | 12 | 26M |
| 🇸🇦 Saudi Arabia | 11.4 | 4M |
| 🇸🇬 Singapore | 11.1 | 665K |
| 🇺🇦 Ukraine | 10.6 | 4M |
| 🇻🇪 Venezuela | 10.3 | 3M |
Note that if we were to rank countries based on their actual number of crypto owners, India would rank first at 93 million people, China would rank second at 59 million people, and the U.S. would rank third at 52 million people.
The UAE Takes the Top Spot
The United Arab Emirates (UAE) boasts the highest rates of crypto ownership globally. The country’s government is considered to be very crypto friendly, as described in Henley & Partners’ Crypto Wealth Report 2023:
In the UAE, the Financial Services Regulatory Authority (FSRA-ADGM) was the first to provide rules and regulations regarding cryptocurrency purchasing and selling. The Emirates are generally very open to new technologies and have proposed zero taxes for crypto owners and businesses.
Vietnam leads Southeast Asia
According to the Crypto Council for Innovation, cryptocurrency holdings in Vietnam are also untaxed, making them an attractive asset.
Another reason for Vietnam’s high rates of ownership could be its large unbanked population (people without access to financial services). Cryptocurrencies may provide an alternative means of accessing these services without relying on traditional banks.
Learn More About Crypto From Visual Capitalist
If you enjoyed this post, be sure to check out The World’s Largest Corporate Holders of Bitcoin, which ranks the top 12 publicly traded companies by their Bitcoin holdings.

-

 Energy5 days ago
Who’s Building the Most Solar Energy?
-

 Wealth2 weeks ago
Charted: Which Country Has the Most Billionaires in 2024?
-

 Business2 weeks ago
The Top Private Equity Firms by Country
-

 Markets2 weeks ago
The Best U.S. Companies to Work for According to LinkedIn
-

 Economy2 weeks ago
Ranked: The Top 20 Countries in Debt to China
-

 Misc1 week ago
Charted: Trust in Government Institutions by G7 Countries
-

 Energy1 week ago
Mapped: The Age of Energy Projects in Interconnection Queues, by State
-

 Mining1 week ago
Visualizing Global Gold Production in 2023