Reconsidered: My 1992 Book on Global Warming
•Download as DOC, PDF•
47 likes•13,523 views

Twenty years ago, I wrote "Global Warming: Understanding the Forecast," the companion book to the first museum exhibition on the greenhouse effect and global warming, at the American Museum of Natural History. Here is a near-final draft of the text (it's too hard to update fully to the final published text). On Dot Earth, I'll be examining (with reader assistance) where the book has -- or has not -- held up, what was missed, and other notions. It's valuable, as a writer or consumer of writing, to track how old output holds up, as a way to avoid mistakes going forward. Related posts on Dot Earth: http://j.mp/dotwarmbook92

Recommended
More Related Content
What's hot
What's hot (20)
Viewers also liked
Similar to Reconsidered: My 1992 Book on Global Warming
Similar to Reconsidered: My 1992 Book on Global Warming (20)
More from Earth Institute of Columbia University
More from Earth Institute of Columbia University (20)
Recently uploaded
Recently uploaded (10)
Reconsidered: My 1992 Book on Global Warming
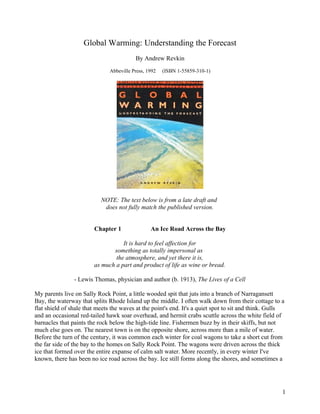
- 1. Global Warming: Understanding the Forecast By Andrew Revkin Abbeville Press, 1992 (ISBN 1-55859-310-1) NOTE: The text below is from a late draft and does not fully match the published version. Chapter 1 An Ice Road Across the Bay It is hard to feel affection for something as totally impersonal as the atmosphere, and yet there it is, as much a part and product of life as wine or bread. - Lewis Thomas, physician and author (b. 1913), The Lives of a Cell My parents live on Sally Rock Point, a little wooded spit that juts into a branch of Narragansett Bay, the waterway that splits Rhode Island up the middle. I often walk down from their cottage to a flat shield of shale that meets the waves at the point's end. It's a quiet spot to sit and think. Gulls and an occasional red-tailed hawk soar overhead, and hermit crabs scuttle across the white field of barnacles that paints the rock below the high-tide line. Fishermen buzz by in their skiffs, but not much else goes on. The nearest town is on the opposite shore, across more than a mile of water. Before the turn of the century, it was common each winter for coal wagons to take a short cut from the far side of the bay to the homes on Sally Rock Point. The wagons were driven across the thick ice that formed over the entire expanse of calm salt water. More recently, in every winter I've known, there has been no ice road across the bay. Ice still forms along the shores, and sometimes a 1
- 2. thin sheet forms briefly over the whole bay, but it's never so thick that you could walk on it, let alone drive a truck across it. The warmth that has prevented the bay from freezing recently may simply be a fluke of New England weather, the changeability of which is legend. Then again, the milder winters may be a sign that it is not just the weather that is changing this time, but the climate -- the general pattern of temperature and moisture for the region, and possibly the entire globe. Climate change is nothing new. Evidence of that can be found in the boulders that are strewn around the cow pastures in Exeter, a few miles inland from my parents' home. Those refrigerator- size chunks of granite were deposited by a mile-thick sheet of ice that scraped south across New England 20,000 years ago. At the time, because of a slow, regular variation in Earth's orbit and other factors, ice covered vast regions of North America, Europe and Asia. Standing on Sally Rock Point today, it is impossible to comprehend a time when more than 5,000 feet of ice pressed down on the land. And it's remarkable to think that since that time the average temperature of the planet has risen just nine degrees Fahrenheit -- that just nine degrees can mean the difference between a mile of ice and a wind-dappled bay with a forested shore. The climate change that may be occurring now is disturbingly different from the slow, steady cycle of ice ages and warmings that has sculpted the face of Earth for two million years. It may be that the recent lack of sea ice from this arm of Narragansett Bay is one result of the warming of Earth's atmosphere by a growing greenhouse effect. This is the tendency of certain gases in the atmosphere to trap solar energy -- just as the glass panes of a greenhouse roof help make it possible to grow tomatoes in winter. The atmosphere has always acted like a greenhouse, with water vapor and a tiny trace of carbon dioxide -- just a few hundredths of a percent -- allowing sunlight in but preventing the sun-warmed planet from radiating all that energy back into space. Indeed, without this insulating blanket, Earth would more closely resemble its frozen, barren cousin Mars, whose thin atmosphere has almost no significant greenhouse properties. What concerns scientists now is that, for the first time, the composition of Earth's atmosphere is being rapidly altered by human activity. In a way, it's not surprising that a species as prolific and industrious as Homo sapiens should have an impact on the dynamics of the entire globe. Since the last time the ice sheets pulled back toward the poles, some 15,000 years ago, the number of humans on the planet has risen from 5 million to 5.3 billion. Even if people only modified the landscape in the simplest ways, say, by chopping down forests, the effect on the planet would be significant. But the human impact has been amplified to an extraordinary degree by our unique ability to fashion tools and technologies that increase our power to change the world. Here is a species that began its reign by taming fire and has since moved on to replicate the fusion energy of the sun in a hydrogen bomb. Along the way, humans discovered the vast stores of energy that lay locked up in subterranean pockets of oil, coal, and natural gas -- the fuels that stoked the boilers of the Industrial Revolution and still power our productive, but profligate, lifestyle today. Just since World War II, the industrial output of the developed world has increased 40 times over. But there has been a hidden cost. All of that combustion -- in power plants and automobiles and factories -- has transformed tens of billions 2
- 3. of tons of ancient, buried carbon into a great burst of carbon dioxide gas that has significantly changed the atmosphere. The incineration of tropical forests, by releasing more carbon dioxide, has added greatly to the problem. Today, for every one of the 5.3 billion people on Earth, three tons of carbon dioxide is spewed into the air each year. In the energy-addicted United States, the rate is 18 tons of carbon dioxide a year per person. Even though Americans comprise just five percent of the world's population, they consume 30 percent of the world's oil. In a year, a typical commuter's car burns so much gasoline that it releases more than three times its own weight in carbon dioxide into the atmosphere. As a result, in just the past 100 years, the concentration of this heat-trapping gas has risen 25 percent. By the latter half of this century, it's likely that the amount of carbon dioxide in the atmosphere will have doubled or climbed even higher. Moreover, other gases generated by human agriculture and industry also trap heat -- gases such as methane, nitrous oxide, and chlorofluorocarbons, or CFC's. (Those same CFC's, used as refrigerants, propellants in some spray cans, and in some foam packaging, also attack the protective shield of ozone in the upper reaches of the atmosphere.) Overall, the warming effect of these other greenhouse gases is expected eventually to equal, if not exceed, that of carbon dioxide. Thus, an era has begun in which humans are no longer simply polluting a particular lake, or cutting down a certain forest, but changing the composition and dynamics of one of the essential components of the planet. Because the atmosphere is intimately linked with Earth's other components -- the oceans, the soil, the sheets of ice at the poles, the flow of energy from the sun, and the web of life -- humans have in an instant of geological time taken hold of the reins guiding this rare blue sphere into the future. Many atmospheric scientists say that the long-heralded climatic "signal" -- clear evidence that all of these emissions from human activity have turned up the global thermostat – has been seen. Leaves still fall in October and snow still falls in February, but the odds of Washington or Dallas having a particularly steamy summer have already tipped notably toward the hotter; the odds of the Grain Belt having a drought have probably tipped toward the drier. Already, in the decade of the 1980s, Earth experienced the six hottest years on record. The first year of the 1990s was hotter still. Computer models that simulate the workings of the atmosphere project that the expected doubling of carbon dioxide levels sometime next century will raise the world's average temperature anywhere from three degrees to eight degrees Fahrenheit. In other words, it's just possible that the climate may be jogged by a change nearly as dramatic as the one that melted the mile of ice that once lay on Sally Rock Point. And this new change will occur in just a century, not one hundred centuries. In that instant of geologic time, the planet will become warmer than it has been in several million years. There is a disturbing litany of possible impacts of such a change: warming seas expand and glaciers melt, adding water to the oceans, which may inundate coastal communities and island nations and create millions of eco-refugees; changing climate patterns disrupt agriculture and exterminate ecosystems that cannot shift fast enough to keep up; frozen tundra thaws, potentially releasing 3
- 4. massive amounts of methane that add to the greenhouse effect. In 1987, the list filled a heavy red book -- a book as thick as the Manhattan Yellow Pages -- called "Preparing for Climate Change." In the 1990s, heavy tomes are coming thick and fast, focusing on everything from the spread of insect-borne diseases to the deterioration of coral reefs. Fortunately, the same intelligence that has allowed humans to dominate and scar the planet in such a short time also endows them with foresight -- the ability to anticipate the consequences of actions. Hundreds of scientists worldwide have made clear the consequences of our current course. But anticipation, in itself, is insufficient. Scientists have listed dozens of prudent actions that can be taken now to limit the impending disruption both to civilization and the biosphere -- actions ranging from screwing in a more efficient light bulb to planting a forest. For industrialized nations, this would mean modifying the formula by which they measure progress -- for the first time taking into account the environmental cost of growth. If evidence for global warming continues to mount, more dramatic measures can be considered, with the eventual result being an early end to the age of oil and coal, when progress came so cheaply -- mined or pumped from a hole in the ground. For the developing nations, it may mean leapfrogging past the mistakes of the industrialized world. The hard part is that the changes taking place in the composition of the atmosphere, although racing along at a pace unprecedented in recent planetary history, are imperceptible to human eyes. Even though any signal of global warming is still largely hidden in the statistical "noise" produced by normal fluctuations in weather, that provides little comfort to people such as Jose Lutzenberger. A noted Brazilian environmentalist, Lutzenberger was appointed that country's first Secretary of the Environment. This was a hopeful development for Brazil, a nation that had incinerated two Californias’ worth of Amazon rain forest in just 10 years. Lutzenberger insists that the lack of certainty of greenhouse warming is no reason not to act now. This is how he put it to me one evening, while we sat sipping beers in a town deep in the Amazon, a place where it is rare not to smell wood smoke in the wind -- smoke from thousands of fires set by men clearing the jungle to make cattle pasture. "A complicated system can take a lot of abuse, but you get to a point where suddenly things fall apart," Lutzenberger said. "It's like pushing a long ruler toward the edge of a table. Nothing happens, nothing happens, nothing happens. Then, suddenly, the ruler falls to the floor." That may well be true for climate. By the time the change caused by all that abuse is obvious -- by the time the ruler clatters to the floor -- it may be too late to change our fate. ~ ~ ~ When I was a college student in London some 30 years ago, I stopped by one day at a little book- sellers' fair that convened every lunch hour in the financial district. Among the crumbling leather- bound remains of someone's literary estate, piled high on one of the wooden carts, I found a slim volume called “The Physical Geography of the Sea,” by Matthew Fontaine Maury. It was a sea captain's guide to the basics of oceanography and meteorology, published in 1859 by Sampson Low, Son, and Co. The book sat on my shelf, largely unread, until recently, when I opened it and found a chapter entitled, "The Atmosphere." Nowhere else have I seen a passage that so effectively describes the workings of the "spherical shell which surrounds our planet," as the author puts it. And the book speaks powerfully of the importance of treating the atmosphere with respect: 4
- 5. The atmosphere "warms and cools by turns the earth and the living creatures that inhabit it. It draws up vapours from the sea and land, retains them dissolved in itself, or suspended in cisterns of clouds, and throws them down again as rain or dew when they are required.... It affords the gas which vivifies and warms our frames, and receives into itself that which has been polluted by use, and is thrown off as noxious.... "It is only the girdling encircling air, that flows above and around all, that makes the whole world kin. The carbonic acid [carbon dioxide] with which to-day our breathing fills the air, to-morrow seeks its way round the world. The date-trees that grow round the falls of the Nile will drink it in by their leaves... and the palms and bananas of Japan will change it into flowers. The oxygen we are breathing was distilled for us ... by the magnolias of the Susquehanna, and the great trees that skirt the Orinoco and the Amazon.... The rain we see descending was thawed for us out of the icebergs which have watched the polar star for ages, and the lotus lilies have soaked up from the Nile, and exhaled as vapour, snows that rested on the summits of the Alps. "Hence, to the right-minded mariner, and to him who studies the physical relations of earth, sea, and air, the atmosphere is something more than a shoreless ocean, at the bottom of which he creeps along.... It is an inexhaustible magazine, marvellously adapted for many benign and beneficent purposes. "Upon the proper working of this machine depends the well being of every plant and animal that inhabits the earth; therefore the management of it, its movements, and the performance of its offices, cannot be left to chance." Now we have arrived at a time when, voluntarily or involuntarily, humans are indeed "managing" the atmosphere. We had better manage it well. The importance of changing our ways came to me recently as I sat once again on Sally Rock Point, this time with my six-month-old son on my lap. On that chilly winter day, I found myself contemplating the warmer future that will probably confront my son before he reaches old age. As I watched Daniel's eyes scan the water, my mind filled with images of this corner of the Earth as it might be transformed by the sudden warming resulting from that blanket of greenhouse gases. I saw waves inundating the remains of my parents' abandoned house and washing over the dying salt marshes that had no room to retreat. I saw beetles and termites devouring the skeletons of the pine forest that once flourished behind the house, but now had shriveled because of drier, hotter summers. And, strangely, I heard laughter. It was the chuckle of the future residents of Sally Rock Point, laughing incredulously as someone told them a story about an old ice road that once cut across the bay. Chapter 2 A Scene of Changes The world’s a scene of changes, and to be Constant 5
- 6. in Nature were inconstancy. -Abraham Crowley, English poet (1618-1667), “Inconstancy” Earth’s atmosphere presents a paradox: It is in constant flux, yet it is also remarkably stable. The flux is obvious to anyone who has sat in a field on a blustery day and looked up at a scudding panorama of clouds, then sun, then a shower, then sun again. From North Atlantic gales to a line of thunderstorms rumbling across Kansas, from Los Angeles's searing Santa Ana winds to a deep- freeze blizzard in Montana, things are on the move. Hour by hour, day by day, season by season, weather patterns sweep across the face of the planet, all ultimately driven by energy from the sun. This great spinning sheath of gases is constantly being heated and cooled, blended and stirred. Warm air rises and cold air falls. Water evaporates and then condenses as clouds, rain, or snow. The patterns range in size from the tiny dust devils that stir up leaves as they dance across a field to the globe-spanning jet stream and hurricanes with the power of hundreds of hydrogen bombs. The stability and predictability of the atmosphere become apparent at larger scales of space and time. From a distance it appears almost serene -- that "moist, gleaming membrane of bright blue sky," as Lewis Thomas once described it. When the small gusts and weather fronts and local storms are averaged out, the system begins to show signs of order. Although it is impossible, for example, to predict when and where a particular tornado will strike, it is clear to meteorologists that because of the prevalence of certain conditions, a swathe of the Midwest -- dubbed Tornado Alley -- is most likely to be struck. Indeed, tornadoes are almost uniquely an American phenomenon. And, by studying charts of barometric pressure and other data, forecasters there can issue tornado warnings for a particular day. Some patterns of atmospheric activity are consistent enough, for instance, that sailors follow trade- wind routes that have existed for thousands of years. In the tropics, each day takes on a predictable rhythm, with humidity and heat and tall cumulus clouds building through the day, until the air can hold no more moisture and sudden downpours bring welcome relief. The parade of the seasons is one of the most fundamental rhythms in nature. In the temperate northern hemisphere, April showers are usually followed by May flowers. This averaged, smoothed-out, somewhat predictable picture of conditions around the globe -- of general patterns of temperature, moisture, and wind -- is called climate. Even this picture changes, but the changes happen over much longer periods of time: decade by decade, century by century, millennium by millennium. These changes are caused by factors ranging from slight variations in the orbit of the Earth to shifts in ocean currents; from cycles of sunspots, which increase the amount of solar energy reaching Earth, to the gradual growth of a mountain range, which alters wind and moisture patterns. We all expect weather to change, but we rarely think about changes in the conditions that prevail in a particular place, year in, year out. We all have a sense of what the "normal" climate is for our hometown, our country, and perhaps places we've visited. But that sense of what is normal is only a function of our brief experience with weather -- a few decades. Human lives are usually too short to allow an individual to observe a fundamental shift in temperature or moisture for a region. When people think they have observed such a change -- and surveys have shown that many people feel they've noticed "a change in the weather" in their lifetimes -- they tend to be wrong. Statistical 6
- 7. studies usually show that such subjective impressions most likely reflect a fluke series of warm summers or wet winters or the like. Indeed, one of the great impediments to human appreciation of the threat posed by global warming is our awareness of the obvious day-to-day changeability of the weather. With all the chaotic flux of weather -- when the temperature outside your home can plummet 20, 30, even 40 degrees in just a few hours -- how are you supposed to get concerned about a nine-degree rise in the global average temperature over 50 or so years? Take the opinion expressed in this letter to the editor published in the San Jose Mercury News in January 1991: "Last February I failed to see any stories about the infamous greenhouse effect or global warming during a week of record low temperatures. At the time, I thought you might at least express opinions about the money-grubbing scientists whose defective models had predicted the overheating of our earth." It's only natural to be confused about greenhouse warming when you're shivering through a cold spell. It is when humans study records of past conditions -- whether the record is a vineyard's century- long log of its harvests, a historian's description of climatic conditions from a bygone age, variations in tree rings, or clues trapped in the layers of a glacier or sedimentary rock -- that patterns of dramatic changes in climate become apparent. And this is when the strong links between climate and life -- and climate and human affairs -- also become apparent. Examples are everywhere. Take one of the world's most inhospitable spots, the Sahara, for example. Just 9,000 years ago, the Sahara -- along with much of the Middle East -- was covered with lakes and lush grassland that supported a rich array of life forms. Regular monsoon rains bathed the region. Beneath today's desert sands, fossilized pollen grains indicate the presence just a short time ago of those moisture-loving grasses. In layers of sedimentary rock, formed as dust and eroded soil accumulated at the bottoms of ancient lakes, the fossilized bones of crocodiles and hippopotamuses can be found. Even the water that is pumped to the surface in the oases scattered through the deserts of the region tells the story. Radiocarbon dating of sediments in such groundwater deposits has shown that much of the water there was deposited 10,000 or more years ago. At that time, then, "normal" conditions for the Sahara were temperate and moist. Normal is a relative term. If you were to turn the geological clock back another 9,000 years from the time when the Middle East was green, you would find much of the planet locked in an Ice Age, with glaciers grinding across 11,000,000 square miles of the Northern Hemisphere that are today ice-free. All across regions where snow falls during winter today, the snow never melted in the summer. Layer upon layer of snow compacted into great fields of ice. Sea levels were hundreds of feet lower than they are today because so much water was locked up in ice and snow. The sprawling ice caps at the poles influenced wind and moisture patterns all the way to the equator. Where the Bonneville Salt Flats are today, there was a huge shallow lake. Where the Amazon rain forest is today, there appear to have been broad stretches of savanna and small pockets of trees. To get the best perspective on where the climate may be heading in years to come, it helps to start at the beginning -- to wind the planetary clock as far back as it goes, to the very origins of Earth more than four billion years ago. On the newborn planet, volcanoes disgorged billions of tons of water vapor, sulfur, carbon dioxide, methane, ammonia, and other materials, creating a shroud of gases. When the surface of the planet cooled below 212 degrees -- the boiling point of water -- water vapor condensed and fell from the skies in a steady rain. There is ample evidence that just 7
- 8. 200 million years after Earth formed, it developed one of its two most distinctive features -- great oceans of water. And it only took another few hundred million years before Earth's other distinctive feature -- life -- appeared. From the remote moment when a stew of amino acids and other carbon-based molecules were somehow organized into strands of replicating material and then into cells, the fate of the planet was forever changed. Thenceforth, the atmosphere and the oceans and the substance of the planet itself would be intricately interrelated with colonies of bacteria, then sheets of algae, then complex green plants, then multi-celled animals -- and eventually human beings and their machines. The connecting factor was a biochemical process that evolved in certain microbes which allowed them to convert sunlight, carbon dioxide, and water into food. The factor was photosynthesis. This is the same process that produces today's redwoods, apples, and roses, that indirectly created the planet's reserves of oil and coal -- the same process that produced the stuff comprising this paper page. The earliest photosynthesizing microbes bloomed in the sea perhaps three billion years ago. At that time, the atmosphere above the oceans was composed primarily of carbon dioxide -- at levels perhaps 1,000 times higher than today. In the air and water, oxygen was present in only the tiniest traces, and was toxic to the first life forms. This is when life exerted its first dramatic influence on the planet. During photosynthesis, a byproduct is released. The byproduct is oxygen, which is left over when the C is taken from and the H from H2O. The first photosynthesizers, like other early life forms, still could not tolerate free oxygen -- it was truly a toxic waste. But as photosynthesizing life continued to evolve, natural selection produced organisms that were able to thrive in an oxygen-rich environment. These innovators soon dominated other forms of life. As they spread, the free oxygen that they produced accumulated in the oceans and diffused into the atmosphere. A minor sideshow took place at the time that would prove to have important consequences later on. Some of the oxygen rose to the highest regions of the planet's atmosphere. There, ultraviolet radiation from the sun and other stars caused a reaction that formed triplets of oxygen atoms, O3 -- a form called ozone. A diaphanous veil of this unstable form of oxygen developed. This ozone layer effectively absorbed much of the ultraviolet radiation that until then had bathed the surface below in destructive energy. Ultraviolet radiation can easily shatter genetic material and thus prevented life from leaving the sea. If the ozone layer had not evolved, it's doubtful that plants, and later, the first animals, would ever have crept forth onto dry land. (And now that ozone layer is being sapped by CFC's produced by one of the lucky species that resulted from life's first forays ashore.) The end result? Possibly as long as a billion years ago, the atmosphere was dramatically transformed by biological processes -- shifting from a primordial envelope of carbon dioxide to an unlikely mixture of 78 percent nitrogen, 21 percent oxygen, and a trace of carbon dioxide and other gases. Oxygen, carbon, and nitrogen atoms were continually passed from air to organism to earth and water then back again. Take, for example, a carbon atom, C, in a CO2 molecule: That C might circulate in the air for years, then dissolve in the ocean, be taken up by a microbe through photosynthesis and incorporated into a calcium carbonate (CaCO3) shell. When the organism died, 8
- 9. the shell would drop to the ocean bottom, be transformed into limestone, then many millions of years later, disgorged back into the atmosphere as carbon dioxide when that now-ancient rock was consumed by geothermal heat and exhaled by a volcano. Thus, the fate of each component of the Earth system became irrevocably tied to the fate of the others. ~ ~ ~ For perhaps a billion years, then, this watery, living planet, cloaked in an insulating atmosphere capped by a protective ozone shield, has maintained a remarkably stable climate and atmospheric chemistry. The amounts of the predominant gases, nitrogen and oxygen, have stayed virtually constant. The global mean temperature has never dropped far below freezing and never risen much above the hottest readings found in today's deserts. The system has taken some incredible abuse, such as occasional direct hits by massive meteorites or asteroids -- including one collision that is thought by many scientists to have ended the age of dinosaurs 65 million years ago. And as continents formed and then drifted together and split apart, resulting changes in ocean currents and ice sheets and wind patterns caused periodic massive die- offs of species. Indeed, the fossil record is punctuated by five such mass extinctions. But the biosphere has always bounced back, with life forms rapidly colonizing niches vacated by those that were extinguished. The disappearance of the dinosaurs, of course, was quickly followed by an explosion of evolution in mammals. A crisis for one species is an opportunity for another. Interestingly, the dynasty of the dinosaurs, from 220 million years ago to the time of their demise, was one of the last long periods of relatively stable, warm, wet weather in the planet's history. There is quite a bit of evidence showing that, 100 million years ago, the world was more uniformly warm than today, with no significant glaciation, even at the poles. At that time, great masses of vegetation lived and then died in what is now Antarctica. Because no water was locked up in its frozen form, sea levels were nearly 1,000 feet higher than they are today. From the time of the dinosaurs' extinction onward, something changed. The global temperature began a slow slide toward cooler conditions. But the most striking changes in the planet's climatic history have occurred in the relatively recent past. For reasons that are not yet adequately explained, some two million years ago the globe gradually descended into an epoch of ice -- a regular cycle of long ice ages and brief respites, called interglacials (we're in the latter half of an interglacial now; don’t worry, the end is probably at least 15,000 years away). In rhythms of roughly every 100,000 years, 40,000 years, and 20,000 years -- believed to be associated with changes in the planet's orbit -- the ice sheets at the poles have crept toward lower latitudes, depressing the continents hundreds of feet with the weight of mile-thick masses of ice. As much as one third of all the Earth's land area has been covered with ice at the peaks of these glacial periods. Ever since the beginning of this epoch, called the Pleistocene, all forms of terrestrial life have had to shift, adapt, or die in response to the advance and retreat of the ice. And it has been an unrelenting cycle of change, allowing little time for the biosphere to sit idly. Particularly through the last 160,000 years -- in which a precise record of climate has been deduced from fossils, the chemistry of ancient ice, and other evidence -- the global temperature has risen and fallen like the tracks of a roller-coaster ride. In North America, for example, studies of fossilized pollen have shown the rhythmic advance and retreat of maple and oak forests, which need relatively temperate 9
- 10. conditions, and a more northerly band of spruce and other coniferous trees, adapted to colder conditions. The impact of the ice ages is felt all the way to the equator and extends into the seas as well. Ancient layers of coral beneath today's reefs show how sea levels rose and fell hundreds of feet as more or less water was locked up in glaciers. One species that has shown a particular propensity for adaptation and innovation can trace much of its lineage within this age of rhythmic climate change. That species, of course, is Homo sapiens. Virtually the entire known span of hominid history takes place in the Pleistocene. The first evidence of hominid use of fire -- some charred bits of antelope bone from a cave near Pretoria, South Africa -- dates from 1.2 million years ago. Much of the great expansion of the human species over the face of the globe has taken place in just the past 30,000 years or so -- since onset of the last ice age. All of modern civilization has blossomed in a short respite from the overarching era of cold -- the most recent interglacial, which geologists call the Holocene. Until 10,000 years ago most of the heart of Western Europe, from the British Isles east through Germany, was bleak tundra. Only after a sustained warming trend for centuries thereafter did European populations grow and agriculture develop. The Sumerians flourished in what is now southern Iraq starting only 8,000 years ago. Five thousand years ago, an especially warm, humid period may have set the stage for the first flowering of Chinese civilization. Even within the relative warmth of the Holocene, little flutters of cold and warmth and drought have forced human societies to shift. A warming trend in Europe from 900 to 1200 A.D. -- sometimes called the Medieval Optimum -- allowed Vikings to colonize previously inhospitable spots such as Iceland and southern Greenland (which never was very green, but was given that name by Eric the Red to entice more settlers to migrate there). At its peak, the Greenland settlement had 280 farms and a population of 3,000. Around the same time, dozens of vineyards flourished in Britain -- so many that France wanted to limit imports from its island neighbor. But then the northern hemisphere climate cooled for several centuries. Most of Britain's vineyards were put out of business. Greenland became increasingly locked in sea ice. By 1492, Pope Alexander VI was noting reports that Greenland was almost unreachable. "Shipping is very infrequent because of the extensive freezing of the waters -- no ship having put into shore, it is believed, for eighty years," he wrote. The settlement eventually died out. Around that time, much of Europe, North America, and other parts of the globe descended into what has been called the Little Ice Age, from 1500 to about 1850. Many regions experienced sharply colder winters, registered in French vineyard records of harvests, Dutch accounts of disruptions in canal travel because of thick ice. The cold also affected some major wars of the time -- creating harsh conditions for American troops at Valley Forge and Napoleon on his ill-fated march into Russia. Glaciers advanced dramatically in the Alps and in parts of New Zealand. The Thames River in London began to freeze regularly, resulting in the advent, in the winter of 1607, of "Frost Fairs," in which a small tent city sprung up on the river, offering amusements that included ice bowling. In 1662, the sport of ice skating was introduced from the Netherlands at such a fair. The last Frost Fair was held in 1814. Since then, warmer conditions have kept the river from freezing completely. 10
- 11. And now human beings and the rest of the inhabitants of planet Earth may have to brace for a new period of change. Humans, at least, have proved themselves to be well adapted to a perpetually, but gradually, shifting climate. But this change is predicted to come at a pace perhaps 10 or 15 times more rapid than that experienced during the looping cycles of ice and warmth in which almost all of human development -- both evolutionary and cultural -- has taken place. As has been the case for a billion years, the pending change is a function of the links between climate and life. Once, the evolution of photosynthesis forever altered the course of the planet's fate by flooding the atmosphere with oxygen. Now, the explosive expansion of human populations and industry is flooding the atmosphere with carbon dioxide and other heat-trapping gases. Perhaps earth scientists of the future will name this new post-Holocene era for its causative element -- for us. We are entering an age that might someday be referred to as, say, the Anthrocene.1 After all, it is a geological age of our own making. The challenge now is to find a way to act that will make geologists of the future look upon this age as a remarkable time, a time in which a species began to take into account the long-term impact of its actions. The alternative will be to leave a legacy of irresponsibility and neglect that will manifest itself in the fossil record as just one more mass extinction -- like the record of bones and empty footprints left behind by the dinosaurs. Chapter 3 The Global Greenhouse “We are evaporating our coal mines into the air.” - Svante Arrhenius, Swedish chemist (1859-1927), in a 1896 essay2 The first winter of the 1990s was a warm one in my town, Brooklyn, New York. Crocuses and even a few tulips popped their green heads up through the garden soil as February began, fooled by 1 I used flawed etymology in proposing the word “Anthrocene,” but my notion of a post-Holocene epoch has gained steam of late, centered now around the more appropriate word Anthropocene. Best reference: “The Anthropocene: a new epoch of geological time?” Jan Zalasiewicz, Mark Williams, Alan Haywood and Michael Ellis . Phil. Trans. R. Soc. A 2011 369, 835-841, doi: 10.1098/rsta.2010.0339 2 Arrhenius never wrote this. This was an error by me, building on earlier errors as described well by Pilson in 2006 (Ambio. 2006 May;35(3):130-3.) 11
- 12. weeks of freak warmth in which New Yorkers donned T-shirts and flocked to parks and beaches. The warm winter followed a year that set a new record for the warmest global mean temperature -- 59.6 degrees Fahrenheit -- in the 110 years since such figures had been calculated. In setting that record, 1990 continued a trend begun in the decade of the eighties. At the time, the seven warmest years on record were, in descending order: 1990, 1988, 1981, 1987, 1983, 1980, and 1989. It is this accumulation of hot years, capping a 100-year trend of slow warming, that recently caused some normally circumspect atmospheric scientists to go out on a limb and declare that we are seeing a signal that human activities are exacerbating the greenhouse effect and warming the planet. Keep in mind that atmospheric science is not a field that attracts high-profile types, eager for the spotlight. These are researchers who would much prefer to sit and tinker with their computer models than address congressional hearings. Nonetheless, out they came -- braving the scorn of skeptics. Previously, scientific papers on the greenhouse effect had been published with little fanfare. There had been a few congressional hearings on the subject, but no one took much notice. The obscurity of the issue came to an end as the United States began to wilt during the scorching, endless summer of 1988. No one put it more bluntly than James Hansen, the soft-spoken leader of an ongoing greenhouse study at NASA's Goddard Institute for Space Studies, who testified before a congressional subcommittee on June 23 of that year. On that day temperatures topped 100 degrees in 45 cities from coast to coast (Washington baked at a mere 98 degrees). This was the summer that saw the forests of Yellowstone National Park and the forests of France go up in smoke, the summer that ruined crops from Canada to China. Hansen said that no one could prove that that particular heat wave -- or any single heat wave -- was caused by the buildup of carbon dioxide, but the lengthening list of record-hot years in the 1980s was getting harder to ascribe to any other cause. Afterward, he told a reporter, "It is time to stop waffling so much and say that the evidence is pretty strong that the greenhouse effect is here." Since then, he and a growing chorus of atmospheric specialists have not changed their views. They stress that neither that summer's drought nor the mild winter of 1990/91 nor any other single climatic anomaly can be linked directly to rising levels of heat-trapping gases. But the increasing frequency of warm summers and winters -- particularly the rising temperature of the planet as a whole, which is the result of averaging hundreds of separate thermometer readings -- is consistent with the theory of a man-made greenhouse effect. As Hansen explained, "Seasonal weather is still a crap shoot, but the global warming is loading the dice." Starley Thompson, a climate modeler at the National Center for Atmospheric Research, put it to me this way: "There are always going to be a few hold-outs -- `Flat Earthers.' Apart from those, though, I don't think it'll be too long before you see broad agreement on this. A clincher will be this continual occurrence of years that are hotter than any other year in the historical record. Right now it's like a plant is peeking up above the weeds. The plant has to get tall enough to grow out of the weeds. If it continues on this way, definitely, within a decade, all reasonable people will have to sit up and take notice." Before the current global warm wave, in which the specter of the greenhouse effect has become such a hot topic, environmental problems were only worrisome if they were tangible or visible: Water pollution was an industrial sewer spewing foamy toxins into a greasy lake. Air pollution was 12
- 13. the sooty blast from a bus's exhaust pipe, the cloud of yellow smoke rising from a power plant's stack. Chemical contamination was the mist spreading from a crop-dusting plane. Now scientists are talking about a dramatic global crisis brought on by an increase in levels of some of the rarest gases in the atmosphere -- gases measured in parts per million -- all of them invisible to the eye. And at the center of all the fuss is a gas that we all know from grade school as one of the basic substances of life. We exhale it and plants inhale it. Dry ice is made of it. It can snuff out a match. It is the bubbles in beer. How can carbon dioxide, such a seemingly innocuous compound -- just a couple of oxygen atoms linked to a carbon atom -- be such a big problem? How can CO2 and these other gases act like a stifling greenhouse? ~ ~ ~ On one of the few frigid afternoons of February 1991, my wife and I walked with our infant over to the Brooklyn Botanic Garden. To take away the chill, we thought we'd head to the forest exhibits, each enclosed in a lofty, dome-like glass greenhouse. Just inside the entrance to the grounds, we passed a big boulder sitting inconspicuously near some bushes. I'd passed it 100 times before, but this time took a closer look. The boulder, about six feet tall and rounded like a pear, had a smooth, polished spot where countless human rear ends had found a perch. At around eye height above that seat, there was a little bronze plaque embedded in the stone. It read, “Boulder of diabase. Geological age, Triassic. Transported by continental glacier during the Ice Age from Palisades, between Hoboken and Englewood.” Here was yet another reminder of the dynamic, ever-changing face of Earth. Plucked from a cliff of 200-million-year-old rock as a glacier scuffed its way across North America 20,000 years ago, this boulder was carried along like a pebble caught in the tread of a child's sneaker, then dropped as the ice melted back to the north. We made our way to the greenhouses, where we began in the temperate forest, a replica of Mediterranean conditions, with beautifully landscaped slopes covered in silvery shrubs, mostly hardy varieties evolved to tolerate dryness. Vents in the glass roof kept this chamber cool and dry. Then we opened the doors leading into the tropical rain forest exhibit, leaving Greece behind in an instant and arriving in the Amazon. Here it was early February in New York, yet suddenly we were immersed in a steaming hothouse, rich with the scents of citrus and coffee blossoms, dank earth and fungi. The sun shone as brightly outside the dripping panes of glass as in, but we were sweltering in our parkas, while people outside were thankful for theirs. Just as the glass of that Brooklyn greenhouse prevented the sun-warmed air inside from escaping, so too do carbon dioxide and the other so-called greenhouse gases act as a solar-energy trap. The atmosphere was first compared to a “glass vessel” in 1827, by the French mathematician Jean- Baptiste Joseph Fourier. He recognized that the air circulating around the planet lets in sunlight -- as a glass roof does -- but prevents some of the resulting warmth from leaving. In the 1850s, a British physicist, James Tyndall, took things further and tried to measure the heat-trapping properties of various components of the atmosphere. Surprisingly, the two most common gases -- nitrogen and oxygen -- had no heat-trapping ability. Ninety-nine percent of the atmosphere had no insulating properties at all. It was all up to a few trace gases -- carbon dioxide, water vapor, methane, and the rest -- to keep the planet cozy. 13
- 14. Since Tyndall's time, the process by which greenhouse gases keep the planet warm has become clear. There are still rancorous debates among climatologists over how much, when, and where the planet may warm as these gases increase, but scientists agree on the basic physics. The process goes something like this. Most of the sun's energy travels to Earth as visible light. The sunlight enters the atmosphere and warms things up -- particularly things that are dark in color and thus absorb lots of light, things such as plants, soil, and the oceans. Surfaces warmed by the sun then begin to shed that accumulated energy in a different form, as heat, which is simply energy radiating at an invisible part of the spectrum -- called the infrared. Think of a rock that is tossed into a campfire. It is heated by the flames, then, long after the fire is out, you can still feel heat radiating from the rock. That “heat” is infrared radiation. If the atmosphere had no heat-trapping gases, the heat from the sun would quickly radiate back to space, leaving the planet with a surface temperature of nearly 0 degrees Fahrenheit. But the Earth has a surface temperature that averages a comfortable 59 degrees. The difference lies in the greenhouse effect. Carbon dioxide and other greenhouse gases act like a heat trap by absorbing some of the escaping energy. Just as a tuning fork with prongs of a certain length starts to hum when placed in the presence of sound at just the right pitch, molecules with a certain shape start to vibrate when exposed to energy of a particular type. It just so happens that molecules of carbon dioxide, methane, water vapor, and the other greenhouse gases are not tuned to absorb energy traveling as visible light -- it passes right through them, like light through a transparent window pane -- but these molecules are exquisitely sensitive to infrared energy. They catch it and begin to vibrate, and in so doing send much of the heat back where it came from. The gases comprising 99 percent of the atmosphere -- nitrogen and oxygen -- are transparent to both light and heat, and thus don't enter into the greenhouse equation. Even though the greenhouse gases exist as only a trace -- they are measured in parts per million and in some cases parts per trillion -- they exert a powerful influence on the temperature of the planet. If the air did not have those 350 parts per million of carbon dioxide, the planet would be some 20 degrees cooler. Without water vapor, it would be a deep-frozen snowball. And because these potent gases exist in such minute quantities, a tiny change in their concentrations can cause a big change in the way the atmosphere behaves. John Firor, an atmospheric scientist at the National Center for Atmospheric Research, likes to compare the situation to a corporation that is vulnerable to a takeover. A change of a couple of shareholders' votes can mean the difference between survival and getting swallowed up. It's a “highly leveraged situation,” in the parlance of Wall Street. There is no better way to appreciate the importance of greenhouse gases in determining a planet's climate than to look at three convenient experiments: Venus, the second planet from the sun, Mars, the fourth -- and Earth, in between. Venus has a dense atmosphere that is mostly carbon dioxide. As a result, the planet has a runaway greenhouse effect, resulting in a surface temperature of 840 degrees, hot enough to melt tin and lead. The atmosphere on Mars is mostly carbon dioxide, as well, but is very thin. And Mars has no water vapor in its atmosphere to help trap the sun's heat. With little greenhouse warming, Mars has a mean temperature colder than that of Antarctica. The poles are some 184 degrees below zero. 14
- 15. Earth, literally and figuratively, lies between these two extremes. The planet is cloaked in significant quantities of water vapor and carbon dioxide, both of which hold the heat of the sun. There is something marvelous about the interplay and balance of the biosphere, oceans, rock, air, and ice of Earth -- an equilibrium that has kept conditions equable for more than a billion years. Planetary scientists have referred to the situation of Venus, Mars, and Earth as the Goldilocks phenomenon, in reference to the bowls of porridge left behind by the three bears: one too hot, one too cold, and the third “just right.” Many of the feedback loops and connections between the components of Earth's atmosphere and climate are complex and poorly understood. But one linkage is crystal clear, particularly for the last 160,000 years: a consistent, linear relationship between the amount of carbon dioxide in the air and the average temperature of the planet. This pattern has important implications today. The relationship between carbon dioxide and temperature was detected when Soviet scientists extracted a mile-long cylinder of ice from a hole drilled in the glacier covering east Antarctica. In drilling down through that glacier, which had formed as layer upon layer of snow accumulated year after year, they were drilling back through time. The deepest sections of the core are composed of water that had fallen as snow 160,000 years earlier. Sections of that ice core were flown, still frozen, to a laboratory in Grenoble, France, where instruments were able to measure the composition of ancient air trapped in bubbles in the ice. Other instruments could check the ratio of certain isotopes in the frozen water and get a good idea of the prevailing atmospheric temperature at the time that particular bit of water became locked in the glacier. The result is a remarkable, unbroken record of both temperature and atmospheric carbon dioxide levels, and they travel through time in lock step. Almost every time the chill of an ice age descended on the planet, carbon dioxide levels dropped. As temperature dropped 9 degrees, CO2 levels dropped to 190 parts per million or so. Every time an ice age ended and the Earth basked in a warm interglacial, carbon dioxide levels rose as high as 280 parts per million. Until the beginning of the Industrial Revolution in the last century, the ice record shows that, for 160,000 years, the level of carbon dioxide in the atmosphere fluctuated between 190 and 280 parts per million, but never rose higher. There is indirect evidence that the link goes back much farther than the glacial record. Carbon dioxide levels may have been much greater than the current concentration during the Carboniferous Period, which ended 280 million years ago. Most land surfaces are thought to have been covered with lush swamps and bogs. That was the era named for a profusion of plant life whose buried remains produced a large fraction of the coal deposits that are being brought to the surface and burned today. Coinciding with the high CO2 levels, global temperature was apparently higher back then, as well -- with no ice caps at the poles. It is still not clear how the two are linked -- to what extent dropping carbon dioxide levels caused the cooling and to what extent cooling caused the change in carbon dioxide. But the relationship is firm. That is one reason scientists look at the man-made rise in CO2 today with such concern. For 160,000 years -- and perhaps millions of years -- the linkage between CO2 and temperature has been as firm as any pattern in nature. 15
- 16. And starting perhaps as early as the mid-1700s -- the time of the American Revolution, a time when Earth was still feeling the effects of the Little Ice Age -- humanity did indeed begin to fiddle with one of these parameters. It probably began with the clearing and burning of vast tracts of European and North American forests. For the first time, the atmosphere began to feel strong emanations of carbon dioxide from the activities of the growing human population. Then came steam engines and internal combustion engines and a cascade of technological developments resulting in new uses for heat -- new uses for burning fuel and thus new sources of carbon dioxide. As forests fell, new and more efficient fuels were sought to replace firewood. From then on, most of the fuel would be extracted from the ground -- fossil fuels, such as coal, oil and natural gas. Vast buried stores of carbon were uncovered, fed into the growing fires of the Industrial Revolution, and released into the atmosphere as carbon dioxide. As a result, at some point in the nineteenth century, the concentration of carbon dioxide in the atmosphere rose beyond the highest point it had reached in at least 160,000 years. By the 1890s, the concentration of carbon dioxide was already approaching 300 parts per million and steadily rising. Although no one at the time had any way to measure the change, there was one person, a Swedish chemist named Svante Arrhenius, who theorized that this was occurring. Arrhenius was the first scientists to see the significance of the greenhouse theories of Fourier and Tyndall in light of current events of the late nineteenth century. As he looked around at the growing forests of chimneys and smokestacks, the steam engines, furnaces, foundries, and ovens -- all stoked with coal, charcoal, and wood -- he calculated that millions of tons of carbon dioxide were being released. He did not know of the historical link between carbon dioxide and warmth that would later be discerned deep in glacial ice. He did know that in theory all that carbon dioxide, by causing a “change in the transparency of the atmosphere,” as he put it, could very likely heat things up. A doubling of carbon dioxide, he found, might raise the average temperature of the planet nine degrees. In an essay in the April 1896 issue of the London, Edinburgh, and Dublin Philosophical Magazine, he spelled out his theory, and in a nine-word sentence he summed up the hidden consequence of the rapid expansion of human industry that was unbalancing the atmosphere. Arrhenius, who would later win one of the first Nobel Prizes in chemistry (for his theory of ionization), wrote: “We are evaporating our coal mines into the atmosphere.”3 Chapter 4 The Hand of Man I'm truly sorry Man's dominion Has broken Nature's social union.... The best laid schemes o' mice an' men Gang aft a-gley. - Robert Burns, Scottish poet (1759-96), “To a Mouse” 3 Arrhenius never wrote this. This was an error by me, building on earlier errors as described well by Pilson in 2006 (Ambio. 2006 May;35(3):130-3.) 16
- 17. Almost 100 years have passed since Arrhenius first posited that human actions were changing the nature of the natural world. The dizzying pace of change in those 100 years only becomes evident when you look at how much some places have been modified in only a few generations. Just consider this account of one American wilderness wonderland, as described in the 1875 book “Fishing in American Waters,” by Senio C. Scott: “There is not within any settled portion of the United States another piece of territory where the trout streams are so numerous and productive.... It is scarcely possible to travel a mile in any direction without crossing a trout stream.” The place? Long Island, New York. “From Coney Island to Southampton,” Scott wrote, there was one clear, trout-laden stream after another. Today the only trout on Coney Island are in the smoked-fish sections of the Russian delicatessens of Brighton Beach. It is now hard to find a place where the human impact is not evident, from the most familiar landscape to the harshest wilderness. Half a century ago, if you stood on a hilltop on a clear day just about anywhere east of the Rocky Mountains, you could have seen things 90 miles away. Now, visibility on the clearest days -- even far from cities -- is about 15 miles. Particulates from power plants and automobiles have created a permanent haze. Even high above the stark, frozen ice fields of Antarctica, satellites and research aircraft now routinely detect the seasonal formation of a gaping hole in the thin veneer of ozone that has shielded terrestrial life from harmful ultraviolet radiation ever since life first spread onto dry land half a billion years ago. And scientists have confirmed that the degradation of the ozone layer is being caused by man-made chlorofluorocarbons, the same CFC's that also are efficient greenhouse gases. As a journalist, I've been fortunate to travel to some of the more remote corners of the planet, and nowhere have I found a place unaffected by human actions. The scars were freshest in the Amazon. I remember bouncing around in the back of a small pickup truck as it sped along one of the muddy roads that have been cut through that vast river basin, deep in the tropical interior of South America. Just 20 years earlier, before a rush of ranchers and landless poor pushed north, the rich rain forest there was pristine; in some places leafy branches formed a vaulted gallery over what was then a rough dirt trail. Now, along almost the entire stretch of road, the forest had been cut back so far that it was only a faint green smudge on the horizon. Here and there stood a single giant tree trunk topped by dead branches or thin foliage -- a pathetic vestige of the vanished forest. Worldwide, rain forests are disappearing at the rate of one and a half football fields a second. Just a few centuries ago, Earth's equator was girdled by a green belt of 15,000,000 square miles of rain forest, an area five times that of the contiguous United States. Now three Americas' worth of forest are gone, with just 6.2 million square miles left. In Brazil alone, the annual emission of carbon dioxide from the burning of forests in the late 1980s equaled the amount of this gas spewing from the industries of Poland and (former) West Germany combined. Because of the burning, Brazil was fourth on the list of greenhouse polluters, behind the United States, the Soviet Union, and China. Without it, Brazil wouldn't even be in the top 20 polluters. Alberto Setzer, a Brazilian space scientist who monitored the fires using satellite photographs -- sometimes counting more than 17
- 18. 8,000 fires in a single day -- calculated that emissions from the annual burning season in the Amazon equaled those of a big volcano. But, as Setzer put it, “This is a volcano that erupts every year, not just once in a lifetime.” Back in 1980, I was working on a boat that sailed up the Red Sea. We sailed past a maze of oil rigs and pipelines, with natural gas burning off in towering plumes of flame and black smoke. An endless convoy of ships headed north for Europe, some riding low -- their holds filled with oil -- and others riding as high as a 10-story building, stacked with layer upon layer of Japanese automobiles. Once at their destination, these two imports -- oil and cars -- would meet, and the result would be more carbon dioxide and smog. Off the coast of Ethiopia, we passed a string of uninhabited islands that were about as bleak and sterile as any terrain on Earth -- blasted volcanic heaps with hardly a shrub growing in the gray and black soil. The islands had risen along a great submarine rift where Africa is slowly, inexorably tearing away from the Eurasian continent. Nothing looked odd as we anchored off Zuqar Island. The coral below glimmered and a school of manta rays, each as long and broad as a king-size bed, soared through the clear water. But as we came ashore and explored the beach, we were stunned by what we saw. Hundreds of light bulbs had somehow bounced their way above the tide line without shattering. Bulbs littered the shoreline as far as we could see. There were long fluorescent tubes and high- wattage spotlights and old-fashioned screw-in incandescent bulbs. We figured that most were burned-out bulbs that had been tossed from passing ships. Hundreds of miles from the nearest town, we were surrounded by one of the crowning symbols of technological progress -- the light bulb, symbol of the “eureka” moment of invention. Closer to civilization, things were far worse. I lived for a time in Los Angeles, where my job was to report on the environmental problems plaguing one of America's fastest growing cities. There I lived in the hills above Hollywood Boulevard, just high enough to be able to look out across the sea of smog that engulfs that city most days. It has been just four years since I left Los Angeles, but in that time, the average speed on the freeways at “rush” hour has already fallen from 38 to 35 miles per hour. (It is projected that by the turn of the century, at the current rate of growth, rush hour traffic will be creeping along at 11 miles per hour.) While in Los Angeles, I reported on some strange events, including a discovery made one day by a construction crew. They were excavating a site, preparing to pour the foundation for a parking garage. Suddenly gasoline began bubbling up from the earth. They hadn't struck some underground pipeline, but instead had simply dug down to the water table. Later, authorities found that the gas had been leaking for years from a storage tank at a service station several hundred yards away. Floating on one of the only big pockets of groundwater in a desiccated city aching for water was a spreading, subterranean, man-made lake of gasoline. All of these scars on the landscape are a disturbing presence, but now it is the invisible impact of man -- Arrhenius's “change in the transparency” of the air -- that has scientists most concerned. In the century that has passed since he wrote about all that “evaporating” coal, the sphere of influence of the human species has undergone one of the most explosive expansions ever seen in the long 18
- 19. history of life's adventure on Earth. Part of that expansion has been due to population growth -- but only a part. After all, the human population had been growing rapidly for centuries: In 1 A.D., there were about 250 million humans -- the current population of the United States spread across a planet. By 1500, that number had doubled to 500 million. By the 1890s, the population had risen fourfold, to 2 billion. As the twentieth century draws to a close it is well on its way to 6 billion. In this century, it has not just been rising numbers that have increased human dominion of the globe, but an increase in power. The human hand is a potent force, but put a tool or weapon in it and watch what happens. In this short span, the power of that hand was enormously amplified by extraordinary technological advances -- particularly advances in the technology of combustion. In his 1954 essay “Man the Firemaker,” Loren Eiseley correlates human progress with the use of ever- more-potent fuels. First came firewood, which enabled humans to cook meats and thus increase food's nutritive value. Then came charcoal. The Iron Age would have been meaningless without the hot charcoal fires over which metals become malleable. Mastery of glass, ceramics, and steel was a function of rising temperatures in kilns, forges and furnaces. As Eiseley put it, “Man's long adventure with knowledge has, to a very marked degree, been a climb up the heat ladder.... Today the flames grow hotter in the furnaces.... The creature that crept furred through the glitter of blue glacial nights lives surrounded by the hiss of steam, the roar of engines, and the bubbling of vats.... And he is himself a flame -- a great, roaring, wasteful furnace devouring irreplaceable substances of the earth.” It is only in the twentieth century that humanity, in the words of the Russian geochemist Vladimir Vernadsky, “for the first time becomes a large-scale geological force.” A large fraction of that force has come from the burning of fuels. From 1900 to 1988, global energy consumption jumped fifteen-fold. Consider the following: From 1860 to 1960, human activities added 240 billion tons of carbon dioxide to the air. From 1960 to 1990 -- just the past 30 years -- another 240 billion tons were added, giving some indication of the stunning acceleration of the human impact. Now, every day another 50,000,000 tons of carbon dioxide spews into the air as humans burn things. Some comes from the exhaust pipe of your car and the 500 million other cars on the planet. (And by 2025, the automobile population is expected to quadruple -- 2 billion cars!) Some carbon dioxide comes from the furnaces of steel mills, cement plants, and power plants. There are still some low-technology sources: Some comes from fires set to clear brush and create cattle pasture. Scientists at NASA have calculated that something like five percent of the Earth's land surface is set ablaze each year. And part of that human production of carbon dioxide comes from cooking fires -- more than two billion people rely on firewood to cook their daily meals. All in all, then, humans have added a lot of carbon dioxide to the air -- some 480 billion tons in a little over a century. When you consider that the entire atmosphere weighs some five quadrillion tons, this number seems less disturbing. But, it quickly grows in significance again when you recall that “highly leveraged situation” -- to repeat the phrase of John Firor -- in which a little carbon dioxide accounts for a significant portion of the air's warming effect. The biologist/philosopher Rene Dubos noted the absurdity of our carbon-fueled civilization, in which so much growth has been built on “a series of great technological achievements made possible by the lavish use of cheap fossil fuels.” Today, every person with an automobile has the 19
- 20. power of a king, he wrote in “The Wooing of Earth”: “Personal control of a 350-horsepower automobile is equivalent in energy terms to the power of an Egyptian pharaoh with 350 horses or 3,500 slaves at his command.” Even accounting for those of us who drive more conservative vehicles, with less than 150 horsepower, that still makes us a nation of pharaohs. And now the rest of the world wants to catch up. After Arrhenius, there was some continuing interest in the idea that humans were modifying the atmosphere in ways that could warm the planet. In the 1930s, during a period of unusually hot summers in Europe, George Callendar, a British coal engineer, compiled several decades' worth of temperature readings taken at dozens of weather stations and by sea captains who brought up buckets of water and measured its warmth. He averaged the readings and published his results in 1938. His graphs showed a steady warming trend, which he ascribed to rising carbon dioxide levels. Callendar optimistically asserted that the addition of carbon dioxide to the air would result in a warmer, more comfortable world. (Arrhenius had earlier drawn this same conclusion, once writing, “[W]e may hope to enjoy ages with more equable and better climates....”) But Callendar's theories were forgotten as the northern hemisphere descended quickly thereafter into a prolonged cold period. Once again, the vagaries of year-to-year variations in weather had humbled human efforts to understand the deeper workings of climate. Another reason that the rise in carbon dioxide levels was largely ignored was that basic laws of gas exchange showed that the oceans would act as a vast “sink,” or repository, for this gas. Something like 98 percent of any excess carbon dioxide in the atmosphere would be absorbed by the oceans, and the carbon would soon find its way to the sea floor -- locked safely away in sediments for millions of years to come. At least that was the prevailing view until 1957, when Roger Revelle announced his analysis of the question. Revelle, then director of the Scripps Institution of Oceanography in La Jolla, California, made some calculations and found that the chemistry of seawater sharply limited the amount of carbon dioxide that would dissolve in it. At most, Revelle calculated, only half of the carbon dioxide being introduced to the air by human actions would end up in the seas. That left an awful lot in the air -- more than enough to influence the workings of the atmosphere. As Revelle and his coauthor, Hans Suess, put it: “Thus human beings are now carrying out a large scale geophysical experiment of a kind that could not have happened in the past nor be reproduced in the future.” “Large scale” was perhaps the underestimate of the century. The test tube in which this experiment was taking place was the entire planet. Around that time, Revelle was involved in planning the most ambitious coordinated scientific examination of the workings of the globe in history, the International Geophysical Year. Actually running over 18 months, the project would employ hundreds of geologists, chemists, climatologists, and other specialists from more than 70 nations. They would be dispatched to the four corners of the Earth, where they would measure everything measurable. In a way, they were about to conduct Earth's first checkup. One of the scientists was a young chemist named Charles David Keeling. He'd spent the last two years running around California collecting flasks full of air. He had designed and built an especially sensitive instrument for measuring carbon dioxide concentrations. This was the first device that could measure differences on the order of one part per million. 20
- 21. Keeling was finding that his gas samples from around the state contained, on average, 315 parts per million of CO2 -- a figure about 13 percent higher than the few measurements that were available from before the peak of the Industrial Revolution. As part of the International Geophysical Year, Keeling built two instruments that could take continual readings of atmospheric CO2. One was sent to Antarctica, but malfunctioned. The other was hauled up the slope of Mauna Kea, a massive dormant volcano that crowns the big island of Hawaii. There, 11,050 feet above sea level -- far from any distorting influences like cities or forests -- the manometer began in March 1958 to take readings of the carbon dioxide level of the atmosphere. In its first year, the instrument produced a remarkable record of the breathing of the biosphere. A graph of the readings looked like a camel's humps. Carbon dioxide was high in the winter, then dropped in the spring and summer, then rose again in the fall and the following winter. Keeling realized that his meter was reading the annual rhythm of photosynthesis in the Northern Hemisphere. Through the spring and summer, the temperate forests burst into photosynthetic activity, sparked by the brighter sun. In the process, the trees removed millions of tons of carbon from the air and put it into new growth -- roots and stems and blossoms and berries and pine cones. Then the biosphere sank into winter torpor and released much of that carbon as leaves fell and disintegrated, fruit rotted, and trees consumed some of their stores of energy. The following year the pattern was repeated. And the year after that. Keeling had become obsessed with carbon dioxide's cycles, and he kept his instruments running long after the big research project was over. His first device, and many others like it that were subsequently deployed to widely dispersed weather stations, have since churned out three decades of readings of the atmosphere's carbon dioxide trace. The result, as all the data have been collated and assembled in a graph, is a remarkable, sinuous curve that has since been dubbed the Keeling Curve -- and may prove to be something of a central symbol for the Anthrocene Age. The curve for each year has the same camel's-hump shape, but as the numbers for successive years are strung together, the levels of carbon dioxide have been just a little bit higher each year than they were the year before. The change pushes the line of the graph steadily up the page -- a snake climbing a long hill. Like a watch that gains a few seconds a month, the process is hardly discernible as it is happening, but the end result is significant. Where the atmosphere had 315 parts per million carbon dioxide in 1958, by 1990 it was shown to contain 355 parts per million of this heat-trapping gas. And that meant that since the 1880s, the amount of carbon dioxide in the atmosphere had risen some 25 percent. And almost every year, the amount of the increase -- the size of the annual hump -- increased a little. Whereas in the 1960s, Keeling found that carbon dioxide levels were rising about 0.7 parts per million a year, by the 1980s the annual rise had more than doubled, to 1.5 parts per million a year. This reflected the enormous acceleration of global industry and consequent rise in the burning of coal, oil, and natural gas. It also reflected the explosive growth of the human population, which was pushing people to incinerate thousands of square miles of forest. Unluckily, Keeling, like Callendar before him, began his research at a time when global temperatures were tending to dip. As a result, his results were widely discussed within the arcane world of climatology, but rarely cited as a cause for concern. Indeed, the 1970s saw prolonged 21
- 22. periods of wintry weather. Brazil's coffee crop failed twice because of frosts. The United States saw freak blizzards. Snow fell in London in June. The chilly weather had politicians and the press buzzing about an imminent ice age. In the 1980s, though, the global average temperature resumed the climb it had begun back in the 1930s. Year after year saw a new record set, as readings from around the world were collected and corrected -- to remove distortions caused by phenomena such as the so-called "heat-island" effect of cities (which hold heat in their masses of stone and asphalt and thus tend to make temperature readings higher than they would otherwise be). In 1988, researchers at NASA's Goddard Institute for Space Studies and at the University of East Anglia in England separately reported that when all such distortions were removed, the global mean temperature had risen just about 1 degree Fahrenheit in 100 years. It was an uneven rise, but compared to past global warmings, it was happening at breakneck speed. During the warming that followed the last Ice Age, the global temperature had risen 1 degree every 500 years or so. There was no way to prove a link between the rise in carbon dioxide and the rise in temperature. Indeed, the warming was within the range of normal fluctuations of temperature and could have been caused by any number of factors -- including the variability of the sun's output. But the parallel curves began to generate more and more interest in the scientific community and the world at large. The distinctive climbing snake of the Keeling Curve began to show up not just in scientific journals, but also in the pages of the New York Times, Newsweek, and National Geographic magazine. Moreover, concern about an intensifying greenhouse effect was heightened when it became apparent that human activities were increasing levels of other trace gases that have much more potent heat-trapping properties than CO2. Levels of methane, for example, have risen sharply in the atmosphere in the past 150 years. Although there is still less than 2 parts per million of this gas in the air, that is more than twice the highest level seen for the past 160,000 years. And each methane molecule is 20 to 30 times more efficient than a carbon dioxide molecule at trapping heat. This gas, also called natural gas or swamp gas, is generated naturally by bacterial decomposition in the absence of oxygen -- in such places as bogs, rice paddies, landfills, and the guts of cattle and termites (in which colonies of anaerobic bacteria break down cellulose). As humans have cut down forests, termites and bacteria have flourished in the detritus left behind. And the human population explosion has been accompanied by a livestock explosion -- there are some 2 billion head of cattle on Earth today. Each cow belches a methane burp twice a minute. Methane also escapes during oil drilling (that is what burns in the flares above oil rigs) and coal mining. Some methane is also emitted by the incomplete combustion of fossil fuels. All told, about half of the methane in the atmosphere is thought to be the result of human activity. Some scientists theorize that part of the methane increase is the result of the slight global warming that has already taken place: methane may be rising from warming soil and thawing permafrost in the vast stretches of Arctic tundra, and perhaps from the floor of the sea, where vast amounts of methane are locked up in cold sediments. If rising temperatures allow a large portion of this hidden reserve of methane to enter the atmosphere, then the greenhouse effect, in a classic feedback loop, will accelerate itself. 22
- 23. Another gas on the rise is nitrous oxide, the same compound that dentists use to dull pain. In nature, nitrous oxide is emitted by soil microbes. When nitrate fertilizers are added to farmland, they accelerate the production of the gas. Some is also formed when fossil fuels are burned. Altogether, there has been an eight-percent rise in nitrous oxide levels since the turn of the century. Nitrous oxide, methane, and carbon dioxide have all been around, to some extent, for millions of years. But there is a fourth important class of greenhouse gases that never existed in nature before Thomas Midgley, Jr., a remarkably inventive chemist working for General Motors, created them in a laboratory in 1930. Midgley had already made a name for himself by concocting the tetraethyl- lead additive that took the knock out of auto engines. He was asked by GM's Frigidaire division to come up with an alternative to ammonia and sulfur dioxide, which were then the standard chemicals circulating in the coils of refrigeration units -- but were dangerous or toxic. His solution was to add some chlorine and fluorine atoms to a carbon chain, and the result was an inert, nontoxic class of compounds called chlorofluorocarbons, or CFC's -- or Freon. These CFC's were hailed as one of the great triumphs of the chemical age -- a purely synthetic substance that lasted for centuries and had no known adverse effects. Midgley won important chemistry awards for both his lead additive and for CFC's, which quickly found myriad uses in products ranging from plastic foams to underarm sprays. Ironically, these two substances now occupy the highest levels of environmental hazard lists. Today, lead levels in human tissue and Arctic snows are hundreds of times what they were two centuries ago. And CFC's are not only a potent, long-lived greenhouse gas, but are the same compounds that have wafted up to the stratosphere, where they are attacking the planet's protective shield of ozone. Although CFC's exist in the atmosphere at minute levels, measured in parts per trillion, each molecule has 16,000 times as much heat-trapping potential as a molecule of carbon dioxide. Because they have become so pervasive in industry, in 60 years 16 million tons of CFC's have made their way into the air. Even though the United States banned some uses in the 1970s, and many countries have agreed to eliminate production by the turn of the century, the amount in the air is still growing at some five percent each year. And each molecule may remain in the atmosphere for many decades. Midgley's chemical creation is certainly a durable one. Overall, it has been calculated that the heat-trapping properties of the rarer gases will equal that of carbon dioxide within a few decades. The sudden accumulation of these greenhouse gases is not visible. You cannot smell it because none of the gases has an odor (the natural gas in a kitchen stove has an odorant added to it to warn of a leak). But this flurry of change is bound to disrupt the balance of energy flowing to and from the Earth, and, as a consequence, the balance of the biological world, as well. When you look at graphs of the steadily ascending amounts of these other greenhouse graphs and compare them with the rising snake of the Keeling Curve and the slow rise in the century-long graph of global temperature, the effect is akin to what has been shown in countless movie scenes: An ailing patient lies in a hospital's intensive-care unit. Next to the bed, needles scratch across a roll of paper, charting heart rate, blood pressure, respiratory rate, and other vital signs, which all bounce along at a steady rhythm -- until they begin to jiggle faster, then suddenly jump off the scale, with alarms buzzing and doctors rushing in. 23
- 24. The planet's vital signs are beginning to waver. The challenge is that by the time the symptoms are clear, it may be too late to save the patient. Chapter 5 The Cloudy Crystal Ball “How little, mark! that portion of the ball. Where faint at best, the beams of Science fall.” - Alexander Pope, English poet (1688-1744), “The Dunciad” It is July 2029, and an atmospheric catastrophe is in the making. The amount of carbon dioxide in the air has nearly doubled from pre-industrial levels. Earth is running a raging fever. Over the American Grain Belt and central China, the sun withers wheat and cornfields. Over the southern oceans around Antarctica, air temperatures are far above the typical readings seen 100 years earlier. As a result, Rhode Island-size icebergs are calving from the edges of glaciers at a record rate. As the seasons and years roll forward, the amount of carbon dioxide and other greenhouse gases continues to rise. Heat waves and occasional cool snaps swirl around the planet, but by 2050 the colder pockets are a rarity, and the entire globe is baking in conditions many degrees warmer than were typical just a century before. Fortunately this is not yet the real world, but a parallel one, built of a matrix of mathematical equations, each representing conditions in a small portion of the atmosphere. The fate of this world is unfolding on a video display terminal in an air-conditioned computer room two floors above Tom's Restaurant, a luncheonette at the corner of Broadway and 112th Street on Manhattan's Upper West Side. That is the unlikely home of the Goddard Institute for Space Studies, a research center, run by NASA, that has focused for more than a decade on the question of climate change. As time rolls forward in the computer model, swirls of red, orange, yellow, white, and blue are painted on the screen, where Earth's continents are visible in outline. As summer follows summer, the heartland of America pulses cherry red -- a color that represents temperatures nine degrees above today's norm. The orange and yellow indicate less intense warming, and the few blue patches show rare regions that remain relatively cool. Even as some researchers are looking back at past climates by boring holes into ancient glacial ice or studying ancient fossilized grains of pollen, others are using computer models to try to divine the future. Such global climate models, also called general circulation models, were first developed both to help forecast the weather on a daily basis and to understand the workings of the atmosphere on various planets in the solar system (hence the NASA connection). The picture they are projecting of Earth beneath the enhanced greenhouse is not a pretty one. If the planet were a smooth, motionless, monochrome sphere, the task of simulating its climate would be simple. You'd only need equations for the amount of sunlight hitting the surface and the infrared radiation escaping into space. There would be no regional variations. There would be no wind or clouds or ocean currents or polar ice caps to stir things up in unpredictable ways. But the planet is not monochrome and monotonous; it is a variegated, complicated system with a mottled 24
- 25. surface of water, earth, ice, and green plant life -- each of which absorbs sunlight and radiates heat in very different ways. As a result, modeling future climates is a daunting challenge. Even so, computer scientists and atmospheric scientists have reached a point where their mathematical simulations do a remarkably good job of representing the real world. The global climate models at research centers such as the Goddard Institute all work in much the same way. The atmosphere is crudely represented by splitting it into layers -- like the outer layers of an onion -- and then dicing each layer into cubes. A typical model divides the atmosphere vertically into a dozen or so layers, each a mile or so thick, and horizontally into boxes that are roughly the size of Colorado. The conditions in each box are boiled down to a few basic equations that represent the flow of heat, moisture, sunlight, wind, and the like. Each box in the atmospheric grid interacts with adjacent boxes (allowing a parcel of hot air to rise through the atmosphere, for instance). The program accounts for the passage of the seasons, with the tilt of the Earth's axis bringing less and then more sunlight to boxes in each hemisphere as the planet revolves around the sun once a year. A set of initial conditions is fed into the computer: for example, the conditions that prevailed around the world in 1958, the first year in which global carbon dioxide levels were measured. Then the scientists sit back and let the equations churn away. Scientists can tweak a particular condition -- say, adding carbon dioxide to the air -- simply by changing the appropriate factors in the set of equations. After all, carbon dioxide behaves in a predictable way, consistent with the basic laws of physics. It doesn't directly affect moisture or sunlight, but it does trap heat. So a rise in carbon dioxide is represented by changing the equations that indicate how much heat can be trapped in the air. Originally, all of the projections of a greenhouse future were made simply by taking an operating climate model and instantaneously doubling the amount of carbon dioxide in the atmosphere. More recently, modelers at Goddard and other centers have been able to add the carbon dioxide gradually, in a way that more closely resembles the inexorable buildup of the gas in the real world. This is a very complex calculation to make. At research centers that are equipped with the latest supercomputers -- such as the National Center for Atmospheric Research in Colorado -- the fate of the world is determined in a matter of hours or a few days. At Goddard, which uses slow, conventional computers, some "runs" have taken years to complete. There are still many uncertainties that limit the confidence that can be placed in the model results. After all, they remain very crude projections of reality. Each Colorado-size grid box can only be all cloudy or all sunny, for example -- when it's obvious to anyone that conditions in Denver at one moment are likely to be very different from those in Durango. Along with the limits of resolution, there are great uncertainties concerning the role of oceans and clouds in maintaining the current climate and affecting possible changes down the line. Two thirds of the planet's surface is covered by oceans, which are a vast reservoir for heat and also act to transport that heat from the hot tropics to higher, cooler latitudes. The warm Gulf Stream, for example, is like a fast-flowing river -- with 100 times the volume of the Amazon -- that swings north past Florida and then out across the Atlantic, carrying solar energy absorbed near the equator as far north as the British isles and northern Europe. As a result, those countries have a winter 25
- 26. climate much warmer than it would otherwise be. Keep in mind that London is at the same latitude as the blustery northern tip of Newfoundland. And the Scilly Isles, off the southwest coast of England, have palm trees. No one has a good idea of how the oceans may accelerate or slow the warming trend, or how ocean currents may affect the regional impact of global warming. What is known is that changes in the oceans can cause widespread changes in climate. The El Niño warming of the eastern equatorial Pacific, occurring every few years, can strongly alter rainfall and temperature patterns across the United States and as far east as Africa and the Indian Ocean. Recently, there have been attempts to link computer models of ocean currents to the global climate models, but the work is at an early stage. Clouds are one of the trickiest unknowns in the formula for global warming. They are a prominent feature of the planet -- covering about 60 percent of Earth's surface at any time. But their influence on climate is hard to add up. These floating blankets of water droplets or ice crystals simultaneously reflect incoming sunlight back out to space and trap escaping heat -- they both cool and warm the planet. And different types of clouds, at different altitudes, have different effects: The high, wispy mare's tails tend to trap more energy than they reflect, while low, thick cumulus clouds act as an efficient reflector, sending the sun's rays back into space before they can warm the surface. Overall, it is thought that clouds reduce the amount of sunlight hitting the surface by some 20 percent. An enhanced greenhouse effect, by warming the seas, is predicted to cause more water to evaporate and thus generate more clouds. Atmospheric scientists caution, though, that this does not mean that the planet will cool itself off reflecting more solar energy into space. There is as yet no way to predict what type of clouds will form, where they are most likely to form, where they will drop their moisture, and whether it will drop as rain or snow. One indicator of the complexity of clouds is that most of the global climate models agree on a wide range of factors -- ®MDUL¯until® ¯ clouds are included in the projections. At that point, the models vary dramatically in their forecasts. Overall, despite the uncertainties, these models have proved their worth by accurately replicating conditions that occur in the real world -- such phenomena as the change of seasons, the occasional El Niño warming in the Pacific, and the periodic droughts that ravage the Sahel region of northern Africa. The models have also been tested by inserting data from periods in Earth's history -- such as the warming after the last ice age -- for which scientists have a good knowledge of regional climates. If the model churns out a world that has warm and cool spots matching the regional patterns, say, reflected in fossilized pollen grains of warm-loving and cold-loving plants, then confidence in the model is boosted. A detailed assessment and comparison of the most sophisticated climate models was done in 1990 by the Intergovernmental Panel on Climate Change, a group of several hundred eminent scientists convened by the World Meteorological Organization and the United Nations to provide a framework of knowledge upon which governments can base plans for the future. Although different models disagree sharply on some of the details of Earth's greenhouse future -- some show hot spots where others have cool spots, for example -- they all agree that a world with doubled carbon dioxide levels will be a significantly warmer place. Predictions range from a global mean temperature that is 2.5 degrees hotter than the current norm to 8 degrees. A "most likely" figure is 4.5 degrees warmer. 26
- 27. The models consistently predict that the temperature rise near the ground will be accompanied by a sharp cooling high in the stratosphere. Indeed, as the planet has experienced the warm wave that started in the 1980s, the stratosphere has showed some cooling. They are also quite consistent in predicting that high-latitude regions, near the poles, will be close to the current norm in the summer, but perhaps 18 degrees warmer than the current average in winter -- a dramatic change with unpredictable consequences. There is general agreement that the amount of sea ice near the poles will diminish, as will the amount of land covered by snow in winter. This is expected to have an amplifying effect, or positive feedback, further warming the globe. Surfaces covered in snow and ice reflect almost 90 percent of the sunlight that strikes them; less snow and ice means more absorbed solar energy, and thus an even warmer planet. In addition, several of the leading models, particularly the model running at the Geophysical Fluid Dynamics Laboratory in Princeton, New Jersey, predict that the global water cycle -- from oceans to clouds to precipitation to rivers to oceans -- will change dramatically. Because of the warmth, more water will evaporate from the oceans, more clouds will form, and more precipitation will fall. But it won't be evenly distributed. While some regions grow wetter, others will dry out. Most researchers also agree that greenhouse warming will cause a substantial rise in sea level. A warmer atmosphere is expected to accelerate the melting of ice and snow near the poles, increasing the runoff of fresh water into the sea. In addition, some of the warmth from the air will be transferred to the oceans. When something gets warmer, the molecules within it jiggle more and take up more space -- causing that thing to expand slightly. That's just as true for a warming ocean as it is for a door that sticks in its frame in the heat of the summer. In a greenhouse world, then, seawater is expected to expand a fraction of a tenth of a percent. Altogether, the melting ice and expanding seawater are projected to raise sea levels by one quarter of an inch per year through the coming century. Seas have already risen steadily over the past 100 years at the seemingly imperceptible rate of about a third of an inch per decade. That doesn't sound like a lot, but the result has already been substantial erosion of beaches and salt-water intrusion into such important agricultural regions as the Sacramento River valley in California. And now the conservative estimate is for the seas to rise at three to six times faster through the coming century, reaching more than a foot and a half above current levels in the next 80 years. Seas may rise dramatically higher if the warming accelerates the melting of glaciers and calving and melting of icebergs. But some scientists feel that any such accelerated melting will be counterbalanced as increased snowfall, particularly over the Antarctic (thanks to all the extra clouds and precipitation) takes more water out of the oceans and stores it in frozen form on dry land. A worst-case scenario, according to some researchers, concerns the West Antarctic Ice Sheet -- an India-size slab of ice a mile thick. This mass of ice rests on the sea floor, like a ship aground on a submerged reef. As the sea rises and warms, it is possible that the ice could become destabilized and break up, with a resulting rise in sea level of 10 feet or more worldwide. 27