Few people are choosing to buy homes with mortgage rates well above 6%; even fewer homeowners want to sell.
Home prices increased 1% in the last two weeks after 11 weeks of declines as mortgage rates soared past 6%. The Federal Reserve’s aggressive interest rate hikes have successfully cooled off homebuying demand by dramatically reducing buyers’ spending power, but new listings have also taken a huge hit. Typically, when mortgage rates shoot up, we’d expect prices to come down in turn, but with so few desirable homes coming on the market, buyers are not getting much relief.
Those who do choose to list their homes have lost the upper hand their neighbors enjoyed when they sold last spring and should price accordingly. The share of home listings with a price drop reached a new high and months of supply (active listings divided by closed sales—the lower the level, the stronger the seller’s market) climbed to a 27-month high.
“There has been a lot of talk of a ‘new normal,’ but what’s happening in the housing market feels more like a ‘new weird,’” said Redfin Deputy Chief Economist Taylor Marr. “The impact of the Fed’s inflation-curbing strategy is seen clearest in the housing market as prospective buyers take a big step back, slowing sales. But since the vast majority of homeowners who might consider moving have a mortgage rate far below current levels, there’s very little new supply hitting the market. As a result, home sale prices have picked up in recent weeks, and the typical buyer’s monthly mortgage payment is just a few pumpkin spice lattes shy of its all-time high. The irony is that it may take renewed fears of a recession to bring some relief to buyers in the form of lower prices.”
Leading indicators of homebuying activity:
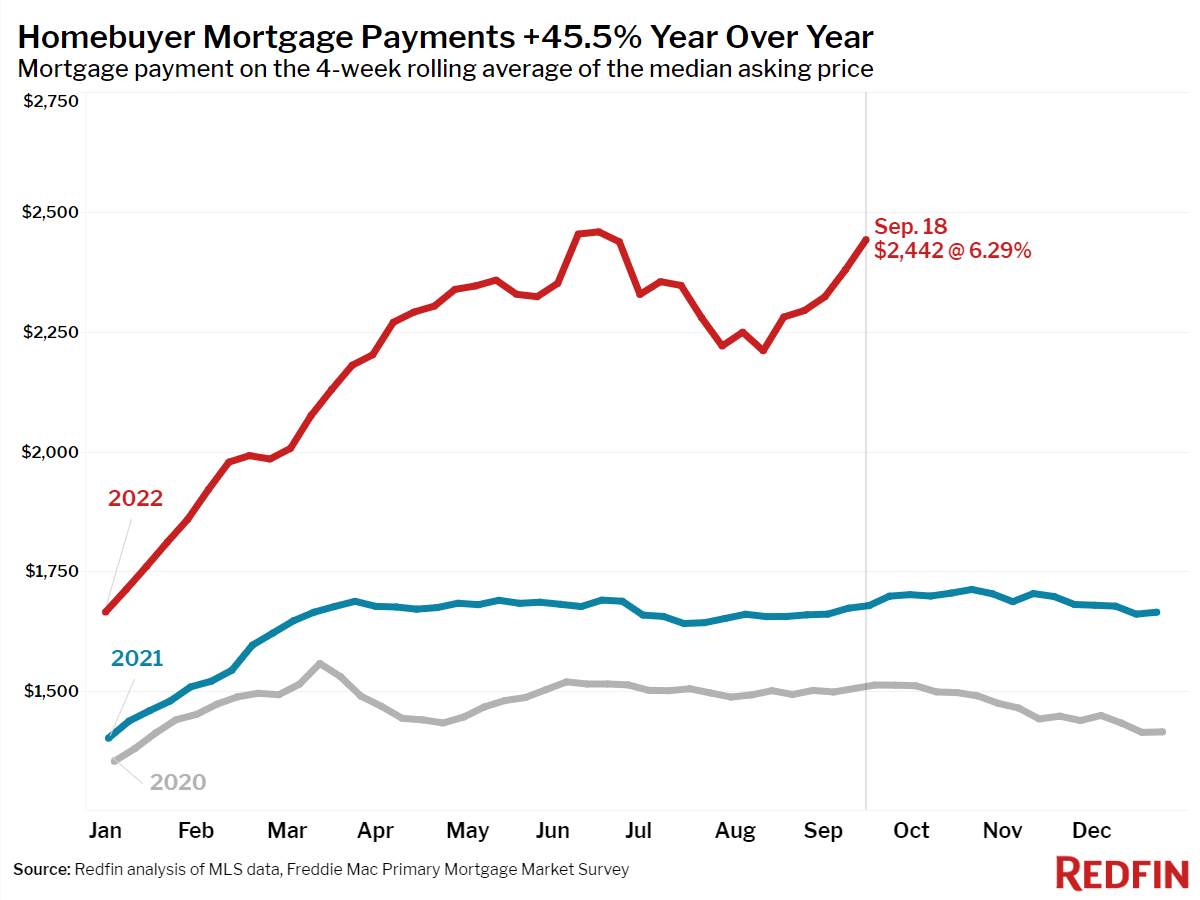
- For the week ending September 22, 30-year mortgage rates rose to 6.29%, their highest level since October 2008.
- Fewer people searched for “homes for sale” on Google. Searches during the week ending September 17 were down 33% from a year earlier.
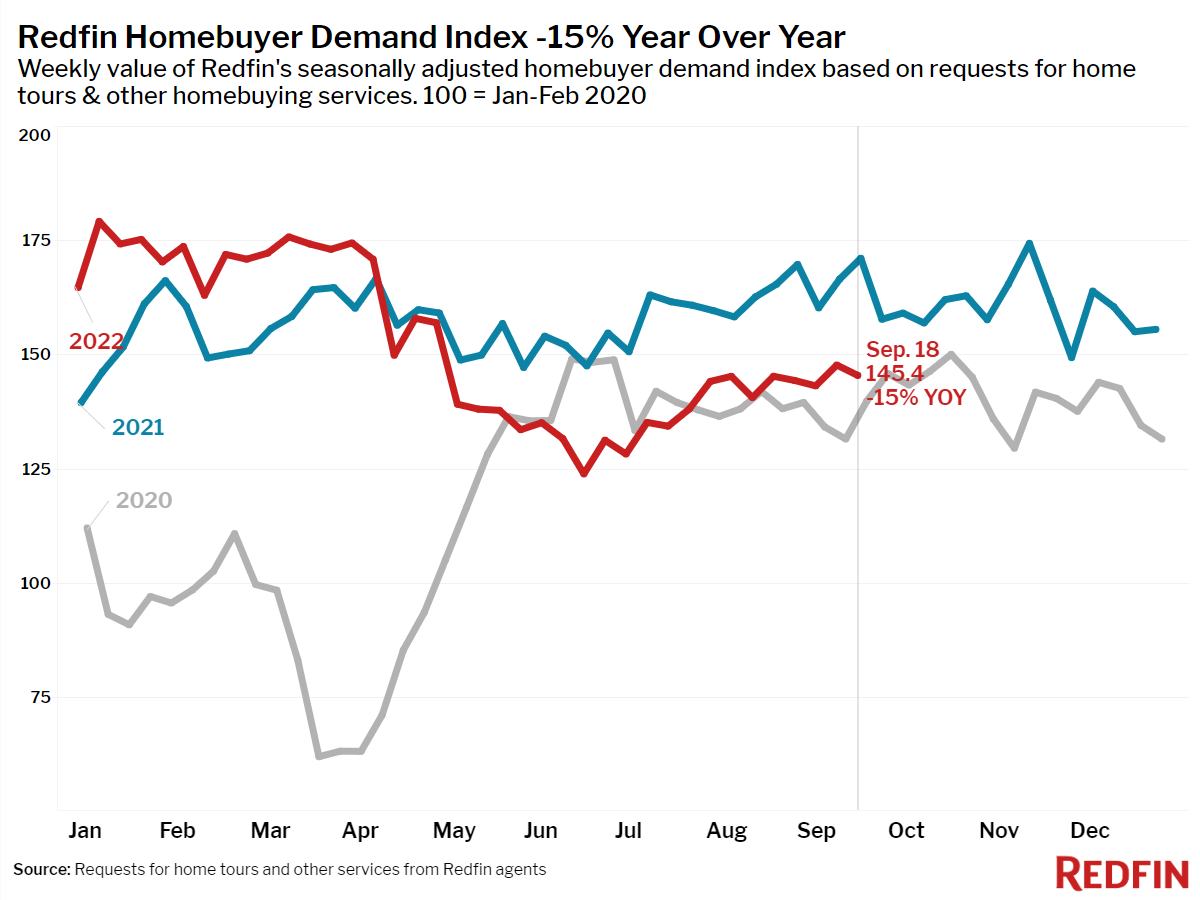
- The seasonally adjusted Redfin Homebuyer Demand Index—a measure of requests for home tours and other home-buying services from Redfin agents—was down 15% year over year.
- Touring activity as of September 18 was down 13% from the start of the year, compared to a 12% increase at the same time last year, according to home tour technology company ShowingTime.
- Mortgage purchase applications were up 1% week over week, seasonally adjusted, and were down 30% from a year earlier during the week ending September 16.
Key housing market takeaways for 400+ U.S. metro areas:
Unless otherwise noted, the data in this report covers the four-week period ending September 18. Redfin’s housing market data goes back through 2012.
Data based on homes listed and/or sold during the period:
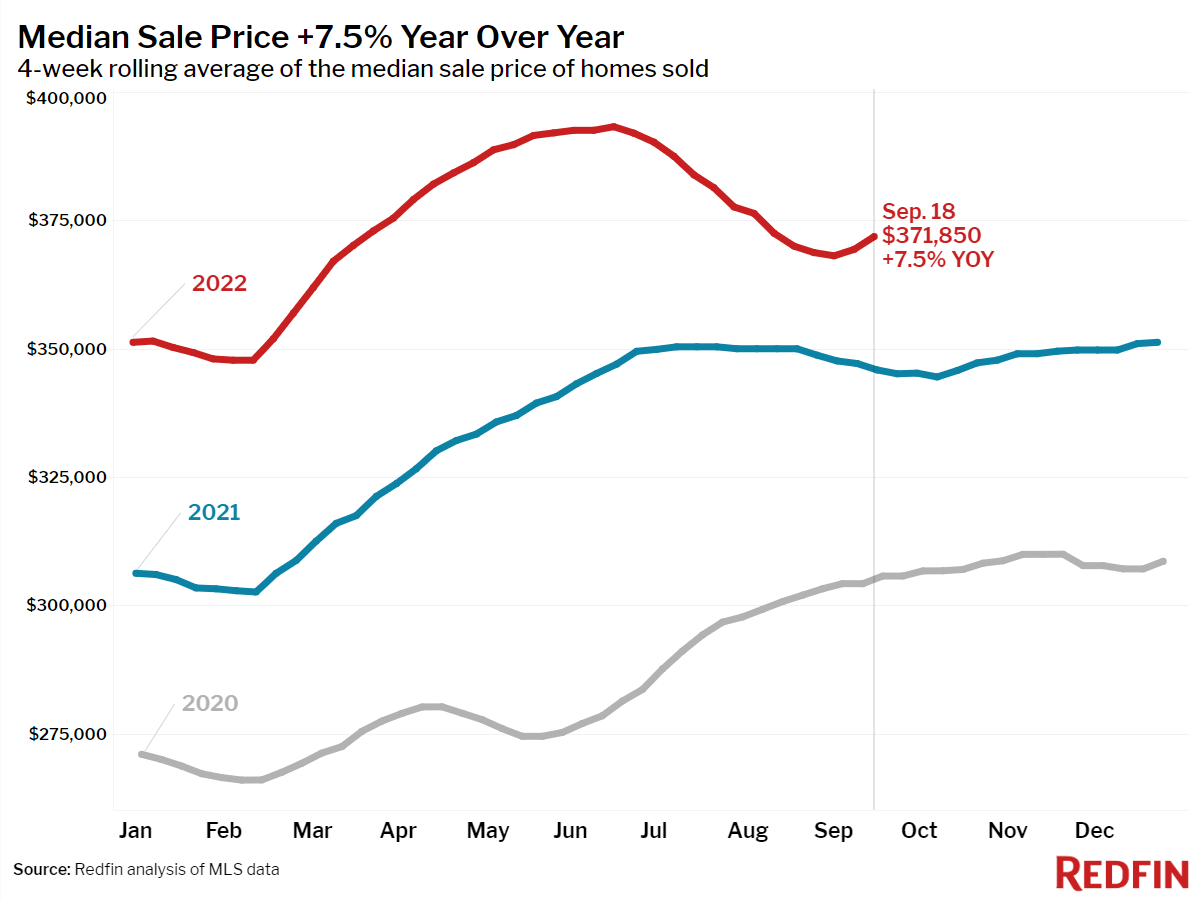
- The median home sale price was $371,850, up 8% year over year. Prices have climbed 1% since the beginning of the month, after 11 weeks of declines.
- Home sale prices in San Francisco fell 6% year over year. Neighboring Oakland, CA, where prices fell 2.5%, Buffalo, NY (-0.1%), Honolulu, HI (-1.4%) and New Orleans (-10%), rounded out the five metro areas that saw year-over-year median-sale-price declines.
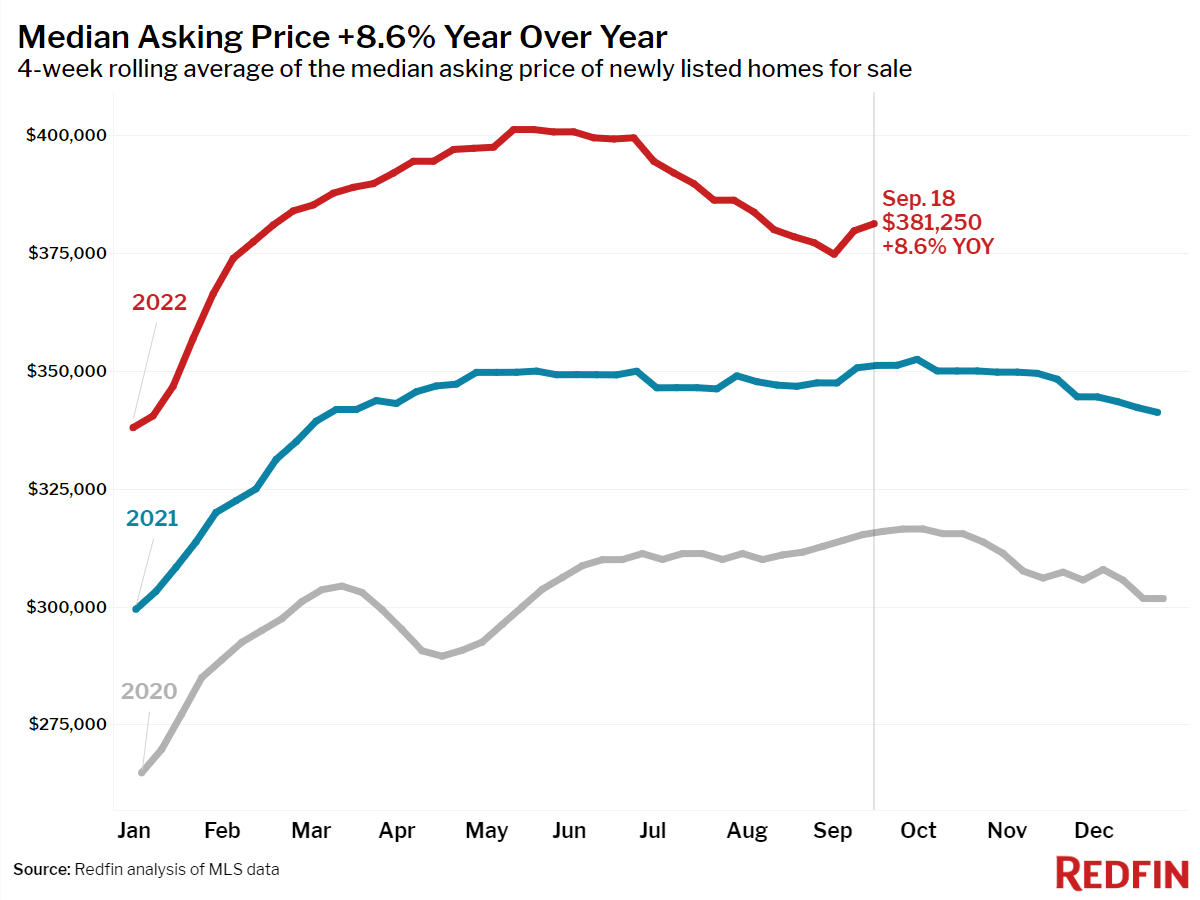
- The median asking price of newly listed homes increased 9% year over year to $381,250.
- The monthly mortgage payment on the median asking price home was $2,442 at the current 6.29% mortgage rate, up 45% from $1,678 a year earlier, when mortgage rates were 2.88%. That’s down from the peak of $2,458 reached during the four weeks ending June 19.
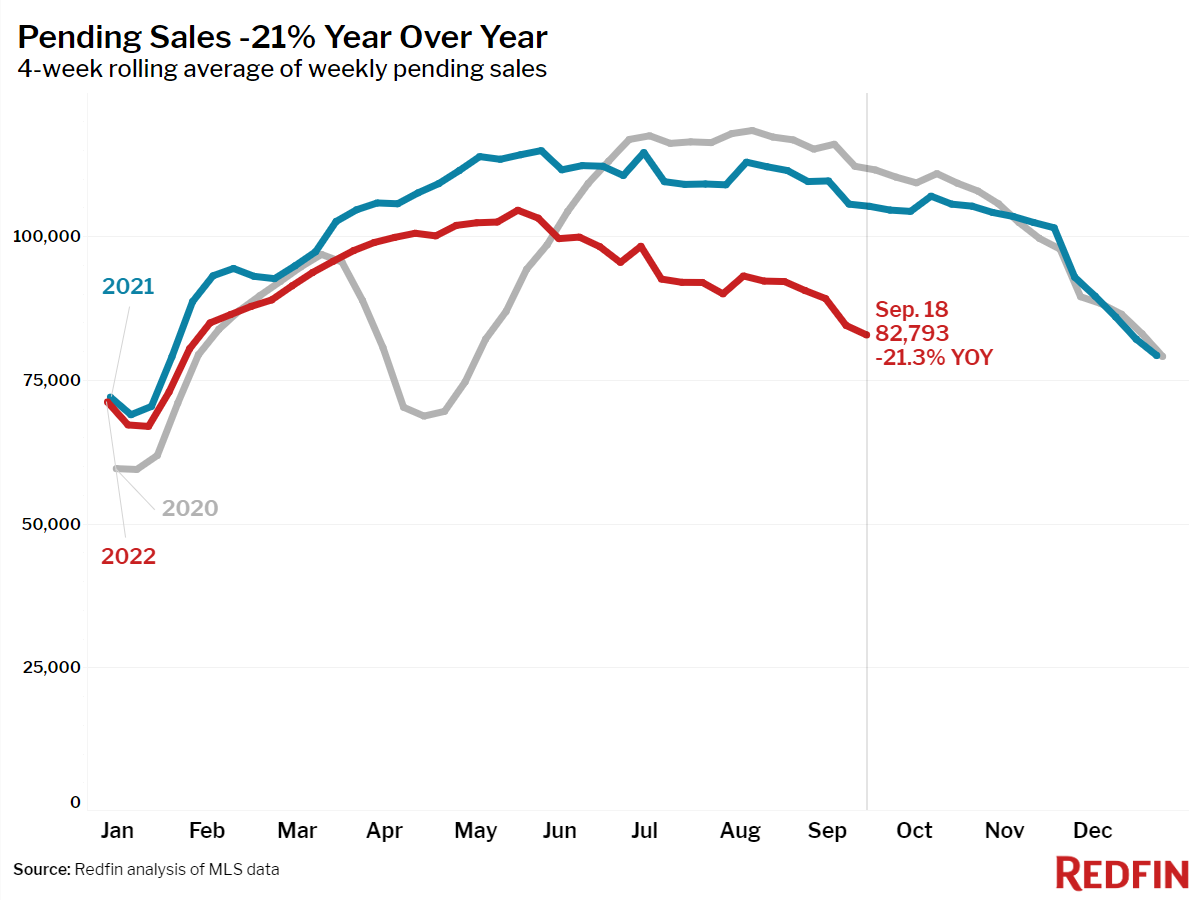
- Pending home sales were down 21% year over year, the largest decline since May 2020.
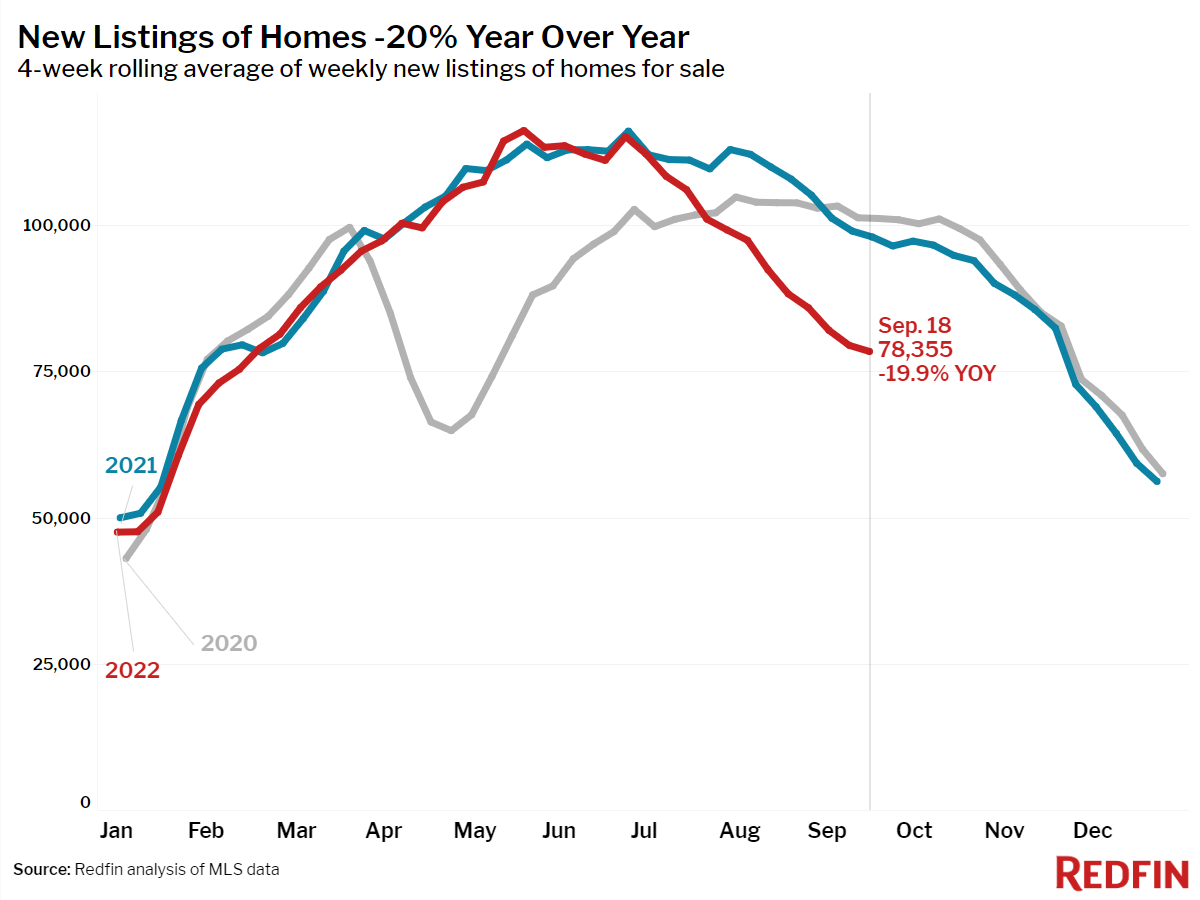
- New listings of homes for sale were down 20% from a year earlier, also the largest decline since May 2020.
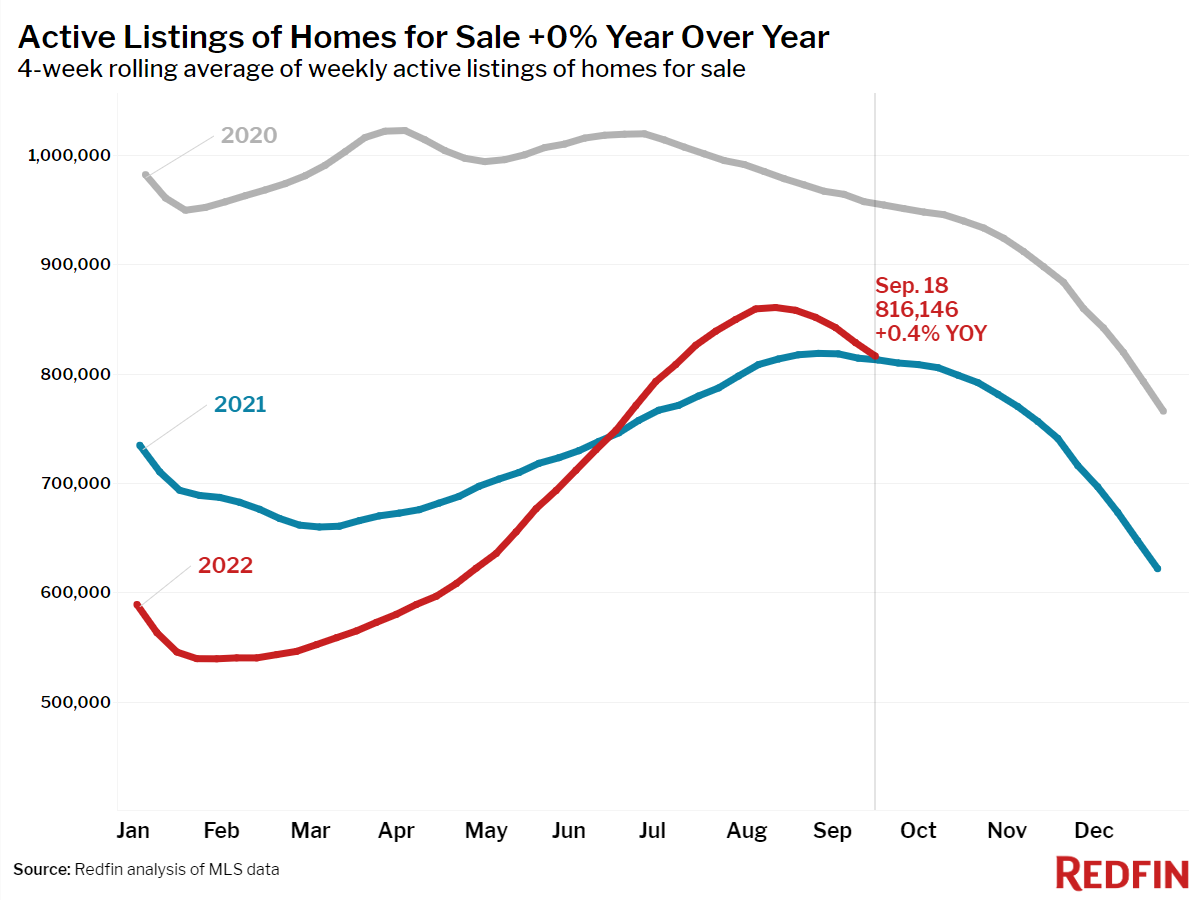
- Active listings (the number of homes listed for sale at any point during the period) fell 1.5% from the prior four-week period. On a year-over-year basis, they rose 0.4%.
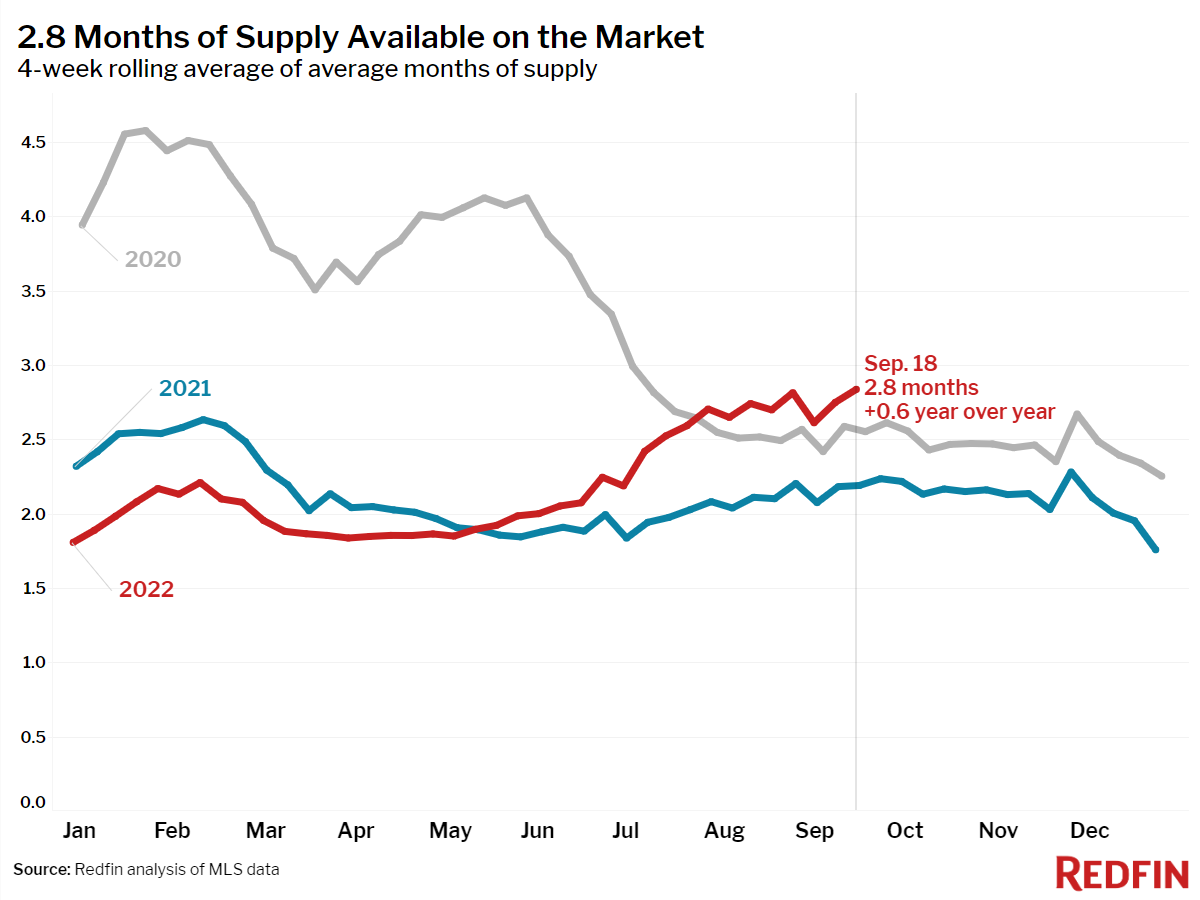
- Months of supply—a measure of the balance between supply and demand, calculated by dividing the number of active listings by closed sales—increased to 2.8 months, the highest level since July 2020.
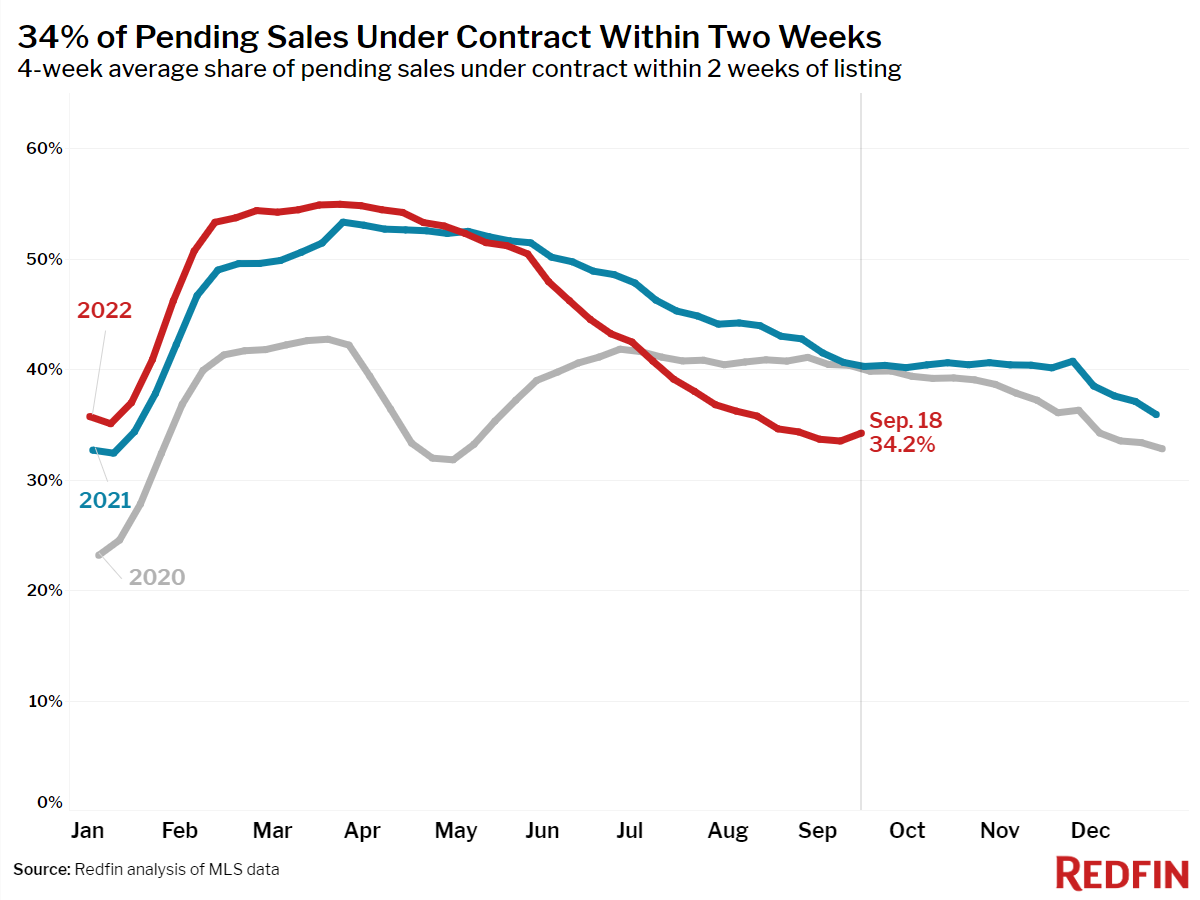
- 34% of homes that went under contract had an accepted offer within the first two weeks on the market, little changed from the prior four-week period but down from 40% a year earlier.
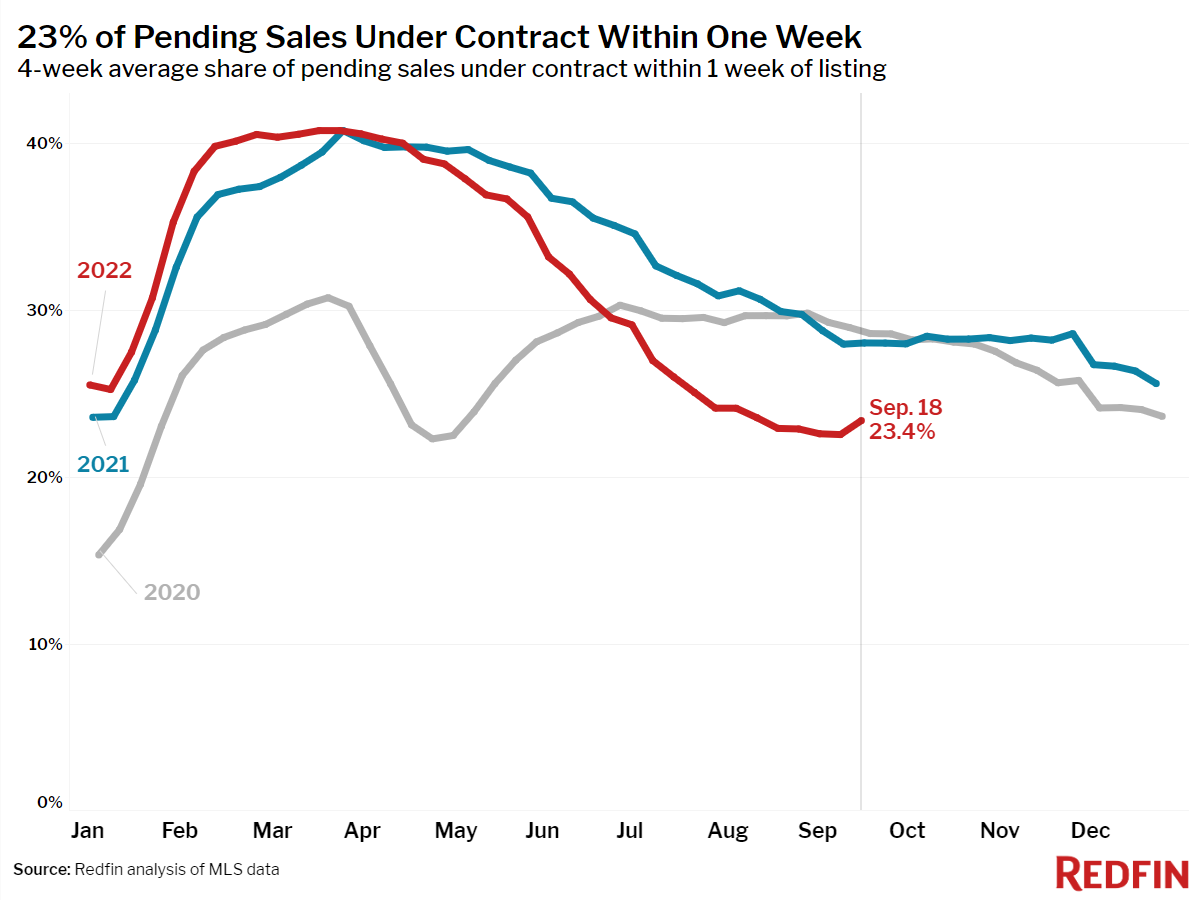
- 23% of homes that went under contract had an accepted offer within one week of hitting the market, little changed from the prior four-week period but down from 28% a year earlier.
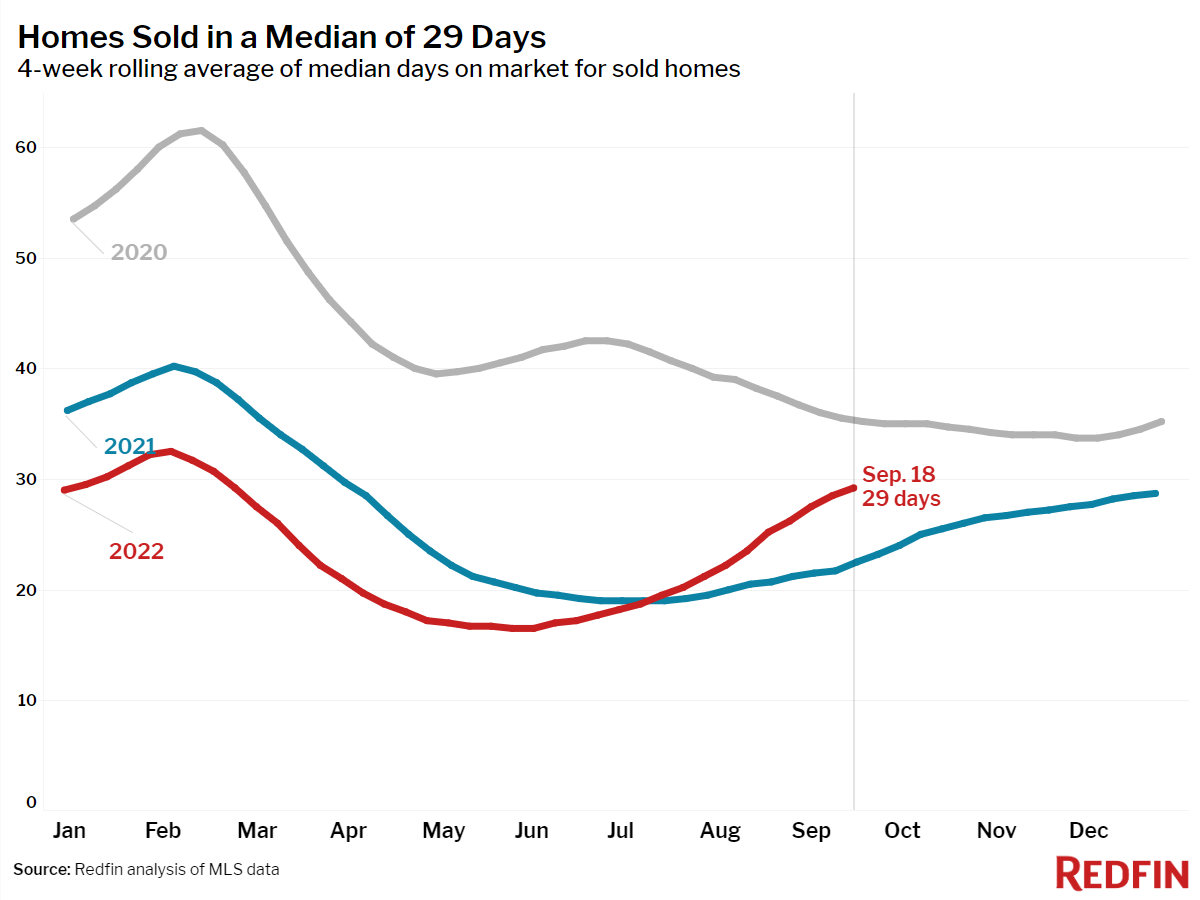
- Homes that sold were on the market for a median of 29 days, up from 23 days a year earlier and the record low of 17 days set in May and early June.
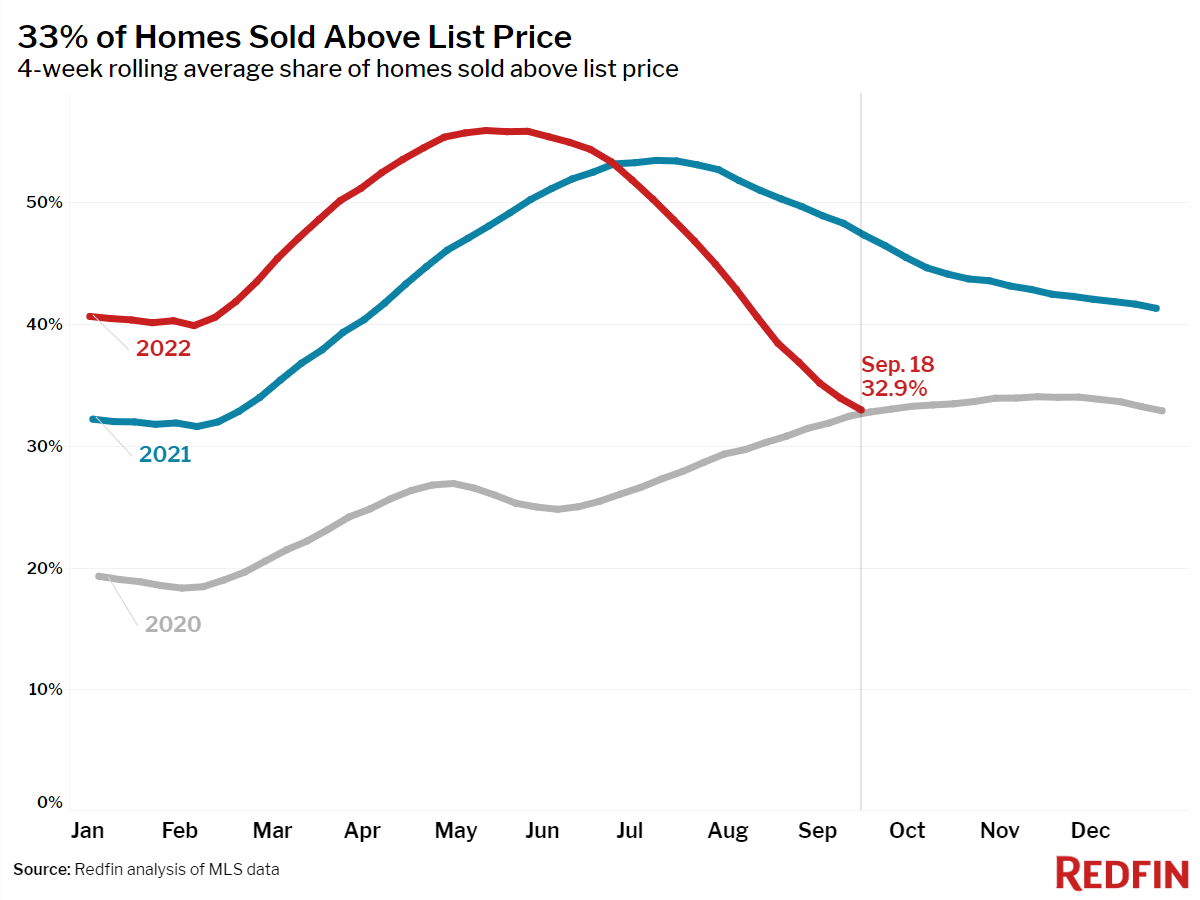
- 33% of homes sold above list price, down from 47% a year earlier.
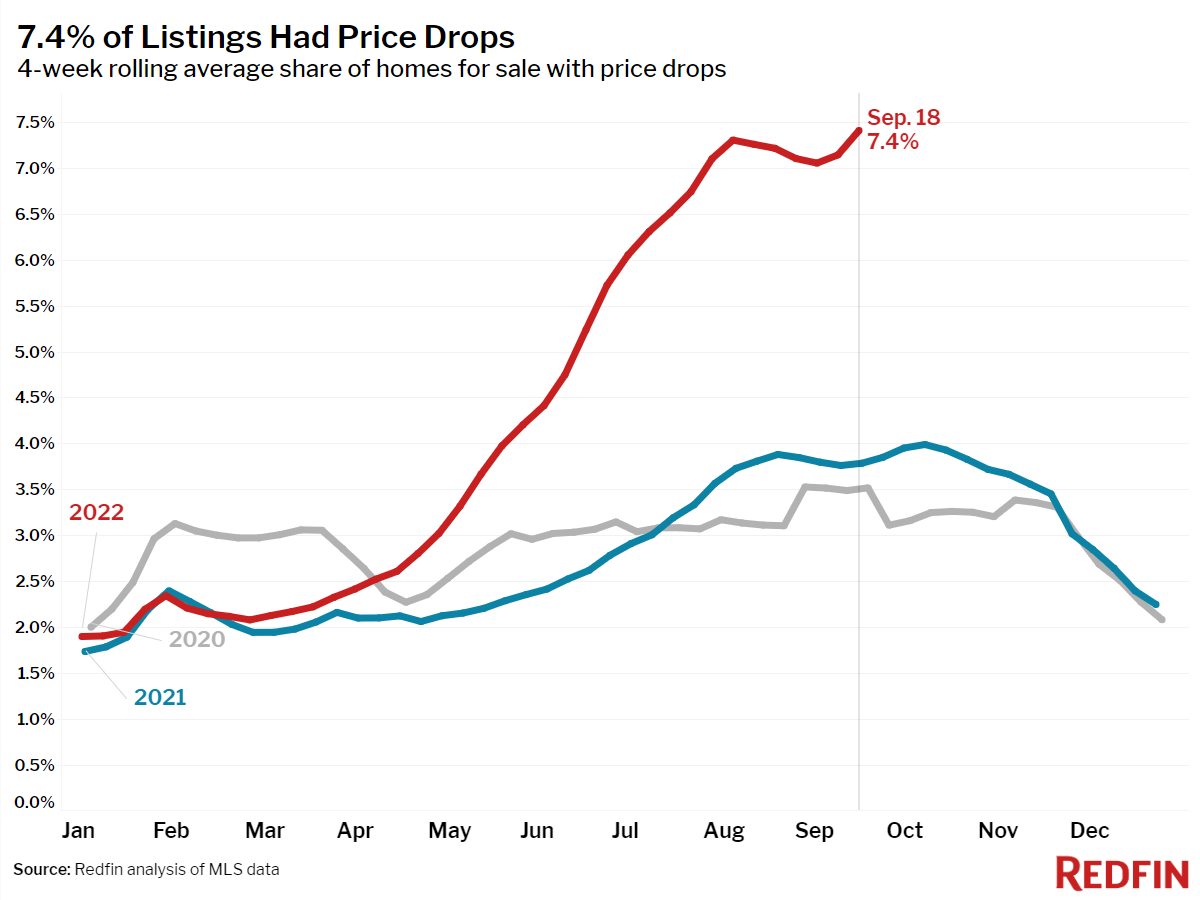
- On average, a record high 7.4% of homes for sale each week had a price drop, up from 3.8% a year earlier.
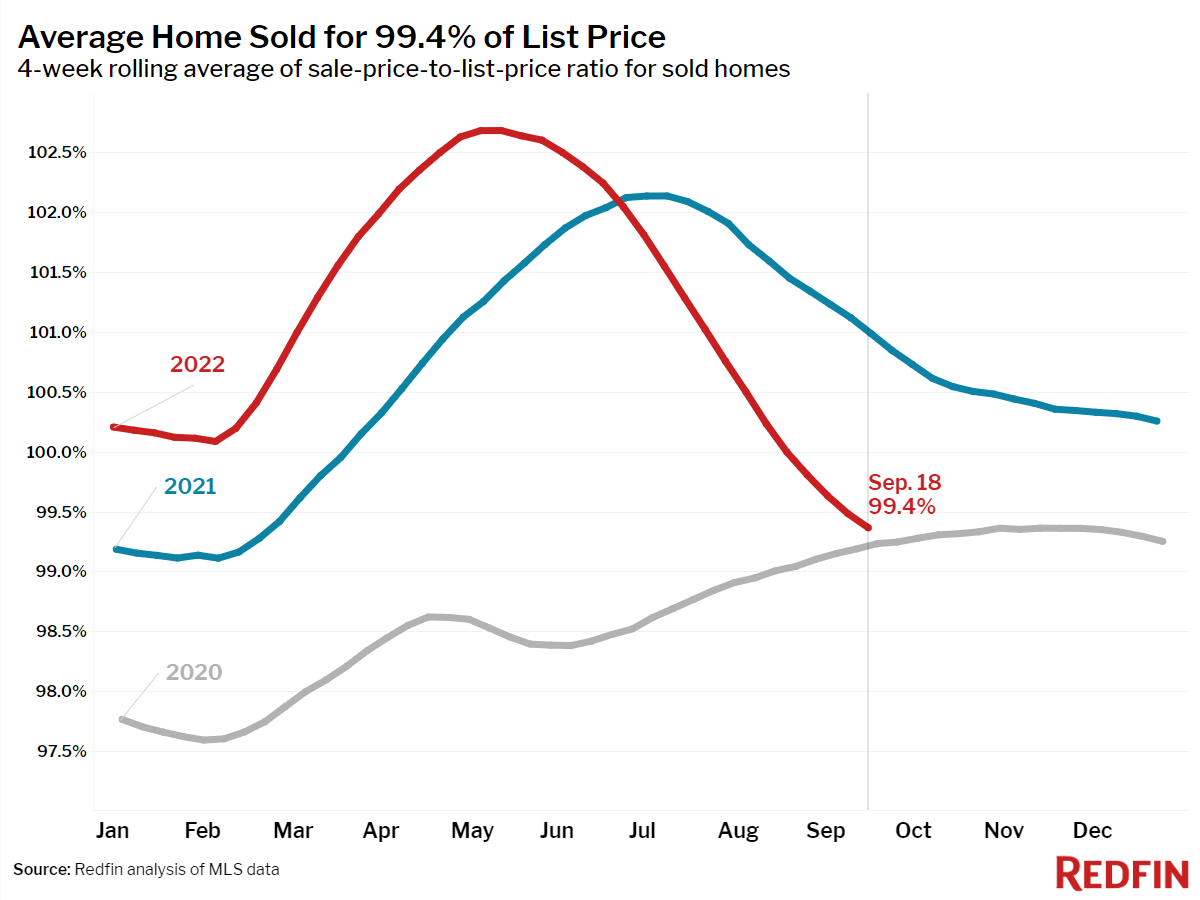
- The average sale-to-list price ratio, which measures how close homes are selling to their asking prices, fell to 99.4% from 101.0% a year earlier.
Refer to our metrics definition page for explanations of all the metrics used in this report.
 United States
 Canada