Key takeaways
- Unemployment insurance (UI) benefits are determined by individual states. States vary in how much of previous wages UI replaces, the time period used to calculate previous benefits, and how sensitive they are to changes in wages.
- This adds substantial complexity to the UI system, making it difficult to alter it in response to emergencies such as Covid-19.
- It also means that people who lose their jobs cannot easily predict what benefits they will receive.
- This complexity does not appear to be related to differences in state economies. Instead, it reflects many arbitrary changes over a long time period.
- States should look to declutter their UI algorithms so that they are easier to understand and modify when needed.
- The federal government should pursue broader measures to support UI standardization.
If you lose your job, how much of your previous income will unemployment insurance replace?
There’s no single answer. Unemployment insurance (UI), a joint federal-state program, accords states considerable flexibility in determining benefit size, duration, and eligibility. When comparing UI benefits across states, people typically look at the “average benefit amount” or the “average replacement rate.” For example, the Brookings Institution reports that “most state UI systems replace 30-50 percent of prior weekly earnings.”
A person reading a news article or think tank report can easily get the impression that each state sets a particular income replacement rate. But these high-level aggregations mask the complexity of the actual calculations involved. Every state uses a bespoke formula that determines UI benefits. Even if the average benefit level for two states is similar, two people with similar incomes and work histories in each of those states can get very different benefits.
The complexity of state UI programs limits the effective administration of the program. That each state uses its own formula is a major reason why policymakers were forced to add $600 to UI checks during the early stages of the COVID-19 pandemic instead of simply setting benefits to be 100 percent of previous wages. While many news reports focused on the age of UI code, each state’s complicated algorithms also played a role. This tangled web also leaves people confused about UI benefits. A person who loses their job will not be able to reliably estimate their benefits and incorporate that into their job search plans.
A more standardized system across states would allow for a more rationalized unemployment insurance program. But is the state-by-state variation a useful adaptation to each state’s unique economic conditions, or is it what Niskanen senior fellow Steve Teles has called a “kludge”: “an ill-assorted collection of parts assembled to fulfill a particular purpose”?
Our analysis suggests that many of the differences in unemployment formulas across states are kludges. The different variables, base periods, and formulas that states use to calculate UI add to the system’s complexities, but this variation does not appear to be driven by the need for each state to customize its program to its unique economic circumstances.
Broaden the base, calculate the rates
Before we go into state-by-state comparisons, it is helpful to review some of the basic terms. UI benefits are always in part based on your previous wages – but how far back does “previous” go?
States calculate benefits based on the wages an applicant earned over 12 months — what’s known as the “base period.” But the “base period,” does not just stretch back 365 days from the date the applicant files for unemployment. Instead, the base period is the “first four out of the last five completed calendar quarters prior to the time that your claim is filed.” That is, neither the month you filed for unemployment counts nor does the immediate previous quarter. This is partly because when UI was first being implemented, UI offices would not necessarily have payroll data from the most recent months.
Many states have recently supplemented this with an “alternate base period” system, where unemployment benefits can also be calculated based on the most recent four complete quarters (without including a gap quarter). This allows workers who might not qualify for unemployment benefits under the old system to access them.
For example, a worker who has been working for the previous eight months before filing for unemployment might have as little as two months in the “base period” such that they do not have enough earnings to be eligible for benefits under the standard “base period” approach, but could qualify under an “alternate base period” approach, where they would have five months of earnings. Typically, most states first check to see if a claimant is eligible for benefits using the standard base period, but switch to the “alternate base period” if they are not.
The chart below illustrates this framework.
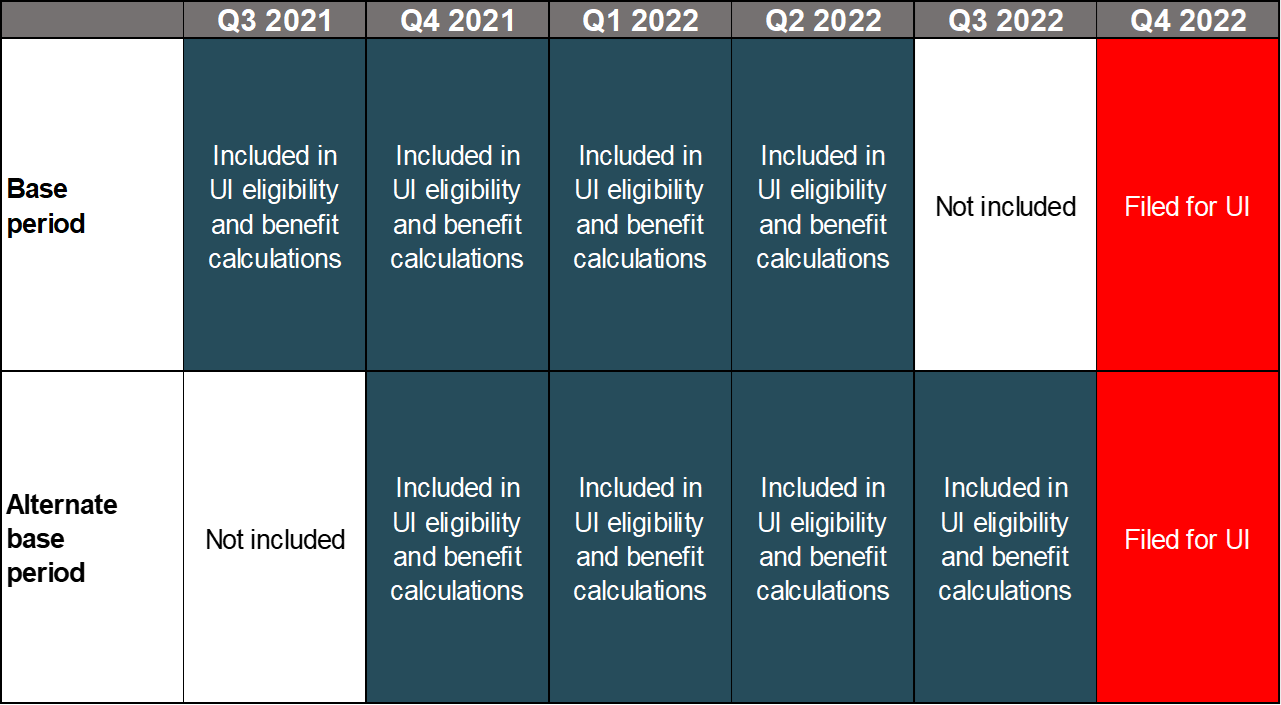
While the introduction of “alternative base periods” has opened UI eligibility to many people, it also makes the system more complicated. It is one of the complexities that made revising UI benefits during Covid more difficult. Additionally, people who lose their job and file for benefits for the first time will typically not know about this system.
A tale of two states
Neighboring states Oregon and Idaho have similar average wage-replacement rates for UI benefits. In the first quarter of 2022, Oregon replaced 44.1 percent of the average UI recipient’s income, while Idaho replaced 44.8 percent.
Imagine four people with similar jobs in both states who have recently filed for unemployment.
Olivia is a chef in Oregon and was laid off due to her restaurant closure. She had worked at the restaurant for a year before being laid off. One of her co-workers, Oscar, was also laid off, but he is a recently graduated student who had only worked at the restaurant for eight months. Both of them were making $20 an hour, or about $40,000 a year.
Across the border in Idaho, another restaurant has also been forced to close. Olivia’s counterpart Ian lost his job after working for a year, as did recent graduate Isabelle, who had worked for eight months after her kids started going to daycare.
Each hypothetical worker made a sufficient salary before losing their job that they will be eligible for UI benefits under the standard “base period.” Since Oregon and Idaho have similar average UI rates — and everyone in the example makes the same salary — we might expect that both pairs of workers would receive roughly equivalent UI benefits. That would be a mistake. Each state’s formula to calculate UI benefits is very different and can result in substantial divergences in payment.
- Olivia: Oregon’s UI benefits are 1.25 percent of wages in the base period. For Olivia, that will be a weekly UI benefit of $500.
- Oscar: On the other hand, Oscar will only make $250, since his total earnings in the base period were half of Olivia’s.
- Ian: Idaho’s UI benefits are 1/26th of wages of the highest quarter in the base period. That is, looking at the same four of the last five quarters, use the quarter where the worker received the most income, and their UI payments will be 1/26th of that. If you take Ian’s annual salary of $40,000, divide it into four $10,000 quarters, and divide that by 26, his UI payment will be $385.
- Isabelle: Isabelle’s benefit will be the same – both she and Ian have identical “highest quarters”.
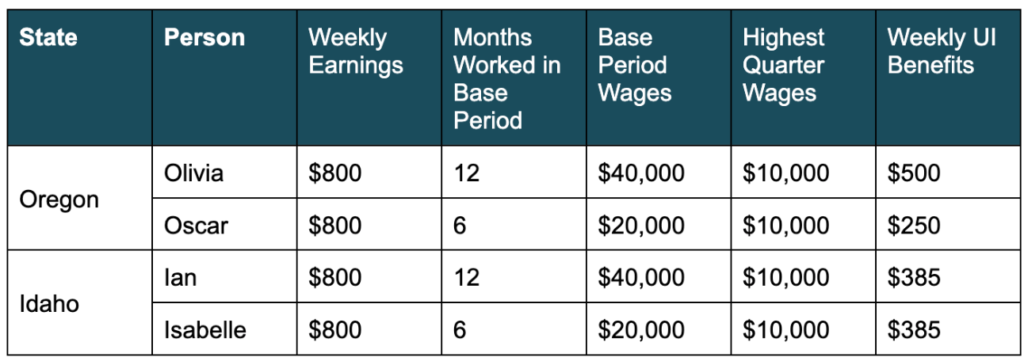
Despite the topline similarity of Oregon and Idaho’s UI laws and the identical wages in our examples, the realized UI benefits differ substantially across the four people. Olivia receives the most benefits – $100 on top of half of her weekly paycheck. Oscar receives the least. Even though he and Olivia were making the same wages every week, his more limited work history resulted in a benefit size of only half of Olivia’s. Ian and Isabelle make the same amount, and their combined benefits ($770) are similar to Olivia and Oscar’s ($750). Ian is effectively paying for Isabelle’s more generous benefits compared to Oscar’s since work history plays less of a role in Idaho.
Are UI algorithms designed or kludged?
Whether states use “base period wages” or “highest quarter wages’ is just one of the ways how calculations can vary. Among the other sources of variation:
- Some states use the average highest two quarters in the base period. As of January 2022, that included Alabama, Delaware, Georgia, Illinois, Tennessee, Vermont, Virginia, and Washington.
- Some states provide larger benefits for unemployed workers with dependents. As of January 2022, that included Iowa, Maine, Mayland, Massachusetts, Michigan, New Jersey, Ohio, and Pennsylvania.
- Some states use complex formulas that defy easy explanation or categorization.
- West Virginia has a table of “wage classes” instead of a formula. That is, in order to determine the UI benefits you need to look them up in a table.
- Colorado uses a complex algorithm: “Higher of 60% of 1/26 of 2 consecutive HQW [Highest Quarter Wages], capped by 50% of State avg weekly earnings or 50% of 1/52 BP [Base Period] earnings capped by 55% of State avg weekly earnings”.
- Louisiana UI agency explains: “The formula used to determine your weekly benefit amount is to first take 1/25th of the average of your total covered employment wages in the base period. That number is multiplied by 1.05, and then multiplied again by 1.28.”
When we inquired about the rationale for multiplying by two different numbers, instead of just multiplying by 1.344, the Louisiana Work Commission could not provide any explanations.
- West Virginia has a table of “wage classes” instead of a formula. That is, in order to determine the UI benefits you need to look them up in a table.
States should have substantial flexibility to design their own UI programs. This allows states to set benefit levels in accordance with their populations’ political beliefs, economic conditions, and fiscal capacity. But even if states should have some degree of latitude in determining generosity, do their unique economic environments justify using entirely different formulas to calculate benefit amounts?
We can explore this by just looking at which states use “base period wages” as the basis of their calculation and which use “highest-quarter wages” (or a variant like the highest two quarters). Among the 50 states and D.C., 13 base their calculation on the annual wage or four consecutive quarters, while 38 use the highest quarter or two quarters.
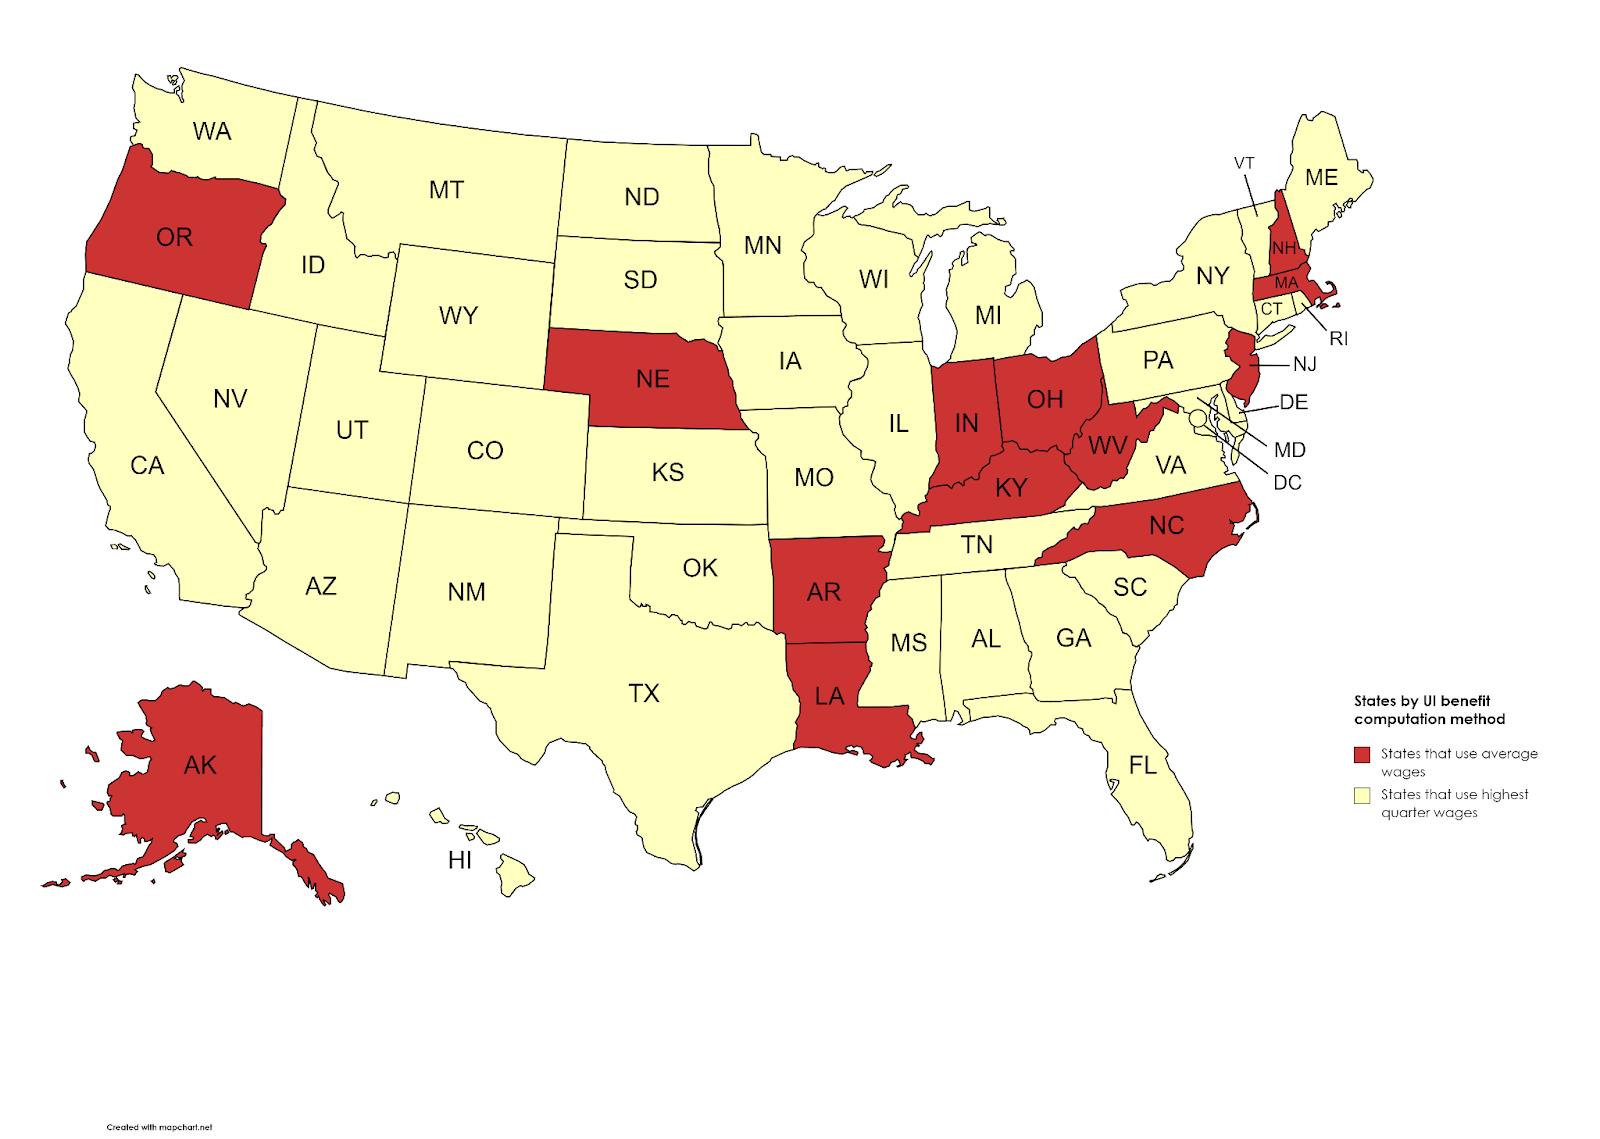
Sometimes it feels like every state policy map looks the same. State policies often are closely correlated with variables like population density and partisan lean, such that they often look like the “red versus blue” maps we see on election night. But in this case, there’s no obvious intuitive breakdown — the 13 states that use highest-quarter wages do not appear to have much in common.
But we can look into this deeper. Even if these states do not have obvious historical or demographic similarities, they could have similar labor markets in ways that are not intuitively obvious.
For example, it could be the case that states that use the highest quarter(s) method do so because they experience higher seasonal unemployment than those that use the average method. States that experience higher seasonal fluctuations in employment might want to ensure that workers who lost their high-wage seasonal jobs receive benefits in line with what they would have made otherwise.
We examine this by isolating the seasonal component from unemployment trends in each state. The graph below shows California’s unemployment rate from 2012 through 2020. We can see that the unemployment rate trends down over this period, but we can also see seasonal fluctuations. Unemployment rates typically fall during the summer (because of available summer jobs) and in December (because of available holiday jobs).
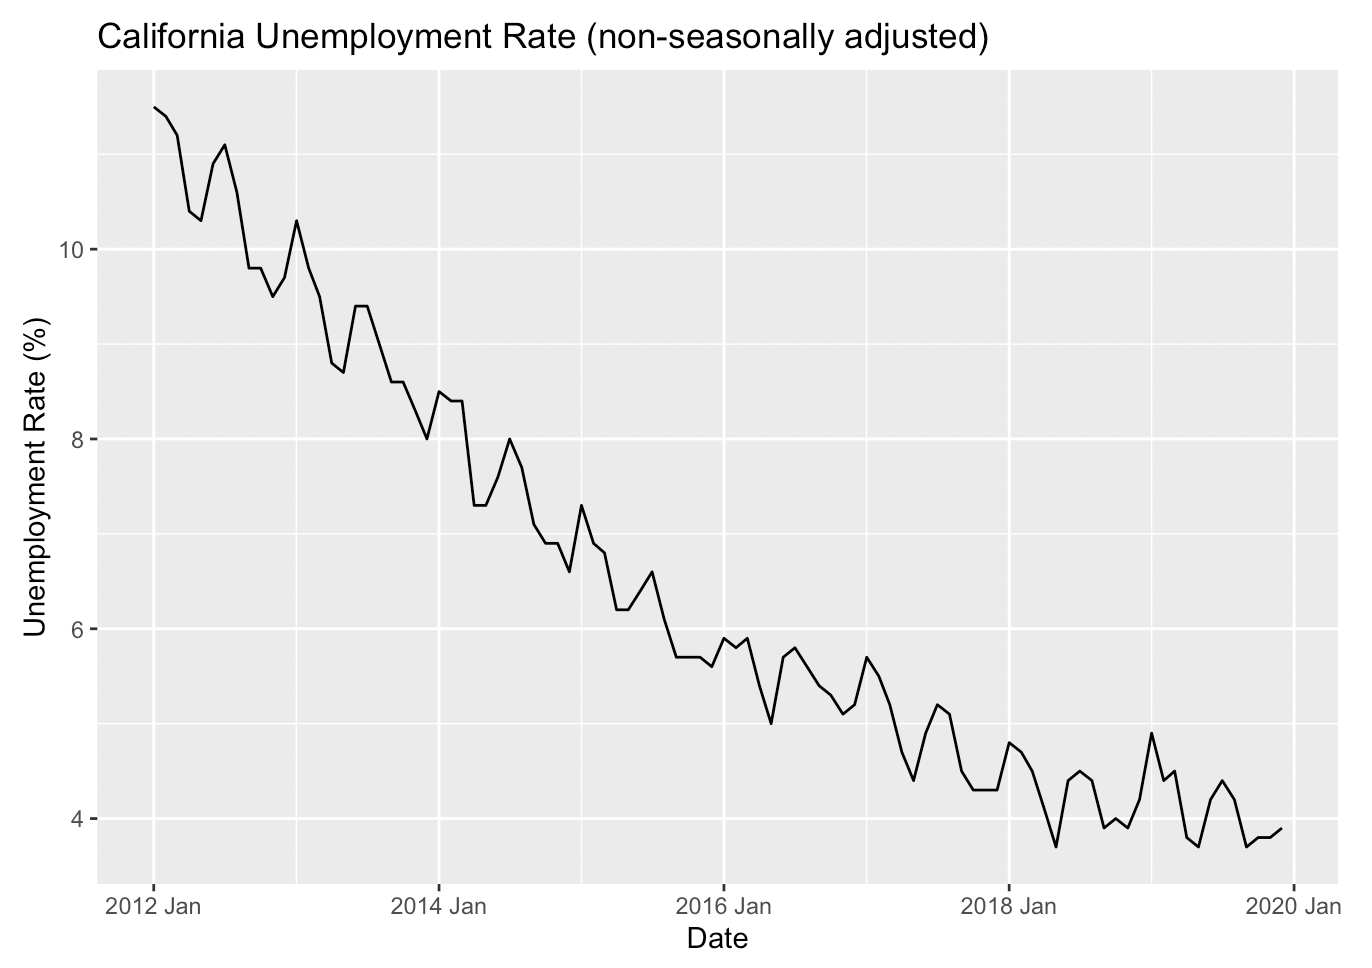
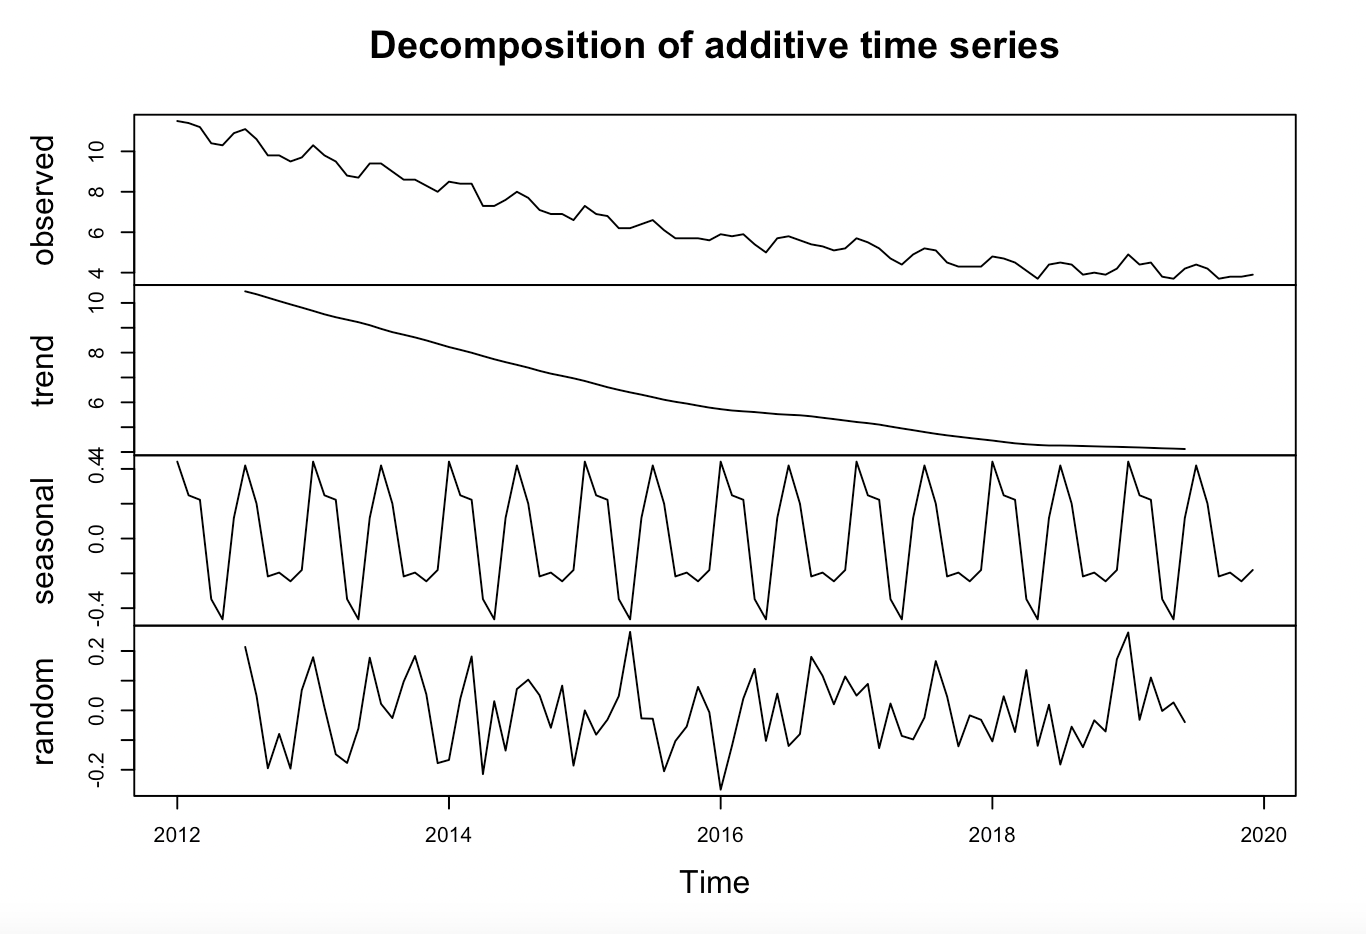
We can decompose a time series like this into different underlying patterns. The diagram below decomposes the California data above so we can observe the “trend”, “seasonal”, and “random” components independently from one other.
- “Trend” is defined as persistent directions in the data over the entire time series. It describes a change over longer periods that do not repeat. For California, the trend component shares a similar range as the data itself, from around 11 percent unemployment down to 4 percent.
- “Seasonal” patterns are caused by seasonal factors such as the weather and holidays. This technique is widely used in many economic data, where we would often see two versions of the same dataset released, one seasonally adjusted and one that is not. Seasonal variation for California has a range of 0.9 percent.
- “Random” components extracted from the data show any irregularities observed that could not be explained by trend or seasonality. Random variation accounts for about half of California’s variation in the unemployment rate.
All states experience some seasonal and random fluctuation in employment. That said, some states see more fluctuations than others. Montana sees the most seasonal variation — perhaps due to its highly agriculturally based economy or its unique just-cause employment laws. Washington, D.C., has the most random unemployment variance — perhaps because D.C.’s business cycle is much more based on the political cycle than in other states.
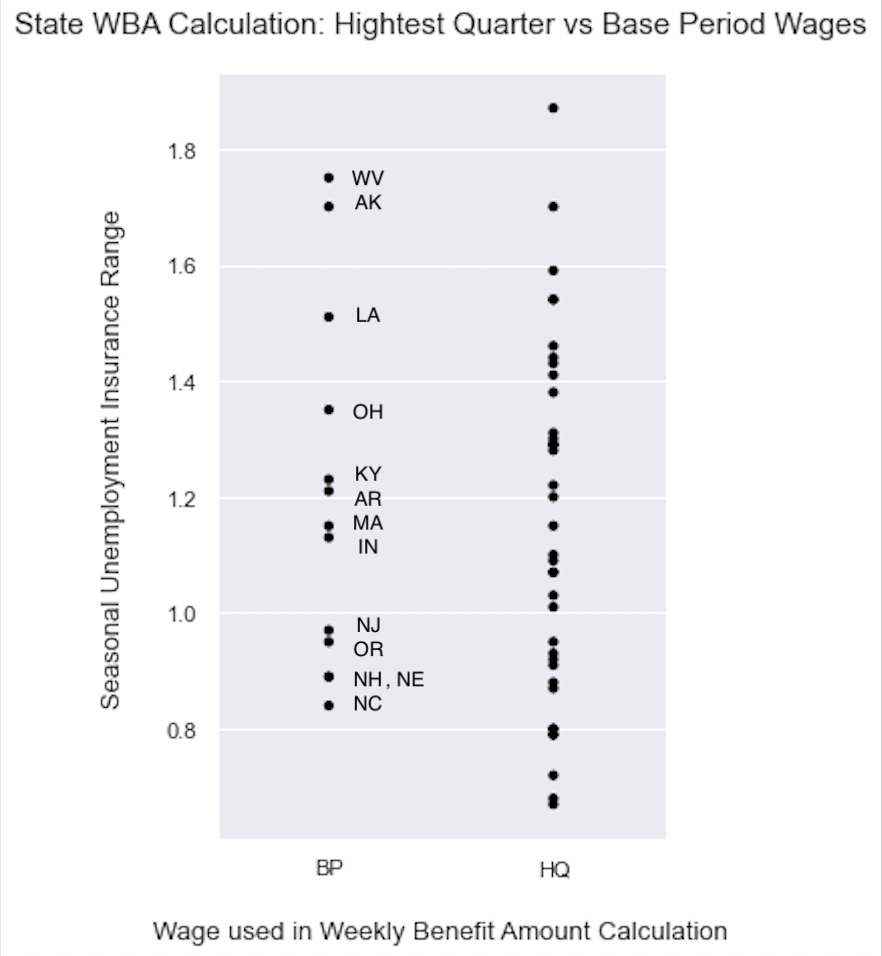
The graph below plots each state’s seasonal unemployment range. The graph shows no relationship between how much unemployment levels fluctuate in a given state and whether the states use the highest quarter or average wage to determine UI benefits. Statistical tests confirm what our eyes see (t-test, p=0.65). We see a similar result if we look at random variance (t-test, p=0.14). The differences appear arbitrary and not responsive to any particular economic conditions on the ground.
Make Unemployment Insurance benefits legible again
Over the last century, states have evolved their UI programs in distinctive ways. The collection of UI programs has been around for almost a century, and it’s not surprising that there has been substantial drift as different state policymakers tweak their UI systems in various ways. It’s easy to understand why a state legislator might respond to an unemployed worker’s complaint by moving to a “highest quarter’ system or why they might add a small dependent allowance.
But this drift has a cost. The UI program has become illegible — both for potential UI recipients and for the states themselves. Complicated UI codes make it impossible for people to anticipate how much in benefits they will receive and plan accordingly. The complex framework also increases the amount of UI “overpayments,” where people receive more benefits than they should. And, as we saw during the COVID-19 pandemic, it limits our ability to design and implement new policies in a crisis.
State policymakers should look for ways to “clean up” their UI benefit calculations and make them easier for individuals to understand (or late-night COBOL programmers to recode). But they should also start thinking about a “do no harm” approach where they try to preserve their current program’s remaining simplicity. Adding small tweaks to the program can increase eligibility or generosity but at the expense of a system that can effectively be modified or communicated.
At the same time, federal policymakers should consider potential mechanisms that encourage states to adopt simple UI benefits — ideally a wholesale UI reform effort, instead of giving states additional tweaks and optionality that will just lead to further complexity. This could include laws that limit the mechanisms states use to calculate UI, federalization of the UI system, or the creation of a federal UI “back-end” that states could access (with limited customization options). And, like state policymakers, they should avoid small tweaks that, while well-intentioned, will make the program more complex.
Let’s clean up unemployment insurance and make it easier for everyone to understand. Less confusion, fewer overpayments, and better preparedness for the next crisis.
Photo credit: iStock