Research on Livestock Carrying Capacity of Arid Pastoral Areas Based on Dynamic Water–Forage–Livestock Balance in OtogBanner, China


State Key Laboratory of Eco-hydraulics in Northwest Arid Region of China, Xi’an University of Technology, Xi’an 710048, China
*
Author to whom correspondence should be addressed.
Water 2020, 12(9), 2539; https://doi.org/10.3390/w12092539
Submission received: 11 August 2020
/
Revised: 4 September 2020
/
Accepted: 9 September 2020
/
Published: 11 September 2020
Abstract
:There are nonequilibrium characteristics of grassland ecosystems driven by water, and constraints on the development scale of artificially irrigated grassland caused by the lack of water resources in arid pastoral areas. Based on the interaction of water, forage, and livestock, this study built a model of livestock-carrying capacity within the dynamic water–forage–livestock balance, to analyze the livestock carrying capacity of arid pastoral areas. The results showed that compared with the fixed livestock carrying capacity of 1.0898 million sheep units with a dynamic forage–livestock balance, the livestock carrying capacity based on the dynamic water–forage–livestock balance of OtogBanner were in a multi-equilibrium state due to the fluctuation of rangeland productivity caused by a change in precipitation conditions and the adjustment of the tame grassland irrigation scale caused by the change in water demand of other water users in the pastoral area. Under the conditions of the wet, normal, and dry years, the livestock carrying capacity was 1.632 million standard sheep units under the 26.5 thousand hm2 tame grassland developing areas, 1.3037 million standard sheep units under the 25.9 thousand hm2 tame grassland developing areas, and 0.9155 million standard sheep units respectively under 22.4 thousand hm2 tame grassland developing areas. This fluctuation change was more prominent in the pastoral areas with rangeland as the key field. Besides this, the model could effectively identify the predicament of water and forage resources. At present, the overload of forage resources and water resources coexisted in the pastoral area of OtogBanner, and an important reason for this was that the distribution of water and forage resources was poorly matched with the mode of animal husbandry production. The value of 1.3037 million sheep units was recommended to the livestock-carrying capacity of OtogBanner according to the model. This study could provide a new method for the calculation of livestock carrying capacity, and offered a scientific basis for the protection of the grassland ecological environment and the sustainable development of animal husbandry in the arid pastoral area of OtogBanner.
1. Introduction
There are more than 4 million km2 of rangeland in China, accounting for 41% of territorial areas, which is the main animal husbandry production base in the country and the ecological barrier for wind prevention and sand fixation in the northern region [1,2,3]. Facing the current predicament of livestock overload and ecological imbalance of rangeland in pastoral areas [4,5], on the one hand, the pastoral management departments strictly control the number of livestock in pastoral areas, and carry out forage–livestock balance (FLB) management based on the livestock carrying capacity (LCC) of rangeland in pastoral areas [6,7]. On the other hand, the artificially irrigated grassland is developed, and the grazing pressure of rangeland is replaced with the huge productivity of intensive cultivation of tame grassland [8,9]. However, the pastures in China are mainly distributed between the arid and semi-arid areas to the west of the 400mm precipitation line. The scarcity of water resources, the fragility of the water ecological environment, and the uneven precipitation caused by monsoon water vapor pose new challenges to the development of the concept “to determining the forage yield by water carrying capacity and the livestock number by forage carrying capacity” in pastoral areas [10,11]. Therefore, to study the carrying capacity of animal husbandry development under the restriction of water resources and to realize the sustainable development of animal husbandry production, resources and ecological environments in pastoral areas have become an important problem to be solved urgently for the high-quality development of animal husbandry in pastoral areas of China.
As the basis of animal husbandry management, the core of LCC is to achieve the maximum number of livestock that can equal the amount of available forage and the forage demand for the animal in pastoral areas, to realize the ecological protection of rangeland and the sustainable development of animal husbandry in pastoral areas [12,13,14]. The LCC of this equilibrium state was usually based on the theory of equilibrium ecology. This theory held that the grassland ecosystem was a stable system, which can return to its initial state after being disturbed by grazing, and the LCC was the maximum value of this resilience, so the LCC usually showed a fixed value for the pastoral areas [15,16]. However, water resources as the main driving factor for the stability of the grassland ecosystem in the arid and semi-arid areas and the unstable precipitation made the grassland ecosystem present with a high degree of variability, showing a state of non-equilibrium or multi-equilibrium, and the fixed LCC for grassland ecosystem protection was hardly satisfied [16,17,18,19].
At the same time, tame grassland as the efficient, stable and controllable irrigated grassland, has always been regarded as an important measure to solve the contradiction between the development of animal husbandry and the ecological protection of rangeland in pastoral areas [20]. Different from the rangeland, the growth of tame grassland was inseparable from local agricultural irrigation, and the forage yield of tame grassland was significant correlativity with irrigation water [21,22]. Furthermore, developing tame grassland blindly in the arid and semi-arid areas with water scarcity was not only needed to face the competition with other water users, but would also lead to overexploitation of local water resources and the destruction of the balance of water resources. It was bound to cause a series of water environmental problems, and deepen the current situation of rangeland degradation and ecological environmental deterioration, in the form of a vicious cycle in pastoral areas [23,24,25]. Therefore, it is meaningful to consider the influence of water resources on the FLB and to realize the development of animal husbandry and the protection of the grassland ecological environment through the dynamic balance of water, forage, and livestock in the arid and semi-arid pastoral areas.
This study took the arid pastoral area of OtogBanner in China as the research area, by analyzing the functional relationship between water, forage, and livestock, based on the nonequilibrium characteristics of the grassland ecosystem driven by precipitation and the current mode of animal husbandry production dominated by forage utilization and livestock grazing management, to study the LCC based on the dynamic balance of water, forage, and livestock, to provide a scientific basis for the sustainable development of ecological animal husbandry in arid pastoral areas.
2. Materials and Methods
2.1. Study Area
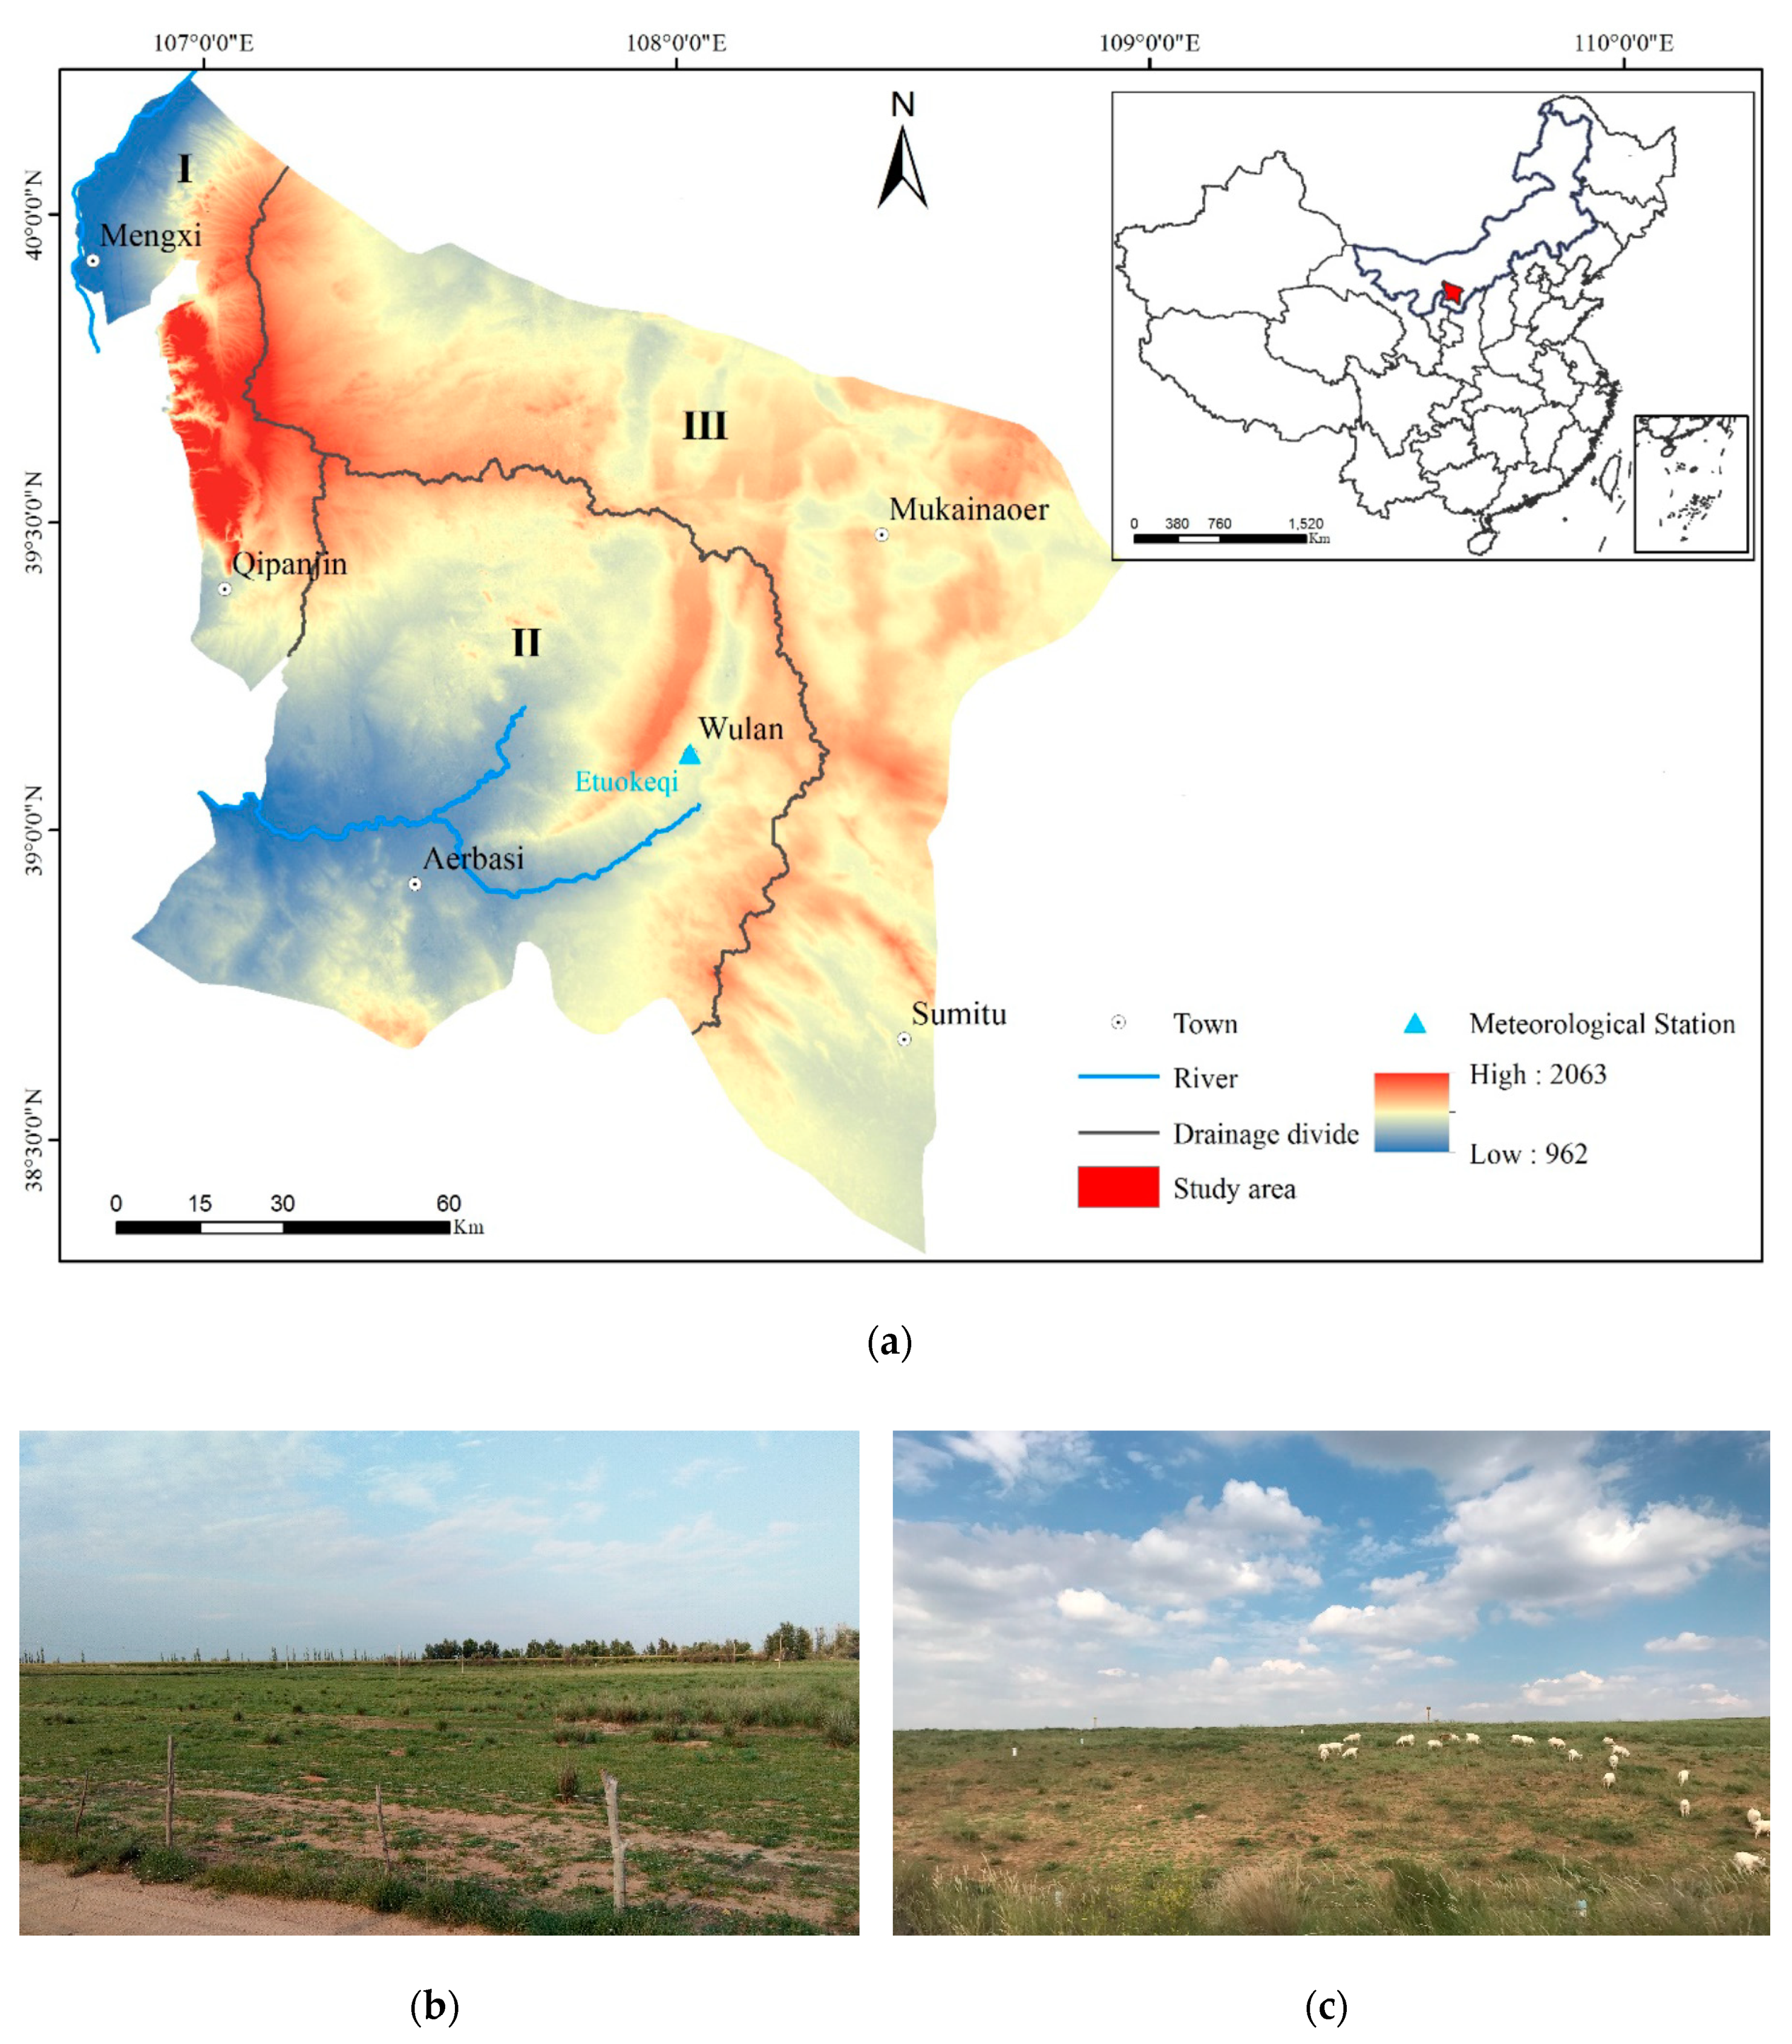
The study area, OtogBanner (106°40′ E–108°54′ E, 38°18′ N–40°11′ N, Figure 1), is located to the southwest of Ordos city, Inner Mongolia Autonomous Region, China. The area is 962–2063 m above sea level, with an area of 20.4 thousand km2. The annual average temperature is 7.7℃, and the average annual precipitation is only 241.2 mm, which is typical of the arid and semi-arid continental climate in OtogBanner [26]. According to the characteristics of the river system of the basin, the study area is divided into three water resource regionalizations: Zhuozi mountain zoning (Ⅰ), Dusituhe river watershed zoning (Ⅱ), and Inland river watershed zoning (Ⅲ).
2.2. Data
The present situation of water resource data refers to The Integrated Water Resources Planning of OtogBanner and the water supply and consumption statistics by the local OtogBanner government. The available amount of water resources in OtogBanner is 206.702 million m3, of which the available amount of surface water resources is 11.174 million m3 and the exploitable amount of groundwater resources is 195.528 million m3. According to the most stringent water resources management system, the water consumption control index of OtogBanner is 192 million m3 in 2016, while the total water supply is 197.89 million m3, which shows that the current water supply capacity is greater than the total water consumption control index in OtogBanner. Therefore, adding the water supply capacity of reclaimed water of 16.677 million m3, the current available water supply of OtogBanner was208.677 million m3 in 2016 and the available water supply with different inflow frequency in different water resource regionalization is described in Table 1.
The current situation of water users covers the whole industry including domestic, agriculture, industry, tertiary industry, ecological, and so on in OtogBanner. To facilitate understanding and calculation, livestock water users and tame grassland water users are separated from agricultural water users and calculated independently in this study. The scale and quota of water consumption in related industries are selected according to the relevant indicators of the Statistical Bulletin of National Economic and Social Development of OtogBanner in 2016 (http://www.eq.gov.cn/zwgk_97654/tjxx_97687/tjgb_97910/201704/t20170427_1932660.html) and the water consumption standard of the Industrial Water quota of the Inner Mongolia Autonomous Region. The utilization coefficient of local agricultural water irrigation is 0.75, ignoring the utilization rate of water resources in other industries.
The situation of grassland resources refers to the monitoring data collected by the OtogBanner grassland station, and OtogBanner has a total rangeland area of 1.9745 million hm2. Due to the outstanding problems of degradation, desertification, and salinization of rangeland in OtogBanner, in addition to the grassland ecological construction, the present situation of rangeland used for grazing is only 1.1277 million hm2. At the same time, OtogBanner is also an important tame forage base in Inner Mongolia, and there was 25,000 hm2 of artificial forage planting area in 2016, with corn and alfalfa as the main tame forage crops. The specific statistics of the grazing grassland area in each district of OtogBanner are shown in Table 2.
The current situation of grazing livestock refers to the mid-year livestock statistics of the local animal husbandry bureau in OtogBanner, and due to the different amount of forage required among all kinds of livestock in pastoral areas, the standard conversion of livestock quantities is carried out by using sheep units (SU) which are commonly used in China. The mid-year statistics of livestock is 1.5395 million SU in 2016, including 161.1 thousand SU in Zhuozi mountain zoning, 677.3 thousand SU in Dusituhe river watershed zoning, and 701.1 thousand SU in inland river watershed zoning. Sheep are the main grazing livestock in OtogBanner, according to the local feeding rhythm, and the lambing and column quantity of sheep, which have the greatest impact on the number of grazing livestock in the pastoral area, occurred in April and September respectively, and the slaughter rate of livestock was 0.65.
The intermittent grazing was carried out in the rangeland of OtogBanner. From January to March, it was called the cold season, grazing on rangeland for 90 days. In addition to grazing, additional supplementary feeding was conducted, with 0.75kg forage per SU per day; from April to June, it belonged to the grazing prohibition season, with a total of 91 days, and supplementary feeding 1.8kg forage per SU per day; from July to December, it was called the warm season, grazing on rangeland for 184 days without supplementary feeding. The productivity of rangeland was significantly different in the cold season compared to the warm season (Table 3). The productivity of tame grassland was 18 thousand kg/hm2 for core, 12 thousand kg/hm2 for alfalfa, and the utilization rate of artificial grassland was 0.9. At the same time, the tame grassland is also responsible for supplying forage to the outside of OtogBanner, the retention rate of tame grassland is 0.76 for corn and 0.2 for alfalfa.
2.3. Methods
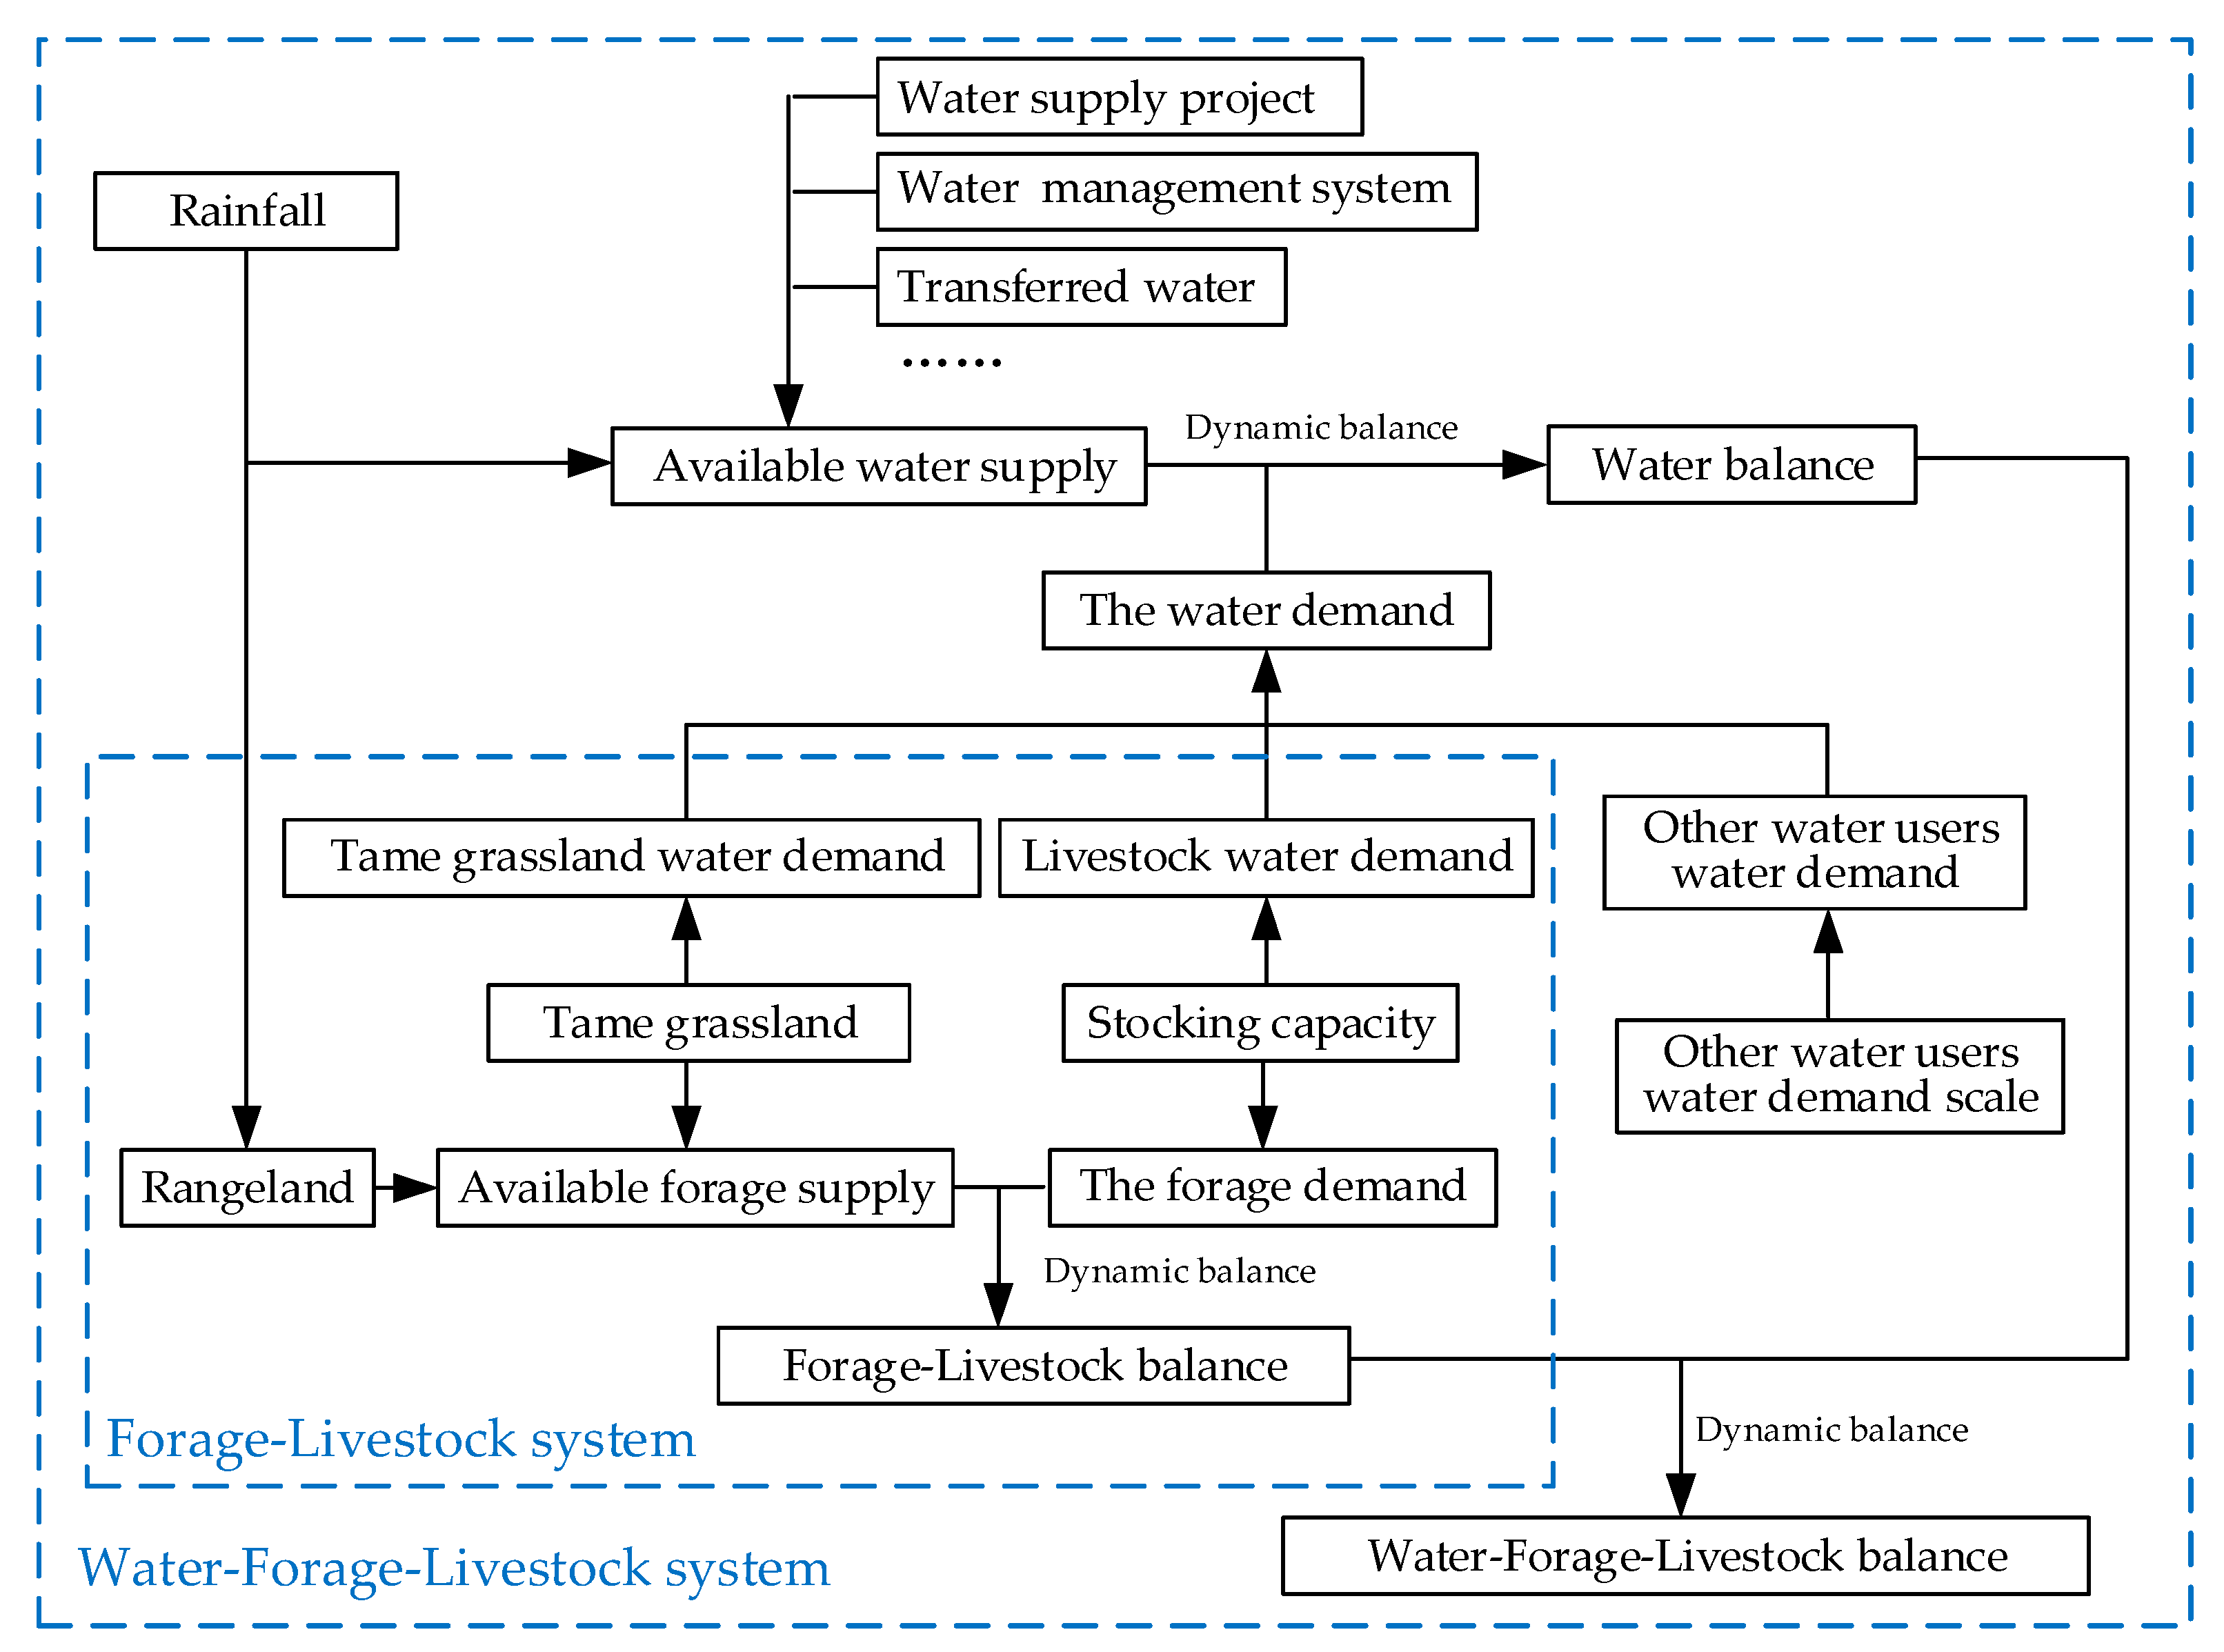
The balance of water, forage, and livestock is a complex system involving humans, water, forage, livestock, ecology, and other elements [27,28]. According to the correlation among the elements of the system, the balance system of water, forage, and livestock can be divided into water balance and FLB (Figure 2). From elements and balance, the functional relationship among the elements is embodied in the following aspects:
(1) The effect of water on the balance of forage and livestock.
FLB refers to the dynamic balance between the forage demand of livestock and the amount of available forage of grassland in a specific period. As the basic resource of production and life, water resources play the controlling factor in the balance of forage and livestock and are an important means of regulating both sides of the balance. Tame grassland is a stable and controllable high-quality forage, the irrigation water of grassland determines the planting scale and the output of tame grassland. The productivity of rangeland, especially in arid areas, is unsteadily driven by precipitation. On the other hand, livestock as the demand side of FLB not only needs to consume forage in its growth process, but also needs to drink enough water. The supply of water resources determines the livestock feeding scale and then affects the forage demand for FLB.
(2) The effect of forage and livestock on the balance of water resources.
Water balance refers to the dynamic balance between water consumption of regional water users and the regional available water supply in a specific period and region. In the water resource balance, forage and livestock are independent water use departments, which form the balanced water side together with other water departments in the region. The change of the scale of forage and livestock will directly lead to an increase in water consumption of forage and livestock, which will lead to an increase in water consumption and water balance.
To verify the applicability of the dynamic balance of water, forage, and livestock in the calculation of LCC in pastoral areas, two balance models based on dynamic FLB and based on dynamic water–forage–livestock balance (WFLB) were used to calculate LCC in this study.
2.3.1. LCCModel Based on Dynamic FLB
The LCC model based on the dynamic FLB was referred to the existing research results [29] when the amount of available forage was equal to the forage demand of livestock in t periods of i pastoral areas, the number of livestock was the LCC in t periods of i pastoral areas, which was also called theoretical LCC, and the formula was expressed as follows:
where Fit is the amount of available forage in t periods of i pastoral areas (kg); Eit is the forage demand of livestock in t periods of i pastoral areas (kg).
The Fit usually consisted of four parts: the remaining available forage amounts of rangeland in t − 1 periods of i pastoral areas, the growing available forage amounts of rangeland in t periods of i pastoral areas, the available forage amount of tame grassland for t periods of i pastoral areas, and the available forage amount of outside input and output for t periods of i pastoral areas. The formula was as follows:
where is the remaining available forage amount of rangeland in t − 1 periods of i pastoral areas (kg); j is the number of different types of rangeland in i pastoral areas; is the forage utilization rate of the rangeland; is the forage productivity of the j type of rangeland in i pastoral areas (kg/hm2); is the area of the j type of rangeland in i pastoral areas; is the forage utilization rate of the tame grassland; is the forage productivity of the tame grassland (kg/hm2); Sith is the area of tame grassland used for t periods of i pastoral areas (hm2) and fit is the available forage amount of outside input
and output for t periods of i pastoral areas (kg).
The Eit is usually calculated by the forage requirement quota of livestock and the number of livestock in the pastoral area. The formula for calculating the forage demand of livestock in t periods of i pastoral areas was as follows:
where k is the number of times that the number of livestock fluctuates around the maximum statistics of livestock during the t periods; is the floating coefficient of the change of the k-th livestock quantity in t periods of i pastoral areas; is the maximum statistical number of livestock in t periods of i pastoral areas (SU); is the forage requirement quota for livestock (kg/SU); the duration of the k-th livestock quantity change in t periods of i pastoral areas (d).
According to the Formulas (1)–(3), the amount of available forage was equal to the forage demand of livestock, which means that the FLB in t periods in i pastoral areas, and the was the LCC in t periods of i pastoral areas:
For i pastoral areas, different calculation periods t would get different LCCs. From the whole system, only the LCC corresponding to the period with the lowest LCC could make the pastoral area achieve FLB in the whole period, which was called the key pasture of the pastoral area [30]. Therefore, the LCC of i pastoral areas was:
The calculated LCC was used to analyze the current stocking capacity balance, and obtain the overload condition of i pastoral areas:
where is the overload rate of livestock in pastoral areas; is the current number of the livestock in pastoral areas (SU).
2.3.2. LCCModel Based on Dynamic WFLB
The dynamic WFLB increases the water resource balance and the influence of water resources on the balance system based on dynamic FLB. Because of the contradiction between water balance and FLB, we used the objective programming method to calculate the LCC based on dynamic WFLB. The calculation model is expressed as follows:
Objective:
The maximum LCC of i pastoral areas
Subjective to:
(1) The forage demand of livestock was less than or equal to the available forage amount of grassland in t periods of i pastoral areas
(2) The water demand was less than or equal to the available water supply in t periods of i pastoral areas
where is the forage demand of livestock and is the available forage amount of grassland in t periods of i pastoral areas based on the dynamic WFLB (kg); is the water demand of all water-use sectors and is the available water supply in t periods of i pastoral areas (m3).
(3) Nonnegative constraint
According to the relationship between the elements of the WFLB system, the effect of water resources on the forage demand of livestock was shown to limit the size of livestock by affecting livestock water consumption, thus affecting the forage requirement of livestock in pastoral areas. The scale of livestock can be expressed by the water consumption of livestock and the water demand quota of livestock , the forage demand of livestock based on the balance of water–forage–livestock in t periods of i pastoral areas was expressed as follows:
where is the water demand of livestock in t periods of i pastoral areas (m3); is the water demand quota for livestock (m3/SU).
Similarly, considering the driving effect of water resources on rangeland in arid pastoral areas, the representative precipitation cumulative frequency of 25%, 50%, and 75% was selected as the wet year, normal year and dry year in the calculation of available forage amount of rangeland, and the wet and dry coefficient was introduced to simulate the multi-equilibrium state of rangeland productivity caused by precipitation driving in arid pastoral areas. The effect of water resources on the available forage amount of tame grassland was expressed by using irrigation water requirements and irrigation quotas. Therefore, the available forage amount of grassland based on the balance of water–forage–livestock in t periods of i pastoral areas could be expressed as follows:
where is the irrigation water requirement of tame grassland in t periods of i pastoral areas (m3); and is the wet and dry coefficient of rangeland in i pastoral areas, representing the floating range of grass production capacity and the multi-year average value of rangeland under different water supply conditions. The values should be dynamically fitted according to the observed data of a long series of rangeland and their corresponding precipitation. In this study, the values were obtained by using the research results of Habuer et al. [31]; is the utilization coefficient of irrigation water in i pastoral areas; is the irrigation quota of tame grassland in t periods of i pastoral areas (m3/hm2).
On the other hand, the water demand reflects the influence of forage and livestock on the water balance in the pastoral area. I pastoral areas, for example, water demand, was generally expressed as the sum of water demand for each water user in t periods, and water users include tame grassland water users, livestock water users, and other industrial water users. The water demand for other industrial water users were calculated by the water demand scale of water users and their corresponding water demand quota. Thus, the formula of water demands in t periods of i pastoral areas was obtained as follows:
where n is the number of different other water users in pastoral areas; is the water resources utilization coefficient of the n-th water user; is the water demand scale of the n-th water users, the unit varies according to the statistics of water users, taking livestock water users as an example (SU); is the water demand quota of water users, the unit varies according to the statistics of water users also, taking livestock water users as an example (m3/SU).
The available water supply was determined by the number of available water resources and the water supply capacity of the water supply project; the total water consumption index was under the strictest water resource management system and the amount of water transferred outside the region in t periods of i pastoral areas. The formula was expressed as follows:
where is the amount of available water resources in t periods of i pastoral areas (m3); is the water supply capacity of water supply projects in t periods of i pastoral areas (m3); is the total water consumption index under the strictest water resource management system in t periods of i pastoral areas (m3); is the amount of reclaimed water in t periods of i pastoral areas (m3); is the amount of water transferred outside the region in t periods of i pastoral areas (m3).
The objective programming model based on the dynamic balance of water–forage–livestock was established by the simultaneous Formulas (7)–(13) and solved by MATLAB. The water demand of livestock and the water demand of tame grassland in different periods were obtained. The LCC and the development scale of tame grassland in different periods were calculated according to and .
From the LCC calculation process, the balance of water–forage–livestock existence and the relationship between water resources affected the FLB by affecting the planting scale and output of tame grassland. Therefore, the LCC was closely related to the area of tame grassland in the pastoral area, and it could be regarded as the LCC. was based on the planting scale of tame grassland in i pastoral areas. However, in the current stocking capacity balance analysis of i pastoral areas, due to the difference between the current planting area of tame grassland and the planting area which could be the development of tame grassland , the LCC based on the WFLB calculation was not the actual carrying capacity of the current, which was difficult to directly guide with the development of ecological animal husbandry in pastoral areas.
The current LCC was based on the planting area of tame grassland in i pastoral areas. So, calculating the current LCC of i pastoral areas needed to be replaced with in Formula (11) by using , and in Formula (12) by using , which was to use the current situation of tame grassland and water use to replace the theoretical value. Then the new objective programming model was established and solved, and the current carrying capacity of i pastoral areas can be obtained. If the model cannot be solved, it shows that the water–forage–livestock system was imbalanced and the development of artificial grassland was restricted, and was the current carrying capacity of i pastoral areas.
Based on the analysis of the current LCC of i pastoral areas, the overloading situation of the pastoral area was obtained.
Similarly, by substituting the livestock capacity L and the planting area of tame grassland into the Formulas (10)–(12), the current forage requirement of livestock , the amount of current forage available and the current water demand can be calculated respectively in i pastoral areas, and the overload condition of forage resources and water resources can be calculated as follows:
3. Results
3.1. Analysis of Livestock Carrying Capacity in Pastoral Areas
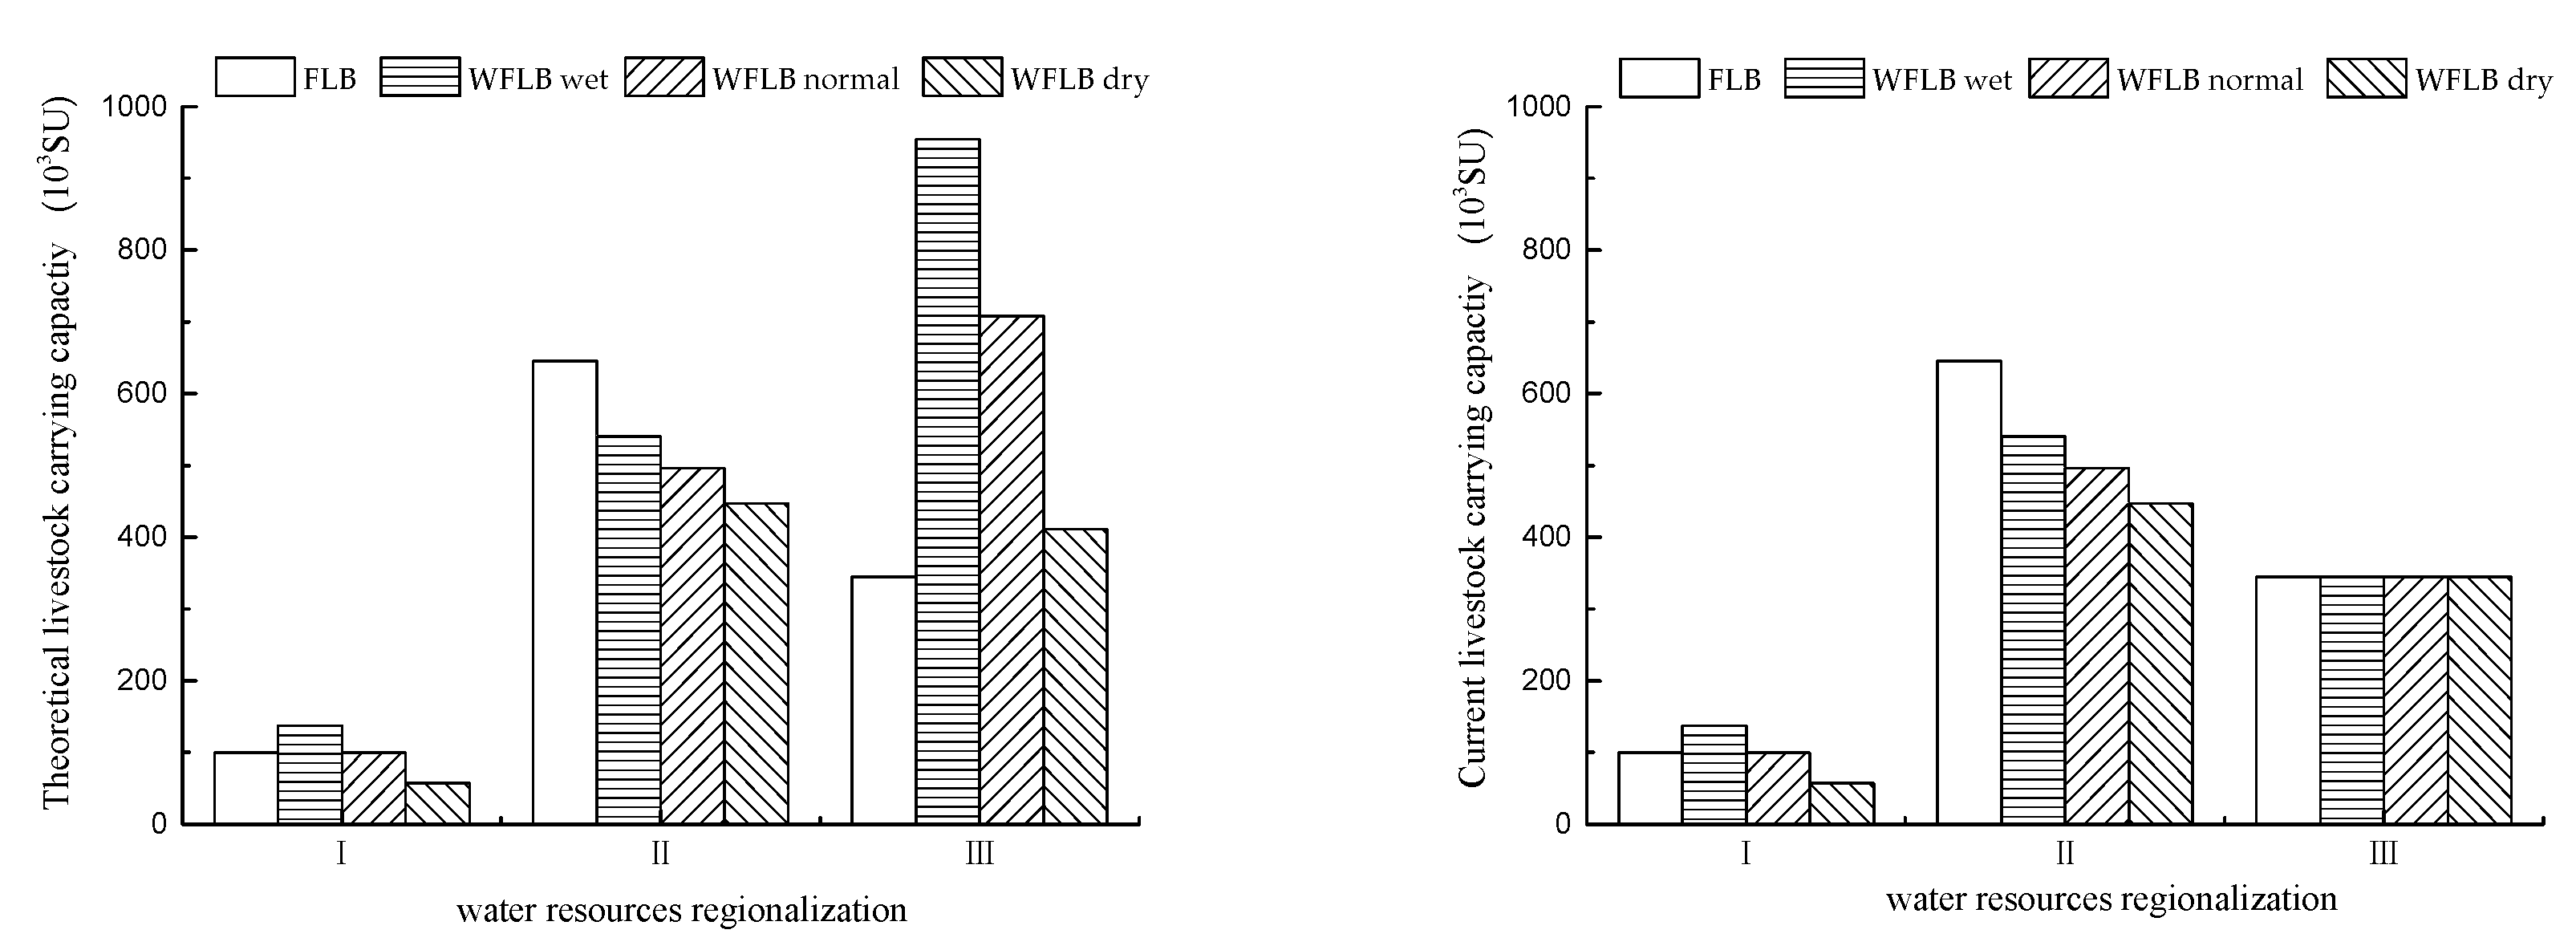
According to the present situation of grassland utilization, the pasturing area of OtogBanner was divided into two periods of rangeland utilization and tame grassland utilization. The calculation results of two methods could be found in Table 4 and Table 5, compared with the LCC based on the dynamic FLB model, the LCC was based on the dynamic WFLB model which showed a fluctuating multi-equilibrium form with a different water frequency. At the same time, it could be seen that the livestock carrying capacity values of the two models were also different (Figure 3).
For the Zhuozimountain zoning with the rangeland as the key field, the difference of LCC between the two methods was that the dynamic WFLB model could reflect the process of water resources affecting FLB by affecting the rangeland. Because of the wet year, precipitation was most beneficial to the growth of rangeland in the arid pastoral area. Therefore, the theoretical LCC based on dynamic WFLB 136.9 thousand SU under the 4.2 thousandhm2 tame grassland developing areas was higher than that based on dynamic FLB 99.2 thousand SU.
For the Dusituhe river watershed zoning, the inland river watershed zoning with the tame grassland was the key field. The difference in LCC between the two models was that the dynamic WFLB model, which took into account the effects of the interaction of water, tame grassland, and livestock on water balance and FLB in pastoral areas. The yield of the existing tame grassland could support the LCC of 645.5 thousand SU, but at this time, the water demand of tame grassland and livestock exceeded the available water supply for tame grassland and livestock, and the water resources could not be balanced in the pastoral area. It was necessary to reduce the water use of tame grassland and livestock to re-establish the balance of water resources. So, the theoretical LCC based on dynamic WFLB 540.6 thousand SU under the 8.1 thousand hm2 tame grassland developing areas was lower than that based on the dynamic FLB 645.5 thousand SU in pastoral areas.
In the Inland river watershed zoning, the water resources in pastoral areas could not only support the current water demand but also develop additional tame grassland irrigation areas and supply water to additional livestock at the same time. Therefore, the theoretical LCC 954.5 thousand SU was higher than the current LCC 345.0 thousand SU, and the theoretical LCC based on dynamic WFLB was higher than that based on dynamic FLB 345.0 thousand SU. However, since the development area of tame grassland does not reach the theoretical planting area 14.2 thousand hm2, this effect was lagging, and the actual LCC did not reach the theoretical LCC.
3.2. Analysis of Stocking Capacity Balance in Pastoral Area
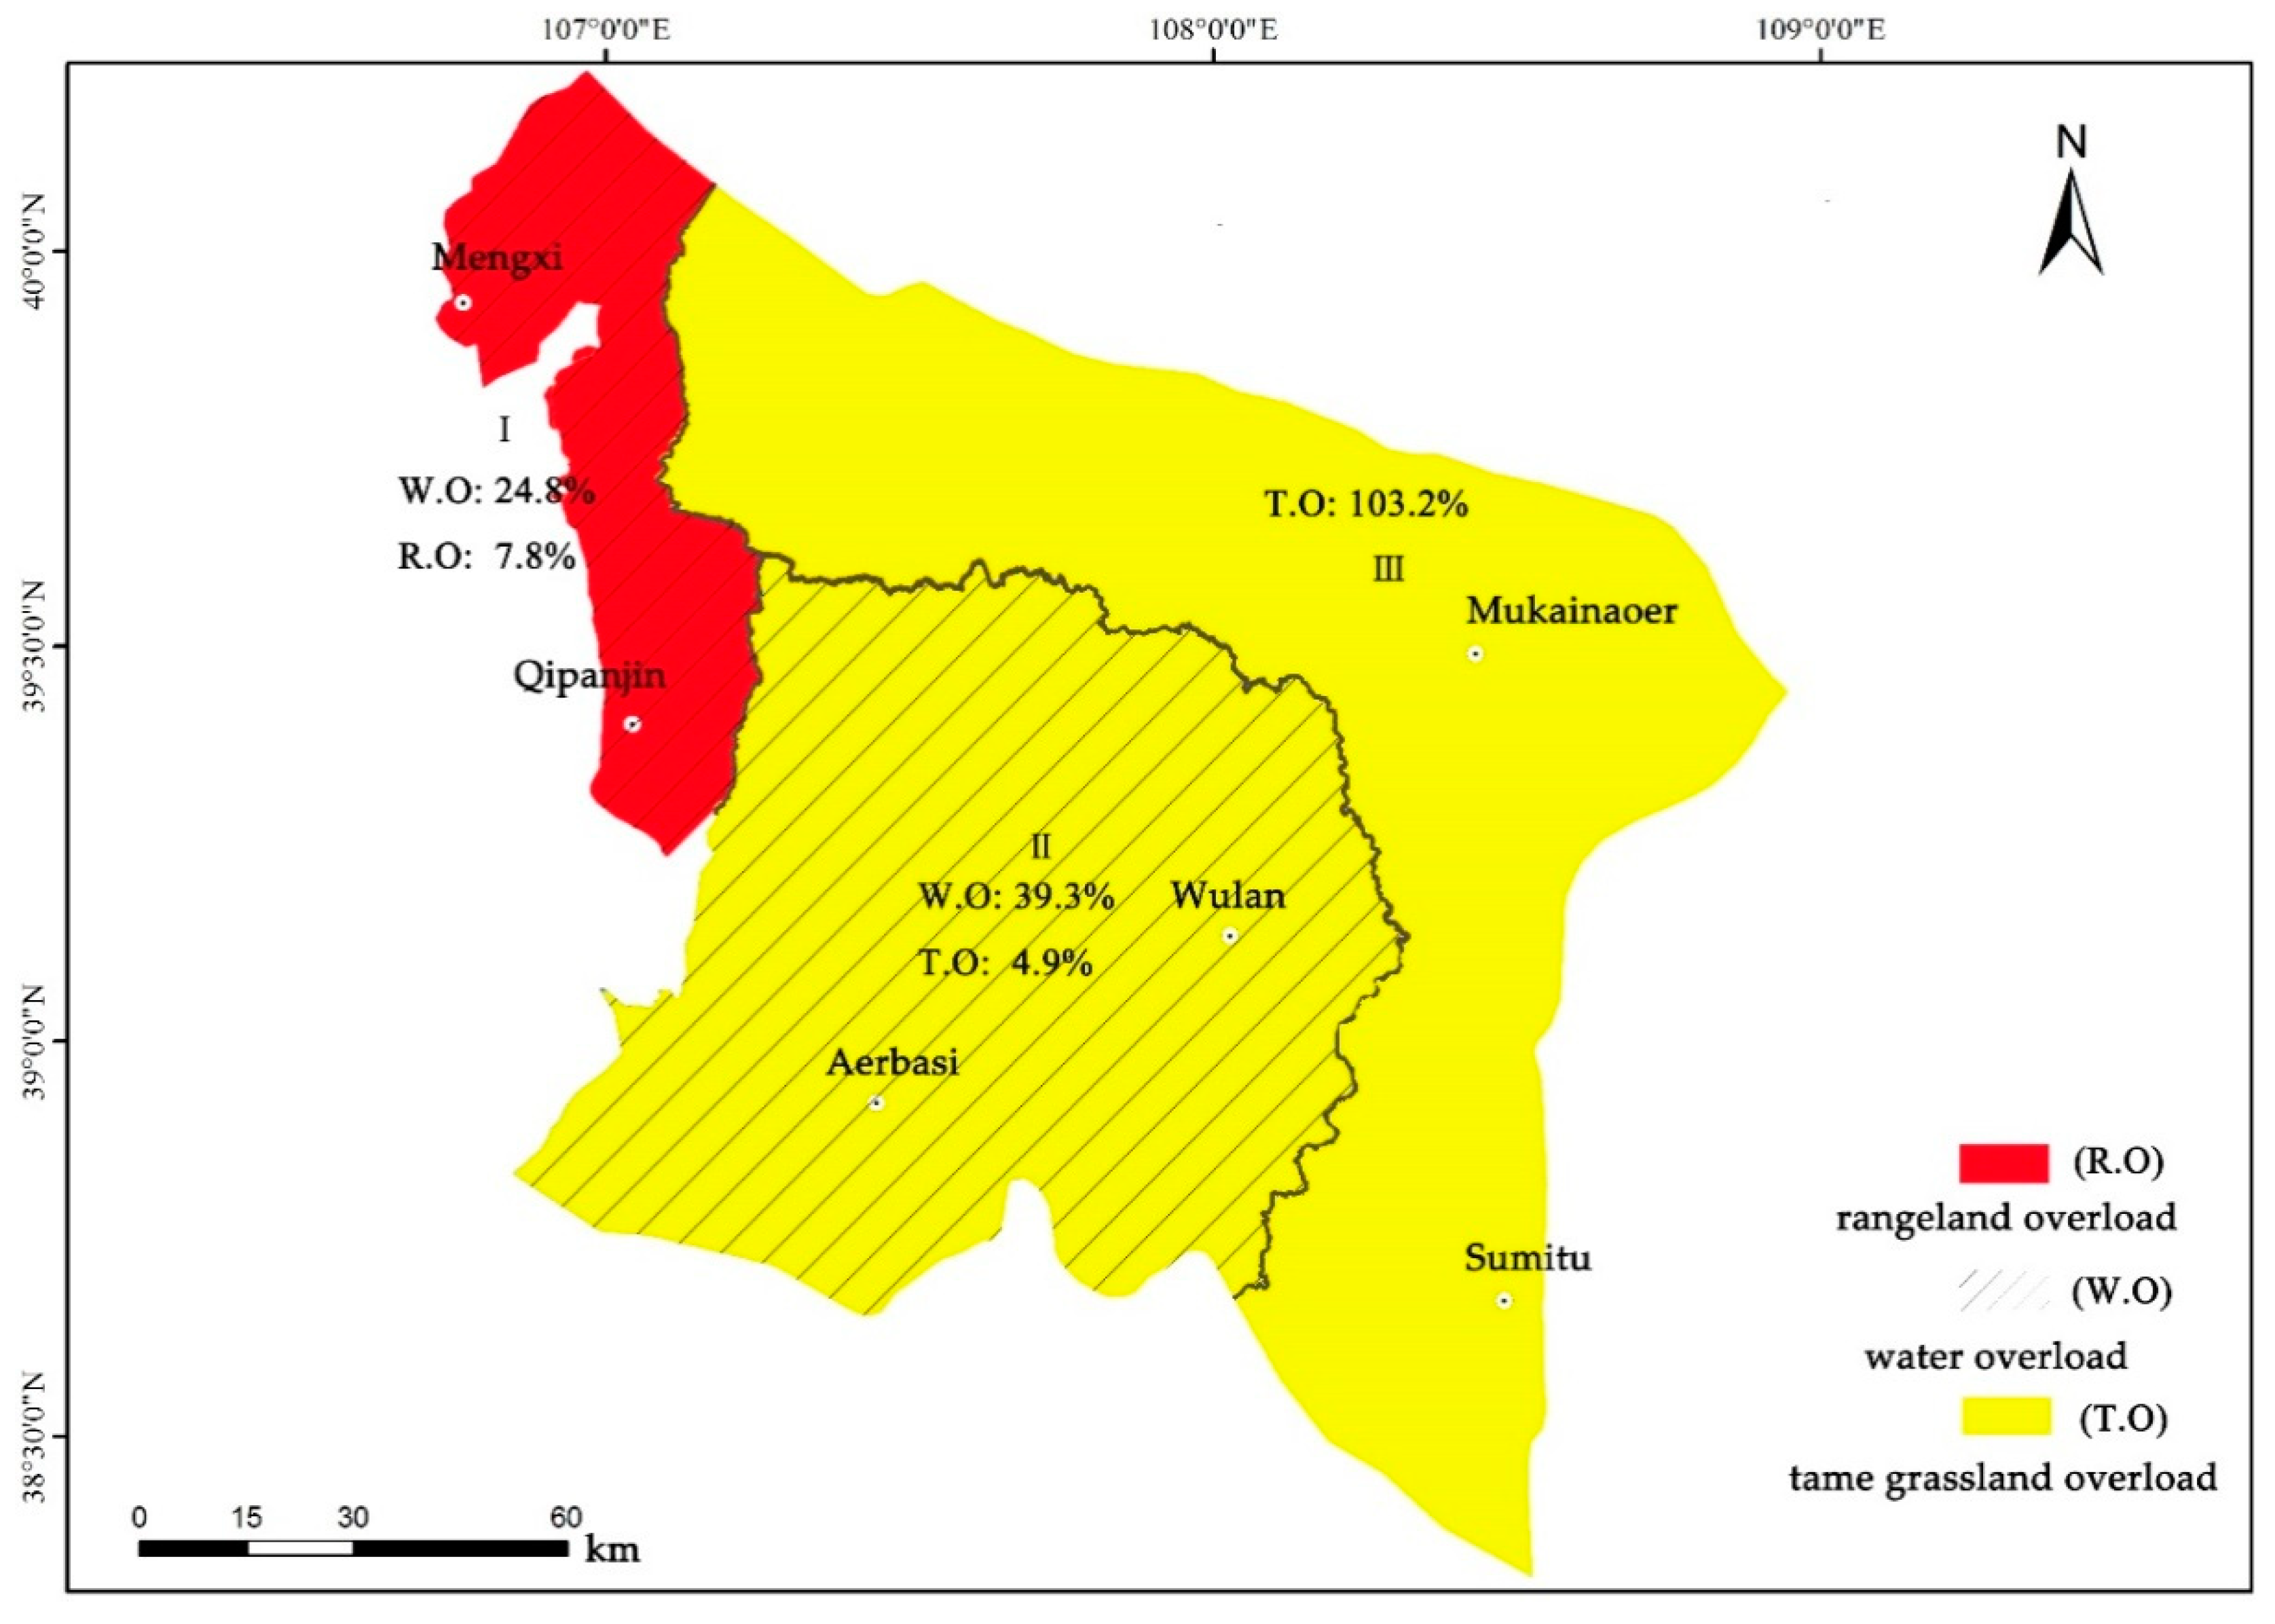
The precipitation frequency of OtogBanner was 18.5% (belongs to wet year) in 2016 and the results of the stocking capacity balance is shown in Table 6 and Table 7, and Figure 4. There are different degrees of overloading of livestock in several pastoral areas, and the overload phenomenon was prominent. The analysis of stocking capacity balance based on the dynamic balance of forage–livestock only considered the two elements of forage and livestock, so the reason for overloading was usually assumed to be that there are more livestock and less forage, leading to the supply and demand of forage and livestock being unbalanced in pastoral areas. For the stocking capacity balance analysis based on the dynamic balance of water–forage–livestock, after considered the situation of water resources in the pastoral area, the overload situation had become more complex.
In the Zhuozi mountain zoning and Dusituhe river watershed zoning, the analysis of stocking capacity balance based on dynamic FLB showed that the main reason for the overload was the lack of forage production and the excessive number of livestock. After solving the problem of forage supply, the present overloading situation would be improved in pastoral areas. According to the analysis results of stocking capacity balance based on the dynamic WFLB, there was not only a forage demand overload, but also a water resource demand overload. It was necessary to solve the problem of water and forage resource overload at the same time to effectively improve the current situation of overloading in the two pastoral areas.
For the inland river watershed zoning, according to the analysis of the stocking capacity balance based on the dynamic WFLB, the overload rate of 103.2% was consistent with the analysis of the stocking capacity balance based on the dynamic FLB in pastoral areas, which belonged to the overloading of tame grassland demand. However, according to the analysis of theoretical LCC, the theoretical LCC of 954.5 thousand SU was larger than the current LCC of 701.1 thousand SU, which were bearable and were opposite to the results based on the dynamic FLB in the pastoral area. It could be seen that the reason for the regional overload was that the planting scale of the tame grassland was insufficient, and the regional water resources could support the additional forage and livestock scale, so after planning the appropriate planting scale of the tame grassland, the water and forage resources could improve the current situation of overloading in pastoral areas.
4. Discussion
In this study, we have shown that in the development chain of animal husbandry from water to tame grassland to livestock, the results of LCC based on the dynamic FLB ignore the overload of water resources in pastoral areas. Therefore, it is easy to lead to a series of water resource problems, which in turn affect the FLB through the “water–forage–livestock” development chain. This is consistent with the conclusion of Ellis [32] that the correlation between the balance of forage and livestock in arid pastoral areas decreases with the fluctuation of the surrounding environment (precipitation). However, the results of LCC based on the dynamic WFLB consider the impact of water resource characteristics on the balance of forage and livestock in the arid pastoral areas and show the buoyancy of a multi-equilibrium state. The result corresponds with the theory of a non-equilibrium system [33,34], which holds that the large fluctuation of primary productivity driven by precipitation causes the grassland production system to show non-equilibrium or multi-equilibrium in arid pastoral areas.
Besides this, the results of LCC based on dynamic WFLB can effectively identify the predicament of water and forage resources, and provide a more scientific basis for the development of ecological animal husbandry in pastoral areas. In the Dusituhe river watershed zoning, in which the water supply is dominated by groundwater, compared with the calculation of LCC based on dynamic FLB with a livestock overload rate of only 4.9%, the result of water resource overload calculated based on dynamic WFLB is consistent with the current situation of groundwater overexploitation in this pastoral area. Because the carrying capacity of water resources is not taken into account in the process of exploiting groundwater to develop tame grassland, the local groundwater level drops year after year and forms the groundwater over-exploitation area of the Saiwusu Grass Industry Company in OtogBanner. Thus it can be seen that it is difficult to support the stocking capacity scale of 645.5 thousand SU in the Dusituhe river watershed zoning, and the LCC of 540.6 thousand SU based on the dynamic WFLB is more reasonable.
On the other hand, although the floating LCC can effectively ensure the balance of water–forage–livestock under different water conditions, it is not conducive to the stable and effective management requirements of animal husbandry in pastoral areas. Compared with the Dusituhe river watershed zoning, the floating range of LCC of the Zhuozimountain zoning with rangeland as the key field (including theoretical LCC of the inland river watershed zoning) is larger. It can be seen that the forage yield of rangeland affected by water conditions is the main factor affecting the floating degree of LCC in arid pastoral areas. However, the floating range of LCC in the Dusituhe river watershed zoning and the current LCC of the inland river watershed zoning with tame grassland as the key field is small, which can be summarized as a failure to make full use of natural grassland. Therefore, for the current pastoral area of OtogBanner, full use of rangeland means greater fluctuation of LCC; on the contrary, underutilization of rangeland means a waste of forage resources. Therefore, given the fluctuation of theoretical LCC in pastoral areas based on dynamic WFLB, we suggest that the theoretical LCC of 1 303.7 thousand SU in normal years (50% precipitation frequency) could be taken as the goal for animal husbandry management in OtogBanner. In dry years (75% precipitation frequency), the number of livestock could be controlled from the lambing and fencing of livestock in pastoral areas.
The current situation of water, forage, and livestock resources in the pastoral areas of OtogBanner shows the overloaded of LCC, the unbalanced distribution of water, forage, and livestock resources, and the different overloading causes in each water resource region. No matter what the comparison of LCC between rangeland and tame grassland, or the overload rate of water and forage resources in the analysis of stocking capacity balance in pastoral areas, it can be seen that each district in pastoral areas has its advantages and disadvantages relating to water and forage resources. However, the current production model of animal husbandry in pastoral areas is difficult to make use of and the resource advantages of each pastoral area to reasonably avoid the shortage of resources, can cause a situation of resource overload and unloading to coexist, and this is the main problem in the pastoral areas of China at present [35,36]. Different to the simple analysis of more and less forage based on the analysis of dynamic FLB, the LCC analysis based on dynamic WFLB can effectively analyze the relationship and constraints between water, forage, and livestock, which is more conducive for managers to clearly understand the factors limiting the development of LCC, and to provide a scientific basis for pastoral area managers to solve the contradiction of water, forage, and livestock resources and the optimal allocation of water, forage, and livestock resources in pastoral areas.
5. Conclusions
This study constructed an LCC research model based on the WFLB. Through the analysis and comparison with the model of dynamic FLB, this model can simulate the multi-equilibrium state of LCC from 0.9155 million SU to 1.632 million SU in arid pastoral areas of OtogBanner with the fluctuation of precipitation frequency, and the corresponding development scale of tame grassland is 22.4 thousand hm2 to 26.5 thousand hm2. The current stick rate of 1.5395 million SU is higher than the current LCC of1.0225 million SU, which belongs to livestock overload, and we recommend 1.3037 million SU under 25.9 thousand hm2 tame grassland developing areas as the LCC in the pastoral area of OtogBanner. Rational allocation of water, forage, and livestock resources is an important measure to improve LCC in pastoral areas. This study can provide scientific support for grassland fine management in the arid pastoral area of OtogBanner.
Author Contributions
Conceptualization, L.Q. and X.S.; methodology, L.Q.; software, X.L.; investigation, L.Q., W.W. and X.L.; data curation, L.Q. and W.W.; writing—original draft preparation, L.Q.; writing—review and editing, L.Q. and X.S.; visualization, L.Q.; supervision, X.L.; project administration, H.L.; funding acquisition, X.S. All authors have read and agreed to the published version of the manuscript.
Funding
This work was supported by the National key R & D project (grant number 2016YFC0400301).
Acknowledgments
We thank the OtogBanner Water Affairs Bureau, Gansu Institute of Water Resources and Hydropower Research, and Beijing Forestry University for their assistance in collecting basic data in OtogBanner.
Conflicts of Interest
The authors declare no conflict of interest.
References
- Zhang, J.P.; Zhang, L.B.; Liu, W.L.; Qi, Y.; Wo, X. Livestock-carrying capacity and overgrazing status of alpine grassland in the Three-River Headwaters region, China. J. Geogr. Sci. 2014, 24, 303–312. [Google Scholar] [CrossRef]
- Zhang, J.; Zhang, L.; Liu, X.; Qiao, Q. Research on Sustainable Development in an Alpine Pastoral Area Based on Equilibrium Analysis Between the Grassland Yield, Livestock Carrying Capacity, and Animal Husbandry Population. Sustainability 2019, 11, 4659. [Google Scholar] [CrossRef] [Green Version]
- Papanastasis, V.P. Restoration of Degraded Grazing Lands through Grazing Management: Can It Work? Restor. Ecol. 2009, 17, 441–445. [Google Scholar] [CrossRef]
- Nandintsetseg, B.; Shinoda, M.; Erdenetsetseg, B. Contributions of multiple climate hazards and overgrazing to the 2009/2010 winter disaster in Mongolia. Nat. Hazards 2018, 92, 109–126. [Google Scholar] [CrossRef]
- Briske, D.D.; Zhao, M.L.; Han, G.D.; Xiu, C.B.; Kemp, D.R.; Willms, W.; Havstad, K.; Kang, L.; Wang, Z.W.; Wu, J.G.; et al. Strategies to alleviate poverty and grassland degradation in Inner Mongolia: Intensification vs. production efficiency of livestock systems. J. Environ. Manag. 2015, 152, 177–182. [Google Scholar] [CrossRef]
- Hu, Z.; Zhao, Z.; Zhang, Y.; Jing, H.; Gao, S.; Fang, J. Does “Forage-Livestock Balance” policy impact ecological efficiency of grasslands in China? J. Clean. Prod. 2019, 207, 343–349. [Google Scholar] [CrossRef]
- Cao, Y.N.; Wu, J.S.; Zhang, X.Z.; Niu, B.; Li, M.; Zhang, Y.J.; Wang, X.T.; Wang, Z.P. Dynamic forage-livestock balance analysis in alpine grasslands on the Northern Tibetan Plateau. J. Environ. Manag. 2019, 238, 352–359. [Google Scholar] [CrossRef]
- Fang, J.; Bai, Y.; Li, L.; Jiang, G.; Huang, J.; Huang, Z.; Zhang, W.; Gao, S. Scientific basis and practical ways for sustainable development of Chinas pasture regions. Chin. Sci. Bull. 2016, 61, 155–164. [Google Scholar]
- Tian, Y.H.; Liu, Y.Q.; Jin, J.J. Effect of Irrigation Schemes on Forage Yield, Water Use Efficiency, and Nutrients in Artificial Grassland under Arid Conditions. Sustainability 2017, 9, 2035. [Google Scholar] [CrossRef] [Green Version]
- Lu, H.; Li, H.; Wang, J.; Zheng, H.; Cao, X.; Tong, C. Optimal water and land resource allocation in pastoral areas based on a water-land forage-livestock balance: A case study of Otog Front Banner, Inner Mongolia, China. Environ. Sci. Pollut. Res. 2020, 27, 10328–10341. [Google Scholar] [CrossRef]
- Chen, Y.N.; Li, B.F.; Li, Z.; Li, W.H. Water resource formation and conversion and water security in arid region of Northwest China. J. Geogr. Sci. 2016, 26, 939–952. [Google Scholar] [CrossRef] [Green Version]
- Xu, M. A review of grassland carrying capacity: Perspective and dilemma for research in China on “forage-livestock balance”. Acta Prataculturae Sin. 2014, 23, 321–329. [Google Scholar]
- Gu, X.Y.; Jia, Z.R.; Yang, Y.Y.; Wu, D.S.; Li, J.P. Research on Dynamic Rotational Grazing Assignment Model based on Grass Resource Leveling. In Proceedings of the 7th International Conference on Information Technology and Quantitative Management, Granada, Spain, 5–6 November 2019; HerreraViedma, E., Shi, Y., Berg, D., Tien, J., Cabrerizo, F.J., Li, J., Eds.; Elsevier Science Bv: Amsterdam, The Netherlands, 2019; Volume 162, pp. 696–703. [Google Scholar]
- Ebong, G.A.; Ettesam, E.S.; Dan, E.U. Impact of Abattoir Wastes on Trace Metal Accumulation, Speciation, and Human Health–Related Problems in Soils within Southern Nigeria. Air Soil Water Res. 2020, 13. [Google Scholar] [CrossRef] [Green Version]
- Meshesha, D.T.; Moahmmed, M.; Yosuf, D. Estimating carrying capacity and stocking rates of rangelands in Harshin District, Eastern Somali Region, Ethiopia. Ecol. Evol. 2019, 9, 13309–13319. [Google Scholar] [CrossRef] [PubMed] [Green Version]
- Lohmann, D.; Tietjen, B.; Blaum, N.; Joubert, D.F.; Jeltsch, F. Shifting thresholds and changing degradation patterns: Climate change effects on the simulated long-term response of a semi-arid savanna to grazing. J. Appl. Ecol. 2012, 49, 814–823. [Google Scholar] [CrossRef]
- Derry, J.F.; Boone, R.B. Grazing systems are a result of equilibrium and non-equilibrium dynamics. J. Arid. Environ. 2010, 74, 307–309. [Google Scholar] [CrossRef]
- Godde, C.; Dizyee, K.; Ash, A.; Thornton, P.; Sloat, L.; Roura, E.; Henderson, B.; Herrero, M. Climate change and variability impacts on grazing herds: Insights from a system dynamics approach for semi-arid Australian rangelands. Glob. Chang. Biol. 2019, 25, 3091–3109. [Google Scholar] [CrossRef] [Green Version]
- Zhang, R.R.; Li, Z.H.; Yuan, Y.W.; Li, Z.H.; Yin, F. Analyses on the Changes of Grazing Capacity in the Three-River Headwaters Region of China under Various Climate Change Scenarios. Adv. Meteorol. 2013, 2013, 951261. [Google Scholar] [CrossRef] [Green Version]
- Bai, Y.; Yu, Z.; Yang, Q.; Wan, H.; Huang, J.; Ji, B.; Li, A. Mechanisms regulating the productivity and stability of artificial grasslands in China: Issues, progress, and prospects. Chin. Sci. Bull. 2018, 63, 511–520. [Google Scholar]
- Wang, H.; Tian, Y.; Huang, W.; Xiao, S. Analyzing the impact of irrigation quantity on biomass and water use efficiency of main grasses in artificial grassland in Inner Mongolia. Acta Ecol. Sin. 2015, 35, 3225–3232. [Google Scholar]
- Villarruel-Sahagun, L.; Troyo-Dieguez, E.; Gutierrez-Ruacho, O.G.; Nieto-Garibay, A.; Esqueda, M.; Ffolliot, P.; Murillo-Amador, B.; Solis-Garza, G. Hydro-environmental assesment and grazing capacity valoration by thermo-pluviometrics indicators. Rev. Mex. Cienc. Pecu. 2014, 5, 143–156. [Google Scholar] [CrossRef] [Green Version]
- Zheng, C.; Halik, U.; Xinhua, G.O.U.; Shuzheng, L.U.O. Environmental Problems Caused by Excessive Exploitation of Groundwater at Chaiwopu Source in Xinjiang. Res. Soil Water Conserv. 2008, 15, 132–135. [Google Scholar]
- Xu, D.P.; Liu, Y.H.; Li, T.S.; Wu, P.; Chen, Y.S.; Runa, A. Pattern of agricultural and pastoral development under water resource constraints in semi-arid areas: A case study of Tongliao, Inner Mongolia. In Proceedings of the 4th International Conference on Water Resource and Environment, Kaohsiung City, Taiwan, 17–21 July 2018; Li, P., Ed.; Iop Publishing Ltd.: Bristol, UK, 2018; Volume 191. [Google Scholar]
- Peukert, S.; Griffith, B.A.; Murray, P.J.; Macleod, C.J.A.; Brazier, R.E. Intensive Management in Grasslands Causes Diffuse Water Pollution at the Farm Scale. J. Environ. Qual. 2014, 43, 2009–2023. [Google Scholar] [CrossRef] [PubMed] [Green Version]
- Liu, X.F.; Wang, S.X.; Zhou, Y.; Wang, F.T.; Li, W.J.; Liu, W.L. Regionalization and Spatiotemporal Variation of Drought in China Based on Standardized Precipitation Evapotranspiration Index (1961–2013). Adv. Meteorol. 2015, 2015, 950262. [Google Scholar] [CrossRef] [Green Version]
- Godde, C.M.; Garnett, T.; Thornton, P.K.; Ash, A.J.; Herrero, M. Grazing systems expansion and intensification: Drivers, dynamics, and trade-offs. Glob. Food Secur.-Agric.Policy 2018, 16, 93–105. [Google Scholar] [CrossRef]
- Dong, S.; Yang, M.; Ren, J.; Shang, Z.; Zhao, X.; Dong, Q.; Liu, W.; Renqin, D.Z.; Dou, S.; Zhou, X.; et al. Sustainable grassland management based on grazing system unit: Concepts and models. Pratacultural Sci. 2020, 37, 403–412. [Google Scholar]
- Qin, L.; Song, X.; Feng, X. Forage-livestock dynamic balance of pasturing area based on rotational grazing theory in northern slope of Qilian Mountains. Trans. Chin. Soc. Agric. Eng. 2019, 35, 256–264. [Google Scholar]
- Chen, Q. Key pasture, seasonal grazing and sustainable development of grassland animal husbandry production in China. Acta Pratacult. Sin. 2005, 14, 29–34. [Google Scholar]
- Habuer; Chang, J.; Xi, L. League grassland production monitoring results analysis-take sunitezuo banner as the example. J. Inn. Mong. Agric. Univ. 2018, 39, 37–43. [Google Scholar]
- Swift, E.D.M. Stability of African Pastoral Ecosystems: Alternate Paradigms and Implications for Development. J. Range Manag. 1988, 41, 450–459. [Google Scholar]
- Vetter, S. Rangelands at equilibrium and non-equilibrium: Recent developments in the debate. J. Arid. Environ. 2005, 62, 321–341. [Google Scholar] [CrossRef]
- Quaas, M.F.; Baumgartner, S. Optimal grazing management rules in semi-arid rangelands with uncertain rainfall. Nat. Resour. Model. 2012, 25, 364–387. [Google Scholar] [CrossRef] [Green Version]
- Zhang, Z.; Liu, X. Contrastive Analysis of Optimum Utilization of Grassland Resources in Xinyuan County. Xinjiang Agric. Sci. 2015, 52, 366–370. [Google Scholar]
- Hou, X. Priority Approaches, Techniques and Models to Sustainably Tap the Grassland Productivity Potential. Sci. Agric. Sin. 2016, 49, 3229–3238. [Google Scholar]
Figure 1.
(a) Location of study area and division of water resource regionalization; (b) The rangeland in pastoral area of OtogBanner; (c) The grazing behavior in pastoral area of OtogBanner.
Figure 1.
(a) Location of study area and division of water resource regionalization; (b) The rangeland in pastoral area of OtogBanner; (c) The grazing behavior in pastoral area of OtogBanner.

Figure 2.
Schematic diagram of the water, forage, and livestock balance system.

Figure 3.
The comparison of LCC with two balance models.

Figure 4.
The water and forage resource overload situation based on the dynamic WFLB model in OtogBanner.
Figure 4.
The water and forage resource overload situation based on the dynamic WFLB model in OtogBanner.


Table 1.
The results of the currently available water supply in OtogBanner (106 m3).
| Water Resource Regionalization | Available Surface Water | Available Ground Water | Available Reclaimed Water | Available Water Supply | ||||
|---|---|---|---|---|---|---|---|---|
| 25% | 50% | 75% | 25% | 50% | 75% | |||
| I | 60.004 | 59.950 | 59.904 | 11.410 | 14.753 | 86.167 | 86.113 | 86.068 |
| II | 11.271 | 9.229 | 7.503 | 40.468 | 1.924 | 53.663 | 51.620 | 49.894 |
| III | 1.054 | 0.863 | 0.702 | 70.080 | 0.0 | 71.134 | 70.943 | 70.782 |
| OtogBanner | 72.329 | 70.042 | 68.109 | 121.958 | 16.677 | 210.964 | 208.677 | 206.744 |
Table 2.
Statistics on grazing grassland in OtogBanner (103 hm2).
| Water Resources Regionalization | Rangeland | Tame Grassland | |||||
|---|---|---|---|---|---|---|---|
| Temperate Steppe Type | Temperate Desert Steppe Type | Temperate Steppe Desert Type | Temperate Desert Type | Azonal Lowland MeadowType | Corn | Alfalfa | |
| I | 0.0 | 38.4 | 30.3 | 3.7 | 1.8 | 4.5 | 1.4 |
| II | 2.1 | 492.8 | 48.8 | 3.8 | 26.0 | 8.8 | 4.6 |
| III | 10.1 | 391.9 | 48.7 | 2.7 | 26.5 | 5.0 | 0.7 |
| OtogBanner | 12.2 | 923.1 | 127.8 | 10.2 | 54.4 | 18.4 | 6.7 |
Table 3.
The productivity of rangeland in OtogBanner.
| Type of Rangeland | Productivity in the Warm Season (kg/hm2) | Productivity in the Cold Season (kg/hm2) | Utilization Rate of Rangeland |
|---|---|---|---|
| Temperate steppe type | 475.88 | 285.56 | 0.80 |
| Temperate desert-steppe type | 440.00 | 263.96 | 0.72 |
| Temperate steppe desert type | 400.08 | 240.00 | 0.64 |
| Temperate desert type | 327.05 | 196.07 | 0.56 |
| Azonal lowland meadow type | 436.52 | 283.79 | 0.99 |
Table 4.
LCC based on the Dynamic FLB in OtogBanner.
| Water Resources Regionalization | LCCbased on the Dynamic FLB Model (103 SU) | ||
|---|---|---|---|
| Rangeland Utilization Period | Tame Grassland Utilization Period | Theoretical Value | |
| I | 99.2 | 321.6 | 99.2 |
| II | 842.1 | 645.5 | 645.5 |
| III | 708.1 | 345.0 | 345.0 |
| OtogBanner | 1649.4 | 1312.1 | 1089.8 |
Table 5.
LCC based on the Dynamic WFLB in OtogBanner.
| Water Resources Regionalization | LCC Based on the Dynamic WFLBmodel | |||
|---|---|---|---|---|
| Precipitation Frequency (%) | Developing Area of Tame Grassland (103 hm2) | Theoretical Livestock Carrying Capacity (103 SU) | Current Livestock Carrying Capacity (103 SU) | |
| I | 25 | 4.2 | 136.9 | 136.9 |
| 50 | 3.7 | 99.2 | 99.2 | |
| 75 | 3.1 | 57.5 | 57.5 | |
| II | 25 | 8.1 | 540.6 | 540.6 |
| 50 | 7.4 | 496.3 | 496.3 | |
| 75 | 6.7 | 447.2 | 447.2 | |
| III | 25 | 14.2 | 954.5 | 345.0 |
| 50 | 14.7 | 708.2 | 345.0 | |
| 75 | 12.6 | 410.9 | 345.0 | |
| OtogBanner | 25 | 26.5 | 1632.0 | 1022.5 |
| 50 | 25.9 | 1303.7 | 940.5 | |
| 75 | 22.4 | 915.5 | 849.7 | |
Table 6.
Analysis of stocking capacity balance based on dynamic FLB.
| Water Resource Regionalization | Stocking Rate (103 SU) | Theoretical LCC (103 SU) | Overload Rate (%) |
|---|---|---|---|
| I | 161.1 | 99.2 | 62.4 |
| II | 677.3 | 645.5 | 4.9 |
| III | 701.1 | 345.0 | 103.2 |
| OtogBanner | 1539.5 | 1089.8 | 41.3 |
Table 7.
Analysis of stocking capacity balance based on dynamic WFLB.
| Water Resources Regionalization | Stocking Rate 103 SU) | Current LCC (103 SU) | Overload Rate of Livestock (%) | Overload Rate of Water Resource (%) | Overload Rate of Rangeland (%) | Overload Rate of Tame Grassland (%) |
|---|---|---|---|---|---|---|
| I | 161.1 | 136.9 | 17.7 | 24.8 | 7.6 | −49.9 |
| II | 677.3 | 540.6 | 25.3 | 39.3 | −46.7 | 4.9 |
| III | 701.1 | 345.0 | 103.2 | −60.7 | −34.4 | 103.2 |
| OtogBanner | 1539.5 | 1022.5 | 50.6 | −16.8 | −38.2 | 17.3 |
© 2020 by the authors. Licensee MDPI, Basel, Switzerland. This article is an open access article distributed under the terms and conditions of the Creative Commons Attribution (CC BY) license (http://creativecommons.org/licenses/by/4.0/).
Share and Cite
MDPI and ACS Style
Qin, L.; Song, X.; Wen, W.; Liu, X.; Liu, H. Research on Livestock Carrying Capacity of Arid Pastoral Areas Based on Dynamic Water–Forage–Livestock Balance in OtogBanner, China. Water 2020, 12, 2539. https://doi.org/10.3390/w12092539
AMA Style
Qin L, Song X, Wen W, Liu X, Liu H. Research on Livestock Carrying Capacity of Arid Pastoral Areas Based on Dynamic Water–Forage–Livestock Balance in OtogBanner, China. Water. 2020; 12(9):2539. https://doi.org/10.3390/w12092539
Chicago/Turabian StyleQin, Lin, Xiaoyu Song, Wang Wen, Xiaodi Liu, and Hui Liu. 2020. "Research on Livestock Carrying Capacity of Arid Pastoral Areas Based on Dynamic Water–Forage–Livestock Balance in OtogBanner, China" Water 12, no. 9: 2539. https://doi.org/10.3390/w12092539
Note that from the first issue of 2016, this journal uses article numbers instead of page numbers. See further details here.