Real-Time Estimation of Disinfection By-Products through Differential UV Absorbance


1
Department of Civil Engineering, University of Ottawa, Ottawa, ON K1N 6N5, Canada
2
Department of Civil Engineering, University of Victoria, Victoria, BC V8P 5C2, Canada
*
Author to whom correspondence should be addressed.
Water 2020, 12(9), 2536; https://doi.org/10.3390/w12092536
Submission received: 21 August 2020
/
Revised: 7 September 2020
/
Accepted: 9 September 2020
/
Published: 11 September 2020
Abstract
:Efforts to control of unwanted disinfection by-products (DBPs) can be hindered by the relatively low-frequency data that is generated from DBP monitoring for regulatory purposes. Differential UV absorbance (DUVA) has the potential to overcome some of these difficulties as a relatively simple and low-cost technique for the estimation of regulated DBPs (i.e., trihalomethanes, THMs, and haloacetic acids, HAAs). DUVA is based on the principle that differences in UV absorbance at specific wavelengths before and after chlorination can be correlated to DBP occurrence. This project sought to assess a lab-based protocol for the determination of a site-specific linear calibration curve for in situ real-time estimations of DBPs from DUVA measurement in water treatment plants (WTPs). A field spectrophotometer probe capable of high frequency scans within the UV light wavelength spectra with light paths of 100 mm was used. Models were developed to estimate DBP levels, at a scale representative of DUVA and DBP levels that actually occur in the WTP under study. Results showed that level of uncertainty on DBP levels estimation is relatively low (23% for HAAs and 32% for THMs). Although DBP estimations through DUVA are not of regulatory value, they can be used for real-time estimation of DBP levels to better inform operational decision making in water treatment plants and management of DBPs in distribution systems.
1. Introduction
Disinfection process, mainly with chlorine, to prevent microbiological contamination of water can lead to the formation of hazardous disinfection by-products (DBPs) due to the reaction of chlorine with natural organic matter (NOM) present in the water [1]. DBPs is a large family of organic compounds, more than 700 DBPs have been detected [2,3]. Beyond specific health based thresholds, DBPs can represent a public health issue due to the potential chronic risk of adverse effects on human health (e.g., cancer, reproductive and developmental effects) and the high prevalence of exposure [4,5,6]. Thus, DBPs constitute an important concern for water systems, especially systems supplied by surface waters. In fact, source water generally presents a level higher of NOM than groundwater [4,7]. Trihalomethanes (THMs) and haloacetic acids (HAAs) are the most commonly observed chlorinated DBPs in drinking water [2,8,9]. Their occurrence is regulated in several countries, including USA and Canada. In the United States, USEPA established THMs and HAAs guidelines at 80 µg/L and 60 µg/L respectively [10]. Health Canada proposes a guideline of 100 µg/L for THMs and 80 µg/L for HAAs [11,12]. However, these levels do not represent mandatory standards. In Canada, drinking water regulations fall under provincial jurisdiction. For example, the Province of Quebec has established a standard of 80 μg/L for THMs and 60 μg/L for HAAs [13] and the Province of Ontario has established a standard of 100 μg/L for THMs and 80 μg/L for HAAs [14].
Such regulations are typically based on yearly averages of quarterly measurements. The complexity of their analyses most often requires outsourcing to specialized laboratories at relatively high cost. This ultimately limits access to valuable information on DBP occurrence to regulatory quarterly samplings. UV absorbance (UVA) is a commonly accepted surrogate for organic compounds in water with methods using UVA at a specific wavelength (e.g., 254 nm) or with the entire UV-Visible spectrum (200–750 nm) [15,16,17]. There are specific sites in NOM that absorb UV light, such as aromatic functional groups, dominant chromophores in NOM. These sites are also the main sites of attack by chlorine on NOM molecules. Thus, the chlorination reaction with NOM occurs primarily at sites that absorb UV light [18]. It has been reported that simple and reliable relationships exist between change in UV absorbance of NOM and formation of DBPs during the chlorination process [19,20,21,22,23]. Recently, a technique known as differential UV absorbance (DUVA) has been developed that could provide a sensitive and highly specific indicator for DBP formation resulting from chlorination [19,20,22,23,24]. This approach is based on the principle that differences in UVA at specific wavelengths (e.g., 272 nm) before and after chlorination can be correlated to certain species of DBPs [20,25]. DUVA has been shown to be an effective, simple, fast, and relatively low-cost spectrophotometric method for DBP monitoring, especially THMs and HAAs [26,27].
DUVA could be a useful tool for municipalities to manage and estimate DBP levels at the water treatment plant (WTP) [23,28]. The development of field instrumentation capable of high frequency UVA measurements opens the possibility for in situ real-time estimation, monitoring and control of DBPs in WTPs through DUVA [29]. The possibility of real-time DBP control can be a step change for both large and small municipalities considering the current modus operandi that relies on the infrequent and expensive DBP analyses carried out mainly for regulatory purposes. However, DBP/DUVA relationships are site-specific [20,22,23,24,30,31]. The objective of this study was to assess a lab-based protocol for the determination of site-specific calibrations for in situ real-time estimations of DBPs by DUVA.
2. Materials and Methods
2.1. Experimental Approach
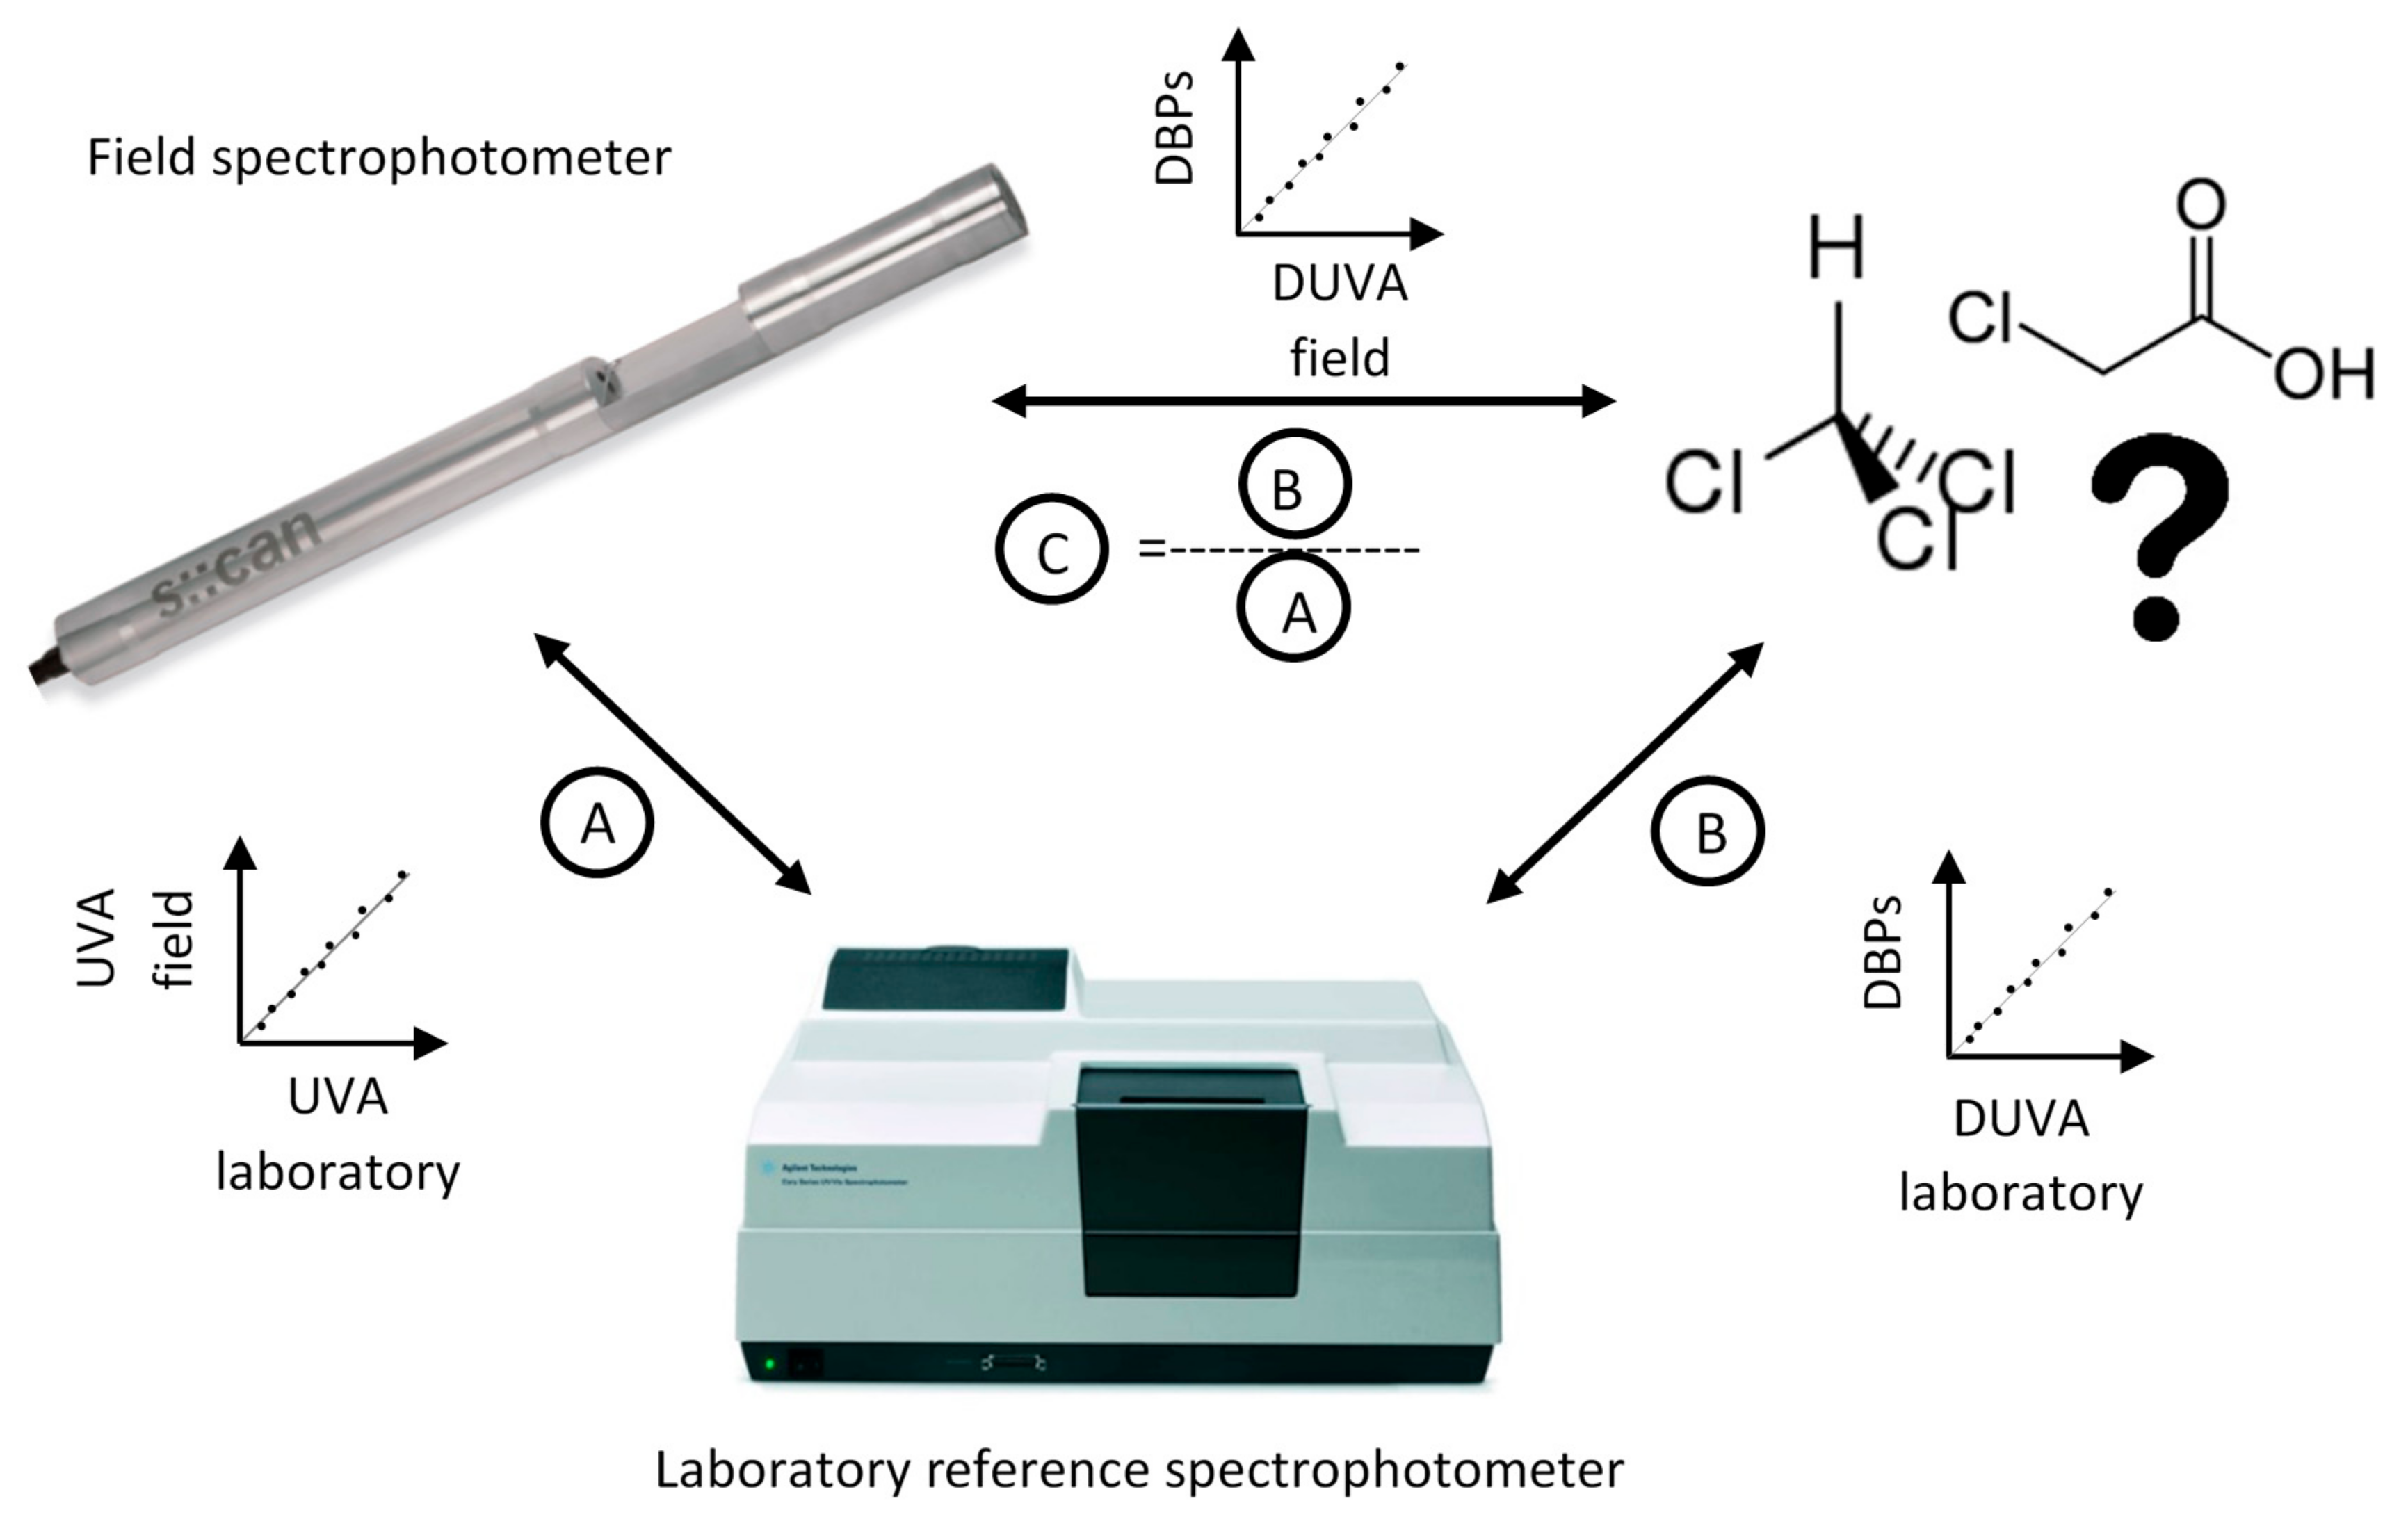
The overall approach for real-time estimation of DBPs is summarized in Figure 1. Real-time estimation of DBPs was made with field spectrophotometric probes, located at different stages of a treatment chain in a WTP. Field instruments measured real-time UVA before and after disinfection, providing real-time DUVA measurements (see Section 2.2. Field). In order to elaborate models to estimate DBP levels from DUVA measurements on the field, we passed through laboratory instrumentation to validate the field measurements and develop the calibration curves between DUVA and DBPs (THMs and HAAs). Validation and calibration were made on water sampled from the WTP where the field instrument is located, and then chlorinated in controlled conditions in laboratory at Université Laval (see Section 2.3. Laboratory). Validation of DUVA measurements between field and laboratory instrumentation was made at the predetermined wavelength 272 nm, corresponding to coefficient A (Figure 1). Linear correlations between DBP levels and differential UVA measurements in controlled laboratory conditions were subsequently determined at the same wavelength, corresponding to coefficient B (Figure 1). To develop the calibration curve to estimate DBP levels through DUVA measurement with the field instrument, we corrected linear correlations developed in laboratory (coefficient B) with correlations between the reference and the field spectrophotometers (coefficient A). Uncertainty of models were calculated as follow by the relative error (%) = (DBPs_level_measured − DBPs_level_estimated) × 100/DBPs_level_measured.
2.2. Field
2.2.1. Study Area
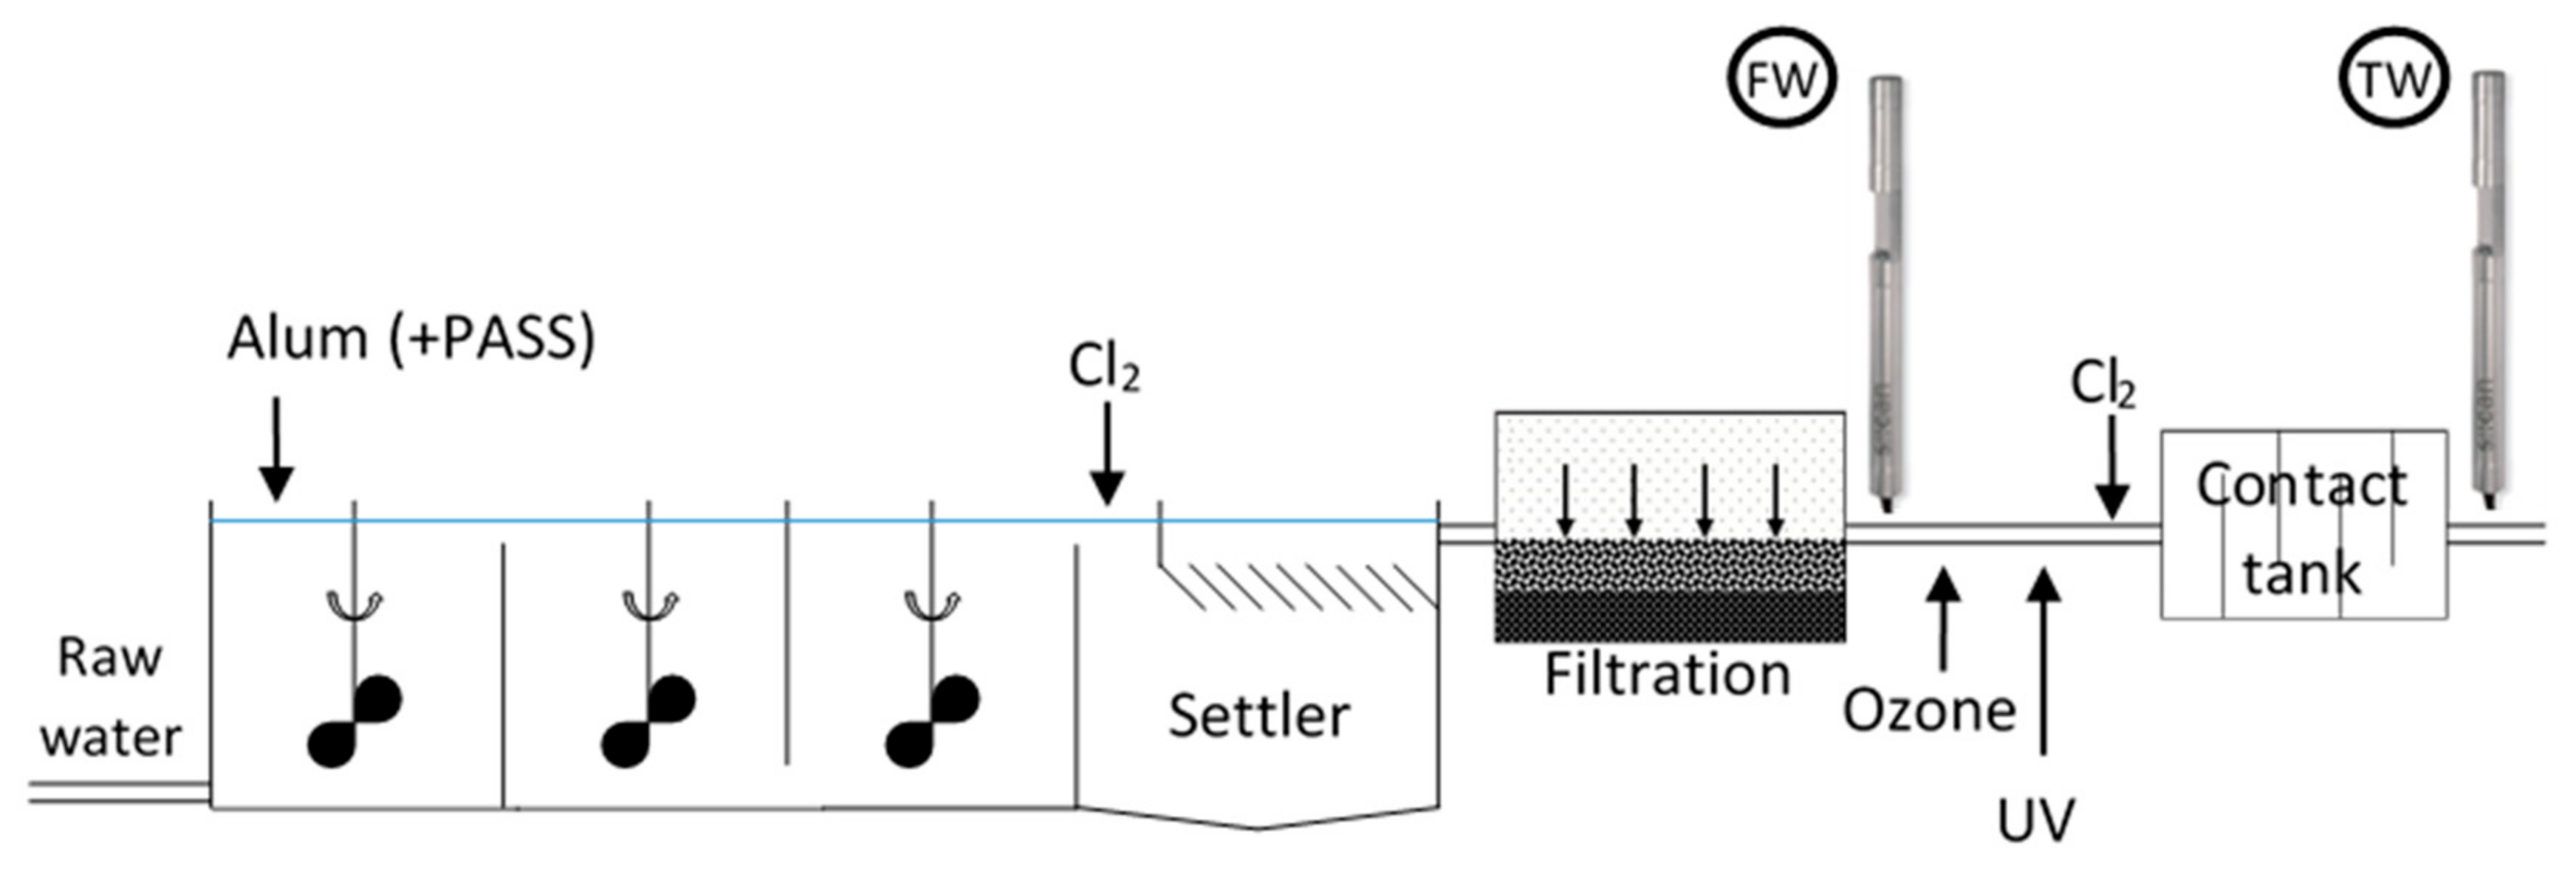
Field instrumentation was installed in a WTP in the Québec City (Canada) area. The WTP under study uses the water treatment process including coagulation, flocculation, intermediate chlorination, ballasted sedimentation, sand filtration, ozonation, UV treatment, and a final chlorination (Figure 2). The WTP is supplied by a river that is influenced by high weather variability in Québec from cold and snowy winters to hot summers interspaced with snowmelt in spring and rains in autumn.
2.2.2. Field Instrumentation
Two spectro::lyser (s::can, Austria) spectrophotometer probes with 100 mm optical paths were used. The probes are capable of real-time measurements of UV absorption spectra (from 220 to 400 nm) via a by-pass flow cell setup. Spectrophotometer analysis parameters data are accessible via the con::cube controller and datalogger, equipped with the moni::tool software [32]. The first probe was installed after filtration immediately before chlorination (FW), and the second was located just after chlorination (TW) (Figure 2). Initially, the first probe was installed immediately before intermediate chlorination (after flocculation) to also consider its contribution to any UVA (and DBP) variations. However, the presence of flocs in suspension could not be adequately removed by the instrument’s self-cleaning protocol thereby disrupting UVA measurements. Consequently, the instrument was moved just after the filters in order to avoid flocs. Also, the field instrument in TW was installed after chlorination and just before lime adding. In fact, the instrument would have been affected by the lime precipitates there by affecting UVA measurements if installed after lime addition.
2.2.3. Sampling Campaign
In addition to field equipment, a daily sampling campaign was organised in the WTP between June and August 2016. Several parameters were measured in water samples to monitor water quality (Section 2.3.3—water quality analysis). Three types of waters were sampled in the WTP: Raw water (RW), filtered water (FW), and treated water (TW), once per week. Water samples were transported in coolers, in less than 2 h, to the laboratory and then stored at 4 °C before analysis and chlorination experiments. Temperature, free and total chlorine were measured on site during sampling, at the WTP. Temperature was measured with an analogic thermometer. Chlorine was measured on the field using portable colorimeter DR890 from HACH (USA) with a detection limit of 0.02 mg/L.
2.3. Laboratory
All laboratory measurement and analyses were performed in the laboratory of the NSERC Industrial Research Chair in Management and Surveillance of Drinking Water Quality from the Watershed to the Citizen’s Tap in Université Laval, Québec, QC, Canada.
2.3.1. Laboratory Reference Spectrophotometer
A Cary-100 (Agilent Technologies, USA) UV-Vis spectrophotometer was used as a reference to validate UVA field measurements and calibrate DBP estimations. Cobalt (II) chloride and potassium hexachloroplatinate (IV) solutions were used as primary UVA standards at 254 nm. The UVA spectra of the samples between wavelengths of 200 and 400 nm were obtained using a quartz cells with optical paths of 1 or 5 cm for RW and 10 cm for FW. Quantification limits were 0.007 cm−1 at 254 nm and 0.019 cm−1 at 272 nm. DUVA was calculated from measurement of UVA at 272 nm, as per previous studies [22,27], before and after chlorination. Blanks and baseline samples consisted of nanofiltered demineralized water.
2.3.2. Water Chlorination
Correlations between DUVA and DBPs were measured in controlled laboratory conditions (pH, temperature, chemical dosing, and contact time) from water sampled during the sampling campaign subsequently chlorinated in the laboratory.
RW samples were treated in the laboratory in different conditions (coagulant and chlorine doses) using a jar-tester with 1 L beakers (Kemira Flocculator 2000) in triplicate. The coagulant used throughout this study was aluminum sulfate, Al2(SO4)3 ∙18H2O (Sigma-Aldrich). Jar tests were performed to determine coagulant dose and conditions (mixing speed and time). Coagulation-flocculation conditions consisted of flash mixing at 100 rpm for 5 min, slow mixing at 40 rpm for 20 minutes and settling for 30 min. The supernatant water was then filtered through a 0.7 µm nominal pore size glass fiber filter 47 mm circle (Fisherbrand™ Filters, Fisher Scientific) and chlorinated in 60 mL vials without leaving air in the vial, in conditions described in Table 1. Cl × UVA factors were chosen to represent a wide range of chlorinated conditions, including conditions inducing free chlorine levels observed at the WTP. This range of Cl × UVA factors is similar to other studies on DUVA [20,22,24,30,31,33,34,35,36]. Water was maintained at 20 °C during the contact time of chlorination tests [30,33,35,36]. Contact time was representative of contact time in the WTP (2 h) and aligned with previous work on DUVA [22]. After the contact time, chlorine was quenched using Na2SO3 (Sigma-Aldrich) and was stored in appropriate glassware at 4 °C for no more than 14 days before being analyzed for DBPs.
FW samples were chlorinated in laboratory in conditions described in Table 2. Use of FW differed from other studies on DUVA that chlorinated directly RW [24,31,35,36]. Cl × UVA factors range is smaller than mentioned above for the RW samples. Contact time and quenching process were similar to those applied on RW samples.
2.3.3. Water Quality Analysis
Parameters, pH, turbidity, dissolved organic carbon (DOC) and UVA were measured, within 24 h, in all samples: Water from the WTP (i.e., RW, FW, and TW) and water treated in laboratory (clarified and chlorinated RW, and chlorinated FW). DOC was measured using a total organic carbon analyser Sievers 5310C (General Electric, USA) with a detection limit of 4 μg/L. Turbidity was measured using a Hach 2100 N laboratory turbidimeter and pH with a ORION Star A215 (Thermo Scientific).
DBP levels were measured in clarified and chlorinated RWs, FWs (as the WTP includes an intermediate chlorination before FW) and chlorinated FWs. The level of DBPs formed during FW chlorination is considered as the difference of DBP levels between FWs and chlorinated FWs. Two families of DBPs were measured: THMs and HAAs. Four THMs (chloroform (TCM), bromo-dichloromethane (BDCM), dibromo-chloromethane (DBCM), and bromoform (TBM)) and five HAAs (monochloroacetic acid (MCAA), monobromoacetic acid (MBAA), dichloroacetic acid (DCAA), trichloroacetic acid (TCAA), and dibromoacetic acid (DBAA)) were analyzed. HAAs were extracted by liquid–liquid extraction and then analysed by gas-chromatography. THMs were extracted by solid phase microextraction (SPME) and then analysed by gas chromatography. A surrogate was added to each sample to ensure the efficiency of the extraction for HAAs and THMs (2-bromopropionic acid for HAAs and 4-bromofluorobenzene for THMs). To ensure the quality of the analysis, an internal standard was added to each sample (1,2,3-trichloropropane for HAAs and 1,2-dichlorobenzene-d4 for THMs). To ensure the validity and the quality of the results, blanks, duplicates and controls (with different concentrations) were added for each sequence of analysis. The THM quantification limit was 3.6 μg/L for TCM, 2.0 μg/L for BDCM, 3.4 μg/L for DBCM, and 2.6 μg/L for TBM. The HAA quantification limits were 1.0 μg/L for all HAAs. If the concentration of a DBP was lower than its quantification limit, concentration was considered as null. Complementary information on the analytical methods used are described elsewhere [37].
3. Results
3.1. Water Quality Characteristics
Characteristics of the waters sampled at the WTP are provided in Table 3. RW quality varied considerably during the study period, compared to FW and TW quality that varied less, indicating consistent water treatment efficiency.
3.2. Validation of UVA Measurements between the Field and the Laboratory Spectrophotometers
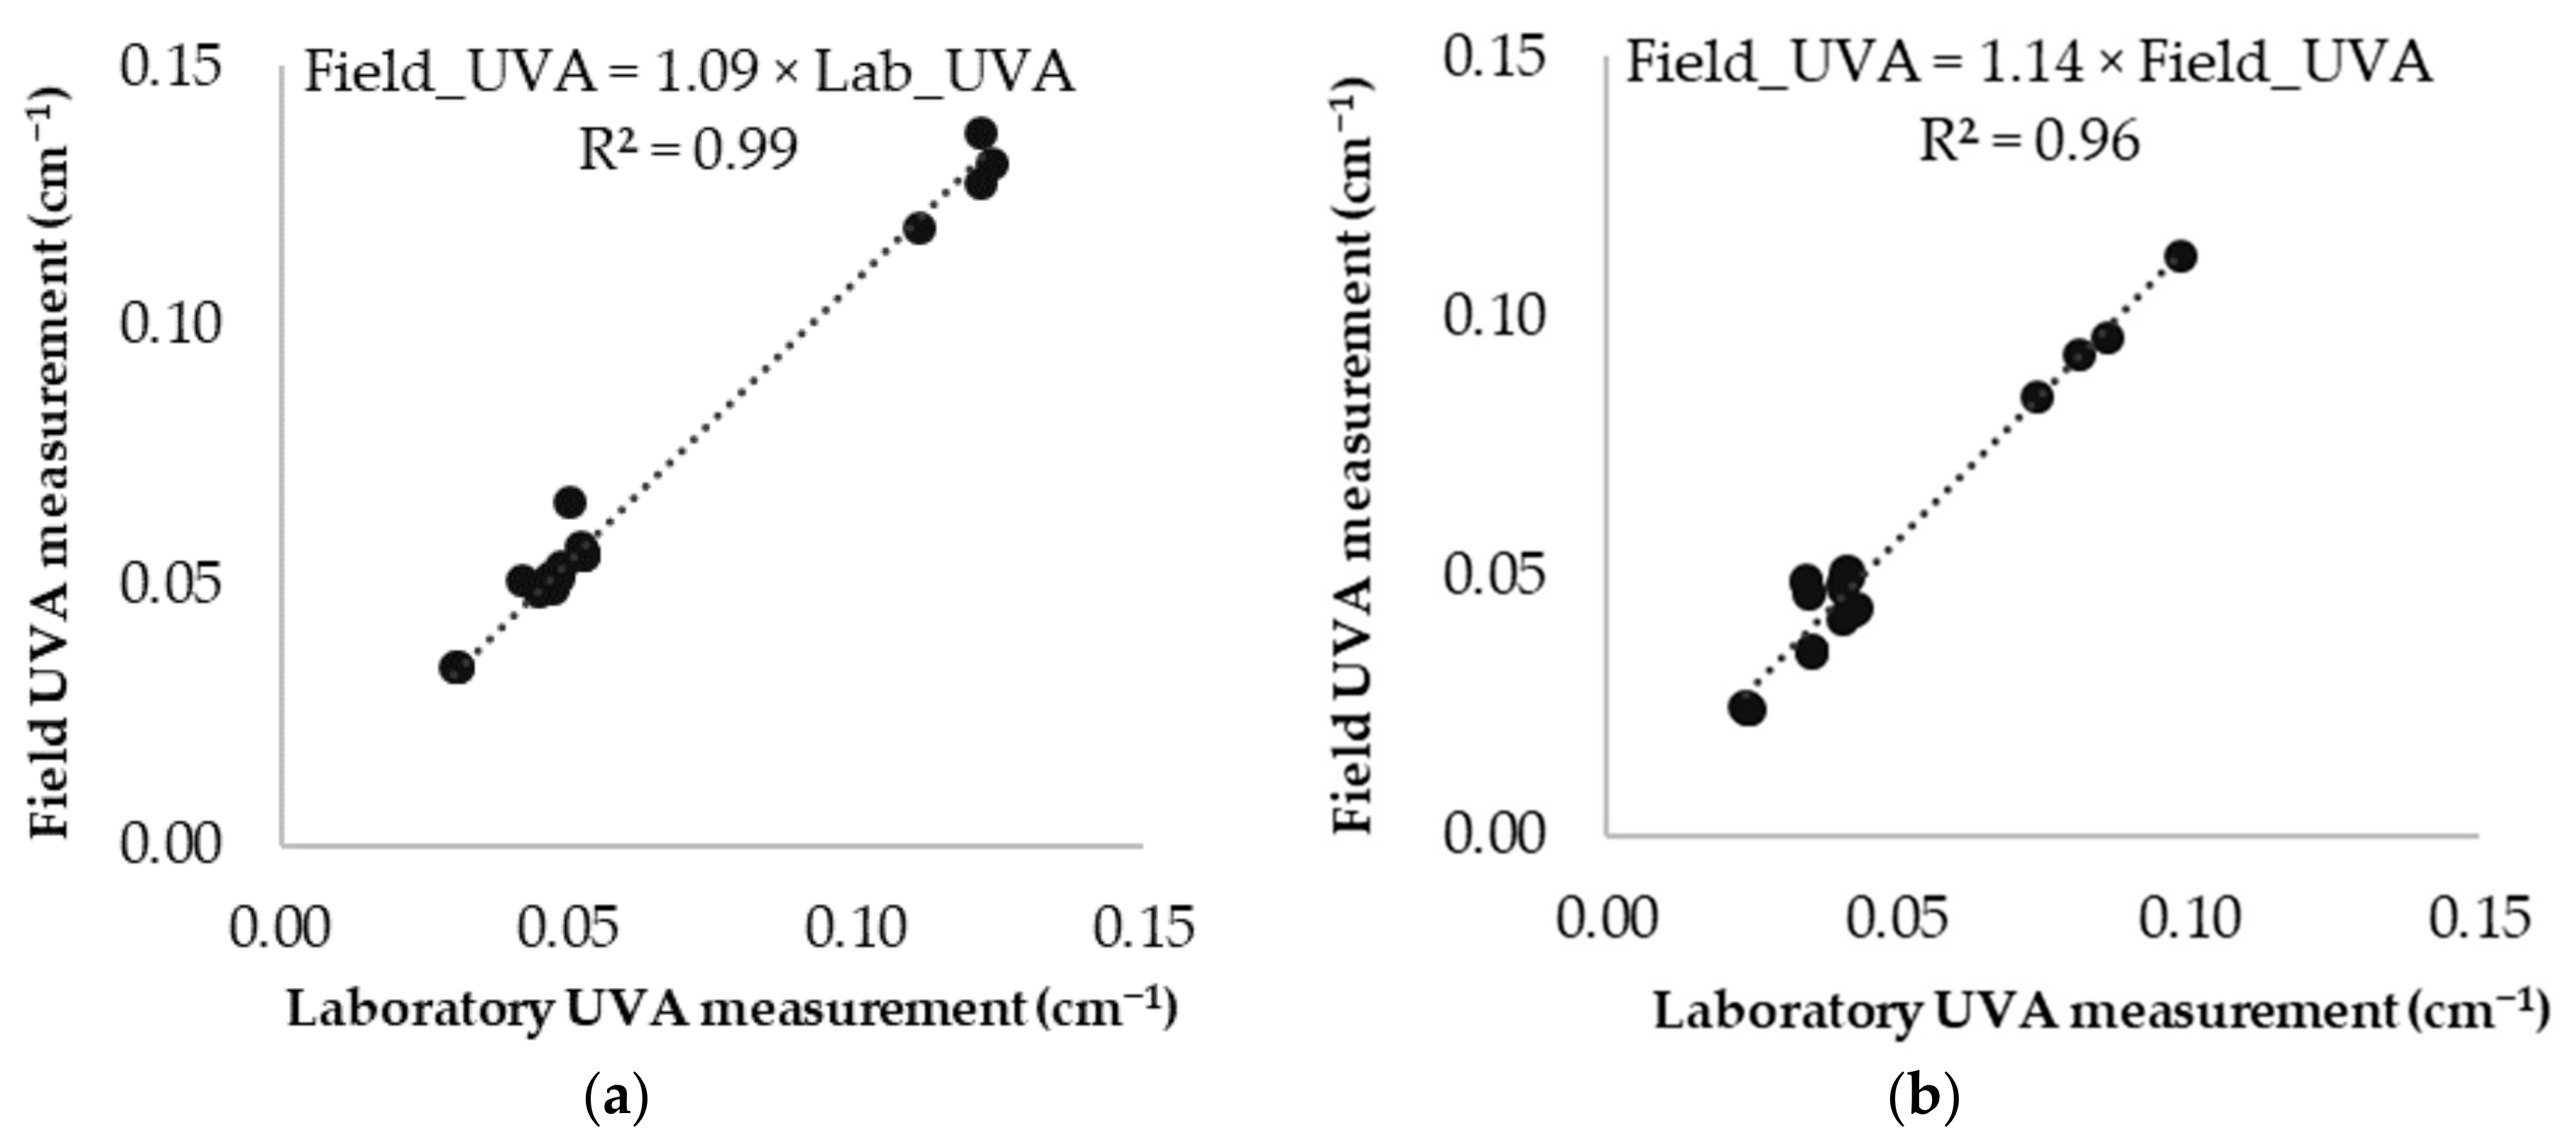
Validation of UVA measurements between field and laboratory reference instruments is presented in Figure 3. A high degree of correlation (R2 ≥ 0.96) was observed for both instruments located in FW and TW as well as a slight underestimation by the in situ field instrument relative to the laboratory instrument (regression through the origin). Coefficient a values, corresponding to the experimental approach (Figure 1), for field instruments located in FW and TW are respectively 1.09 and 1.14.
3.3. Lab-Based Estimations of DBPs
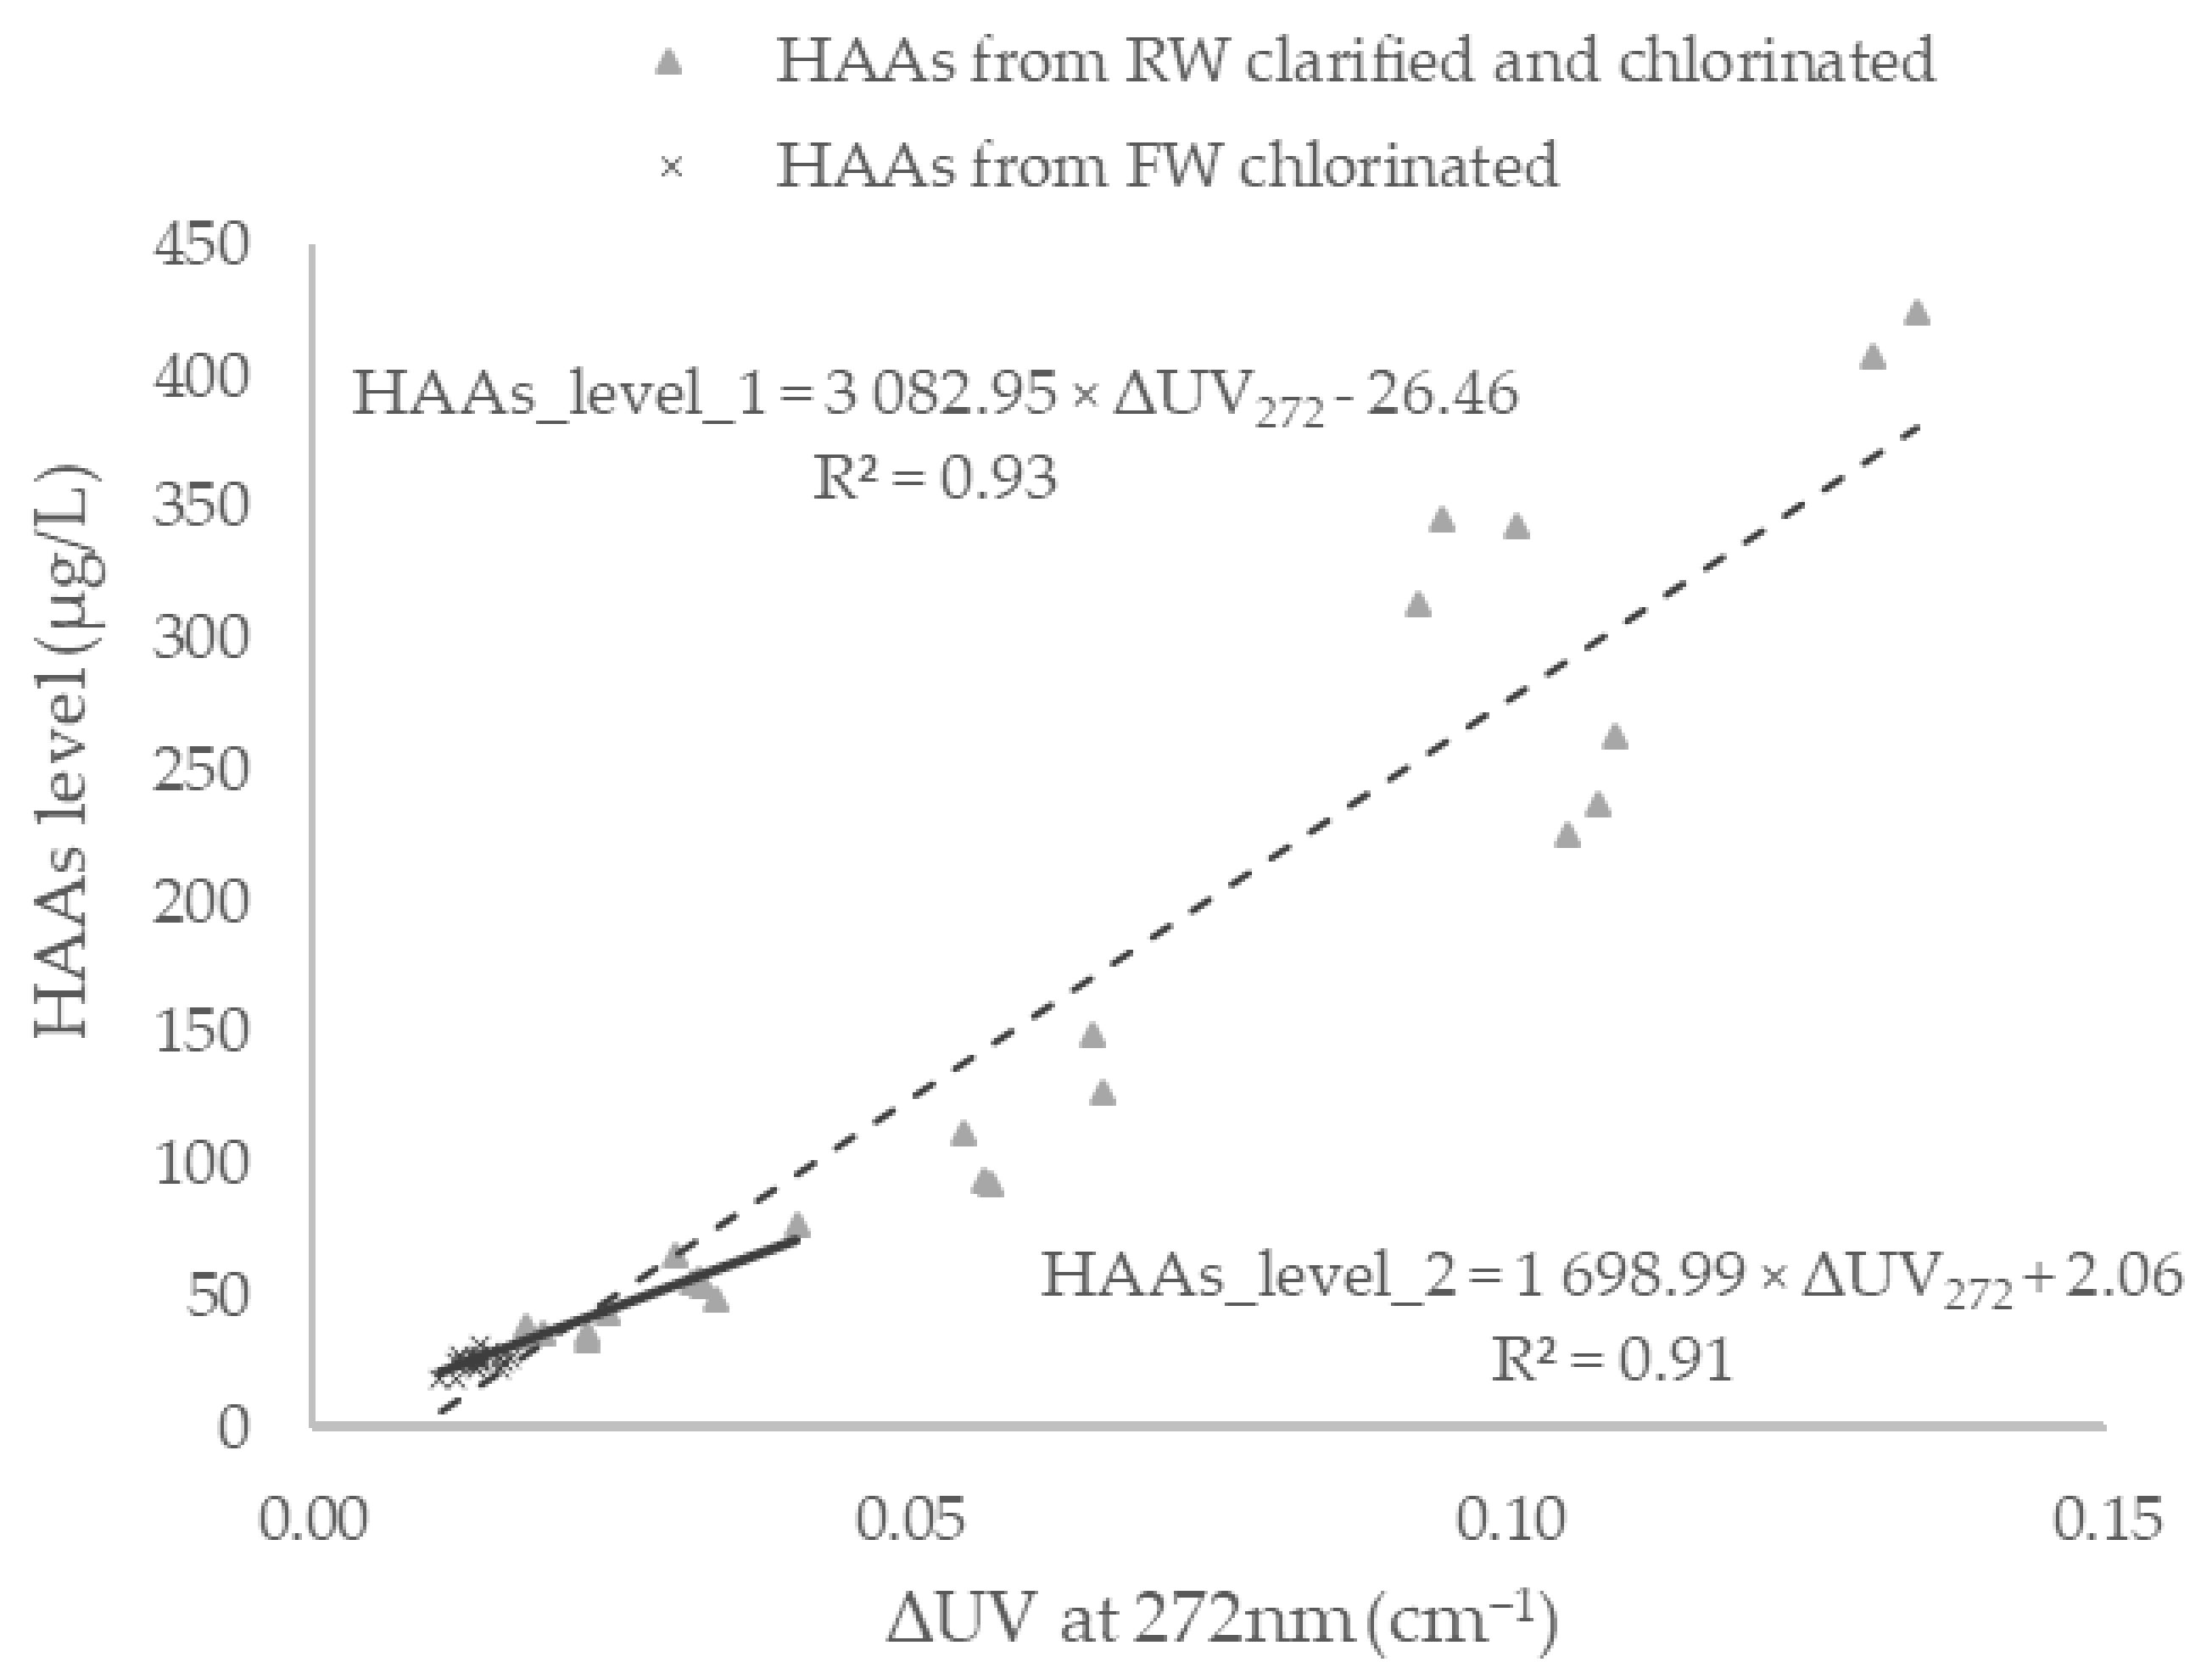
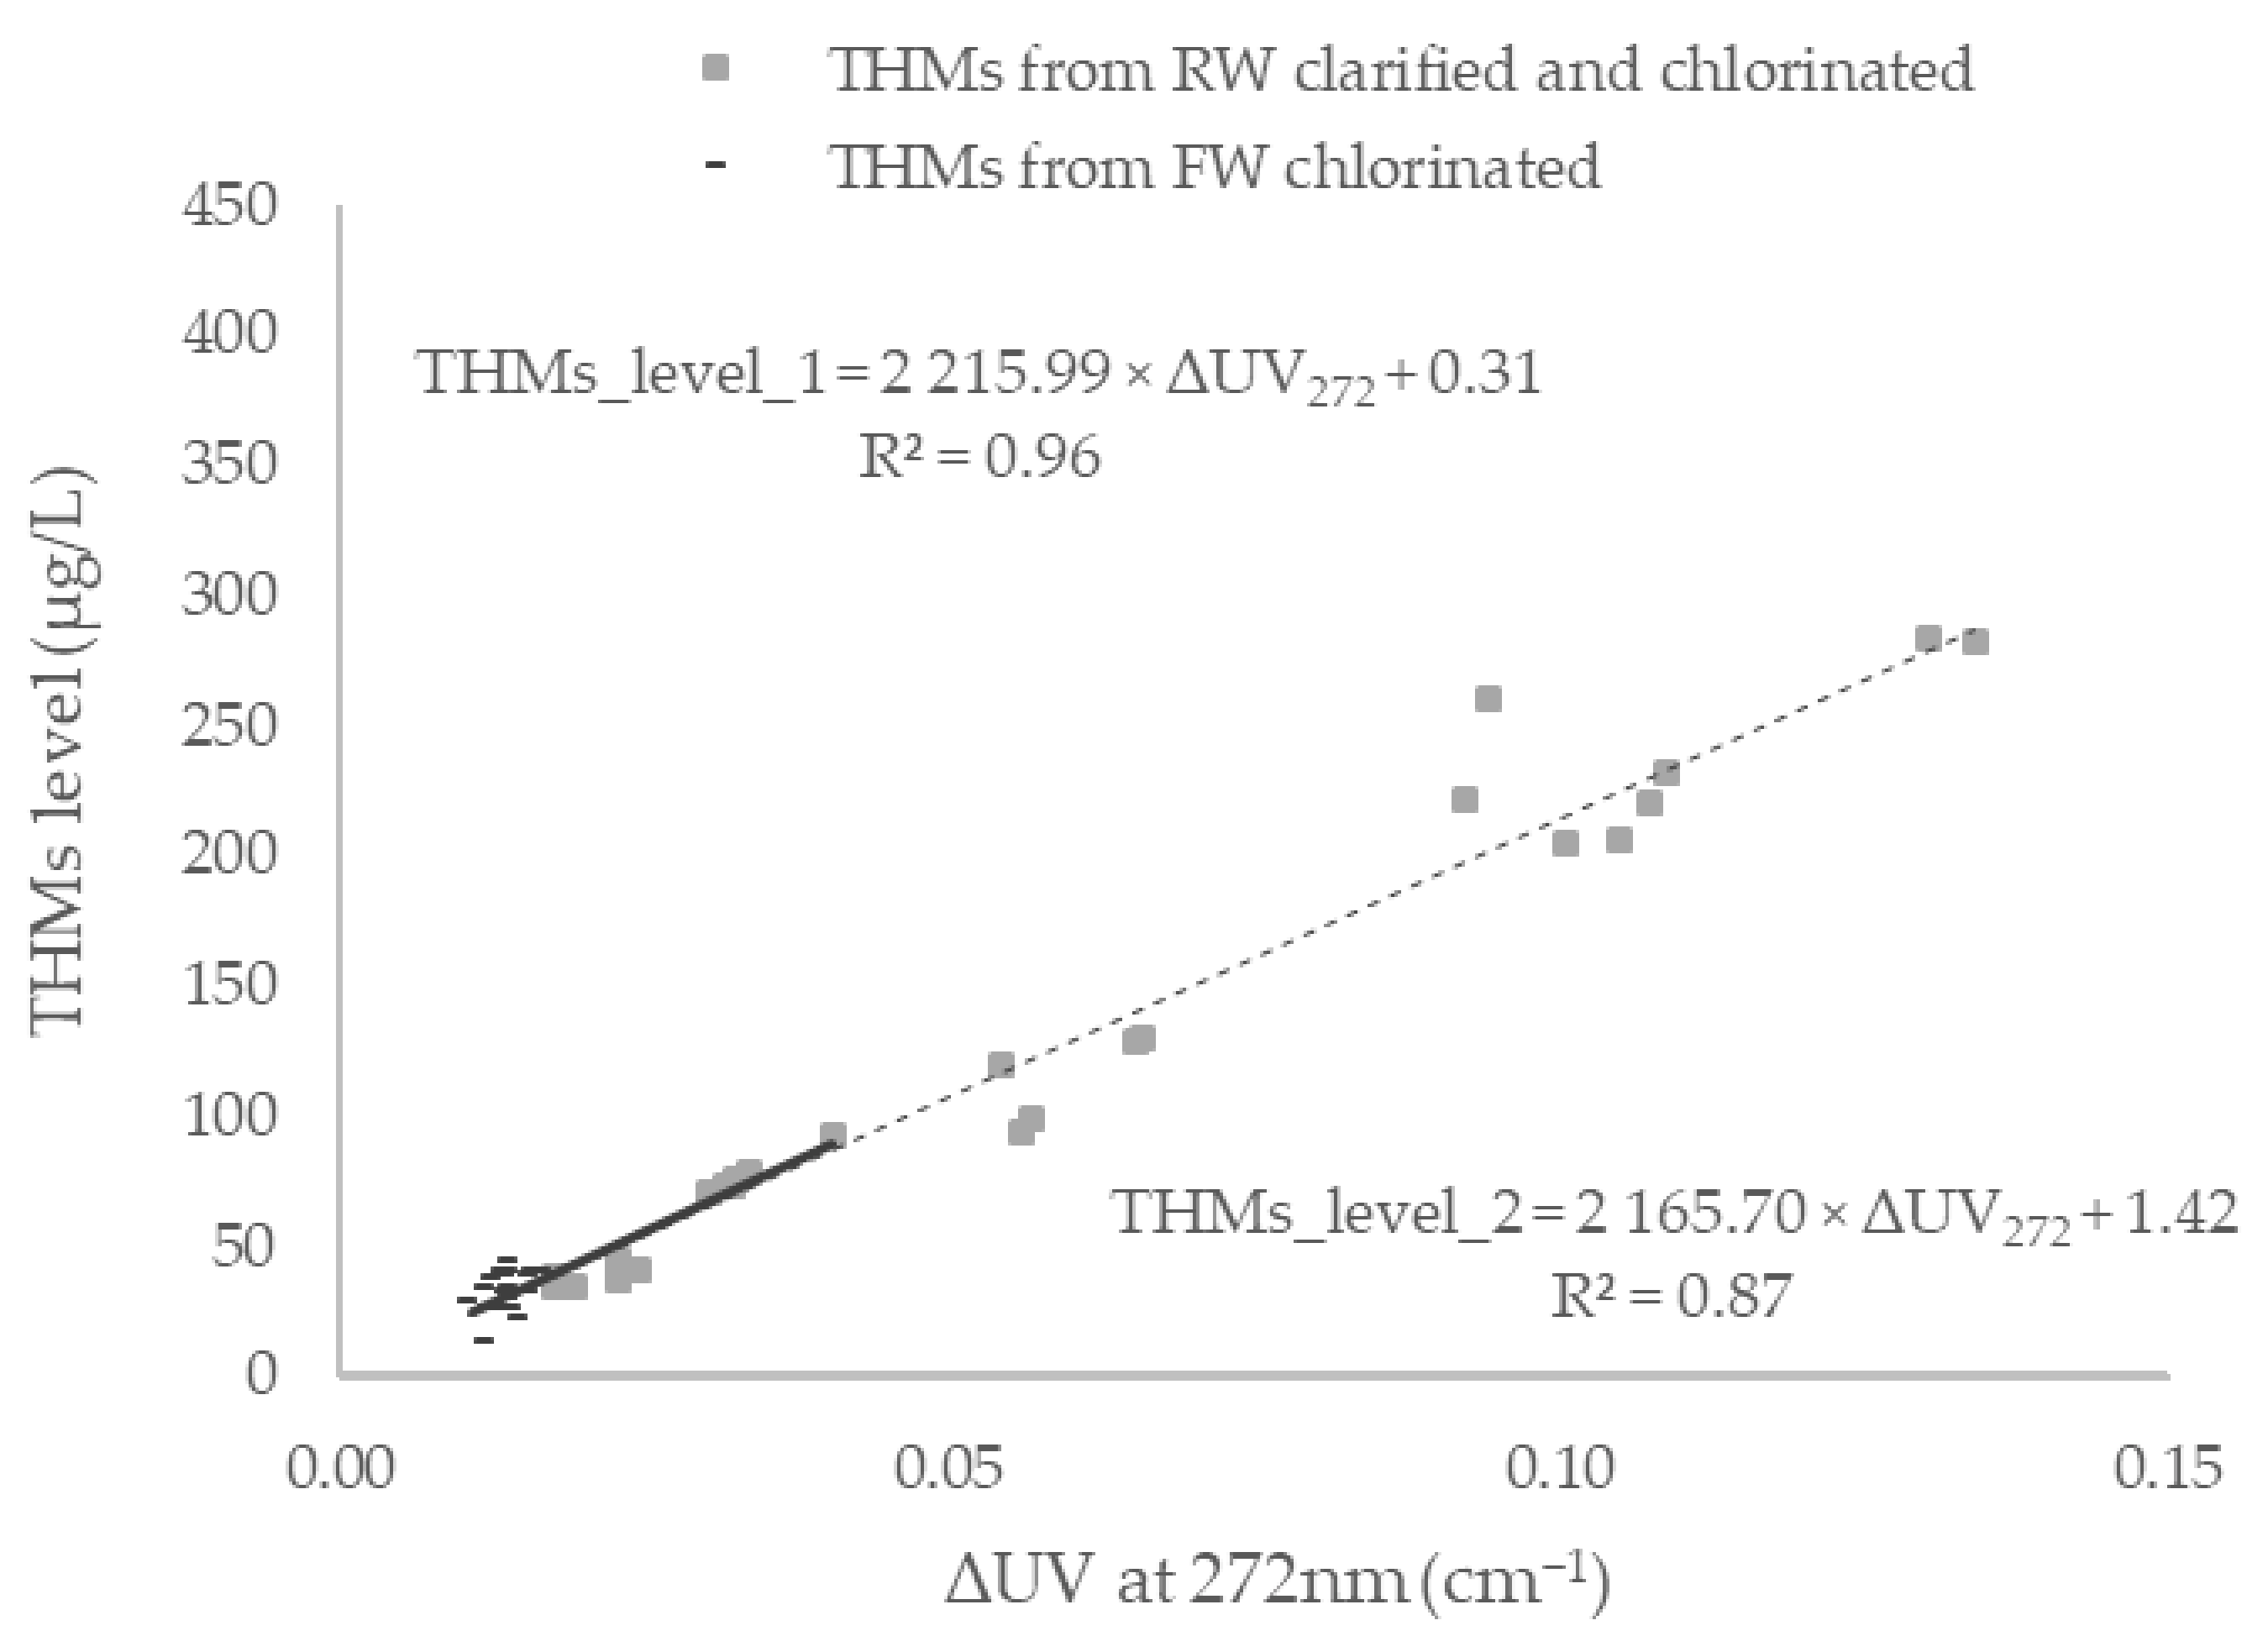
Linear calibration curves between DUVA (measured with the laboratory spectrophotometer) and concentrations of THMs and HAAs were established (Figure 4 and Figure 5). The range of DUVA was from 0.10 to 0.135 cm−1 with DBP levels ranging from 18 to 424 µg/L for HAAs and from 11 to 294 µg/L for THMs. Ranges of DPB levels are comparable to levels observed in previous studies in similar conditions [22,24,25,34,36]. This large range of DBP levels is mainly due to varying NOM levels from RW clarified and chlorinated water samples. Maximum levels observed in Figure 3 and Figure 4 are higher than the actual DBP levels observed in the WTP under study, based on historical data, from 10 to 60 µg/L for TCM and 1 to 5 µg/L for BDCM (the two most predominant THMs) and from 4 to 17 µg/L for DCAA and 2 to 18 µg/L for TCAA (the two most predominant HAAs) [38]. Meanwhile, the lowest measurements of DUVA and DBP levels appear for samples from FW chlorinated only and are more representative of the actual DBP levels observed in the WTP.
Correlation curves are linear but do not pass through the origin of the graph, as already observed in previous DUVA studies [23]. Correlations between HAA and THM levels and DUVA measurements are strong with R2 values respectively of 0.93 and 0.96, if we consider all observations (linear correlation DBPs_level_1). Residual analysis are provided in Supplementary Figures S1 and S2.
Linear correlation DBPs_level_2 (Figure 4 and Figure 5) represents correlation between DUVA and DBP levels considering DUVA values typical of WTP field conditions during the study period (also representative of historical data [38]). R2 values are respectively 0.91 and 0.87 for HAAs and THMs. R2 values decrease slightly compared to correlations made on all observations (DBPs_level_1). Residual analyses are provided in Supplementary Figures S3 and S4.
When all data are considered, the wider range of DUVA values from tests with relatively higher coagulant and chlorine dosages resulted in higher correlation coefficients with similar values to what has been reported in the literature [22,24,25,34,36]. However, such test conditions may not be representative of field conditions.
Based on data from Figure 4 and Figure 5, models for DBP levels estimation were developed. Two types of models were developed: The first is based on linear correlation between DBP levels and DUVA at large scale (corresponding to linear correlations DBPs_level_1) and the second is based on linear correlation between DBP levels and DUVA at a limited scale (corresponding to linear correlations DBPs_level_2). Thus, coefficient B values, corresponding to the experimental approach (Figure 1), at large scale are respectively 3082.95 for HAAs and 2215.99 for THMs and at limited-scale of 1698.99 for HAAs and 2165.70 for THMs. R2 values of these models are presented in Table 4.
R2 values from large-scale models for both THMs and HAAs are similar to these observed in previous studies with comparable DBP ranges [22,24,34,36]. On the contrary, R2 values from limited-scale models differ from previous studies with comparable DBP ranges: R2 value for HAAs models is higher and R2 value for HAAs models is slightly lower [22,31,34].
3.4. Determination of a Site-Specific Linear Calibration Curve for in Situ Real-Time Estimations of DBPs
Models for DBP estimations were developed by combining coefficients A and B, based on the methodology described in Figure 1 (see Section 2.1) and presented in Table 5.
Comparison between estimated levels of DBP and actual measured level of DBPs showed that large-scale models achieve to estimate DBP levels at 77% level of uncertainty for HAAs and 32% for THMs. Models developed at limited scale estimated DBP levels at a 23% level of uncertainty for HAAs and 32% for THMs. Uncertainty for THM models do not change between scales, while uncertainty for HAAs models is considerably lower at limited scale. These results revealed that overall limited scale models managed to estimate DBP levels with relatively similar or less uncertainties for THM and HAAs, respectively, when compared to large-scale models. Even if R2 values of large-scale models are quite stronger (Table 4), these models were developed on a range of DBP levels that is not thought to be representative of WTP levels like similar previous studies [22,24,25,34,36]. It highlights that it might me inadequate to develop models on range of DBP levels deliberately large.
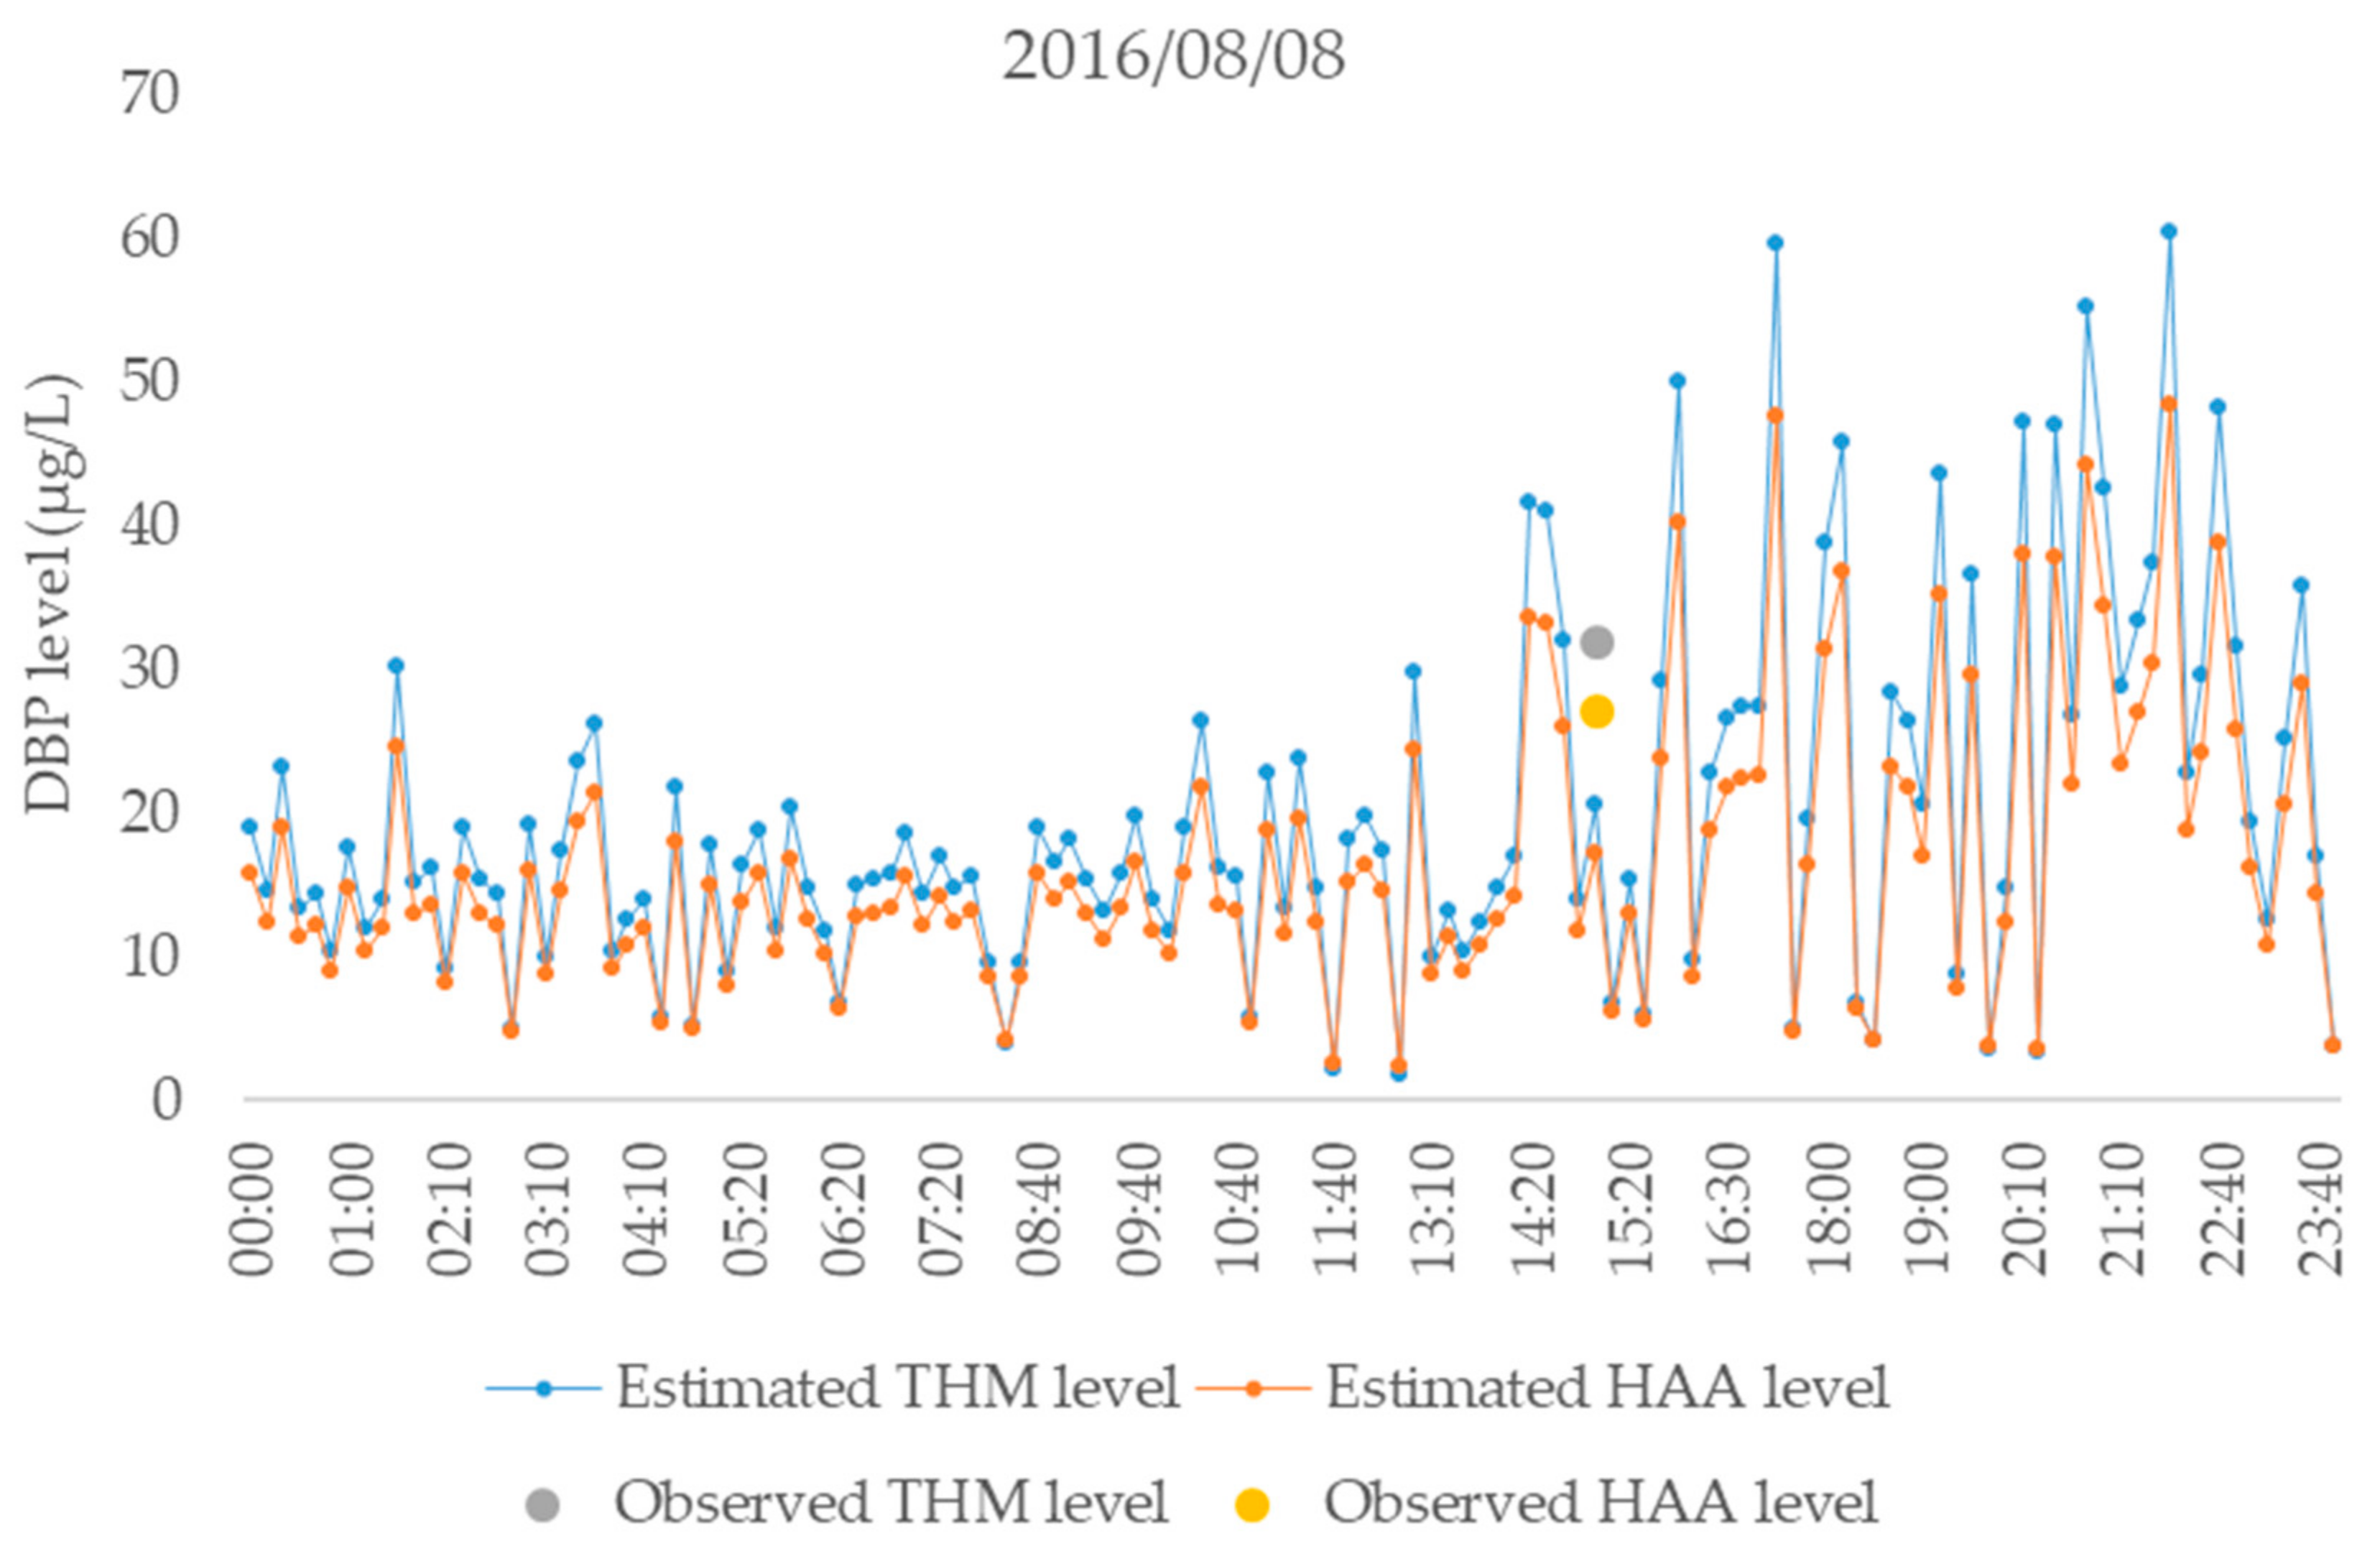
These results show that even if models present a very high R2 factor, they would not be as efficient to estimate DBP levels as if they were developed at a limited scale representative of DUVA and DBP levels that actually occur in a WTP. Thus, models to estimate DBP levels with DUVA need to be developed on DUVA and DBP levels ranges representative of levels that can be actually observable. As DBP estimation models from UVA measured with the field instruments were elaborated (based on limited scale models), real-time estimation of DBP levels from field instruments was feasible. Figure 6 depicts the real-time estimated DBP levels formed in the WTP (between FW and TW) over a day (1 measurement every 10 min) alongside DBP actual measurements in a grab sample. Estimated THM and HAA levels varied widely within this period. Levels vary from 0.05 to 56 µg/L for HAAs and from 0.05 to 65 µg/L for THMs, over the day (due to extreme values).
As real-time measurement generates a large number of data, it is important to further develop a data processing strategy for the probes. A data processing strategy would permit to remove errors and outliers and produce meaningful information for DBP estimation.
4. Discussion
A lab-based protocol was developed for the determination of a site-specific linear calibration curve for in situ real-time estimation of DBP occurrences using DUVA. Models to estimate DBP levels from real-time DUVA with field spectrophotometer probes were developed and levels of uncertainty on DBP levels estimation are relatively low (from 23% to 32%, depending on compounds).
This project also revealed the importance of developing models at scale representative of DUVA and DBP levels that actually occur. In fact, in lab-based experiments in controlled conditions, the range of DUVA established is usually wide, and so the range of DBP levels measured. Thus, the correlation between DUVA measurements and DBP levels are strong. However, this range of DBP levels is not typical of what is observed in WTPs. Focus on DUVA measurements and DBP levels representative of values typically observed at the WTP, resulted in a slight decrease in correlations and R2 values. However, the limited-scale models managed to estimate DBP levels with less uncertainty than the large-scale models. However, the DBP levels representative of values typically observed at the WTP remain specific to the average annual levels observed a typical WTP supplied by a source water (surface water) which present a large variability of DBP levels along the year. A groundwater with low organic matter would present a lower DBP levels range with a lower variability for example. This study was based on water sampling during a relatively limited time duration. As such, this proof-of-concept should be considered being of preliminary nature warranting complementary studies, preferably in full-scale water treatment facilities. Further studies are needed focusing on several other types of waters (sampled in several different WTPs with different contact times). Finally, in this project DBPs were estimated at the WTP. It would be interesting to estimate DBP levels at different points throughout the distribution system for a more robust DBP management tool. Furthermore, the use multi-wavelength models for DUVA-based DBP estimation has been shown to be effective in lab studies [39]. Such an approach should be explored in future work relative to full-scale applications of real-time DBP estimations by DUVA.
Supplementary Materials
The following are available online at https://www.mdpi.com/2073-4441/12/9/2536/s1, Supplementary Figure S1: Residual analysis of HAAs_level_1 linear regression, Supplementary Figure S2: Residual analysis of THMs_level_1 linear regression, Supplementary Figure S3: Residual analysis of HAAs_level_2 linear regression, Supplementary Figure S4: Residual analysis of THMs_level_2 linear regression.
Author Contributions
Conceptualization, G.S. and D.C.; methodology, G.S. and D.C.; formal analysis, G.S.; writing—Original draft preparation, G.S.; writing—Review and editing, G.S. and D.C.; supervision, D.C.; project administration, D.C.; funding acquisition, D.C. All authors have read and agreed to the published version of the manuscript.
Funding
Financial support for this project was mainly provided by the National Science and Engineering Research Council (NSERC) through an Engage Grant.
Acknowledgments
The authors would like to acknowledge the staff of the laboratory of the NSERC Industrial Research Chair in Management and Surveillance of Drinking Water Quality from the Watershed to the Citizen’s Tap in Université Laval for their technical support. Also, the authors acknowledge the staff from the WTP where field instrumentation were installed for their welcome and technical support.
Conflicts of Interest
The authors declare no conflict of interest. The funders had no role in the design of the study; in the collection, analyses, or interpretation of data; in the writing of the manuscript, or in the decision to publish the results.
References
- Rook, J.J. Formation of haloforms during the chlorination of natural water. Water Treat. Exam. 1974, 23, 234–243. [Google Scholar]
- Richardson, S.D. Disinfection By-Products: Formation and Occurrence in Drinking Water. Encyclopedia of Environmental Health; Nriagu, J.O., Ed.; Elsevier Science Inc.: Burlington, MA, USA, 2011. [Google Scholar]
- Yang, M.; Zhang, X. Current trends in the analysis and identification of emerging disinfection byproducts. Trends Environ. Anal. Chem. 2016, 10, 24–34. [Google Scholar] [CrossRef]
- Richardson, S.D.; Plewa, M.J.; Wagner, E.D.; Schoeny, R.; DeMarini, D.M. Occurrence, genotoxicity, and carcinogenicity of regulated and emerging disinfection by-products in drinking water: A review and roadmap for research. Mutat. Res. 2007, 636, 178–242. [Google Scholar] [CrossRef]
- Villanueva, C.; Cantor, K.P.; Grimalt, J.O.; Malats, N.; Silverman, D.; Tardon, A.; Garcia-Closas, R.; Serra, C.; Carrato, A.; Castaño-Vinyals, G.; et al. Bladder cancer and exposure to water disinfection by-products through ingestion, bathing, showering and swimming in pools. Am. J. Epidemiol. 2007, 165, 148–156. [Google Scholar] [CrossRef]
- Stalter, D.; O’Malley, E.; Von Gunten, U.; Escher, B.I. Fingerprinting the reactive toxicity pathways of 50 drinking water disinfection by-products. Water Res. 2016, 91, 19–30. [Google Scholar] [CrossRef] [Green Version]
- Mouly, D.; Joulin, E.; Rosin, C.; Beaudeau, P.; Zeghnoun, A.; Olszewski-Ortar, A.; Munoz, J.-F.; Welté, B.; Joyeux, M.; Seux, R.; et al. Variations in trihalomethane levels in three French water distribution systems and the development of a predictive model. Water Res. 2010, 44, 5168–5179. [Google Scholar] [CrossRef]
- Singer, P.C. Occurrence of haloacetic acids in chlorinated drinking water. Water Sci. Technol. Water Supply 2002, 2, 487–492. [Google Scholar] [CrossRef]
- Guilherme, S.; Rodriguez, M.J. Occurrence of regulated and non-regulated disinfection by-products in small drinking water systems. Chemosphere 2014, 117, 425–432. [Google Scholar] [CrossRef]
- United States Environmental Protection Agency-USEPA. Complying with the Stage 2 Disinfectant and Disinfection Byproducts Rule: Small Entity Compliance Guide; Office of Groundwater and Drinking Water: Washington, DC, USA, 2007.
- Health Canada. Guidelines for Canadian Drinking Water Quality. In Guideline Technical Document—Trihalomethanes; Health Canada: Ottawa, ON, Canada, 2006. [Google Scholar]
- Health Canada. Guidelines for Canadian Drinking Water Quality. In Guideline Technical Document–Haloacetic Acids; Health Canada: Ottawa, ON, Canada, 2008. [Google Scholar]
- Ministère du Développement Durable, de l’Environnement et de la Lutte contre les Changements Climatiques—MDDELCC. Règlement sur la Qualité de l’eau Potable; Éditeur Officiel du Québec: Québec, QC, Canada, 2012. Available online: http://legisquebec.gouv.qc.ca/fr/ShowDoc/cr/Q-2,%20r.%2040 (accessed on 10 September 2020).
- Ontario Regulation 169/03, 2017. Ontario Drinking Water Quality Standards, Safe Drinking Water Act, 2002, S.O. 2002, c. 32. 2017. Available online: https://www.ontario.ca/laws/statute/s02032 (accessed on 10 September 2020).
- The Standard Methods Organization. Method 5910 UV-Absorbing Organic Constituents. In Standard Methods for the Examination of Water and Wastewater, 22nd ed.; American Public Health Association: Washington, DC, USA, 2012. [Google Scholar]
- Pifer, A.D.; Fairey, J.L. Suitability of Organic Matter Surrogates to Predict Trihalomethane Formation in Drinking. Water Environ. Eng. Sci. 2014, 31, 117–126. [Google Scholar] [CrossRef]
- Capodaglio, A.G.; Callegari, A.; Molognoni, D. Online monitoring of priority and dangerous pollutants in natural and urban waters: A state-of-the-art review. Manag. Environ. Qual. 2016, 27, 507–536. [Google Scholar] [CrossRef]
- Korshin, G.V.; Li, C.-W.; Benjamin, M.M. Use of UV spectroscopy to study chlorination of natural organic matter. (ACS Symposium Series). Water Disinfect. Nat. Org. Matter. 1996, 649, 182–195. [Google Scholar]
- Korshin, G.V.; Li, C.-W.; Benjamin, M.M. The decrease of UV absorbance as an indicator of TOX formation. Water Res. 1997, 31, 946–994. [Google Scholar] [CrossRef]
- Korshin, G.V.; Wu, W.W.; Benjamin, M.M.; Hemingway, O. Correlations between differential absorbance and the formation of individual DBPs. Water Res. 2002, 36, 3273–3282. [Google Scholar] [CrossRef]
- Li, C.; Benjamin, M.M.; Korshin, G.V. The relationship between TOX formation and spectral changes accompanying chlorination of pre-concentrated or fractionated NOM. Water Res. 2002, 36, 3265–3272. [Google Scholar] [CrossRef]
- Roccaro, P.; Vagliasindi, F.G.A. Differential vs. absolute UV absorbance approaches in studying NOM reactivity in DBPs formation: comparison and applicability. Water Res. 2009, 43, 744–750. [Google Scholar] [CrossRef]
- Beauchamp, N.; Laflamme, O.; Simard, S.; Dorea, C.; Pelletier, G.; Bouchard, C.; Rodriguez, M.J. Relationships between DBP concentrations and differential UV absorbance in full-scale conditions. Water Res. 2018, 131, 110–121. [Google Scholar] [CrossRef]
- Özdemir, K.; Toröz, İ.; Uyak, V. Assessment of Trihalomethane Formation in Chlorinated Raw Waters with Differential UV Spectroscopy Approach. Sci. World J. 2013, 890854. [Google Scholar] [CrossRef]
- Li, C.W.; Korshin, G.V.; Benjamin, M.M. Monitoring DBP formation with differential UV spectroscopy: a new application uses differential UV spectroscopy to monitor DBP formation easily, rapidly, and inexpensively. J. Am. Water Works Assn. 1998, 90, 88–100. [Google Scholar] [CrossRef]
- Chow, A.T.; Dahlgren, R.A.; Zhang, Q.; Wong, P.K. Relationships between specific UVA and THMs precursors of different carbon sources. J. Water Supply Res. Technol. AQUA 2008, 57, 471–480. [Google Scholar] [CrossRef] [Green Version]
- Beauchamp, N.; Dorea, C.C.; Bouchard, C.; Rodriguez, M. Use of differential UV absorbance to estimate concentrations of chlorinated disinfection by-product in drinking water: Critical review and research needs. Crit. Rev. Env. Sci. Technol. 2018, 48, 210–241. [Google Scholar] [CrossRef]
- Mercier, N.; Bouchard, C.; Dorea, C.C. Online estimation of disinfection by products through differential UV spectrophotometry: Potential & challenges. In Proceedings of the 30th Eastern Canadian Symposium on Water Quality Research, Ottawa, ON, Canada, 27 May 2016. [Google Scholar]
- Légaré-Julien, F.; Bouchard, C.; Dorea, C.C. Application of Differential UV Spectrophotometry for the Estimation of Disinfection By-products. In Proceedings of the AWWA Water Quality & Technology Conference, Indianapolis, IN, USA, 13–17 November 2016. [Google Scholar]
- Korshin, G.V.; Chang, H.-S. Spectroscopic Studies of the Roles of Distinct Chromophores in NOM Chlorination and DBP Formation. In Disinfection By-Products in Drinking Water. J. Am. Chem. Soc. 2008, 995, 158–171. [Google Scholar]
- Uyak, V.; Demirbas, K.D. Formation of Disinfection Byproducts (DBPs) in Surface Water Sources: Differential Ultraviolet (UV) Absorbance Approach. Environ. Forensics. 2014, 15, 52–65. [Google Scholar] [CrossRef]
- Available online: http://www.s-can.at/ (accessed on 21 May 2020).
- Edzwald, J.K.; Becker, W.C.; Wattier, K.L. Surrogate parameters for monitoring organic matter and THM precursors. J. Am. Water Works Assn. 1985, 77, 122–132. [Google Scholar] [CrossRef]
- Roccaro, P.; Chang, H.-S.; Vagliasindi, F.G.A.; Korshin, G.V. Differential absorbance study of effects of temperature on chlorine consumption and formation of disinfection by-products in chlorinated water. Water Res. 2008, 42, 1879–1888. [Google Scholar] [CrossRef] [PubMed]
- Roccaro, P.; Vagliasindi, F.G.A.; Korshin, G.V. Comparison of the performance of spectroscopic indices developed to quantify the halogenation of natural organic matter at varying chlorine concentrations, reaction times and temperatures. In: Disinfection By-Products in Drinking Water. J. Am. Chem. Soc. 2008, 995, 198–212. [Google Scholar]
- Yan, M.; Korshin, G.V.; Chang, H.-S. Examination of disinfection by-product (DBP) formation in source waters: A study using log-transformed differential spectra. Water Res. 2014, 50, 179–188. [Google Scholar] [CrossRef]
- Guilherme, S.; Rodriguez, M.J. Short-term spatial and temporal variability of disinfection by-product occurrence in small drinking water systems. Sci. Total Environ. 2015, 518–519, 280–289. [Google Scholar] [CrossRef]
- Mercier Shanks, C.; Sérodes, J.-B.; Rodriguez, M.J. Spatio-temporal variability of non-regulated disinfection by-products within a drinking water distribution network. Water Res. 2013, 47, 3231–3243. [Google Scholar] [CrossRef]
- Beauchamp, N.; Dorea, C.C.; Bouchard, C.; Rodriguez, M. Multi-wavelength models expand the validity of DBP-differential absorbance relationships in drinking water. Water Res. 2019, 158, 61–71. [Google Scholar] [CrossRef]
Figure 1.
Experimental approach to estimate disinfection by-product (DBP) levels from differential UV absorbance (DUVA).
Figure 1.
Experimental approach to estimate disinfection by-product (DBP) levels from differential UV absorbance (DUVA).

Figure 2.
Overall pattern of the water treatment plant under study.

Figure 3.
Validation of real-time field measurements with laboratory measurements: (a) FW field instrument (filtered water); (b) TW field instrument (treated water).
Figure 3.
Validation of real-time field measurements with laboratory measurements: (a) FW field instrument (filtered water); (b) TW field instrument (treated water).

Figure 4.
Correlation between haloacetic acid (HAA) levels and DUVA at 272 nm.

Figure 5.
Correlation between trihalomethane (THM) levels and DUVA at 272 nm.

Figure 6.
Evolution of real-time estimated THM and HAA levels at TW throughout one day.


Table 1.
Experimental parameters for raw water (RW) clarification and chlorination.
| Parameter | Alum Dose (mg/L) | Cl × UVA = Cl2 (mg/L) × UVA254 (cm−1) × 10 | pH | Contact Time (h) |
|---|---|---|---|---|
| Values | 20/40 | 0.25/0.5/1.0/1.5/2.0/3.0/4.0/6.0 | 6.5/7.0/7.5 | 2 |
Cl2: chlorine dose UVA254: UV absorbance at 254 nm before chlorination.
Table 2.
Experimental parameters for filtered water (FW) chlorination.
| Parameter | Cl × UVA = Cl2 (mg/L) × UVA254 (cm−1) × 10 | pH | Contact Time (h) |
|---|---|---|---|
| Values | 1.0/1.5/2.0/3.0/4.0 | 6.5/7.0/7.5 | 2 |
Cl2: chlorine dose UVA254: UV absorbance at 254 nm before chlorination.
Table 3.
Water quality characteristics at the study area water treatment plant (WTP) between June and August 2016 (n = 91).
Table 3.
Water quality characteristics at the study area water treatment plant (WTP) between June and August 2016 (n = 91).
| Raw Water (RW) | Filtered Water (FW) | Treated Water (TW) | ||||
|---|---|---|---|---|---|---|
| Mean ± SD * | Range | Mean ± SD * | Range | Mean ± SD * | Range | |
| pH | 7.6 ± 0.4 | 6.8–9.0 | 6.6 ± 0.4 | 4.8–7.2 | 6.6 ± 0.4 | 4.9–7.1 |
| Turbidity (NTU) | 9.2 ± 13.5 | 1.4–64.7 | 0.24 ± 0.19 | 0.07–0.73 | 0.19 ± 0.20 | 0.07–1.10 |
| DOC (mg/L) | 9.2 ± 3.6 | 5.3–19.6 | 3.0 ± 1.0 | 1.7–6.8 | 3.0 ± 1.0 | 1.7–6.4 |
| UVA at 254 nm (cm−1) | 0.34 ± 0.14 | 0.18–0.77 | 0.05 ± 0.02 | 0.03–0.14 | 0.04 ± 0.02 | 0.03–0.12 |
| SUVA | 3.8 ± 0.7 | 2.7–5.2 | 1.7 ± 0.1 | 1.5–2.1 | 1.5 ± 0.1 | 1.3–1.8 |
| Free chlorine (mg/L) | - | - | 0.02 ± 0.02 | 0.00–0.05 | 1.14 ± 0.16 | 0.85–1.44 |
| Total chlorine (mg/L) | - | - | 0.31 ± 0.20 | 0.01–0.80 | 1.39 ± 0.16 | 1.13–1.68 |
* SD: Standard deviation, Range: Minimum–maximum.
Table 4.
R2 values from models for DBP levels estimation from DUVA with the laboratory spectrophotometer.
Table 4.
R2 values from models for DBP levels estimation from DUVA with the laboratory spectrophotometer.
| Type of Model | DBPs | R2 |
|---|---|---|
| Large-scale model | HAAs | 0.93 |
| THMs | 0.96 | |
| Limited-scale model | HAAs | 0.91 |
| THMs | 0.87 |
Table 5.
Models for DBP levels estimation from DUVA measurement with FW and TW probes (n = 12).
| Type of Model | DBPs | Models | DUVA Level Range (cm−1) | DBPs Level Range (µg/L) | Uncertainty |
|---|---|---|---|---|---|
| Large-scale model | HAAs | HAA6 = 3 082.95 × (1/1.09 × UVAFW272 − 1/1.14 × UVATW272) − 26.46 | 0.01–0.13 | 18–424 | 77% |
| THMs | THM4 = 2 215.99 × (1/1.09 × UVAFW272 − 1/1.14 × UVATW272) + 0.31 | 0.01–0.13 | 12–283 | 32% | |
| Limited scale model | HAAs | HAA6 = 1 698.99 × (1/1.09 × UVAFW272 − 1/1.14 × UVATW272) + 2.06 | 0.02–0.04 | 33–77 | 23% |
| THMs | THM4 = 2 165.70 × (1/1.09 × UVAFW272 − 1/1.14 × UVATW272) + 1.42 | 0.02–0.04 | 34–92 | 32% |
Range: Minimum–maximum.
© 2020 by the authors. Licensee MDPI, Basel, Switzerland. This article is an open access article distributed under the terms and conditions of the Creative Commons Attribution (CC BY) license (http://creativecommons.org/licenses/by/4.0/).
Share and Cite
MDPI and ACS Style
Stéphanie, G.; Caetano, D. Real-Time Estimation of Disinfection By-Products through Differential UV Absorbance. Water 2020, 12, 2536. https://doi.org/10.3390/w12092536
AMA Style
Stéphanie G, Caetano D. Real-Time Estimation of Disinfection By-Products through Differential UV Absorbance. Water. 2020; 12(9):2536. https://doi.org/10.3390/w12092536
Chicago/Turabian StyleStéphanie, Guilherme, and Dorea Caetano. 2020. "Real-Time Estimation of Disinfection By-Products through Differential UV Absorbance" Water 12, no. 9: 2536. https://doi.org/10.3390/w12092536
Note that from the first issue of 2016, this journal uses article numbers instead of page numbers. See further details here.