Modeling Wave Overtopping on a Seawall with XBeach, IH2VOF, and Mase Formulas
by
 , and
, and
João Nuno C. Oliveira
1,2,*, 
Filipa S. B. F. Oliveira
2,
Maria Graça Neves
2,
María Clavero
3 and
António A. Trigo-Teixeira
1 1
CERIS, Instituto Superior Técnico, Av. Rovisco Pais 1, 1049-001 Lisbon, Portugal
2
Laboratório Nacional de Engenharia Civil, Departamento de Hidráulica e Ambiente, Av. do Brasil 101, 1700-066 Lisbon, Portugal
3
Andalusian Institute for Earth System Research, University of Granada, Avda. del Mediterraneo, s/n, 18006 Granada, Spain
*
Author to whom correspondence should be addressed.
Water 2020, 12(9), 2526; https://doi.org/10.3390/w12092526
Submission received: 24 July 2020
/
Revised: 3 September 2020
/
Accepted: 8 September 2020
/
Published: 10 September 2020
(This article belongs to the Special Issue Dynamics and Biogeochemical Flows in Estuarine and Nearshore Systems)
Abstract
:The advances in computational fluid dynamics have made numerical modeling a reliable complementary tool to the traditional physical modeling in the study of the wave overtopping phenomenon. This paper addresses overtopping on a seawall by combining the numerical models XBeach (non-hydrostatic and Surfbeat modes) and IH2VOF, and the Mase formulas. This work is structured in two phases: (i) phase I assesses the performance of numerical models and formulas in modeling wave run-up and overtopping on a seawall for a solid profile bottom and representative hydro-morphologic conditions of a study site in the Portuguese west coast; (ii) phase II investigates the effect of the profile bottom variation in the overtopping phenomenon for extreme maritime storm field conditions of the study site, considering a solid bottom and a varying sandy bottom. The results indicate that XBeach underestimates the wave energy, and the frequency and intensity of the overtopping occurrences predicted by IH2VOF; the numerical models’ run-up and overtopping discharge predictions are overestimated by the Mase formulas, in simplified and in storm field conditions; and the variation of the bottom morphology throughout the storm event greatly influences the XBeach predictions, while the Mase results are mostly influenced by the bottom roughness.
1. Introduction
The coastal region, as a critical resource for human activity, endures an ever-increasing land use pressure. Many populations are exposed to coastal erosion, wave attack, and flooding, and rely on the performance of coastal defense structures for protection. These hazards tend to aggravate due to the climate change induced sea level rise and expected increase of maritime storm frequency and intensity [1]. There is a need for a better understanding of the complex coastal dynamics and adaptation to climate change in order to uphold coastal protection in the future and guarantee a safe use of the coastal region.
Numerical modeling is nowadays essential to predict the complex hydrodynamic and morphological behavior of the nearshore and improve the effectiveness of coastal protection solutions. These models can be used as predictive tools in the scope of coastal management, to reduce the negative consequences of erosion, overtopping and overwash, and assess hotspots that need improvements regarding coastal defense interventions [2]. The modeling of the hydro-morphodynamic coastal processes has greatly improved in the last decades, even though knowledge on the behavior of these models under highly energetic environmental conditions is still lacking [3].
The XBeach hydro-morphodynamic process-based numerical model application [4], for simplified coastal defense schemes, proved that it is capable of identifying the overall hydro-morphodynamic driving processes and allows the sensitivity assessment of certain parameters for the environmental test conditions [5,6]. Several recent one-dimensional (1D) and (quasi-) two-dimensional (Q2D) model applications in energetic environments, such as the Portuguese west coast [7,8], have brought new insight on the processes involved in the sea-structure-sediments interactions and how they affect the local morphodynamics. The quantification of how these effects vary with the hydrodynamic and geomorphologic characteristics of the coastal environment was built upon the consolidated knowledge on modeling approaches of the nearshore dynamics [9,10,11]. A recent study performed by [12], regarding the 1D and Q2D XBeach hydrostatic model performance for bed morphology evolution, revealed overall Brier Skill Scores that indicate similar performance of Q2D and 1D simulations in the inter-tidal and shoreline area, under storm conditions comparable to [7,8]. Still, as is the case for these applications and as collected by [2], most of the model validation studies regarding wave run-up and overtopping have been limited to the scope of morphological changes comparison (e.g., [13,14,15,16]). The XBeach applications to demonstrate the model ability to reproduce the hydrodynamic processes in detail have been very few (e.g., [17,18,19]).
The IH2VOF hydrodynamic model has been applied to predict wave run-up and overtopping in a wide range of cases, including coastal structures [20], vertical breakwaters [21], and other ocean structures [22]. Empirical formulas based on physical model tests (e.g., [23]) have been widely used to predict wave run-up and mean overtopping discharge due to their swiftness of use and low cost. The application of these formulas can, however, be limited by the specific geometry of the structure at the risk of compromising the results due to extrapolation. Formulas such as the Mase formulas [23] are applicable for random wave run-up on a solid bottom, in land or very shallow water, and use the deep-water wave characteristics considering an imaginary uniform slope, enabling their application for prediction of wave overtopping on seawalls. The Mase formulas have been used recently to analyze overtopping on coastal structures at Costa da Caparica beach, in Portugal [24].
The limitations in the use of numerical modeling tools are mostly associated with the computational complexity in simulating real scale field conditions and the availability of in situ data [2]. Despite many existing experimental results, field data regarding storm hydrodynamic and morphodynamic conditions are still needed for model validation at the prototype scale [2,25]. Field measurements during storms are scarce and difficult to obtain due to the constraints inherent to the forcing energetic coastal conditions. However, reliable models that simulate overwash can be helpful in obviate the field data scarcity (e.g., [26]), especially during storm conditions, when wave attacks are prone to cause overtopping of the coastal defense structures.
Recent studies on run-up and overtopping prediction using process-based models and empirical formulas have reported the ability of each of these tools to model these phenomena (e.g., [27,28,29,30]). Hydro-morphodynamic models such as XBeach [4], and hydrodynamic models such as IH2VOF [31], take into account the evolution, in time and space, of the local physical mechanisms involved in the coastal hydro-morphodynamics and hydrodynamics, respectively. Compared with empirical formulas such as the Mase formulas [23], the last were derived based on the parametrization of the observed physics for a narrower range of conditions, therefore, their application is most of the time constrained to simplified conditions of the local physics. As described by [2], if the dominant physical relations are well described, the use of process-based models can deliver improved results over empirical models and extend their range to a wider variety of application conditions. The disadvantage of using the above numerical models is that they have a considerable computational cost and higher input data requirements of calibration in comparison to the Mase formulas, which provides more expedite results. In the absence of field measurements, the modeling results can be validated against reduced-scale physical models and compared with expedite empirical and semi-empirical formulas, allowing a more flexible and robust validation process, and better comprehension of the processes involved in wave overtopping.
The prediction of wave overtopping is crucial to ensure the safety of coastal populations, especially as a design factor for coastal defense structures. Thus, the current research work is motivated by the lack of wave overtopping modeling studies addressing both: (i) the implications of using alternative methodologies to predict the occurrence of the phenomenon on a seawall, and (ii) the effect of the bed profile morphodynamic changes on wave run-up and overtopping. The two-phase approach adopted in this work starts by modeling pre-designed wave overtopping conditions using the XBeach hydro-morphodynamic model [4], the IH2VOF hydrodynamic model [31], and semi-empirical Mase formulas [23], and assessing their performance. The effect of the bottom evolution in wave overtopping is then evaluated for storm field conditions of the study site, using XBeach and the Mase formulas.
The two most relevant features differing in the numerical models are the mutual interactions between the hydrodynamics and the morphodynamics of the sandy bottom accounted for in XBeach and the possibility to model disconnected fluid areas over a solid bottom in IH2VOF, which allows a more precise modeling of the wave breaking phenomenon associated to overtopping. The Mase semi-empirical formulas link wave run-up and overtopping, meaning the wave overtopping is established using run-up prediction formulas, that can be applied to field conditions and in very shallow waters. The combined application of the models and formulas under the same representative conditions for a study site in the Portuguese west coast allows a clearer understanding of coastal defense response to wave overtopping, as well as each method’s practical limitations and advantages in modeling the overtopping phenomenon.
The paper is structured as follows: Section 2 briefly describes the methodology used, Section 3 is devoted to the analysis of the results, Section 4 includes the discussion, and finally Section 5 gives the conclusions.
Study Site
The Portuguese west coast is one of the most energetic and dynamic coastal regions in Europe [32,33]. Most of the country’s urbanized marine fronts have been protected with coastal defense structures, such as groins and seawalls, since the 1970s, as is the case of Cova-Gala, the study site [34,35]. However, the rise of the mean sea level and the expected increase of frequency and intensity of maritime storms [1], added to the propagation of a southward erosive trend with large time and space scales, predominantly due to the lack of sediment supply [35], are factors that increase the shore exposure to erosion and wave overtopping, which leads to flooding and inundation [8].
Cova-Gala is located south of the Mondego river mouth in Figueira da Foz (40°8′45″ N and 8°52′42″ W), in the west coast of Portugal (Figure 1). The study site is characterized by a highly energetic wave climate with high interannual and seasonal variations, combined with a meso-tidal regime with an amplitude of almost 4 m. The average Hs (wave significant height) is 2.15 m and the average Tp (peak period) is 11.6 s, being 40% of the Hs occurrence greater than 2 m. The reference potential sediment drift average is 1 million m3/year southwards [33,35,36].
To protect this maritime front and reduce the generalized beach erosion verified after the construction of the Mondego river mouth jetties in the 1970s, a combined groyne field and seawall defense scheme was built. In contrast to the sediment accumulation at the updrift side of the river mouth’s north jetty, extended in 2008–2010, the southern beaches face serious erosion problems, particularly troublesome in Cova-Gala [8,33,35,36]. The seawalls, alongshore coastal defense structures, are located in backshore of a narrow beach, which, despite being emerged during the summer season, when it has an intense recreational and bathing occupation, becomes totally submerged under storm conditions that occur mostly between December and March [33]. In recent years the beach protection has been complemented with regular nearshore nourishment operations, using sediments from the river mouth, and, in 2019, with the placement of a geotextile tube revetment in the southern beach stretch, the area most affected by the severe erosion, along with dune nourishment.
2. Materials and Methods
This work was structured in two phases. In phase I, to assess the implications of using alternative methodologies to predict wave overtopping, the XBeach Non-hydrostatic and IH2VOF models and the Mase semi-empirical formulas were used. The same schematic solid bottom beach profile and compatible model setup conditions were considered. Overtopping was assessed in two cases of distinct hydrodynamic forcing–combined incident wave and sea level conditions: case I.NO, designed for the non-occurrence of overtopping; and case I.O, where the phenomenon is intended to occur. The results were compared for the free surface elevation along the model domain, wave run-up, and overtopping discharge. Phase II investigated the effect of the profile bottom variation in the overtopping phenomenon for extreme maritime storm field conditions of the study site, using the XBeach Non-hydrostatic model and Mase formulas. The results interpretation was supported by the discussion and conclusions of phase I, used as the benchmark. A real storm event with synoptic wave and sea level conditions (96-h series) was considered as the hydrodynamic forcing, and the same initial beach profile was considered in two cases: case II.SP—solid bottom profile, where the profile bottom was kept steady throughout the storm event; and case II.VP—varying sandy bottom, where the XBeach Surfbeat model was applied to calculate the sandy beach profile update after each 24-h period of the storm induced morphological evolution, results that were then used sequentially as input for the XBeach Non-hydrostatic model and the Mase formulas. The results were compared for the maximum wave run-up time series and overtopping discharge.
This section presents a description of the applied numerical models XBeach and IH2VOF and Mase formulas, and, for each phase, the topo-bathymetric and hydrodynamic data used, and the methodological approach considered.
2.1. XBeach, IH2VOF and Mase Formulas
2.1.1. XBeach Hydro-Morphodynamic Model
XBeach is an open-source hydro-morphodynamic model [4], originally developed by UNESCO-IHE, Delft University of Technology, Deltares and the University of Miami, within the MORPHOS-3D framework, after the hurricane seasons of 2004 and 2005 in the USA. It was developed to assess the natural coastal response to time-varying storm and hurricane conditions by solving coupled 2D-Horizontal momentum equations, and designed to reproduce the different storm regimes, as described by [37], focusing on relatively small spatial scales and short temporal scales. Computing the balance between onshore sediment transport by wave skewness and asymmetry and offshore transport by the return flow, it contains the essential processes to model wave run-up, dune erosion, overwashing, and breaching [4].
The functionality of XBeach is divided among several modules, called in a specific sequence during a single numerical step. The model uses a rectilinear, non-equidistant, staggered grid. It starts with the wave module, applying a non-stationary long wave flux at the boundary. Short wave transformation is derived from a time-dependent version of the wave action balance equation of Delft University’s (stationary) HISWA model [38]. The roller energy balance is coupled with the wave action, where dissipation of short-wave energy serves as a source term for the roller energy balance [39]. Both the wave action balance and the roller energy balance result in a spatial distribution of wave energy. This distribution can, according to the linear wave theory, be used to calculate the gradients in radiation stress. Thus, two contributions to the radiation stress are considered: the roller-induced and the wave-induced. A flow module then uses the changes in radiation stress to solve the propagation of the short-wave envelope and the non-stationary shallow water equations. The Generalized Lagrangian Mean (GLM) formulation [40] makes it possible to take into account the wave-induced mass-flux and the return current in shallow water via a depth averaged formulation. The obtained surface elevation and velocities are used to model sediment transport, using a depth-averaged advection diffusion equation [41]. The equilibrium sediment concentration, necessary to solve the sediment transport equations, can be calculated using the default extended transport formulation of [42], or any other of the available formulations [43]. The bed level update is then computed in the morphology module, as a result of the gradients in sediment transport. Morphology can be turned on or off, running XBeach as a hydrodynamic or a hydro-morphodynamic model, respectively. A comprehensive description of the model and the formulations used in each module can be found in the user manual of XBeach [43].
Since the model’s original development, several improvements have been implemented in new releases, which resulted in the three different modes presently available. The Stationary mode solves the wave-averaged equations but neglects infragravity waves. The Surfbeat mode solves the short-wave variations on the wave group scale and the associated long waves, currents, and morphological changes are solved separately. This saves considerable computational time, at the expense of not simulating the short-wave phase. It is the most used mode when the focus is on swash zone processes and has been extensively validated for the morphological evolution modeling of dissipative beaches, where the short waves are mostly dissipated upon reaching the shoreline. The wave-resolving non-hydrostatic mode is more complete, solving all processes, including short and long wave motions, with a greater computational demand. It combines the non-linear shallow water equations with a pressure correction term, modeling the propagation and decay of individual waves. As a result, it accounts for wave diffraction and reflection and undertow by turning on the newly implemented reduced two-layer mode (nonhq3d). This option improves the accuracy in modeling the frequency dispersion of the non-hydrostatic model due to the additional layer in comparison to the depth-averaged formulation.
Based on the above fundamentals, the following XBeach modes-versions were applied: (i) for a suitable hydrodynamic model application in the analysis of the overtopping phenomenon in phases I and II, the morphological evolution was turned off and the more complete non-hydrostatic mode of the latest XBeachX version of the model was used [44]; (ii) for a suitable modeling of the morphodynamics and resulting sandy bottom update in phase II, the Surfbeat mode of the Kingsday XBeach version of the model was used [4]. This version is more adequate for morphological evolution modeling of dissipative sandy beaches due to the extensive sediment transport formulations, and less demanding computational requirements.
2.1.2. IH2VOF Hydrodynamic Model
IH2VOF is a two-dimensional hydrodynamic model developed from the University of Cantabria COBRAS-UC model, used for modeling wave-structure interactions. The original model, COBRAS (Cornell Breaking Waves and Structure), was developed at the University of Cornell to describe the flow inside and outside coastal structures, including permeable layers [45,46]. Using a finite-difference method, it solves the 2DV Reynolds Averaged Navier–Stokes (RANS) equations on a structured grid. A nonlinear turbulence model κ-ε, for the turbulent kinetic energy κ and its dissipation rate ε, is included via a set of volume-averaged turbulence balance equations [46,47]. The free surface movement is tracked by a volume of fluid (VOF) free-surface movement tracking method for one phase only, water and void [31]. The model is hybrid domain-based and solves the RANS equations at the clear fluid domain and the Volume-Averaged RANS (VARANS) equations to obtain the flow inside the porous media, using the Forchheimer relation, generalized to nonstationary and variable flows [46,48]. The possibility to model disconnected fluid areas in IH2VOF is a relevant advantage of the model because most types of wave breaking, such as plunging, lead to separation of the wave water surface. By modeling disconnected fluid areas, wave breaking is better represented, consequently allowing a more precise modeling of the overtopping phenomenon.
The present version improvements overcome some of the original model limitations regarding the wave generation process, the code optimization, the graphical user interface (GUI), the input and output data definition, and processing programs. The model has been extensively validated for several applications for low-crested structures [31,49,50], wave breaking over porous and impermeable slopes [31,46,51], overtopping on rubble mound breakwaters and low-mound breakwaters [50,52], and surf zone hydrodynamics on natural beaches [53]. It has also been verified through several physical modeling studies [50,54]. Further model details and information regarding the model calibration and recommended values can be found in these references.
2.1.3. Mase Formulas
The empirical formulas proposed by Mase can be used to predict both random wave run-up and mean overtopping discharge on seawalls constructed on land or in very shallow water [23]. After the compilation of wave run-up and overtopping formulas by several authors, the Mase formulas adopt the deep-water wave characteristics as input and the concept of an imaginary uniform slope to evaluate the surf similarity parameter. The run-up prediction formulas are based on two sets of experimental data [23,55], and the values used in the overtopping prediction formulas are based on experimental data carried out in a wave flume [56].
The set of formulas presented in Table 1 were used for the prediction of wave run-up and mean overtopping discharge according to the respective applicability conditions [23,57]. In this table, Ho is the offshore significant wave height determined by the frequency analysis, Lo = gT2/(2π) is the offshore wave length computed using the offshore significant wave period T = T1/3 and the gravitational acceleration g, h is the depth, RC is the seawall crest height above the still water level (SWL), α is the angle of the structure with the horizontal plane, q is the average overtopping flow, R# is the run-up exceeded by #% of the incident waves, and (Rmáx)#%,100 is the maximum run-up no exceeded in #% of the storms represented by 100 waves.
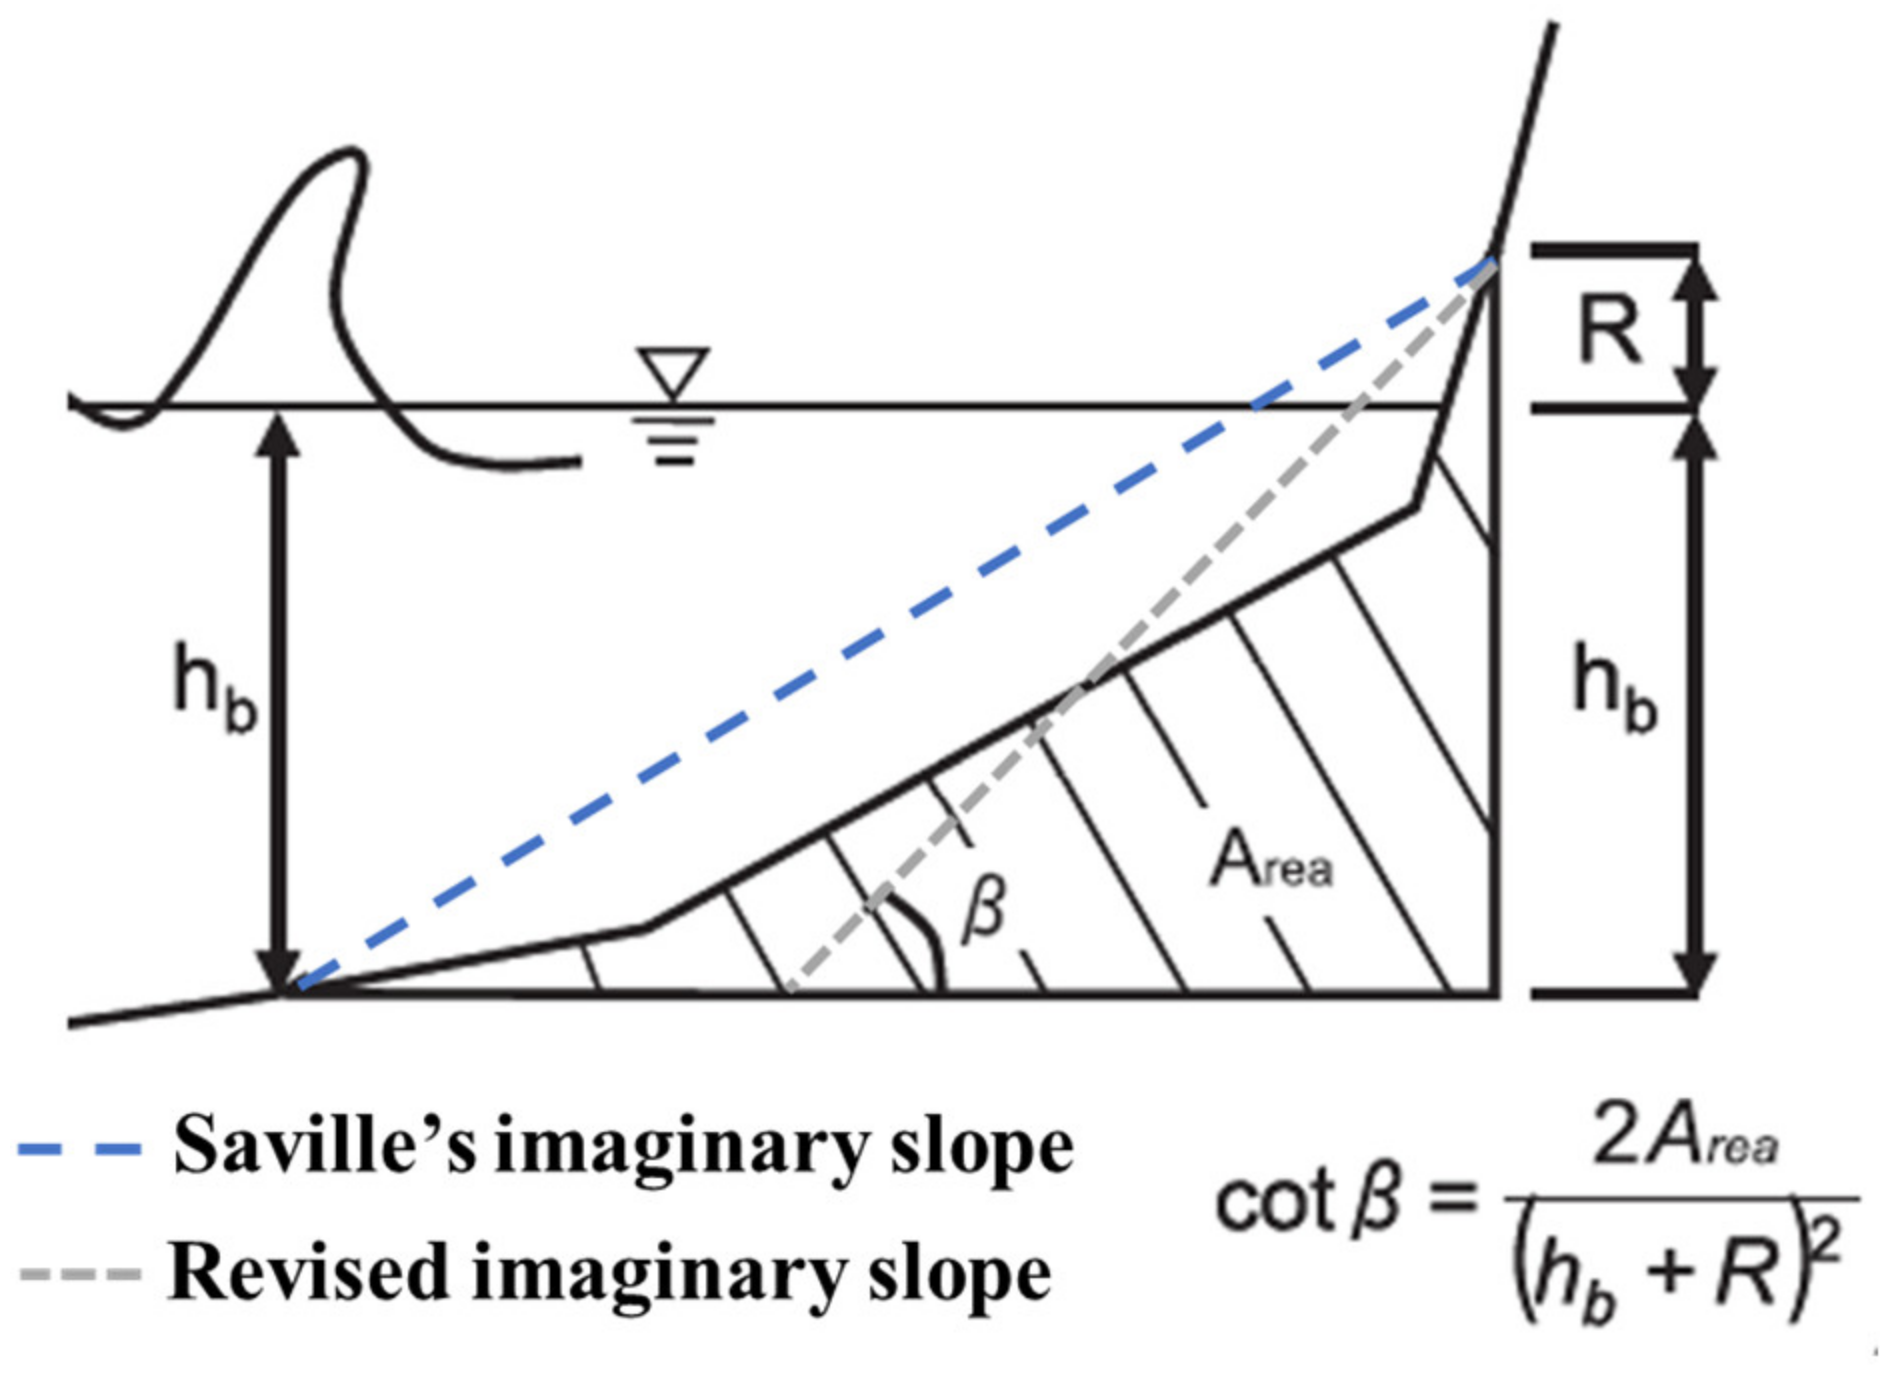
The imaginary slope concept is presented in Figure 2 and was initially proposed by Saville to account for the variability of the seawall slopes [58]. The slope is defined by a line that connects the point in the sea bottom where the wave breaks, and the limiting point of the wave run-up.
Since the imaginary slope is necessary to compute the run-up and vice-versa, the calculation is an iterative process. Equation (10) represents the imaginary slope, where Area is the cross-shore area of the structure and the beach profile between the wave breaking point and the wave run-up limit, R is the run-up considering irregular waves. The wave breaking depth hb is defined as the water depth at which the significant wave height becomes 7% smaller that obtained without an energy dissipation term in the model of [59].
tan β = (hb + R)2/(2*Area)
According to the overtopping manual [60], in the case of a permeable/rough seawall slope, a correction coefficient to reduce spreading (γf) is applied to R# and (Rmáx)#%,100 and the final run-up values, respectively γf*R# and γf*(Rmáx)#%,100, are instead used in the computation of Equation (5). The necessary data for the application of the Mase formulas are the wave characteristics, the sea level, and the geometry of the beach profile and the structure.
2.2. Phase I—Performance of Alternative Methodologies for Overtopping Assessment
2.2.1. Topo-Bathymetric Conditions
The topo-bathymetric characteristics adopted are representative of Cova-Gala. The XBeach model and the Mase formulas were applied at the prototype scale. The IH2VOF model was applied at a reduced scale, using a scale factor of 34.5. This allows the comparison with physical model tests planned to be done in the future. The differences in results of doing prototype or small-scale simulation with IH2VOF were tested and are negligible.
The 450 m long cross-shore profile was a schematic representation of a beach profile located in one of the groyne field cells, limited by a seawall at the backshore. At the prototype scale, the profile consisted of a 210 m flat bottom starting from the offshore boundary of the computational domain, followed by a slope of 0.10 in the submerged profile for 210 < x < 383 m, a slope of 0.083 in the beach face for 383 < x < 416 m, a seawall with a slope of 0.5 for 416 < x < 429 m and a smooth landwards sloping crest 26.22 m above the profile flat bottom (Figure 3). For both cases, I.NO and I.O, the bottom was considered solid and impermeable.
2.2.2. Hydrodynamic Conditions
The models were forced with the same hydrodynamic conditions, different for each case. At the prototype scale, in case I.NO, a regular wave with H = 4 m and T = 12 s was generated at the offshore boundary. The still water level (SWL) was set at 17.25 m above the bottom of the profile at the offshore boundary (Figure 3), corresponding to the level of slope transition between the submerged profile and the beach face, at x = 383 m. The same regular wave characteristics and SWL were used as input for the Mase formulas. In case I.O, a JONSWAP spectrum with the parameters Hs = 8 m, Tp = 12 s, peak enhancement factor γ = 3.3 and directional spreading coefficient s = 5 was generated in XBeach and imported into IH2VOF as the water surface elevation, η, time series at the numerical boundary, guaranteeing equal hydrodynamic forcing in the models when using a random phase wave spectrum. The SWL was set at 20 m above the profile flat bottom (Figure 3), corresponding to the level of the seawall toe, at x = 429 m. The input for the Mase formulas consisted of the same wave characteristics as considered for the numerical models’ spectrum generation, and the same SWL.
2.2.3. Methodological Approach
For the XBeach model setup in phase I, a weakly reflective type boundary condition (absorbing-generating) was imposed at the offshore boundary and a Warming and Beam scheme was used. The bottom was considered as a structure via a non-erodible layer to guarantee the compatibility with IH2VOF, which allowed the direct definition of the profile behavior as a non-porous and impermeable media. Several uniform grid spatial resolutions were tested. The grid resolution values of 0.2070, 0.1725, 0.1380, and 0.1035 m were analyzed for XBeach at the prototype scale, corresponding to 0.0060, 0.0050, 0.0040, and 0.0030 m, respectively, for IH2VOF at the model scale. The best processes’ resolution and computational effort balance was achieved for a spatial resolution of 0.1380 m at the prototype scale, corresponding to 0.004 at the model scale, according to the sensitivity analysis results for the models’ performance. Thus, the resolutions dx = 0.138 (prototype) and 0.004 m (reduced scale) were adopted, respectively, in XBeach and IH2VOF.
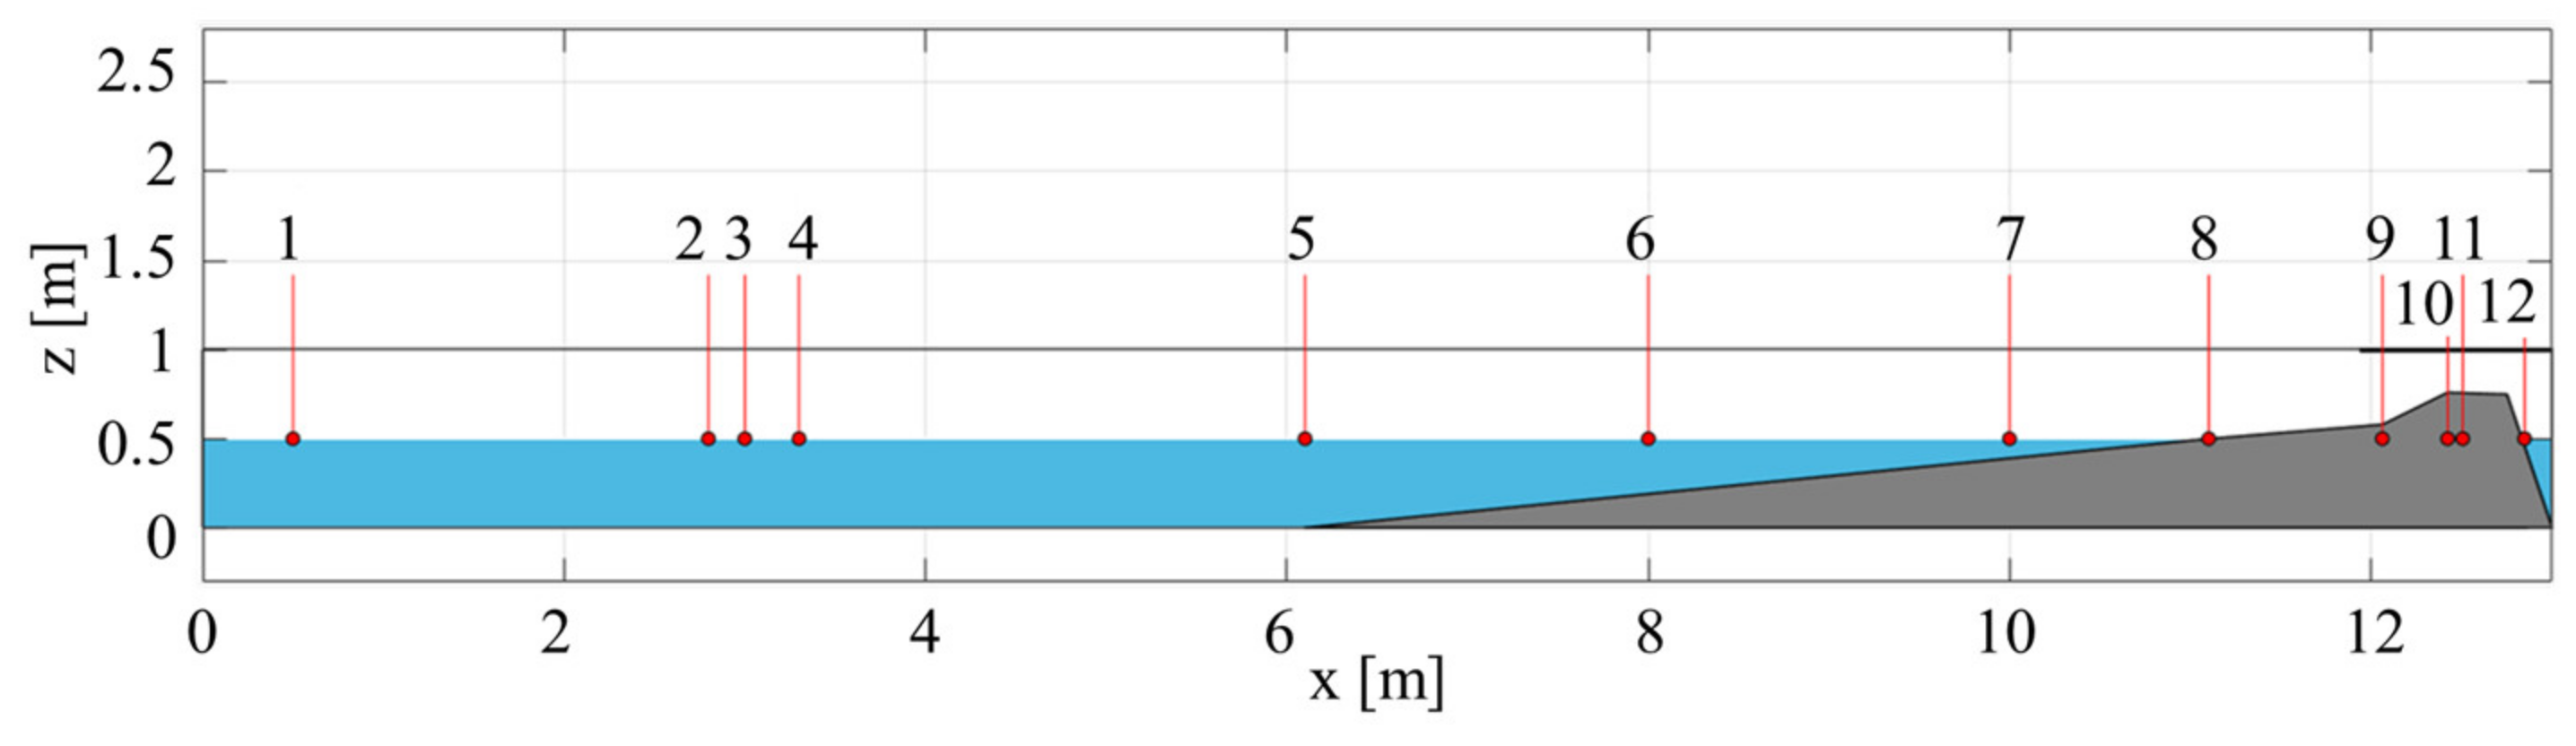
Twelve gauges were considered in the same position of the modeling domain in both models, to allow a proper calibration and analysis of the results, as can be seen in Figure 4 at the reduced scale. In case I.NO, the maximum wave steepness criterion (maxbrsteep parameter) in XBeach was calibrated by comparing the η time series obtained in gauge 1 (x = 17.25 m at the prototype scale) with the time series obtained in IH2VOF. This parameter was kept constant for the simulation of case I.O. A warm-up period of seven waves was considered for both models and the η and wave run-up were analyzed for the subsequent 20 waves in case I.NO. In case I.O, overtopping was assessed for a period of 50 waves. For the Mase formulas application, the same topo-bathymetric and hydrodynamic conditions were considered. The maximum run-up, not exceeded in 99% of the incident waves and the run-up exceeded by 2% of the incident waves, as well as the mean overtopping discharge that occurs when the maximum run-up exceeds the seawall freeboard were obtained. If the slope of the sea defense structure was rough/permeable, according to the overtopping manual [60], a correction coefficient to reduce spreading (γf) was applied to the maximum and 2% run-up. Since there was no overtopping of the seawall in case I.NO, the wave run-up was compared for the two models and the Mase formulas. In case I.O, the η and the horizontal velocity in gauge 10 were used to calculate the overtopping discharge in the numerical models and the results were analyzed and compared with the Mase formulas results.
2.3. Phase II—Effect of Bed Morphodynamics on Wave Overtopping
2.3.1. Topo-Bathymetric Conditions
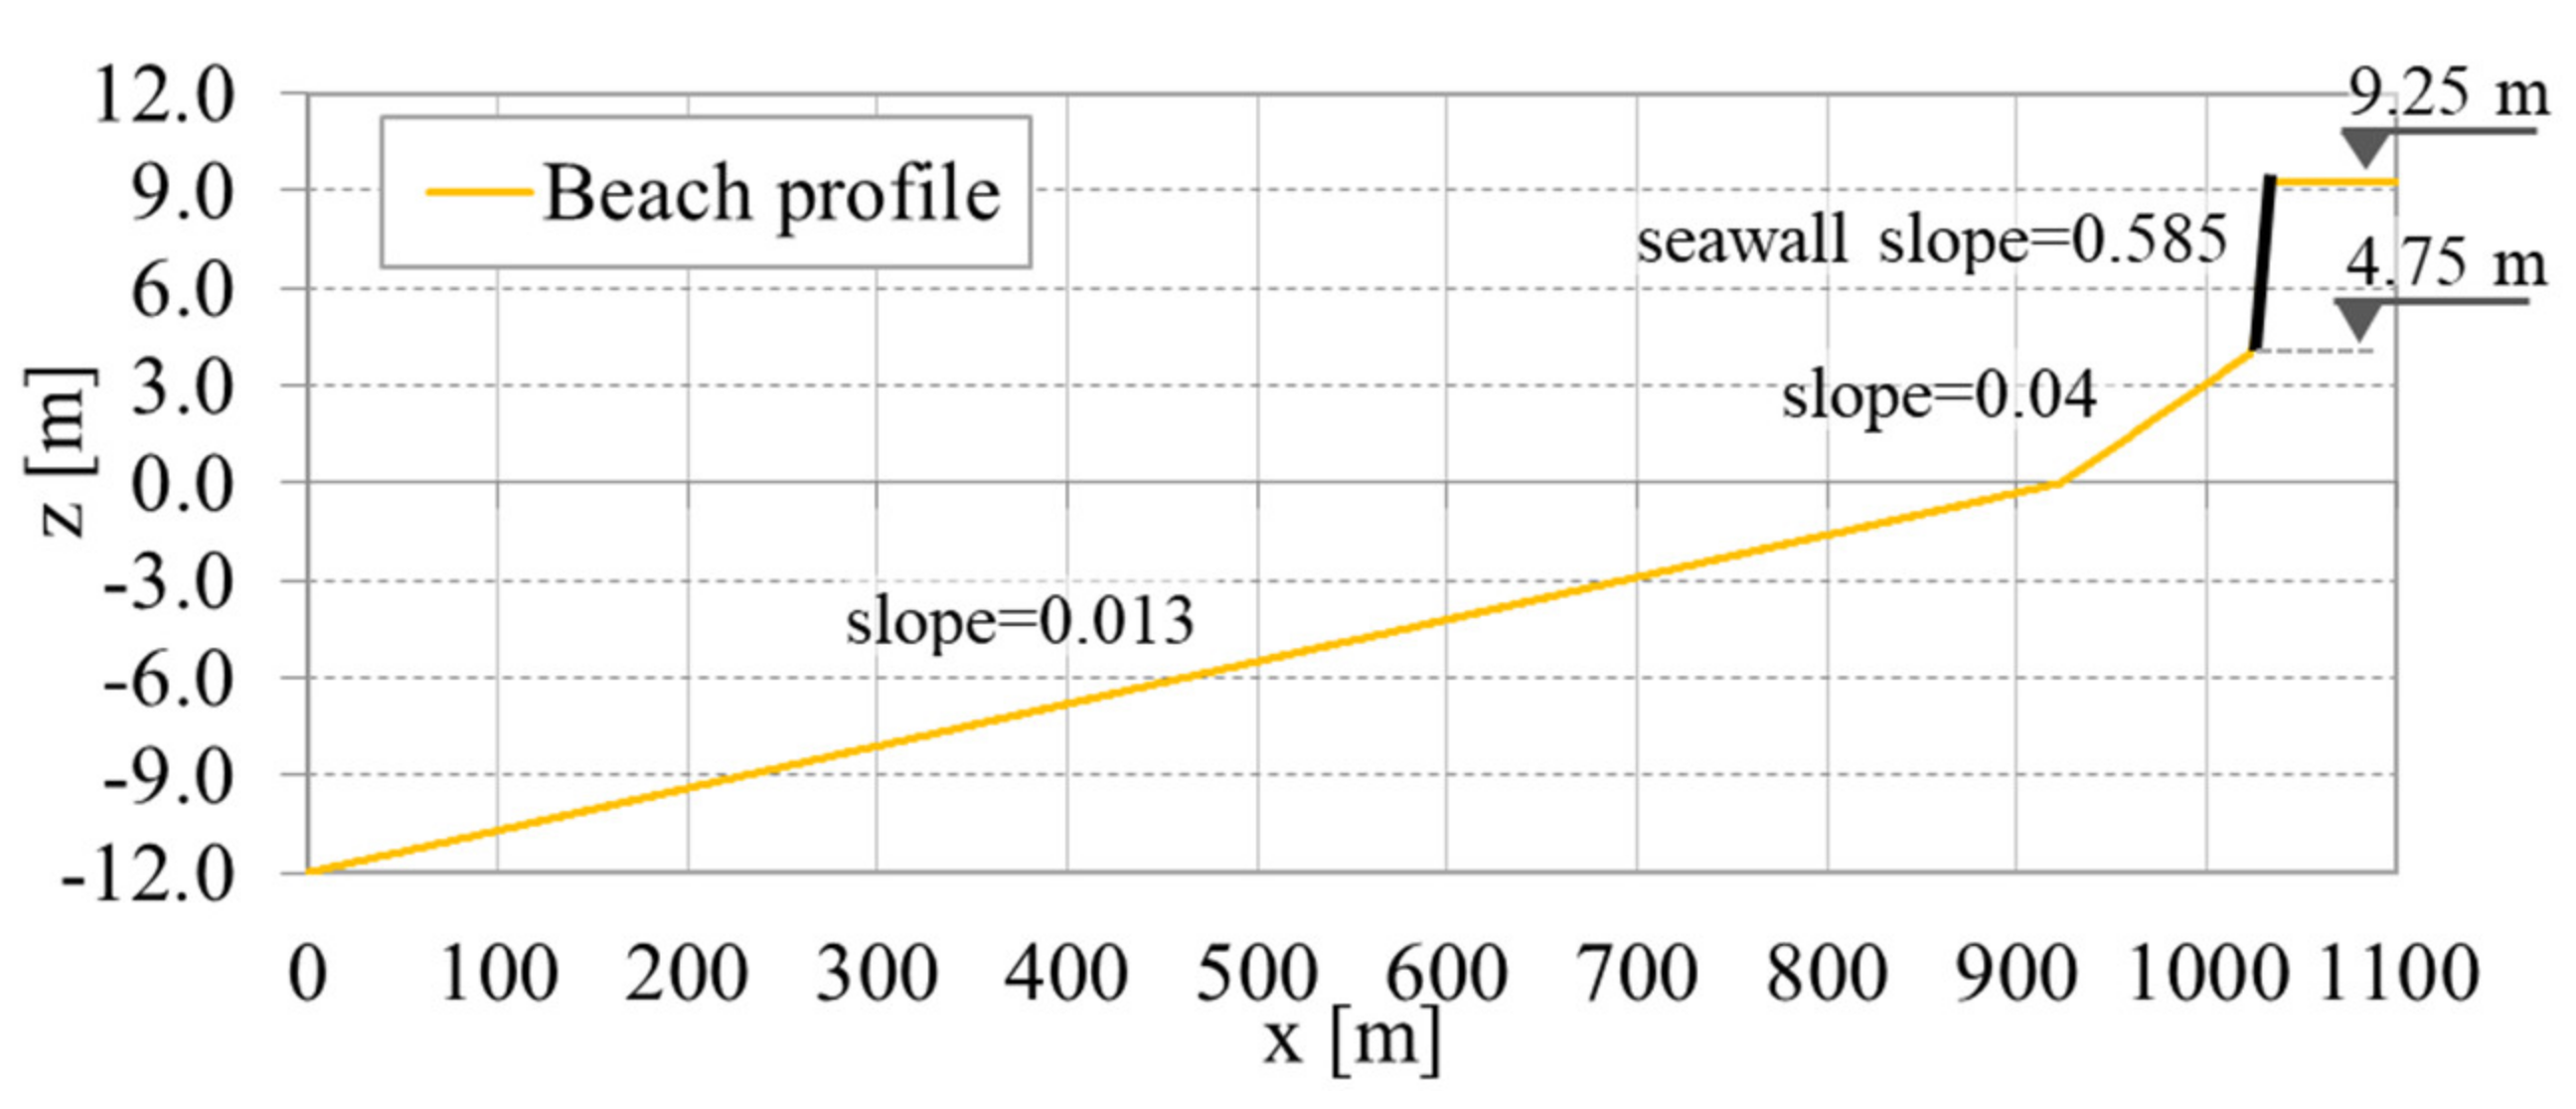
The topo-bathymetric characteristics adopted as the real scale initial beach profile, for the numerical model implementation and the Mase formulas application, were representative of Cova-Gala as defined by [61]. The beach profile consisted of three slopes: (i) 0.013 in the submerged profile, between 12 m below the vertical chart datum reference level (ZH) and ZH; (ii) 0.04 in the beach face, between ZH and 4.75 m above ZH; and (iii) 0.585 in the seawall, between 4.75 and 9.25 m above ZH (Figure 5). In case I.NO the profile was considered to have a solid bottom, whereas in case I.O the profile sandy bottom was allowed to vary in response to hydrodynamic action until the toe of the seawall. The sediment size characteristics representative of the sandy bottom of the study site were considered uniform: sand with median and 90th percentile diameter d50 = 0.30 mm and d90 = 0.50 mm [36].
2.3.2. Hydrodynamic Conditions
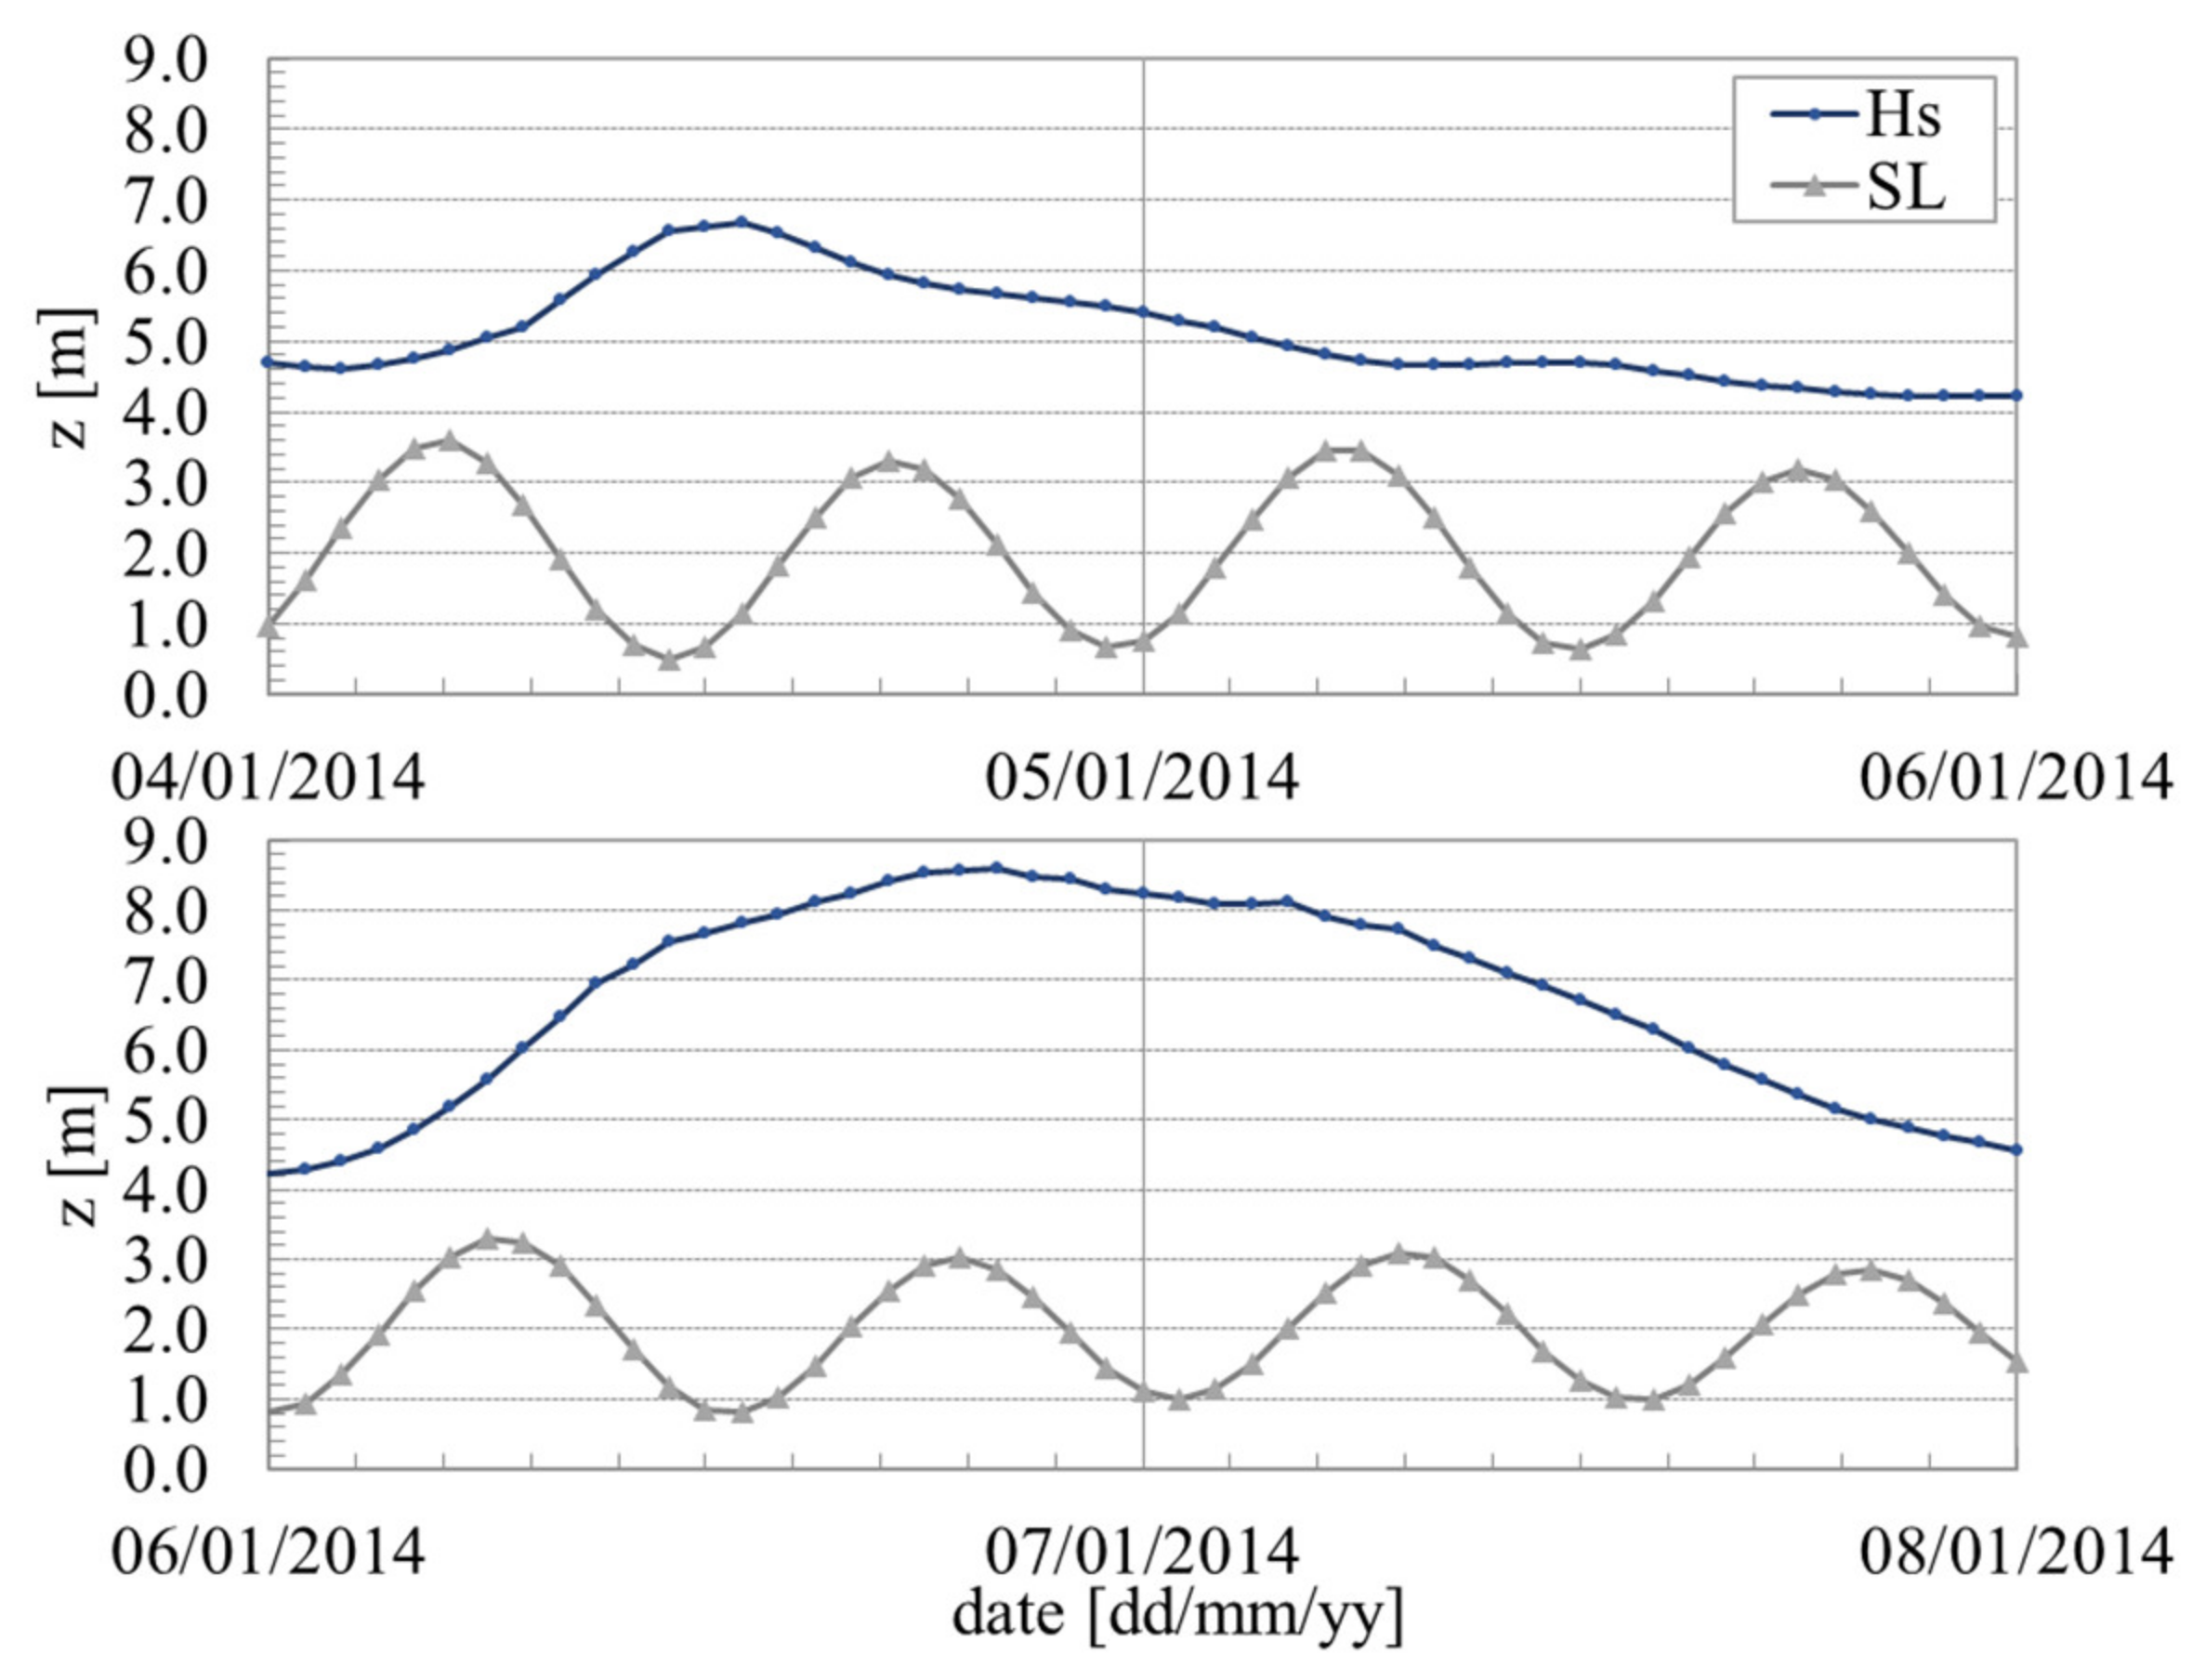
In phase II, the hydrodynamic conditions of the Hercules storm, January 2014 [62,63], were considered for the XBeach numerical model forcing and the Mase formulas application, in both cases I.NO and I.O. A four-days period of the storm was considered from 04/01/2014 00h00 to 08/01/2014 00h00. The hindcast wave dataset offshore of the study site was provided and validated by Puertos del Estado, for the SIMAR point 1,044,060 (40° N, 9° W) at −37 m ZH, and was transferred through numerical modeling to the topo-bathymetric profile limit at −12 m ZH. A synoptic sea level (SL) time series for Figueira da Foz was considered, provided by the University of Lisbon dataset (https://webpages.ciencias.ulisboa.pt/~cmantunes/hidrografia/hidro_mares.html), validated with the Figueira da Foz tide gauge. Figure 6 shows the Hs and SL time series for the four-days period considered.
2.3.3. Methodological Approach
For the XBeach model setup in phase II, a weakly reflective type boundary condition (absorbing-generating) was imposed at the offshore boundary and a uniform grid spatial resolution of dx = 1 m was considered. The seawall presence was simulated via a non-erodible layer in the upper profile as specified in Figure 5, and no morphodynamic acceleration factor was considered during the simulation period in both cases. The wave and SL time series were applied at the offshore boundary to force the XBeach Non-hydrostatic and Surfbeat models and were used as input for the Mase formulas application, in both cases, II.SP and II.VP. The Mase formulas were applied considering γf values of 1 for case II.SP (impermeable slope, no correction for run-up) and 0.8 for case II.VP (permeable/rough slope).
In case II.SP, a unique solid bottom profile, the initial profile, was considered throughout the storm event for the XBeach non-hydrostatic hydrodynamic modeling and Mase formulas application. In the numerical model, a Warming and Beam scheme was used, and the morphological evolution was turned off.
In case II.VP, four different profiles were considered at the start of each 24-h period of the 96-h storm event: (i) a beach profile at the start of the storm, 4 January 2014 00h00, corresponding to the profile used in case II.SP; (ii) a profile after 24 h of the storm induced morphological evolution, 5 January 2014 00h00; (iii) a profile after 48h, 6 January 2014 00h00; and (iv) a profile after 72 h, 7 January 2014 00h00. The profiles after 24, 48, and 72 h of morphological evolution were computed using the Surfbeat mode of the XBeach numerical model, with a second order upwind numerical scheme and the advanced default model parameter values recommended by the developers [4]. These four profiles were then used sequentially as input for the XBeach Non-hydrostatic hydrodynamic modeling and the Mase formulas application in case II.VP. The maximum wave run-up time series obtained using the numerical model and the empirical formulas were compared, and several run-up and overtopping statistical parameters were computed and analyzed in both cases.
3. Results
3.1. Phase I—Performance of Alternative Methodologies for Overtopping Assessment
3.1.1. Case I.NO
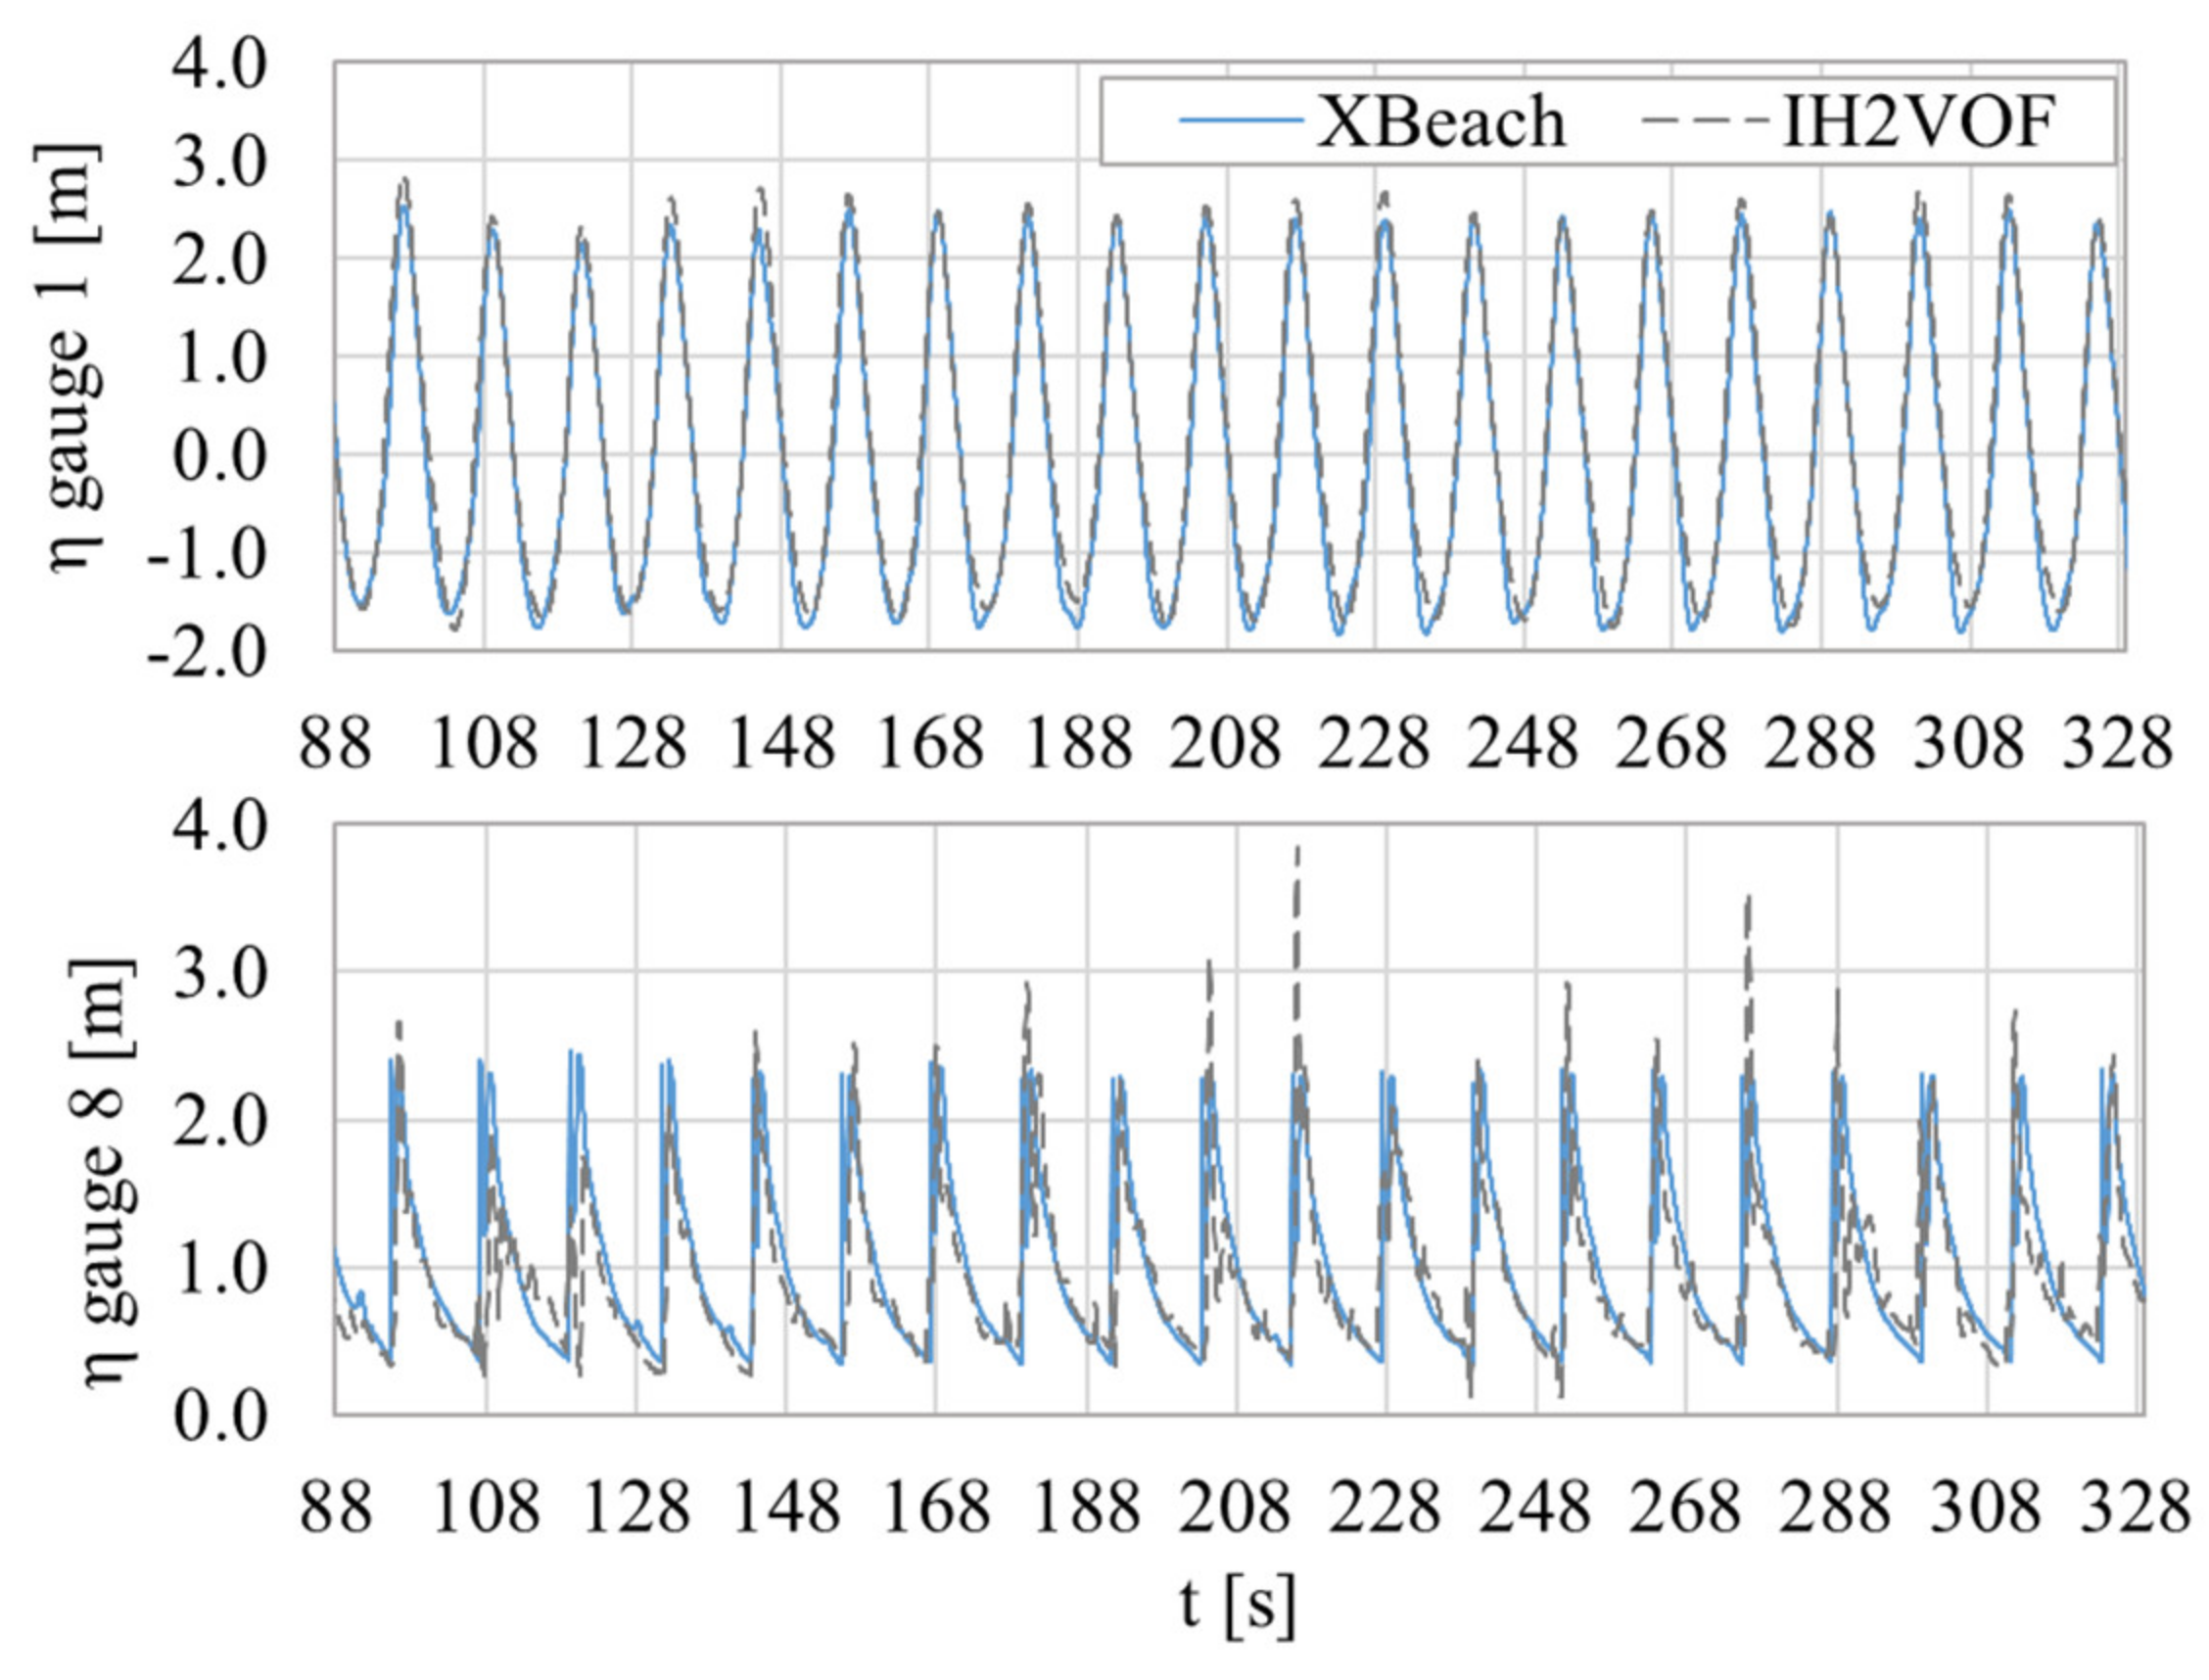
In the case designed for the non-occurrence of overtopping, the surface elevation η and the wave run-up time series obtained using XBeach and IH2VOF were analyzed and the run-up statistical parameters were computed and analyzed for both models and the Mase formulas. The results are presented at the prototype scale. The numerical models were forced with a regular wave and the SWL set at the 0.10 to 0.083 slope transition vertical level. The η variation obtained in gauges 1 and 8 using XBeach and IH2VOF, considering the SWL as reference, is depicted in Figure 7 for a period of 240 s, encompassing 20 waves. The statistics relating the η time series obtained in the two models are presented in Table 2.
The bias and the root mean square error (rmse) were calculated for gauges 1 to 8. For the calculation of these error indicators, the η time series obtained with IH2VOF was considered to be the reference value, that is, the most precise model prediction. The rmse values (Table 2) were low in most of the model domain, indicating that the η predictions obtained with both models were similar, especially in the extension where the wave shape was less affected by the profile bottom, before reaching gauge 7. For the same hydrodynamic forcing, η was negatively biased, meaning that XBeach underestimated the wave energy during the wave propagation process, in comparison to IH2VOF.
In gauges 1 to 6, the η displacements were more significant in the wave troughs and lower levels are obtained in XBeach, with average values of bias = −0.15 m and rmse = 0.24 m. Such reduces the probability of the occurrence of wave overtopping with the XBeach model. Although in gauges 7 and 8 the bias was positive, it was approximately zero. The rmse was more significant, especially in gauge 7, indicating that the η predictions in the two models had greater differences.
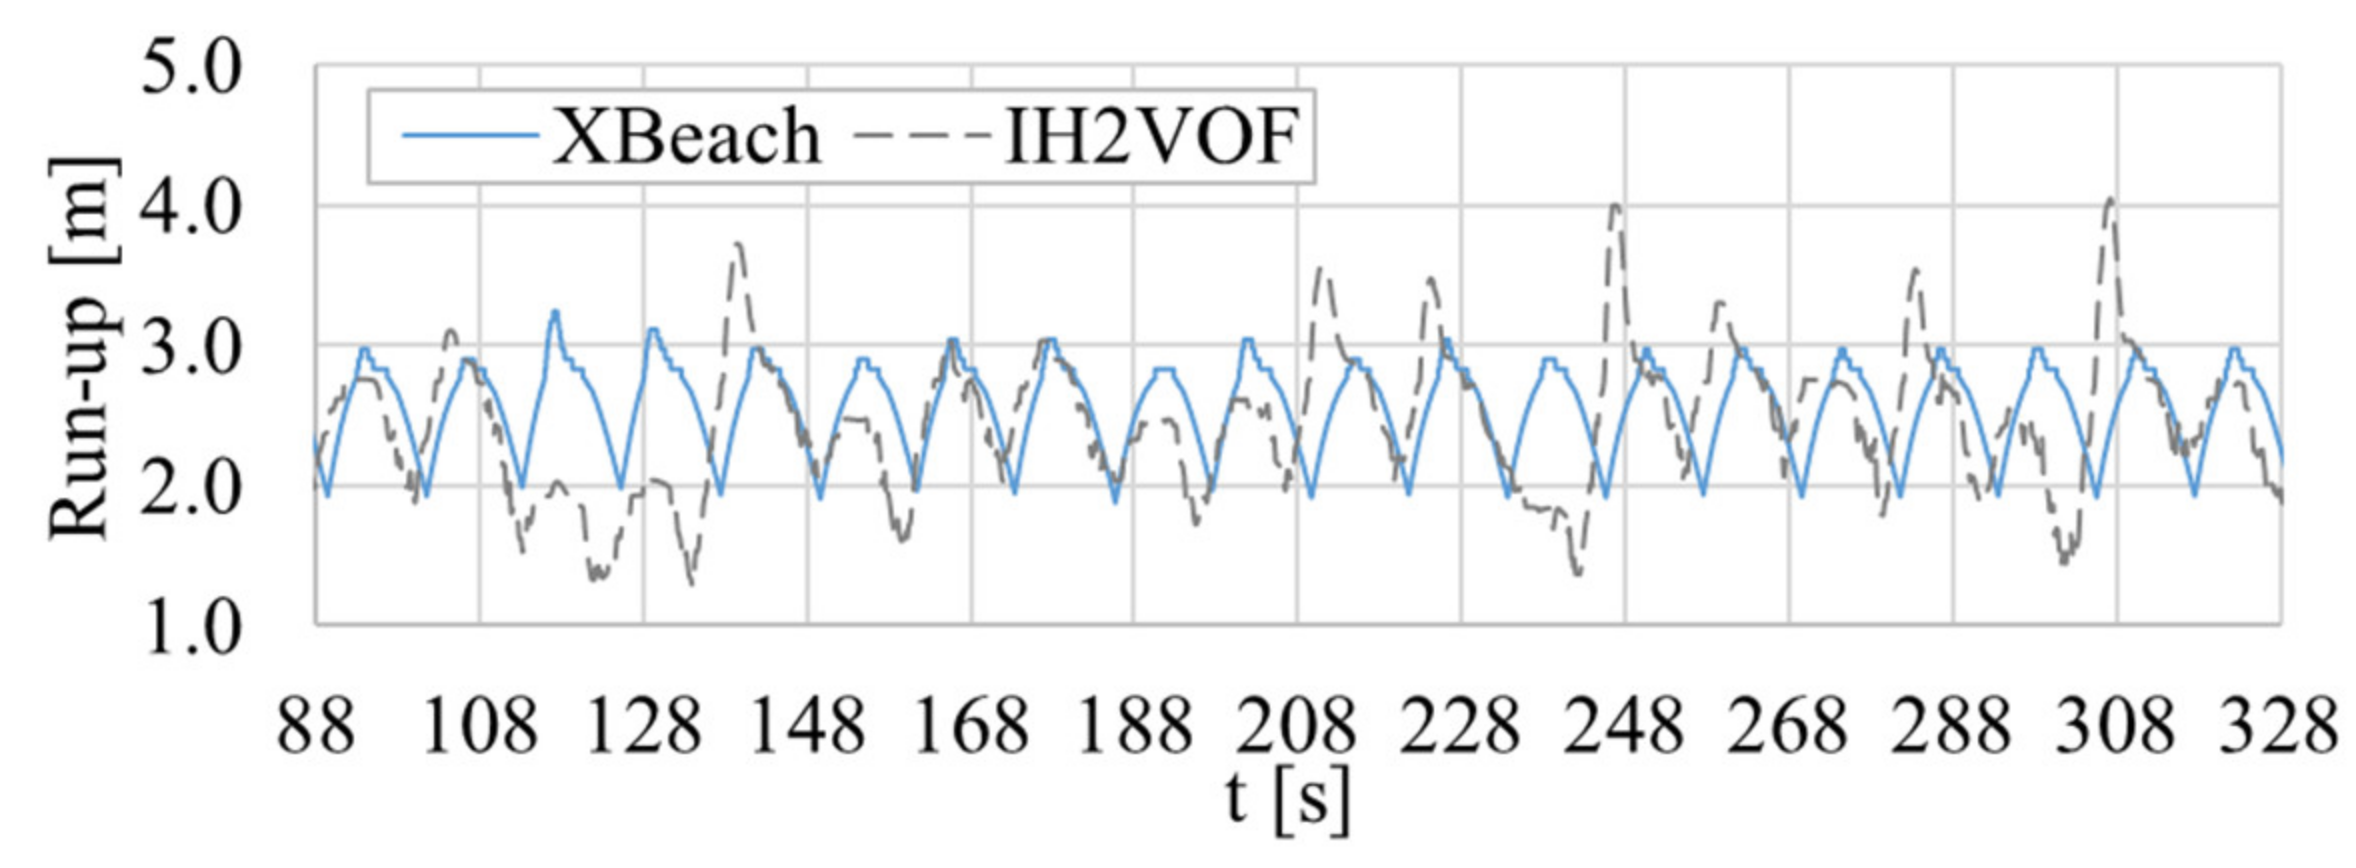
The run-up time series obtained using XBeach and IH2VOF is depicted in Figure 8 for the same simulation period. Table 3 presents the average (Rav), minimum (Rmin), maximum (Rmax) wave run-up and the two percent exceedance value (R2%), calculated for both model results. The Rmax and R2% predicted using the Mase formulas (Mase) are also presented in Table 3.
The bias and rmse were calculated for the numerical model results. A positive bias of 0.11 m indicates that the XBeach model slightly overestimated the overall run-up, and the average run-up value in XBeach was 0.10 m higher than in IH2VOF, but a rmse of 0.56 m represents more than 40% and 20% of the run-up range obtained in XBeach and IH2VOF, respectively. In fact, the extreme run-up levels obtained in IH2VOF were higher. Rmax reached a value of 4.05 m, 0.80 m above the maximum XBeach run-up level. Also, the R2% was 0.56 m higher in the IH2VOF predictions. The Rmax value of 6.14 m predicted using the Mase formulas was higher than those predicted using the numerical models, and almost reached the seawall crest, with height 6.22 m. However, the R2% obtained from the Mase formulas, 3.02 m, was similar to the XBeach R2% value but was still the smallest value predicted. Figure 8 shows the greater variation of the IH2VOF run-up time series compared to that of XBeach, which maintained an approximately constant run-up amplitude throughout the simulation.
3.1.2. Case I.O
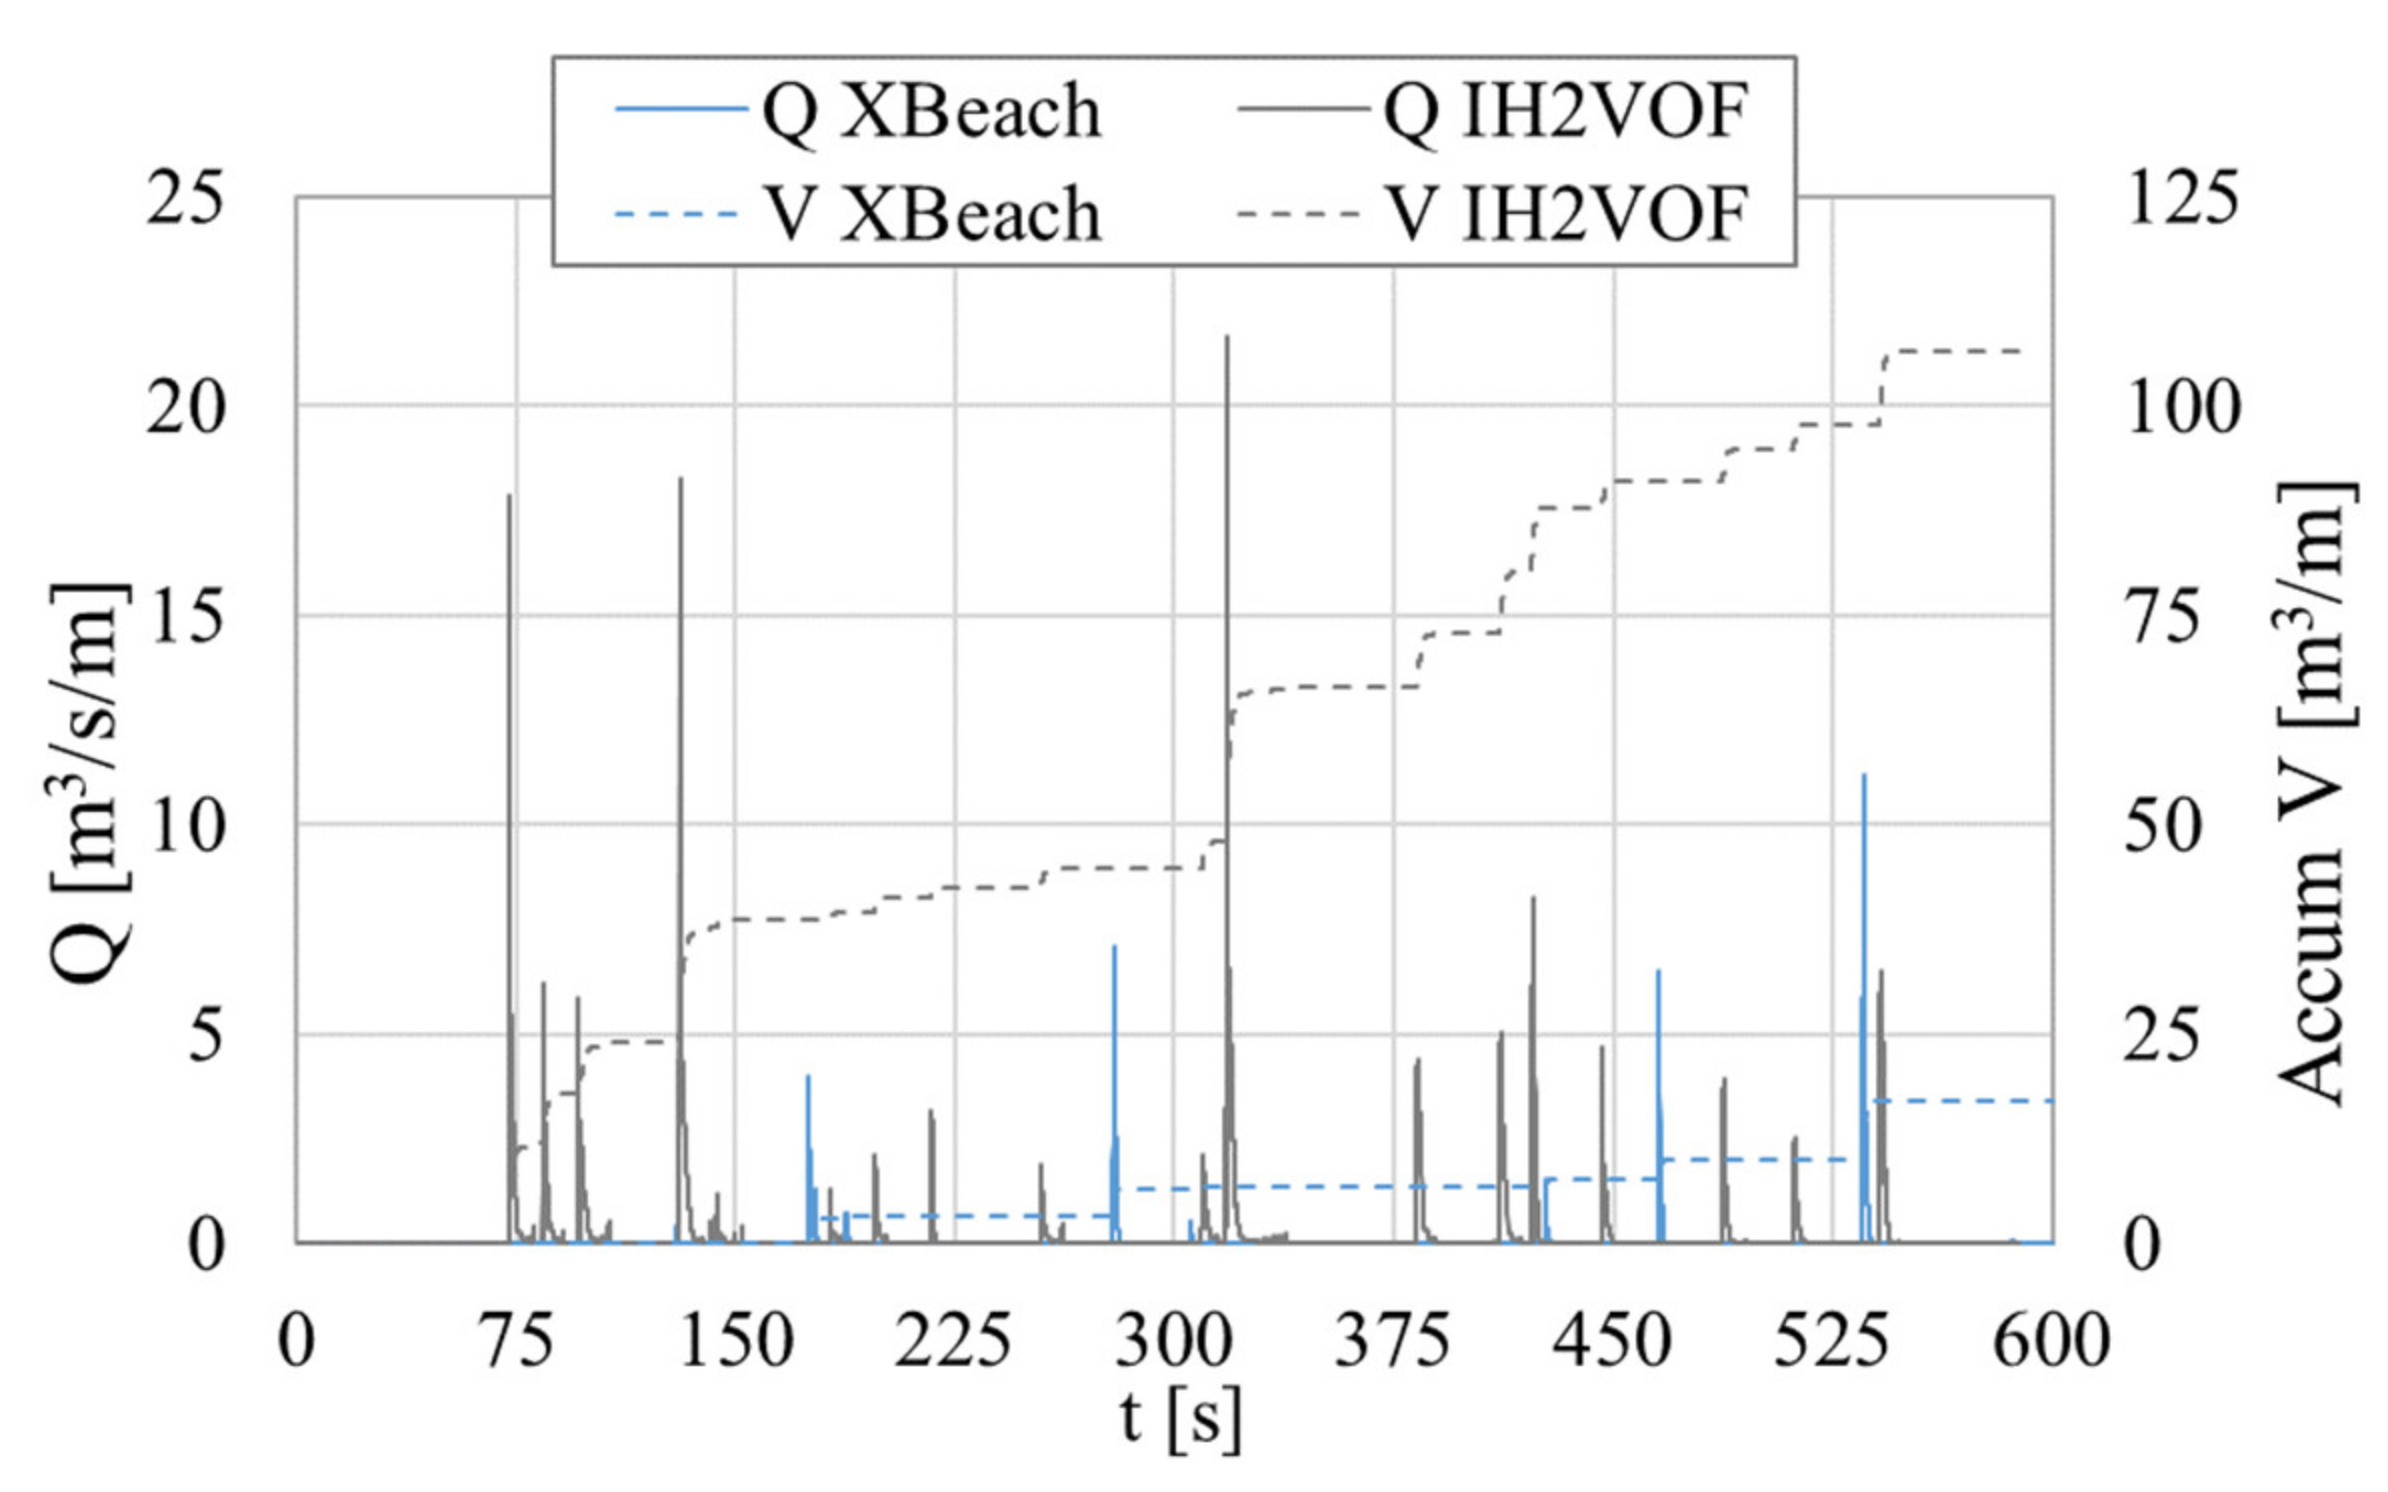
In the case designed for the occurrence of overtopping, the overtopping flow and accumulated overtopping volume time series predicted using XBeach and IH2VOF were analyzed and the overtopping statistical parameters were computed and analyzed for both models and the Mase formulas. The results are presented at the prototype scale. The numerical models were forced with a JONSWAP spectrum and a SWL was set at the seawall toe vertical level. During a period of 600 s, encompassing 50 waves, the overtopping flow was calculated based on the η and u-velocity values registered in gauge 10. Figure 9 shows the overtopping flow (Q) and the accumulated overtopping volume (Accum V) during the simulation period. Table 4 presents the average (Qav) and maximum (Qmax) overtopping flow values, and the total overtopping volume (Vtot) obtained in the two models. The same conditions were considered for the application of the Mase formulas and the Qav value predicted is also presented in Table 4.
Considering the same hydrodynamic forcing conditions in the two models, XBeach predicted the occurrence of 7 overtopping events, while IH2VOF predicted 18 events, more than the double. The maximum overtopping flow in XBeach was half of the maximum IH2VOF value, and the average value was at large underpredicted by XBeach, representing only 16% of the average IH2VOF value. The total overtopping volume in XBeach was 16.88 m3/m, representing 17% of the 107.57 m3/m predicted in IH2VOF. XBeach underestimated both the frequency and intensity of the overtopping occurrences predicted by IH2VOF. The Qav calculated using the Mase formulas was the highest value predicted, representing more than the double of the flow predicted using IH2VOF, and amounting to an extra overtopping volume of 250 m3/m than the XBeach prediction during the simulation period.
3.2. Phase II—Effect of Bed Morphodynamics on Wave Overtopping
3.2.1. Case II.SP
In the case where a unique solid bottom profile was considered throughout the storm event for the application of XBeach and the Mase formulas, the maximum run-up time series predicted using both methodologies were analyzed. The 96-h maximum run-up time series predicted in both methodologies for the duration of the storm event along with the seawall freeboard, distance between the sea level, and the seawall crest level, are depicted in Figure 10. The maximum run-up values calculated for the complete storm event and for each 24-h period of the storm time series are presented in Table 5.
Since the maximum run-up obtained using XBeach during the storm was never greater than the seawall freeboard, no overtopping was predicted by the model. The values for Rmax obtained using the Mase formulas exceeded the XBeach model predictions during the 96-h storm period. The highest Rmax values of 6.20 and 7.87 m were predicted, respectively, for the XBeach model and the Mase formulas, in the third 24-h period, while the lowest Rmax values of 1.99 and 3.23 m were predicted, respectively, by XBeach in the second 24-h period and by the Mase formulas in the third 24-h period (vd. Figure 10). The Mase formulas predicted the exceedance of the seawall freeboard several times and the occurrence of four overtopping events: one in the first 24-h period, two in the third (48–72 h) and one in the last (72–96 h). A maximum mean overtopping discharge per unit length of seawall of 0.00115 m3/s/m was predicted in the second overtopping event of the third 24-h period.
3.2.2. Case II.VP
In the case where a varying profile (sandy bottom) was considered by applying the XBeach Surfbeat model to calculate the profile update after each 24-h period of storm induced morphological evolution, the maximum run-up time series was calculated using the XBeach Non-hydrostatic model and the Mase formulas.
The morphological evolution of the profile during the 96-h storm period obtained using the XBeach Surfbeat model is depicted in Figure 11. The model showed the following morphological evolution throughout the storm: (i) erosion in the seawall toe and in the beach face up to 64 m from the seawall; (ii) a resulting scour hole in the seawall toe which reached 1.0 m after the first 24 h, approximately 0.5 m in each of the subsequent 24-h periods, and 0.10 m in the last 24 h; (iii) deposition of the eroded sediments along a 125 m extension zone, gradually accumulating seawards; (iv) that the relevant morphological changes were limited to a 189 m extension zone from the seawall toe.
The four profiles dated 4 January 2014, 5 January 2014, 6 January 2014, and 7 January 2014 were used sequentially as input for the XBeach Non-hydrostatic hydrodynamic modeling and the Mase formulas application in case II.VP. The hydrodynamic forcing consisted of the synoptic storm wave and SL conditions for a varying sandy bottom profile, updated with the aforementioned data after each 24-h period of the storm induced morphological evolution. The maximum 96-h run-up series predicted with both methodologies for the duration of the storm event, along with the seawall freeboard level, are depicted in Figure 12. The maximum run-up values calculated for the complete storm event and for each 24-h period of the storm time series are presented in Table 6.
Similarly to case II.SP, the maximum run-up obtained using XBeach was never greater than the seawall freeboard. The values for Rmax obtained using the Mase formulas exceeded the XBeach model predictions during most of the 96-h storm event and exceeded the seawall freeboard in the third 24-h period. Two overtopping events of reduced mean overtopping discharge were predicted, with a maximum of 0.00019 m3/s/m. The highest Rmax values of 5.16 and 6.31 m were predicted in the fourth and third 24-h periods, respectively, by the XBeach model and the Mase formulas. The lowest Rmax values of 1.37 and 2.55 m were predicted in the same 24-h period as in case II.SP, respectively, by XBeach in the second 24-h period and by the Mase formulas in the third 24-h period (vd. Figure 11).
4. Discussion
4.1. Phase I—Performance of Alternative Methodologies for Overtopping Assessment
In this section, the implications of the alternative methodologies for predicting the occurrence of overtopping are discussed in light of the results obtained using the XBeach and IH2VOF numerical models, and the Mase formulas, in cases I. NO and I.O.
In the case designed for the non-occurrence of overtopping, case I.NO, the indicators of η differences (Table 2) demonstrated that the η predictions obtained with both models for the same hydrodynamic forcing were similar in the profile extension where the waves shape was less affected by the profile bottom. This was no longer verified closer to the seawall, where the differences in the η predicted by the XBeach and the IH2VOF models in gauges 7 and 8 were greater (v.d. Table 2 and Figure 7), and is due to the different approach of the wave breaking phenomenon considered by both models. These differences in the breaking zone influenced the swash process and led to greater variations in the wave run-up time series obtained in each model. The run-up peaks predicted by IH2VOF in gauge 8 (Figure 7) were associated with the higher irregular η values predicted by this model, and the η time series analysis demonstrated that, in comparison, the XBeach model underestimated the wave energy during the wave propagation process (Figure 8). This led to η mismatches being more significant in the wave troughs where lower levels were obtained in XBeach, thus reducing the probability of the occurrence of wave overtopping with the XBeach model. The run-up results, for this case, demonstrate that the Mase formulas are more likely to predict the occurrence of overtopping than the numerical models, since the maximum run-up was the highest of all. The IH2VOF numerical model is more prone to predict overtopping than XBeach for this case since the irregular and extreme peak values generated by higher waves and identified in Figure 8 are the main cause for the wave overtopping.
In the case designed for the occurrence of overtopping, case I.O, IH2VOF predicted more than double the overtopping events predicted by XBeach, for the same hydrodynamic forcing conditions. Considering the Rmax values obtained for the numerical models and the Mase formulas in case I.NO (Table 3), this was expected. The underestimation of the wave energy in the XBeach propagation process reduces the probability of overtopping occurrence both in frequency and intensity. This was also confirmed by the fact that the average overtopping flow predicted be XBeach represented only 16% of that predicted by IH2VOF (Table 4). The average overtopping flow predicted by the Mase formulas surpassed the IH2VOF predictions by more than double, amounting to a considerable overtopping volume of 276.48 m3/m (Table 4). Considering the Rmax values obtained in case I.NO for the three methodologies, it was expected that the Mase formulas would predict a considerably higher overtopping discharge.
Wave overtopping is a random process with respect to time and volume [23]. A single calibration parameter (maxbrsteep) was used in XBeach Non-hydrostatic mode, achieving a good η correspondence between the numerical models while minimizing the overall energy dissipation in XBeach. An alternative multi-parametric calibration to improve the precision between non-linearity and dispersion, the possible cause for the differences in the dissipation rate of wave energy was not possible in this non-hydrostatic model version, since wave breaking is not extensively parameterized. Nevertheless, the analysis of case I.NO supports the above-mentioned conclusions of the overtopping analysis in case I.O: XBeach underestimated the wave energy predicted in IH2VOF and, consequently, the occurrence of overtopping. The precision of the IH2VOF model comes at a high computational cost: the simulations presented in this paper for phase I, which considered simplified topo-bathymetric and hydrodynamic conditions, took weeks to run using IH2VOF over a few hours using XBeach. As mentioned, the Mase formulas overestimated the mean overtopping discharge obtained with IH2VOF and XBeach. This is a common result of formulae, that has an advantage of getting a quick response of mean wave overtopping discharge but was calibrated based on data from different geometrical and hydrodynamic characteristics. Some empirical parameters, such as γf, should be obtained by calibration, but in real cases no data for calibration are available in most of such energetic conditions. The model choice requires a compromise between precision and computational cost, especially when it comes to modeling complex field conditions.
4.2. Phase II—Effect of Bed Morphodynamics on Wave Overtopping
The effect of the bed profile morphodynamic changes on wave run-up and overtopping, during a storm event, are discussed according to the results obtained with the XBeach numerical model and the Mase formulas, in cases II.SP and II.VP.
The insights drawn in phase I regarding the XBeach and the Mase formulas application for wave overtopping assessment were valid in phase II. The Rmax values predicted by the Mase formulas in both the solid bottom (II.SP) and the varying bottom (II.VP) cases were greater than the values predicted by XBeach during the storm event, as shown in Figure 9 and Figure 11, respectively. The Mase formulas are more prone to predicting the occurrence of overtopping than both numerical models, as they were developed to design coastal defense structures and take into account safety parameters according to technical standards [23]. Four overtopping events were predicted in case II.SP, with one of them a considerable occurrence with a mean overtopping discharge of 0.00115 m3/s/m—above the limit admitted when considering pedestrian circulation, 0.00003 m3/s/m, and the protection of infrastructures, 0.001 m3/s/m [60]. Two events were predicted in case II.VP, again surpassing these safety limits. For the same conditions, XBeach did not predict the occurrence of wave overtopping in any of the cases.
The morphological evolution of the profile during the 96-h storm period in Figure 11, modeled using the XBeach Surfbeat model, predicted severe erosion in the beach face and the formation of a scour hole in the seawall toe. The erosion rate was higher in the first 24-h period of the storm, as the representative equilibrium profile adapted to new highly energetic hydrodynamic conditions, and in the third 24-h period, when the storm reached its energy peak, with Hs reaching 8.60 m (Figure 6). The scouring of the seawall may be overestimated by the model [36], but XBeach has been successfully applied to investigate the effects of hard elements on the erosion processes during storm surges [4,6,8,61]. The local scour hole developed due to the presence of the seawall that cuts off the sediment supply to the upper beach profile by increasing the energy dissipation on its toe [6].
In case II.SP, the highest Rmax values predicted using both methods occurred in the most energetic 24-h period of the storm event. In case II.VP, the highest Rmax value for Mase was 1.56 m lower than in case II.SP and still predicted in the third 24-h period, while in XBeach it was 1.04 m lower and predicted in the last 24-h period. In spite of the same forcing hydrodynamic conditions and the fact that in the first 24-h period the bottom profile was the same, the XBeach Rmax time series results were different in cases II.SP and II.VP. This is due to the random phase of the wave spectra considered and highlights the significance of the random processes in the overtopping phenomenon. The most relevant effect of the bottom variation in the XBeach results occurred in the third and beginning of the fourth 24-h period, when the incident wave heights were the highest and the Rmax values were mostly lower in case II.VP. Even though the storm influenced the profile bottom variation in the upper beach profile, these changes were not as relevant as the γf parameter value in the application of the Mase formulas for the run-up and overtopping calculations, since they were based on a parameterized profile geometry calibrated with data from different geometrical conditions.
Different γfvalues were considered for the Mase formulas in each case, according to [23,60]. In case II.SP a γf value of 1 was considered to model an impermeable slope for the solid bottom, i.e., no run-up correction was done due to the permeability or roughness of the bottom [55]. In case II.VP a γf value of 0.8 was considered to model the varying profile as a permeable/rough slope. The maximum run-up time series obtained in case II.SP followed the same trend as the one obtained for case II.VP, and the values were, in average, 1.06 m higher. During the storm, the Rmax values in case II.SP were 1.20, 1.15, 1.56, and 1.40 m higher than in case II.VP, respectively, for each sequential period of 24-h. The influence of the varying bottom cannot be directly measured in the Mase formulas results, since the γf coefficient is not calibrated as the storm progresses and is user defined for the case application. An advantage of a multi-model approach is that conclusions about the model or formulas calibration parameter can be drawn from the application of another model in the same conditions, knowing the calculation methodology of each of them.
In this study, according to the XBeach and Mase formulas results in phases I and II, it was demonstrated that XBeach underestimates wave run-up but takes into account the bottom variations throughout the storm, and the Mase formulas overestimate the results, as they are meant to provide safety design values. The maximum run-up time series comparison of both methods and the analysis of cases II.SP and II.VP suggest that since the Mase formulas’ values are not directly affected by the storm beach face erosion, as opposed to XBeach, but are very sensitive to the γf value, this parameter can be used in the calibration process of the formulas with the numerical model agreement, so that the maximum run-up values and, consequently, the overtopping discharge, can take into account the effect of the bottom variation predicted by XBeach.
5. Conclusions
In summary, this research work addressed the wave overtopping phenomenon on a Portuguese alongshore coastal defense structure by combining different methodologies. The difficulties in predicting the occurrence of overtopping and the limitations associated with the computational complexity of simulating real scale field conditions, along with the lack of field data for the validation of the overtopping analysis methodologies, were tackled by applying numerical models and semi-empirical formulas.
It was shown how the overtopping analysis methodology choice requires a compromise between precision and computational cost, especially when it comes to modeling complex field conditions. The formulae application, such as the Mase formulas, has the advantage of getting a quick response of mean wave overtopping discharge. On the downside, this methodology overestimates the numerical models’ results and does not provide any insight on the processes involved in the specific wave overtopping phenomenon conditions. Also, the effect of the bed profile morphodynamic changes during a storm event cannot be taken into account, except by means of an overall friction coefficient. The overtopping modeling precision is greater in models that account for the processes involved in wave breaking and processes that directly influence the free surface level, such as wave reflection. The possibility to model disconnected fluid areas in IH2VOF allows a more realistic and detailed representation of the wave breaking phenomenon in nature and leads to better results, even though the bottom morphodynamic modeling is absent. The XBeach model performance stands in between the two abovementioned methodologies, with the advantage of accounting for a synoptic morphological evolution.
The knowledge provided by multi-model approaches allows a parameter calibration that can reduce the model or formula’s uncertainty regarding important processes that are not considered by that methodology and have an influence in the overtopping analysis.
Author Contributions
Conceptualization, J.N.C.O., F.S.B.F.O. and M.G.N.; Methodology, J.N.C.O., F.S.B.F.O. and M.G.N.; software, J.N.C.O. and M.G.N.; validation, J.N.C.O. and M.G.N.; formal analysis, J.N.C.O. and M.G.N.; investigation, J.N.C.O. and M.G.N.; resources, J.N.C.O., F.S.B.F.O. and M.G.N.; data curation, J.N.C.O., F.S.B.F.O. and M.G.N.; writing—original draft preparation, J.N.C.O.; writing—review and editing, J.N.C.O., F.S.B.F.O., M.G.N., M.C. and A.A.T.-T.; visualization, J.N.C.O.; supervision, F.S.B.F.O., M.G.N. and A.A.T.-T.; project administration, M.G.N. and M.C.; funding acquisition M.C. All authors have read and agreed to the published version of the manuscript.
Funding
This work was partially funded by the projects CYTED 2017-PROTOCOL, PCI2019-103565-SUSME and PID2019-107509GB-I00-ROMPEOLAS. The work of the first author was supported by FCT through the Ph.D. Grant PD/BD/128508/2017.
Acknowledgments
The authors are grateful to the Spanish State Port Authority for the data provided.
Conflicts of Interest
The authors declare no conflict of interest.
References
- Andrade, C.; Pires, H.O.; Taborda, R.; Freitas, M.C. Projecting future changes in wave climate and coastal response in Portugal by the end of the 21st century. J. Coast. Res. 2007, 50, 253–257. [Google Scholar]
- Matias, A.; Carrasco, R.; Loureiro, C.; Masselink, G.; Andriolo, U.; McCall, R.; Ferreira, Ó.; Plomaritis, T.A.; Pacheco, A.; Guerreiro, M. Field measurements and hydrodynamic modelling to evaluate the importance of factors controlling overwash. Coast. Eng. 2019, 152, 103523. [Google Scholar] [CrossRef] [Green Version]
- Roelvink, J.A.; Reniers, A.J.H.M. A Guide to Modeling Coastal Morphology—Advances in Coastal and Ocean Engineering; World Scientific: Singapore, 2011; Volume 12, p. 250. [Google Scholar]
- Roelvink, D.; Reniers, A.; Dongeren, A.; Vries, J.T.; McCall, R.; Lescinski, J. Modelling storm impacts on beaches, dunes and barrier islands. Coast. Eng. 2009, 56, 1133–1152. [Google Scholar] [CrossRef]
- Trouw, K.; Zimmermann, N.; Mathys, M.; Delgado, R.; Roelvink, D. Numerical modelling of hydrodynamics and sediments transport in the surf zone: A sensitivity study with different types of numerical models. Coast. Eng. Proc. 2012, 1, 1–12. [Google Scholar] [CrossRef] [Green Version]
- Nederhoff, C.M. Modelling the Effects of Hard Structures on Dune Erosion and Overwash. Master’s Thesis, University of Technology, Delft, The Netherlands, 2014. [Google Scholar]
- Oliveira, J.N.C.; Oliveira, F.S.B.F.; Teixeira, A.T. Modelling the beach morphodynamics in defence schemes of combined groyne fields and seawalls under storm conditions. In Proceedings of the 5th Hydrographic Engineering Conference, Hydrographic Institute, Lisbon, Portugal, 19–21 June 2018; pp. 257–260. [Google Scholar]
- Oliveira, J.N.C.; Oliveira, F.S.B.F.; Freire, P.; Trigo-Teixeira, A.A. A hybrid monitoring-modelling analysis on the storm induced sediment dynamics of a structure-controlled beach. J. Coast. Res. 2020, 95, 605–609. [Google Scholar] [CrossRef]
- Van der Hoeoven, R. Morphological Impact of Coastal Structures. Master’s Thesis, University of Technology, Delft, The Netherlands, 2010. [Google Scholar]
- Van der Salm, G.L.S. Coastline Modelling with UNIBEST: Areas Close to Structures. Master’s Thesis, University of Technology, Delft, The Netherlands, 2013. [Google Scholar]
- Van Rijn, L.C. Design of Hard Coastal Structures against Erosion. 2013. Available online: http://www.leovanrijn-sediment.com (accessed on 26 June 2017).
- Kolokythas, G.A.; Raquel, S.; Blanco, M.R.D. Morphological Evolution of a Bed Profile Induced By a Storm Event at the Belgian Coast Predicted By XBeach Model. In Proceedings of the 26th International Ocean and Polar Engineering Conference, Rhodes, Greece, 26 June–1 July 2016. [Google Scholar]
- Lindemer, C.A.; Plant, N.G.; Puleo, J.A.; Thompson, D.M.; Wamsley, T.V. Numerical simulation of a low-lying barrier island’s morphological response to Hurricane Katrina. Coast. Eng. 2010, 57, 985–995. [Google Scholar] [CrossRef]
- McCall, R.T.; de Vries, J.S.M.; Plant, N.G.; van Dongeren, A.R.; Roelvink, J.A.; Thompson, D.M.; Reniers, A.J. Two-dimensional time dependent hurricane overwash and erosion modelling at Santa Rosa Island. Coast. Eng. 2010, 57, 668–683. [Google Scholar] [CrossRef]
- De Vet, P.L.M.; McCall, R.T.; den Bieman, J.P.; Stive, M.J.F.; van Ormondt, M. Modelling Dune Erosion, Overwash and Breaching at Fire Island (NY) during Hurricane Sandy. In Proceedings of the Coastal Sediments, San Diego, CA, USA, 11–15 May 2015; World Scientific: Singapore, 2015. [Google Scholar]
- Muller, H.; van Rooijen, A.; Idier, D.; Pedreros, R.; Rohmer, J. Assessing storm impact on a French coastal dune system using morphodynamic modeling. J. Coast. Res. 2017, 33, 254–272. [Google Scholar] [CrossRef]
- McCall, R.T.; Masselink, G.; Poate, T.G.; Roelvink, J.A.; Almeida, L.P.; Davidson, M.; Russell, P.E. Modelling storm hydrodynamics on gravel beaches with XBeach-G. Coast. Eng. 2014, 91, 231–250. [Google Scholar] [CrossRef] [Green Version]
- Almeida, L.P.; Masselink, G.; McCall, R.; Russell, P. Storm overwash of a gravel barrier: Field measurements and XBeach-G modelling. Coast. Eng. 2017, 120, 22–35. [Google Scholar] [CrossRef] [Green Version]
- Baumann, J.; Chaumillon, E.; Bertin, X.; Schneider, J.-L.; Guillot, B.; Schmutz, M. Importance of infragravity waves for the generation of washover deposits. Mar. Geol. 2017, 391, 20–35. [Google Scholar] [CrossRef]
- Neves, M.G.; Reis, M.T.; Losada, I.J.; Asce, M.; Keming, H. Wave Overtopping Of Póvoa De Varzim Breakwater: Physical And Numerical Simulations. J. Waterw. Port Coast. Ocean Eng. 2008, 10, 203–264. [Google Scholar] [CrossRef]
- Di Lauro, E.; Maza, M.; Lara, J.L.; Losada, I.J.; Contestabile, P.; Vicinanza, D. Advantages of an innovative vertical breakwater with an overtopping wave energy converter. Coast. Eng. 2020, 159, 103713. [Google Scholar] [CrossRef]
- Inverno, J.; Neves, M.G.; Didier, E.; Lara, J.L. Numerical simulation of wave interacting with a submerged cylinder using a 2D RANS model. J. Hydro Environ. Res. 2016, 12, 1–15. [Google Scholar] [CrossRef]
- Mase, H.; Tamada, T.; Yasuda, T.; Hedges, T.; Reis, M. Wave Run-up and Overtopping at Seawalls Built on Land and in Very Shallow Water. J. Waterw. Port Coast. Ocean. Eng. 2013, 139, I5, 346–357. [Google Scholar] [CrossRef]
- Oliveira, F.S.B.F.; Fortunato, A.; Freire, P.; Fortes, C.J.; Neves, M.G.; Reis, M.T. Modelling Support for the Interventions in the Costa da Caparica—Almada Beaches. Study I—Vulnerability Analysis of the Urban Beaches to a Storm Event. DHA/NPE, LNEC; Technical Report 110/2020; LNEC: Lisbon, Portugal, 2020. (In Portuguese) [Google Scholar]
- Van Dongeren, A.; Roelvink, D.; McCall, R.; Nederhoff, K.; van Rooijen, A. Modelling the morphological impacts of coastal storms. In Coastal Storms: Processes and Impacts; Ciavola, P., Coco, G., Eds.; John Wiley & Sons Ltd.: Hoboken, NJ, USA, 2017; pp. 195–216. [Google Scholar]
- Martins, K.; Blenkinsopp, C.E.; Almar, R.; Zang, J. The influence of swash-based reflection on surf zone hydrodynamics: A wave-by-wave approach. Coast. Eng. 2017, 122, 27–43. [Google Scholar] [CrossRef] [Green Version]
- Vousdoukas, M.I.; Wziatek, D.; Almeida, L.P. Coastal vulnerability assessment based on video wave run-up observations at a mesotidal, steep-sloped beach. Ocean. Dynam. 2012, 62, 123–137. [Google Scholar] [CrossRef]
- Stockdon, H.F.; Thompson, D.M.; Plant, N.G.; Long, J.W. Evaluation of wave runup predictions from numerical and parametric models. Coast. Eng. 2014, 92, 1–11. [Google Scholar] [CrossRef]
- Lerma, A.N.; Pedreros, R.; Robinet, A.; Senechal, N. Simulating wave setup and runup during storm conditions on a complex barred beach. Coast. Eng. 2017, 123, 29–41. [Google Scholar] [CrossRef]
- Atkinson, A.L.; Power, H.E.; Moura, T.; Hammond, T.; Callaghan, D.P.; Baldock, T.E. Assessment of runup predictions by empirical models on non-truncated beaches on the south-east Australian coast. Coast. Eng. 2017, 119, 15–31. [Google Scholar] [CrossRef] [Green Version]
- Lara, J.L.; Garcia, N.; Losada, I.J. RANS modelling applied to random wave interaction with submerged permeable structures. Coast. Eng. 2006, 53, 395–417. [Google Scholar] [CrossRef]
- Salman, A.; Lombardo, S.; Doody, P. Living with Coastal Erosion in Europe: Sediment and Space for Sustainability, PART I—Major Findings and Policy Recommendations of the EUROSION Project. Report 2004, National Institute for Coastal and Marine Management of the Netherlands (RIKZ), EUCC—The Coastal Union, IGN France International, UAB, BRGM, IFEN, & EADS Systems & Defence Electronics. p. 57. Available online: http://www.eurosion.org/reports-online/part1.pdf (accessed on 10 July 2020).
- Oliveira, J.N.C. Modelling the Impact of the Extension of the North Jetty of the Mondego River Inlet on the Adjacent Southern Beaches. Master’s Thesis, Instituto Superior Técnico, Lisbon, Portugal, 2016. [Google Scholar]
- Cunha, P.P. Erosion on the Cabo Mondego—Figueira da Foz coastal section: Natural/anthropic controls and management implications on the coastline and adjacent river basins. In Proceedings of the IV Simpósio de Hidráulica e Recursos Hídricos dos Países de Língua Oficial Portuguesa, University of Coimbra, Coimbra, Lisbon, Portugal, 24–26 May 1999; p. 22. (In Portuguese). [Google Scholar]
- Santos, F.D.; Lopes, A.M.; Moniz, G.; Ramos, L.; Taborda, R. Coastal areas management. In The Challenge of Change; Technical Report 2014; Littoral Work Group: Lisbon, Portugal, 2014; p. 368. (In Portuguese) [Google Scholar]
- Oliveira, J.N.C.; Oliveira, F.S.B.F.; Trigo-Teixeira, A.A. Coastline evolution south of the Mondego river inlet: Modelling the impact of the extension of the north jetty. In Proceedings of the 4th Hydrographic Engineering Conference, Hydrographic Institute, Lisbon, Portugal, 21–23 June 2016; pp. 245–248. [Google Scholar]
- Sallenger, A. Storm impact scale for barrier islands. J. Coast. Res. 2000, 16, 890–895. [Google Scholar]
- Holthuijsen, L.H.; Booij, N.; Herbers, T.H.C. A prediction model for stationary, short-crested waves in shallow water with ambient currents. Coast. Eng. 1989, 13, 23–54. [Google Scholar] [CrossRef]
- Roelvink, J.A. Dissipation in random wave groups incident on a beach. Coast. Eng. 1993, 19, 127–150. [Google Scholar] [CrossRef]
- Walstra, D.J.R.; Roelvink, J.; Groeneweg, J. 3D calculation of wave-driven cross-shore currents. In Proceedings of the 27th the International Conference on Coastal Engineering, Sydney, Australia, 6–21 July 2000; pp. 1050–1063. [Google Scholar]
- Galappatti, R.; Vreugdenhill, C.B. A depth integrated model for suspended transport. J. Hydraul. Res. 1985, 23, 359–377. [Google Scholar] [CrossRef]
- Van Rijn, L.C. Unified View of Sediment Transport by Currents and Waves: Part I and II. J. Hydraul. Eng. 2007, 133, 649–667. [Google Scholar] [CrossRef] [Green Version]
- Roelvink, D.; Reniers, A.; Dongeren, A.; Vries, J.T.; Lescinski, J.; McCall, R. XBeach Model Description and Manual; Report 2010 Unesco-IHE I.W.E.; Deltares and Delft University of Technology: Delft, The Netherlands, 2010; p. 106. [Google Scholar]
- Roelvink, D.; McCall, R.; Mehvar, S.; Nederhoff, K.; Dastgheib, A. Improving predictions of swash dynamics in XBeach: The role of groupiness and incident-band run-up. Coast. Eng. 2018, 134, 103–123. [Google Scholar] [CrossRef]
- Lin, P.; Liu, P.L.-F. A numerical study of breaking waves in the surf zone. J. Fluid Mech. 1998, 359, 239–264. [Google Scholar] [CrossRef]
- Hsu, T.-J.; Sakakiyama, T.; Liu, P.L.-F. A numerical model for wave motions and turbulence flows in front of a composite breakwater. Coast. Eng. 2002, 46, 25–50. [Google Scholar]
- Rodi, W. Turbulence Models and Their Application in Hydraulics—A State-of-the-Art Review; CRC Press: Boca Raton, FL, USA, 1980; ISBN 9054101504. [Google Scholar]
- Bairrao, M.; Neves, M.G.; Reis, M.T.; Pinto, F.T. Galgamento de uma estrutura portuária protegida por um quebra-mar submerso: O caso do Porto de Leixões, Portugal. J. Integr. Coast. Zone Manag. RGCI 2016, 16, 121–131. (In Portuguese) [Google Scholar] [CrossRef] [Green Version]
- Garcia, N.; Lara, J.L.; Losada, I.J. 2-D Numerical analysis of near-field flow at lowcrested permeable breakwaters. Coast. Eng. 2004, 51, 991–1020. [Google Scholar] [CrossRef]
- Losada, I.J.; Lara, J.L.; Guanche, R.; González-Ondina, J.M. Numerical analysis of wave overtopping of rubble mound breakwaters. Coast. Eng. 2008, 55, 47–62. [Google Scholar] [CrossRef]
- Neves, M.G.; Reis, M.T.; Didier, E. Comparisons of wave overtopping at coastal structures calculated with AMAZON, COBRASUC and SPHYSICS. In Proceedings of the V European Conference on Computational Fluid Dynamics, Lisbon, Portugal, 14–17 June 2010; pp. 14–17. [Google Scholar]
- Lara, J.L.; Losada, I.J.; Guanche, R. Wave interaction with lowmound breakwaters using a RANS model. Ocean Eng. 2008, 35, 1388–1400. [Google Scholar] [CrossRef]
- Torres-Freyermuth, A.; Losada, I.J.; Lara, J.L. Modeling of surf zone processes on a natural beach using Reynolds-averaged Navier–Stokes equations. J. Geophys. Res. 2007, 112, C09014. [Google Scholar] [CrossRef]
- Pilechi, A.; Baker, S.; Cornett, A. Evaluation of a numerical wave modelling tool for studying the overtopping of rubblemound breakwaters. In Proceedings of the 7th VII International Conference on the Application of Physical Modelling in Coastal and Port Engineering and Science (Coastlab18), Santander, Spain, 22–26 May 2018. [Google Scholar]
- Mase, H.; Miyahira, A.; Hedges, T.S. Random wave run-up on seawalls near shorelines with and without artificial reefs. Coast. Eng. Jpn. 2004, 46, 247–268. [Google Scholar] [CrossRef]
- Tamada, T.; Inoue, M.; Tezuka, T. Diagrams for the estimation of wave overtopping rate on gentle slope-type seawalls. Coast. Eng. JSCE 2002, 49, 641–645. (In Japanese) [Google Scholar]
- Masatoshi, Y.; Naoya, O.; Mase, H.; Kim, S.; Umeda, S.; Altamore, C. Applicability enhancement of integrated formula of wave overtopping and runup modelling. Coast. Eng. JSCE Ser. B2 2019, 75, 739–744. [Google Scholar]
- Saville, T., Jr. Wave run-up on composite slopes. In Proceedings of the 6th International Conference on Coastal Engineering, Bangkok, Thailand, 28 April 2019; ASCE: Reston, VA, USA, 1958; pp. 691–699. [Google Scholar]
- Mase, H.; Kirby, J.T. Hybrid frequency-domain KdV equation for random wave transformation. In Proceedings of the 23rd International Conference on Coastal Engineering, Venice, Italy, 4–9 October 1992; ASCE: New York, NY, USA, 1993; pp. 474–487. [Google Scholar]
- Van der Meer, J.W.; Allsop, W.; Bruce, T.; de Rouck, J.; Kortenhaus, A.; Pullen, T.; Schüttrumpf, H.; Troch, P.; Zanuttigh, B. EurOtop Manual on Wave Overtopping of Sea Defences and Related Structures. An Overtopping Manual Largely Based On European Research, but for Worldwide Application. 2nd ed. 2018. Available online: www.overtopping-manual.com (accessed on 13 July 2020).
- Oliveira, F.S.B.F. Modelling morphological evolution in the surrounding area of a groyne: Preliminary results. In Proceedings of the 4th Hydrographic Engineering Conference, Hydrographic Institute, Lisbon, Portugal, 21–23 June 2016; pp. 241–244. [Google Scholar]
- APA (Portuguese Environment Agency). Recording Occurrences in Littoral. Storm from 3 to 7 of January of 2014; Technical Report 2014; APA: Lisbon, Portugal, 2014; p. 123. (In Portuguese) [Google Scholar]
- Santos, A.; Mendes, S.; Corte-Real, J. Impacts of storm Hercules in southwestern Europe. In Proceedings of the RISK Information Management, Risk Modelsand Applications, Berlin, Germany, 17–18 November 2014. [Google Scholar]
Figure 1.
Satellite view of Cova-Gala and detail of the beach protection scheme: groyne field, seawalls, and geotextile tubes (Google Earth–3 August 2015).
Figure 1.
Satellite view of Cova-Gala and detail of the beach protection scheme: groyne field, seawalls, and geotextile tubes (Google Earth–3 August 2015).

Figure 2.
Imaginary slope of foreshore and seawall scheme used in the Mase formulas application (adapted from [23]).
Figure 2.
Imaginary slope of foreshore and seawall scheme used in the Mase formulas application (adapted from [23]).

Figure 3.
Numerical beach profile configuration (prototype scale) used in phase I. Water levels for cases I.NO and I.O.
Figure 3.
Numerical beach profile configuration (prototype scale) used in phase I. Water levels for cases I.NO and I.O.

Figure 4.
Numerical beach profile configuration (reduced scale) used in the IH2VOF model in case I.NO. Location of the 12 gauges.
Figure 4.
Numerical beach profile configuration (reduced scale) used in the IH2VOF model in case I.NO. Location of the 12 gauges.

Figure 5.
Bottom configuration of the real scale beach profile and seawall adopted in phase II, representative of the topo-bathymetric characteristics of the study site in Cova-Gala.
Figure 5.
Bottom configuration of the real scale beach profile and seawall adopted in phase II, representative of the topo-bathymetric characteristics of the study site in Cova-Gala.

Figure 6.
Significant wave height and sea level time series of the Hercules storm, from 4 January 2014 00h00 to 8 January 2014 00h00.
Figure 6.
Significant wave height and sea level time series of the Hercules storm, from 4 January 2014 00h00 to 8 January 2014 00h00.

Figure 7.
Free surface elevation time series at gauges 1 and 8 predicted by XBeach and IH2VOF for simplified representative hydro-morphologic conditions in case I.NO, designed for the non-occurrence of overtopping.
Figure 7.
Free surface elevation time series at gauges 1 and 8 predicted by XBeach and IH2VOF for simplified representative hydro-morphologic conditions in case I.NO, designed for the non-occurrence of overtopping.

Figure 8.
Run-up time series predicted using XBeach and IH2VOF for simplified representative hydro-morphologic conditions in case I.NO, designed for the non-occurrence of overtopping.
Figure 8.
Run-up time series predicted using XBeach and IH2VOF for simplified representative hydro-morphologic conditions in case I.NO, designed for the non-occurrence of overtopping.

Figure 9.
Overtopping flow and accumulated overtopping volume predicted using XBeach and IH2VOF for simplified representative hydro-morphologic conditions in case I.O, designed for the occurrence of overtopping.
Figure 9.
Overtopping flow and accumulated overtopping volume predicted using XBeach and IH2VOF for simplified representative hydro-morphologic conditions in case I.O, designed for the occurrence of overtopping.

Figure 10.
Maximum run-up time series predicted using XBeach and the Mase formulas for field storm conditions, and seawall freeboard level, considering a solid bottom in case II.SP.
Figure 10.
Maximum run-up time series predicted using XBeach and the Mase formulas for field storm conditions, and seawall freeboard level, considering a solid bottom in case II.SP.

Figure 11.
Storm induced morphological evolution of the sandy beach profile in case II.VP. Numerical profiles obtained using the XBeach Surfbeat numerical model.
Figure 11.
Storm induced morphological evolution of the sandy beach profile in case II.VP. Numerical profiles obtained using the XBeach Surfbeat numerical model.

Figure 12.
Maximum run-up time series predicted using XBeach and the Mase formulas for field storm conditions and seawall freeboard level, considering a varying beach sandy bottom profile in case II.VP.
Figure 12.
Maximum run-up time series predicted using XBeach and the Mase formulas for field storm conditions and seawall freeboard level, considering a varying beach sandy bottom profile in case II.VP.


Table 1.
Mase formulas and applicability conditions for the wave run-up and mean overtopping discharge prediction on seawalls constructed on land or in very shallow water [23,57].
| Formulas | Applicability Conditions | |
|---|---|---|
| Run-up | R2% = H0*(2.99–2.73 exp (−0.57 tanβ/)) | 0.2 < < 4 |
| R1/3 = H0*(2.14–2.18 exp (−0.70 tanβ/)) | 0.009 < < 0.06 | |
| (Rmáx)99%.100 ≈ 2.15 R1/3 ≈ 1.54 R2% | −0.37 < h/H0 < 0.53 | |
| Mean overtopping discharge | q = 0 | (Rmáx)99%.100 ≤ RC |
| q = *[Г*C*((Rmáx)99%.100/H0)3/2 *{1 − (RC/H0)/((Rmáx)99%.100/H0)}Ω | 0 ≤ RC < (Rmáx)99%.100 | |
| Г = 0.018 Ω = 6.240 | −0.5 ≤ X X = ln(1 − RC/(Rmáx)99%.100) | |
| Г = e−3.27–2.91X^2 Ω = 5.82*x + 9.15 | −1.4 < X < −0.5 X = ln(1 − RC/(Rmáx)99%.100) | |
| Г = 0.00013 Ω = 1.0 | X ≤ −1.4 X = ln(1 − RC/(Rmáx)99%.100) | |
| C = 0.25*cot (α) + 0.5 C = 1 | 0 ≤ cot (α) < 2 cot (α) ≥ 2 | |
Table 2.
Statistics correlating the free surface elevation time series predicted using XBeach and IH2VOF in case I.NO for gauges 1 to 8: bias and rmse.
Table 2.
Statistics correlating the free surface elevation time series predicted using XBeach and IH2VOF in case I.NO for gauges 1 to 8: bias and rmse.
| Gauge | 1 | 2 | 3 | 4 | 5 | 6 | 7 | 8 |
|---|---|---|---|---|---|---|---|---|
| rmse (m) | 0.23 | 0.21 | 0.26 | 0.24 | 0.24 | 0.24 | 1.03 | 0.40 |
| bias (m) | −0.16 | −0.14 | −0.14 | −0.14 | −0.15 | −0.16 | 0.02 | 0.07 |
Table 3.
Average, minimum, maximum, and two percent wave run-up predicted using XBeach and IH2VOF in case I.NO. Maximum and two percent wave run-up predicted using Mase formulas in case I.NO.
Table 3.
Average, minimum, maximum, and two percent wave run-up predicted using XBeach and IH2VOF in case I.NO. Maximum and two percent wave run-up predicted using Mase formulas in case I.NO.
| Rav (m) | Rmin (m) | Rmax (m) | R2% (m) | |
|---|---|---|---|---|
| XBeach | 2.56 | 1.88 | 3.24 | 3.05 |
| IH2VOF | 2.46 | 1.29 | 4.05 | 3.61 |
| Mase | 6.14 | 3.02 |
Table 4.
Average and maximum overtopping flow and total overtopping volume predicted using XBeach and IH2VOF in case I.O. Average overtopping flow and total overtopping volume predicted using Mase formulas in case I.O.
Table 4.
Average and maximum overtopping flow and total overtopping volume predicted using XBeach and IH2VOF in case I.O. Average overtopping flow and total overtopping volume predicted using Mase formulas in case I.O.
| Qav (m3/s/m) | Qmax (m3/s/m) | Vtot (m3/m) | |
|---|---|---|---|
| XBeach | 0.03 | 11.17 | 16.88 |
| IH2VOF | 0.18 | 21.65 | 107.57 |
| Mase | 0.46 | 276.48 |
Table 5.
Maximum wave run-up predicted using XBeach and Mase formulas for field storm conditions considering a solid bottom in case II.SP.
Table 5.
Maximum wave run-up predicted using XBeach and Mase formulas for field storm conditions considering a solid bottom in case II.SP.
| Storm Period (Hours) | Rmax (m) | |
|---|---|---|
| XBeach | Mase | |
| 0–96 | 6.20 | 7.87 |
| 0–24 | 3.95 | 6.01 |
| 24–48 | 3.97 | 5.73 |
| 48–72 | 6.20 | 7.87 |
| 72–96 | 5.14 | 7.30 |
Table 6.
Maximum wave run-up predicted using XBeach and Mase formulas for field storm conditions considering a varying beach sandy bottom profile in case II.VP.
Table 6.
Maximum wave run-up predicted using XBeach and Mase formulas for field storm conditions considering a varying beach sandy bottom profile in case II.VP.
| Storm Period (Hours) | Rmax (m) | |
|---|---|---|
| XBeach | Mase | |
| 0–96 | 5.16 | 6.31 |
| 0–24 | 3.84 | 4.81 |
| 24–48 | 3.91 | 4.58 |
| 48–72 | 4.92 | 6.31 |
| 72–96 | 5.16 | 5.90 |
© 2020 by the authors. Licensee MDPI, Basel, Switzerland. This article is an open access article distributed under the terms and conditions of the Creative Commons Attribution (CC BY) license (http://creativecommons.org/licenses/by/4.0/).
Share and Cite
MDPI and ACS Style
Oliveira, J.N.C.; Oliveira, F.S.B.F.; Neves, M.G.; Clavero, M.; Trigo-Teixeira, A.A. Modeling Wave Overtopping on a Seawall with XBeach, IH2VOF, and Mase Formulas. Water 2020, 12, 2526. https://doi.org/10.3390/w12092526
AMA Style
Oliveira JNC, Oliveira FSBF, Neves MG, Clavero M, Trigo-Teixeira AA. Modeling Wave Overtopping on a Seawall with XBeach, IH2VOF, and Mase Formulas. Water. 2020; 12(9):2526. https://doi.org/10.3390/w12092526
Chicago/Turabian StyleOliveira, João Nuno C., Filipa S. B. F. Oliveira, Maria Graça Neves, María Clavero, and António A. Trigo-Teixeira. 2020. "Modeling Wave Overtopping on a Seawall with XBeach, IH2VOF, and Mase Formulas" Water 12, no. 9: 2526. https://doi.org/10.3390/w12092526
Note that from the first issue of 2016, this journal uses article numbers instead of page numbers. See further details here.