Land Use and Water Quality


1
Department of Bioscience, Aarhus University, Vejlsoevej 25, DK-8600 Silkeborg, Denmark
2
Forschungszentrum Jülich, Institute of Bio- and Geosciences (IBG), Institute 3: Agrosphere, 52425 Jülich, Germany
3
National Institute for Public Health and the Environment, Centre for Environmental Quality, P.O. Box 1, 3720 BA Bilthoven, The Netherlands
*
Author to whom correspondence should be addressed.
Water 2020, 12(9), 2412; https://doi.org/10.3390/w12092412
Submission received: 24 June 2020
/
Revised: 27 July 2020
/
Accepted: 26 August 2020
/
Published: 28 August 2020
(This article belongs to the Special Issue Land Use and Water Quality)
Abstract
:The interaction between land use and water quality is of great importance worldwide as agriculture has been proven to exert a huge pressure on the quality of groundwater and surface waters due to excess losses of nutrients (nitrogen and phosphorous) through leaching and erosion processes. These losses result in, inter alia, high nitrate concentrations in groundwater and eutrophication of rivers, lakes and coastal waters. Combatting especially non-point losses of nutrients has been a hot topic for river basin managers worldwide, and new important mitigation measures to reduce the input of nutrients into groundwater and surface waters at the pollution source have been developed and implemented in many countries. This Special Issue of the Land use and Water Quality conference series (LuWQ) includes a total of 11 papers covering topics such as: (i) nitrogen surplus; (ii) protection of groundwater from pollution; (iii) nutrient sources of pollution and dynamics in catchments and (iv) new technologies for monitoring, mapping and analysing water quality.
1. Introduction
Agriculture provides food, fibre, energy and, last but not least, a living for many people around the world [1,2,3]. A drawback of agricultural production is pollution of the terrestrial environment with nitrogen via atmospheric deposition [4] and the aquatic environment by nutrients, pesticides and trace elements [5,6,7,8,9]. Thus, growth of agricultural production, as has occurred in Europe and North America since the 1950s and more recently in many other parts of the world, threatens the quality of groundwater and surface waters or has already led to deterioration of the quality of these waters [10,11,12]. Problematic hotspot areas are found in all countries around the world with typical examples in Denmark, the Netherlands, Germany, Belgium, United Kingdom, northern Italy, France, China, the United States and New Zealand.
Policies to abate the deterioration of water quality have been developed and programmes to improve water quality implemented around the world. For example, the European Union has adopted directives (the Nitrates Directive in 1991 [13]; the Water Framework Directive in 2000 [14]; the Groundwater Directive in 2006 [15]) with the objective of obtaining good quality in all waters by 2027.
Experience from the last 15 to 25 years shows that it will be a great challenge to realise the objectives of these policies in the remaining years of this decade, not only because the easy, low-cost measures have already been implemented, but also because the need for food for a growing world population creates a pressure to increase agricultural production. Since the easy, low cost measures generally have already been introduced, there is a need for answers to questions like ‘Which measures are most effective and at the same time the most cost-effective for water quality improvement’? As most of the additional measures will have a larger effect on farm management, their implementation may be less straightforward. This raises the question ‘Should measures be enforced by law or implemented on a voluntary basis’?
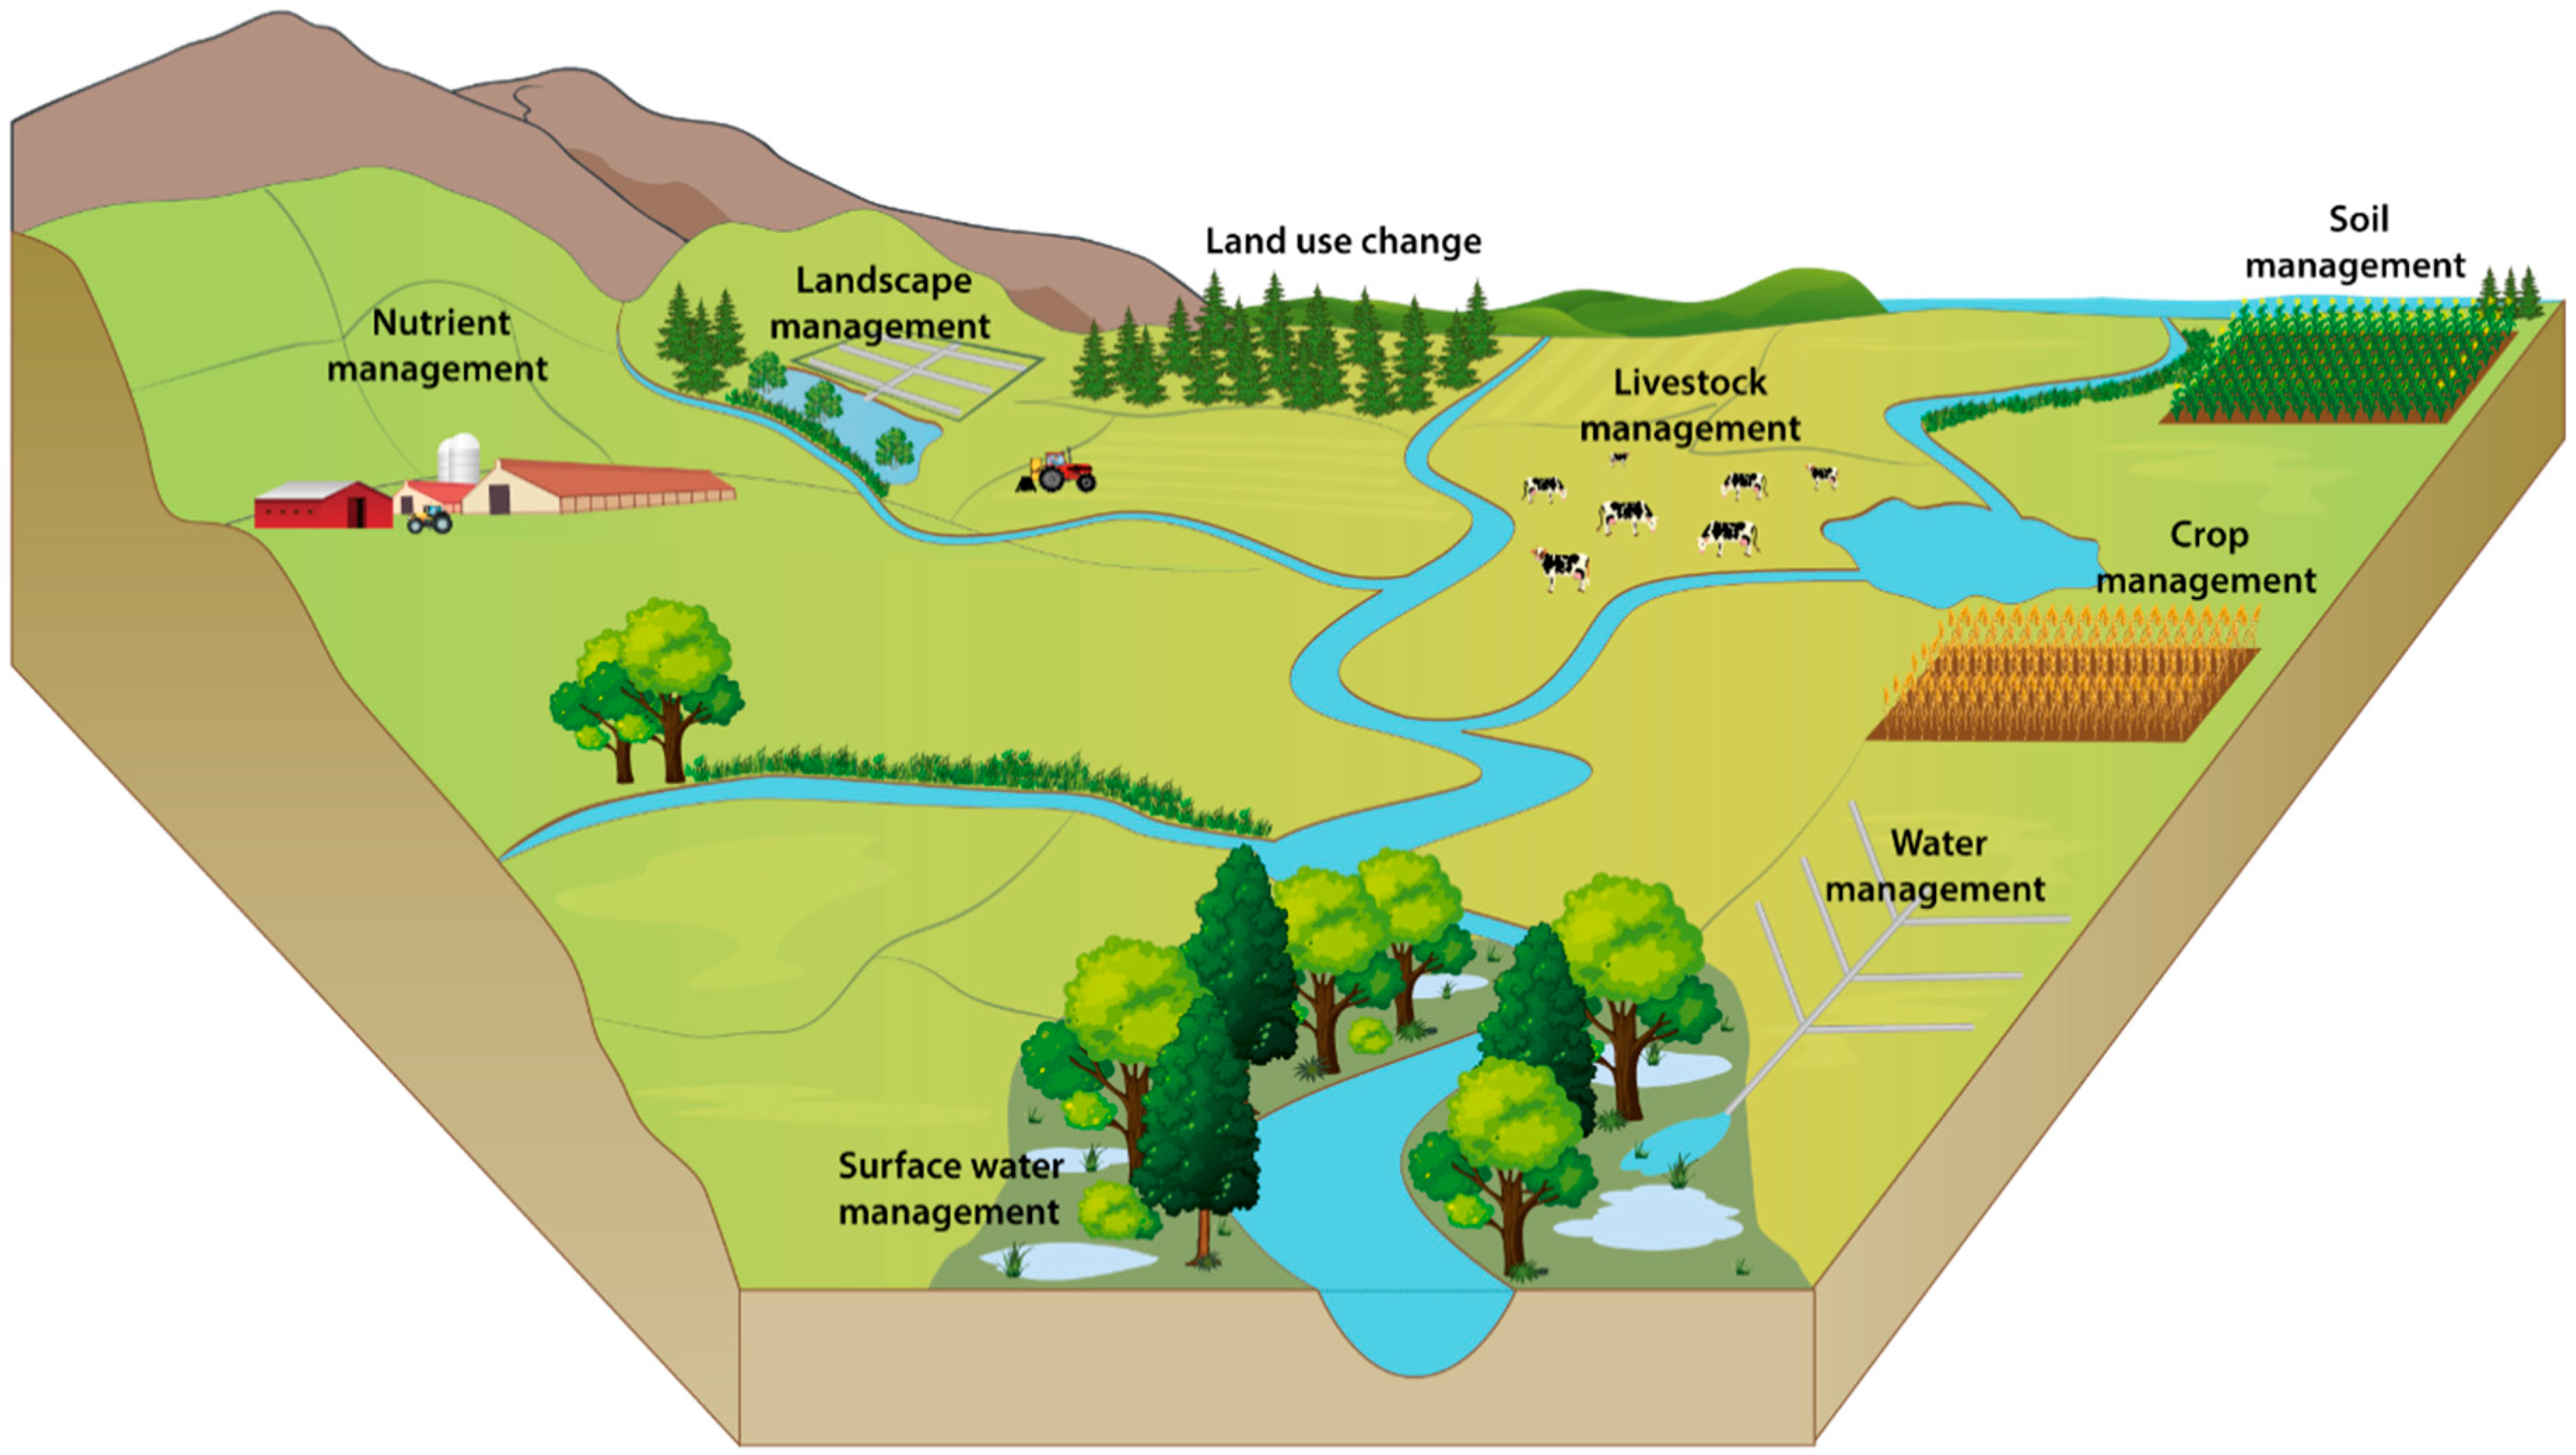
Schoumans et al. [16] developed a new system for implementing mitigation measures in agricultural systems to reduce phosphorus losses to water. Moreover, within the EU Cost-Action 869 programme, a wide range of mitigation measures for reducing nutrient emissions from agriculture was collected [17]. Mitigation of nonpoint source nutrient pollution can be grouped into eight categories: (1) nutrient management; (2) crop management; (3) livestock management; (4) soil management; (5) water management within agricultural land; (6) land use change; (7) landscape management and (8) surface water management. These mitigation measures can be further divided into source and transport measures (Figure 1) [18,19].
Source measures typically belong to groups 1–4 and 6, whereas transport measures belong to groups 5, 7 and 8 (Figure 1). Mitigation measures can be adapted as mandatory requirements for farmers as was the case during the period 1987–2015 in Denmark. This strategy was successful as demonstrated by a reduction of nitrogen and phosphorus concentrations and loadings in streams and rivers of nearly 50% and 70%, respectively, since 1990 [20]. A new era of management has, however, evolved in Denmark involving the application of targeted mitigation measures in agriculture, including local N-retention in groundwater and surface waters [21], as well as identification of phosphorus loss hotspots in agricultural catchments (P-risk mapping) [22]. Currently, development, scientific testing and application of new mitigation measures are ongoing worldwide. Research into new and more engineered types of mitigation measures assisting in removing and capturing nutrients during the transport from source to recipient waters is in progress [18,19].
Some of the above issues are touched upon in this Special Issue from the Land use and Water Quality (LUWQ) conference series, of which the most recent, LuWQ2019, was held at Aarhus University from 3 to 6 June 2019.
2. History and Themes of the LuWQ Conference Series 2013–2021
The Land use and Water Quality conferences have their origin in the series of so-called international MonNO3 workshops focusing on monitoring the effectiveness of the European Nitrates Directive action programmes. The first MoNO3 workshop was held in The Hague in 2003 and the second in Amsterdam in 2009. The workshops were limited to invited researchers and policy advisors from north-west and central European countries. At the latter workshop, the importance of the European Water Framework Directive for nutrients and other agriculture-related pollutants became clear. Furthermore, in countries outside the European Union, interesting developments in agri-environmental research, water management and policies have taken place. Therefore, we decided to broaden the scope of the meetings and to continue them in the form of conferences.
Thematically, LuWQ currently covers a wide range of topics covered by the nine themes. Three themes relate to more fundamental research:
- (a)
- to increase our knowledge about ‘system functions’, i.e., basic hydrogeological and biogeochemical processes and related tools and methodologies,
- (b)
- water quality monitoring which is about improving the effectiveness and increasing the added value of monitoring,
- (c)
- impact of weather variability and climate change on water quality.
Three themes deal with the impact of policy and measures on water quality on plot, field, catchment and national scales:
- (d)
- assessing national or regional policy, e.g., with regard to the effectiveness of programmes of measures on water quality,
- (e)
- improving water quality by farm management practices (monitoring and modelling) and changes in land use,
- (f)
- improving water quality by establishing eco-technological mitigation measures and discussing development, testing, implementation and operation to quantify the effects of such measures.
The last three themes cover management and social–economic aspects:
- (g)
- managing protected areas for water supply and nature conservation including risk assessment techniques, monitoring and modelling,
- (h)
- decision-making on Programmes of Measures with topics which look into the role of stakeholder input and science in policy decision-making, and
- (i)
- implementation of Programmes of Measures that focusses on social and economic incentives and regulatory mandates that drive implementation (carrots and sticks).
At the first LuWQ conference in The Hague in 2013, we had a total of 170 participants from 30 different countries from all continents. Since then, the number of participants rose to 175 at the conference in Vienna in 2015, to 195 at the conference in The Hague in 2017 and to 240 participants in Aarhus in 2019. Feedback of participants resulted in a separate theme about monitoring in 2017 and distinguishing explicitly separate themes on farm management and technical measure for improving water quality in 2019. Furthermore the setup of the conference developed, for example, by introducing special sessions and workshops giving more room for in-depth discussion. However, the key strength of the LuWQ conferences remained which is twofold: (1) LuWQ has a well-defined narrow focus on ‘agriculture and water quality’ and (2) the conference is broadly oriented with regard to the various professional disciplines related to the conference topics.
3. Contributions
This Special Issue from the LuWQ2019 Conference hosted by Aarhus University, Danish Centre for Environment and Energy and Department of Bioscience, includes a total of 11 papers related to land use and water quality. The papers are grouped into four sections according to their main aims. The first section includes three papers discussing the use of the nitrogen surplus as an indicator to assess the impact of agri-environmental policies and climate change on water quality. Protection of groundwater from pollution is the guiding theme of the second section. The common theme of the three papers in the third section is sources and dynamics of nutrients in catchments, and the last section contains four papers that discuss new technologies for monitoring, mapping and analysing water quality.
3.1. Nitrogen Surplus
The nitrogen (N) surplus is an appealing indicator for assessing agri-environmental policies. Klages et al. [23] used this indicator to demonstrate the effect of the sunny and dry summer of 2018 on the environment. The 2018 drought resulted in yield reductions between 10 and 35% of the main crops grown in Germany, which led to an additional average N surplus of 30 kg/ha. Their calculations showed that this surplus would have been higher (43 kg/ha) if farmers had not changed their regular fertilisation practices. Klages et al. [23] referred to data showing an increase in mineral N in soil (upper 0.9 m) in southern Germany of 36 kg/ha between spring 2018 and spring 2019. They therefore concluded that water shortages in a changing climate not only impacted agricultural production and yields but also created further challenges and threats to nutrient management and the environment. To provide farmers with tools to reduce these risks, they discussed measures for bringing down N losses in autumn and winter, counteracting the risk of crop failure and to increase N-efficiency during the cropping season.
However, in a second paper, Klages et al. [24] questioned the use of the N surplus as a unified indicator for water pollution at farm level in Europe. They analysed the methods of fertilisation planning and nitrogen budgeting at farm level in fourteen European countries and came to the conclusion that there is no unified indicator to the assist management of nutrients and water quality at farm level. Although fertilisation planning is defined as “good agricultural practice” in the Nitrates Directive, the directive does not accept the N surplus as an indicator for the success of its implementation into national legislation. The authors argued that this is an obstacle to harmonising the methodology of using nitrogen budgets as agri-environmental indicators at farm level. Additionally, the lack of farm specific data for calculating budgets makes the N surplus at farm level less reliable. Nevertheless, Klages et al. [24] state that nitrogen budgets at farm level can serve as a simple benchmark instrument, next to autumn mineral nitrogen values of the soil, to identify the best management practices under defined environmental and farming conditions.
A model-based assessment of the nitrogen surplus can also be used to analyse the fate of agricultural nitrogen inputs into groundwater and nitrate concentrations in leachate as described in the paper by Wendland et al. [25]. They coupled a water balance model, an agro-economic model and a reactive transport model to calculate nitrate concentrations in leachate from N emissions from agriculture, urban systems and small sewage plants in North Rhine-Westphalia with a spatial resolution of 100 by 100 m. Wendland et al. [25] compared the modelled nitrate concentrations in leachate of different land uses with measured nitrate concentrations in groundwater from 1500 monitoring wells. The model results corresponded well with the measured results, with the exception of wells located in aquifers with high denitrification capacities due to the fact that denitrification in groundwater was not accounted for in the modelled nitrate concentrations in the leachate. Wendland et al. [25] highlight the importance of considering systematically not only agricultural N-emissions when modelling nitrate concentrations in densely populated regions, but argued that N-inputs from all sources (including small sewage plants, urban systems and nitrogen oxides deposition) should be included, and such a model seems promising for evaluating the relative contribution of each pollutant to the overall N-pollution. The latter has supported the selection and adequate dimensioning of regionally adapted agricultural N reduction measures.
3.2. Protection of Groundwater from Pollution
The paper by Nicholson and colleagues [26] is a comprehensive review carried out within the framework of the FAIRWAY project where approaches to protect drinking water from nitrate and pesticide pollution have been assessed. The authors reviewed more than 150 decision support tools (DSTs) applied by farmers, advisors, water managers and policy makers across the European Union with the aim to identify tools applicable at farm scale. Out of these, 12 DSTs were selected for practical testing at nine case study sites across Europe, based on their pertinence to the local challenges at the nine locations. It turned out that the exchange of DSTs across Europe is still challenging because of the different legislative environments, advisory frameworks, country-specific data/calibration requirements, regional climate/soil differences, and language issues. Specifically, the authors found that although many countries have developed comparable DSTs for similar problems, these—albeit being based on the same input data—may deliver very different results. The authors conclude that the potential for exchange of DSTs between countries is limited at present but necessary in order to promote a more effective drinking water protection within EU, for instance by collecting the required data in such a way that any transnational DST can be used consistently and thereby increase the comparability between regions. Although the paper focuses on Europe, the concept may also be applicable in other regions experiencing problems with high nitrate and pesticide concentrations in groundwater sources.
3.3. Nutrient Sources and Dynamics in Catchments
The paper “Influence of Farming Intensity and Climate on Lowland Stream Nitrogen” by Goyenola et al. [27] elucidates the patterns and driving factors behind N fluxes in lowland stream ecosystems differing in land use, soil characteristics and climatic-hydrological conditions. For the purpose of the paper, three complementary monitoring sampling characteristics were applied to 43 selected streams showing contrasting farming intensities in a humid subtropical climate with flashy conditions in Uruguay and a humid cold temperate with stable discharge conditions in Denmark. The results proved that, in both study regions, farming intensity determined the concentrations in and loss to streams of total dissolved N, nitrate and total N in spite of the differences in soil and climatic–hydrological conditions between the case study areas. Ammonium and dissolved organic N concentrations did not show significant responses to the farming intensity or climatic/hydrological conditions, whereas a high dissolved inorganic N to total dissolved N ratio was associated with the temperate climate and high base flow conditions but not with farming intensity. As for nitrate pollution of surface waters, the authors touched upon an issue of general importance in many lowland areas. In the Danish catchments, artificial drainage through tile drains is widespread, these acting as a shortcut pathway for the transport of nitrate from the soils to surface waters. As part of the nitrate leached from soils is transported directly in tile drains to streams and thus escapes from the denitrification processes in the groundwater of lowland areas, connected streams draining intensively farmed catchments are characterised by higher nitrate concentrations than streams in intensively farmed catchments without drainage systems such as the subtropical streams in Uruguay.
Chen et al. [28] draw attention to the source apportionment and spatiotemporal dynamics of nitrogen distribution and transport in hilly areas with a monsoon climate. Specifically, the paper presents the results of applying a SWAT model to the Qiandao Lake Basin (China) to identify drivers and transport processes in order to facilitate effective nutrient management. The simulation showed that the basin’s annual average total nitrogen load between 2007 and 2016 of ca. 11,500 tons was represented realistically by the model. The authors conclude that most of all available optimised localised SWAT model parameters suitable for hilly areas with a monsoon climate, such as shallow soil layers, were needed to provide reliable estimates, e.g., with regard to realistic representation of the N loss peak from fertilised tea plantations in the subsurface flow in the period before the rainy season. For such areas with intensive agriculture and high total nitrogen (TN) yields, the authors suggest that water conservation practices should be implemented. Another main finding was that the largest contributors to the N loads were domestic sewage (ca. 22%) and livestock production (21%), which highlights the need for not only constructing more wastewater treatment plants in areas identified as sites of high domestic and industrial pollution but also for increasing their operational efficiency. Although the paper focuses on a Chinese catchment, the concept of optimised localised SWAT model parameters may be relevant for application in similar monsoon basins elsewhere that experience problems with nitrate pollution of surface waters.
Ta et al. [29] performed a distributed model analysis on the gap between the current water status and the good ecological status stipulated by the European Water Framework Directive (WFD) for an entire region of Germany (state of Schleswig-Holstein) by applying the model system GROWA-MEPhos with high spatial resolution. The model results on water balances and phosphorus sources and emissions showed that phosphorus target concentrations were exceeded in 60% of the 6407 analysed sub-catchments. The authors also found that a 269 tons P year-one reduction of the phosphorus input to rivers and lakes in Schleswig-Holsten is required, corresponding to approximately 31% of the total emissions to surface waters. As most of the phosphorus emissions into surface waters are derived from agricultural diffuse sources, Ta et al. [29] concluded that the implementation of measures directed against fertilisation and erosion control is needed. Moreover, improved treatment of waste in sewage treatment plants may be an option, especially when they play a major emission role in urban areas. Finally, the authors found that technically sound and plausible methods are required to better describe the phosphorus retention processes in rivers and lakes in order to improve the model results.
3.4. New Technologies for Monitoring, Mapping and Analysing Water Quality
Song et al. [30] investigated the effects of land use on water quality across multiple spatial scales based on both circular and riparian buffers in a rapidly urbanised region in Hangzhou City, China. Their results showed that total nitrogen (TN) and total phosphorus (TP) concentrations were closely related to land use at circular buffer scale, while relatively strong correlations were found between land use and algae biomass at riparian buffer scale. At circular buffer scale, significant positive correlations appeared between land use and TN concentrations when areas of industrial land, urban greenspace and roads increased, whereas negative correlations were found with forests, lakes, ponds and rivers. In the case of TP, significant correlations emerged between land use and industrial areas at circular buffer scale, the correlation improving with increasing buffer size (100 m to 1000 m). In addition, significant correlations existed between land use and algae biomass (total chlorophyll a), with the clearest correlation occurring at the riparian buffer scale, and the authors therefore concluded that riparian buffer zones might play a key role in the conservation of aquatic ecosystems. Finally, the variation in water quality explained by landscape metrics increased with increasing buffer size, implying that land use patterns may have a closer correlation with water quality at larger spatial scales than those of this investigation (maxima of 1000 m for circular buffers and 300 m for riparian buffers).
Zhang et al. [31] investigated a water quality predictive model based on a combination of Kernal Principal Component Analysis (kPCA) and a Recurrent Neural Network (RNN) to forecast the trend of dissolved oxygen based on sensor data on electrical conductivity, pH, turbidity and chlorophyll-a in the Burnett River, Australia. Enormous amounts of water quality data are collected by advanced sensors, and the authors therefore foresee that use of data-driven models for predicting trends in water quality will increase in the future. The water quality variables used in their investigation were reconstructed based on the kPCA method, which aims to reduce the noise from raw sensory data and preserve usable data. Due to the RNN’s recurrent connections, their model was able to include previously gathered information to predict a trend for the future of water quality data. The kPCA-RNN model achieved R2 scores up to 0.908, 0.823 and 0.671 in predicting the concentration of dissolved oxygen in the upcoming 1, 2 and 3 h, respectively, using data from the previous 24 h time intervals as the model input. The predictive accuracy of the kPCA–RNN model was at least 8-17% better than that of other comparative models. Zhang et al. [28] concluded that the model inputs can be improved to include extra information such as rainfall and to cover longer periods of time and, also, that the water quality predictive model can be extended to support simultaneous prediction of multiple water variables.
Hashemi et al. [32] investigated nutrient concentration–discharge (C–Q) relationships for hysteresis behaviours and export regimes in 87 Nordic small streams draining mini-catchments from three Nordic countries (Finland, Sweden and Denmark). The classification applied is based on a combination of stream export behaviour (dilution, constant, enrichment) and hysteresis rotational pattern (clockwise, no rotation, anticlockwise). The classification is intended to assist in the development of pollution monitoring and management in catchments as it requires an in-depth understanding of spatial and temporal factors controlling nutrient dynamics in streams. Hashemi et al. [32] documented that the dominant nutrient export regimes were enrichment for NO3− and constant for total organic N (TON), dissolved reactive P (DRP), and particulate P (PP). Nutrient hysteresis patterns were primarily clockwise or no hysteresis. A Principal Component Analysis (PCA) considering the effects of catchment size, land use, climate, and dominant soil type showed that land use and air temperature were the dominant factors controlling nutrient C–Q types. Therefore, the nutrient export behaviour in streams draining Nordic mini-catchments seems to be dominantly controlled by their land use characteristics and, to a lesser extent, their climate.
Kim et al. [33] investigated lag time as an indicator of the link between nitrogen (N) surplus in agriculture and groundwater nitrate concentrations utilizing a cross correlation analysis method. The authors used groundwater monitoring data from three case study sites with groundwater-based drinking water abstraction: Tunø and Aalborg-Drastrup in Denmark and La Voulzie in France. In these case study sites, soil surface N surplus and long-term groundwater monitoring data were available for the analysis. Kim et al. [33] found that for Tunø and La Voulzie, where matrix flow is the dominant groundwater pathway, the N lag times continuously increased with an increasing distance from the agricultural N source (in Tunø: from 0 to 20 years between 1.2 to 24 m below the land surface (mbls); at La Voulzie: from 8 to 24 years along the groundwater pathway). However, in Aalborg-Drastrup where both matrix and fracture flows are important groundwater pathways, the N lag times showed a greater variability with depth: for instance, a 23-year lag time at 9–17 mbls compared to a 4-year lag time at 21–23 mbls. The N lag times estimated in the study were generally found to be comparable to groundwater ages measured by chlorofluorocarbons (CFCs). Kim et al. [33] concludes that the lag time may be a useful indicator to reveal the hydrogeological links between the agricultural pressure and water quality state, which is fundamental for a successful implementation of drinking water protection plans.
To sum up, this Special Issue clearly fills in a gap in the knowledge about the many linkages between land use and water quality. Special thanks are due to all the authors for accepting the call and to the publishers for their professional assistance at all stages.
Author Contributions
All authors have read and agreed to the published version of the manuscript.
Funding
This study was part of the Nordic Centre of Excellence BIOWATER project and funded by Nordforsk (project number 82263).
Conflicts of Interest
The authors declare no conflict of interest.
References
- Tilman, D.; Cassman, K.G.; Matson, P.A.; Naylor, R.; Polasky, S. Agricultural sustainability and intensive production practices. Nature 2002, 418, 671–677. [Google Scholar] [CrossRef] [PubMed]
- Erisman, J.W.; Sutton, M.A.; Galloway, J.; Klimont, Z.; Winiwarter, W. How a century of ammonia synthesis changed the world. Nat. Geosci. 2008, 1, 636–639. [Google Scholar] [CrossRef]
- Jensen, L.S.; Schjoerring, J.K.; van der Hoek, K.W.; Damgaard-Poulsen, H.; Zevenbergen, J.F.; Pallière, C.; Lammel, J.; Brentrup, F.; Jongbloed, A.W.; Willems, J.; et al. Benefits of nitrogen for food fibre and industrial production. In The European Nitrogen Assessment; Sutton, M.A., Howard, C.M., Erisman, J.W., Billen, G., Bleeker, A., Grennfelt, P., van Grinsven, H., Grizzetti, B., Eds.; Cambridge University Press: Cambridge, UK, 2011. [Google Scholar]
- Bobbink, R.; Hicks, K.; Galloway, J.N.; Spranger, T.; Alkemade, R.; Ashmore, M.; Bustamante, M.; Cinderby, S.; Davidson, E.A.; Dentener, F.; et al. Global assessment of nitrogen deposition effects on terrestrial plant diversity: A synthesis. Ecol. Appl. 2010, 20, 30–59. [Google Scholar] [CrossRef] [PubMed] [Green Version]
- Pimentel, D.; Houser, J.; Preiss, E.; White, O.; Fang, H.; Mesnick, L.; Barsky, T.; Tariche, S.; Schreck, J.; Alpert, S. Water resources: Agriculture, the environment, and society source. BioScience 1997, 47, 97–106. [Google Scholar] [CrossRef]
- Peierls, B.L.; Caraco, N.F.; Pace, M.L.; Cole, J.J. Human influence on river nitrogen. Nature 1991, 350, 386–387. [Google Scholar] [CrossRef]
- Townsend, A.R.; Howarth, R.W.; Bazzaz, F.A.; Booth, M.S.; Cleveland, C.C.; Collinge, S.K.; Dobson, A.P.; Epstein, P.R.; Holland, E.A.; Keeney, D.R.; et al. Human health effects of a changing global nitrogen cycle. Front. Ecol. Environ. 2003, 1, 240–246. [Google Scholar] [CrossRef]
- Reid, W.V.; Mooney, H.A.; Cropper, A.; Capistrano, D.; Carpenter, S.R.; Chopra, K.; Dasgupta, P.; Dietz, T.; Duraiappah, A.K.; Hassan, R.; et al. Millennium Ecosystem Assessment: Ecosystems and Human WellBeing: Synthesis; Island Press: Washington, DC, USA, 2005. [Google Scholar]
- Billen, G.; Silvestre, M.; Grizzetti, B.; Leip, A.; Garnier, J.; Voss, M.; Howarth, R.W.; Bouraoui, F.; Lepistö, L.; Kortelainen, P.; et al. Nitrogen flows from European watersheds to coastal marine waters. In The European Nitrogen Assessment; Sutton, M.A., Howard, C.M., Erisman, J.W., Billen, G., Bleeker, A., Grennfelt, P., van Grinsven, H., Grizzetti, B., Eds.; Cambridge University Press: Cambridge, UK, 2011. [Google Scholar]
- Sims, J.T.; Sharpley, A.N. Phosphorus: Agriculture and the Environment; Book Series: Agronomy Monographs; American Society of Agronomy, Inc.; Crop Science Society of America, Inc.; Soil Science Society of America, Inc.: Madison, WI, USA, 2005; Volume 46, p. 1121. ISBN 9780891181576. Online ISBN 9780891182696. [Google Scholar] [CrossRef]
- Schlesinger, W.H. On the fate of anthropogenic nitrogen. Proc. Natl. Acad. Sci. USA 2009, 104, 203–208. [Google Scholar] [CrossRef] [Green Version]
- Voß, M.; Baker, A.; Bange, H.W.; Conley, D.; Cornell, S.; Deutsch, B.; Engel, A.; Ganeshram, R.; Garnier, J.; Heiskanen, A.-S.; et al. Nitrogen processes in coastal and marine systems. In The European Nitrogen Assessment; Sutton, M.A., Howard, C.M., Erisman, J.W., Billen, G., Bleeker, A., Grennfelt, P., van Grinsven, H., Grizzetti, B., Eds.; Cambridge University Press: Cambridge, UK, 2011. [Google Scholar]
- European Commission. Directive of the Council of December 12, 1991 Concerning the Protection of Waters against Pollution Caused by Nitrates from Agricultural Sources (91/676/EEC); European Commission: Brussels, Belgium, 1991; pp. 1–8. [Google Scholar]
- European Commission. Directive 2000/60/EC of the European Parliament and of the Council of 23 October 2000 Establishing a Framework for the Community Action in the Field of Water Policy; European Commission: Brussels, Belgium, 2000; pp. 1–72. [Google Scholar]
- European Union. Directive 2006/118/EC on the protection of groundwater against pollution and deterioration Directive 2006/118/EC of the European Parliament and of the Council. Off. J. Eur. Union 2006, 372, 19–31. [Google Scholar]
- Schoumans, O.F.; Chardon, W.J.; Bechmann, M.E.; Gascuel-Odoux, C.; Hofman, G.; Kronvang, B.; Rubæk, G.H.; Ulén, B.; Dorioz, J.-M. Mitigation options to reduce phosphorus losses from the agricultural sector and improve surface water quality: A review. Sci. Total Environ. 2014, 15, 468–469. [Google Scholar] [CrossRef]
- Bechmann, M.; Gascuel-Odoux, C.; Hofman, G.; Kronvang, B.; Litaor, M.I.; Lo Porto, P.A.; Newell-Price, G.R. Mitigation Options for Reducing Nutrient Emissions from Agriculture. A Study Amongst European Member States of Cost Action 869; Schoumans, O.F., Chardon, W.J., Eds.; Wageningen, Alterra, Alterra-Report 2141; 2011; p. 144. Available online: https://www.researchgate.net/publication/254832937_Mitigation_options_for_reducing_nutrient_emissions_from_agriculture_a_study_amongst_European_member_states_of_Cost_action_869 (accessed on 3 June 2020).
- Hoffmann, C.C.; Zak, D.; Kronvang, B.; Kjaergaard, C.; Carstensen, M.V.; Audet, J. An overview of nutrient transport mitigation measures for improvement of water quality in Denmark. Ecol. Eng. 2020. [Google Scholar] [CrossRef]
- Carstensen, M.V.; Hashemi, F.; Hoffmann, C.C.; Zak, D.; Audet, J.; Kronvang, B. Efficiency of mitigation measures targeting nutrient losses from agricultural drainage systems: A review. Ambio 2020. [Google Scholar] [CrossRef] [PubMed]
- Dalgaard, T.; Hansen, B.; Hasler, B.; Hertel, O.; Hutchings, N.J.; Jacobsen, B.H.; Jensen, L.S.; Kronvang, B.; Olesen, J.E.; Schjoerring, J.K.; et al. Policies for agricultural nitrogen management—Trends, challenges and prospects for improved efficiency in Denmark. Environ. Res. Lett. 2014, 9, 115002. [Google Scholar] [CrossRef]
- Højberg, A.L.; Windolf, J.; Børgesen, C.D.; Troldborg, L.; Tornbjerg, H.; Blicher-Mathiesen, G.; Kronvang, B.; Thodsen, H.; Ernstsen, V. National nitrogen model, catchment model for loading and mitigation. In National Geological Survey for Denmark and Greenland Report; 2015; p. 111. ISBN 978-87-7871-417-6. (In Danish) [Google Scholar]
- Andersen, H.E.; Kronvang, B. Modifying and evaluating a P index for Denmark. Water Air Soil Pollut. 2006, 174, 341–353. [Google Scholar] [CrossRef]
- Klages, S.; Heidecke, C.; Osterburg, B. The Impact of Agricultural Production and Policy on Water Quality during the Dry Year 2018, a Case Study from Germany. Water 2020, 12, 1519. [Google Scholar] [CrossRef]
- Klages, S.; Heidecke, C.; Osterburg, B.; Bailey, J.; Calciu, I.; Casey, C.; Dalgaard, T.; Verloop, K.; Velthof, G. Nitrogen Surplus—A Unified Indicator for Water Pollution in Europe? Water 2020, 12, 1197. [Google Scholar] [CrossRef] [Green Version]
- Wendland, F.; Bergmann, S.; Eisele, M.; Gömann, H.; Herrmann, F.; Kreins, P.; Kunkel, R. Model-Based Analysis of Nitrate Concentration in the Leachate—The North Rhine-Westfalia Case Study, Germany. Water 2020, 12, 550. [Google Scholar] [CrossRef] [Green Version]
- Nicholson, F.; Laursen, R.K.; Cassidy, R.; Farrow, L.; Tendler, L.; Williams, J.; Surdyk, N.; Velthof, G. How Can Decision Support Tools Help Reduce Nitrate and Pesticide Pollution from Agriculture? A Literature Review and Practical Insights from the EU FAIRWAY Project. Water 2020, 12, 768. [Google Scholar] [CrossRef]
- Goyenola, G.; Graeber, D.; Meerhoff, M.; Jeppesen, E.; Teixeira-de Mello, F.; Vidal, N.; Fosalba, C.; Ovesen, N.B.; Gelbrecht, J.; Mazzeo, N.; et al. Influence of Farming Intensity and Climate on Lowland Stream Nitrogen. Water 2020, 12, 1021. [Google Scholar] [CrossRef] [Green Version]
- Chen, D.; Li, H.; Zhang, W.; Pueppke, S.G.; Pang, J.; Diao, Y. Spatiotemporal Dynamics of Nitrogen Transport in the Qiandao Lake Basin, a Large Hilly Monsoon Basin of Southeastern China. Water 2020, 12, 1075. [Google Scholar] [CrossRef] [Green Version]
- Ta, P.; Tetzlaff, B.; Trepel, M.; Wendland, F. Implementing a Statewide Deficit Analysis for Inland Surface Waters According to the Water Framework Directive—An Exemplary Application on Phosphorus Pollution in Schleswig-Holstein (Northern Germany). Water 2020, 12, 1365. [Google Scholar] [CrossRef]
- Song, Y.; Song, X.; Shao, G.; Hu, T. Effects of Land Use on Stream Water Quality in the Rapidly Urbanized Areas: A Multiscale Analysis. Water 2020, 12, 1123. [Google Scholar] [CrossRef] [Green Version]
- Zhang, Y.; Fitch, P.; Thorburn, P.J. Predicting the Trend of Dissolved Oxygen Based on the kPCA-RNN Model. Water 2020, 12, 585. [Google Scholar] [CrossRef] [Green Version]
- Hashemi, F.; Pohle, I.; Pullens, J.W.M.; Tornbjerg, H.; Kyllmar, K.; Marttila, H.; Lepistö, A.; Kløve, B.; Futter, M.; Kronvang, B. Conceptual Mini-catchment Typologies for Testing Dominant Controls of Nutrient Dynamics in Three Nordic Countries. Water 2020, 12, 1776. [Google Scholar] [CrossRef]
- Kim, H.; Surdyk, N.; Møller, I.; Graversgaard, M.; Blicher-Mathiesen, G.; Henriot, A.; Dalgaard, T.; Hansen, B. Lag Time as an Indicator of the Link between Agricultural Pressure and Drinking Water Quality State. Water 2020, 12, 2385. [Google Scholar] [CrossRef]
Figure 1.
Categories of mitigation options for nonpoint source nutrients in a landscape and catchment context.
Figure 1.
Categories of mitigation options for nonpoint source nutrients in a landscape and catchment context.

© 2020 by the authors. Licensee MDPI, Basel, Switzerland. This article is an open access article distributed under the terms and conditions of the Creative Commons Attribution (CC BY) license (http://creativecommons.org/licenses/by/4.0/).
Share and Cite
MDPI and ACS Style
Kronvang, B.; Wendland, F.; Kovar, K.; Fraters, D. Land Use and Water Quality. Water 2020, 12, 2412. https://doi.org/10.3390/w12092412
AMA Style
Kronvang B, Wendland F, Kovar K, Fraters D. Land Use and Water Quality. Water. 2020; 12(9):2412. https://doi.org/10.3390/w12092412
Chicago/Turabian StyleKronvang, Brian, Frank Wendland, Karel Kovar, and Dico Fraters. 2020. "Land Use and Water Quality" Water 12, no. 9: 2412. https://doi.org/10.3390/w12092412
Note that from the first issue of 2016, this journal uses article numbers instead of page numbers. See further details here.