Natural Surface Hydrocarbons and Soil Faunal Biodiversity: A Bioremediation Perspective


Department of Chemistry, Life Sciences and Environmental Sustainability, University of Parma, 43124 Parma, Italy
*
Author to whom correspondence should be addressed.
Water 2020, 12(9), 2358; https://doi.org/10.3390/w12092358
Submission received: 4 August 2020
/
Revised: 18 August 2020
/
Accepted: 19 August 2020
/
Published: 22 August 2020
(This article belongs to the Special Issue Hydrogeological Dynamics and Soil Biodiversity: An Interdisciplinary Approach)
Abstract
:Hydrocarbon pollution threatens aquatic and terrestrial ecosystems globally, but soil fauna in oil-polluted soils has been insufficiently studied. In this research, soil hydrocarbon toxicity was investigated in two natural oil seepage soils in Val D’Agri (Italy) using two different approaches: (i) toxicological tests with Folsomia candida (Collembola) and Eisenia fetida (Oligochaeta) and (ii) analysis of abundance and composition of micro- and meso-fauna. Soil sampling was done along 20 m-transepts starting from the natural oil seepages. Toxicological testing revealed that no exemplars of F. candida survived, whereas specimens of E. fetida not only survived but also increased in weight in soils with higher PAH concentrations, although no reproduction was observed. Analysis on microfauna showed that Nematoda was the most abundant group, with distance from seepages not affecting its abundance. Arthropoda results showed that Acarina, Collembola and Diptera larvae represented the most abundant taxa. The highest divergence in community composition was found between soils situated near seepages and at 5 m and 10 m distance. Arthropoda taxa numbers, total abundance and Acarina were lower in soils with high PAH concentration, while Diptera larvae were not significantly affected. Earthworms, together with Nematoda and Diptera larvae, could therefore represent ideal candidates in PAH degradation studies.
1. Introduction
Over the years, the development of the global economy has led to a growing demand for oil products. Activities related to oil extraction and use, however, are among the leading factors determining a variety of environmental issues. Among these, leaking underground and aboveground storage tanks, improper disposal of petroleum waste and accidental spills are the main cause of soil and groundwater contamination [1]. Extensive damage involving food webs, thus affecting human health, can result from such hydrocarbon contamination through a series of bioaccumulation events, as well as the percolation and transportation of contaminants.
Despite this, not all hydrocarbon-contaminated soils are a consequence of human activities, since about 80% of the total production of crude oil derives from natural terrestrial fields [2], which allows the effects of continuous discharges in natural seeps to be studied. Hydrocarbons are naturally found in underground geological formations, where they are produced from abundant organic matter and its chemical alteration, slowly migrating as a result of lithostatic pressure and tectonic activity, finally producing spontaneous hydrocarbon emissions that can be detected on the Earth’s surface [3]. These seepages can activate oxidation-reduction processes that cause changes in soil chemical and mineralogical composition. In addition, the gases that seep onto the surface partly displace soil air. This, together with bacterial oxidation of light hydrocarbons, generates an anaerobic environment that can directly or indirectly induce significant changes in the pH and oxidation-reduction potential of the surrounding environment [4,5]. An oxygen-poor environment, combined with changes in the solubility of macro- and micro-nutrients, is a well-known stress factor for plants [6]. Furthermore, accumulation of pollutants in animals and plant tissues may induce mutations, even causing death [7].
Such consequences of hydrocarbon contamination, however, are not exclusively confined to local systems: soil micro-biota diversity loss often results from the spread of a limited number of fast-growing hydrocarbon degraders, which are dominant in contaminated conditions [8]. Such a phenomenon is also to be seen among soil fauna [9,10], which is well known to be involved in key processes such as organic matter decomposition, nutrient mineralization and microbial spore dispersal. Considering that several species of invertebrates are negatively affected by hydrocarbons, the consequent loss of biodiversity can affect the entire ecosystem functioning [11]. Some studies have shown that the soil faunal community observed in a contaminated area differs from uncontaminated areas. For instance, [12] observed that communities in polluted soils exhibited the dominance of different groups such as Collembola, Protura and Diplura, which were suggested to positively correlate with major detected contaminants (Pb, Sb). At the same time, Symphyla showed a negative correlation with these pollutants [12]. Another study, on the other hand, revealed that Isopoda and Hymenoptera abundances in petrochemical-contaminated sites were higher when compared with uncontaminated areas [13]. Thus, not all terrestrial invertebrates show high sensitivity to hydrocarbon contamination, and it is possible that organisms living in seepage areas find a suitable environment that can contribute additional organic carbon [14]. In addition, the ability of soil fauna to live in association with microbial communities should be taken into account, since some of these microbes utilize hydrocarbons as an energy source and are responsible for the breakdown of organic pollutants [10,15].
This study combines two different approaches, both aimed at quantifying soil surface hydrocarbon effects on soil communities, with a particular focus on soil fauna. First, the effects of natural hydrocarbons in soils are assessed on two species—Folsomia candida Willem, 1902 (Collembola: Isotomidae) and Eisenia fetida (Savigny, 1826; Oligochaeta: Lumbricidae), both extensively used in ecotoxicological testing—using a lab approach. Second, the responses of the soil faunal community to hydrocarbons naturally present on the surface of an area characterised by active oil seepages are analysed with regard to community abundance and composition. If soil fauna survives in such a stressful environment, we can hypothesise that it has the ability to take advantage of the presence of hydrocarbons. Consequently, the identification of the most resistant groups may be the goal for further studies aimed at deepening the potential of specific soil fauna to accelerate decontamination processes in bioremediation systems, either directly or indirectly, through symbiotic relationships that could enhance microbial degradation.
2. Materials and Methods
2.1. Area of Study
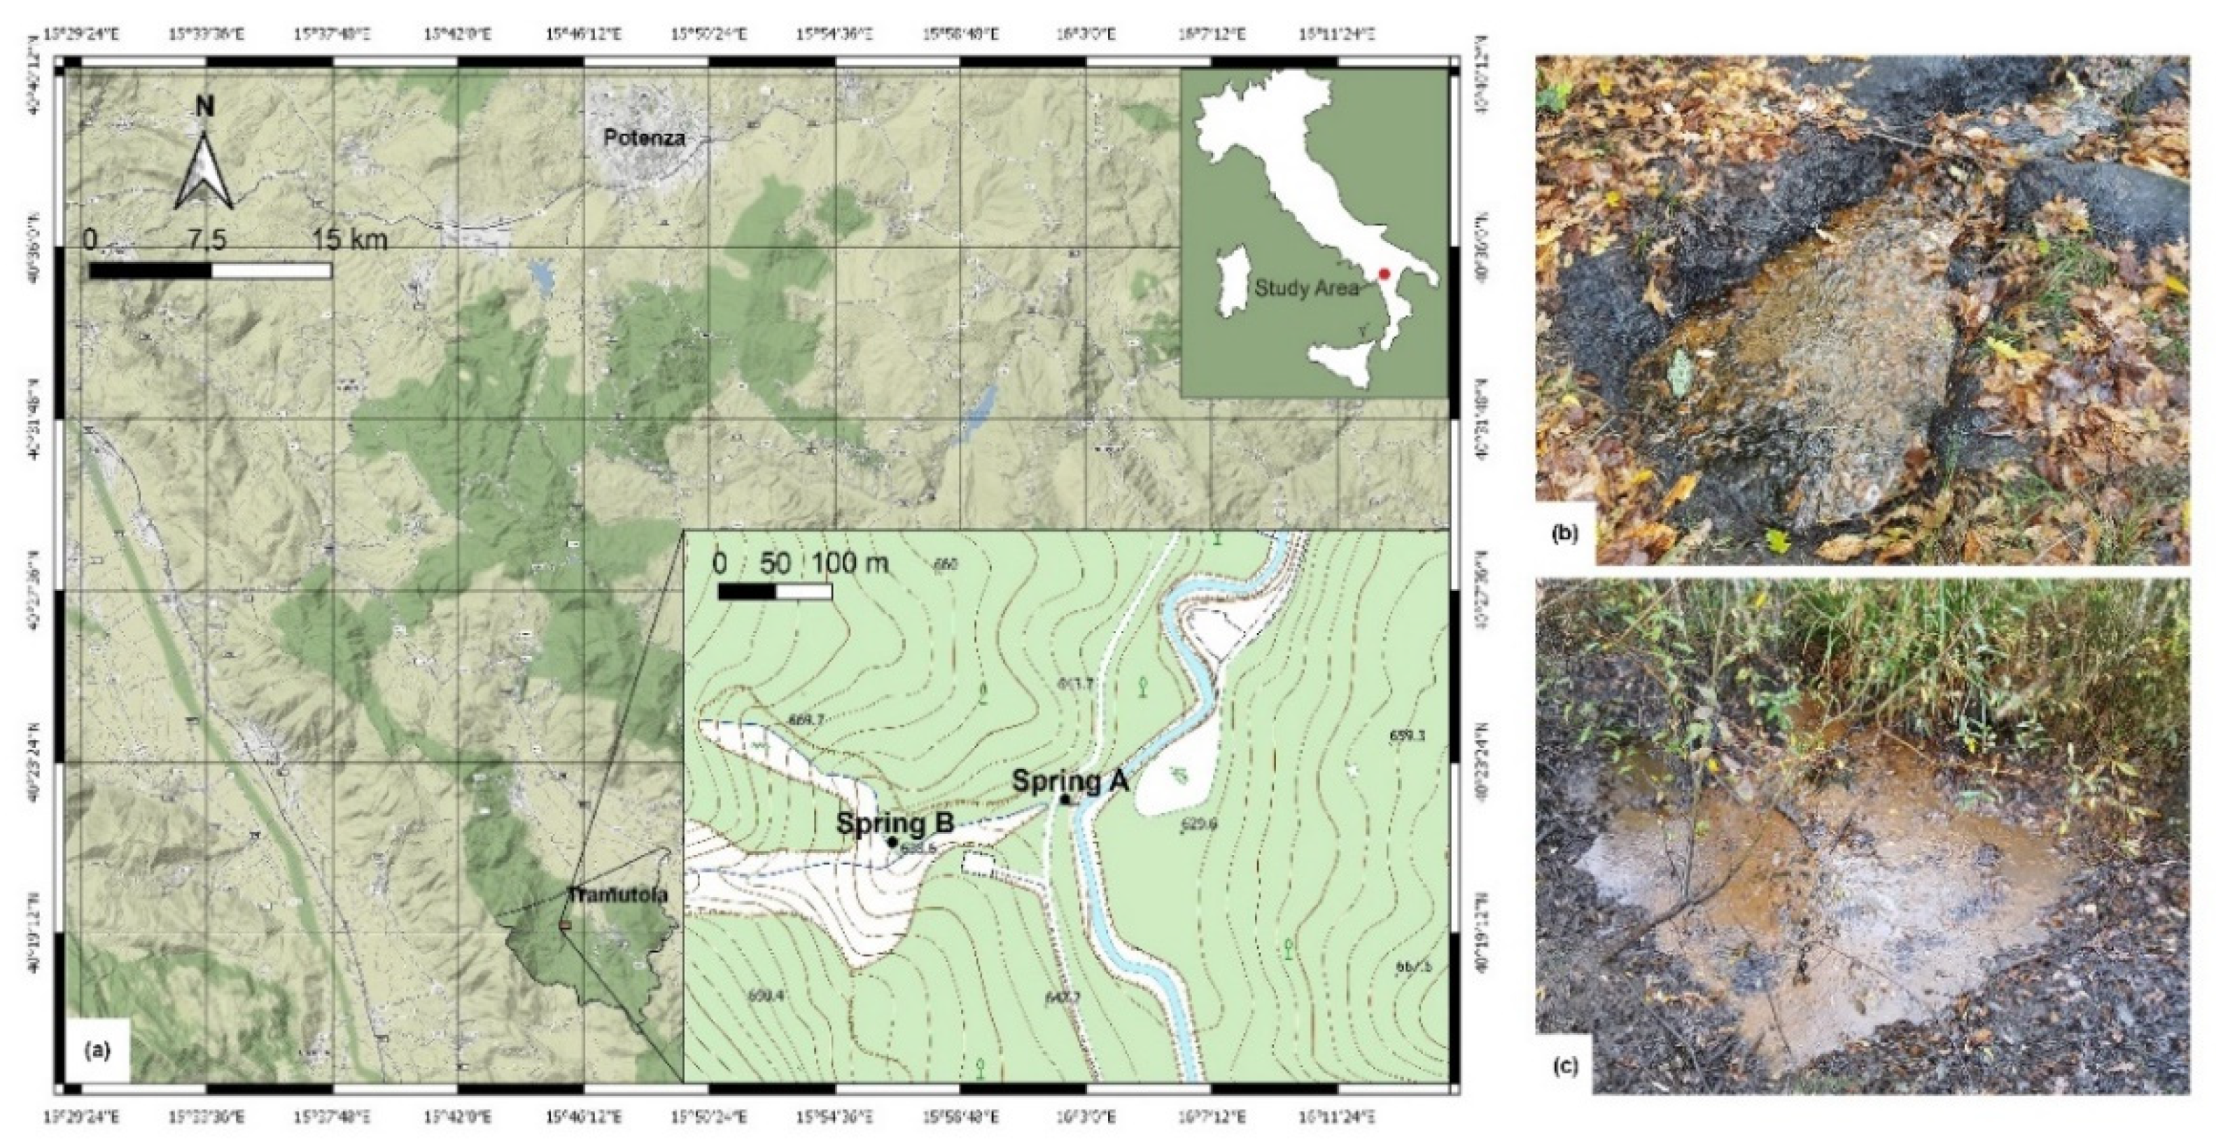
In Italy, natural hydrocarbon emissions are mainly located along a strip of land parallel to the Apennine chain: The Southern Apennine Trust-belt, known as Val d’Agri, ranks among the largest onshore petroleum deposits in Europe, the source rocks of which are marine anoxic carbonates facies containing sulphur [16]. Val d’Agri, located near the town of Potenza, is a 12 km-wide and 30 km-long intermontane basin, covering the upstream extent of the entire Agri River drainage basin, oriented NW-SE at about 600 m a.s.l. and filled with alluvial and lacustrine deposits hundreds of meters thick [17].
In Val d’Agri, the main oilfield is located within fractured carbonate rocks attributable to the Apennine Platform [18,19,20]. Oil and gas are stored within limestone and dolomite from the Miocene to Cretaceous period [21]. The reservoir is under a Pliocene siliciclastic succession and a thick layer of mélange.
Hydrocarbon extraction dates from the 1990s, through wells placed between 1800 m and 3500 m below sea level. Spontaneous gas (mainly H2S) and hydrocarbon emissions, however, have occurred in Val d’Agri since the 19th century, particularly in the Tramutola municipality and, from the 20th century, have led to the drilling of many exploration and production wells near the hydrocarbon seepages; these were decommissioned and have been closed for several decades.
The study area is located about 2 km west of Tramutola, in the Rio Cavolo valley (a tributary of the Agri River), where plant cover is mainly represented by oak, hygrophilous formations and thermophilic shrubs. Within this area, two sites characterised by the presence of oil seepages were selected for soil sampling in March 2019: site A, close to a hydrocarbon spring located at 636 m a.s.l., and site B, close to a diffuse hydrocarbon spring located at 643 m a.s.l. (Figure 1).
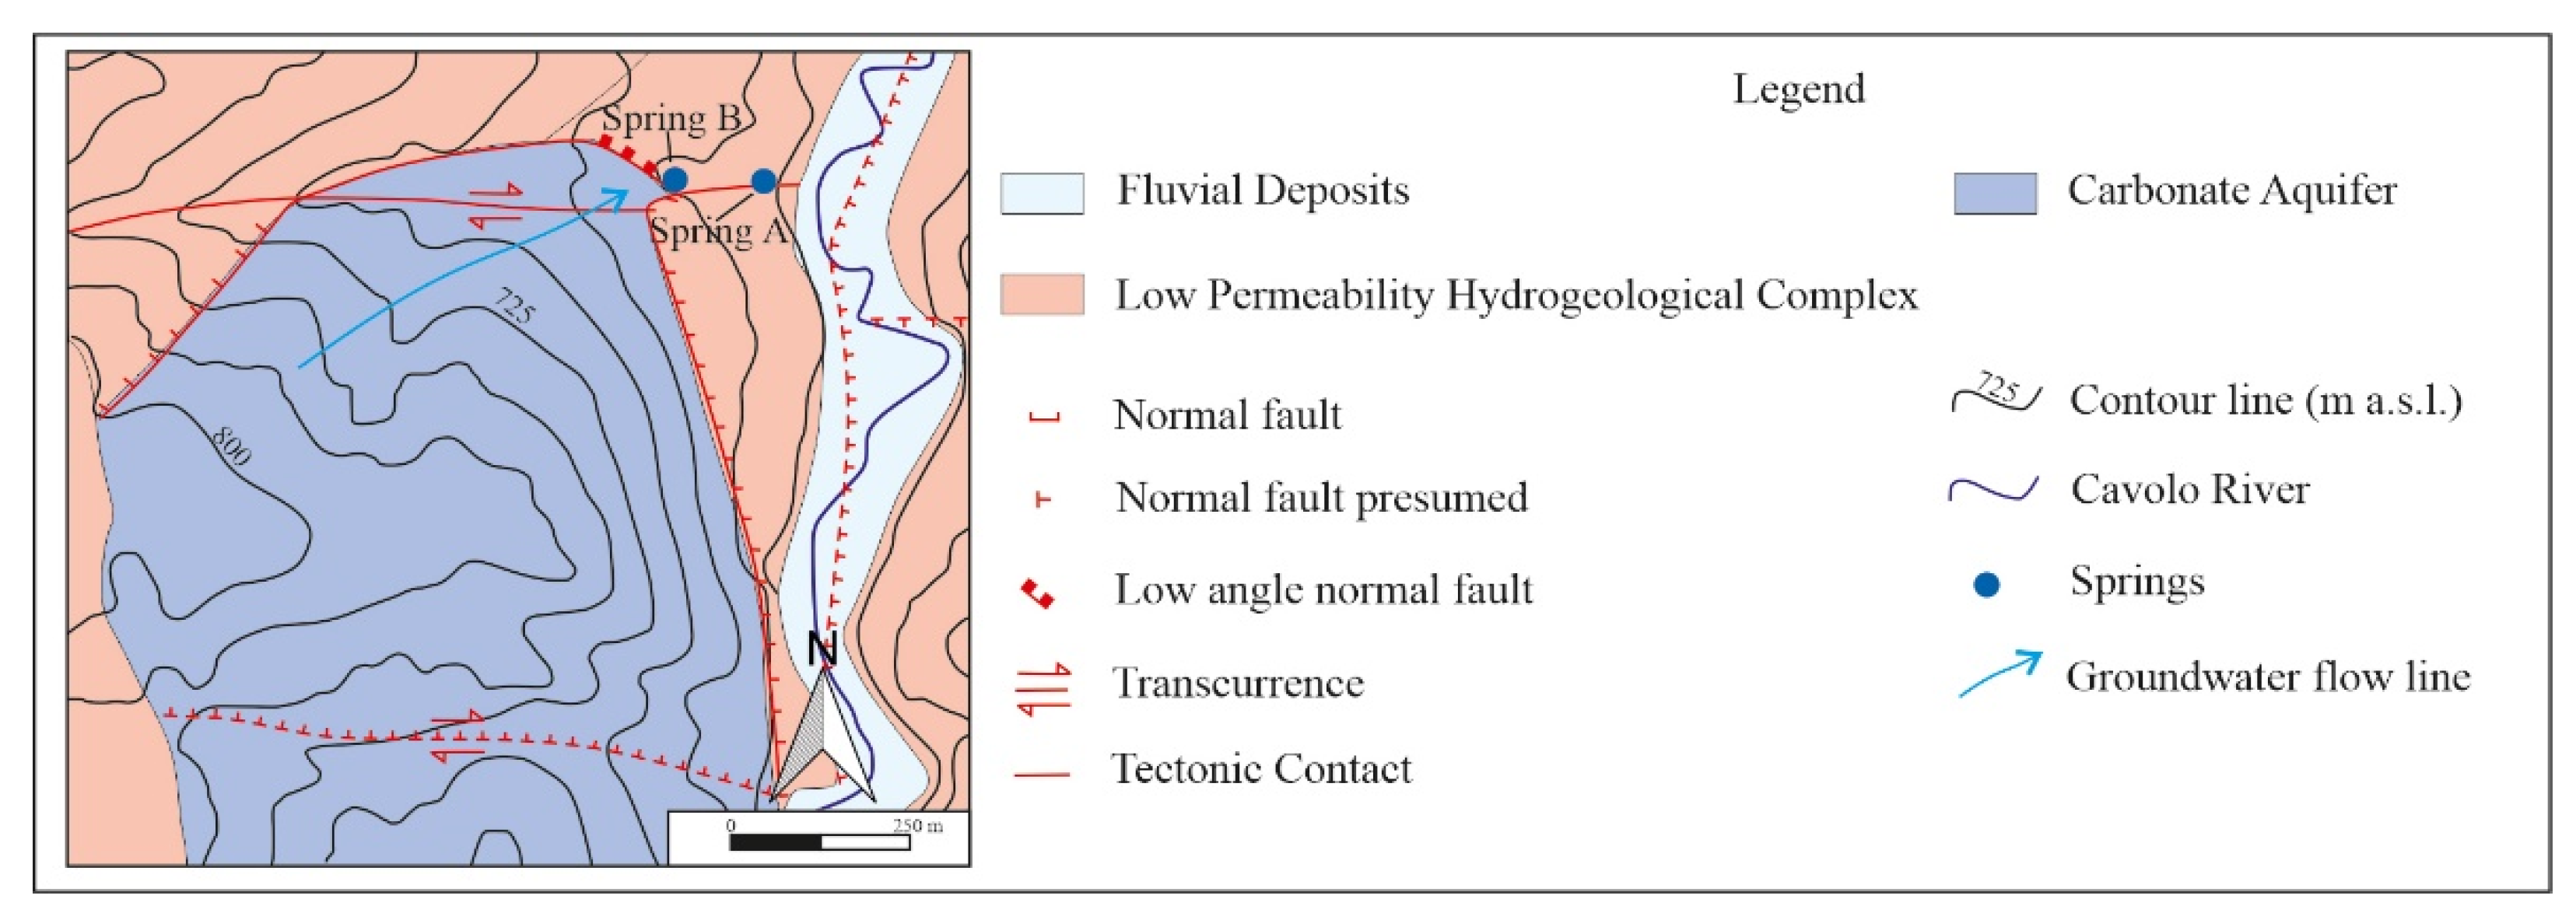
Both hydrocarbon springs are situated over an E-W tectonic fault zone [24]. From the hydraulic point of view, this fault zone acts as a conduit, as in classic karst systems [25] or as a conduit-barrier system (e.g., in carbonate aquifers of southern Italy and in other similar systems abroad; [26,27,28,29,30,31,32,33,34]), therefore enhancing the local upflow of fluids. Perennial springs are mainly fed by the shallow groundwater flowing within the nearby carbonate aquifer (Figure 2), with a possible contribution from a deeper confined aquifer [35]. In the wider hydrogeological context, the carbonate system belongs to the so-called Mesozoic carbonate platform complex, characterised by very high permeability due to a well-developed fracture network and karst conduits [36]. In contrast, the deeper confined system belongs to the so-called syn-orogenic turbidite complex and the outer/inner basins complex, characterized by a lower permeability [36].
2.2. Chemical Analysis on Soil
BTEX (Benzene, Toluene, Ethylbenzene and Xylene) and PAH (Polycyclic Aromatic Hydrocarbons) concentrations in soils with hydrocarbon seepages (called A0 and B0, Figure 1b,c), collected near springs A and B, were determined. The analyses were performed by Biochemie Lab S.r.l. following the EPA 5030C 2003 + EPA 8015D 2003 protocol for BTEX and the EPA3510C 1996 + EPA 8270E 2018 protocol for PAH.
The other soil samples collected for zoological purposes along the transects starting from A0 (called A5 and A10) and from B0 (called B5, B10, B15 and B20) were not analysed in the present study, since no detectable hydrocarbons were reported by previous observations at these sites.
2.3. Ecotoxicological Tests on F. candida and E. fetida
The springtail F. candida (Exapoda: Collembola) and the earthworm E. fetida (Oligochaeta: Lumbricidae) were used to test soil toxicity in A0 and B0.
F. candida came from laboratory cultures at Parma University. Growth, survival and reproduction tests were carried out according to [37]. Individual specimens were maintained at 20 ± 2 °C (with 50–55% RH) and fed weekly on a pulverized mixture of dried organic cereals (20% wheat, 20% oats, 20% rye, 20% spelt, and 20% rice). Specimens used for egg deposition (aimed to obtain age-synchronized juveniles to be used in the test) were collected from breeding containers and mixed to prevent them originating from a single breeding line. All springtails used for testing were 10 days old and age-synchronized by removing eggs from the deposition cultures and, once hatched, inserting juveniles into Petri dishes with moistened breeding substrate with a ratio of 8:1 (w/w) plaster of Paris and activated carbon powder.
For survival and reproduction tests, Petri dishes were filled with 0.5 cm of testing soil, wetted with deionized water to reach 40–60 % of the total water holding capacity (WHC). Five replicates were set up for both soil A0 and B0. Ten F. candida specimens aged 10 days were added to each Petri dish using an exhauster, checking that none of the exemplars died during the process. Springtails were maintained at 20 ± 2 °C with 70–80% relative humidity (RH) and fed with the same mixture of cereals used during the breeding. The Petri dishes were incubated for 28 days, aerated once a week and watered when water loss exceeded 2% of the initial WHC. At the end of this period, the number of surviving adults and new-born springtails (when present) were recorded using a stereomicroscope with floatation technique. In order to assess the validity of the test, the same procedure was applied using a control soil consisting of a standard substrate: 70% quartz sand, 20% kaolinite clay, 10% peat and calcium carbonate to adjust the pH to 6.0 ± 0.5.
The sexually mature E. fetida were supplied by a worm breeding company. Survival and reproduction tests were carried out according to [38]. Test containers were filled with 500 g of testing soil, to which deionised water was added to achieve a soil moisture of 40–60% of the WHC. Five replicates were prepared for both soil A0 and B0. Ten earthworms were washed with distilled water, dried and weighed, then placed in the container and maintained at 20 ± 2 °C with 80–85% RH for 28 days. During the test period, earthworms were fed weekly with cattle manure, and water was added when water loss > 2% of the initial WHC. At the end of the test, surviving earthworms and cocoons (when present) were counted. Surviving specimens were washed with distilled water and weighed. To assess the validity of the test, the same procedure applied to F. candida was followed, with standard substrate as a control soil.
2.4. Soil Fauna Extraction
For soil fauna extraction, soil sampling spots were selected by gradually moving away from seepages A0 and B0 at intervals of 5 m along transect A and B, respectively. Based on the results obtained from BTEX and PAH analysis, it was decided to select additional spots where there was a major concentration of hydrocarbon. Consequently, three spots along the transect starting from A0 (named A0, A5 and A10) and five spots starting from B0 (named B0, B5, B10, B15 and B20) were selected. For each spot, three soil samples (replicates) of 10 × 10 × 10 cm were collected using a spade.
Regarding microfauna extraction (fauna < 200 µm), 10 g of soil from each replicate were placed in a modified Baermann funnel. The sample, wrapped in a piece of muslin and supported by a metal gauze, was placed into a Petri dish, partially covered with water and left for 24 h. Microfauna leaving the soil sample during this period and falling through the gauze was collected in the Petri dish. It was then examined using a stereomicroscope and a microscope and identified at the phylum taxonomic level (i.e., Ciliophora, Nematoda, Rotifera, Sarcomastigophora and Tardigrada).
Soil microarthropods (200 µm–2 mm) were extracted from each soil replicate using a Berlese–Tüllgren funnel for 10 days. The extracted soil arthropods were collected and preserved in a solution consisting of 75% ethyl alcohol and 25% glycerol by volume. Identification was carried out at different taxonomic levels (i.e., class for Myriapoda, order for Hexapoda, Chelicerata, and Crustacea), each of them counted using a stereomicroscope.
2.5. Data Analysis
In order to analyse ecotoxicological differences between soil A0 and B0, Student’s t-test was performed on the proportion of survivors, new-borns per survivor and, for E. fetida, survivors’ rate of growth. To meet the assumptions of parametric statistical tests, arcsine transformation of the proportion of survivors and log-transformation of the weight values were applied [39].
To evaluate the effects of natural hydrocarbon presence on microfauna, the number of organisms extracted for each phylum was considered as the dependent variable, whereas for arthropod communities, the number of observed taxa and their total abundance, together with the abundance of each Arthropoda taxon, were set as the response variables. Data between equally spaced spots from seepages A and B were compared using Student’s t-test. Within every site, data obtained along the transect were compared using one-way ANOVA and Tukey test as a post-hoc. To meet the assumptions of parametric statistical tests, log-transformation was applied both to the number of observed phyla/taxa and their abundance (using log(x + 1) to avoid zeros) [39]. For each spot, the Simpson Index of Diversity (1-D) and the Shannon Diversity Index (H) were applied to the Arthropoda community.
As far as the differences in arthropod taxa assemblages among the sample sites were concerned, these were studied through square root transformation of the community matrix to minimize the influence of the most abundant groups, after which the Bray–Curtis dissimilarity index was calculated. On the dissimilarity matrix obtained, a permutational multivariate analysis of variance (PERMANOVA) was conducted. Site and distance from the seepage were considered as independent variables, and only distances up to 10 m were included to avoid unbalanced models. In the event of a significant result, pairwise comparisons were performed using the R package “RVAideMemoire” and dissimilarities in data were visualized with a principal coordinate analysis (PCoA) [40]. An analysis of similarity percentages (SIMPER) was then performed to test which arthropod groups were driving the differences in assemblages. Ordination, PERMANOVA and SIMPER were all performed using the R package “vegan” [41]. A p ≤ 0.05 was considered significant. Statistical analyses were performed using R v.3.6.3 (R Core Team, Vienna, Austria) [42].
3. Results
3.1. Chemical Analysis on Soil
No BTEX were found in any of the analysed soil samples. Several PAHs, however, were present (Table 1). Benzo(g,h,i)perylene was the PAH with the highest concentration in both A0 and B0 soils, watered by springs A and B, followed by Benzo(a)anthracene, Benzo(b)fluoranthene and Benzo(k)fluoranthene in soil B0.
3.2. Ecotoxicological Tests on F. candida and E. fetida
In the control soil, the conditions of validity for the tests were met for both F. candida and E. fetida [37,38].
Neither vital Collembola nor new-borns were observed after 28 days in either soil A0 or B0.
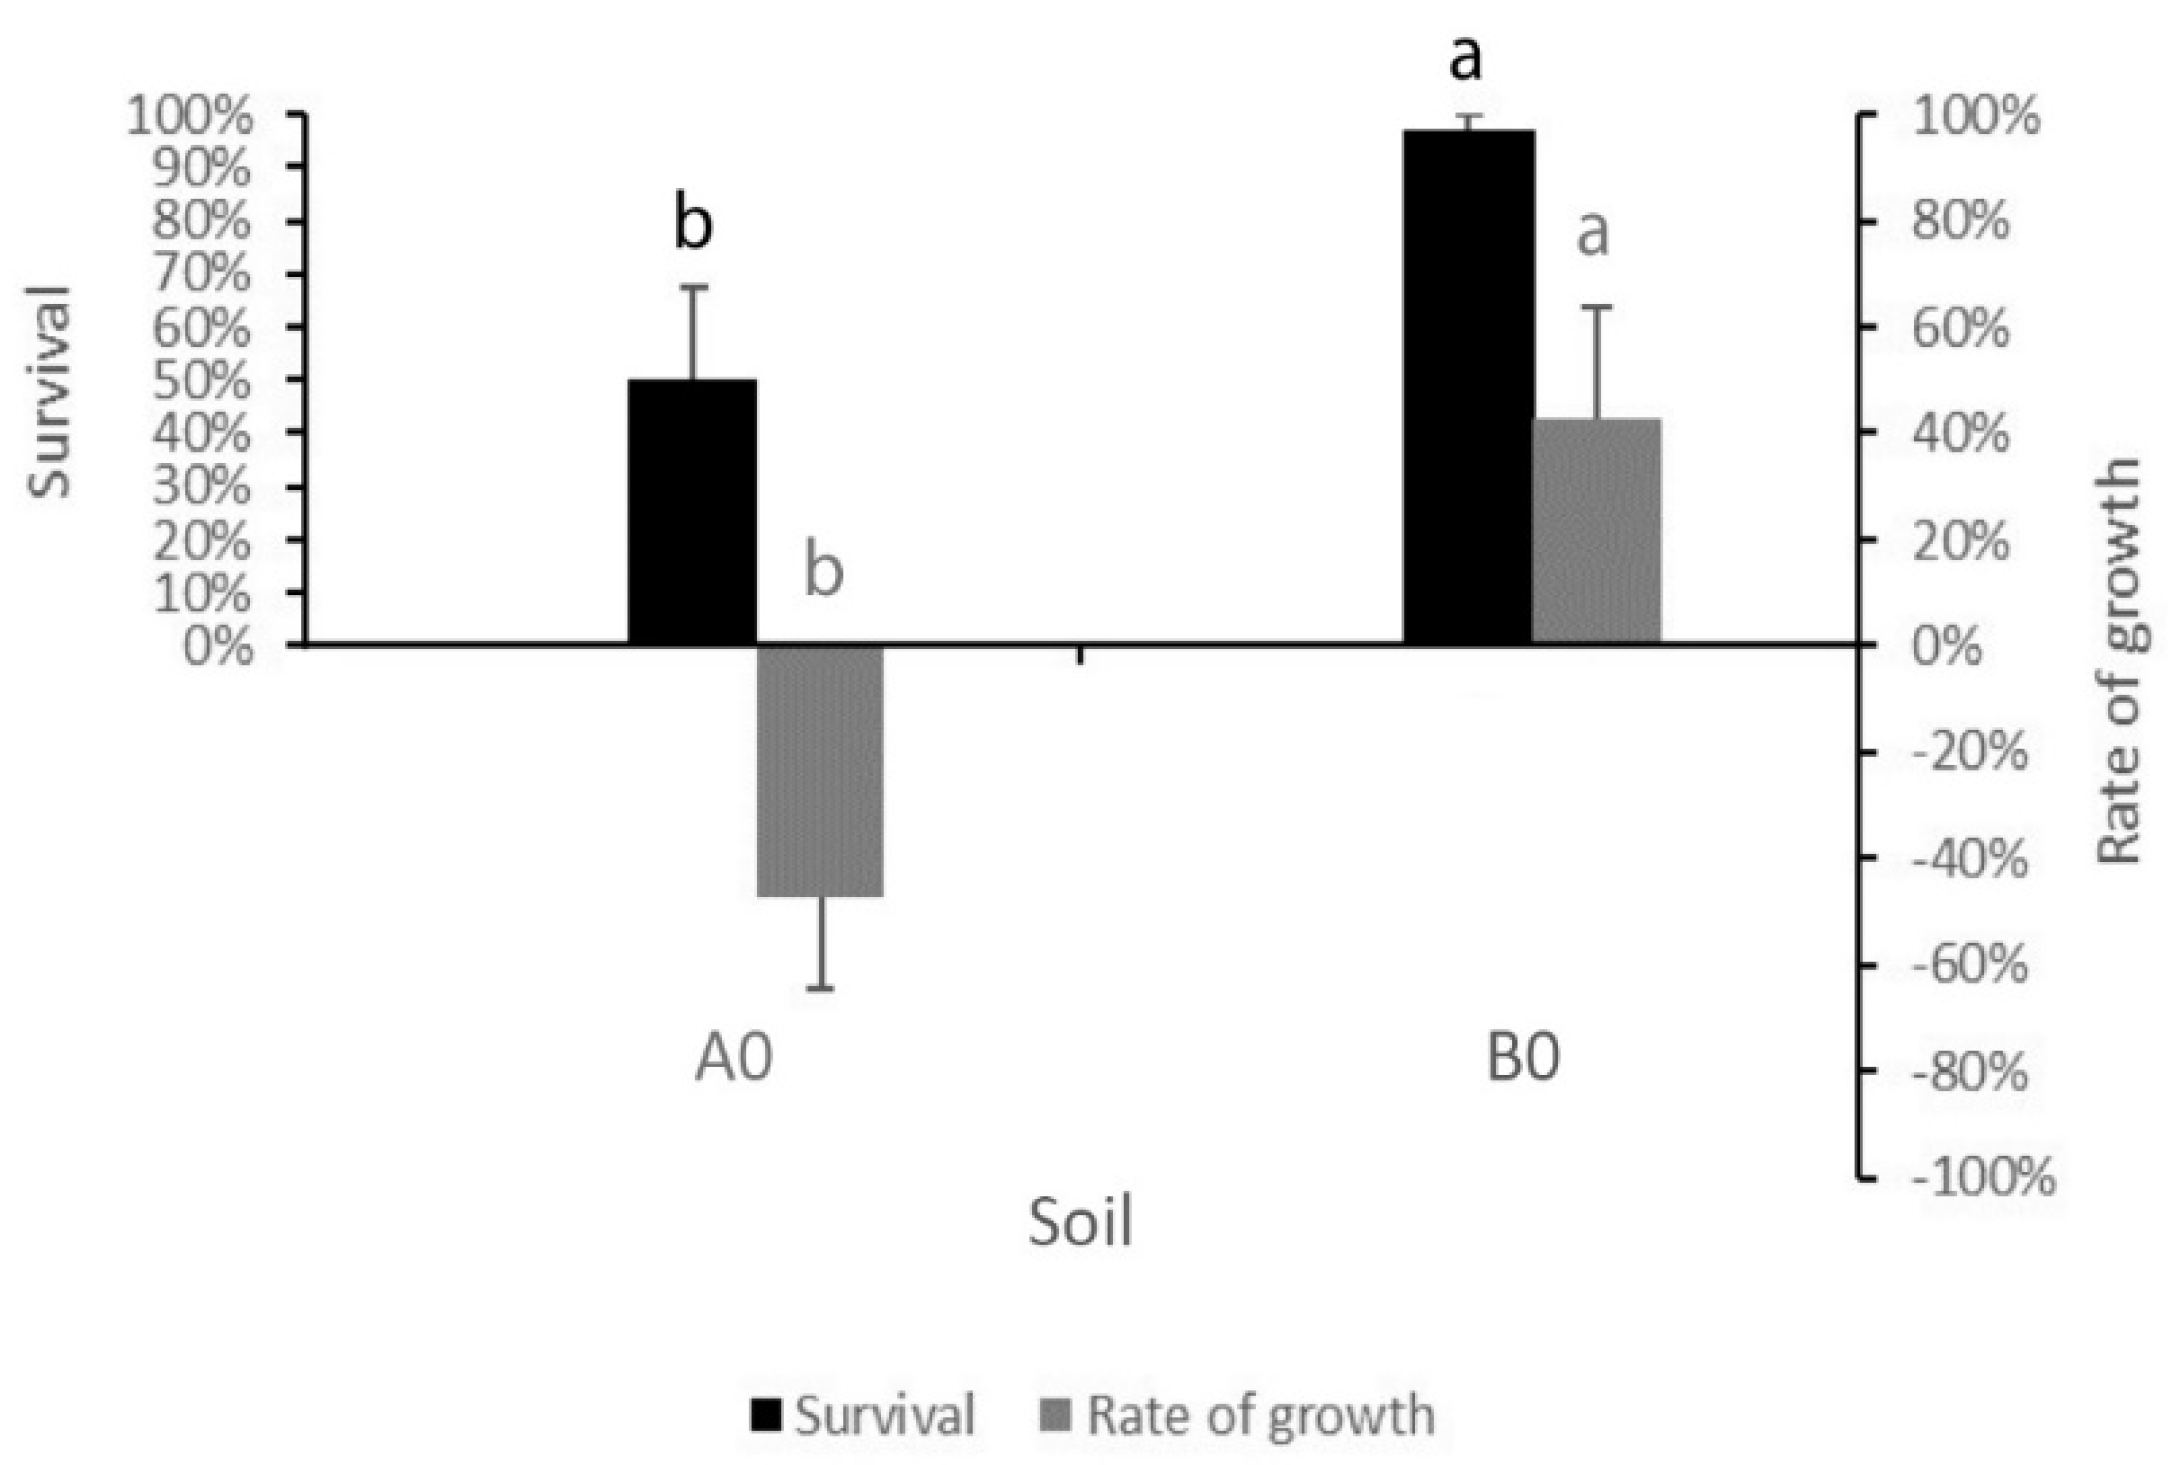
In tests with E. fetida, a significant difference between A0 and B0, both for survival and rate of growth, was observed (p ≤ 0.05 for both), with a loss of weight in earthworms after 28 days in soil A0 compared with a weight gain in those in soil B0 (Figure 3). No cocoons were found, either in A0 or B0.
3.3. Soil Fauna Characterization
3.3.1. Soil Microfauna
Results from microfauna extraction are reported in Table 2.
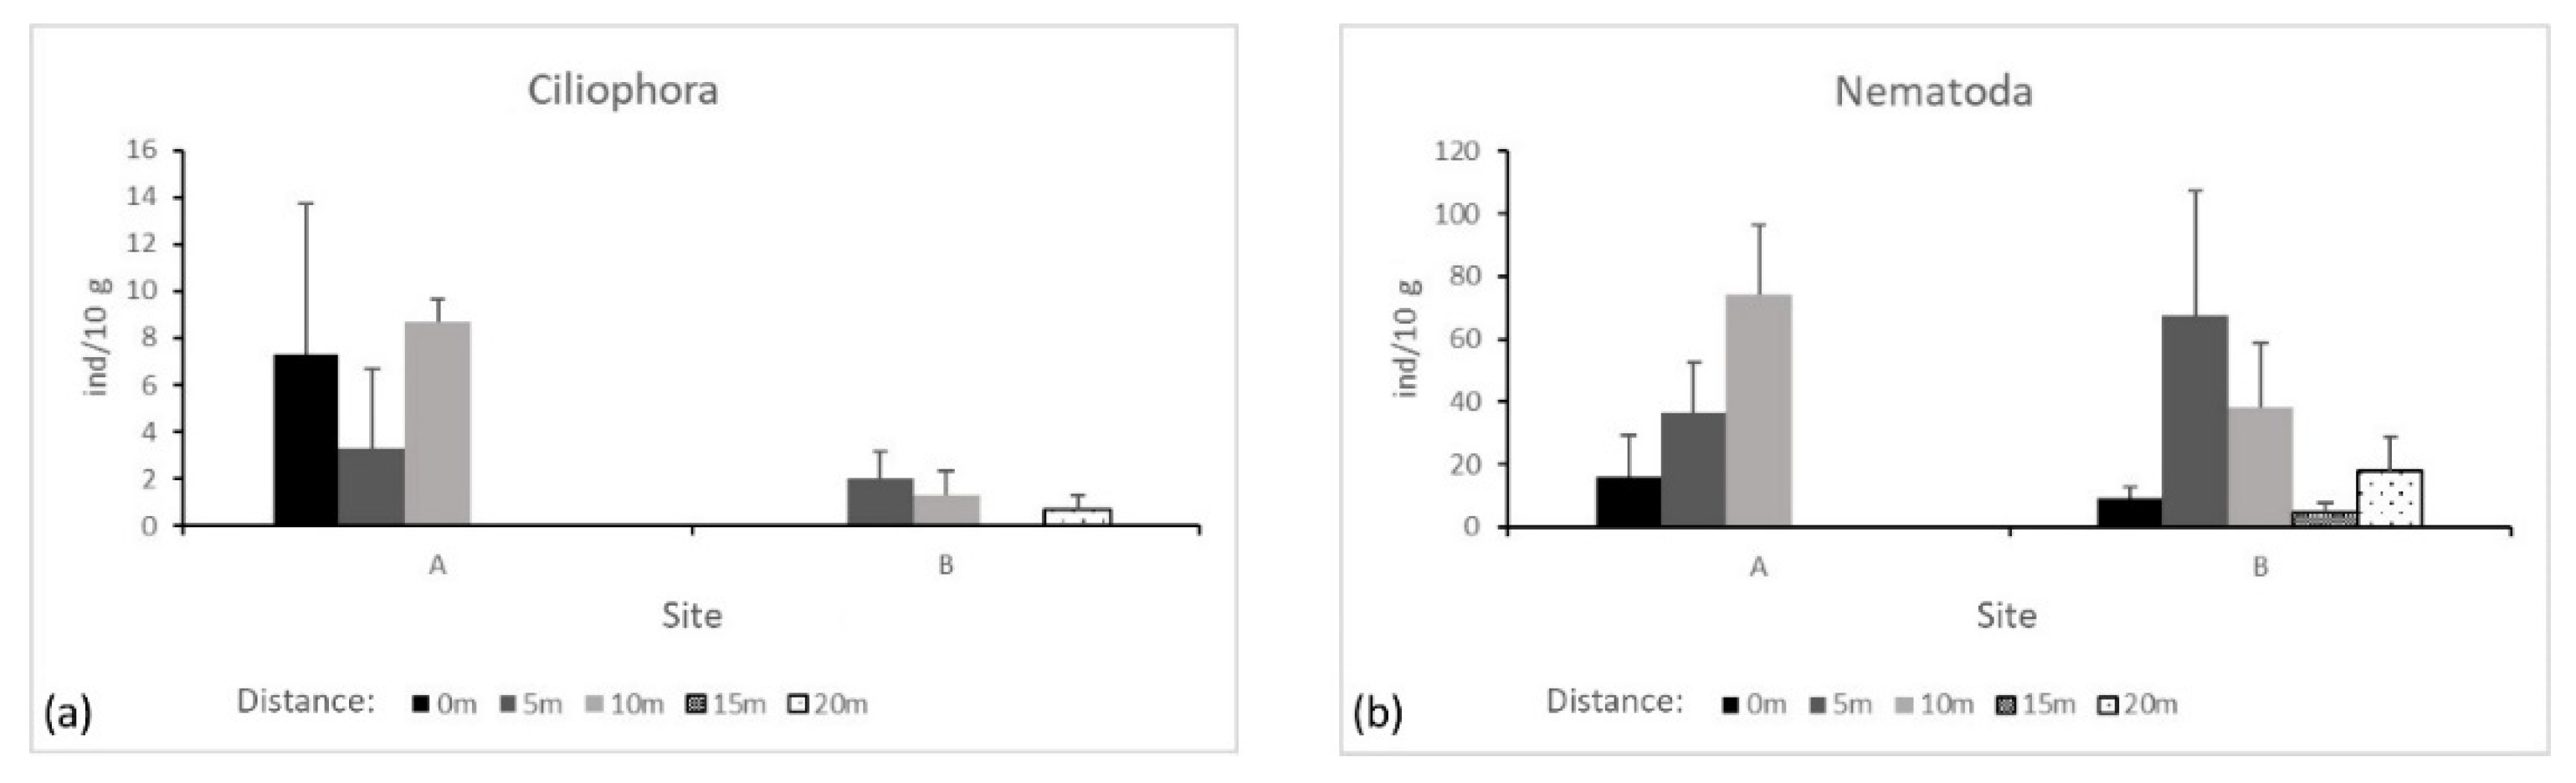
In site A, microfauna was mostly represented by Nematoda (82%), Ciliophora (12%) and Rotifera (4%), while Sarcomastigophora and Tardigrada together accounted for less than 2% of the microfauna found. In site B, Nematoda accounted for 90% of the microfauna, followed by Tardigrada (5%), Ciliophora (3%) and Sarcomastigophora (2%), while no Rotifera were found.
Ciliophora and Nematoda were mostly found at 5 m and 10 m from the seepages, both in site A and B, but their abundance did not differ significantly either between equally spaced spots from the seepages or along the transects (Figure 4a,b).
There were also no differences observed for the other microfauna, with the exception of Rotifera along transect A (absent in B), where they resulted to be more abundant at 10 m from the seepage (p ≤ 0.01).
3.3.2. Soil Arthropods
Results from microarthropods extractions are reported in Table 2. A total of 15 groups of Arthropoda was found: Acarina and Collembola were the most abundant taxa, together representing 89% of the total arthropods extracted; only Diptera (3%), specifically larvae, were present in all soils; Coleoptera, mostly larvae, Isopoda, Hymenoptera, Hemiptera and Pauropoda together represented 6% of the total; each of the remaining taxa accounted for less than 1%.
Along transect A, Collembola represented 75% of the specimens extracted, followed by Acarina (19%), Coleoptera (2%) and Diptera (1%). The other groups together accounted for 3% of the arthropods found, with Araneidae, Diplura, Pauropoda and Pseudoscorpionida being absent. Along transect B, Acarina, Collembola and Diptera represented 65%, 20% and 5%, respectively, of the total arthropod abundance. Hemiptera, Pauropoda, Isopoda and Hymenoptera each accounted for 2%, with Coleoptera accounting for 1% and a further 1% made up of the remaining groups. Chilopoda and Lepidoptera larvae were absent.
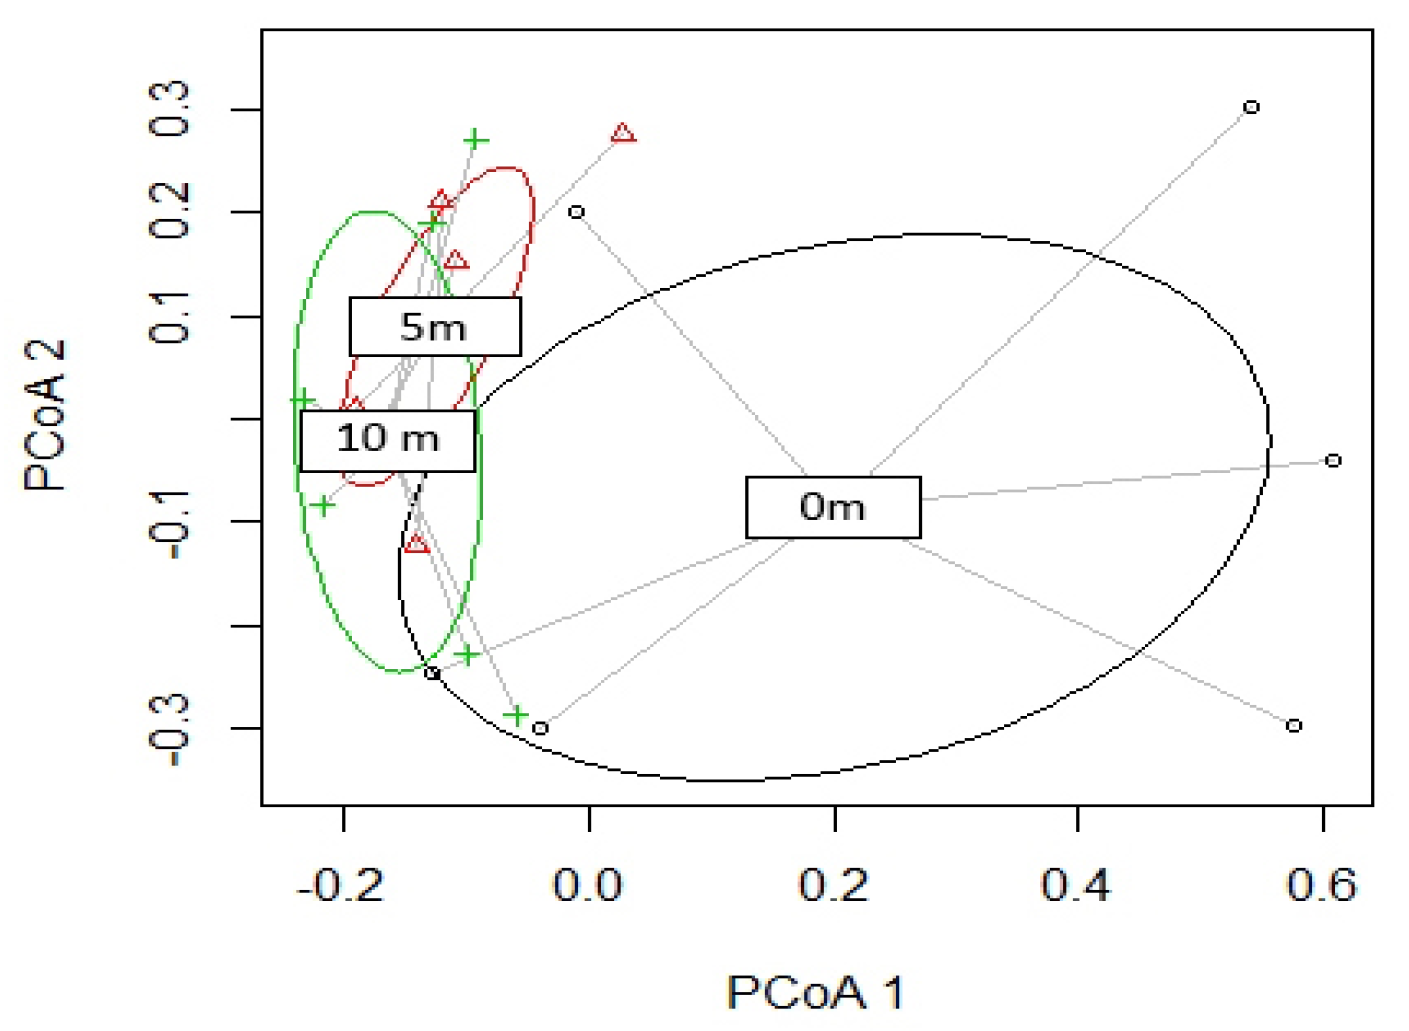
PERMANOVA analysis revealed no site-dependent differences between arthropods assemblages up to 10 m, whereas the distance from the seepage resulted as a significant factor (p ≤ 0.01; Figure 5).
Pairwise comparisons revealed a difference between 0 m and further distances (p < 0.05 for both comparisons). Following this result, SIMPER analysis was conducted using distance as a grouping factor. Faunal assemblages differed for >78% in contrasts between samples collected near the seepage (i.e., at 0 m) and the other distances, while 5 m differed from 10 m assemblages for <50% (Table 3).
A separate analysis of the two sites revealed an increase in both Simpson and Shannon indexes with greater distance from the springs, with the exception of B15. Diversity was greater in transect B compared to transect A (Table 2).
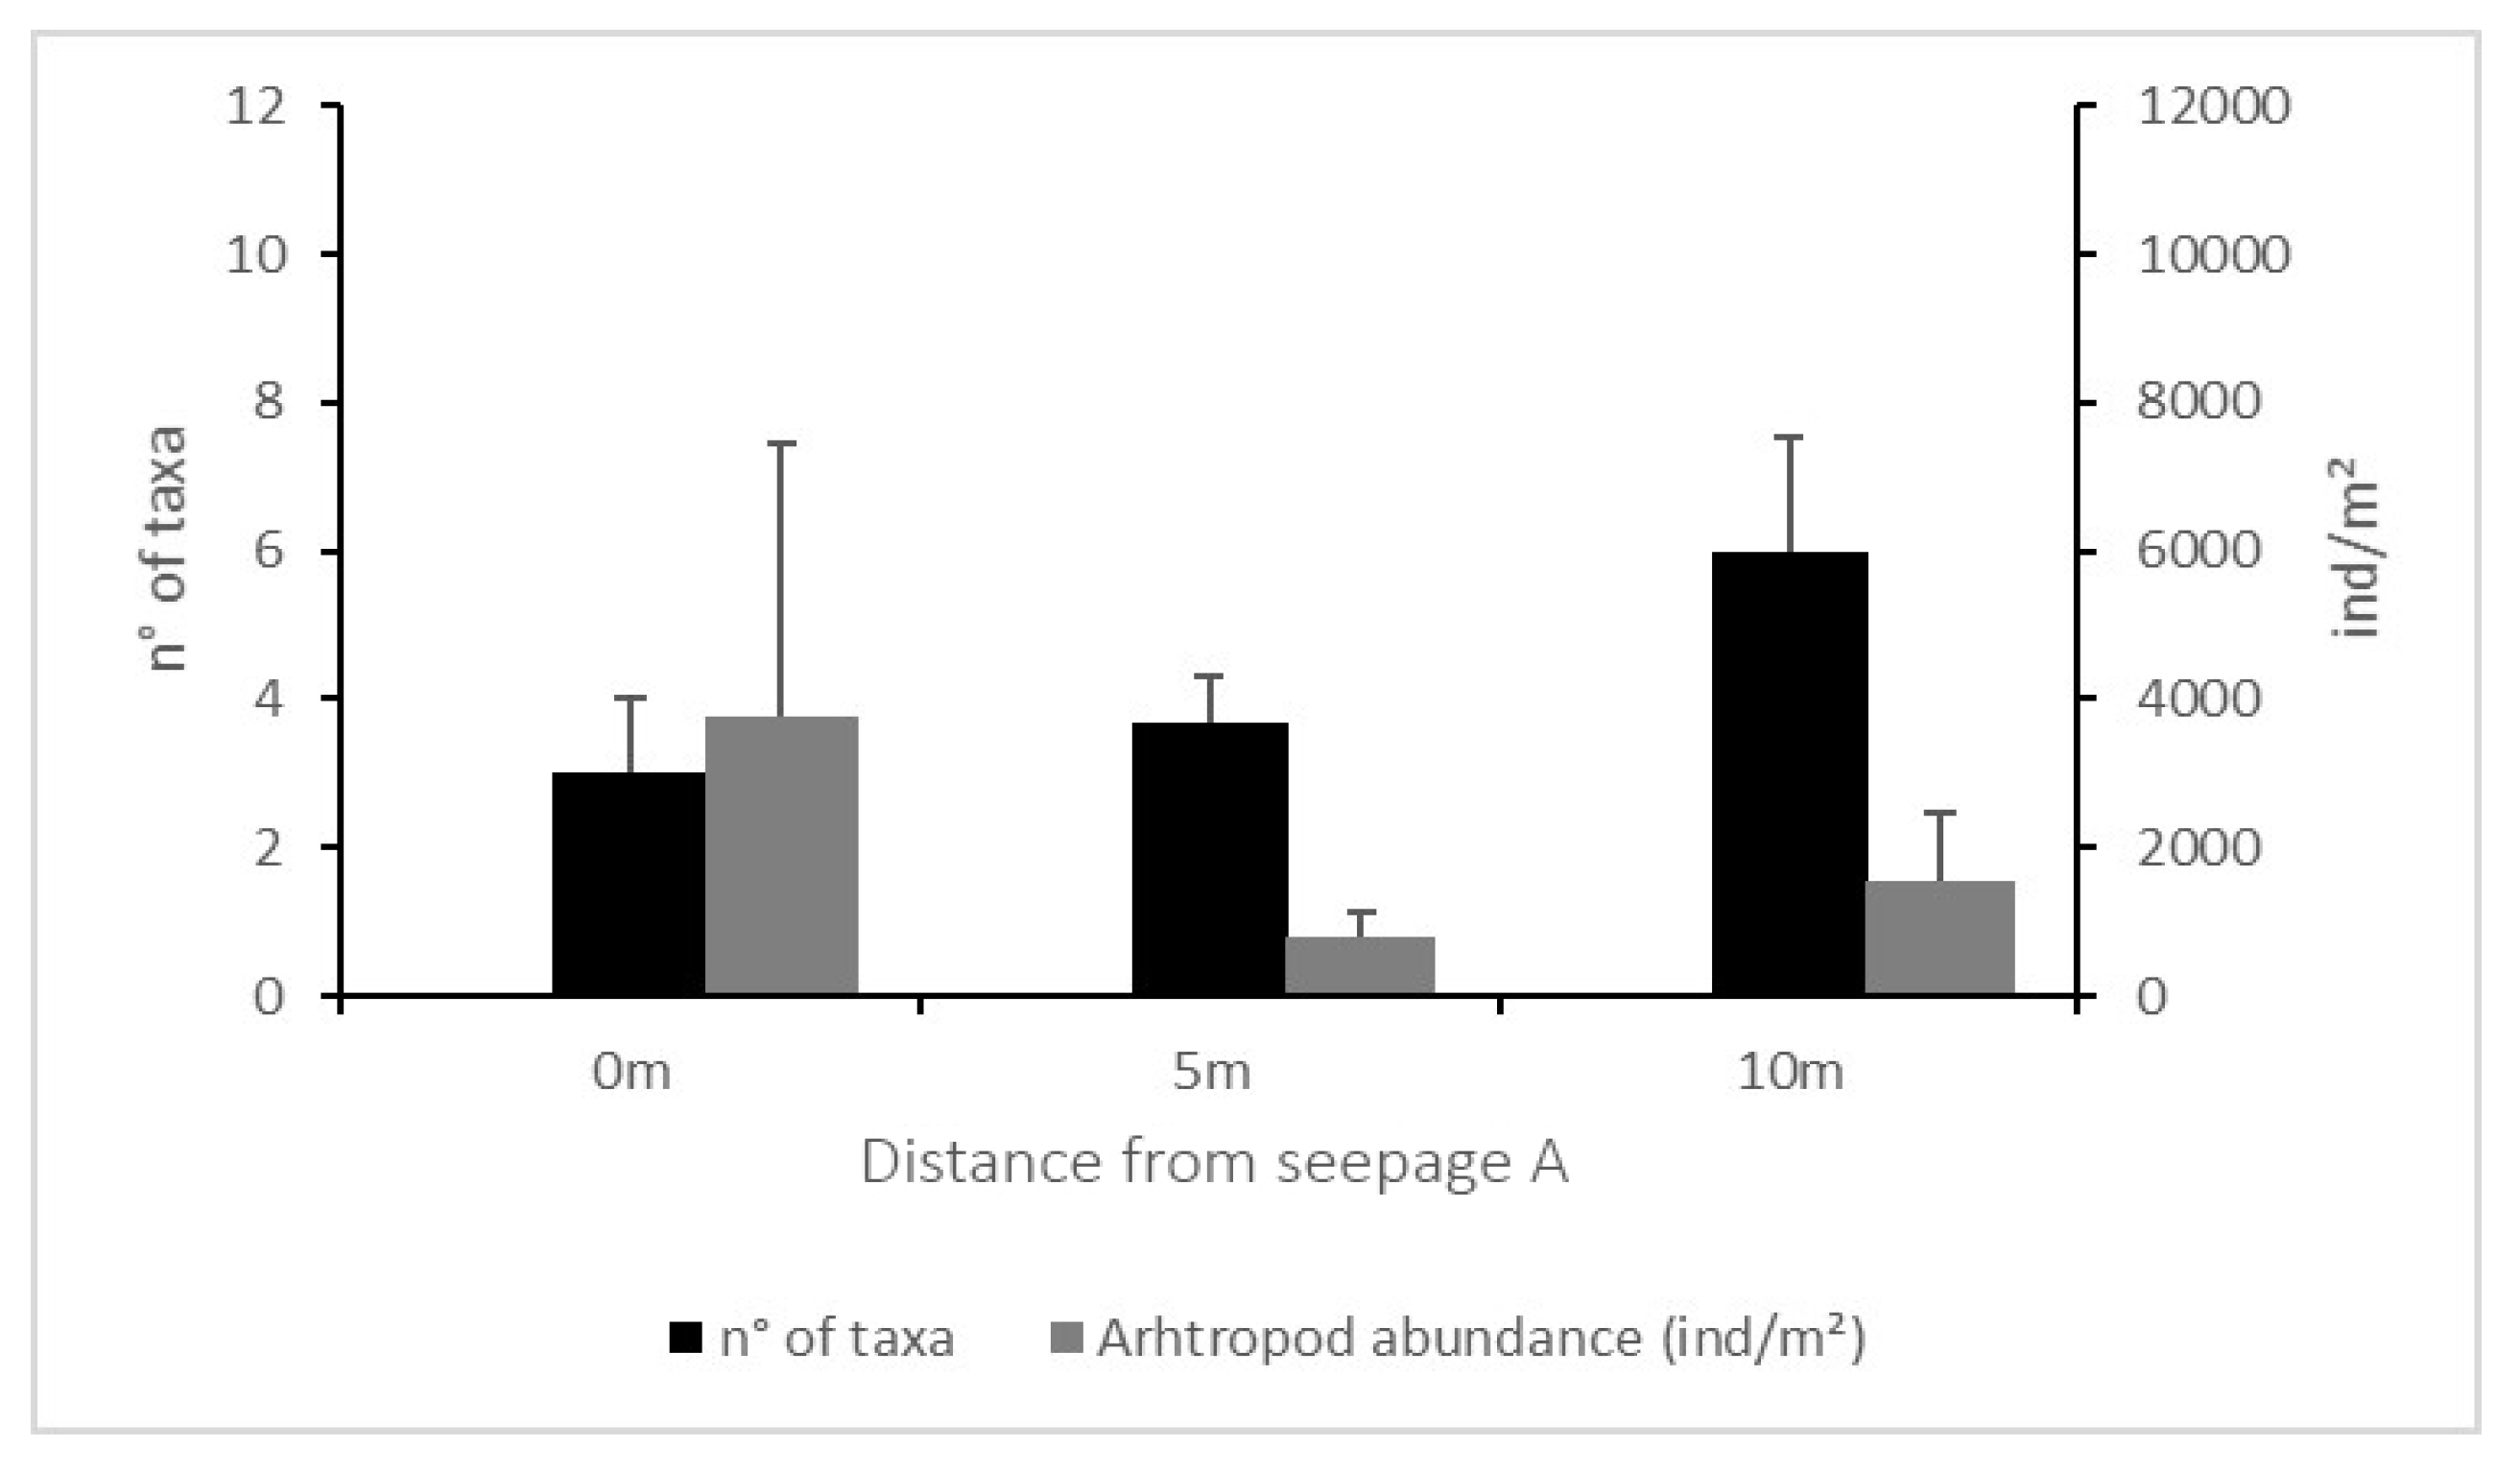
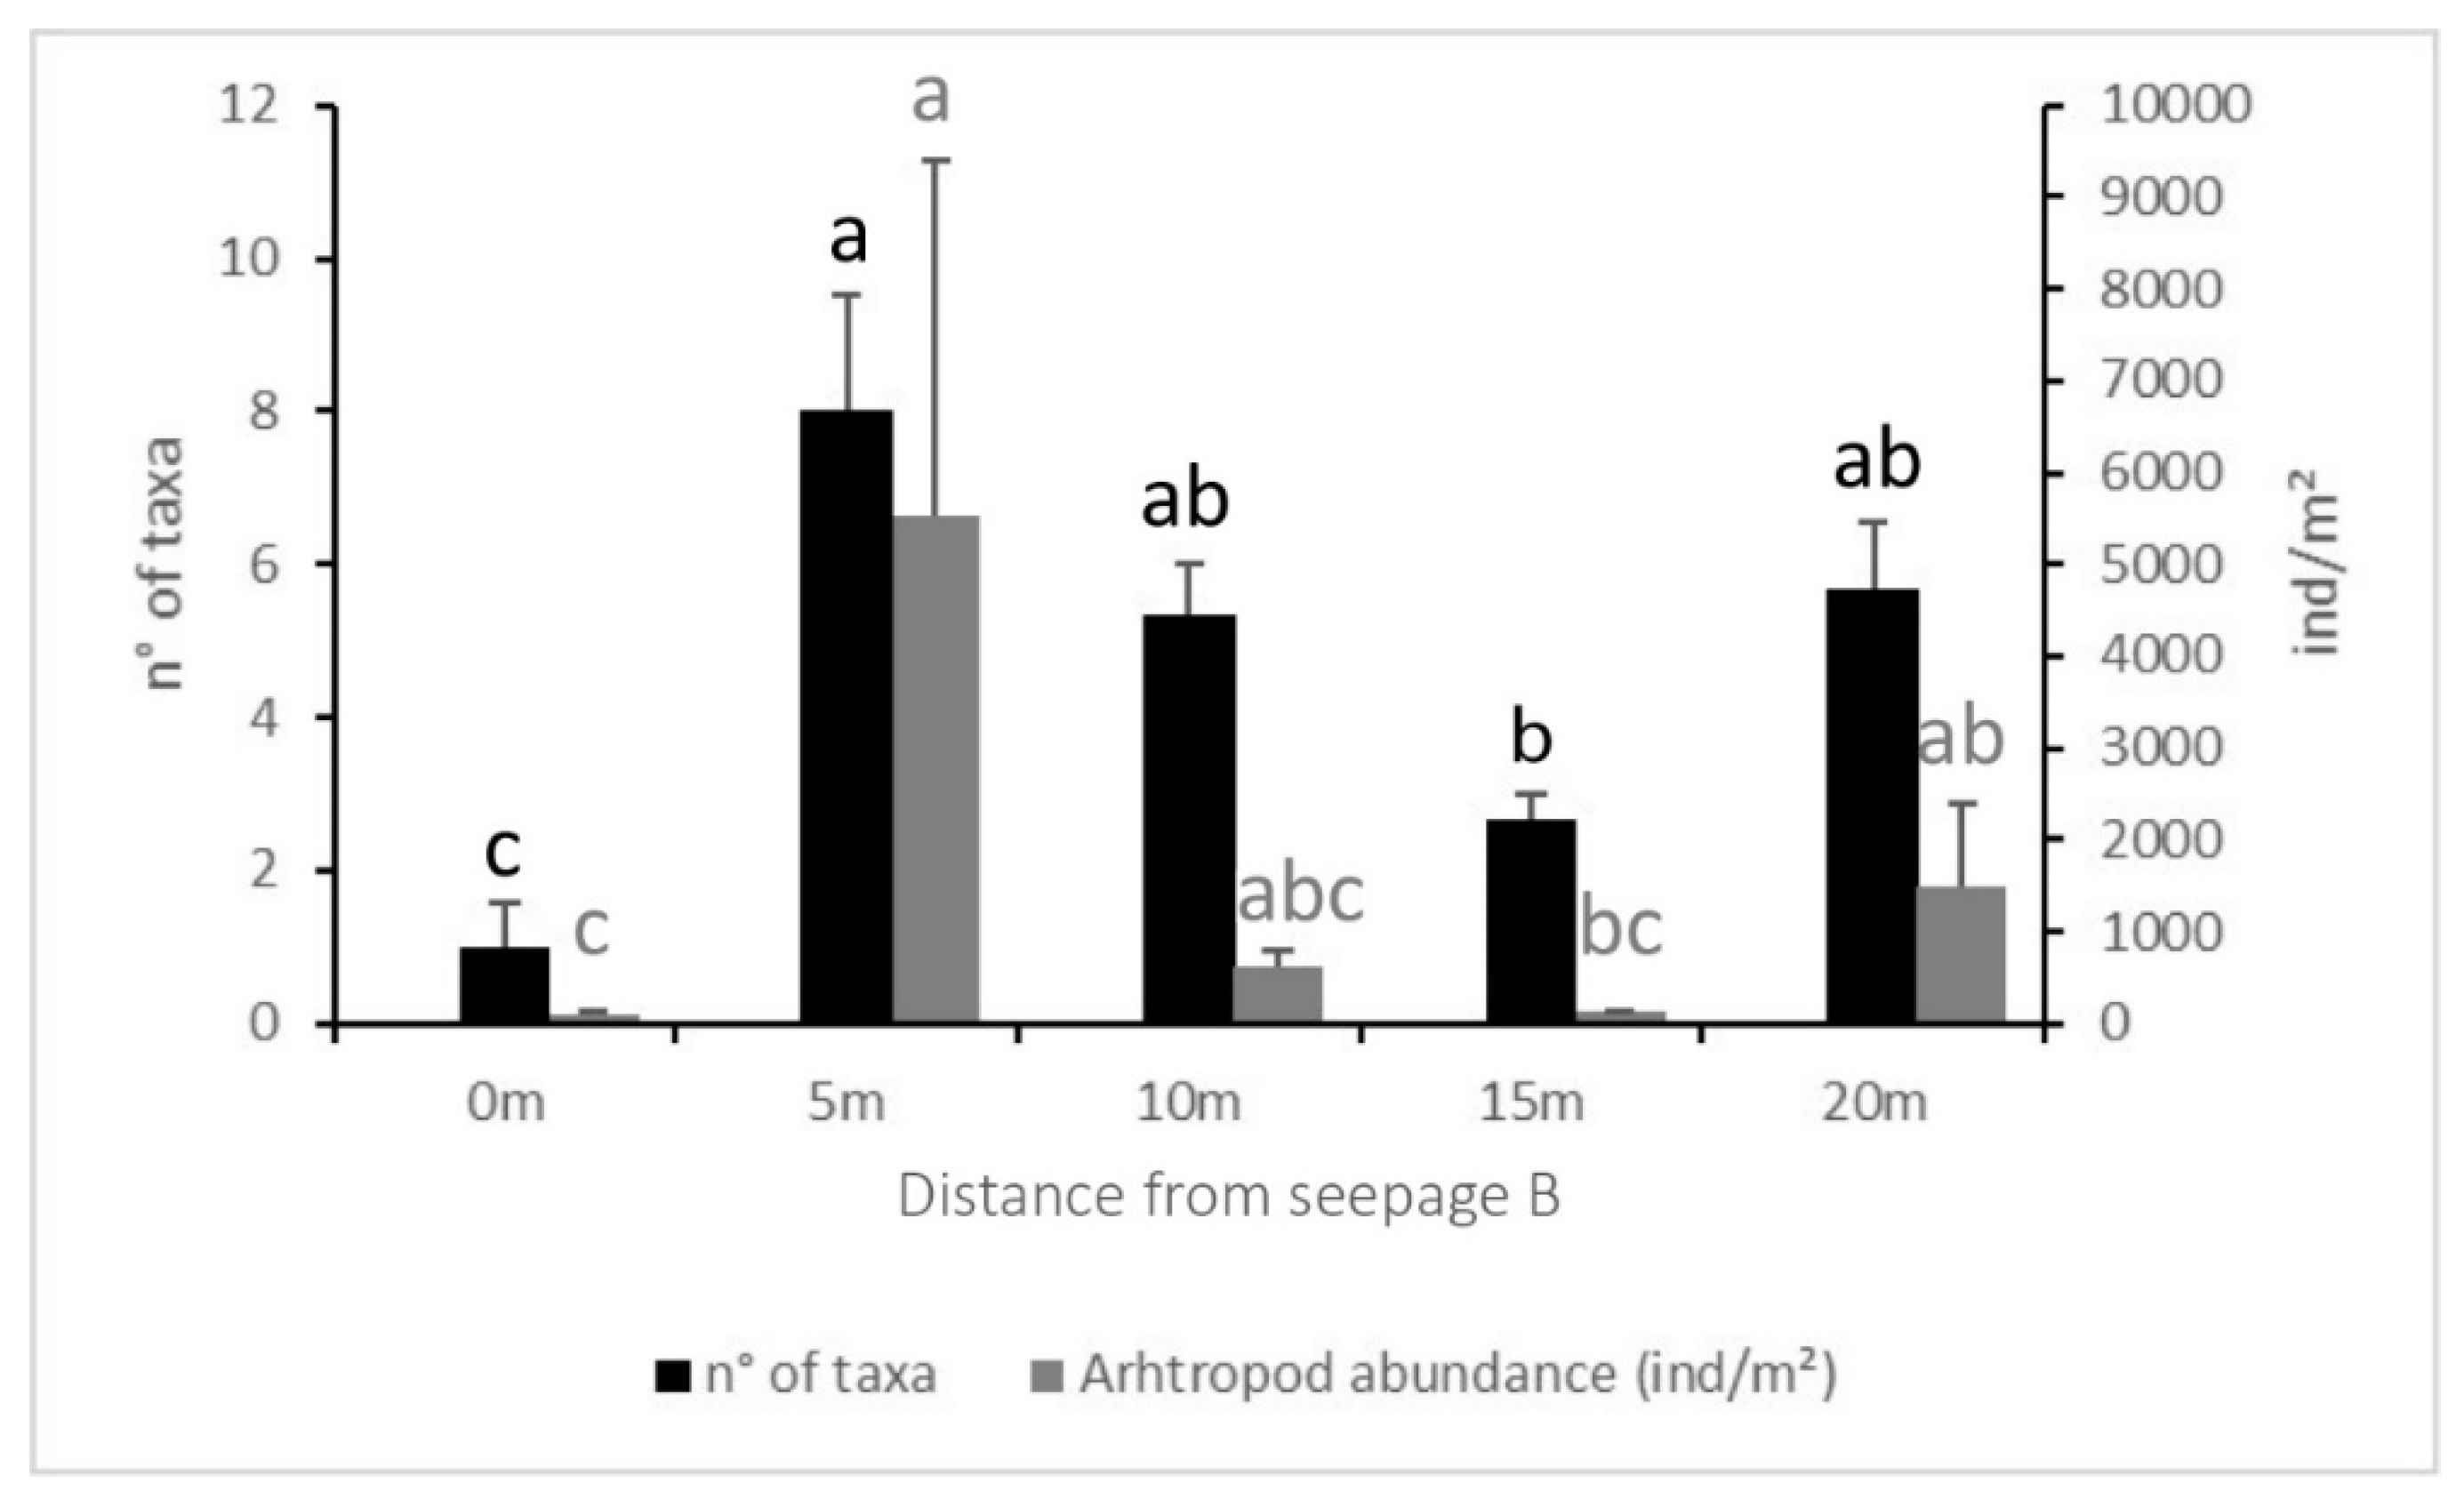
The number of taxa and abundances (both total abundance and abundances of each taxon) did not differ significantly either between equally spaced spots in A and B nor along transect A (Figure 6). On the contrary, both number of groups and total abundance differed significantly between distances on the transect from spring B (p ≤ 0.001 and p < 0.01. respectively) (Figure 7). Both data were higher in B5 than in B0 and B15. The number of taxa in B0 were also lower than those found in the other soils along the transect, and the total abundance was higher at a distance of 20 m from the seepage.
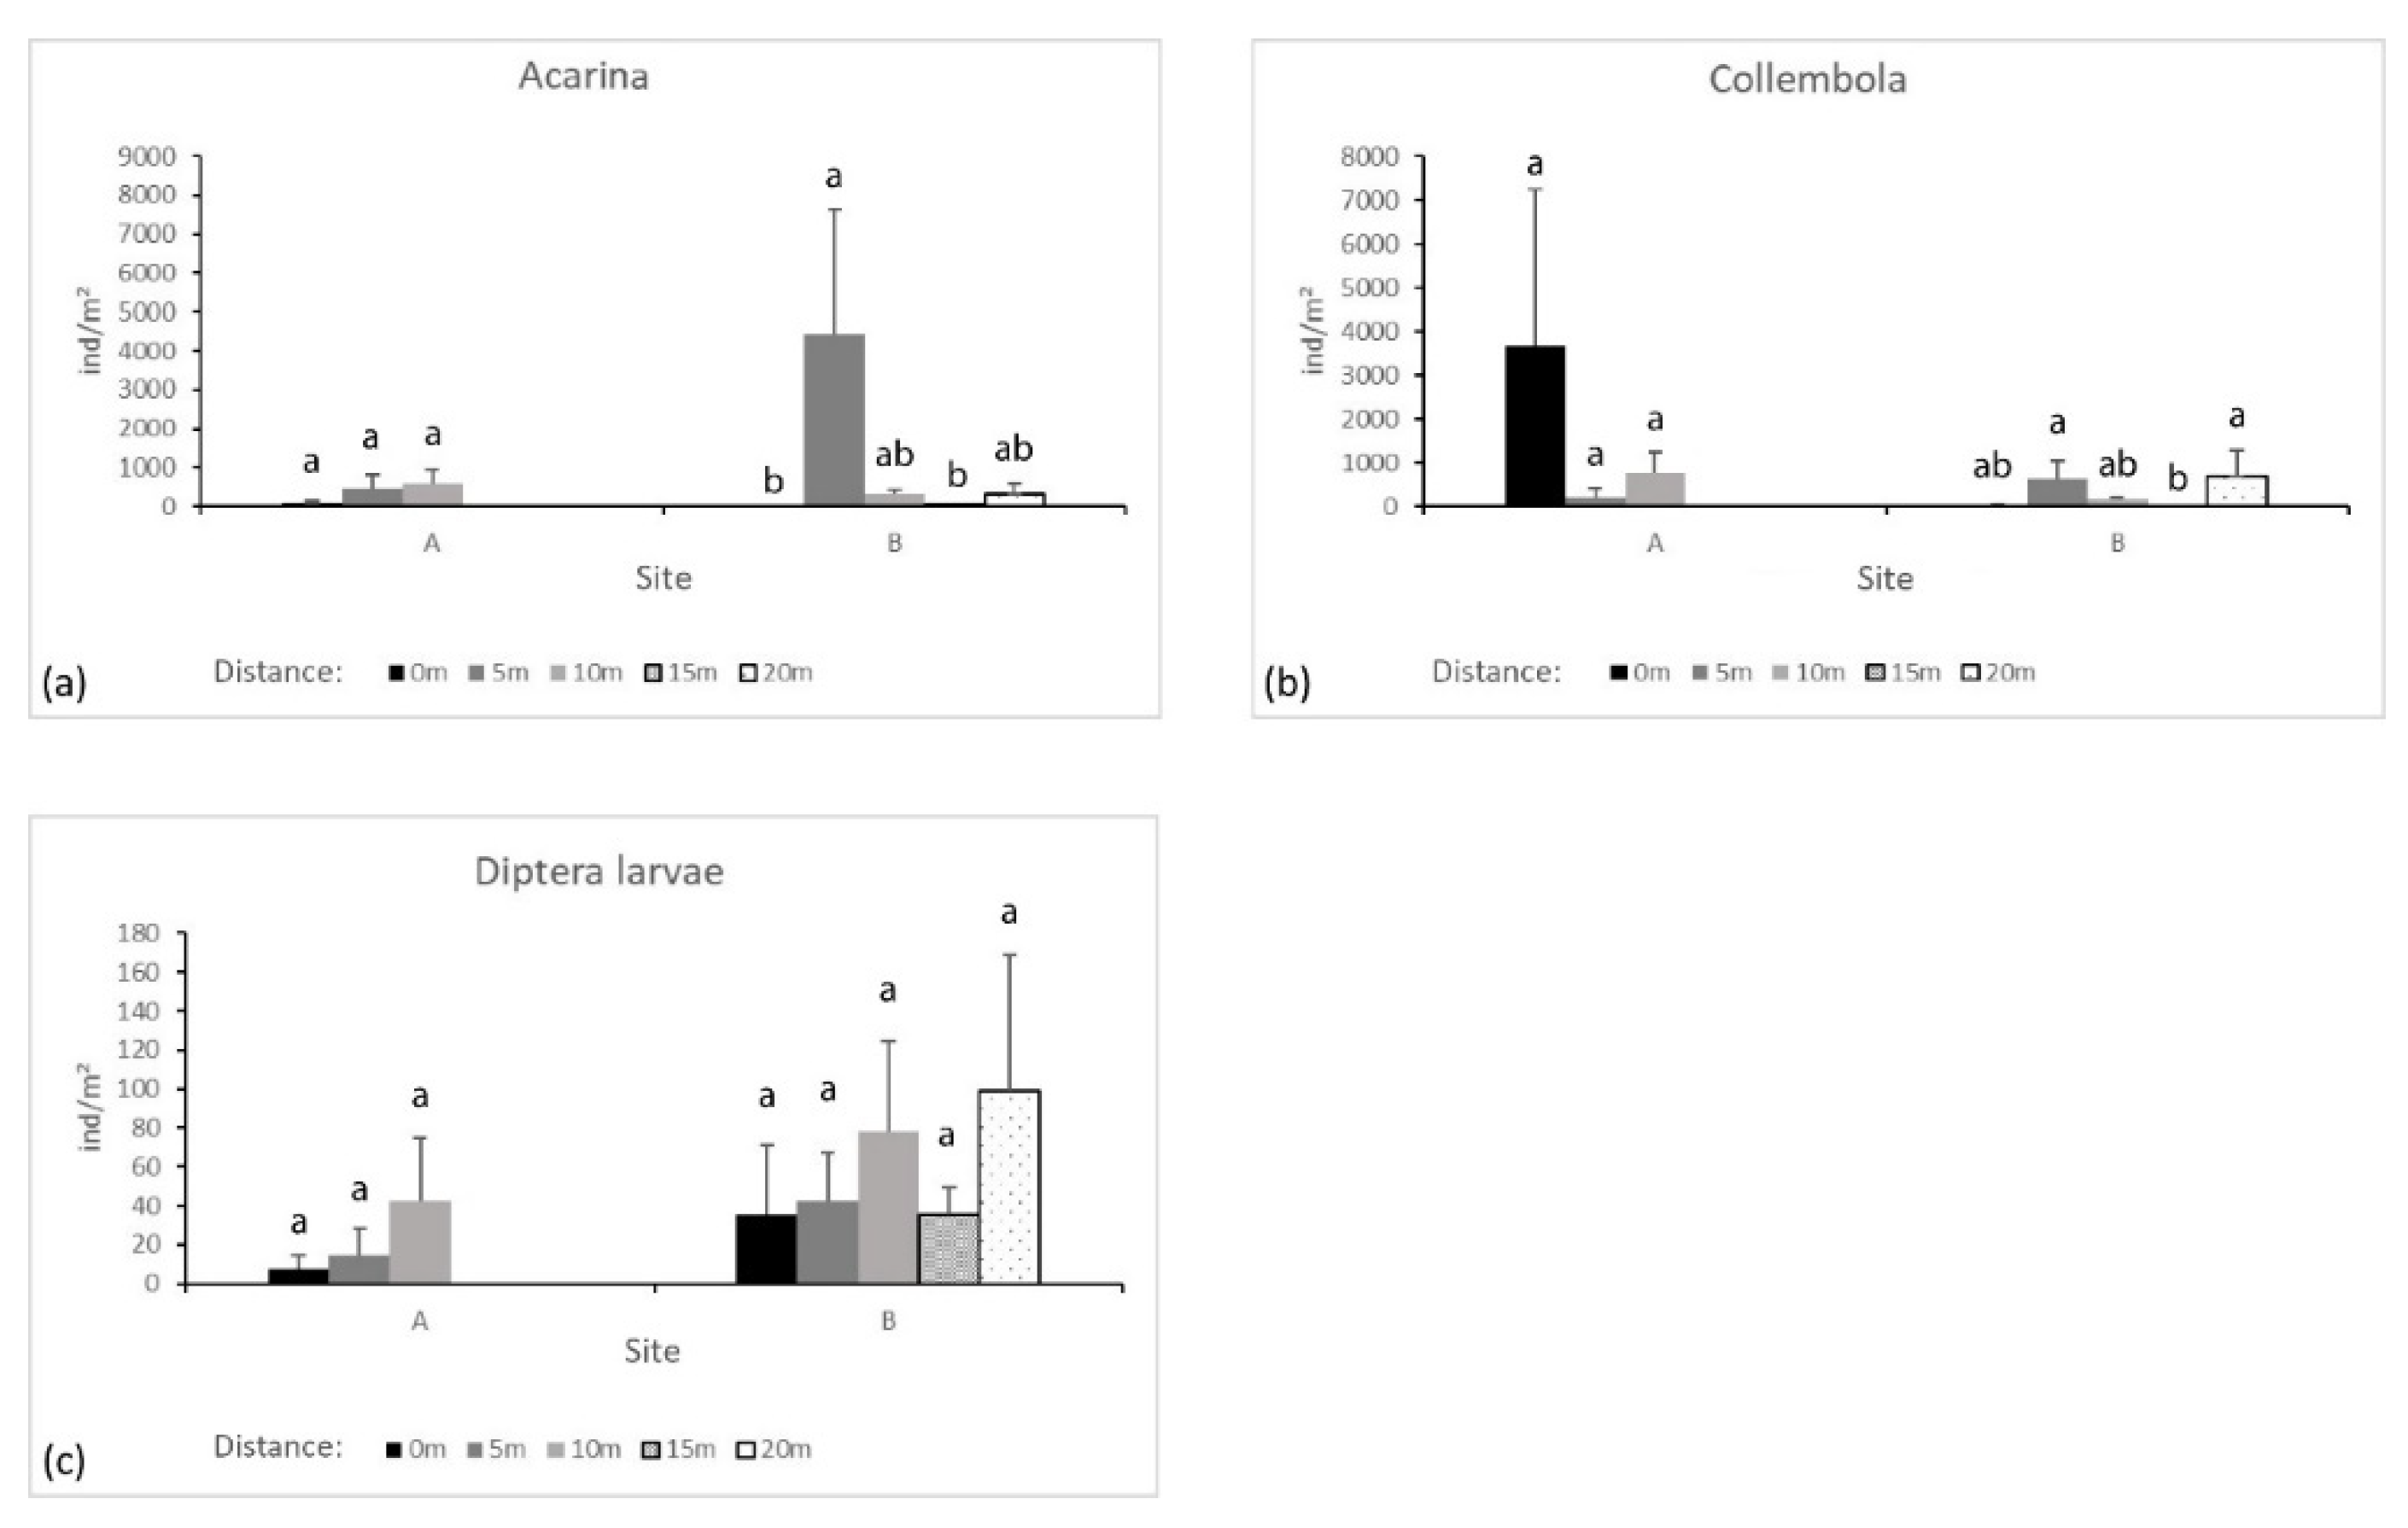
Acarina abundance did not differ along transect A, in contrast to transect B (where p < 0.01 among distances in transect B). In site B, Acarina were mostly found at 5 m from the seepage. Here their abundance was significantly higher than that found in B0 and at 15 m (Figure 8a).
A higher abundance of Collembola was found in site A, but no significant differences were found along the transect (Figure 8b). In site B, their abundance was lower than in site A but with significant differences among the transect (p ≤ 0.01): more Collembola were found at 5 m and 20 m than at 15 m from B0.
Diptera, mostly larvae, were present in lower numbers, and their abundance did not differ significantly along either transect A or B. Nevertheless, a gradual increase was found with greater distance from the springs (Figure 8c). Among the remaining taxa, only Pauropoda abundance differed significantly along transect B (p ≤ 0.01), as they were only found at 5 m from spring B.
4. Discussion
Soil fauna plays a key role in soil ecosystem functioning, since it is involved in the decomposition of organic matter, regulation of the microbial community and nutrient cycle. This key role, together with the stability of community composition in an undisturbed environment, makes soil fauna a widely used tool for the bio-indication of changes in soil properties [43]. Species such as F. candida and E. fetida are, therefore, frequently used as indicators on account of their sensitivity to soil contamination. Our study revealed that F. candida was negatively affected by the presence of hydrocarbons, so much so that no springtails survived after 28 days and no reproduction was observed, confirming the toxic impact of these compounds for some organisms. However, ecotoxicological tests on E. fetida highlighted the fact that other organisms, such as earthworms, which are generally sensitive to contaminants, were able to survive in soils containing hydrocarbons. Results in soil B0, when compared to A0, suggested that organisms such as these are able to take advantage of higher concentrations of these toxic compounds, confirming observations made by García-Segura et al. [44]. The lower survival of earthworms in soil A0, however, might also be related to the physical properties of the soil (i.e., high skeleton proportion). The absence of cocoons, however, suggested that E. fetida was also negatively affected by the presence of hydrocarbons, even if it is possible that reproductive activity was only slowed down. Since earthworms are under investigation for their crude-oil decontamination potential [45], the results of our study point to E. fetida as a potential species of interest for bioremediation, especially as some studies have found this species to be not only more resistant than others to this contaminant, but also to possess an effective ability to breakdown crude oil [46,47,48].
Erstfeld and Snow-Ashbrooky [9] have suggested that some invertebrate communities are favourably impacted by the presence of hydrocarbons, since carbon represent a food resource. In light of this and considering the strong symbiotic relationship with the final element in the chain of organic pollutant breakdown (i.e., microflora) [10], hydrocarbon-resistant soil fauna has been proposed as a bioremediation agent. In our study, microfauna was mostly represented by nematodes as in other similar studies, which found higher abundances of deposit feeders (especially nematodes) near active springs which, by feeding on the same bacteria, caused a reduction in the amount of other microfauna through competitive exclusion [14,49,50,51]. In addition, the abundance of Nematoda was not significantly affected by the proximity of the seepages, either in A or B. Such a result contrasts with Blakely et al. [52], who recommend nematodes as good indicators for some contaminants, such as PAHs, because their permeable cuticle leads to a direct exposure to soil particles and contamination, thus increasing their sensitivity to pollutant compounds. Other studies, on the other hand, highlight the fact that nematodes are petroleum fuel tolerant and are able to co-operate with bacteria to promote the biodegradation rate of petroleum hydrocarbons [51,53,54]. In fact, in a recent study on bacterial communities carried out in the same study area, several bacterial strains capable of degrading hydrocarbons were isolated and screened, such as those belonging to genera Achromobacter and Pseudomonas [55].
With regard to Simpson and Shannon indexes calculated on arthropods in the present study, these generally increased as the distance from the springs became greater. Higher values, however, were found along transect B, even though B0 had a higher concentration of PAHs. This result is in line with García-Segura et al. [44], who noted that diversity indices were generally higher in contaminated sites. Nevertheless, the extreme conditions near the springs can affect soil fauna biodiversity, together with the microbial community, by stimulating hydrocarbon degraders while, at the same time, rendering other organisms inactive [10].
In our study, higher densities of arthropods were found in A0 and B5. Since PAH concentration in B0 was higher, it is possible that arthropod abundance, mainly driven by a greater abundance of Collembola and Acarina, increased with the presence of hydrocarbons at low concentrations. Together with nematodes, Erstfeld and Snow-Ashbrook [9] noted that the abundance of collembolans also increased with some hydrocarbon contaminants, such as PAHs, a result also confirmed by Migliorini et al. [12], who found that Collembola exhibited higher densities in contaminated sites. Like nematodes, a higher abundance of Collembola could be linked to changes in microbial dynamics [56]. Finally, even though Acarina was one of the most abundant taxa in this study, this taxon was absent in the soil surrounding spring B (i.e., the one with higher hydrocarbon concentration). This represents an interesting result, considering the fact that Acarina, together with Coleoptera and Hymenoptera, are generally thought to be more tolerant than other organisms to hydrocarbons, due to their lower permeable cuticle [52]. In contrast, other taxa were confined to one spot: Diplura, Pauropoda and Pseudoscorpionida were only found in B5, a result in line with García-Segura et al. [44], who found the presence of these taxa only in moderately contaminated sites; Chilopoda was found only in A10, with a progressive reduction in soil concentration of hydrocarbons moving away from the seepage, suggesting they are to be considered pioneers in site rehabilitation [57]. Diptera was the only mesofaunal group found in all spots, where its larvae did not seem to be strongly affected by hydrocarbons, even if their abundance generally increased with greater distance from the springs; their presence in sites with a low number of groups could be due to the reduction of competition and/or predation, as well as changes in the microbial community [58].
To conclude, it is to be noted that differences in arthropod assemblages in the first 10 m from the seepages were driven by the distance from the seepage rather than the sample area (A or B), even if B was characterized by higher PAH concentrations. In fact, community assemblages from soils collected further away from seepages were similar for almost 50% of the population, independent of whether they came from site A or B, while there was a significant difference between them and assemblages from soils collected near the seepages. Apart from the presence of hydrocarbons, sample areas share similar characteristics, so it is possible to speculate that soil populations further from the seepages consist of primary edaphic zoocoenoses that, nearer the seepage, are gradually substituted and dominated by more resilient organisms. These results could be compared with those of Melekhina [59], who found that the proportion of microfaunal taxa in an oil polluted area in the Subarctic of European Russia changed during a seven years remediation study, with some groups of microarthropods acting as biomarkers of succession stages. In Melekhina’s study, the highest relative abundance of dipterous larvae was observed at the first stage of zoocoenosis recovery, but then, their proportion decreased with the increasing of collembolans, similarly to what observed along transects in our study.
As a final observation, even if the site did not significantly affect community structure, nevertheless, a higher variability was observed within communities near seepages; this was probably due to different concentrations of hydrocarbons. As suggested by Migliorini et al. [60], even small differences in environmental characteristics can result in distinct edaphic populations.
5. Conclusions
Results obtained with E. fetida suggest that this particular earthworm could benefit from the presence of some of the compounds found in these soils, thus responding to the need for organisms which are both easy to breed and able to accelerate bioremediation processes in contaminated industrial sites.
Moreover, this study reveals that some soil organisms, specifically Collembola and Acarina, even if negatively affected by the higher oil concentration near the seepages, are still able to increase their abundance at lower levels of contaminant pollution. Other soil fauna, on the other hand, such as Nematoda and Diptera larvae, seem not to be affected by the presence of PAHs and are able to live at higher concentrations of hydrocarbons, some of which having carcinogenic properties (e.g., Benzo(b)fluoranthene). Therefore, taxa such as these could be suitable for study as potential candidates for incorporation in PAH degradation processes.
In a wider perspective, purpose-designed experiments are being planned with the aim of exploring the degrading potential of consortia made up of soil fauna and bacterial strains isolated at the study site.
Author Contributions
Conceptualization, C.M., F.C. and S.R.; methodology, C.M. and S.R.; validation, C.M. and S.R.; formal analysis, S.R.; investigation, P.R. and S.R.; resources, C.M.; data curation, S.R.; writing—original draft preparation, C.M. and S.R.; writing—review and editing, C.M., F.C. and S.R.; visualization, S.R.; supervision, C.M. and F.C.; project administration, F.C.; funding acquisition, F.C. All authors have read and agreed to the published version of the manuscript.
Funding
This research received no external funding.
Acknowledgments
We warmly acknowledge Dario Avagliano, Francesco Coraggio, Antonella Caputi, and Fabrizio Micucci (ENI S.p.A., Distretto Meridionale) for providing some of the information used in the present work and for useful discussions. This work has benefited from the equipment and framework of the COMP-HUB Initiative, funded by the “Departments of Excellence” program of the Italian Ministry for Education, University and Research (MIUR, 2018–2022).
Conflicts of Interest
The authors declare no conflict of interest.
References
- Nadim, F.; Hoag, G.E.; Liu, S.; Carley, R.J.; Zack, P. Detection and remediation of soil and aquifer systems contaminated with petroleum products: An overview. J. Pet. Sci. Eng. 2000, 26, 169–178. [Google Scholar] [CrossRef]
- Wang, Y.; Chen, H.; Chen, H.; Wu, J. Influences of chronic contamination of oil field exploitation on soil nematode communities at the Yellow River Delta of China. Front. Biol. China 2009, 4, 376–383. [Google Scholar] [CrossRef]
- Martinelli, G.; Cremonini, S.; Samonati, E. Geological and geochemical setting of natural hydrocarbon emissions in Italy. In Advances in Natural Gas Technology; Al-Megren, H., Ed.; IntechOpen: Rijeka, Croatia, 2012. [Google Scholar]
- Hoeks, J. Changes in composition of soil air near leaks in natural gas mains. Soil Sci. 1972, 113, 46–54. [Google Scholar] [CrossRef]
- Schumacher, D. Hydrocarbon-induced alteration of soils and sediments. AAPG Mem. 1996, 71–89. [Google Scholar] [CrossRef]
- Noomen, M.F.; Skidmore, A.K.; Van Der Meer, F.D. Detecting the influence of gas seepage on vegetation, using hyperspectral remote sensing. In Proceedings of the 3rd EARSeL Workshop on Imaging Spectroscopy, Herrsching, Germany, 13–16 May 2003; p. 256. [Google Scholar]
- Alvarez, P.J.J.; Vogel, T.M. Substrate interactions of benzene, toluene, and para-xylene during microbial degradation by pure cultures and mixed culture aquifer slurries. Appl. Environ. Microbiol. 1991, 57, 2981–2985. [Google Scholar] [CrossRef] [Green Version]
- Atlas, R.M. Microbial hydrocarbon degradation-bioremediation of oil spills. J. Chem. Technol. Biotechnol. 2007, 52, 149–156. [Google Scholar] [CrossRef]
- Erstfeld, K.M.; Snow-Ashbrook, J. Effects of chronic low-level PAH contamination on soil inverertebrate communities. Chemosphere 1999, 39, 2117–2139. [Google Scholar] [CrossRef]
- Iloba, B.N.; Odon, A.P. Studies on the biodiversity of soil microarthropods and their responses to crude oil spills. Int. J. Zool. Res. 2007, 3, 41–47. [Google Scholar] [CrossRef] [Green Version]
- Smith, R.; Pollard, S.J.T.; Weeks, J.M.; Nathanail, C.P. Assessing significant harm to terrestrial ecosystems from contaminated land. Soil Use Manag. 2006, 21, 527–540. [Google Scholar] [CrossRef] [Green Version]
- Migliorini, M.; Pigino, G.; Bianchi, N.; Bernini, F.; Leonzio, C. The effects of heavy metal contamination on the soil arthropod community of a shooting range. Environ. Pollut. 2004, 129, 331–340. [Google Scholar] [CrossRef] [PubMed]
- Faulkner, B.C.; Lochmiller, R.L. Increased abundance of terrestrial isopod populations in terrestrial ecosystems contaminated with petrochemical wastes. Arch. Environ. Contam. Toxicol. 2000, 39, 86–90. [Google Scholar] [CrossRef] [PubMed]
- Steichen, D.J.; Holbrook, S.J.; Osenberg, C.W. Distribution and abundance of benthic and demersal macrofauna within a natural hydrocarbon seep. Mar. Ecol. Prog. Ser. 1996, 138, 71–82. [Google Scholar] [CrossRef]
- Kaplan, D.L.; Hartenstein, R. Studies on monooxygenases and dioxygenases in soil macroinvertebrates and bacterial isolates from the gut of the terrestrial isopod, Oniscus asellus L. Comp. Biochem. Physiol. Part B Biochem. 1978, 60, 47–50. [Google Scholar] [CrossRef]
- Craig, J.; Gerali, F.; Macaulay, F.; Sorkhabi, R. The history of the European oil and gas industry (1600s–2000s). In Geological Society Special Publication; Geological Society of London: London, England, 2018; Volume 465, pp. 1–24. [Google Scholar]
- Van Dijk, J.P.; Affinito, V.; Atena, R.; Caputi, A.; Cestari, A.; D’Elia, S.; Giancipoli, N.; Lanzellotti, M.; Lazzari, M.; Oriolo, N.; et al. Cento Anni di Ricerca Petrolifera—L’Alta Val d’Agri (Basilicata, Italia meridionale). In Atti del 1º Congresso dell’Ordine dei Geologi di Basilicata,“Ricerca, Sviluppo ed Utilizzo delle Fonti Fossili: Il Ruolo del Geologo”; Dibuono Edizioni: Potenza, Italy, 2012. [Google Scholar]
- Merlini, S.; Mostardini, F. Appennino centro-meridionale: Sezioni geologiche e proposta di modello strutturale. Mem. Soc. Geol. Ital. 1986, 35, 177–202. [Google Scholar]
- Butler, R.W.H.; Corrado, S.; Mazzoli, S.; De Donatis, M.; Di Bucci, D.; Naso, G.; Scrocca, D.; Nicolai, C.; Zucconi, V. Time and space variability of «thin-skinned» and «thick-skinned» thrust tectonics in the Apennines (Italy)Variabilità spazio-temporale degli stili tettonici nella catena a pieghe e sovrascorrimenti appenninica. Rend. Lincei 2000, 11, 5–39. [Google Scholar] [CrossRef]
- Menardi Noguera, A.; Rea, G. Deep structure of the Campanian–Lucanian arc (southern Apennine, Italy). Tectonophysics 2000, 324, 239–265. [Google Scholar] [CrossRef]
- Wavrek, D.A.; Mosca, F. Compositional grading in the oil column: Advances from a mass balance and quantitative molecular analysis. Geol. Soc. Spec. Publ. 2004, 237, 207–220. [Google Scholar] [CrossRef]
- QGIS Development Team QGIS Geographic Information System. Open Source Geospatial Foundation Project; Map tiles by Stamen Design, under CC BY 3.0. Data by OpenStreetMap, under ODbL; QGIS Development Team QGIS Geographic Information System: Redlands, CA, USA, 2020. [Google Scholar]
- Regione Basilicata. DataBase GeoTopografico (DBGT) della Regione Basilicata. Available online: https://rsdi.regione.basilicata.it/dbgt-ctr/ (accessed on 25 June 2020).
- Olita, F. Investigation of the Natural Hydrocarbon Manifestations and 3D Reconstruction of the Reservoir in the Tramutola Area (Basilicata). Master’s Thesis, University of Basilicata, Potenza, Italy, 2019. [Google Scholar]
- Drogue, C. Hydrodynamics of karstic aquifers: Experimental sites in the Mediterranean karst, Southern France. In Hydrogeology of Selected Karst Regions; Back, W., Herman, J.S., Paloc, H., Eds.; International Association of Hydrogeologists: Heise, Hannover, 1992; pp. 133–149. ISBN 3-922705-94-4. [Google Scholar]
- Celico, F.; Petrella, E.; Celico, P. Hydrogeological behaviour of some fault zones in a carbonate aquifer of Southern Italy: An experimentally based model. Terra Nov. 2006, 18, 308–313. [Google Scholar] [CrossRef]
- Petrella, E.; Capuano, P.; Carcione, M.; Celico, F. A high-altitude temporary spring in a compartmentalized carbonate aquifer: The role of low-permeability faults and karst conduits. Hydrol. Process. 2009, 23, 3354–3364. [Google Scholar] [CrossRef]
- Bucci, A.; Petrella, E.; Naclerio, G.; Gambatese, S.; Celico, F. Bacterial migration through low-permeability fault zones in compartmentalised aquifer systems: A case study in Southern Italy. Int. J. Speleol. 2014, 43, 273–281. [Google Scholar] [CrossRef] [Green Version]
- Aquino, D.; Petrella, E.; Florio, M.; Celico, P.; Celico, F. Complex hydraulic interactions between compartmentalized carbonate aquifers and heterogeneous siliciclastic successions: A case study in southern Italy. Hydrol. Process. 2015, 29, 4252–4263. [Google Scholar] [CrossRef]
- Petrella, E.; Aquino, D.; Fiorillo, F.; Celico, F. The effect of low-permeability fault zones on groundwater flow in a compartmentalized system. Experimental evidence from a carbonate aquifer (Southern Italy). Hydrol. Process. 2015, 29, 1577–1587. [Google Scholar] [CrossRef]
- Agosta, F.; Alessandroni, M.; Antonellini, M.; Tondi, E.; Giorgioni, M. From fractures to flow: A field-based quantitative analysis of an outcropping carbonate reservoir. Tectonophysics 2010, 490, 197–213. [Google Scholar] [CrossRef]
- Ferraro, F.; Grieco, D.S.; Agosta, F.; Prosser, G. Space-time evolution of cataclasis in carbonate fault zones. J. Struct. Geol. 2018, 110, 45–64. [Google Scholar] [CrossRef]
- Giuffrida, A.; La Bruna, V.; Castelluccio, P.; Panza, E.; Rustichelli, A.; Tondi, E.; Giorgioni, M.; Agosta, F. Fracture simulation parameters of fractured reservoirs: Analogy with outcropping carbonates of the Inner Apulian Platform, southern Italy. J. Struct. Geol. 2019, 123, 18–41. [Google Scholar] [CrossRef]
- Hernàndez-Diaz, R.; Petrella, E.; Bucci, A.; Naclerio, G.; Feo, A.; Sferra, G.; Chelli, A.; Zanini, A.; Gonzalez-Hernandez, P.; Celico, F. Integrating hydrogeological and microbiological data and modelling to characterize the hydraulic features and behaviour of coastal carbonate aquifers: A case in western Cuba. Water 2019, 11, 1989. [Google Scholar] [CrossRef] [Green Version]
- Rizzo, P.; Bucci, A.; Sanangelantoni, A.M.; Iacumin, P.; Celico, F. Coupled microbiological-isotopic approach for studying hydrodynamics in deep reservoirs: The case of the Val d’Agri oilfiled (Southern Italy). Water 2020, 12, 1483. [Google Scholar] [CrossRef]
- De Vita, P.; Allocca, V.; Celico, F.; Fabbrocino, S.; Cesaria, M.; Monacelli, G.; Musilli, I.; Piscopo, V.; Scalise, A.R.; Summa, G.; et al. Hydrogeology of continental Southern Italy. J. Maps 2018, 14, 230–241. [Google Scholar]
- International Standard Organization (ISO). Soil Quality—Inhibition of Reproduction of Collembola (Folsomia Candida) by Soil Pollutants; ISO: Geneva, Switzerland, 1999; No. 11267. [Google Scholar]
- International Standard Organization (ISO). Soil Quality—Effects of Pollutants on Earthworms; ISO: Geneva, Switzerland, 1998; No. 11268. [Google Scholar]
- McDonald, J. Tests for one measurement variable. In Handbook of Biological Statistics; Publishing, S.H., Ed.; Sparky House Publishing: Baltimore, MD, USA, 2014; pp. 140–145. ISBN 9780444535924. [Google Scholar]
- Maxime, H. RVAideMemoire: Testing and Plotting Procedures for Biostatistics. Available online: https://CRAN.R-project.org/package=RVAideMemoire (accessed on 15 June 2020).
- Oksanen, J.; Blanchet, F.G.; Kindt, R.; Legendre, P.; O’Hara, R.B.; Simpson, G.L.; Solymos, P.; Stevens, M.H.H.; Wagner, H. Vegan: Community Ecology Package. Available online: https://CRAN.R-project.org/package=vegan (accessed on 15 June 2020).
- R Core Team. R: A Language and Environment for Statistical Computing; R Core Team: Vienna, Austria, 2020. [Google Scholar]
- Van Straalen, N.M.; Verhoef, H.A. The development of a bioindicator system for soil acidity based on arthropod pH preferences. J. Appl. Ecol. 1997, 34, 217. [Google Scholar] [CrossRef]
- García-Segura, D.; Castillo-Murrieta, I.M.; Martínez-Rabelo, F.; Gomez-Anaya, A.; Rodríguez-Campos, J.; Hernández-Castellanos, B.; Contreras-Ramos, S.M.; Barois, I. Macrofauna and mesofauna from soil contaminated by oil extraction. Geoderma 2018, 332, 180–189. [Google Scholar] [CrossRef]
- Schaefer, M.; Juliane, F. The influence of earthworms and organic additives on the biodegradation of oil contaminated soil. Appl. Soil Ecol. 2007, 36, 53–62. [Google Scholar] [CrossRef]
- Shakir Hanna, S.H.; Weaver, R.W. Earthworm survival in oil contaminated soil. Plant Soil 2002, 240, 127–132. [Google Scholar] [CrossRef]
- Schaefer, M.; Petersen, S.O.; Filser, J. Effects of Lumbricus terrestris, Allolobophora chlorotica and Eisenia fetida on microbial community dynamics in oil-contaminated soil. Soil Biol. Biochem. 2005, 37, 2065–2076. [Google Scholar] [CrossRef]
- Ceccanti, B.; Masciandaro, G.; Garcia, C.; MacCi, C.; Doni, S. Soil bioremediation: Combination of earthworms and compost for the ecological remediation of a hydrocarbon polluted soil. Water Air Soil Pollut. 2006, 177, 383–397. [Google Scholar] [CrossRef]
- Spies, R.B.; Davis, P.H. The infaunal benthos of a natural oil seep in the Santa Barbara channel. Mar. Biol. 1979, 50, 227–237. [Google Scholar] [CrossRef]
- Montagna, P.A.; Bauer, J.E.; Toal, J.; Hardin, D.; Spies, R.B. Temporal variability and the relationship between benthic meiofaunal and microbial populations of a natural coastal petroleum seep. J. Mar. Res. 1987, 45, 761–789. [Google Scholar] [CrossRef]
- Chan, H. Biodegradation of petroleum oil achieved by bacteria and nematodes in contaminated water. Sep. Purif. Technol. 2011, 80, 459–466. [Google Scholar] [CrossRef]
- Blakely, J.K.; Neher, D.A.; Spongberg, A.L. Soil invertebrate and microbial communities, and decomposition as indicators of polycyclic aromatic hydrocarbon contamination. Appl. Soil Ecol. 2002, 21, 71–88. [Google Scholar] [CrossRef]
- Montagna, P.; Bauer, J.; Prieto, M.; Hardin, D.; Spies, R. Benthic metabolism in a natural coastal petroleum seep. Mar. Ecol. Prog. Ser. 1986, 34, 31–40. [Google Scholar] [CrossRef]
- Beyrem, H.; Louati, H.; Essid, N.; Aïssa, P.; Mahmoudi, E. Effects of two lubricant oils on marine nematode assemblages in a laboratory microcosm experiment. Mar. Environ. Res. 2010, 69, 248–253. [Google Scholar] [CrossRef] [Green Version]
- Rizzo, P.; Malerba, M.; Bucci, A.; Sanangelantoni, A.M.; Remelli, S.; Celico, F. Potential enhancement of the in-situ bioremediation of contaminated sites through the isolation and screening of bacterial strains in natural hydrocarbon springs. Water 2020, 12, 2090. [Google Scholar] [CrossRef]
- Hopkin, S.P. Biology of the Springtails (Insecta, Collembola); Oxford University Press: New York, NY, USA, 1997; ISBN 9780198540847. [Google Scholar]
- Menta, C.; Remelli, S. Soil health and arthropods: From complex system to worthwhile investigation. Insects 2020, 11, 54. [Google Scholar] [CrossRef] [PubMed] [Green Version]
- Weber, G. Die Nematocera (Insecta: Diptera) eines klärschlammgedüngten und schwermetallbelasteten Ackers: Ökologie und Larvalbiologie; Universität Carolo-Wilhelmina zu Braunschweig: Braunschweig, Germany, 1993. [Google Scholar]
- Melekhina, E.N. Recovery successions of soil microfauna in oil-polluted ecosystems of the European subarctic. Biol. Bull. 2020, 47, 97–105. [Google Scholar] [CrossRef]
- Migliorini, M.; Petrioli, A.; Bernini, F. Comparative analysis of two edaphic zoocoenoses (Oribatid mites and Carabid beetles) in five habitats of the “Pietraporciana” and “Lucciolabella” Nature Reserves (Orcia Valley, central Italy). Acta Oecol. 2002, 23, 361–374. [Google Scholar] [CrossRef]

Figure 2.
Hydrogeological map of the study area (from Rizzo et al., 2020 modified) [35]; the blue points show the location of the investigated springs A and B (the geological sketch is taken from Olita, 2018, modified) [24].

Figure 3.
Average and Standard Error of the percentage of surviving earthworms and of the rate of growth in soil A and B after 28 days. Different letters above bars mean significant differences between A0 and B0 (p ≤ 0.05).
Figure 3.
Average and Standard Error of the percentage of surviving earthworms and of the rate of growth in soil A and B after 28 days. Different letters above bars mean significant differences between A0 and B0 (p ≤ 0.05).

Figure 4.
Average and Standard Error of phyla accounting for at least 90% of total microfauna abundance. (a) Ciliophora and (b) Nematoda abundance per 10 g of soil. No letters above bars mean no significant differences within transects (p > 0.05).
Figure 4.
Average and Standard Error of phyla accounting for at least 90% of total microfauna abundance. (a) Ciliophora and (b) Nematoda abundance per 10 g of soil. No letters above bars mean no significant differences within transects (p > 0.05).

Figure 5.
Principal coordinate analysis (PCoA) ordination plot with the dissimilarity in arthropods communities according to their distance from the seepage.
Figure 5.
Principal coordinate analysis (PCoA) ordination plot with the dissimilarity in arthropods communities according to their distance from the seepage.

Figure 6.
Average and Standard Error of the number of taxa and the number of individuals per m2 found along the transect at 0 m (soil surrounding seepage A), 5 m and 10 m from seepage A. No letters above bars mean no significant differences within transects (p > 0.05).
Figure 6.
Average and Standard Error of the number of taxa and the number of individuals per m2 found along the transect at 0 m (soil surrounding seepage A), 5 m and 10 m from seepage A. No letters above bars mean no significant differences within transects (p > 0.05).

Figure 7.
Average and Standard Error of the number of taxa and the number of individuals per m2 found along the transect at 0 m (soil surrounding seepage B), 5 m, 10 m, 15 m and 20 m from seepage B. Different letters above bars mean significant differences within transects (p ≤ 0.01).
Figure 7.
Average and Standard Error of the number of taxa and the number of individuals per m2 found along the transect at 0 m (soil surrounding seepage B), 5 m, 10 m, 15 m and 20 m from seepage B. Different letters above bars mean significant differences within transects (p ≤ 0.01).

Figure 8.
Average and Standard Error of groups accounting for at least 90% of total arthropod abundance. (a) Acarina abundance per m²; (b) Collembola abundance per m²; (c) Diptera larvae abundance per m². Different letters above bars mean significant differences within transects (p ≤ 0.01).
Figure 8.
Average and Standard Error of groups accounting for at least 90% of total arthropod abundance. (a) Acarina abundance per m²; (b) Collembola abundance per m²; (c) Diptera larvae abundance per m². Different letters above bars mean significant differences within transects (p ≤ 0.01).


Table 1.
Chemical analysis on soils A0 and B0.
| Soil A0 (mg/kg) | Soil B0 (mg/kg) | |
|---|---|---|
| Dry weight content at 105 °C (%) | 63.5 | 43.3 |
| Skeleton between 2 cm and 2 mm (%) | 56.3 | 1.0 |
| Benzene | <0.01 | <0.01 |
| Etilbenzene | <0.05 | <0.05 |
| Styrene | <0.05 | <0.05 |
| Toluene | <0.05 | <0.05 |
| Xylenes | <0.05 | <0.05 |
| o-Xylene | <0.05 | <0.05 |
| p,m-Xilenes | <0.05 | <0.05 |
| Total aromatic compounds (D. Lgs.152/06) | <0.10 | <0.10 |
| Benzo(a)anthracene | 0.16 | 0.95 |
| Benzo(a)pyrene | <0.01 | <0.01 |
| Benzo(b)fluoranthene | <0.05 | 3.93 |
| Benzo(k)fluoranthene | <0.05 | 0.58 |
| Benzo(g,h,i)perylene | 0.28 | 1.45 |
| Chrysene | 0.21 | 1.23 |
| Dibenzo(a,e)pyrene | <0.01 | <0.01 |
| Dibenzo(a,l)pyrene | <0.01 | 0.10 |
| Dibenzo(a,i)pyrene | <0.01 | <0.01 |
| Dibenzo(a,h)pyrene | <0.01 | <0.01 |
| Dibenzo(a,h)anthracene | <0.01 | 0.34 |
| Indeno(1,2,3-c,d)pyrene | 0.05 | 0.19 |
| Pyrene | <0.05 | 0.61 |
| Total IPA (D.Lgs. 152/06 All.5 Table 1) | <1.0 | 8.25 |
Table 2.
Average ± Standard Error of the number of individuals for each faunal group (microfauna per 10 g and Arthropoda per m²) found along transects in study sites, together with the Simpson Index of Diversity (1-D) and the Shannon Diversity Index (H) calculated for Arthropoda.
Table 2.
Average ± Standard Error of the number of individuals for each faunal group (microfauna per 10 g and Arthropoda per m²) found along transects in study sites, together with the Simpson Index of Diversity (1-D) and the Shannon Diversity Index (H) calculated for Arthropoda.
| A | B | |||||||||||||||||||||||
|---|---|---|---|---|---|---|---|---|---|---|---|---|---|---|---|---|---|---|---|---|---|---|---|---|
| 0 m | 5 m | 10 m | 0 m | 5 m | 10 m | 15 m | 20 m | |||||||||||||||||
| Microfauna (<200 μm) | ||||||||||||||||||||||||
| Ciliophora | 7.33 | ± | 6.36 | 3.33 | ± | 3.33 | 8.67 | ± | 4.67 | - | 2.00 | ± | 1.15 | 1.33 | ± | 0.67 | - | 0.67 | ± | 0.67 | ||||
| Nematoda | 16.00 | ± | 13.11 | 36.67 | ± | 15.68 | 74.00 | ± | 22.72 | 9.33 | ± | 3.53 | 67.33 | ± | 40.16 | 38.00 | ± | 20.53 | 4.67 | ± | 2.91 | 18.00 | ± | 11.02 |
| Rotifera | - | 1.33 | ± | 1.33 | 5.33 | ± | 0.67 | - | - | - | - | - | ||||||||||||
| Sarcomastigophora | 0.67 | ± | 0.67 | 1.33 | ± | 1.33 | - | - | - | 0.67 | ± | 0.67 | - | 2.00 | ± | 1.15 | ||||||||
| Tardigrada | - | - | 0.67 | ± | 0.67 | - | 4.67 | ± | 2.91 | 2.67 | ± | 1.76 | - | 0.67 | ± | 0.67 | ||||||||
| Microarthropods (200 μm–2 mm) | ||||||||||||||||||||||||
| Acarina | 92.00 | ± | 81.61 | 481.21 | ± | 353.83 | 608.59 | ± | 314.97 | - | 4415.84 | ± | 3220.18 | 304.30 | ± | 128.75 | 7.08 | ± | 7.08 | 311.37 | ± | 290.14 | ||
| Araneidae | - | - | - | - | - | - | 7.08 | ± | 7.08 | - | ||||||||||||||
| Chilopoda | - | - | 56.61 | ± | 37.45 | - | - | - | - | - | ||||||||||||||
| Coleoptera | 7.08 | ± | 7.08 | 49.54 | ± | 25.52 | 35.38 | ± | 18.72 | - | 49.54 | ± | 18.72 | 14.15 | ± | 14.15 | 7.08 | ± | 7.08 | 28.31 | ± | 14.15 | ||
| larvae | - | 49.54 | ± | 25.52 | 21.23 | ± | 12.28 | - | 35.38 | ± | 14.15 | 7.08 | ± | 7.08 | - | 7.08 | ± | 7.08 | ||||||
| Collembola | 3651.56 | ± | 3588.06 | 226.45 | ± | 183.99 | 750.13 | ± | 504.98 | 28.31 | ± | 28.31 | 643.98 | ± | 396.10 | 169.84 | ± | 53.43 | - | 707.67 | ± | 580.80 | ||
| Diplura | - | - | - | - | 14.15 | ± | 14.15 | - | - | - | ||||||||||||||
| Diptera | 7.08 | ± | 7.08 | 14.15 | ± | 14.15 | 42.46 | ± | 32.43 | 42.46 | ± | 42.46 | 70.77 | ± | 30.85 | 84.92 | ± | 44.19 | 42.46 | ± | 12.26 | 183.99 | ± | 60.46 |
| larvae | 7.08 | ± | 7.08 | 14.15 | ± | 14.15 | 42.46 | ± | 32.43 | 35.38 | ± | 35.38 | 42.46 | ± | 24.51 | 77.84 | ± | 46.40 | 28.31 | ± | 28.31 | 162.76 | ± | 51.03 |
| Hemiptera | - | - | 7.08 | ± | 7.08 | 7.08 | ± | 7.08 | 42.46 | ± | 42.46 | 21.23 | ± | 21.23 | - | 92.00 | ± | 46.40 | ||||||
| Hymenoptera | 14.15 | ± | 14.15 | 7.08 | ± | 7.08 | 14.15 | ± | 14.15 | - | 42.46 | ± | 24.51 | 21.23 | ± | 0.00 | - | 70.77 | ± | 60.46 | ||||
| larvae | - | - | 14.15 | ± | 14.15 | - | - | - | - | - | ||||||||||||||
| Isopoda | 7.08 | ± | 7.08 | 14.15 | ± | 14.15 | 14.15 | ± | 7.08 | - | 35.38 | ± | 18.72 | - | - | 106.15 | ± | 76.55 | ||||||
| Lepidoptera | 7.08 | ± | 7.08 | - | - | - | - | - | - | - | ||||||||||||||
| larvae | 7.08 | ± | 7.08 | - | - | - | - | - | - | - | ||||||||||||||
| Pauropoda | - | - | - | - | 155.69 | ± | 123.99 | - | - | - | ||||||||||||||
| Pseudoscorpionida | - | - | - | - | 7.08 | ± | 7.08 | - | - | - | ||||||||||||||
| Psocoptera | - | - | 7.08 | ± | 7.08 | - | 7.08 | ± | 7.08 | 7.08 | ± | 7.08 | - | - | ||||||||||
| Symphyla | - | - | 28.31 | ± | 28.31 | - | 35.38 | ± | 35.38 | 7.08 | ± | 7.08 | - | - | ||||||||||
| 1-D | 0.19 | ± | 0.16 | 0.40 | ± | 0.11 | 0.64 | ± | 0.09 | 0.49 | ± | 0.29 | 0.44 | ± | 0.09 | 0.67 | ± | 0.07 | 0.35 | ± | 0.17 | 0.67 | ± | 0.05 |
| H | 0.38 | ± | 0.31 | 0.73 | ± | 0.14 | 1.25 | ± | 0.29 | 0.22 | ± | 0.22 | 0.95 | ± | 0.19 | 1.31 | ± | 0.19 | 0.54 | ± | 0.28 | 1.31 | ± | 0.15 |
Table 3.
Results of similarity percentages (SIMPER) analysis. Most influential arthropod groups are shown, accounting for a cumulative dissimilarity between distances from the seepages of 70%. Overall (%): average contrast dissimilarity; Ratio: average contribution to overall dissimilarity to sd ratio; Cum. (%): ordered cumulative contribution of each arthropod group.
| Contrasts between Distances | Overall % | Most Influential Groups | Ratio | Cum. % | ||
|---|---|---|---|---|---|---|
| 0 m | - | 5 m | 82.82 | Acarina | 2.08 | 36.54 |
| Collembola | 1.25 | 63.01 | ||||
| Coleoptera larvae | 0.88 | 72.03 | ||||
| - | 10 m | 78.10 | Collembola | 1.56 | 30.51 | |
| Acarina | 1.75 | 59.00 | ||||
| Diptera larvae | 1.11 | 68.63 | ||||
| Hymenoptera | 1.14 | 75.04 | ||||
| 5 m | - | 10 m | 48.50 | Acarina | 1.41 | 28.47 |
| Collembola | 1.43 | 45.67 | ||||
| Diptera larvae | 1.07 | 54.55 | ||||
| Coleoptera larvae | 1.02 | 61.87 | ||||
| Hymenoptera | 1.14 | 67.29 | ||||
| Pauropoda | 0.89 | 72.51 | ||||
© 2020 by the authors. Licensee MDPI, Basel, Switzerland. This article is an open access article distributed under the terms and conditions of the Creative Commons Attribution (CC BY) license (http://creativecommons.org/licenses/by/4.0/).
Share and Cite
MDPI and ACS Style
Remelli, S.; Rizzo, P.; Celico, F.; Menta, C. Natural Surface Hydrocarbons and Soil Faunal Biodiversity: A Bioremediation Perspective. Water 2020, 12, 2358. https://doi.org/10.3390/w12092358
AMA Style
Remelli S, Rizzo P, Celico F, Menta C. Natural Surface Hydrocarbons and Soil Faunal Biodiversity: A Bioremediation Perspective. Water. 2020; 12(9):2358. https://doi.org/10.3390/w12092358
Chicago/Turabian StyleRemelli, Sara, Pietro Rizzo, Fulvio Celico, and Cristina Menta. 2020. "Natural Surface Hydrocarbons and Soil Faunal Biodiversity: A Bioremediation Perspective" Water 12, no. 9: 2358. https://doi.org/10.3390/w12092358
Note that from the first issue of 2016, this journal uses article numbers instead of page numbers. See further details here.