Article

Spatial and Seasonal Variations of C, Nutrient, and Metal Concentration in Thermokarst Lakes of Western Siberia Across a Permafrost Gradient

by
Rinat M. Manasypov
1,*,
Artem G. Lim
1,
Ivan V. Kriсkov
1,
Liudmila S. Shirokova
2,3,
Sergey N. Vorobyev
1,
Sergey N. Kirpotin
1 and
Oleg S. Pokrovsky
1,2,3
1
BIO-GEO-CLIM Laboratory, Tomsk State University, 36 Lenina av., 634004 Tomsk, Russia
2
Federal Center for Integrated Arctic research, Institute of Ecological Problem of the North, 23 Nab Severnoi Dviny, 163000 Arkhangelsk, Russia
3
GET UMR 5563 CNRS University of Toulouse, 14 Avenue Edouard Belin, 31400 Toulouse, France
*
Author to whom correspondence should be addressed.
Water 2020, 12(6), 1830; https://doi.org/10.3390/w12061830
Submission received: 26 May 2020 / Revised: 20 June 2020 / Accepted: 22 June 2020 / Published: 26 June 2020

Abstract

:
Thermokarst lakes and ponds formed due to thawing of frozen peat in high-latitude lowlands are very dynamic and environmentally important aquatic systems that play a key role in controlling C emission to atmosphere and organic carbon (OC), nutrient, and metal lateral export to rivers and streams. However, despite the importance of thermokarst lakes in assessing biogeochemical functioning of permafrost peatlands in response to climate warming and permafrost thaw, spatial (lake size, permafrost zone) and temporal (seasonal) variations in thermokarst lake hydrochemistry remain very poorly studied. Here, we used unprecedented spatial coverage (isolated, sporadic, discontinuous, and continuous permafrost zone of the western Siberia Lowland) of 67 lakes ranging in size from 102 to 105 m2 for sampling during three main hydrological periods of the year: spring flood, summer baseflow, and autumn time before ice-on. We demonstrate a systematic, all-season decrease in the concentration of dissolved OC (DOC) and an increase in SO4, N-NO3, and some metal (Mn, Co, Cu, Mo, Sr, U, Sb) concentration with an increase in lake surface area, depending on the type of the permafrost zone. These features are interpreted as a combination of (i) OC and organically bound metal leaching from peat at the lake shore, via abrasion and delivery of these compounds by suprapermafrost flow, and (ii) deep groundwater feeding of large lakes (especially visible in the continuous permafrost zone). Analyses of lake water chemical composition across the permafrost gradient allowed a first-order empirical prediction of lake hydrochemical changes in the case of climate warming and permafrost thaw, employing a substituting space for time scenario. The permafrost boundary shift northward may decrease the concentrations and pools of dissolved inorganic carbon (DIC), Li, B, Mg, K, Ca, Sr, Ba, Ni, Cu, As, Rb, Mo, Sr, Y, Zr, rare Earth elements (REEs), Th, and U by a factor of 2–5 in the continuous permafrost zone, but increase the concentrations of CH4, DOC, NH4, Cd, Sb, and Pb by a factor of 2–3. In contrast, the shift of the sporadic to isolated zone may produce a 2–5-fold decrease in CH4, DOC, NH4, Al, P, Ti, Cr, Ni, Ga, Zr, Nb, Cs, REEs, Hf, Th, and U. The exact magnitude of this response will, however, be strongly seasonally dependent, with the largest effects observable during baseflow seasons.

1. Introduction

The impact of ongoing climate change on the functioning of aquatic ecosystems and biogeochemical cycles of chemical elements poses the main environmental threat in the arctic and subarctic regions [1]. Western Siberia is a key region and the most convenient platform to study the fundamental issues of climate–permafrost interaction, examine the applied aspects of these changes, and assess their possible social impacts [2,3,4]. Thawing of frozen peatlands under increasing air and water temperature and greenhouse gas (GHG) concentrations are the most crucial issues related to behavior of aquatic ecosystems in the north of Western Siberia, the largest permafrost peatland in the world.
The permafrost-affected part of the West Siberian Lowland (WSL) covers an area of 1.05 million km2 [5]. The majority of lakes here are of thermokarst origin, formed during thawing of frozen peat bogs, similar to other arctic and subarctic regions of the northern hemisphere. The lake coverage of the lowland can attain 40–60% in some areas. Recent estimates obtained using high-resolution satellite imagery show that the total area of the lakes amounts to 61,900 km2 [5], while the total number of thermokarst lakes of the WSL permafrost zone is 727,700 [6]. Thermokarst lakes in Western Siberia are the key components of GHG exchange between surface waters and the atmosphere [7]. Such lakes represent highly dynamic water systems [8,9,10,11], which are substantially fed by atmospheric precipitation [12,13]. Thermokarst lakes, as the most common water bodies in the arctic and subarctic regions, are also the main pools [14,15] and sources [16] of dissolved metals and dissolved organic carbon (DOC), and they play a crucial role for the adjacent hydrological network during flooding or drainage [17,18]. The surface of frozen peat bogs in the north of Western Siberia is smooth and flat; therefore, the water surface area of lakes is almost equal to the catchment area [13]. Most of the chemical elements and DOC enter the lakes during coastal abrasion of the reactive frozen peat [13,18,19], via surface runoff in the snowmelt period [12], via atmospheric transport [20], and after ground fires [21].
In high-latitude peatlands, thermokarst (thaw) lakes are formed due to ice melting and soil subsidence in frozen wetlands as a result of thermokarst processes [22,23,24,25,26,27,28,29,30,31]. Former studies of the history of thermokarst lakes revealed a cyclic nature of their formation and development [3,18,32,33,34,35], although these cycles are not observed in all circumpolar regions (i.e., References [25,36,37,38,39]). In the WSL, the cycle starts when frozen peat subsides due to warming, and a depression filled by thaw water is formed in the moss/lichen cover [3,18]. After some time, the depression attains the size of a lake due to ongoing subsidence of peat soil and degradation of its unstable edges. A mature thermokarst lake can eventually drain into another lake or into a hydrological system (local streams and rivers). The bottom of the drained lake is covered with gramineae-like plant communities alternated with mosses and lichens. The soil gradually heaves due to renewed permafrost, and small isolated mounds form and merge into a flat uniform palsa plateau. Another wet depression at the former basin of the thermokarst lake can start a new cycle. In this regard, the size of the water body can be indicative of the lake maturity, with small actively growing thaw ponds being a few years to a few decades old, and large, mature lakes with stable borders persisting for centuries (i.e., Reference [28]).
Thermokarst lakes in Western Siberia feature shallow depth (0.5–1.5 m), complete freezing in winter [40], and strong contact of thick sediments with overlaying water column via exchange of gases and solutes between porewaters and the water column [7,32]. Due to their shallow depth and unshaded (from the wind) position, the lakes lack vertical stratification in the water temperature, O2, and dissolved elements. Moreover, thermokarst lakes are typically isolated and not connected to hydrological networks. The watershed area of thermokarst lakes is typically very small, and it rarely exceeds the open water surface area. As a result, two main sources of solutes to the lake are peat abrasion/vegetation litter degradation on the lake shore, and subsoil inflow of the suprapermafrost ground waters above the frozen peat at the depth of 100 to 40 cm, depending on the active layer thickness (ALT). During the open water period from May/June to October, this suprapermafrost water originates from the rain/snowmelt water penetrating through moss and lichen layer and thawed peat ice, following progressively increasing ALT.
Thermokarst lakes in Western Siberia were studied primarily in summer [13,18,19,32,41,42,43,44], and the seasonal dynamics of the elemental composition was studied fragmentarily in one selected site of discontinuous permafrost zone [40]. As such, the seasonal dynamics of the elemental composition of lake water should be studied over a more extensive latitudinal transect of Western Siberia, encompassing several permafrost zones. By analogy with lakes of permafrost peatlands in Canada [12,26] or northern Sweden [45,46], one may expect that the hydrochemical pattern of lake water in WSL will follow the main hydrological events during the “active” (unfrozen) period of the year [47]: dilution by snowmelt in spring, evaporation and autochthonous biological processes in summer when the lake is fed by suprapermafrost waters, and beginning of freezing and sediment–bottom water exchange in autumn. However, it is not clear how and to which extent these processes will affect lake water chemical composition across small depressions, thaw ponds, and large thermokarst lakes abundant in different permafrost zones.
Ongoing climate warming in the Arctic can affect natural zones and cause spread of permafrost northward [48,49,50]. To predict changes in the elemental composition of surface waters [13,16,51,52], it is necessary to study the latitudinal gradient of the concentration of C, nutrients, and trace elements in water bodies. Generally, a latitudinal gradient allows using a “substituting space for time” approach as tested in Western Siberia for rivers [53,54,55], when contemporary spatial phenomena can be used to model future events (i.e., Reference [56]).
This work is aimed at getting new insights into the processes of formation of the lake water elemental composition across four permafrost zones of Western Siberia (from isolated to continuous permafrost zone), assessing a within-year variability of lake hydrochemistry, and predicting the evolution of elemental composition under ongoing climate change. For this, we addressed the following questions: (1) What are the relationships between element concentration and water surface area in different permafrost zones?; (2) How do the concentration and stock of DOC, DIC, nutrients, and trace elements in lake waters respond to the change in the main hydrological seasons?; (3) How do the concentrations and stocks of DOC, nutrients, and trace elements in thermokarst lakes change throughout the latitudinal profile of Western Siberia, and how may the elemental composition of the lake water respond to ALT increase and the permafrost boundary shift?
To shed light on these issues, we performed thorough seasonal measurements across all permafrost zones of the WSL in 2016. We studied major components of the C biogeochemical cycle in high-latitude water bodies—dissolved organic and inorganic carbon. Furthermore, we measured the concentrations and discussed the behavior of major anions (Cl, SO4), cations (Na, Mg, Ca, K), macro- (N, P, Si) and micro-nutrients (B, Mn, Fe, Co, Ni Cu, Zn, Rb, Mo, Ba), toxicants (As, Cd, Sb, Pb), and geochemical tracers (Li, Al, Ti, Cr, Ga, Sr, Y, rare Earth elements (REEs), Zr, Cs, Nb, Hf, Th, and U). As such, we covered all individual solutes of both ecological and general geochemical significance in the dissolved (<0.45 µm) fraction of the lake water. This set of data is novel compared to previous assessment of WSL thermokarst lake chemical composition performed in summer 2016 in the northern part of the lowland [13] and over four hydrological seasons in 2014 on a limited number of lakes in the sporadic permafrost zone [40].

2. Study Site Description, Sampling, Analytical and Statistical Methods

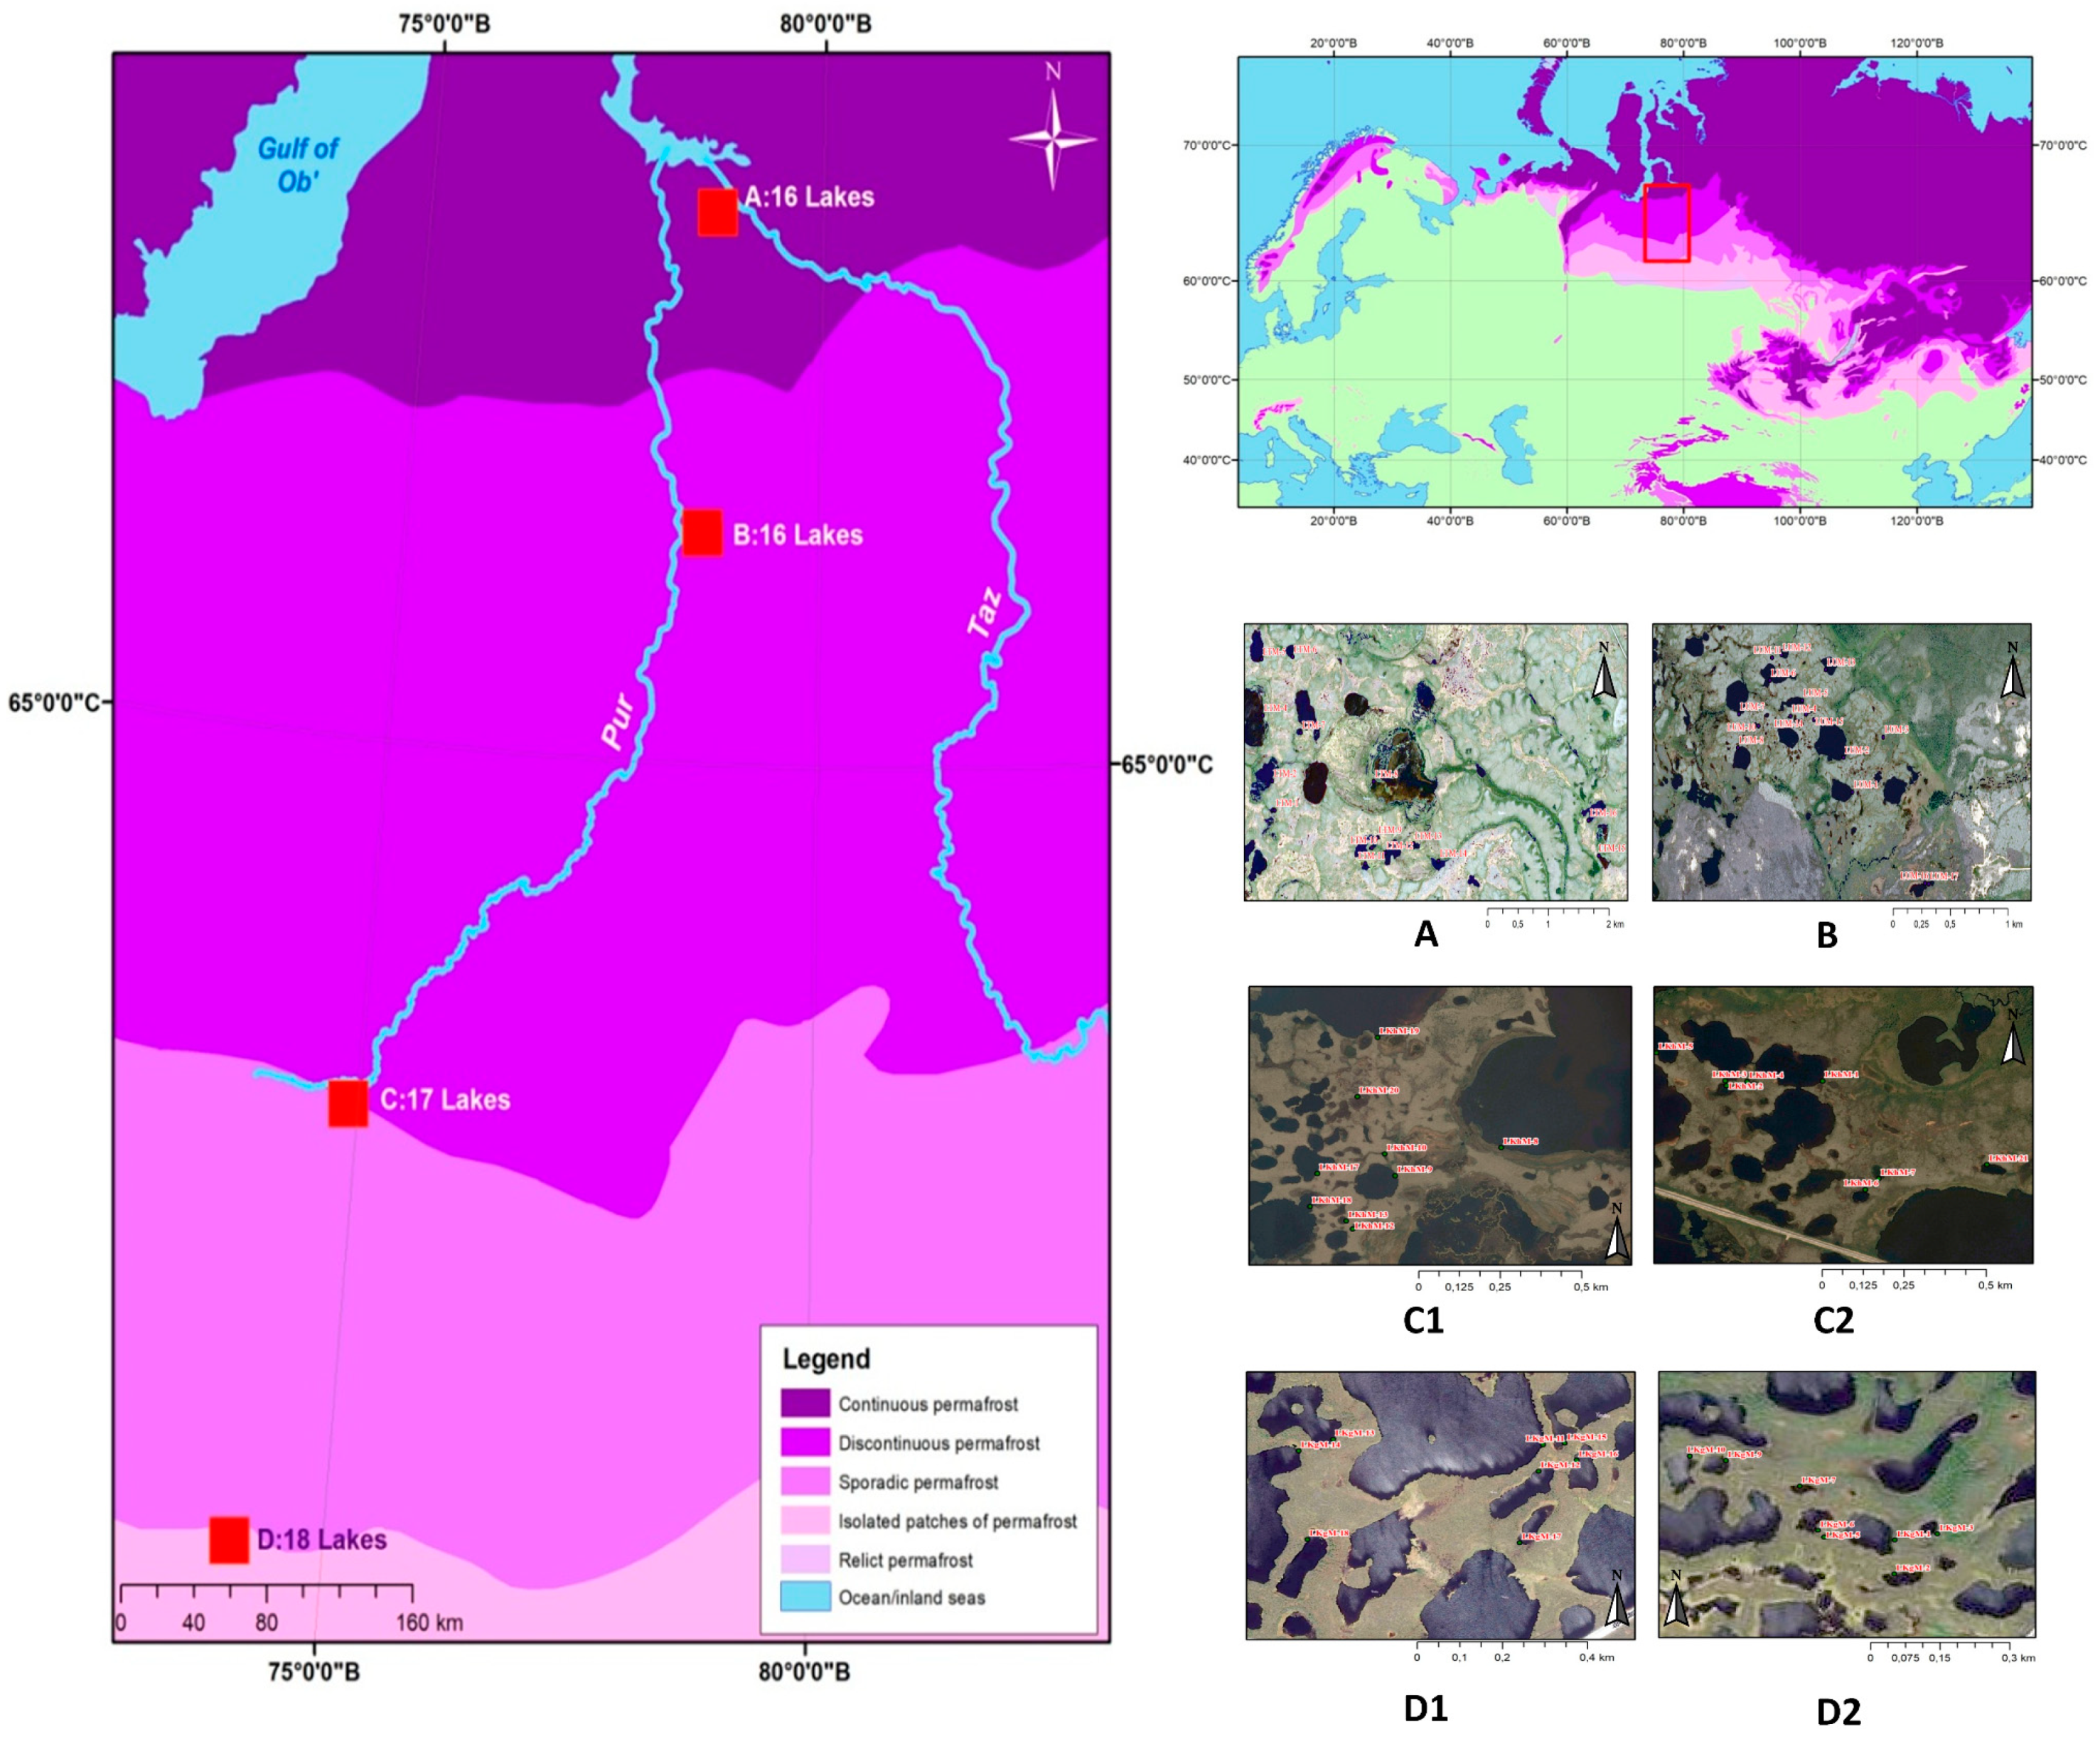
2.1. Study Site Description

The West Siberian lowland is covered by homogeneous taiga, forest–tundra, and tundra landscapes. The thermokarst lakes are developed in sporadic, discontinuous, and continuous permafrost zones, whereas raised bogs and ridge–pool complexes occur in isolated and sporadic permafrost zones [57]. The thermokarst lakes of Western Siberia are formed due to thawing and subsidences of frozen peatlands. The general cycles of their development are described elsewhere [2,3,32]. In the studied territory, the thermokarst lakes are shallow, isometric water bodies with sharp, rather abrupt shorelines. The mature thermokarst lake has stable frozen shores and it occupies clearly distinguishable depression in frozen peatlands. The height of the lake border can achieve 1.5 m which is comparable with the height of frozen mounds in the surrounding palsa peatbogs. The change of hydrological seasons leads to the change in lake depth due to evaporation and atmospheric input.
Lake water was sampled along the permafrost transect of Western Siberia, which includes four permafrost zones with four key sites in these zones: the southern site in the environs of the Kogalym town, taiga biome of the isolated permafrost zone; the environs of the Khanymey village, northern taiga biome of the sporadic permafrost zone; the environs of the Urengoy town, forest–tundra biome of the discontinuous permafrost zone; and most northern key site in the environs of the Tazovsky town, tundra biome of the continuous permafrost zone (Figure 1). In the description of the results obtained, the key study sites are referred to in accordance with the permafrost zones. The four key study sites are located essentially on watershed divides within the catchments of the Ob, Nadym, Pur, and Taz rivers. The average annual temperatures in these four territories are −4.0, −5.6, −6.4, and −9.1 °C when going from south to north [58]. During summer sampling, the average thickness of the active layer ranged from 200–300 cm in the south to 65 cm in the north [50]. A more detailed description of the study sites is provided elsewhere [7,13,49,50,59,60].
In the latitudinal transect of Western Siberia, we studied 67 lakes during three main hydrological seasons—melting of lake ice cover in spring, base flow in summer, and at the beginning of lake freeze-up in autumn. Specifically, we worked in 2016 at the ice-off event (20 May–13 June 2016), in the middle of the summer (8–24 August 2016), and just before lakes were ice-covered (25 September–8 October 2016). The sampling was performed in all four permafrost zones and included 18, 17, 16, and 16 lakes in the isolated, sporadic, discontinuous, and continuous permafrost zones, respectively.
The studied lakes are mostly rounded flat-concave shallow basins [7,13,62]. All the lakes have small catchments, with a watershed area almost similar to the area of the lake. The size of the lakes varies from several hundred meters to 1 km2 across all the permafrost zones. The studied lakes are characterized by shallow depth that varies significantly in different seasons since the main source of water supply for lakes is atmospheric precipitation and spring snowmelt [12,19,40], and parts of the small water bodies dry out in summer. The depth of the studied lakes in spring, during active snowmelt and abundant precipitation, was 122 ± 35 cm for the isolated zone, 50 ± 20 cm for the sporadic zone, 81 ± 37 cm for the discontinuous zone, and 140 ± 87 cm for the continuous permafrost zone. In summer, the depth of the studied lakes was observed to significantly decrease from the isolated to continuous zone and amounted to 90 ± 35, 36 ± 25, 45 ± 27, and 125 ± 77 cm, respectively. During autumn ice-on period and heavy rains, the depth of the lakes insignificantly increased, which was especially characteristic of sporadic and discontinuous zones (Figure S1A, Supplementary Materials).
The average temperature of lake water in the four key study sites ranged from 9.3 to 19.3 °C in the spring, 17 to 21.4 °C in the summer, and 3 to 8.1 °C in the autumn (Figure S1B, Supplementary Materials). There was no sizable temperature stratification between the most surface (0–20 cm) and most deep (0–10 m above sediments) water layers. All the lakes studied are characterized by high oxygen content, especially in the autumn (Figure S1C, Supplementary Materials). In order to obtain comparable results for the same season across full permafrost gradient, in spring, we moved from the south to the north, progressively sampling the lakes, following the northward advancement of the snowmelt. In summer and autumn, we moved from the north to the south. Note that, for seasonal observations, ultra-small water bodies (<100 m²), which often dry out in the summer, were excluded from sampling.

2.2. Sampling and Analyses

Water samples were collected from the lake surface (15–20 cm) using sterile plastic syringes and vinyl gloves. The lake water was filtered in situ immediately after sampling through disposable MILLEX Filter units (0.45 μm). The first 20–50 mL of the filtrate was not analyzed. To determine nutrients, samples (50 mL) of water filtered through pre-combusted acid-washed 0.45-µm Whatman GF/F glass fiber filters at 550 °C for 4 h (Thermo Fisher Scientific, Waltham, MA, USA) were immediately frozen for subsequent analysis of N-NH4+, N-NO3, and P-PO43−.
The filtered samples of lake water were divided into two parts, each of which was placed in a polypropylene vial (12 and 30 mL) pre-washed in a clean room (class A 10,000). One vial was acidified with bidistilled nitric acid to pH = 2 for cation analysis, and the other one was not acidified to analyze DOC, DIC, major anions (Cl, SO4), and ultraviolet (UV) absorbance. Prior to the analysis, the samples were stored in a refrigerator at 4 °C. At each sampling site, the temperature, pH, specific conductivity (SC), and dissolved oxygen (O2) were measured using a WTW Multi 3430 meter. The lake depth was measured using an echo-sonder (Cole-Parmer) at five points and represented as the median of a set of five numbers.
The nutrient concentration was analyzed using an automated flow injection analyzer (FIA star 5000, FOSS, Denmark) with detection limits of 1 µM·L−1 for N-NH4, 0.5 µM·L−1 for N-NO3, and 0.5 µM·L−1 for P-PO4. The CO2 and CH4 concentrations were measured by gas chromatography (see References [44,50] for details). The concentration of DOC, DIC, Cl, SO4, Si, major cations, and trace elements was measured by standard methods used for boreal organic-rich and low-mineralized water samples [18,43,63] as briefly described below. Trace elements were measured by inductively coupled plasma mass spectrometry using an ICP-MS quadrupole (Agilent Technologies 7500 ce, Santa Clara, CA, USA), with an In + Re internal standard and an uncertainty of ±5%. International geo-standard SLRS-5 (river water reference material for trace element analysis certified by the National Research Council of Canada) was used to validate the analyses [64]. The agreement of the results with certified SLRS-5 values ranged from 10% to 15% for 40 elements, except for B and P (≤30%). Non acidified samples were used for the following types of analysis: (1) measurement of DOC concentration by complete combustion at 800 °C using a platinum catalyst with subsequent determination of CO2 by infrared spectroscopy (TOC-VCSN, Shimadzu, Kyoto, Japan), with an accuracy of 5%, and a detection limit of 0.1 mg·L−1; (2) determination of chlorides and sulfates by high-performance liquid chromatography in the range of 0.05–10 mg·L−1 (Dionex ICS-2000, San Jose, CA, USA), with an accuracy of 2%, and a detection limit of 0.02 mg·L−1; (3) determination of ultraviolet radiation absorption at 254 nm using a Varian CARY-50 UV–visible light (Vis) spectrophotometer (Agilent Technologies, Santa Clara, CA, USA) and 10-mm quartz cuvette.

2.3. Statistical Treatment

The data on element concentrations were, firstly, checked for normal distribution using the Shapiro–Wilk test. Nonparametric statistics methods were employed even if a part of the data used in statistical processing was normally distributed and another part was distributed abnormally. The values of the median and interquartile range (median ± IQR) were used to describe the uncertainty due to a large number of extrema and outliers in the datasets and abnormally distributed data. For comparison, we also present the average values and standard deviation (mean ± SD) (Table A1, Appendix A). A correlation analysis with the calculated Spearman’s correlation coefficient (Rs) (p < 0.05) was used to identify the relationship between the elemental composition of lake waters and the water surface area, and to identify the shape of latitudinal patterns of chemical elements. The non-parametric Kruskal–Wallis test (H-test), which determines whether three or more independent samples originate from the same median population, was used to estimate the total difference in the concentration of major and trace elements between four sampling sites during three hydrological seasons. In this regard, this method is similar to the parametric one-way analysis of variance (ANOVA). In addition, a paired comparison analysis was performed using the non-parametric Mann–Whitney test (U-test) to identify statistically significant differences between two independent datasets based on one given parameter. Further statistical treatment of a complete set of element concentration in thermokarst lake waters included hierarchical cluster analysis (HCA) and principal components analysis (PCA) using a variance estimation method [65]. The PCA allowed testing the effect of various parameters, latitude and hydrological seasons in particular, on the behavior of DOC and the concentration of chemical elements. All graphs and drawings were plotted using Microsoft Excel 2016 and STATISTICA version 8 software package (StatSoft Inc., Tulsa, OK, USA) (http://www.statsoft.com).

3. Results and Discussion

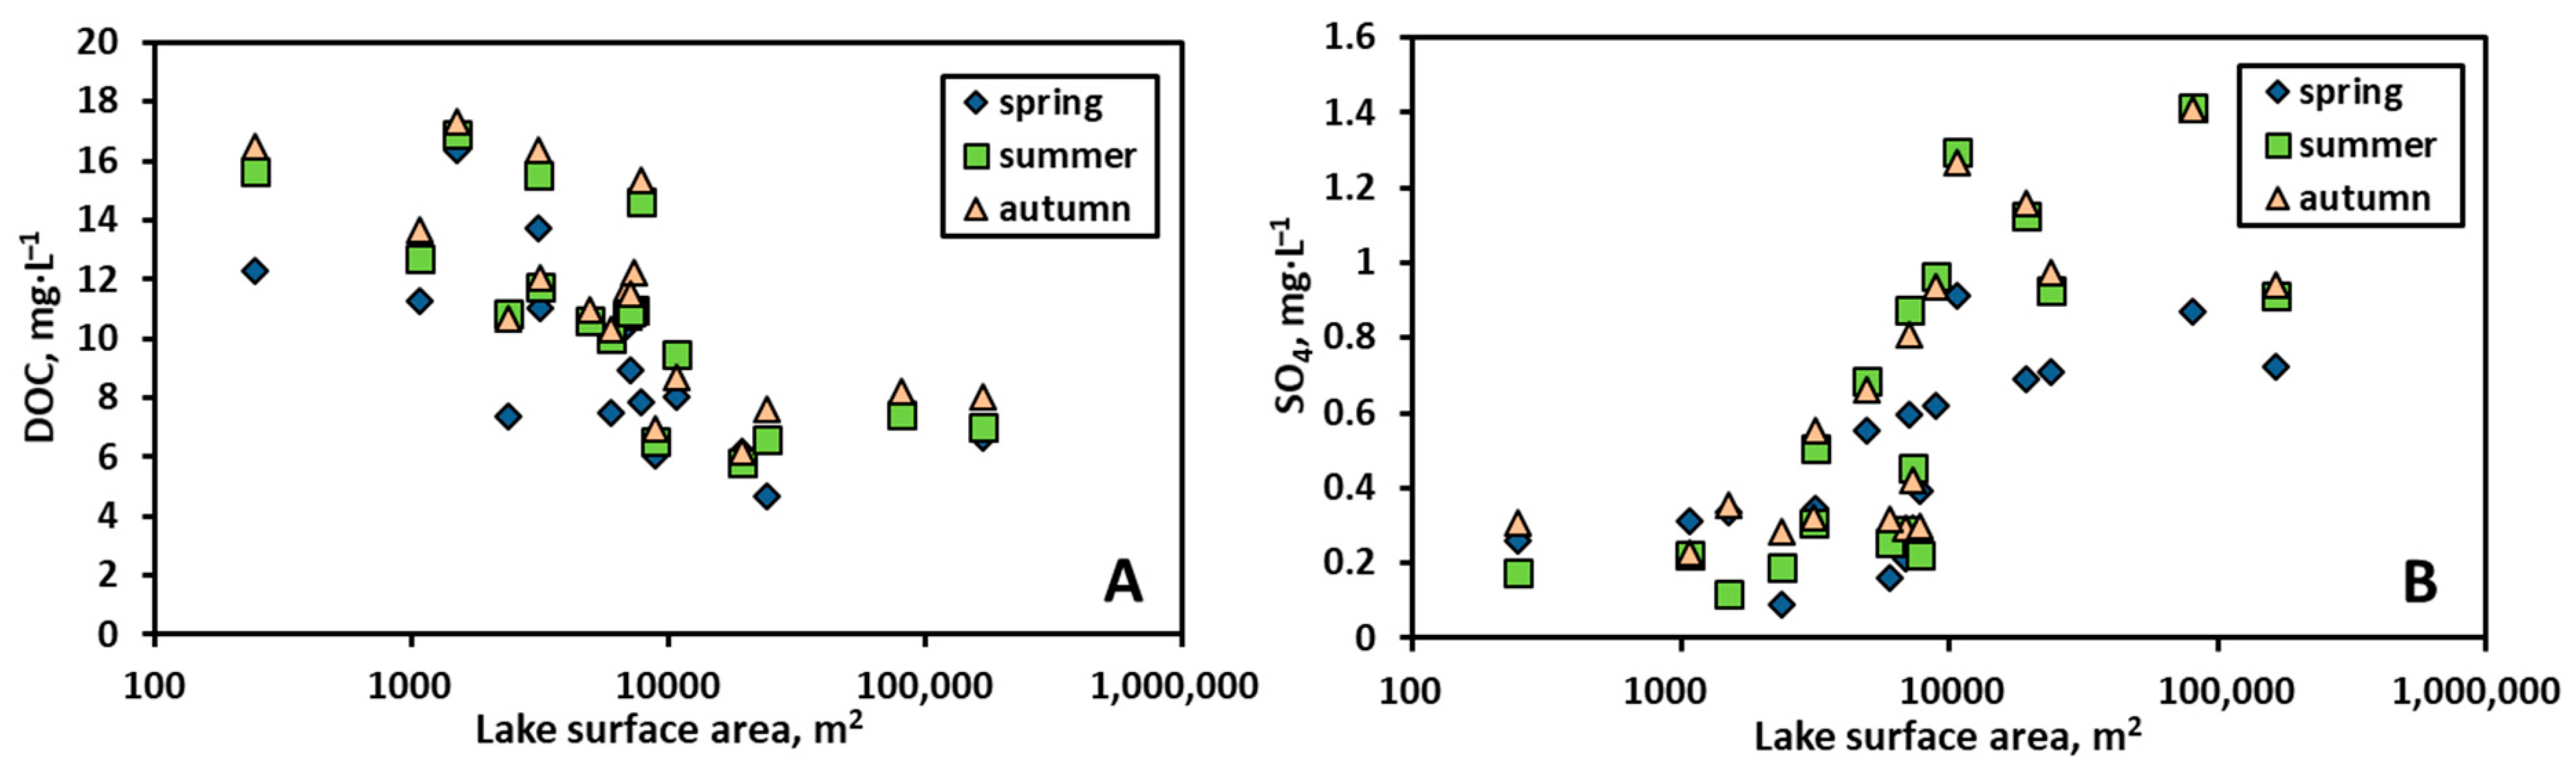
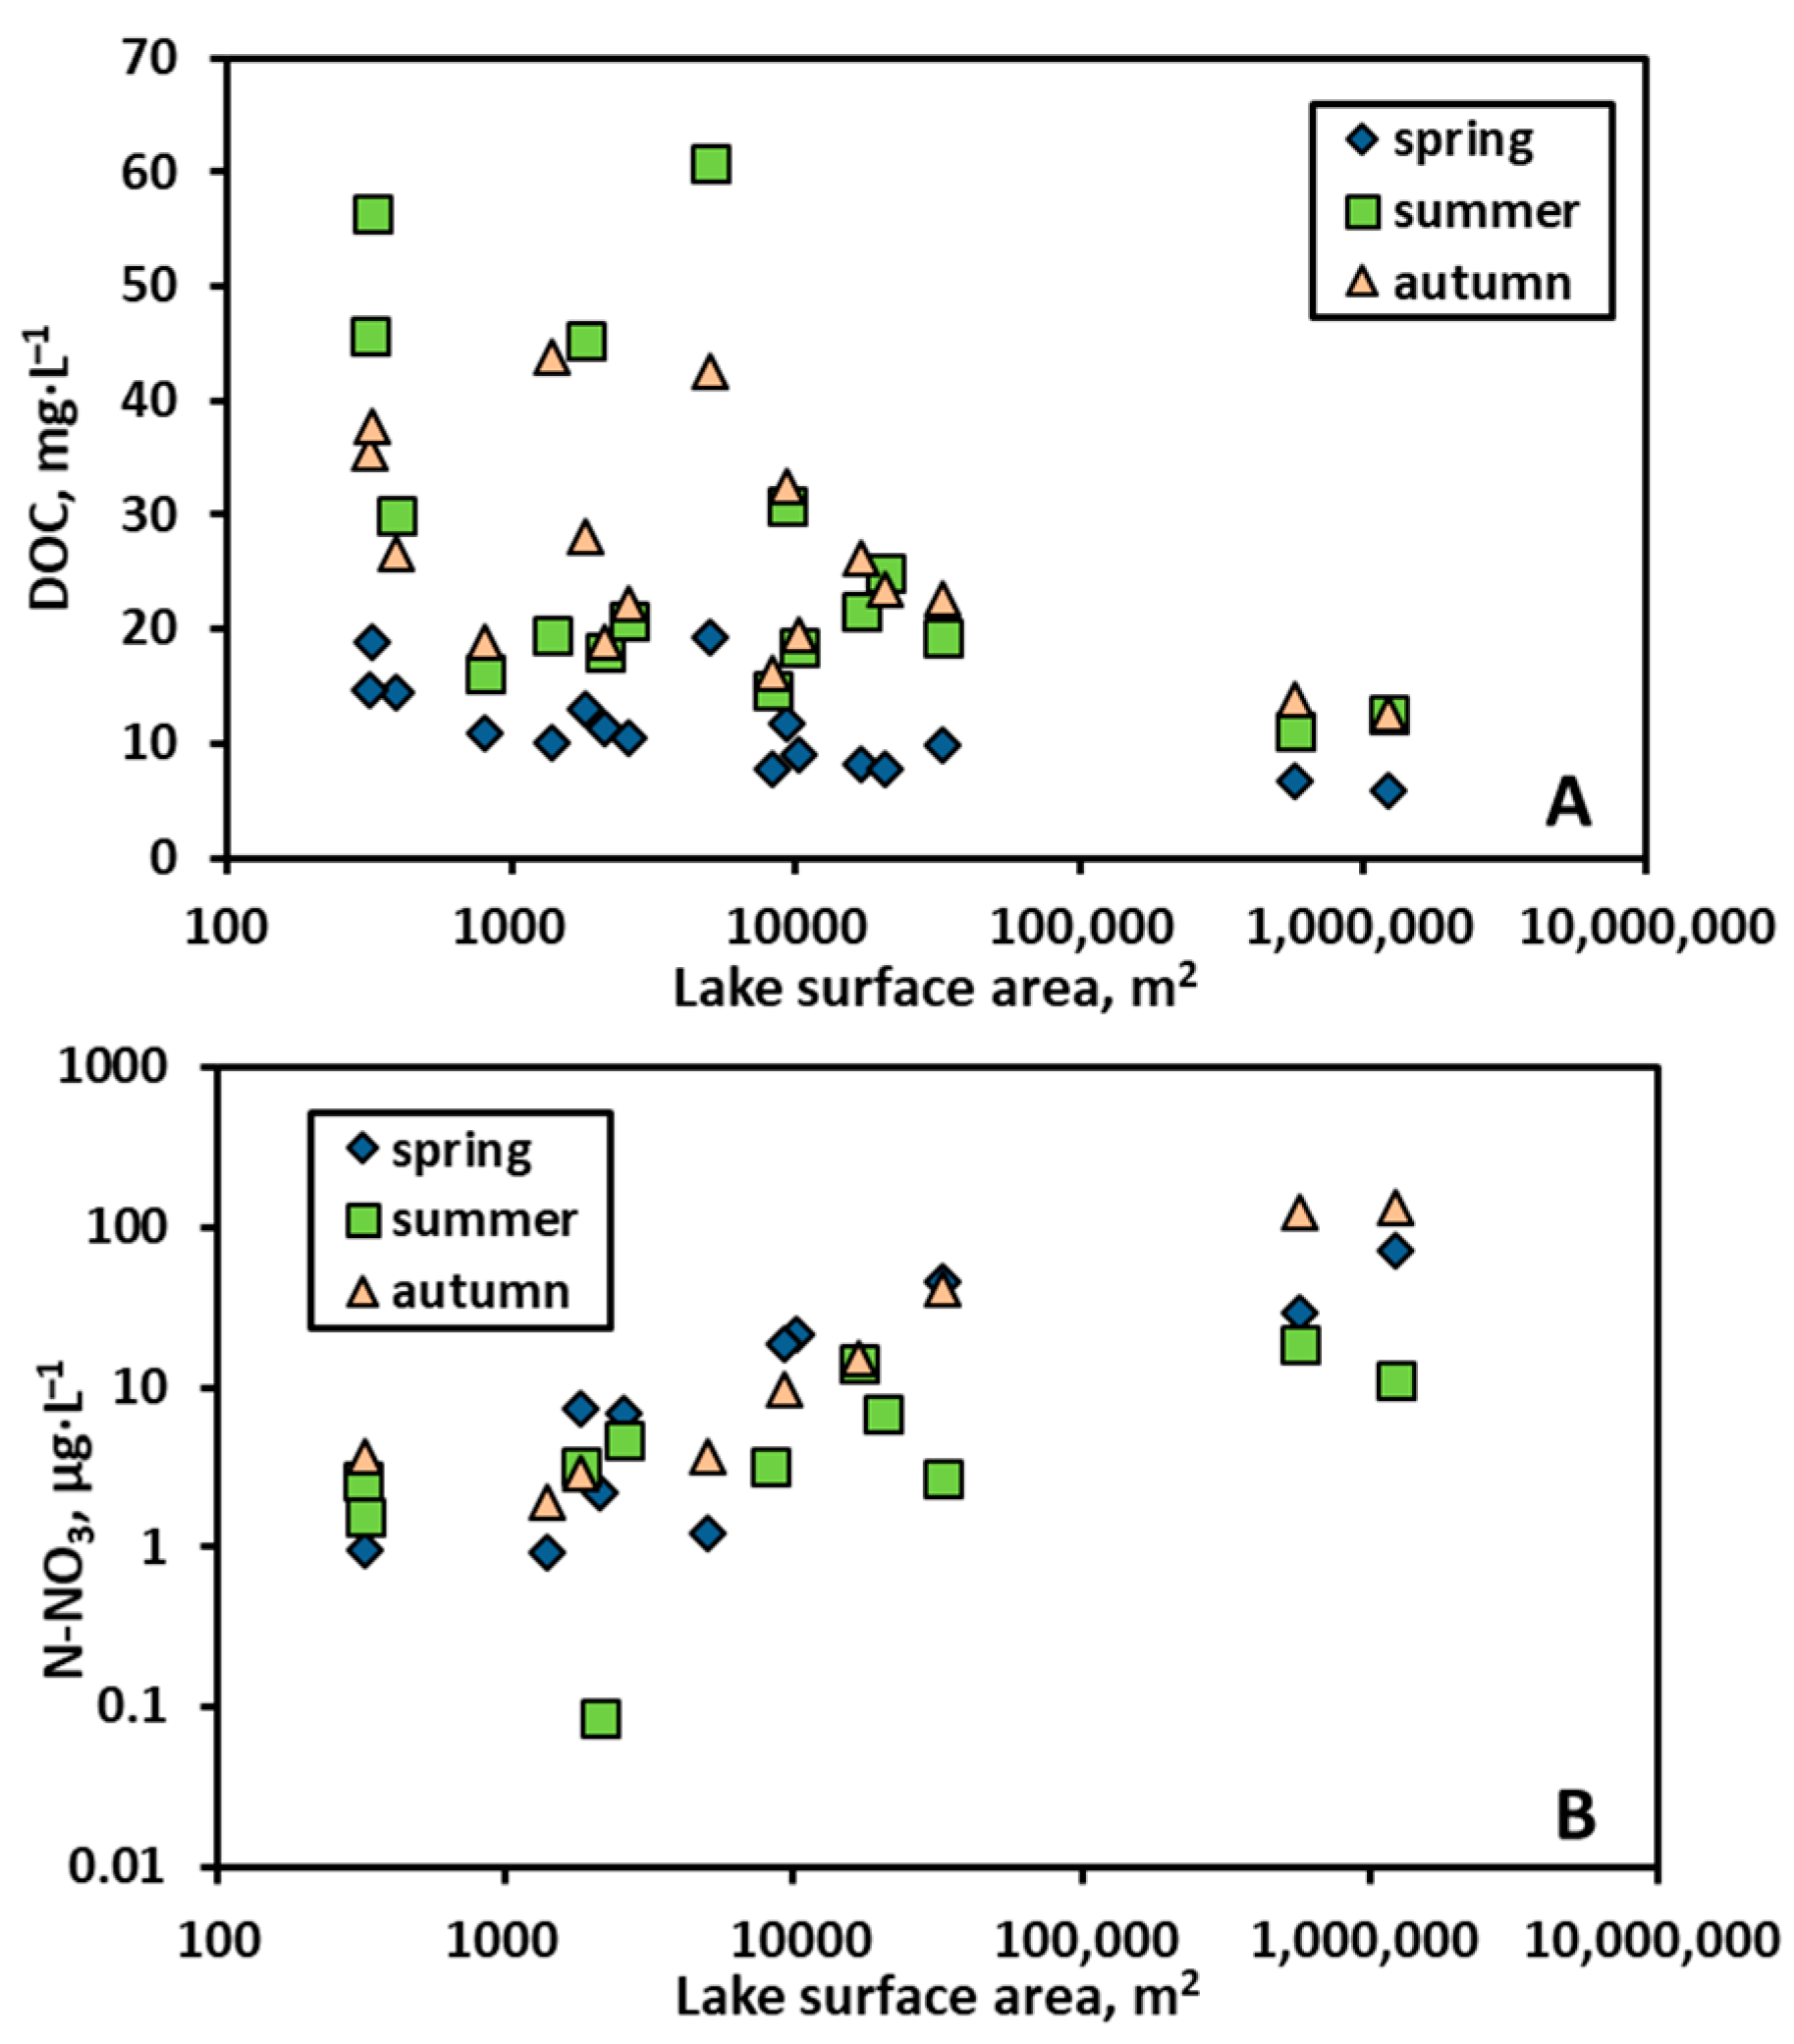
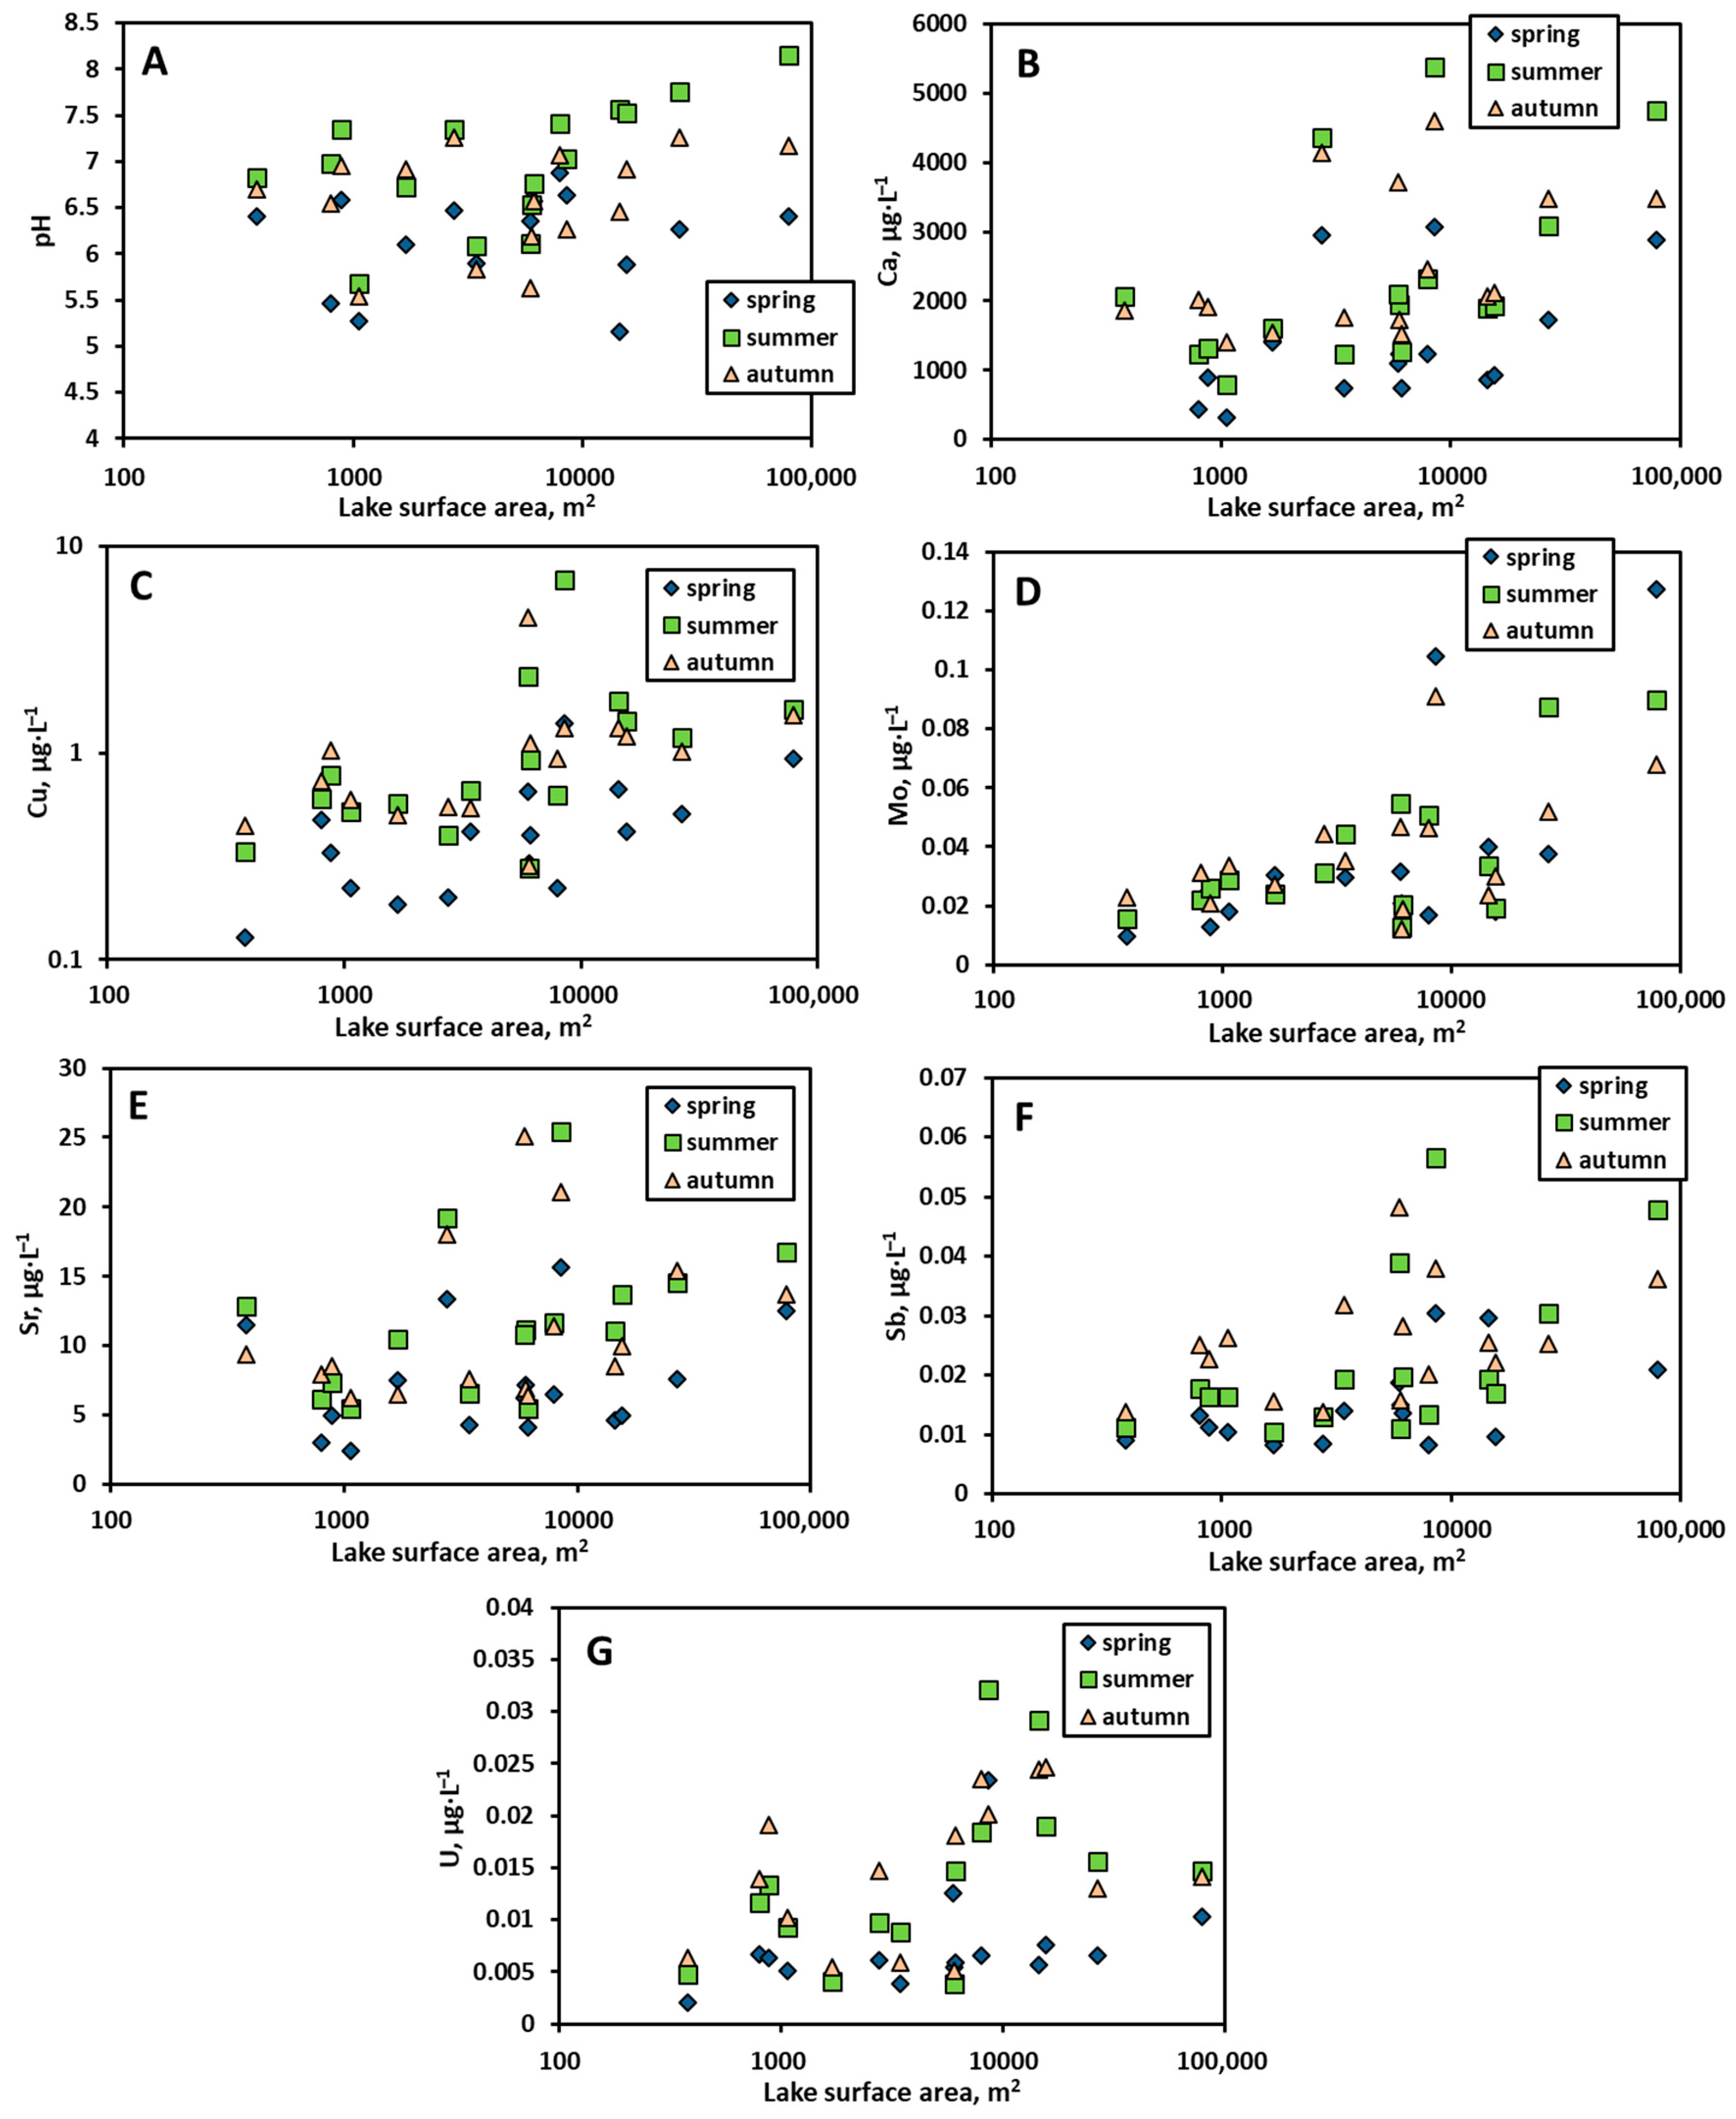
3.1. Dependence of the Concentration of DOC, DIC, Anions, and Trace Elements on the Water Body Size

It is known that the main sources of chemical elements in thermokarst lakes in the north of Western Siberia are coastal abrasion of peat strata of frozen peat bogs (via leaching processes) and lateral soil (suprapermafrost) flow from the lake watershed [18,42,49,50]. As a result, the concentration of dissolved chemical elements, DOC, CO2, and CH4 strongly depends on lake surface area [13,19,40,42], as it is also known in various regions of the northern hemisphere [66,67].
The Spearman’s rank correlation coefficient (p < 0.05) was used to reveal the relationship between the concentration of chemical elements in different seasons and the water surface area for each study area. Correlation analysis data are presented in Table S1A (Supplementary Materials), which lists the elements that exhibit statistically significant values of the correlation coefficient during three hydrological seasons (spring–summer–autumn).

3.1.1. Isolated Permafrost Zone

In the isolated permafrost zone, the DOC concentration decreased (Rs spring = −0.72, Rs summer = −0.79, and Rs autumn = −0.76, p < 0.05) in all three hydrological seasons as the water surface area increased (Figure 2A), which can be due to progressive decrease of allochthonous DOC supply from the surrounding peat [18] upon lake surface area (Sarea) increase due to lake maturation. It is known that, when the lake surface area increases, the impact of peat (coastal abrasion) decreases [19]. This is accompanied by a replacement of allochthonous by autochthonous DOC [68,69]. A statistically significant increase in the SO4 concentration in lake water with the increase in Sarea (Figure 2B) during all three seasons (0.76 ≤ Rs ≤ 0.83, p < 0.05) can be attributed to an increased effect of the groundwater and to diffusion of sulfate from sediment porewater, where it accumulates, due to autochthonous organic matter (OM) [32], to the water column. These effects become more pronounced in the course of lake maturation, leading to elevated SO4 concentrations in the largest lakes.
The Mann–Whitney U-test (p < 0.05) did not show a statistically significant difference between two size classes (<10,000 m² and >10,000 m²) for lakes in the isolated permafrost zone. In the spring, when the Sarea increased due to lateral input of snowmelt water, a statistically significant increase in concentration with Sarea could be observed for Cl, N-NO3, B, K, Co, Rb, and Cs (0.51 ≤ Rs ≤ 0.66). In the summer base flow period, the concentrations of Li (Rs = −0.63), Cr (Rs = −0.5), Zn (Rs = −0.55), and Ga (Rs = −0.47) decreased with Sarea increase and the concentrations of Sb (Rs = 0.49) and Cs (Rs = 0.62) increased. In autumn, at the beginning of freeze up, the SC (Rs = −0.54), Li (Rs = −0.78), B (Rs = −0.49), and Cr (Rs = −0.54) showed a negative correlation with Sarea, whereas a positive correlation was observed for Rb (Rs = 0.53), Cd (Rs = 0.61), and Sb (Rs = 0.62). The other solutes did not demonstrate any sizable effect of lake area on their concentrations.

3.1.2. Sporadic Permafrost Zone

As described previously, the lakes of the sporadic permafrost zone exhibit strong dynamics of changes in the elemental composition of water depending on the lake surface area [19,40,42,60]. However, in this study, we could not track strong dynamics between these indicators during all hydrological seasons, probably due to a small number of studied lakes and the lack of ultra-small water bodies. Only lakes with Sarea > 150–200 m2, which do not dry out in summer, were used to study spatial and seasonal dynamics.
Statistically significant decreases in concentrations with Sarea increase in all three seasons were found only for SC (Rs spring = −0.54, Rs summer = −0.65, and Rs autumn = −0.71, p < 0.05) and DOC (Rs spring = −0.79, Rs summer = −0.51, and Rs autumn = −0.51, p < 0.05) (Figure 3A). The mechanisms responsible for elevated DOC values in small size lakes are peat abrasion and enhanced suprapermafrost water input, with limited processing of allochthonous DOC due to its stability with respect to bio- and photo-degradation (i.e., Reference [70]). Typically, young thermokarst thaw ponds are marked by the presence of organic matter from the degrading permafrost [69]. Another element exhibiting systematic change of concentration over all seasons is nitrite. The N-NO3 concentration increased with Sarea (Rs spring = 0.9, Rs summer = 0.73, and Rs autumn = 0.9, p < 0.05, Figure 3B), which can be indicative of nitrate diffusion from lake sediments, where it is produced due to enhanced input of allochthonous OM from decaying phytoplankton, which is typical for large lakes.
In the spring period of increased water volumes in lakes and breakup of ice, when the lake water surface area increases, an increase in the concentration of Cl, SO4, specific ultraviolet absorbance (SUVA245), N-NH4, K, V, Rb, and Mo was found to be statistically significant (0.50 ≤ Rs ≤ 0.84, p < 0.05). Only Cd exhibited a decrease in concentration with an increase in Sarea (Rs = 0.52, p < 0.05). The autumn was characterized by an increase in SO4, SUVA245, P-PO4, Ptot, Ti, V, Mo, Cs, rare earth elements (REEs), and Th concentration with an increase in Sarea (0.51 ≤ Rs ≤ 0.71, p < 0.05). In the summer low water period, the concentration of nutrients (K, Rb), Y, Zr, Hf, and REEs increased significantly (Rs = from 0.51 to 0.71). The behavior of these lithogenic elements, likely originated from alumosilicate dissolution in mineral soil and subsoil horizons, may mark significant influence of groundwater on the formation of the elemental composition of lake water. This can be highly sensitive to a change in geocryological conditions due climate warming and the shift of permafrost zones to the north (see Section 3.6 below).

3.1.3. Discontinuous Permafrost Zone

In the discontinuous permafrost zone in spring, most chemical elements exhibited statistically significant differences between the two distinguished lake size classes (<10,000 m2 and >10,000 m2). The concentration of both lithogenic (Al, Si, Ti, trivalent and tetravalent hydrolysates) and some labile elements (Li, Na, Mg, Ca, Sr, As, Mo, U) increased with an increase in Sarea, which can be explained by active lateral input during snowmelt and ice abrasion of the peat shoreline. Therefore, for these elements, the ratio of the lake circumference to lake volume is not a driver of their concentrations, similar to the case for sporadic/discontinuous permafrost zone [40,42]. Presumably, the main factor controlling the increase in concentration of these elements is snowmelt and leaching of trace elements (TE) from the vegetation of frozen peat bogs followed by their lateral transfer to lakes.
At the same time, the pH and concentration of Li, Mn, and Co significantly increased with Sarea during all three seasons (p < 0.05, Figure 4). Here, both mobilization from groundwater (Li) or lake sediments, due to redox reactions (Mn, Co; see Reference [32]) in large lakes, may be the governing factor of element increase during the baseflow period.

3.1.4. Continuous Permafrost Zone

The lakes in the continuous permafrost zone neither show a statistically significant difference between the size classes nor a distinct dependence of the concentration of chemical elements on the water surface area. Presumably, the presence of thawed mineral horizon [71] interferes with peat as the main source of chemical elements entering the thermokarst lake water, and this distinguishes the continuous permafrost zone from southern regions. In summer, a number of labile, presumably seawater-originated elements exhibited an increase in concentrations with increased Sarea: pH, Ca, Sr, Cu, Sb, Mo, U (Figure 5). The mineral horizons here are formerly marine clays represented by diatomites with illite and montmorillonite with some chlorite and allophanes (see Reference [51] for soil profile and references therein). These clays may contain a sizable amount of labile elements originated from seawater via adsorption during diagenesis (Ca, Sr, Mo, Sb, U). The high affinity of these elements to clay minerals such as smectite, chlorite and montmorillonite is fairly well known [72,73]. Therefore, we hypothesize that large thermokarst lakes of continuous permafrost zone are capable of eroding the peat underlying mineral horizons, and, after some threshold Sarea (around 50,000 km², see Figure 5), the exposed mineral layers on the lake bottom start to release a sizable amount of labile elements to the water column.
Considering all permafrost zones together, it was found that there was an increase in pH, DIC, alkali and alkaline-earth metals (Li, Mg, K, Ca, and Sr), divalent heavy metals (Co, Ni and Cu), trivalent and tetravalent hydrolysates (Y, Zr, REEs, and Th), Mo, As, and U with lake surface area. The increase in labile soluble elements (alkali and alkaline-earth metals, Mo, As, and U) in the southern, sporadic to discontinuous permafrost zone can be interpreted as due to the input of deep underground waters which contact with carbonate rocks and penetrate into large lakes via taliks or subsurface flow. In the continuous permafrost zone, this increase may be due to a desorption of soluble elements from marine clay mineral surfaces (illite, montmorillonite) exposed at the bottom of large lakes. The increase in concentration of insoluble trivalent and tetravalent hydrolysates with Sarea is pronounced mostly during baseflow period and likely stems from silicate-bearing rocks such as clays, whose dissolution in deeper soil horizons provide tri- and tetravalent hydrolysates (TE3+ and TE4+) to the lake water. These elements are then stabilized in solution via organic and organo-ferric colloids. In contrast, concentrations of DOC and Pb decreased with Sarea (Table S1B, Supplementary Materials), which reflects their dominant origin from peat, abrading at the lake shores. Subsequent delivery of these elements to the lake water column occurs via suprapermafrost flow over frozen organic horizons. These factors are mostly pronounced in small thaw ponds, having a high ratio of lake circumference (and lake watershed area) to the water volume.

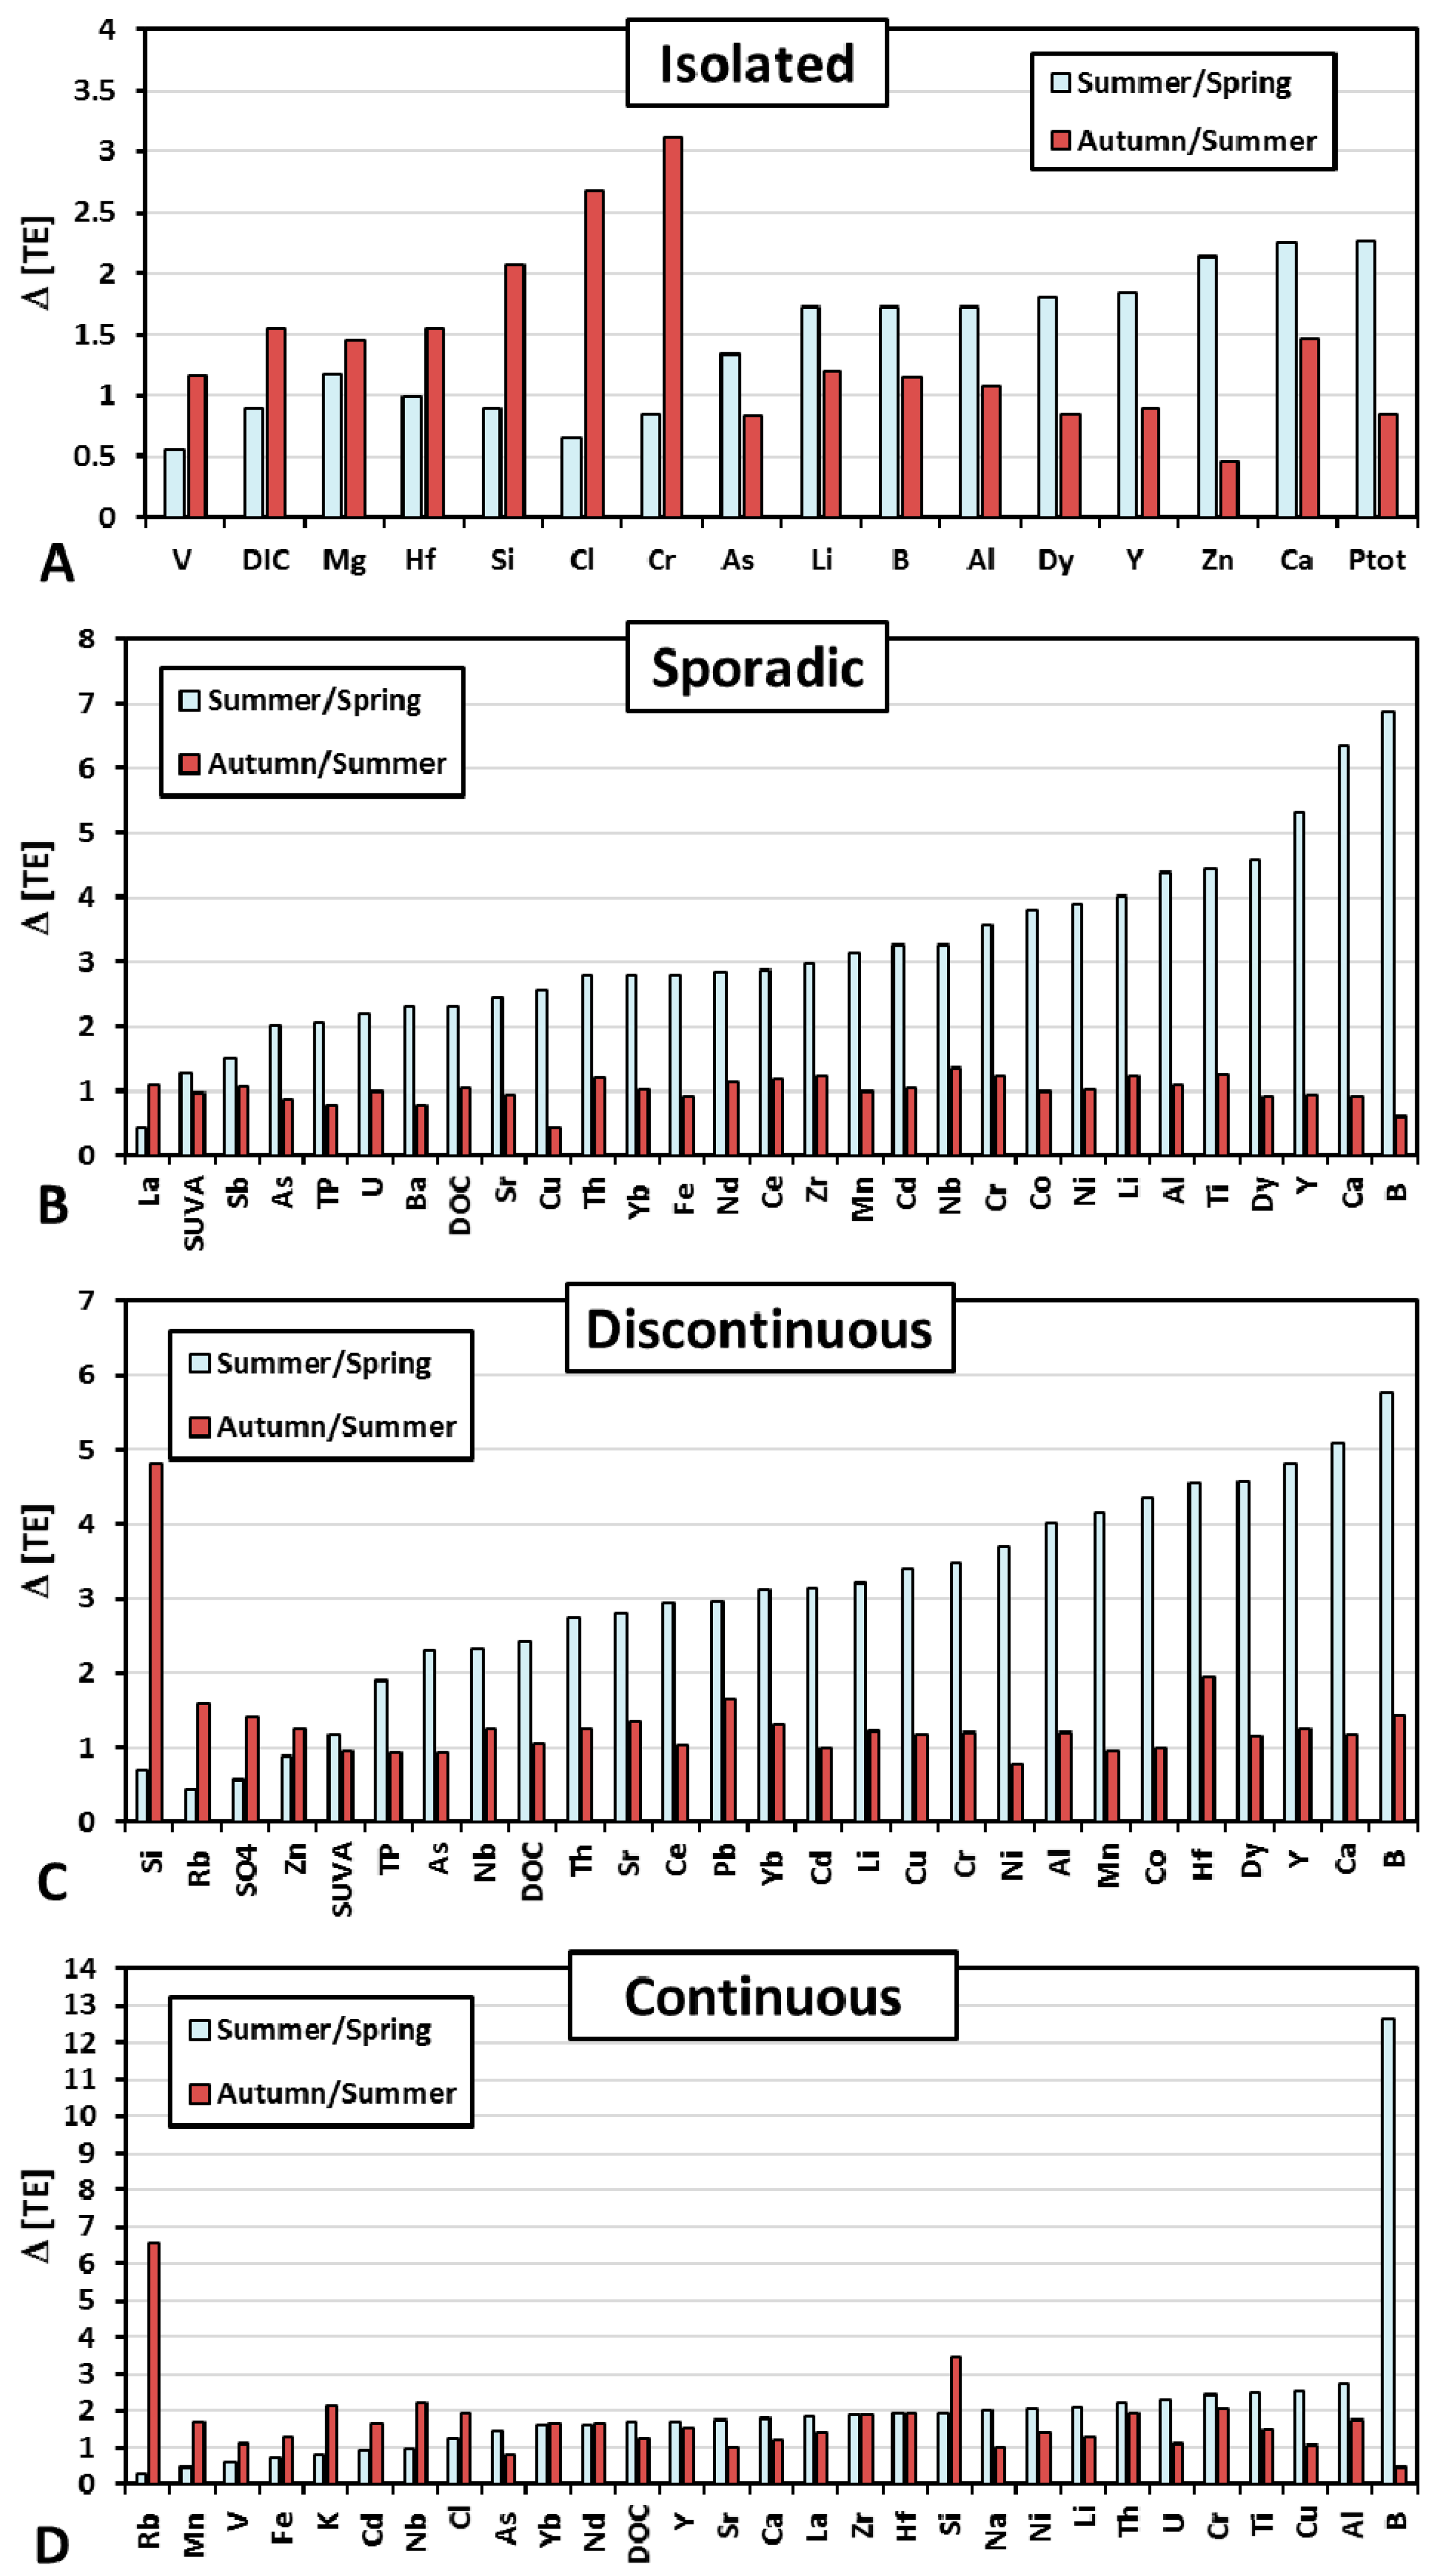
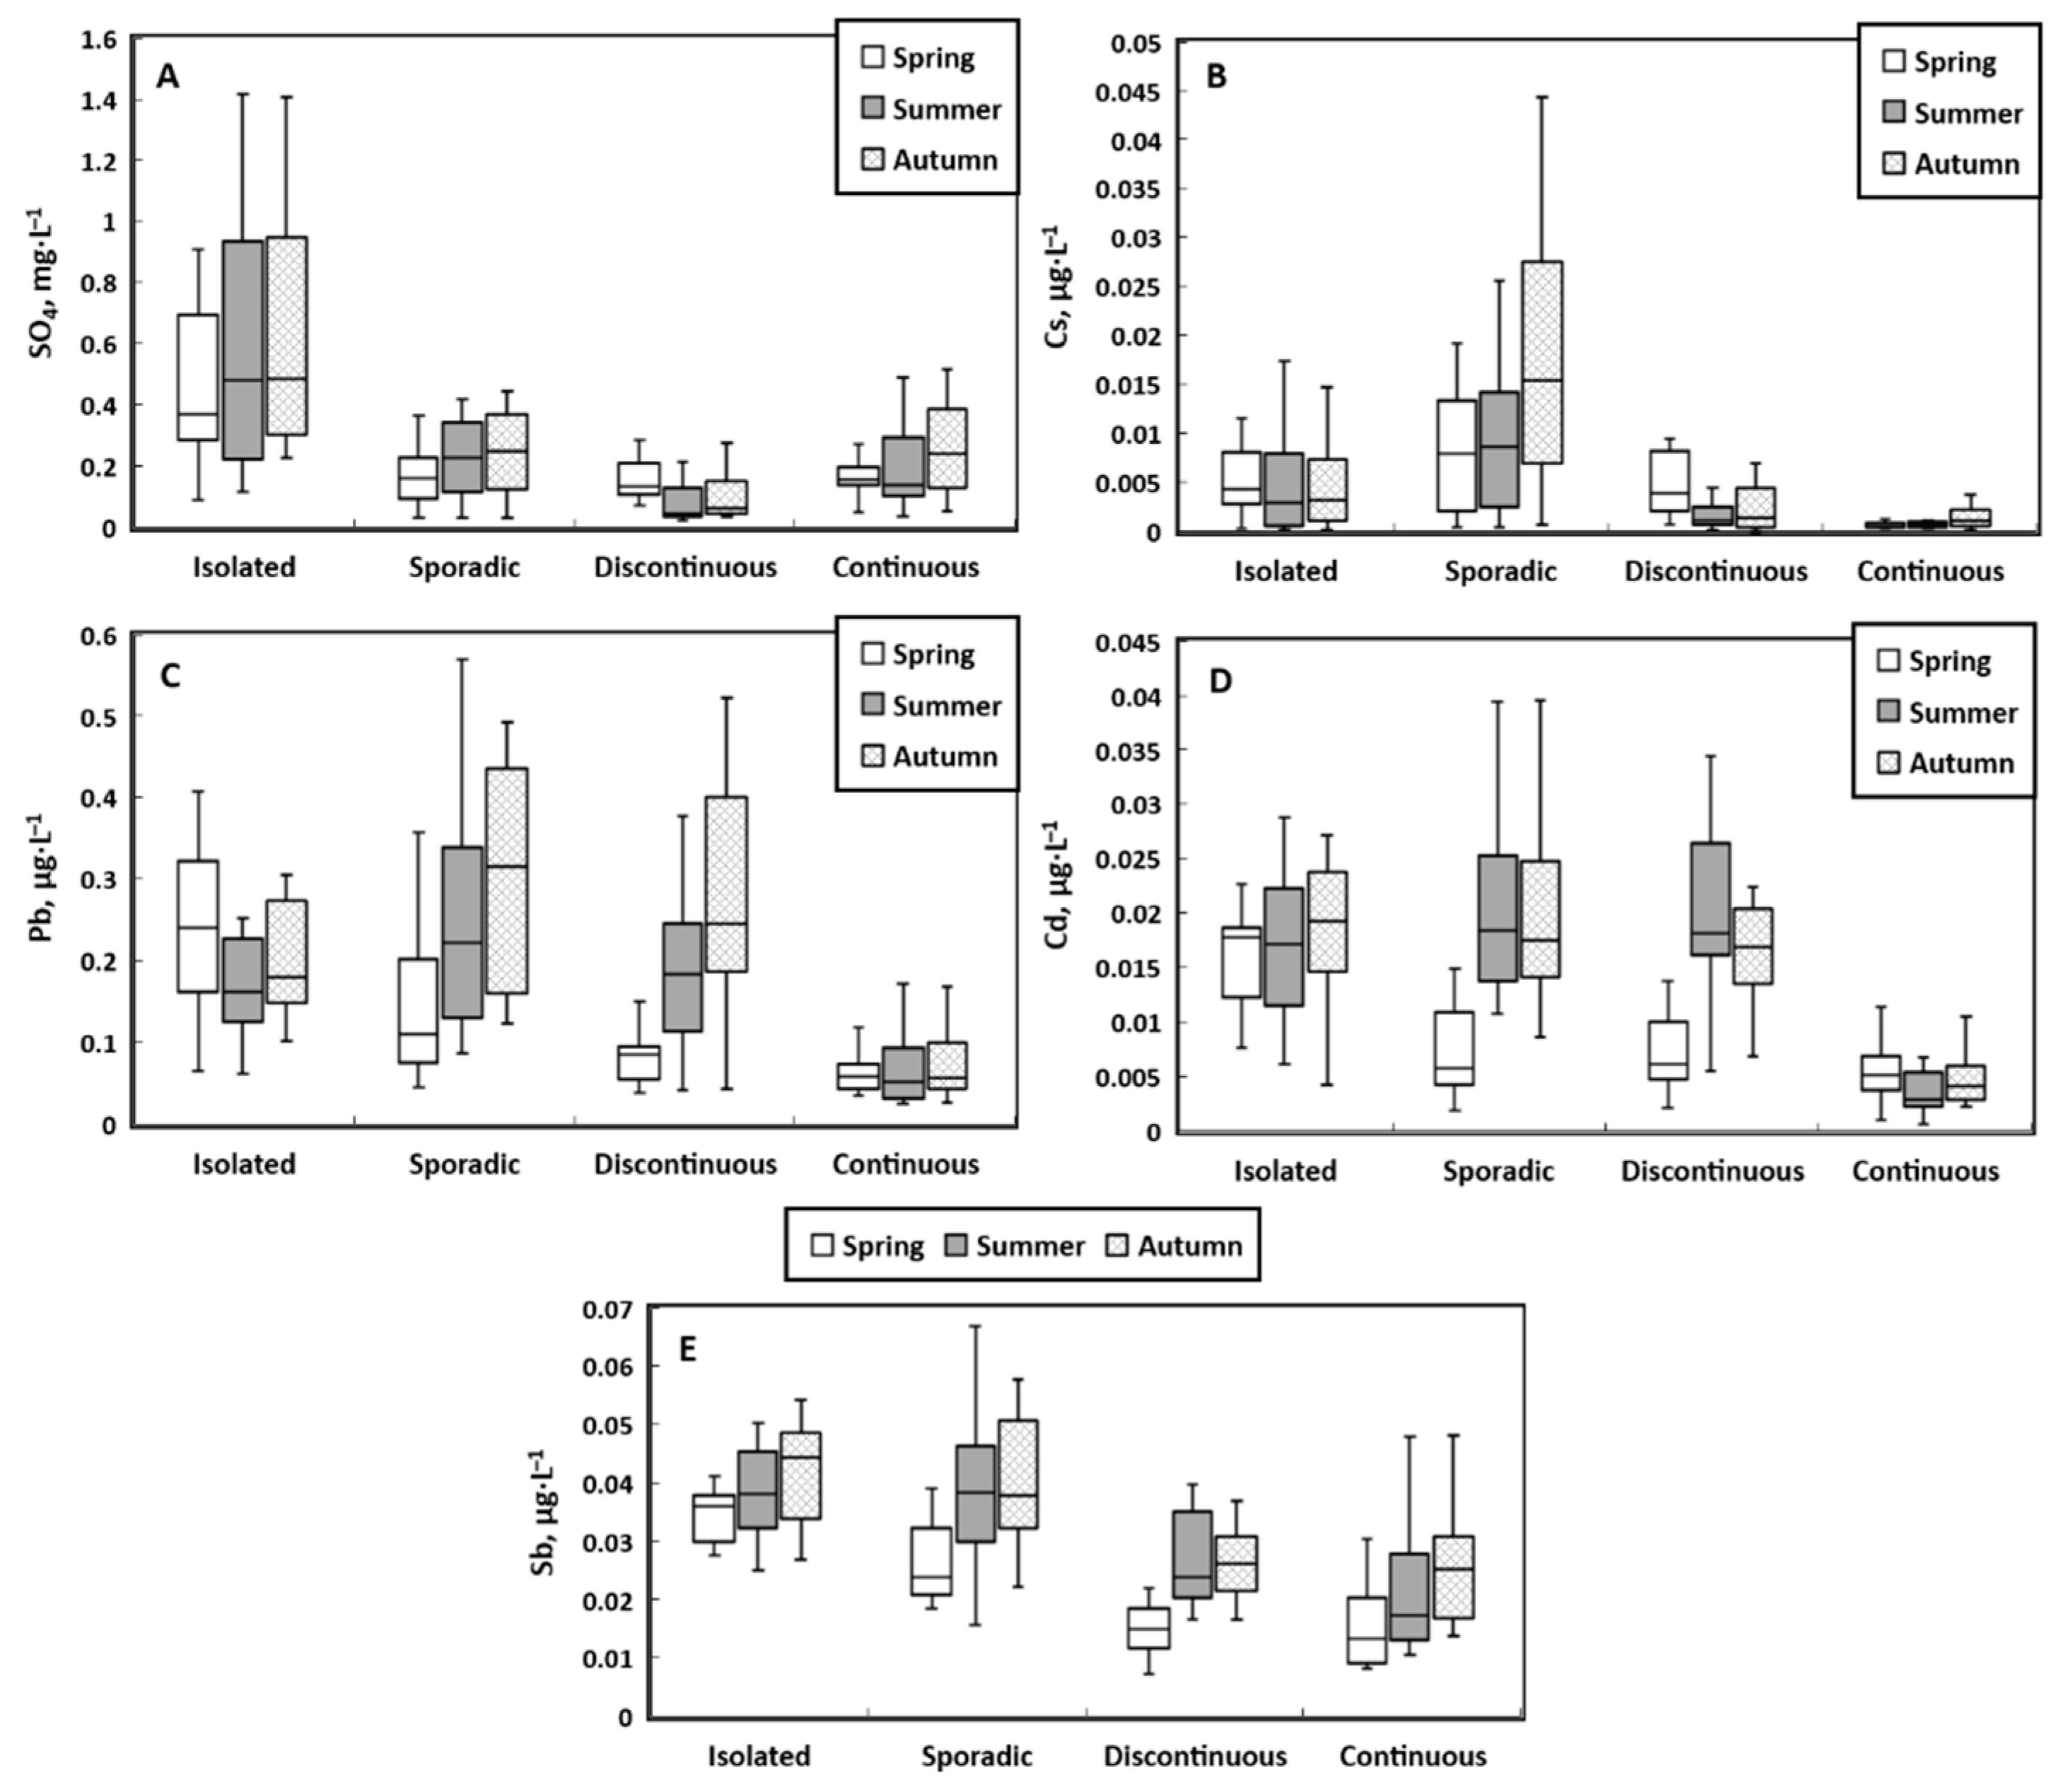
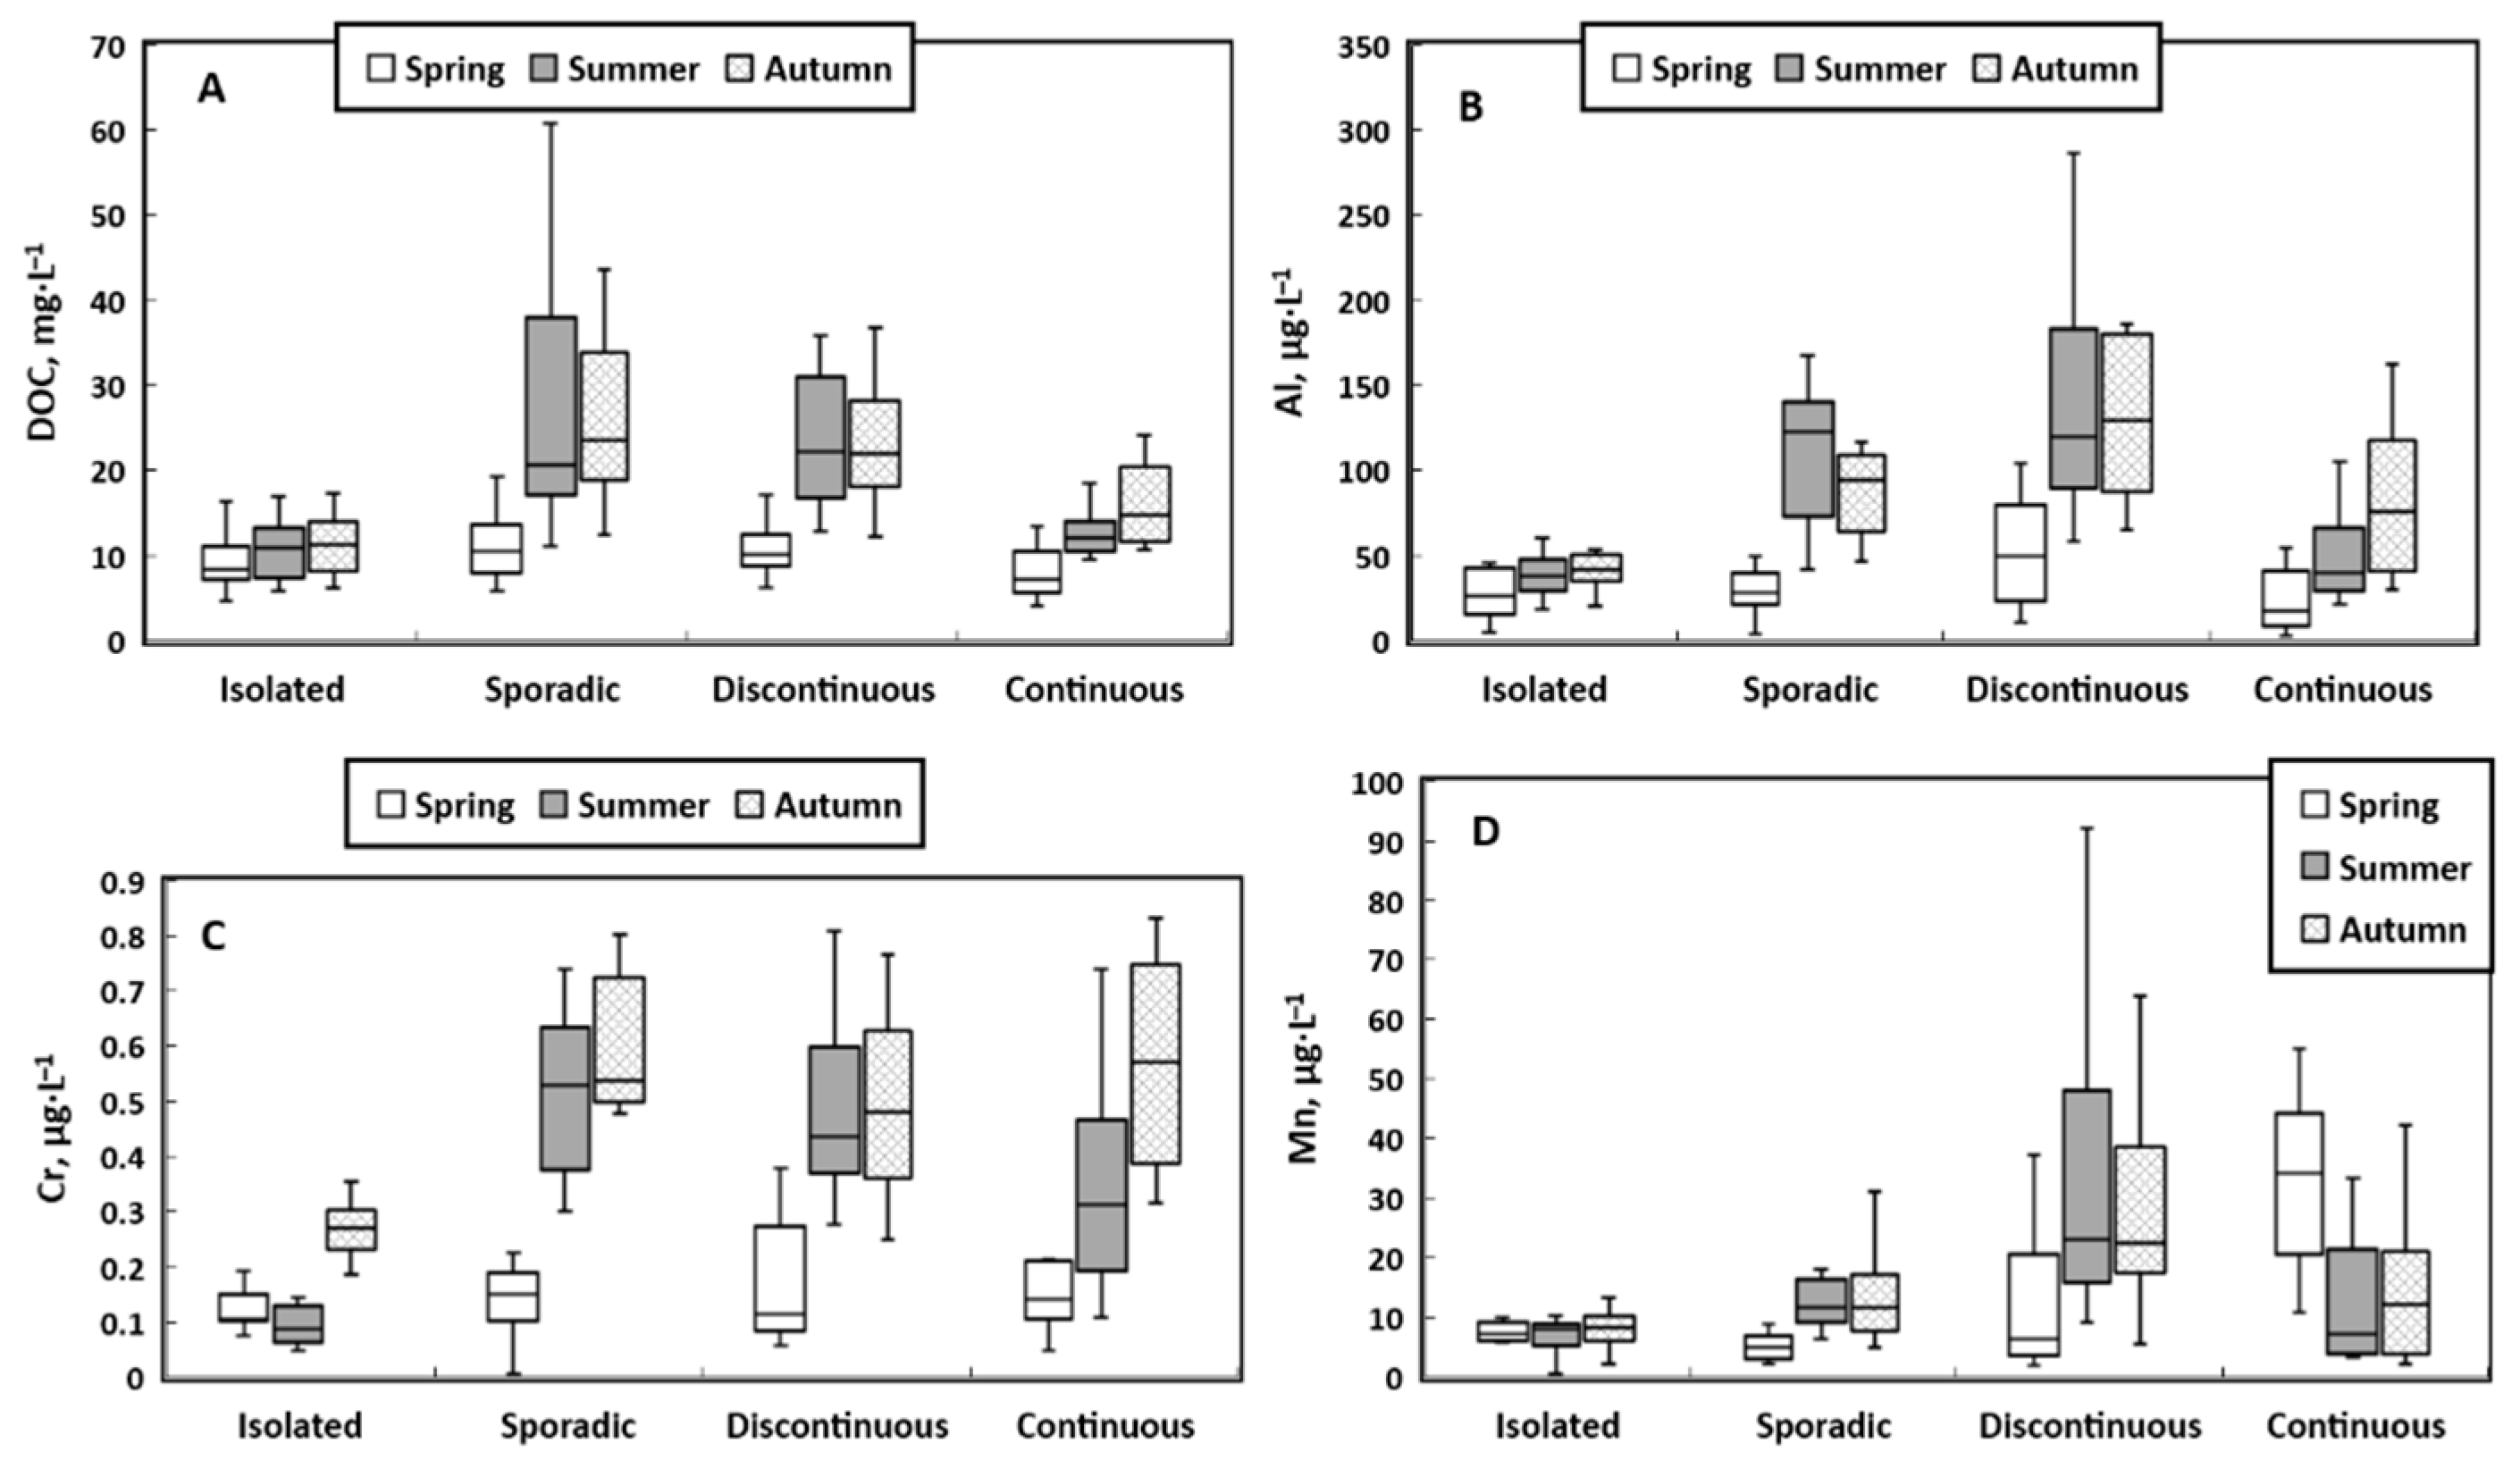
3.2. Impact of Hydrological Season on the Concentration of DOC, DIC, Anions, and Trace Elements in Thermokarst Lake Water

Mean and median concentrations of lake water components measured in the WSL territory for each season are listed in Table A1 (Appendix A). Statistical analysis of the difference in concentrations of chemical elements among different hydrological season was performed for each of the four permafrost zones. For comparison, we used the non-parametric Mann–Whitney test (U-test) for unrelated samples. The correlation was based on a statistically significant difference between the seasons (p < 0.05). Table S2 (Supplementary Materials) shows the relationships where at least one value (compared pair) was statistically significant. During the analysis, the size classes of lakes were not divided due to the absence of very small and very large water bodies in the sample set. Following a previously developed approach, we considered a more than two-fold change in the concentration between the dataset to be significant [40].
There was a progressive increase in the concentration of Mg, Li, B, Al, and Ca from spring to autumn (an increase of 1.5–2-fold or more) in lakes located in the isolated permafrost zone (Figure 6A). Compared to spring season, significantly higher (50–120%) concentrations were observed in summer and slightly higher (10–40%) concentrations were observed in the autumn. The concentrations of DIC, Cl, Si, Cr, V, and Hf were the highest in the spring and autumn periods of heavy rains, and they decreased sharply in the summer during low water period. A particularly noticeable increase in their concentration could be observed in the autumn. The concentration of DOC, SO4, Fe, Mn, Pb, Na, Cd, Cu, Rb, K, Ti, Mo, Ba, Ni, Zr, Cs, Sr, Co, Sb, Nb, Th, U, and most REEs did not show a statistically significant (p < 0.05) difference between seasons.
Thermokarst lakes located in the sporadic permafrost zone showed a 0.5–3-fold increase (p < 0.05) in the concentration of SUVA245, DOC, Ptot, Fe, Sb, As, U, Ba, Zr, Sr, Cu, and Th and a 3–5-fold increase in the concentration of Mn, Al, Cd, Co, Ni, Ti, Cr, Li, Nb, and REEs in the summer relative to the spring (Figure 6B). The most pronounced increase was observed for Ca (6.3) and B (6.8). No statistically significant difference in concentrations between summer and autumn was observed.
Seasonal variations in the elemental composition of lake waters in the discontinuous permafrost zone are similar to those in the sporadic zone (Figure 6C). A sharp increase in the concentration of most of the studied elements was observed from spring to summer. Furthermore, a progressive increase in the concentration from spring to autumn (2–5-fold increase) was characteristic of DOC, Al, Ca, B, Cu, Li, Cr, Pb, Nb, Sr, Hf, Th, and some REEs (Y, Ce, Pr, Sm, Eu, Gd, Tb, Dy, Ho, Er, Yb, and Lu). The SUVA and concentration of Ptot, Mn, Cd, As, Ni, and Co increased sharply in summer and slightly decreased in autumn. Significant accumulation of Si (five-fold), Zn, Rb, and SO4 (1.5–2-fold) in thermokarst lake waters occurred in spring and autumn. This may indicate the inflow of these elements from plant litter which is flooded during snowmelt and heavy rains. Accumulation of SO4, especially in spring (a two-fold decrease in summer concentration), may indicate diffusive transport of sulfates from bottom sediments. The concentration of DIC, Cl, Fe, Na, K, Mg, Sb, Ti, Cs, Zr, V, U, Ba, and Mo remained stable over all three hydrological seasons.
A statistical analysis of the elemental composition of lakes located in the continuous permafrost zone, where most of chemical elements originate from thawed mineral horizon, showed a 1.5–3-fold gradual increase in the concentration of DOC, Cl, Al, Cu, Ti, Cr, Th, U, Li, Ni, Na, Si, Sr, Hf, Zr, Y, and REEs from spring to summer and autumn (Figure 6D). Lower concentrations of Fe, Mn, Cd, V, K, Rb, and Nb in summer relative to spring, when the water level in thermokarst lakes in this zone is minimal, may indicate a preferential lateral inflow of these elements into lake waters with surface runoff, which is mostly pronounced in the spring. This surface inflow is replaced by a subsurface (supra-permafrost) flow in the summer. The decomposition of aquatic vegetation and precipitation can represent additional sources of Zn and B, which show a eight- and 12-fold increase in summer and a four- and two-fold decrease in the autumn relative to the spring, respectively. The elevated concentrations of K, Rb, and Si during autumn compared to summer may indicate (i) ceasing of these nutrient uptake by macrophytes, planktonic, and periphytic diatoms, and (ii) degradation and release of autochthonous freshly produced organic matter. These effects (at least for Si) are also visible in the discontinuous and isolated permafrost zones.

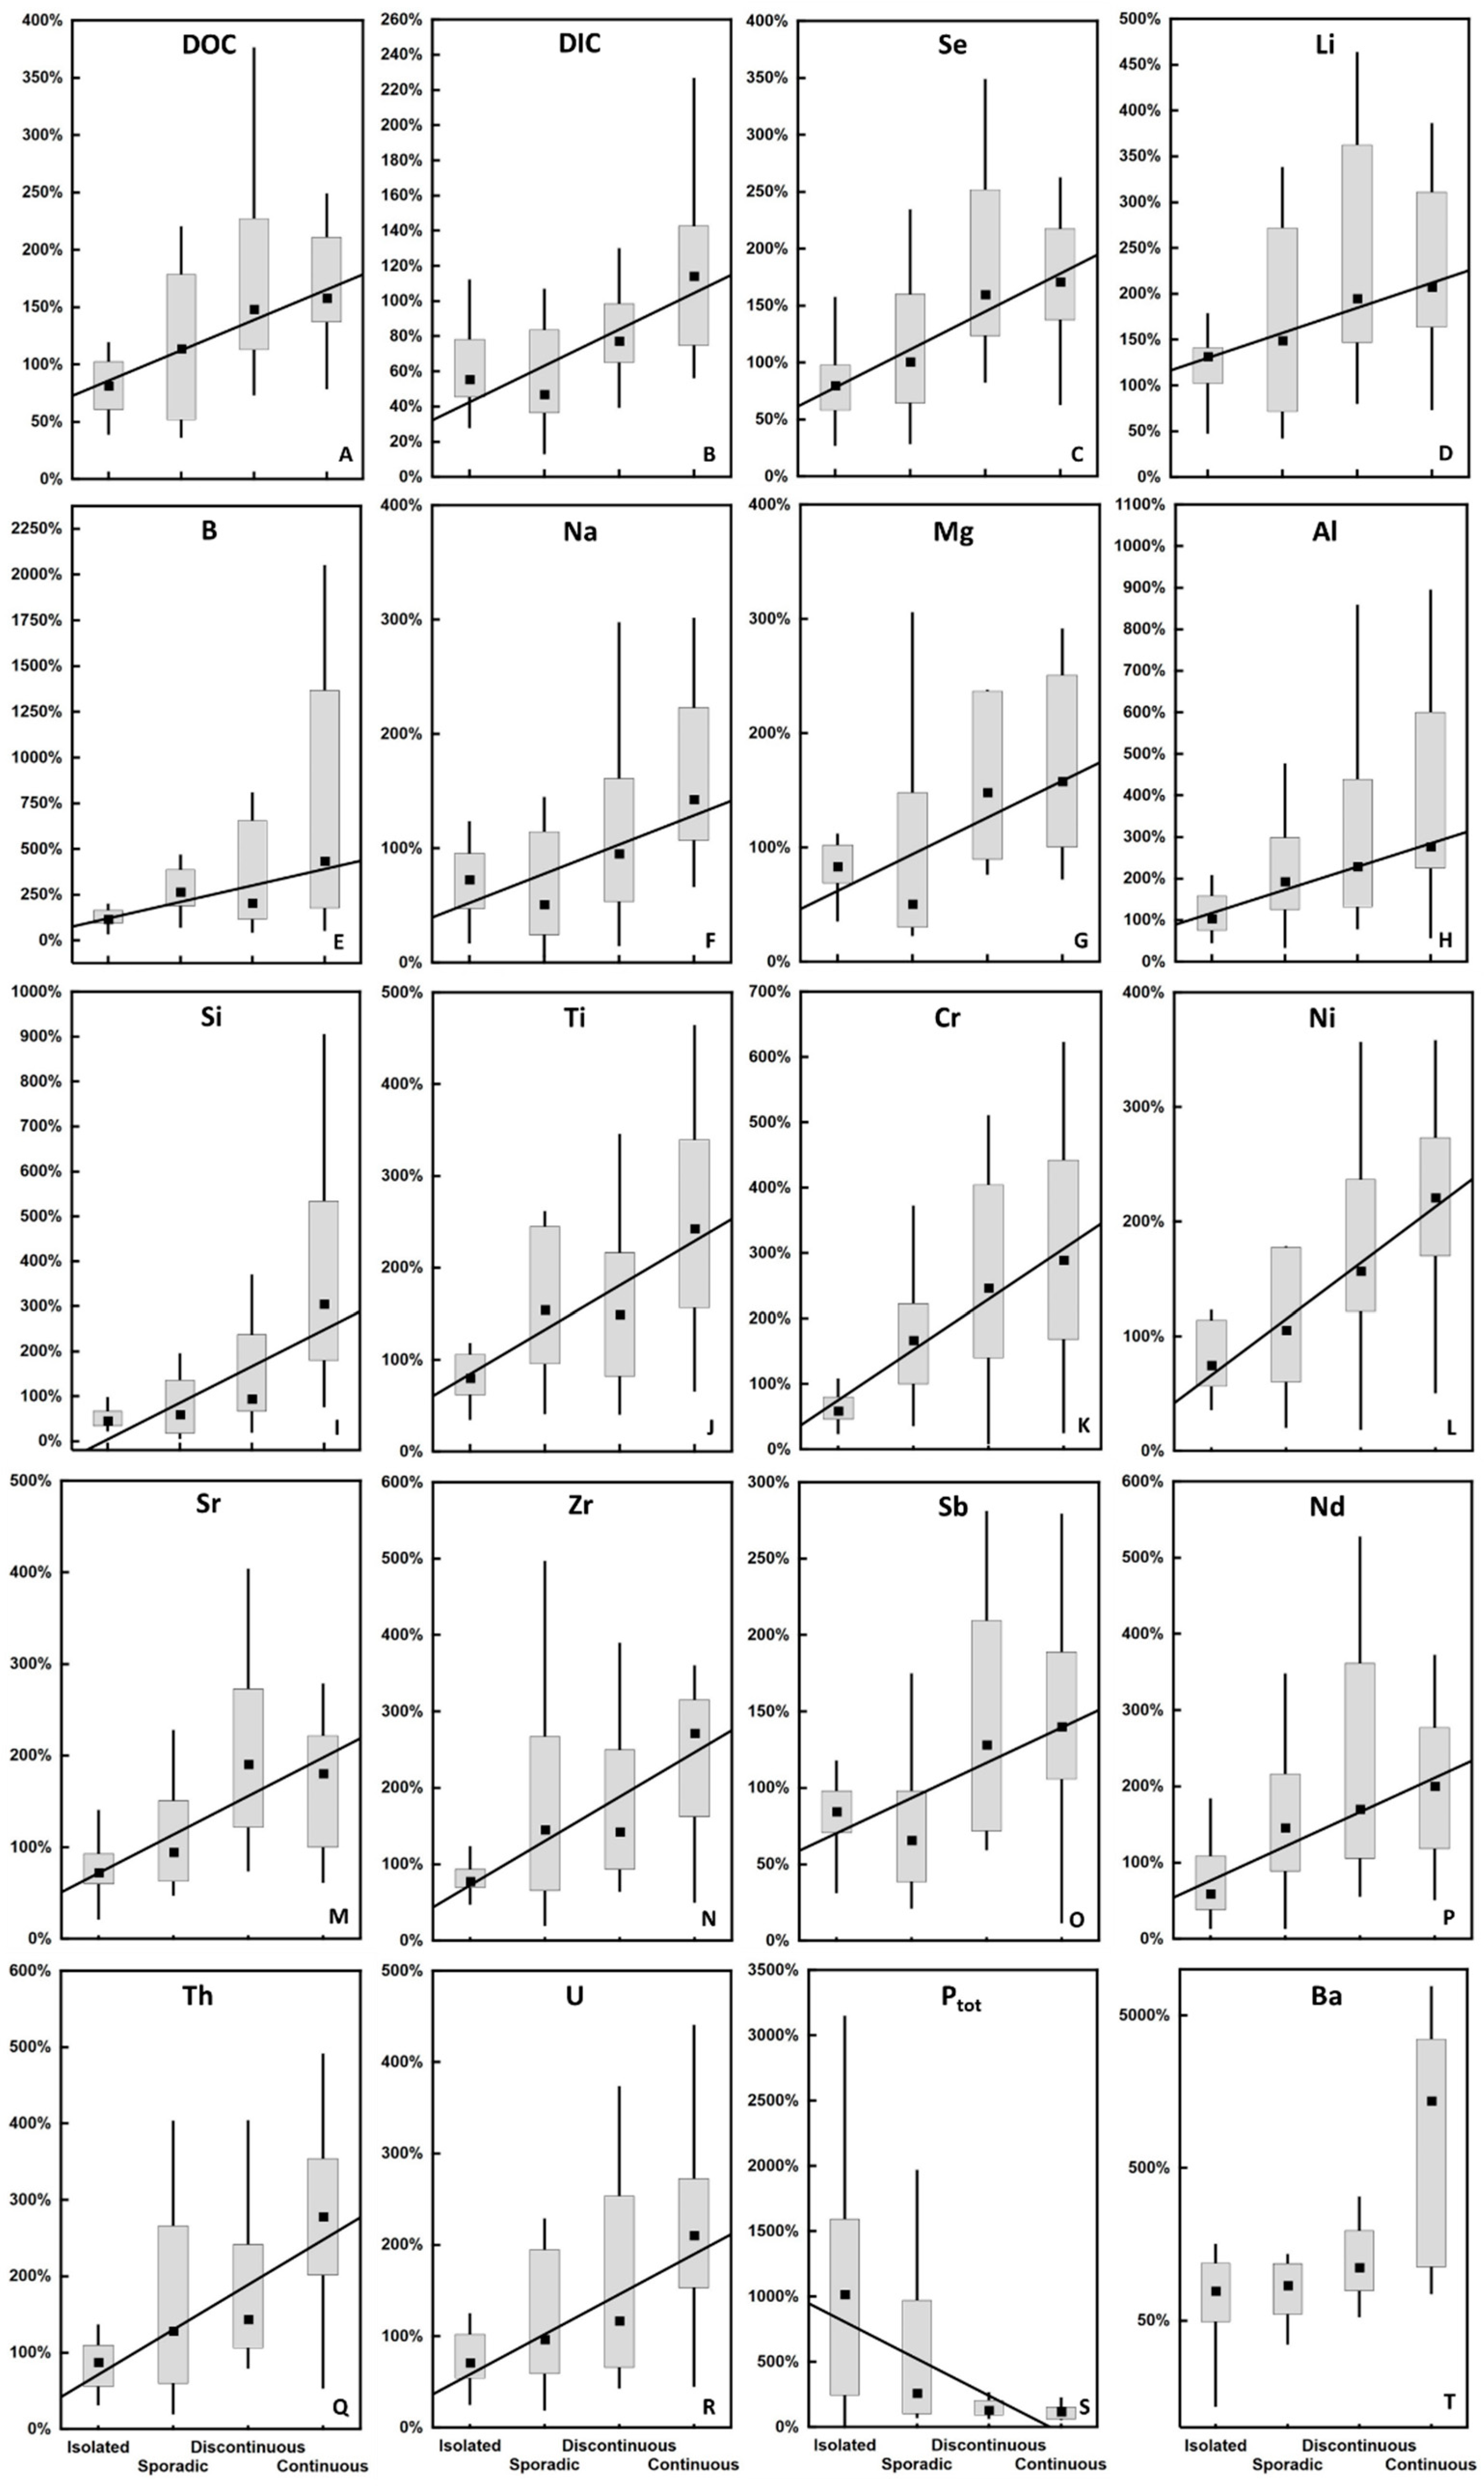
3.3. Effect of the Permafrost Gradient on the Concentration of Elements in Thermokarst Lakes

Prior to testing the concentration dependence of chemical elements on the geographical latitude, we conducted the Mann–Whitney U-test to identify variations in concentration in the four areas over different seasons (spring, summer, and autumn) (Table S3, Supplementary Materials). The revealed variation shows that the concentrations of most elements change significantly across the areas in all three seasons. Sporadic and discontinuous permafrost zones show the greatest similarity in elemental composition, which can be due to similar conditions for lateral element delivery to the lakes via water leaching of the peat deposits and surrounding vegetation under condition of discontinuous/sporadic permafrost, drastically different from those in most southern (isolated) and most northern (continuous) permafrost zones.
The impact of permafrost gradients on thermokarst lake hydrochemistry was determined via analysis of correlation between element concentration in the lake water and geographical latitude. Spearman’s nonparametric correlation coefficient (Rs, p < 0.05) was used to analyze the data with abnormal distribution (Table S4, Supplementary Materials). Note that, for this treatment, we considered only trends of element concentration with latitude that were significant (p < 0.05) over all three hydrological seasons. Based on latitudinal dynamics of lake water chemical composition, the following group of elements were distinguished:
(1) The value of pH and concentrations of CO2, DIC, Mg, Ca, Mo, Sr, U, Ptot, Li, Na, Ti, V, Fe, Co, Ni, Cu, Y, Zr, REEs, Hf, and Th increased northward (Figure 7). Specifically, the pH and concentration of CO2, DIC, Mg, Ca, Mo, Sr, and U changed insignificantly from south to north (from the isolated to discontinuous permafrost zone) and increased sharply (2–3-fold) in the continuous permafrost zone. A possible factor affecting this pattern is shallower peat deposits in the north [3], such that the thawed layer reaches the mineral horizon (marine clays containing illite, chlorite, and montmorillonite) in the tundra zone. This promotes accumulation of low-mobile lithogenic elements and rapidly increases the concentration of dissolved inorganic carbon in lake waters of the continuous permafrost zone. Note that this behavior is somewhat different from that observed for rivers of this territory [16,51]. The elevated pH in the north may explain the enrichment in labile elements; unlike rivers, thermokarst lakes are essentially disconnected from groundwaters and, thus, former marine clays in Tazovsky are most likely the cause of elevated pH and concentrations of DIC, Mg, Ca, Sr, Mo, U, and partially K.
(2) Elements decreased their concentrations northward in all three seasons (p < 0.05): SO4, Cd, Pb, Sb, and Cs (Figure 8). The decrease in SO4 may be due to isolation of sulfate-bearing groundwater reservoirs from surface waters occurring in the continuous permafrost zone. Trace elements Cd, Pb, Sb, and Cs are known to enrich the peat and peat porewaters [49,50], and their decreased concentration in the north may reflect a decreased release of these elements to adjacent surface waters due to decreased peak thickness in the continuous permafrost zone [3]. Furthermore, a decreased input of these elements to the lake water in the north may be due to a decrease in the impact of atmospheric aerosol deposition [20].
(3) The elements which did not show statistically significant changes with latitude in all three seasons (p < 0.05) were SC, Cl, DOC, P-PO4, N-NO3, N-NH4, B, Al, Si, K, Cr, Mn, Zn, As, and Rb. However, some elements such as DOC, Al, Cr, and Mn demonstrated a clear maximum in the sporadic or discontinuous permafrost zone (Figure 9). Presumably, this permafrost belt with its highest ALT during summer and autumn baseflow and at the same time sizable amount of frozen peat provided the most optimal redox conditions for Mn (and Cr) mobilization from the lake sediments to the water column and DOC and Al leaching via peat abrasion and transport in the form of colloids [60].
It is noteworthy that, considering all lakes and all seasons simultaneously, there was no impact of latitude (or permafrost coverage) on major nutrients (P-PO4, N-NO3, N-NH4) (Table S4, Supplementary Materials). The only exceptions were a weak increase in PO4 concentration (Rs = 0.31) and a decrease of NH4 with latitude (Rs = −0.38), detectable in spring. In summer, there was also an increase in PO4 concentration with latitude, as illustrated in Figure S2 (Supplementary Materials). Other nutrients such as Si demonstrated an increase in concentration northward, which was, however, visible only in autumn (Figure 10A), presumably due to progressive involvement of soil mineral horizons, capable of supplying Si due to the shallow peat layer in the north. Alternatively, the autochthon uptake of Si by aquatic plants and diatoms could be much less pronounced in the north due to lower biomass and productivity. This phenomenon was described in WSL rivers [51]. A sharp increase in Si concentration in the discontinuous permafrost zone in spring may indicate active inflow during snowmelt due to Si leaching from forest–tundra litter. In the continuous permafrost zone, K concentration increased by a factor of 2–3 relative to southern regions (Figure 10B), which can be attributed to its atmospheric transport as part of the marine aerosols and inflow with spring and autumn rains. Finally, a micronutrient (Zn) could be strongly affected by a release from tundra vegetation, which intercepts atmospheric deposits and contributes to this element transport from the watershed to the lake. This may produce a sharp increase in Zn concentration in the continuous permafrost zone (Figure 10C).

3.4. Element Pools in Thermokarst Lakes of Western Siberia: Seasonal Variations and Dependence on the Geographic Latitude

Because the depth of lakes varies across permafrost zones and seasons, we estimated the seasonal dynamics of element pools in each permafrost zone based on evolution of concentration and depth, thus quantifying the role of lakes in accumulation of solutes in the water column. Note that, recently, we calculated the summer stock of carbon and chemical elements for the lakes located in the entire permafrost-affected WSL territory [6]. However, the seasonal dynamics of elementary pools is not yet studied. Here, we calculated changes in the pool of DOC, DIC, and trace elements in the studied lakes as a ratio of two most contrasting periods, summer and spring (Rsummer/spring). The changes in elemental pools across the seasons are provided in Table S5 (Supplementary Materials).
The degree of excess of summer over spring pool of DOC, DIC, and many trace elements (Li, B, Na, Mg, Al, Si, Ti, Cr, Ni, Sr, Ba, Se, Zr, Sb, REEs, Th, and U) in lakes increased northward. The overall increase ranged from 200% to 400% (Figure 11). Note the quite low Rsummer/spring of most elements in the isolated permafrost zone; this indicates that the main source of these elements can be lateral transfer to the lakes as a result of decomposition of plant litter during active snowmelt and rather minor inflow in summer. In this permafrost zone, the most significant decrease (20% to 80%) in Rsummer/spring value occurred for DOC, DIC, Se, Na, Mg, Al, Ti, V, Cr, Mn, Fe, Co, Ni, Cu, Rb, Sr, Zr, Cd, Sb, Ba, light REEs, Pb, Th, and U.
Summer pools of K and Rb were lower than in spring in all four permafrost zones (Figure S3A,B, Supplementary Materials), whereas Mo exhibited high seasonal stability of its pool in the four permafrost zones (Figure S3C, Supplementary Materials). Summer pools of Ca, Co, Cd, Mn, Fe, and Pb were 150–300% higher than in spring in the sporadic and discontinuous permafrost zones (Figure S3D–I, respectively, Supplementary Materials), while the pools of these elements in the isolated and continuous zones were comparable and even lower in summer relative to spring. In the continuous permafrost zone, summer pools of Zn and Ba exhibited a three- and 14-fold increase, respectively, relative to spring (Figure S3J,K, Supplementary Materials). The pool of total dissolved P (Ptot) was sizably higher in summer relative to spring (a factor of 2–10 for various permafrost zones), but the Rsummer/spring strongly decreased northward (Figure 11). Thus, the summertime inflow of P from watershed to lakes decreased northward, suggesting that the main source of P is thawed rather than frozen peat and mineral horizons, as also confirmed by experimental modeling of peat core interaction with aqueous solutions [74].
Overall, the evolution of Rsummer/spring for DOC, DIC, Li, B, Na, Mg, Al, Si, P (Ptot), Ti, Cr, Ni, Cu, As, Se, Sr, Zr, Sb, Ba, REEs, Th, and U reflects the impact of ALT, climate, and biota on the combination of processes responsible for element delivery from the watershed to the lakes. The increase in Rsummer/spring northward for DIC, Li, B, Na, Si, Mg, Sr, Ba, Sb, and U may reflect progressive thawing of rather shallow depth of peat with involvement of underlying mineral horizons. Marine clays composed of illite, chlorite, and montmorillonite are, thus, capable of supplying these elements in summer, when the ALT exceeds the peat layer. The increase in summertime DOC storage northward may be due to enhanced delivery of DOC from thawing peat yet weak biodegradability of dissolved organic matter (DOM) in the north. The excess of DOM stabilizes low-soluble elements such as Al, Ti, Cr, Ni, Se, Zr, REEs, Th, and U in the form of organic and organo-mineral colloids; thus, the Rsummer/spring increases northward. Finally, more pronounced biotic input of K, Rb, and Zn in the north during summer may be linked to intensive cycling of these elements by lake macrophytes. The other elements exhibited stable pools over season and latitude, or they demonstrated a local maximum in Rsummer/spring in the sporadic to discontinuous permafrost zone, thus reflecting a combination of biotic uptake/release processes, deep groundwater and shallow suprapermafrost water feeding, lake sediment, and underlying rock/peat interactions with the water column.

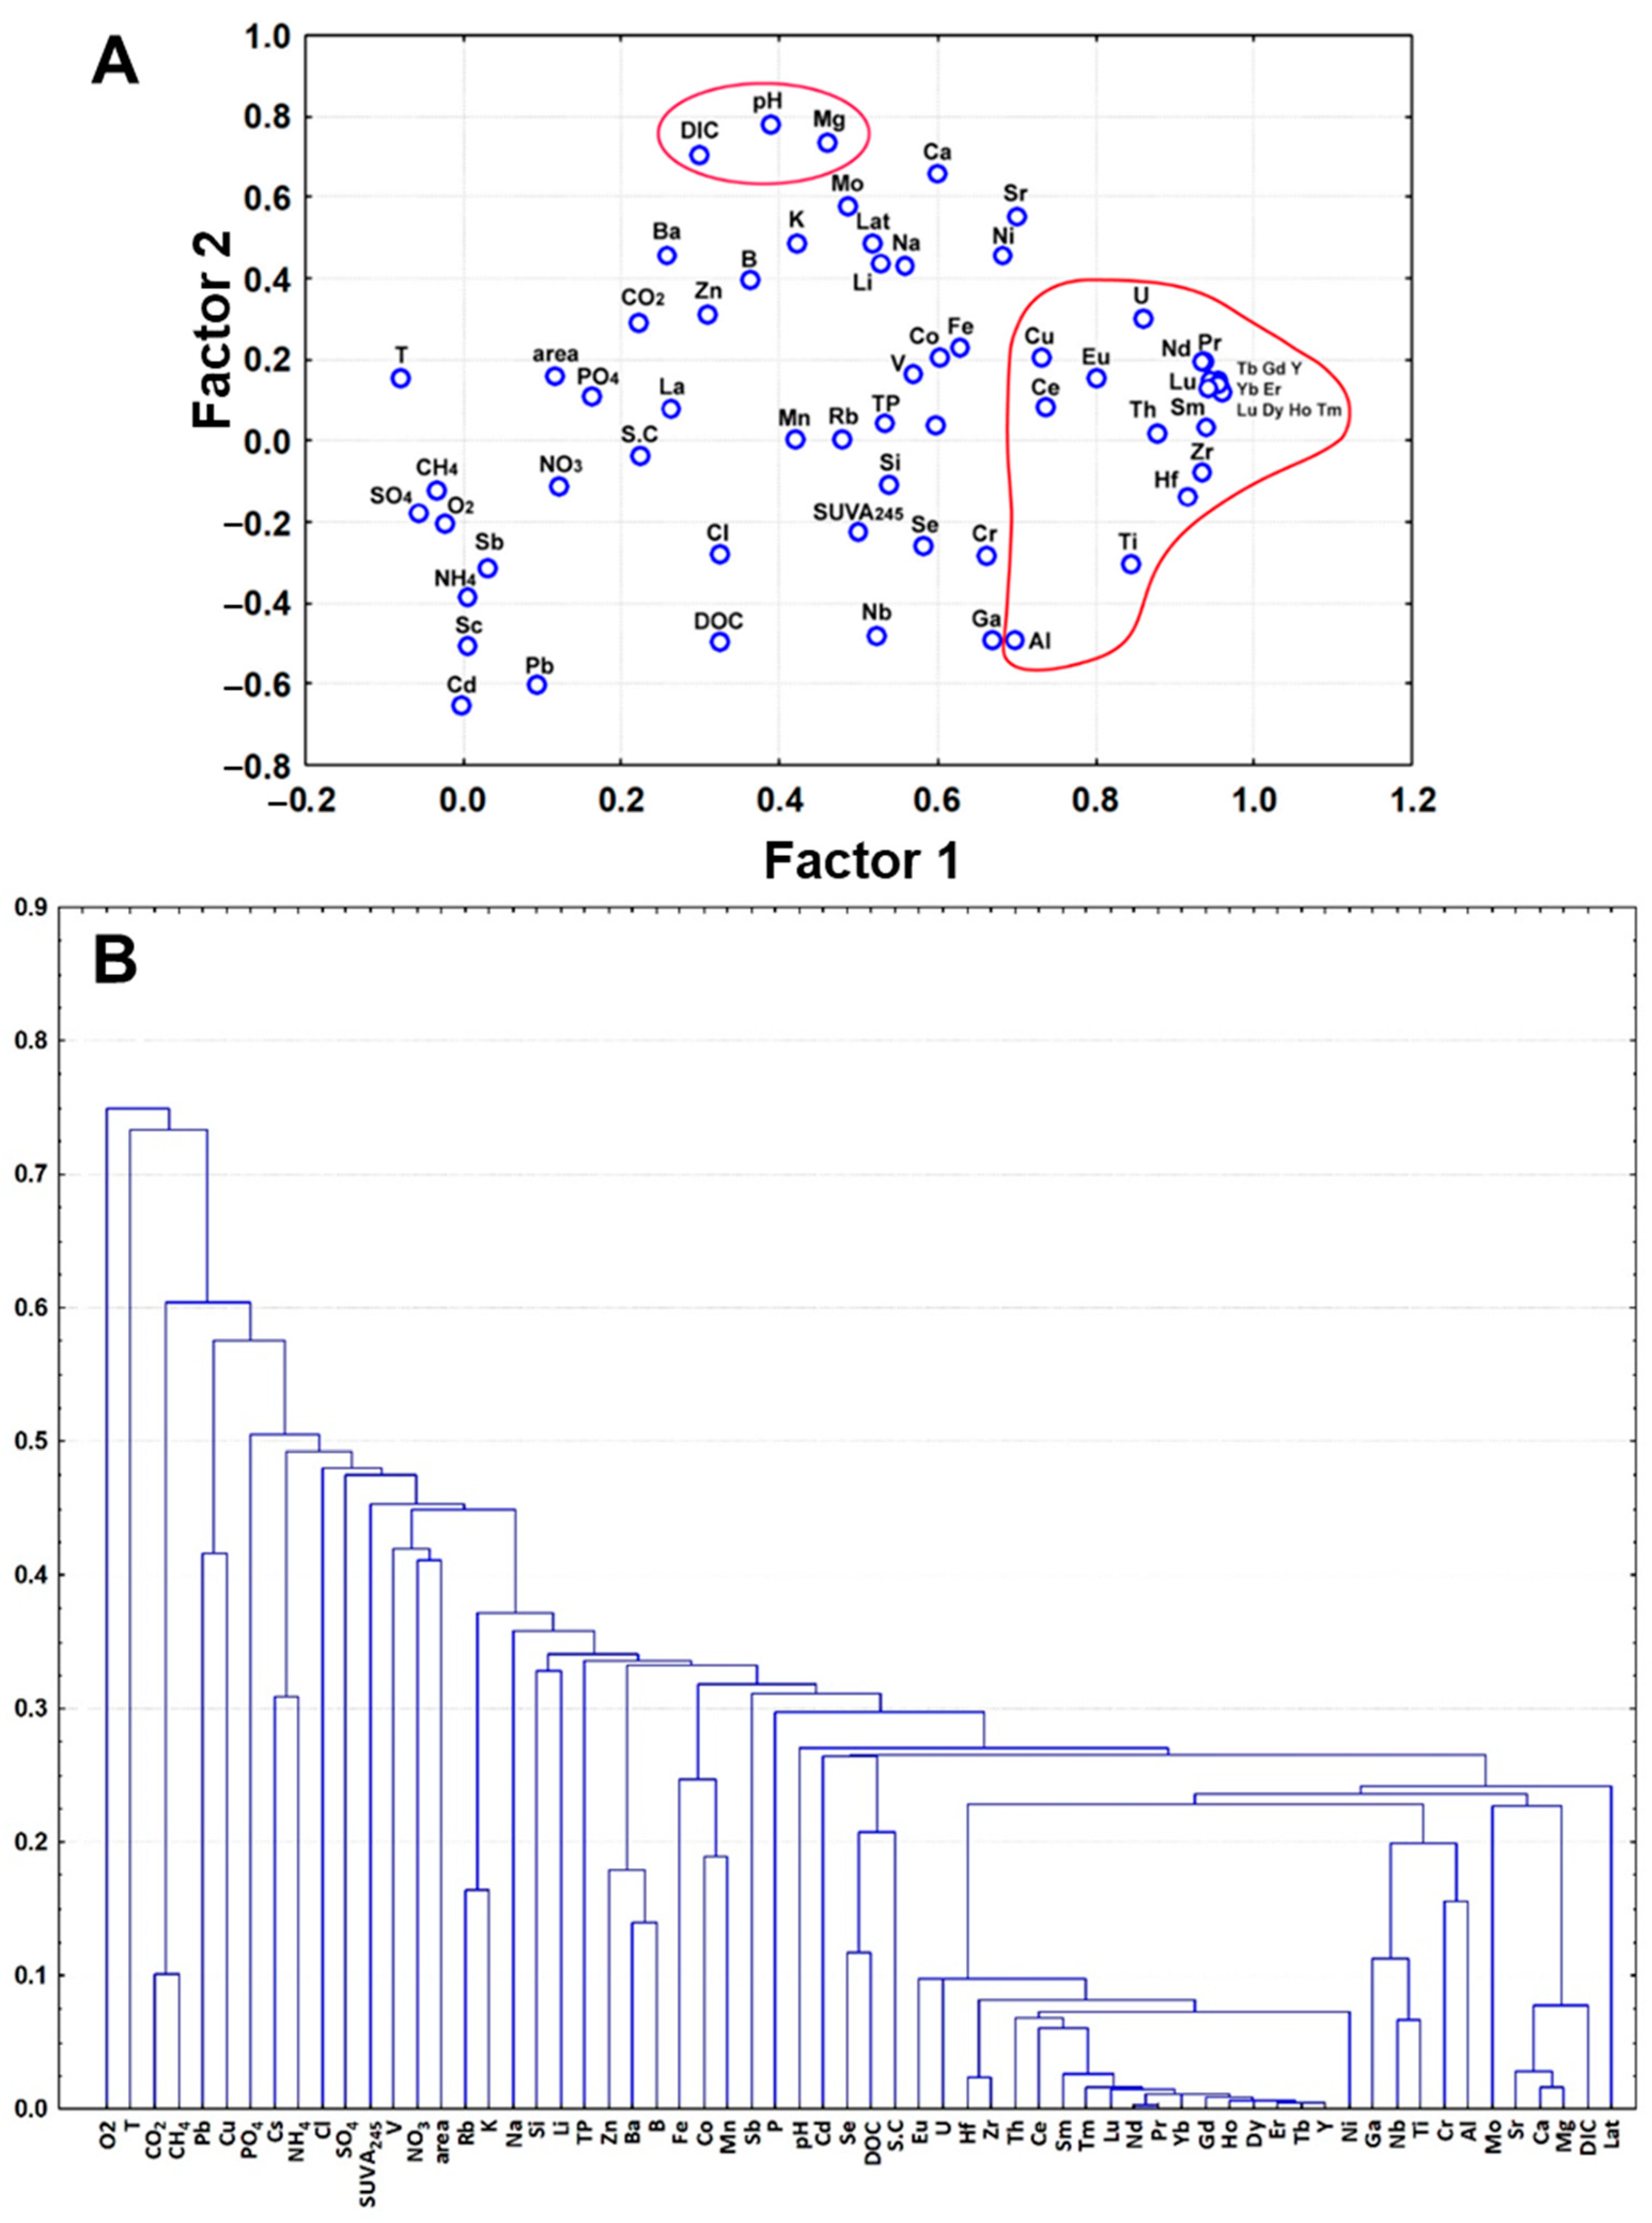
3.5. Multiparametrical Statistical Analysis (PCA and HCA)

Further distinction of different groups of elements was achieved via a PCA treatment. It revealed two main factors controlling major and TE concentrations in WSL lakes across a latitudinal profile, although the explicatory power of these factors was rather low (Figure 12A). The first factor, providing 25% of overall variation, included (Al), Ti, (Fe), Cu, Y, Zr, REEs, Hf, Th, and U, i.e., elements of lithogenic (mineral) origin, controlled by organic and organo-mineral colloids. The second factor (7.7% variation) acted on mobile, soluble elements affected by groundwater feeding in the south and desorption from marine clays in the north (DIC, pH, Mg, (Ca, K, and Mo)).
The HCA treatment of all dataset on WSL lakes also demonstrated a distinct group of soluble highly mobile elements (Ca, Mg, DIC, Mo, Sr) linked to latitude and low-soluble, trivalent and tetravalent hydrolysates, Se and U, linked to DOC (Figure 12B). Note that a similar distinction of elements between two main factors was revealed for WSL rivers [16] and, as such, it can be considered as a general (universal) feature of surface waters in the WSL territory. These two main group of elements are (i) labile, highly soluble alkalis, alkaline-earths, and oxyanions, linked to groundwater reservoirs, and (ii) low-soluble lithogenic trivalent and tetravalent hydrolysates, controlled by organic and organo-mineral colloids. These colloids are formed via mixing of Fe(II) and Al-rich groundwater and DOM-rich surface waters due to adsorption onto and coprecipitation with Fe and Al hydroxides stabilized by OM. The two main groups of elements are also encountered in large rivers of the boreal zone, based on the element concentration–river discharge relationship and seasonal behavior of river water solutes [75,76]; thus, they reflect general principles of geochemistry of surface waters in high-latitude regions.

3.6. How Northward Shift in Permafrost Zones May Affect the Chemical Composition of Lakes

In the Arctic regions, temperature increases faster than in other areas [77,78], which contributes to permafrost thawing and the release of labile organic carbon into surface waters [11]. An estimated carbon loss of up to 15% is expected in the frozen landscapes of the Northern Hemisphere in the next 300 years [79].
In Western Siberia, common climate change scenarios predict a northward shift of permafrost boundaries and an increase in the depth of the seasonally thawed layer [80,81,82,83,84,85,86]. Within a space for time substituting approach [49,50,53,54], the northward shift of permafrost boundaries will transform the continuous permafrost zones into a discontinuous one, and the discontinuous zone into sporadic/isolated zones. As a result, contemporary permafrost zones located along the climate gradient in the WSL and measured lake ecosystem parameters can be used to assess the future status of the territory provided that there will be a lateral shift northward of aquatic and terrestrial landscapes. Such a highly empirical yet straightforward prediction takes into account the integral change of biomes, at the level of both lake watershed (vegetation, soil) and lake ecosystem (water temperature and aquatic biota). Below, we consider the effects of climate changes on the elemental composition of lake waters and pools of DOC, DIC, and trace elements in thermokarst lakes across the permafrost gradient.
The increase in temperature and ALT will alter the proportion of the main sources supplying the components to the lakes, especially in the sporadic and discontinuous permafrost zones; therefore, chemical changes in lake waters will be most pronounced in these areas. The number of small and ultra-small lakes in these permafrost zones is expected to increase [2,3], and thawing of frozen permafrost and discharge of the water into the river network is likely to be enhanced in this transitional permafrost zone [13,18,87]. The main sources of elements entering thermokarst lakes in the continuous permafrost zone are atmospheric depositions and leaching from thawed mineral horizon. Thus, an increased depth of the active layer can cause a rapid influx of dissolved elements from the mineral horizons and deep underground waters to the lake.
For a long-term forecast of changes in the concentrations of chemical elements in the WSL lake waters (due to lateral shift of the permafrost boundaries northward), from isolated to continuous zones, we used previously published data for the Arctic coastal zone of Western Siberia [13] (Figure S4, Supplementary Materials). We also calculated the ratio of mean element concentrations in lakes located in the continuous permafrost zone to those encountered in the discontinuous permafrost zone and similar ratios for the adjacent discontinuous/sporadic and sporadic/isolated permafrost zones (Table 1). As can be seen from Figure S4 (Supplementary Materials) and Table 1, a shift of permafrost zones by 2° to 4° northward will lead, in the region which is now the continuous permafrost zone, to a 2–5-fold decrease in the concentration of most labile components (DIC, Li, B, Mg, K, Ca, Ni, Cu, As, Rb, Sr, Ba, Mo, U), as well as of insoluble low-mobile elements present in colloidal forms (Y, Zr, REEs, Th). The pH will decrease by ca. two units and the concentrations of CH4, DOC, NH4, Cd, Sb, and Pb may increase by a factor of 2–3, while the other elements in northern thermokarst lakes will remain unaffected by this permafrost boundary shift. The changes in concentrations of other elements might not exceed a factor of 1.5 to 2.0, which, given the large lateral and temporal variability of lake hydrochemical composition, can be considered as of low significance. The changes in lake water chemical composition (virtually all components) due to transformation of discontinuous to sporadic zone will also be quite low, within a factor of 1.5 to 2.0. In contrast, the transformation of sporadic to isolated permafrost will lead to a sizable (a factor of 2–5) decrease in the southern part of the permafrost-affected WSL territory of CH4, DOC, NH4, Al, Ptot, Ti, Cr, Ni, Ga Zr, Nb, Cs, REEs, Hf, Th, and U concentrations. Of special interest is a two-fold decrease in DOC concentration in thermokarst lakes of the southern, currently sporadic zone and its comparable increase in the northern, currently continuous permafrost zone.
As previously described [6], the stocks of carbon and most of the elements in the water column of thermokarst lakes account for 10–20% of the riverine export in the area; however, at the same time, lakes may play an important role in the storage of a number of toxic elements in bottom sediments, thus preventing element transfer to the river [32]. The shift in the permafrost zones and change in the elementary supply may cause a 2–5-fold change in the overall dissolved (<0.45 µm) pools of a large number of elements in both the most northern and the most southern permafrost zones of the WSL. Note, however, that these predictions do not take into account the changes in the amount of precipitation and the duration of warm/cold seasons, as well as development of lake macrophytes (i.e., Reference [88]). As such, further integrative ecosystem and climate modeling should allow more precise predictions on changes in element concentrations and pools in lentic waters of the WSL.

4. Conclusions

The chemical composition (DOC, nutrients, major and trace elements) of thermokarst lakes in the largest permafrost peatland in the world, the Western Siberia Lowland, was studied across four permafrost zones (isolated, sporadic, discontinuous, and continuous) and three main hydrological open-water periods (spring, summer, and autumn). Using this unprecedented geographical and seasonal resolution, we identified and quantified the primary environmental factors controlling thermokarst lake water chemistry such as lake size and type of permafrost distribution. These factors determine the link of the lake with groundwaters, soil suprapermafrost waters, and underlying mineral sediments, as well as and the intensity of peat leaching at the lake shore. Using thorough statistical treatment, we revealed two distinct group of elements—soluble highly mobile DIC, Ca, Mg, Sr, Mo, U, linked to groundwater reservoirs and marine clay minerals (chlorite, montmorillonite) and low-soluble lithogenic trivalent and tetravalent hydrolysates, controlled by organic and organo-mineral colloids. Such a distinction can be considered as a general feature of all surface waters in the WSL territory. In order to predict possible changes in thermokarst lake water concentration of C, nutrient, major and trace elements in response to climate warming and permafrost boundary shift northward, we used a “substitution space for time” approach. A shift of permafrost zones by 2° to 4° northward may lead to a 2–5-fold decrease in the concentration of most of the dissolved components (CO2, DIC, Ca, Mg, Sr, Al, Fe, Ti, Mn, Ni, Co, V, Mo, Sr, Zr, Hf, Th, REEs, and U) in lakes located in the continuous permafrost zones. However, the elements supplied from leaching of the peat mass and top humus (DOC, Si, K, Cr, Zn, As, and Rb) will exhibit rather small changes in concentration (i.e., 30–50% decrease). In the southern part of the WSL (sporadic permafrost zone), a sizable decrease in concentrations of CH4, DOC, NH4, Ptot, Al, Ti, Cr, Ni, Ga, Zr, Nb, REEs, Hf, Th, and U can be anticipated. These predictions can be considered of first order only and require further verifications via coupled ecosystem, vegetation, groundwater, and climate modeling.

Supplementary Materials

The following are available online at https://www.mdpi.com/2073-4441/12/6/1830/s1: Figure S1. Changes in lake depth (A), water temperature (B), and oxygen concentration (C) across different permafrost zones of Western Siberia over three hydrological seasons; Figure S2. Dependence of nutrient concentrations on the permafrost gradient (latitude): N-NO3 (A), N-NH4 (B), P-PO4 (C), and Ptot (D); Figure S3. Elements that do not show a significant latitudinal change in stocks in lake waters between spring and summer: K (A), Rb (B), and Mo (C); elements that increase their concentration in summer relative to spring in the sporadic and discontinuous permafrost zones: Ca (D), Co (E), Cd (F), Mn (G), Fe (H), and Pb (I); Figure S4. Summer element concentrations dependence of the permafrost gradient (latitude): DOC (A), Al (B), Fe (C), Mn (D), Si (E), Pb (F), Ca (G), Mg (H), Na (I), K (J), La (K), Ce (L). The data for the Arctic coastal zone of Western Siberia are from ref. [13]; Table S1. Dependence of physicochemical parameters and element concentrations on the water surface area for each permafrost zone during different hydrological seasons; Table S2. Mann–Whitney U test of the difference in element concentration between different seasons; Table S3. Mann–Whitney U test of the difference in element concentration between different permafrost zones; Table S4. Dependence of changes in the concentrations of the studied elements on the geographical latitude in different hydrological seasons; Table S5. Change in pools of DOC, DIC, and trace elements in lake waters in summer relative to spring.

Author Contributions

R.M.M. and O.S.P. conceptualized and designed the measurements of trace elements in lakes; R.M.M., A.G.L., and I.V.K. performed the field sampling; R.M.M., O.S.P., and L.S.S. analyzed the data; R.M.M., A.G.L., and L.S.S. contributed the data on lake water chemistry; S.N.V. provided the statistical treatment of the data; S.N.K. supervised the work and contributed to interpretation and permafrost transect design; R.M.M. and O.S.P. wrote the paper. All authors have read and agreed to the published version of the manuscript.

Funding

This work was supported by RSF grant No. 19-77-00073 (50%, sampling and interpretation), as well as RFBR grants No 19-05-50096, 19-55-15002, 20-05-00729.

Conflicts of Interest

The authors declare no conflicts of interest.

Appendix A

Table A1. Seasonal elemental composition of lake waters in different permafrost zones (mean ± SD is the numerator, median ± interquartile range (IQR) is the denominator). The last column represents global element concentrations for the whole WSL permafrost-affected territory, averaged over three seasons.
ElementUnitsIsolatedSporadicDiscontinuousContinuousAverage
SpringSummerAutumnSpringSummerAutumnSpringSummerAutumnSpringSummerAutumn
SCµS·cm−114 ± 5.215 ± 2.418 ± 3.613 ± 5.224 ± 9.926 ± 7.913 ± 4.622 ± 7.823 ± 8.216 ± 7.221 ± 1124 ± 8.918 ± 8.4
12.5 ± 514 ± 417.5 ± 411 ± 421.5 ± 1327 ± 811.5 ± 719 ± 1222 ± 1214.5 ± 916.5 ± 1420 ± 1417 ± 9.4
pH 4.57 ± 0.24.51 ± 0.44.51 ± 0.54.9 ± 0.84.14 ± 0.24.4 ± 0.24.62 ± 0.44.18 ± 0.44.7 ± 0.56.18 ± 0.56.99 ± 0.76.58 ± 0.65 ± 1
4.53 ± 0.24.4 ± 0.24.39 ± 0.34.65 ± 0.64.15 ± 0.34.42 ± 0.34.57 ± 0.44.1 ± 0.44.53 ± 0.36.38 ± 0.77.01 ± 0.86.63 ± 0.84.52 ± 1.3
CH4µmol·L−11.12 ± 0.91.35 ± 1.491.72 ± 2.30.661 ± 0.891.08 ± 2.415.9 ± 47.816.3 ± 234.45 ± 7.813.7 ± 275.26 ± 5.91.18 ± 0.70.639 ± 0.75.17 ± 18
0.73 ± 1.11.02 ± 1.30.9 ± 1.50.33 ± 0.370.34 ± 0.580.49 ± 1.213.1 ± 132.2 ± 3.75 ± 9.92.2 ± 9.31.2 ± 10.34 ± 0.540.97 ± 2.3
CO2µmol·L−175.6 ± 3061.6 ± 27.686.2 ± 2449.7 ± 1271.4 ± 26156 ± 251120 ± 50100 ± 80139 ± 128211 ± 85205 ± 73175 ± 75119 ± 106
65 ± 4857 ± 1886 ± 19.447.7 ± 1865 ± 7.778.2 ± 49112 ± 3780 ± 24108 ± 34218 ± 142212 ± 114151 ± 9288 ± 69
Cl-mg·L−10.188 ± 0.090.118 ± 0.090.188 ± 0.080.1 ± 0.080.148 ± 0.10.199 ± 0.20.106 ± 0.080.223 ± 0.190.261 ± 0.170.123 ± 0.040.136 ± 0.10.178 ± 0.040.163 ± 0.12
0.171 ± 0.10.09 ± 1.70.189 ± 0.070.08 ± 0.060.119 ± 0.180.18 ± 0.110.08 ± 0.030.171 ± 0.20.187 ± 0.210.12 ± 0.040.11 ± 0.080.17 ± 0.060.14 ± 0.13
SO42-mg·L−10.466 ± 0.250.607 ± 0.420.64 ± 0.390.192 ± 0.10.243 ± 0.20.302 ± 0.30.154 ± 0.60.09 ± 0.090.117 ± 0.110.159 ± 0.10.192 ± 0.10.281 ± 0.20.295 ± 0.29
0.368 ± 0.40.479 ± 0.70.49 ± 0.60.16 ± 0.090.226 ± 0.180.247 ± 0.220.135 ± 0.10.045 ± 0.080.063 ± 0.090.15 ± 0.060.14 ± 0.190.24 ± 0.230.2 ± 0.23
SUVA245L·mg-C−1·m−13.8 ± 0.453.4 ± 0.463.2 ± 0.363.6 ± 0.54.7 ± 0.74.5 ± 0.73.9 ± 0.744.5 ± 0.664.2 ± 0.614.4 ± 0.44.1 ± 13.9 ± 0.74 ± 0.7
3.8 ± 0.73.3 ± 0.63.2 ± 0.53.6 ± 0.64.5 ± 0.84.4 ± 13.8 ± 1.14.2 ± 14.1 ± 0.84.3 ± 0.63.9 ± 0.73.8 ± 1.13.9 ± 1
DOCmg·L−19.3 ± 3.0210.8 ± 3.411.3 ± 3.4311.2 ± 3.927.4 ± 1525.9 ± 9.610.8 ± 2.924.9 ± 1224.1 ± 9.28.46 ± 3.913.5 ± 5.215.9 ± 4.416 ± 10
8.5 ± 3.810.8 ± 5.311.2 ± 5.410.5 ± 4.820.7 ± 1323.5 ± 1410.2 ± 3.422.3 ± 1222 ± 9.37.27 ± 4.612.2 ± 3.314.9 ± 8.612 ± 9
DICmg·L−10.307 ± 0.060.274 ± 0.110.395 ± 0.120.313 ± 0.050.395 ± 0.10.496 ± 0.20.408 ± 0.060.424 ± 0.190.55 ± 0.281.41 ± 0.91.67 ± 1.21.82 ± 1.20.689 ± 0.76
0.289 ± 0.110.221 ± 0.140.434 ± 0.190.327 ± 0.050.401 ± 0.170.51 ± 0.250.388 ± 0.060.369 ± 0.150.508 ± 0.341.04 ± 1.31.34 ± 1.91.36 ± 1.90.4 ± 0.3
P-PO4µg·L−11.42 ± 0.861.76 ± 2.141.66 ± 0.991.87 ± 1.32.52 ± 1.73.31 ± 32.02 ± 1.45.51 ± 8.22.08 ± 1.62.27 ± 0.94.11 ± 2.22.6 ± 1.22.61 ± 3
1.46 ± 1.31.06 ± 1.11.63 ± 1.31.44 ± 0.842.24 ± 2.42.24 ± 41.62 ± 0.81.96 ± 3.81.72 ± 2.42.07 ± 1.43.48 ± 2.82.44 ± 1.51.9 ± 1.8
N-NO3µg·L−111.9 ± 177.03 ± 9.324.4 ± 4218.6 ± 226.2 ± 5.937.2 ± 533.33 ± 3.82.83 ± 1.93.48 ± 2.074.1 ± 2.11.5 ± 1.325.4 ± 3.512.2 ± 25
7 ± 9.21.6 ± 104.1 ± 147.5 ± 283.2 ± 8.59.8 ± 372.39 ± 1.72.19 ± 2.72.57 ± 3.63.72 ± 2.81.44 ± 2.812.4 ± 293.2 ± 8
N-NH4µg·L−1108 ± 10220.6 ± 4438.9 ± 87130 ± 98105 ± 151348 ± 27788.8 ± 12454.2 ± 76164 ± 30211.8 ± 128.74 ± 9.123 ± 4689 ± 161
120 ± 1355.13 ± 4.87.6 ± 12137 ± 19355 ± 118361 ± 56438 ± 10520 ± 807.6 ± 958.3 ± 125.36 ± 5.26.62 ± 1714 ± 86
Liµg·L−10.167 ± 0.150.331 ± 0.490.381 ± 0.520.108 ± 0.10.336 ± 0.20.422 ± 0.10.128 ± 0.080.357 ± 0.240.403 ± 0.250.511 ± 0.31.01 ± 0.41.23 ± 0.50.443 ± 0.44
0.124 ± 0.020.21 ± 0.040.244 ± 0.080.103 ± 0.070.294 ± 0.210.4 ± 0.170.112 ± 0.150.24 ± 0.370.24 ± 0.320.43 ± 0.390.97 ± 0.631.19 ± 0.70.26 ± 0.36
Bµg·L−12.02 ± 1.122.76 ± 0.712.91 ± 0.771.77 ± 1.36.38 ± 2.33.88 ± 1.81.25 ± 1.32.63 ± 0.973.4 ± 1.72.24 ± 1.817.6 ± 123.61 ± 1.54.26 ± 5.7
1.8 ± 1.22.7 ± 1.22.7 ± 0.491.38 ± 1.66.2 ± 3.33.8 ± 2.30.916 ± 1.12.17 ± 1.23.13 ± 21.49 ± 2.414.9 ± 203.57 ± 2.12.7 ± 2.6
Naµg·L−1201 ± 61200 ± 124169 ± 170232 ± 114297 ± 184193 ± 120225 ± 167363 ± 303341 ± 345362 ± 157686 ± 440535 ± 257314 ± 265
183 ± 62181 ± 54136 ± 43211 ± 102302 ± 159179 ± 129182 ± 101242 ± 415227 ± 279320 ± 138675 ± 388470 ± 316221 ± 228
Mgµg·L−181.8 ± 4997.6 ± 83144 ± 12948.6 ± 36109 ± 149161 ± 13354.8 ± 47105 ± 117148 ± 120709 ± 3921098 ± 7461225 ± 537331 ± 501
74 ± 1379 ± 18115 ± 3343 ± 3652 ± 3774 ± 21334 ± 6462 ± 71113 ± 107583 ± 539811 ± 10061029 ± 74492 ± 239
Alµg·L−127.4 ± 1438.7 ± 1241 ± 9.751.3 ± 94111 ± 4094.8 ± 3652.1 ± 33137 ± 65163 ± 11131.2 ± 3261.9 ± 6797.6 ± 8774.6 ± 72
26 ± 2738 ± 1742 ± 1528 ± 14123 ± 6394 ± 3750 ± 56120 ± 88129 ± 8718 ± 3240 ± 3776 ± 7047 ± 64
Siµg·L−1239 ± 69236 ± 338425 ± 451134 ± 49273 ± 446282 ± 539660 ± 725185 ± 174970 ± 1167239 ± 156379 ± 2531021 ± 702415 ± 581
235 ± 85147 ± 62266 ± 144151 ± 78107 ± 143145 ± 161217 ± 139198 ± 201471 ± 750217 ± 269294 ± 361744 ± 1067219 ± 262
Ptotµg·L−10.518 ± 0.663.53 ± 2.53.66 ± 2.044.25 ± 2.724.8 ± 7.78.97 ± 3.810.3 ± 626.4 ± 1313.2 ± 6.314.2 ± 8.920.9 ± 2313 ± 611.6 ± 11
0.16 ± 0.313.14 ± 2.13.3 ± 2.64.6 ± 422 ± 159.4 ± 5.67.6 ± 9.721 ± 1111 ± 8.913 ± 8.912 ± 1012 ± 59.1 ± 13
Kµg·L–177.7 ± 4485.1 ± 6885.5 ± 6377.2 ± 3968.4 ± 4456.4 ± 3854.9 ± 3152.6 ± 3343.7 ± 20198 ± 153141 ± 166194 ± 14295 ± 97
75 ± 4452 ± 6162 ± 2763 ± 7149 ± 4733 ± 6150 ± 5142 ± 2240 ± 18141 ± 13882 ± 58132 ± 9367 ± 75
Caµg·L−1132 ± 137273 ± 232363 ± 23773 ± 45378 ± 284321 ± 169124 ± 108462 ± 297593 ± 5991408 ± 8882329 ± 13642488 ± 1031746 ± 1009
107 ± 58227 ± 120301 ± 20268 ± 61273 ± 113283 ± 14392 ± 57329 ± 242387 ± 2011165 ± 10761937 ± 14182042 ± 1734302 ± 755
Tiµg·L−11.41 ± 0.841.71 ± 1.51.9 ± 1.22.08 ± 0.98.94 ± 59.24 ± 5.43.45 ± 2.35.62 ± 4.57.31 ± 4.53.17 ± 2.17.6 ± 98.5 ± 6.15.04 ± 5.2
1.24 ± 1.41.37 ± 0.81.68 ± 0.92.07 ± 0.98.67 ± 6.69 ± 4.82.85 ± 3.94.1 ± 2.66.1 ± 4.62.48 ± 2.43.63 ± 5.46.9 ± 4.53.2 ± 4.9
Vµg·L−10.594 ± 0.280.201 ± 0.050.232 ± 0.050.491 ± 0.40.606 ± 0.30.596 ± 0.30.515 ± 0.410.45 ± 0.130.453 ± 0.161.21 ± 0.30.731 ± 0.70.628 ± 0.40.552 ± 0.41
0.736 ± 0.570.193 ± 0.040.23 ± 0.060.295 ± 0.430.542 ± 0.10.575 ± 0.20.289 ± 0.830.447 ± 0.170.428 ± 0.271.08 ± 0.230.47 ± 0.380.56 ± 0.190.46 ± 0.46
Crµg·L−10.121 ± 0.030.107 ± 0.070.287 ± 0.090.143 ± 0.10.523 ± 0.10.595 ± 0.10.312 ± 0.610.479 ± 0.170.56 ± 0.30.224 ± 0.20.394 ± 0.30.61 ± 0.30.352 ± 0.3
0.106 ± 0.040.088 ± 0.060.269 ± 0.070.15 ± 0.080.529 ± 0.250.539 ± 0.180.115 ± 0.170.436 ± 0.220.481 ± 0.240.14 ± 0.10.31 ± 0.270.57 ± 0.330.28 ± 0.39
Mnµg·L−18.93 ± 5.27.54 ± 3.88.53 ± 3.85.14 ± 215.4 ± 9.513.2 ± 7.113.9 ± 1632.4 ± 2428 ± 1841.8 ± 3413.9 ± 1419.2 ± 2117 ± 19
7.28 ± 2.78.1 ± 3.58.33 ± 4.15 ± 3.711.8 ± 5.111.6 ± 96.5 ± 1423 ± 3022.6 ± 1733.4 ± 227.33 ± 1512 ± 169.9 ± 13
Feµg·L−1122 ± 68107 ± 9897.6 ± 9262.7 ± 26171 ± 70154 ± 53160 ± 161215 ± 207303 ± 346520 ± 345361 ± 304366 ± 217215 ± 231
101 ± 10179 ± 7375 ± 5655.6 ± 32175 ± 139148 ± 4495 ± 138163 ± 90185 ± 177379 ± 468191 ± 432306 ± 309134 ± 161
Coµg·L−10.042 ± 0.010.039 ± 0.020.047 ± 0.010.03 ± 0.010.11 ± 0.10.1 ± 0.030.08 ± 0.070.249 ± 0.140.22 ± 0.10.389 ± 0.30.297 ± 0.20.342 ± 0.30.158 ± 0.18
0.044 ± 0.020.035 ± 0.020.046 ± 0.020.028 ± 0.020.104 ± 0.080.1 ± 0.040.051 ± 0.060.196 ± 0.20.195 ± 0.10.31 ± 0.310.23 ± 0.270.28 ± 0.220.1 ± 0.15
Niµg·L−10.079 ± 0.040.095 ± 0.060.065 ± 0.020.166 ± 0.10.39 ± 0.20.523 ± 0.80.219 ± 0.110.558 ± 0.30.438 ± 0.220.858 ± 0.51.6 ± 0.71.91 ± 0.50.56 ± 0.69
0.061 ± 0.030.083 ± 0.040.066 ± 0.030.132 ± 0.130.374 ± 0.380.337 ± 0.150.203 ± 0.130.551 ± 0.330.465 ± 0.320.74 ± 0.661.48 ± 0.692.08 ± 0.510.27 ± 0.57
Cuµg·L−10.402 ± 1.080.118 ± 0.050.101 ± 0.040.211 ± 0.10.459 ± 0.20.16 ± 0.10.178 ± 0.110.453 ± 0.240.69 ± 1.10.465 ± 0.31.31 ± 1.61.1 ± 10.47 ± 0.79
0.116 ± 0.050.107 ± 0.020.09 ± 0.060.161 ± 0.130.436 ± 0.20.134 ± 0.10.16 ± 0.10.387 ± 0.340.212 ± 0.230.41 ± 0.360.72 ± 0.970.97 ± 0.720.23 ± 0.38
Znµg·L−15.48 ± 311.3 ± 113.96 ± 1.28.32 ± 108.37 ± 3.76.55 ± 3.212.4 ± 5.69.29 ± 2.98.35 ± 144.79 ± 2.436.4 ± 313.31 ± 1.99.56 ± 13
4.67 ± 1.58.95 ± 3.53.94 ± 13.8 ± 6.47.13 ± 4.55.37 ± 5.410.7 ± 6.68.67 ± 3.94.45 ± 24.59 ± 3.124.5 ± 603.06 ± 35.75 ± 5.8
Gaµg·L−10.003 ± 0.0030.01 ± 0.0020.01 ± 0.0020.008 ± 0.010.021 ± 0.010.019 ± 0.010.007 ± 0.0030.016 ± 0.0080.031 ± 0.030.008 ± 0.0040.009 ± 0.0070.014 ± 0.020.012 ± 0.01
0.002 ± 0.0050.008 ± 0.0020.008 ± 0.0030.006 ± 0.0030.022 ± 0.010.018 ± 0.010.006 ± 0.0050.015 ± 0.010.019 ± 0.010.01 ± 0.0070.01 ± 0.0060.01 ± 0.0060.009 ± 0.009
Asµg·L−10.386 ± 0.080.51 ± 0.090.424 ± 0.080.267 ± 0.10.552 ± 0.20.465 ± 0.110.184 ± 0.090.386 ± 0.150.347 ± 0.120.585 ± 0.250.801 ± 0.370.601 ± 0.140.458 ± 0.23
0.37 ± 0.080.508 ± 0.150.437 ± 0.140.266 ± 0.090.501 ± 0.150.459 ± 0.130.164 ± 0.080.342 ± 0.210.332 ± 0.160.48 ± 0.40.72 ± 0.240.56 ± 0.20.42 ± 0.2
Seµg·L−125.8 ± 5.128.8 ± 8.428.7 ± 5.325 ± 5.957 ± 2153.1 ± 1216.8 ± 3.445.7 ± 1738.2 ± 9.824.5 ± 1146.6 ± 2242.6 ± 1036 ± 17
25.5 ± 6.130.4 ± 1129 ± 9.625.7 ± 7.645.8 ± 2655 ± 1717 ± 4.642.2 ± 1938 ± 1720 ± 1038.4 ± 1542 ± 9.333 ± 19
Rbµg·L−10.194 ± 0.120.149 ± 0.190.131 ± 0.170.178 ± 0.120.163 ± 0.160.145 ± 0.150.145 ± 0.090.048 ± 0.040.057 ± 0.070.35 ± 0.250.09 ± 0.110.359 ± 0.440.169 ± 0.2
0.212 ± 0.150.065 ± 0.180.054 ± 0.110.178 ± 0.210.091 ± 0.20.065 ± 0.240.122 ± 0.150.039 ± 0.020.044 ± 0.040.32 ± 0.260.03 ± 0.130.21 ± 0.170.11 ± 0.2
Srµg·L-11.52 ± 1.11.73 ± 1.81.84 ± 1.91.07 ± 0.452.39 ± 1.61.87 ± 1.11.3 ± 0.913.02 ± 24.91 ± 77.28 ± 3.911.8 ± 5.411.4 ± 5.74.12 ± 5
1.22 ± 0.731.27 ± 0.61.36 ± 0.981.02 ± 0.591.6 ± 1.31.7 ± 1.60.947 ± 0.762.14 ± 2.42.3 ± 2.16.37 ± 5.111.1 ± 7.18.98 ± 7.31.7 ± 4.3
Yµg·L−10.012 ± 0.010.019 ± 0.010.018 ± 0.010.01 ± 0.0060.05 ± 0.030.035 ± 0.030.022 ± 0.020.063 ± 0.040.088 ± 0.10.09 ± 0.050.16 ± 0.140.231 ± 0.170.065 ± 0.09
0.01 ± 0.0070.015 ± 0.0080.015 ± 0.0080.009 ± 0.010.056 ± 0.040.027 ± 0.040.015 ± 0.030.052 ± 0.040.042 ± 0.040.07 ± 0.030.12 ± 0.090.18 ± 0.150.03 ± 0.06
Zrµg·L−10.014 ± 0.020.019 ± 0.030.023 ± 0.030.032 ± 0.020.106 ± 0.060.1 ± 0.080.042 ± 0.030.075 ± 0.050.084 ± 0.040.087 ± 0.070.149 ± 0.150.269 ± 0.270.081 ± 0.12
0.012 ± 0.0060.013 ± 0.0080.014 ± 0.0050.025 ± 0.030.096 ± 0.080.068 ± 0.070.029 ± 0.060.06 ± 0.080.068 ± 0.060.06 ± 0.040.11 ± 0.110.23 ± 0.180.05 ± 0.09
Nbµg·L−10.0031 ± 0.0020.002 ± 0.0010.0035 ± 0.0030.006 ± 0.0040.023 ± 0.0120.019 ± 0.0120.007 ± 0.0040.012 ± 0.0060.014 ± 0.0050.008 ± 0.0070.006 ± 0.0060.012 ± 0.0060.01 ± 0.009
0.003 ± 0.0030.002 ± 0.0020.003 ± 0.0030.004 ± 0.0030.024 ± 0.020.017 ± 0.010.008 ± 0.0070.011 ± 0.0070.013 ± 0.010.005 ± 0.0060.004 ± 0.0030.011 ± 0.0060.007 ± 0.009
Moµg·L−10.005 ± 0.0040.004 ± 0.0030.003 ± 0.0010.006 ± 0.0050.007 ± 0.0050.011 ± 0.0080.007 ± 0.0050.009 ± 0.010.01 ± 0.0080.035 ± 0.0330.052 ± 0.0620.038 ± 0.020.016 ± 0.03
0.003 ± 0.0050.004 ± 0.0030.004 ± 0.0020.005 ± 0.0070.004 ± 0.0060.008 ± 0.0110.006 ± 0.0070.005 ± 0.0070.008 ± 0.0110.026 ± 0.0170.03 ± 0.060.032 ± 0.020.007 ± 0.01
Cdµg·L−10.016 ± 0.0040.017 ± 0.0060.018 ± 0.0060.008 ± 0.0050.025 ± 0.0190.021 ± 0.0110.007 ± 0.0030.022 ± 0.0110.018 ± 0.0080.006 ± 0.0040.004 ± 0.0030.006 ± 0.0050.014 ± 0.01
0.018 ± 0.0060.017 ± 0.010.019 ± 0.0090.006 ± 0.0050.018 ± 0.0080.018 ± 0.0090.006 ± 0.0050.018 ± 0.010.017 ± 0.0070.005 ± 0.0030.003 ± 0.0030.004 ± 0.0030.01 ± 0.01
Sbµg·L−10.035 ± 0.0040.038 ± 0.0080.041 ± 0.0080.026 ± 0.0060.04 ± 0.0140.04 ± 0.0110.015 ± 0.0050.027 ± 0.0080.031 ± 0.0230.026 ± 0.0470.022 ± 0.0140.026 ± 0.0090.03 ± 0.02
0.036 ± 0.0070.038 ± 0.0130.044 ± 0.0140.024 ± 0.0110.038 ± 0.0160.038 ± 0.0180.015 ± 0.0070.024 ± 0.0140.026 ± 0.0090.013 ± 0.010.017 ± 0.0120.025 ± 0.0120.03 ± 0.02
Csµg·L−10.005 ± 0.0040.005 ± 0.0060.005 ± 0.0040.008 ± 0.0060.011 ± 0.0110.018 ± 0.0140.005 ± 0.0030.0021 ± 0.0030.002 ± 0.0020.001 ± 0.00030.001 ± 0.0010.002 ± 0.0040.006 ± 0.008
0.004 ± 0.0050.003 ± 0.0070.003 ± 0.0060.008 ± 0.0110.009 ± 0.010.015 ± 0.0170.004 ± 0.0060.001 ± 0.0020.001 ± 0.0040.0005 ± 0.00040.001 ± 0.00060.001 ± 0.0010.003 ± 0.007
Baµg·L−11.63 ± 1.31.4 ± 0.991.34 ± 1.21.65 ± 0.843.35 ± 1.82.27 ± 1.72.89 ± 1.36.03 ± 4.84.59 ± 3.32.34 ± 0.7587.4 ± 812.59 ± 0.589.78 ± 33
1 ± 1.71.1 ± 0.570.984 ± 0.811.49 ± 1.22.61 ± 2.11.88 ± 13.14 ± 2.34.3 ± 5.53.5 ± 1.62.1 ± 0.5778 ± 1172.75 ± 12.2 ± 2.2
Laµg·L−10.032 ± 0.030.022 ± 0.030.011 ± 0.0050.236 ± 0.550.028 ± 0.0120.026 ± 0.0170.04 ± 0.0390.57 ± 0.040.055 ± 0.060.064 ± 0.030.123 ± 0.110.155 ± 0.110.072 ± 0.18
0.017 ± 0.030.01 ± 0.0060.01 ± 0.0060.092 ± 0.110.027 ± 0.010.023 ± 0.020.03 ± 0.020.035 ± 0.050.033 ± 0.030.05 ± 0.020.09 ± 0.060.14 ± 0.090.03 ± 0.06
Ceµg·L−10.05 ± 0.060.022 ± 0.0120.022 ± 0.0140.024 ± 0.0140.06 ± 0.030.058 ± 0.0420.062 ± 0.060.262 ± 0.0460.129 ± 0.120.154 ± 0.070.268 ± 0.260.357 ± 0.280.12 ± 0.2
0.023 ± 0.0330.019 ± 0.0080.018 ± 0.010.022 ± 0.020.069 ± 0.040.04 ± 0.050.04 ± 0.070.149 ± 0.220.078 ± 0.090.14 ± 0.030.184 ± 0.170.297 ± 0.240.05 ± 0.12
Prµg·L−10.003 ± 0.0020.002 ± 0.0020.003 ± 0.0020.002 ± 0.0010.007 ± 0.0040.007 ± 0.0050.006 ± 0.0050.012 ± 0.0110.016 ± 0.0150.02 ± 0.010.035 ± 0.030.048 ± 0.0350.013 ± 0.02
0.002 ± 0.0020.002 ± 0.0010.002 ± 0.0020.002 ± 0.0020.007 ± 0.0060.05 ± 0.0070.004 ± 0.0070.008 ± 0.010.01 ± 0.010.017 ± 0.0050.024 ± 0.020.04 ± 0.030.006 ± 0.01
Ndµg·L−10.012 ± 0.0080.01 ± 0.0070.011 ± 0.0090.009 ± 0.0050.029 ± 0.0160.028 ± 0.0210.024 ± 0.020.046 ± 0.040.065 ± 0.060.082 ± 0.040.141 ± 0.1360.203 ± 0.150.054 ± 0.08
0.011 ± 0.0070.008 ± 0.0030.01 ± 0.0080.009 ± 0.0090.03 ± 0.020.02 ± 0.0280.018 ± 0.030.031 ± 0.040.041 ± 0.050.07 ± 0.020.101 ± 0.090.166 ± 0.140.02 ± 0.06
Smµg·L−10.007 ± 0.0030.006 ± 0.0020.009 ± 0.0030.004 ± 0.0010.012 ± 0.0040.012 ± 0.0050.009 ± 0.0060.018 ± 0.010.036 ± 0.0420.023 ± 0.010.034 ± 0.030.054 ± 0.0450.018 ± 0.02
0.006 ± 0.0040.006 ± 0.0030.009 ± 0.0030.004 ± 0.0010.012 ± 0.0050.011 ± 0.010.006 ± 0.0070.013 ± 0.010.018 ± 0.010.021 ± 0.070.024 ± 0.020.046 ± 0.030.01 ± 0.01
Euµg·L−10.001 ± 0.00090.0011 ± 0.0010.001 ± 0.0010.001 ± 0.00040.0022 ± 0.0010.002 ± 0.0010.002 ± 0.0010.003 ± 0.0020.003 ± 0.0010.004 ± 0.0020.015 ± 0.0090.017 ± 0.030.004 ± 0.01
0.001 ± 0.00020.001 ± 0.00010.001 ± 0.00030.001 ± 0.0010.002 ± 0.0020.001 ± 0.0020.001 ± 0.0010.002 ± 0.0030.002 ± 0.0010.004 ± 0.0020.011 ± 0.010.009 ± 0.0070.002 ± 0.003
Gdµg·L−10.003 ± 0.0020.004 ± 0.0020.004 ± 0.0030.0024 ± 0.0020.009 ± 0.0050.007 ± 0.0040.005 ± 0.00480.014 ± 0.010.02 ± 0.020.02 ± 0.010.036 ± 0.030.05 ± 0.040.014 ± 0.02
0.003 ± 0.0020.003 ± 0.0020.004 ± 0.0020.0021 ± 0.0020.009 ± 0.0080.005 ± 0.0070.005 ± 0.0060.01 ± 0.0170.011 ± 0.010.017 ± 0.0070.027 ± 0.020.04 ± 0.030.006 ± 0.01
Tbµg·L−10.0005 ± 0.00030.001 ± 0.00030.001 ± 0.00040.0003 ± 0.00020.002 ± 0.0010.0012 ± 0.0010.001 ± 0.00070.002 ± 0.0010.003 ± 0.00250.003 ± 0.0010.005 ± 0.0050.007 ± 0.0050.002 ± 0.003
0.0004 ± 0.00030.001 ± 0.00030.0005 ± 0.00050.0002 ± 0.00030.002 ± 0.0010.001 ± 0.0010.001 ± 0.0010.002 ± 0.0010.001 ± 0.0010.002 ± 0.0010.004 ± 0.0030.006 ± 0.0050.001 ± 0.002
Dyµg·L−10.002 ± 0.00130.004 ± 0.00180.003 ± 0.00260.0022 ± 0.0010.01 ± 0.0060.007 ± 0.0050.004 ± 0.0040.013 ± 0.0080.016 ± 0.020.016 ± 0.0090.03 ± 0.0280.041 ± 0.030.012 ± 0.02
0.002 ± 0.0010.003 ± 0.0020.003 ± 0.0020.002 ± 0.00170.009 ± 0.0080.006 ± 0.0080.003 ± 0.0050.01 ± 0.010.008 ± 0.010.014 ± 0.010.021 ± 0.020.033 ± 0.030.007 ± 0.01
Hoµg·L−10.0005 ± 0.00040.001 ± 0.00040.001 ± 0.00050.0005 ± 0.00030.002 ± 0.0010.0013 ± 0.0010.001 ± 0.00070.003 ± 0.0020.003 ± 0.0030.003 ± 0.0020.006 ± 0.0050.008 ± 0.0060.002 ± 0.003
0.0003 ± 0.00020.001 ± 0.00030.001 ± 0.00040.0004 ± 0.00050.002 ± 0.0020.001 ± 0.0020.001 ± 0.00070.002 ± 0.0020.002 ± 0.0010.003 ± 0.0010.004 ± 0.0030.007 ± 0.0050.001 ± 0.002
Erµg·L−10.001 ± 0.0010.002 ± 0.0010.002 ± 0.00160.001 ± 0.00080.006 ± 0.0030.004 ± 0.0030.003 ± 0.0020.01 ± 0.0040.01 ± 0.00990.01 ± 0.0050.016 ± 0.010.024 ± 0.010.007 ± 0.01
0.001 ± 0.00090.002 ± 0.0010.001 ± 0.0010.0005 ± 0.0010.006 ± 0.0050.003 ± 0.0050.002 ± 0.0030.006 ± 0.0050.005 ± 0.0040.009 ± 0.0030.012 ± 0.010.02 ± 0.0170.004 ± 0.007
Tmµg·L−10.0001 ± 0.00020.0003 ± 0.00020.0003 ± 0.00030.0001 ± 0.00010.0009 ± 0.00050.001 ± 0.00050.0004 ± 0.00040.001 ± 0.00060.0015 ± 0.0010.0014 ± 0.0010.002 ± 0.0020.003 ± 0.0020.001 ± 0.001
0.0001 ± 0.00010.0002 ± 0.00020.0003 ± 0.00020.0001 ± 0.00020.001 ± 0.00070.0004 ± 0.0010.0002 ± 0.00060.001 ± 0.00070.001 ± 0.0010.001 ± 0.00010.002 ± 0.0010.003 ± 0.0020.0005 ± 0.001
Ybµg·L−10.002 ± 0.00120.002 ± 0.00140.002 ± 0.00160.001 ± 0.00090.005 ± 0.0030.004 ± 0.0030.003 ± 0.0020.01 ± 0.0040.01 ± 0.0010.01 ± 0.0040.015 ± 0.010.024 ± 0.020.007 ± 0.01
0.001 ± 0.0010.0015 ± 0.0010.0013 ± 0.0010.001 ± 0.0010.005 ± 0.0040.003 ± 0.0040.002 ± 0.0030.005 ± 0.0050.004 ± 0.0050.01 ± 0.0040.01 ± 0.0080.02 ± 0.010.003 ± 0.007
Luµg·L−10.0003 ± 0.00020.0002 ± 0.00020.0003 ± 0.00030.0002 ± 0.00020.001 ± 0.00040.0005 ± 0.00050.0004 ± 0.00040.0008 ± 0.00060.0015 ± 0.0010.0014 ± 0.0010.002 ± 0.00170.004 ± 0.0030.001 ± 0.001
0.0002 ± 0.00020.0002 ± 0.00010.0002 ± 0.00010.0001 ± 0.00030.001 ± 0.00060.0003 ± 0.00070.0003 ± 0.00050.001 ± 0.00070.001 ± 0.0010.001 ± 0.00060.002 ± 0.0010.003 ± 0.0020.0004 ± 0.001
Hfµg·L−10.003 ± 0.0020.003 ± 0.0020.003 ± 0.0020.005 ± 0.0030.016 ± 0.010.014 ± 0.010.005 ± 0.0040.013 ± 0.0070.029 ± 0.040.012 ± 0.010.021 ± 0.020.035 ± 0.030.013 ± 0.018
0.002 ± 0.00150.002 ± 0.0010.003 ± 0.0020.005 ± 0.0030.015 ± 0.010.011 ± 0.010.003 ± 0.0070.013 ± 0.010.015 ± 0.020.01 ± 0.010.02 ± 0.010.03 ± 0.020.008 ± 0.01
Pbµg·L−10.274 ± 0.220.19 ± 0.10.218 ± 0.110.139 ± 0.080.257 ± 0.160.3 ± 0.10.085 ± 0.040.2 ± 0.110.281 ± 0.140.065 ± 0.030.067 ± 0.040.088 ± 0.090.184 ± 0.14
0.241 ± 0.150.162 ± 0.090.18 ± 0.120.111 ± 0.120.222 ± 0.130.316 ± 0.250.085 ± 0.040.184 ± 0.10.245 ± 0.210.06 ± 0.030.05 ± 0.060.06 ± 0.050.15 ± 0.16
Thµg·L−10.002 ± 0.0010.003 ± 0.0010.003 ± 0.0020.003 ± 0.0010.011 ± 0.010.011 ± 0.0050.006 ± 0.0040.011 ± 0.010.012 ± 0.010.01 ± 0.0080.021 ± 0.020.028 ± 0.010.01 ± 0.01
0.002 ± 0.0010.002 ± 0.0010.003 ± 0.0020.003 ± 0.0020.011 ± 0.010.012 ± 0.010.003 ± 0.0080.008 ± 0.0090.01 ± 0.010.006 ± 0.0060.01 ± 0.010.03 ± 0.020.01 ± 0.01
Uµg·L−10.001 ± 0.00030.001 ± 0.00050.001 ± 0.00050.002 ± 0.0010.004 ± 0.0020.003 ± 0.0020.0012 ± 0.0010.002 ± 0.00150.004 ± 0.0060.007 ± 0.0050.017 ± 0.010.017 ± 0.010.005 ± 0.008
0.001 ± 0.00040.001 ± 0.00060.001 ± 0.00090.002 ± 0.0010.004 ± 0.0020.003 ± 0.0020.001 ± 0.0010.001 ± 0.0020.002 ± 0.0010.006 ± 0.0020.01 ± 0.010.01 ± 0.010.002 ± 0.004

References

  1. Colombo, N.; Salerno, F.; Gruber, S.; Freppaz, M.; Williams, M.; Fratianni, S.; Giardino, M. Review: Impacts of permafrost degradation on inorganic chemistry of surface fresh water. Glob. Planet. Chang. 2018, 162, 69–83. [Google Scholar] [CrossRef]
  2. Kirpotin, S.; Berezin, A.; Bazanov, V.; Polishchuk, Y.; Vorobiov, S.; Mironycheva-Tokoreva, N.; Kosykh, N.; Volkova, I.; Dupré, B.; Pokrovsky, O. Western Siberia wetlands as indicator and regulator of climate change on the global scale. Int. J. Environ. Stud. 2009, 66, 409–421. [Google Scholar] [CrossRef]
  3. Kirpotin, S.; Polishchuk, Y.; Bryksina, N.; Sugaipova, A.; Kouraev, A.; Zakharova, E.; Pokrovsky, O.S.; Shirokova, L.; Kolmakova, M.; Manassypov, R.; et al. West Siberian palsa peatlands: Distribution, typology, cyclic development, present day climate-driven changes, seasonal hydrology and impact on CO2 cycle. Int. J. Environ. Stud. 2011, 68, 603–623. [Google Scholar] [CrossRef]
  4. Hjort, J.; Karjalainen, O.; Aalto, J.; Westermann, S.; Romanovsky, V.E.; Nelson, F.E.; Etzelmüller, B.; Luoto, M. Degrading permafrost puts Arctic infrastructure at risk by mid-century. Nat. Commun. 2018, 9, 1–9. [Google Scholar] [CrossRef] [PubMed]
  5. Polishchuk, Y.M.; Bogdanov, A.N.; Muratov, I.N.; Polishchuk, V.Y.; Lim, A.; Manasypov, R.M.; Shirokova, L.S.; Pokrovsky, O.S. Minor contribution of small thaw ponds to the pools of carbon and methane in the inland waters of the permafrost-affected part of the Western Siberian Lowland. Environ. Res. Lett. 2018, 13, 045002. [Google Scholar] [CrossRef] [Green Version]
  6. Polishchuk, Y.M.; Bogdanov, A.N.; Polishchuk, V.Y.; Manasypov, R.M.; Shirokova, L.S.; Kirpotin, S.N.; Pokrovsky, O.S. Size distribution, surface coverage, water, carbon, and metal storage of thermokarst lakes in the permafrost zone of the Western Siberia Lowland. Water 2017, 9, 228. [Google Scholar] [CrossRef]
  7. Serikova, S.; Pokrovsky, O.S.; Laudon, H.; Krickov, I.V.; Lim, A.G.; Manasypov, R.M.; Karlsson, J. High carbon emissions from thermokarst lakes of Western Siberia. Nat. Commun. 2019, 10, 1–7. [Google Scholar] [CrossRef] [Green Version]
  8. Marsh, P.; Russell, M.; Pohl, S.; Haywood, H.; Onclin, C. Changes in thaw lake drainage in the Western Canadian Arctic from 1950 to 2000. Hydrol. Process. 2009, 23, 145–158. [Google Scholar] [CrossRef]
  9. Rautio, M.; Dufresne, F.; Laurion, I.; Bonilla, S.; Vincent, W.F.; Christoffersen, K.S. Shallow freshwater ecosystems of the circumpolar Arctic. Écoscience 2011, 18, 204–222. [Google Scholar] [CrossRef]
  10. Grosse, G.; Goetz, S.; McGuire, A.D.; Romanovsky, V.E.; Schuur, E.A.G. Changing permafrost in a warming world and feedbacks to the Earth system. Environ. Res. Lett. 2016, 11, 040201. [Google Scholar] [CrossRef]
  11. Vonk, J.E.; Tank, S.E.; Bowden, W.B.; Laurion, I.; Vincent, W.F.; Alekseychik, P.; Amyot, M.; Billet, M.F.; Canário, J.; Cory, R.M.; et al. Reviews and syntheses: Effects of permafrost thaw on Arctic aquatic ecosystems. Biogeosciences 2015, 12, 7129–7167. [Google Scholar] [CrossRef] [Green Version]
  12. Bouchard, F.; Turner, K.W.; MacDonald, L.A.; Deakin, C.; White, H.; Farquharson, N.; Medeiros, A.S.; Wolfe, B.B.; Hall, R.I.; Pienitz, R.; et al. Vulnerability of shallow subarctic lakes to evaporate and desiccate when snowmelt runoff is low. Geophys. Res. Lett. 2013, 40, 6112–6117. [Google Scholar] [CrossRef]
  13. Manasypov, R.M.; Pokrovsky, O.S.; Kirpotin, S.N.; Shirokova, L.S. Thermokarst lake waters across the permafrost zones of western Siberia. Cryosphere 2014, 8, 1177–1193. [Google Scholar] [CrossRef] [Green Version]
  14. Arsenault, J.; Talbot, J.; Moore, T.R. Environmental controls of C, N and P biogeochemistry in peatland pools. Sci. Total Environ. 2018, 631–632, 714–722. [Google Scholar] [CrossRef]
  15. Arsenault, J.; Talbot, J.; Moore, T.R.; Beauvais, M.-P.; Franssen, J.; Roulet, N.T. The spatial heterogeneity of vegetation, hydrology and water chemistry in a peatland with open-water pools. Ecosystems 2019, 22, 1352–1367. [Google Scholar] [CrossRef]
  16. Pokrovsky, O.S.; Manasypov, R.M.; Loiko, S.V.; Krickov, I.A.; Kopysov, S.G.; Kolesnichenko, L.G.; Vorobyev, S.N.; Kirpotin, S.N. Trace element transport in western Siberian rivers across a permafrost gradient. Biogeosciences 2016, 13, 1877–1900. [Google Scholar] [CrossRef] [Green Version]
  17. Kokelj, S.V.; Zajdlik, B.; Thompson, M.S. The impacts of thawing permafrost on the chemistry of lakes across the subarctic boreal-tundra transition, Mackenzie Delta region, Canada. Permafr. Periglac. Process. 2009, 20, 185–199. [Google Scholar] [CrossRef]
  18. Pokrovsky, O.S.; Shirokova, L.S.; Kirpotin, S.N.; Audry, S.; Viers, J.; Dupré, B. Effect of permafrost thawing on organic carbon and trace element colloidal speciation in the thermokarst lakes of western Siberia. Biogeosciences 2011, 8, 565–583. [Google Scholar] [CrossRef] [Green Version]
  19. Shirokova, L.S.; Pokrovsky, O.S.; Kirpotin, S.N.; Desmukh, C.; Pokrovsky, B.G.; Audry, S.; Viers, J. Biogeochemistry of organic carbon, CO2, CH4, and trace elements in thermokarst water bodies in discontinuous permafrost zones of Western Siberia. Biogeochemistry 2013, 113, 573–593. [Google Scholar] [CrossRef]
  20. Shevchenko, V.P.; Pokrovsky, O.S.; Vorobyev, S.N.; Krickov, I.V.; Manasypov, R.M.; Politova, N.V.; Kopysov, S.G.; Dara, O.M.; Auda, Y.; Shirokova, L.S.; et al. Impact of snow deposition on major and trace element concentrations and elementary fluxes in surface waters of the Western Siberian Lowland across a 1700 km latitudinal gradient. Hydrol. Earth Syst. Sci. 2017, 21, 5725–5746. [Google Scholar] [CrossRef] [Green Version]
  21. Manasypov, R.M.; Shirokova, L.S.; Pokrovsky, O.S. Experimental modeling of thaw lake water evolution in discontinuous permafrost zone: Role of peat, lichen leaching and ground fire. Sci. Total Environ. 2017, 580, 245–257. [Google Scholar] [CrossRef]
  22. Osterkamp, T.E.; Viereck, L.; Shur, Y.; Jorgenson, M.T.; Racine, C.; Doyle, A.; Boone, R.D. Observations of thermokarst and its impact on boreal forests in Alaska, U.S.A. Arctic Antarct. Alp. Res. 2000, 32, 303–315. [Google Scholar] [CrossRef]
  23. Luoto, M.; Seppälä, M. Thermokarst ponds as indicators of the former distribution of palsas in Finnish Lapland. Permafr. Periglac. Process. 2003, 14, 19–27. [Google Scholar] [CrossRef]
  24. Bouchard, F.; Francus, P.; Pienitz, R.; Laurion, I. Sedimentology and geochemistry of thermokarst ponds in discontinuous permafrost, subarctic Quebec, Canada. J. Geophys. Res. Biogeosci. 2011, 116, G00M04. [Google Scholar] [CrossRef] [Green Version]
  25. Bouchard, F.; Francus, P.; Pienitz, R.; Laurion, I.; Feyte, S. Subarctic thermokarst ponds: Investigating recent landscape evolution and sediment dynamics in thawed permafrost of Northern Québec (Canada). Arct. Antarct. Alpine Res. 2014, 46, 251–271. [Google Scholar] [CrossRef] [Green Version]
  26. Bouchard, F.; MacDonald, L.A.; Turner, K.W.; Thienpont, J.R.; Medeiros, A.S.; Biskaborn, B.K.; Korosi, J.; Hall, R.I.; Pienitz, R.; Wolfe, B.B. Paleolimnology of thermokarst lakes: A window into permafrost landscape evolution. Arctic Sci. 2017, 3, 91–117. [Google Scholar] [CrossRef] [Green Version]
  27. Bouchard, F.; Proult, V.; Pienitz, R.; Antoniades, D.; Tremblay, R.; Vincent, W.F. Periphytic diatom community structure in thermokarst ecosystems of Nunavik (Québec, Canada). Arctic Sci. 2018, 4, 110–129. [Google Scholar] [CrossRef] [Green Version]
  28. Coulombe, O.; Bouchard, F.; Pienitz, R. Coupling of sedimentological and limnological dynamics in subarctic thermokarst ponds in Northern Québec (Canada) on an interannual basis. Sediment. Geol. 2016, 340, 15–24. [Google Scholar] [CrossRef]
  29. Yi, S.; Wischnewski, K.; Langer, M.; Muster, S.; Boike, J. Freeze/thaw processes in complex permafrost landscapes of northern Siberia simulated using the TEM ecosystem model: Impact of thermokarst ponds and lakes. Geosci. Model. Dev. 2014, 7, 1671–1689. [Google Scholar] [CrossRef] [Green Version]
  30. Czudek, T.; Demek, J. Thermokarst in Siberia and its influence on the development of lowland relief. Quat. Res. 1970, 1, 103–120. [Google Scholar] [CrossRef]
  31. Selroos, J.-O.; Cheng, H.; Vidstrand, P.; Destouni, G. Permafrost thaw with thermokarst wetland-lake and societal-health risks: Dependence on local soil conditions under large-scale warming. Water 2019, 11, 574. [Google Scholar] [CrossRef] [Green Version]
  32. Audry, S.; Pokrovsky, O.S.; Shirokova, L.S.; Kirpotin, S.N.; Dupré, B. Organic matter mineralization and trace element post-depositional redistribution in Western Siberia thermokarst lake sediments. Biogeosciences 2011, 8, 3341–3358. [Google Scholar] [CrossRef] [Green Version]
  33. Jorgenson, M.T.; Shur, Y. Evolution of lakes and basins in northern Alaska and discussion of the thaw lake cycle. J. Geophys. Res. Earth Surface 2007, 112, F02S17. [Google Scholar] [CrossRef]
  34. Hinkel, K.M.; Eisner, W.R.; Bockheim, J.G.; Nelson, F.E.; Peterson, K.M.; Dai, X. Spatial extent, age, and carbon stocks in drained thaw lake basins on the Barrow Peninsula, Alaska. Arct. Antarct. Alpine Res. 2003, 35, 291–300. [Google Scholar] [CrossRef] [Green Version]
  35. Matthews, J.A.; Dahl, S.O.; Berrisford, M.S.; Nesje, A. Cyclic development and thermokarstic degradation in the mid-alpine zone at Leirpullan, Dovrefjel, southern Norway. Permafr. Periglac. Process. 1997, 8, 107–122. [Google Scholar] [CrossRef]
  36. Ellis, C.J.; Rochefort, L.; Gauthier, G.; Pienitz, R. Paleoeco-logical evidence for transitions between contrasting landformsin a polygon-patterned High Arctic wetland. Arct. Antarct. Alpine Res. 2008, 40, 624–637. [Google Scholar] [CrossRef] [Green Version]
  37. Calmels, F.; Allard, M.; Delisle, G. Development and decay of a lithalsa in Northern Québec: A geomorphological history. Geomorphology 2008, 97, 287–299. [Google Scholar] [CrossRef]
  38. Grosse, G.; Jones, B.; Arp, C. Thermokarst Lakes, Drainage, and Drained Basins. In Treatise on Geomorphology, 3rd ed.; Shroder, J., Giardino, R., Harbor, J., Eds.; Academic Press: San Diego, CA, USA, 2013; Volume 8, pp. 325–353. [Google Scholar]
  39. Lenz, J.; Wetterich, S.; Jones, B.M.; Meyer, H.; Bobrov, A.; Grosse, G. Evidence of multiple thermokarst lake generations from an 11 800-year-old permafrost core on the northern Seward Peninsula, Alaska. Boreas 2016, 45, 584–603. [Google Scholar] [CrossRef] [Green Version]
  40. Manasypov, R.M.; Vorobyev, S.N.; Loiko, S.V.; Kritzkov, I.V.; Shirokova, L.S.; Shevchenko, V.P.; Kirpotin, S.N.; Kulizhsky, S.P.; Kolesnichenko, L.G.; Zemtzov, V.A.; et al. Seasonal dynamics of organic carbon and metals in thermokarst lakes from the discontinuous permafrost zone of western Siberia. Biogeosciences 2015, 12, 3009–3028. [Google Scholar] [CrossRef] [Green Version]
  41. Walter Anthony, K.M.; Anthony, P.; Grosse, G.; Chanton, J. Geologic methane seeps along boundaries of Arctic permafrost thaw and melting glaciers. Nat. Geosci. 2012, 5, 419–426. [Google Scholar] [CrossRef]
  42. Pokrovsky, O.S.; Shirokova, L.S.; Kirpotin, S.N.; Kulizhsky, S.P.; Vorobiev, S.N. Impact of western Siberia heat wave 2012 on greenhouse gases and trace metal concentration in thaw lakes of discontinuous permafrost zone. Biogeosciences 2013, 10, 5349–5365. [Google Scholar] [CrossRef] [Green Version]
  43. Pokrovsky, O.S.; Shirokova, L.S.; Manasypov, R.M.; Kirpotin, S.N.; Kulizhsky, S.P.; Kolesnichenko, L.G.; Loiko, S.V.; Vorobyev, S.N. Thermokarst lakes of Western Siberia: A complex biogeochemical multidisciplinary approach. Int. J. Environ. Stud. 2014, 71, 733–748. [Google Scholar] [CrossRef]
  44. Loiko, S.V.; Pokrovsky, O.S.; Raudina, T.V.; Lim, A.; Kolesnichenko, L.G.; Shirokova, L.S.; Vorobyev, S.N.; Kirpotin, S.N. Abrupt permafrost collapse enhances organic carbon, CO2, nutrient and metal release into surface waters. Chem. Geol. 2017, 471, 153–165. [Google Scholar] [CrossRef]
  45. Laudon, H.; Köhler, S.; Buffam, I. Seasonal TOC export from seven boreal catchments in northern Sweden. Aquat. Sci. 2004, 66, 223–230. [Google Scholar] [CrossRef]
  46. Pokrovsky, O.S.; Karlsson, J.; Giesler, R. Freeze-thaw cycles of Arctic thaw ponds remove colloidal metals and generate low-molecular-weight organic matter. Biogeochemistry 2018, 137, 321–336. [Google Scholar] [CrossRef]
  47. Ala-aho, P.; Soulsby, C.; Pokrovsky, O.S.; Kirpotin, S.N.; Karlsson, J.; Serikova, S.; Vorobyev, S.N.; Manasypov, R.M.; Loiko, S.; Tetzlaff, D. Using stable isotopes to assess surface water source dynamics and hydrological connectivity in a high-latitude wetland and permafrost influenced landscape. J. Hydrol. 2018, 556, 279–293. [Google Scholar] [CrossRef]
  48. Erwin, K.L. Wetlands and global climate change: The role of wetland restoration in a changing world. Wetl. Ecol. Manag. 2009, 17, 71–84. [Google Scholar] [CrossRef]
  49. Raudina, T.V.; Loiko, S.V.; Lim, A.G.; Krickov, I.V.; Shirokova, L.S.; Istigechev, G.I.; Kuzmina, D.M.; Kulizhsky, S.P.; Vorobyev, S.N.; Pokrovsky, O.S. Dissolved organic carbon and major and trace elements in peat porewater of sporadic, discontinuous, and continuous permafrost zones of western Siberia. Biogeosciences 2017, 14, 3561–3584. [Google Scholar] [CrossRef] [Green Version]
  50. Raudina, T.V.; Loiko, S.V.; Lim, A.; Manasypov, R.M.; Shirokova, L.S.; Istigechev, G.I.; Kuzmina, D.M.; Kulizhsky, S.P.; Vorobyev, S.N.; Pokrovsky, O.S. Permafrost thaw and climate warming may decrease the CO2, carbon, and metal concentration in peat soil waters of the Western Siberia Lowland. Sci. Total Environ. 2018, 634, 1004–1023. [Google Scholar] [CrossRef]
  51. Pokrovsky, O.S.; Manasypov, R.M.; Loiko, S.; Shirokova, L.S.; Krickov, I.A.; Pokrovsky, B.G.; Kolesnichenko, L.G.; Kopysov, S.G.; Zemtzov, V.A.; Kulizhsky, S.P.; et al. Permafrost coverage, watershed area and season control of dissolved carbon and major elements in western Siberian rivers. Biogeosciences 2015, 12, 6301–6320. [Google Scholar] [CrossRef] [Green Version]
  52. Krickov, I.V.; Lim, A.G.; Manasypov, R.M.; Loiko, S.V.; Shirokova, L.S.; Kirpotin, S.N.; Karlsson, J.; Pokrovsky, O.S. Riverine particulate C and N generated at the permafrost thaw front: Case study of western Siberian rivers across a 1700-km latitudinal transect. Biogeosciences 2018, 15, 6867–6884. [Google Scholar] [CrossRef] [Green Version]
  53. Frey, K.E.; McClelland, J.W.; Holmes, R.M.; Smith, L.C. Impacts of climate warming and permafrost thaw on the riverine transport of nitrogen and phosphorus to the Kara Sea. J. Geophys. Res. Biogeosci. 2007, 112, G04S58. [Google Scholar] [CrossRef]
  54. Frey, K.E.; Smith, L.C. Amplified carbon release from vast West Siberian peatlands by 2100. Geophys. Res. Lett. 2005, 32, L09401. [Google Scholar] [CrossRef] [Green Version]
  55. Vorobyev, S.N.; Pokrovsky, O.S.; Serikova, S.; Manasypov, R.M.; Krickov, I.V.; Shirokova, L.S.; Lim, A.; Kolesnichenko, L.G.; Kirpotin, S.N.; Karlsson, J. Permafrost boundary shift in Western Siberia may not modify dissolved nutrient concentrations in rivers. Water 2017, 9, 985. [Google Scholar] [CrossRef] [Green Version]
  56. Blois, J.L.; Williams, J.W.; Fitzpatrick, M.C.; Jackson, S.T.; Ferrier, S. Space can substitute for time in predicting climate-change effects on biodiversity. Proc. Natl. Acad. Sci. USA 2013, 110, 9374–9379. [Google Scholar] [CrossRef] [Green Version]
  57. Masing, V.; Botch, M.; Läänelaid, A. Mires of the former Soviet Union. Wetl. Ecol Manag. 2010, 18, 397–433. [Google Scholar] [CrossRef]
  58. Trofimova, I.E.; Balybina, A.S. Classification of climates and climatic regionalization of the West-Siberian plain. Geogr. Nat. Resour. 2014, 35, 114–122. [Google Scholar] [CrossRef]
  59. Serikova, S.; Pokrovsky, O.S.; Ala-Aho, P.; Kazantsev, V.; Kirpotin, S.N.; Kopysov, S.G.; Krickov, I.V.; Laudon, H.; Manasypov, R.M.; Shirokova, L.S.; et al. High riverine CO2 emissions at the permafrost boundary of Western Siberia. Nat. Geosci. 2018, 11, 825–829. [Google Scholar] [CrossRef] [Green Version]
  60. Pokrovsky, O.S.; Manasypov, R.M.; Loiko, S.V.; Shirokova, L.S. Organic and organo-mineral colloids in discontinuous permafrost zone. Geochim. Cosmochim. Acta 2016, 188, 1–20. [Google Scholar] [CrossRef]
  61. Brown, J.; Ferrians, O.J., Jr.; Heginbottom, J.A.; Melnikov, E.S. Circum-Arctic Map of Permafrost and Ground Ice Conditions; National Snow and Ice Data Center/World Data Center for Glaciology Digital Media: Boulder, CO, USA, 2001; pp. 28–44. [Google Scholar]
  62. Savchenko, N.V. Nature of lakes in subarctic of West Siberia. Geogr. Prir. Resur. 1992, 1, 85–92. (In Russian) [Google Scholar]
  63. Vasyukova, E.V.; Pokrovsky, O.S.; Viers, J.; Oliva, P.; Dupré, B.; Martin, F.; Candaudap, F. Trace elements in organic- and iron-rich surficial fluids of the boreal zone: Assessing colloidal forms via dialysis and ultrafiltration. Geochim. Cosmochim. Acta 2010, 74, 449–468. [Google Scholar] [CrossRef]
  64. Yeghicheyan, D.; Bossy, C.; Coz, M.B.L.; Douchet, C.; Granier, G.; Heimburger, A.; Lacan, F.; Lanzanova, A.; Rousseau, T.C.C.; Seidel, J.-L.; et al. A compilation of silicon, rare earth element and twenty-one other trace tlement concentrations in the natural river water reference material SLRS-5 (NRC-CNRC). Geostand. Geoanalytical Res. 2013, 37, 449–467. [Google Scholar] [CrossRef]
  65. De la Cruz, O.; Holmes, S. The duality diagram in data analysis: Examples of modern applications. Ann. Appl. Stat. 2011, 5, 2266–2277. [Google Scholar] [CrossRef] [PubMed] [Green Version]
  66. Bastviken, D.; Cole, J.; Pace, M.; Tranvik, L. Methane emissions from lakes: Dependence of lake characteristics, two regional assessments, and a global estimate. Glob. Biogeochem. Cycles 2004, 18, GB4009. [Google Scholar] [CrossRef]
  67. Juutinen, S.; Rantakari, M.; Kortelainen, P.; Huttunen, J.T.; Larmola, T.; Alm, J.; Silvola, J.; Martikainen, P.J. Methane dynamics in different boreal lake types. Biogeosciences 2009, 6, 209–223. [Google Scholar] [CrossRef] [Green Version]
  68. Wauthy, M.; Rautio, M.; Christoffersen, K.S.; Forsström, L.; Laurion, I.; Mariash, H.L.; Peura, S.; Vincent, W.F. Increasing dominance of terrigenous organic matter in circumpolar freshwaters due to permafrost thaw. Limnol. Oceanogr. Lett. 2018, 3, 186–198. [Google Scholar] [CrossRef] [Green Version]
  69. Peura, S.; Wauthy, M.; Simone, D.; Eiler, A.; Einarsdóttir, K.; Rautio, M.; Bertilsson, S. Ontogenic succession of thermokarst thaw ponds is linked to dissolved organic matter quality and microbial degradation potential. Limnol. Oceanogr. 2020, 65, S248–S263. [Google Scholar] [CrossRef]
  70. Shirokova, L.S.; Chupakov, A.V.; Zabelina, S.A.; Neverova, N.V.; Payandi-Rolland, D.; Causserand, C.; Karlsson, J.; Pokrovsky, O.S. Humic surface waters of frozen peat bogs (permafrost zone) are highly resistant to bio- and photodegradation. Biogeosciences 2019, 16, 2511–2526. [Google Scholar] [CrossRef] [Green Version]
  71. Babkina, E.A.; Leibman, M.O.; Dvornikov, Y.A.; Fakashchuk, N.Y.; Khairullin, R.R.; Khomutov, A.V. Activation of cryogenic processes in Central Yamal as a result of regional and local change in climate and thermal state of permafrost. Russ. Meteorol. Hydrol. 2019, 44, 283–290. [Google Scholar] [CrossRef]
  72. Xu, N.; Braida, W.; Christodoulatos, C.; Chen, J. A review of molybdenum adsorption on soils/bed sediments: Speciation, mechanisms and model applications. Soil Sediment Contam. Int. J. 2013, 22, 912–929. [Google Scholar] [CrossRef]
  73. Tournassat, C.; Tinnacher, R.M.; Grangeon, S.; Davis, J.A. Modeling uranium (VI) adsorption onto montmorillonite under varying carbonate concentrations: A surface complexation model accounting for the spillover effect on surface potential. Geochim. Cosmochim. Acta 2018, 220, 291–308. [Google Scholar] [CrossRef]
  74. Payandi-Rolland, D.; Shirokova, L.S.; Nakhle, P.; Tesfa, M.; Abdou, A.; Causserand, C.; Lartiges, B.; Rols, J.-L.; Guérin, F.; Bénézeth, P.; et al. Aerobic release and biodegradation of dissolved organic matter from frozen peat: Effects of temperature and heterotrophic bacteria. Chem. Geol. 2020, 536, 119448. [Google Scholar] [CrossRef]
  75. Chupakov, A.V.; Pokrovsky, O.S.; Moreva, O.Y.; Shirokova, L.S.; Neverova, N.V.; Chupakova, A.A.; Kotova, E.I.; Vorobyeva, T.Y. High resolution multi-annual riverine fluxes of organic carbon, nutrient and trace element from the largest European Arctic river, Severnaya Dvina. Chem. Geol. 2020, 538, 119491. [Google Scholar] [CrossRef]
  76. Vorobyev, S.N.; Pokrovsky, O.S.; Kolesnichenko, L.G.; Manasypov, R.M.; Shirokova, L.S.; Karlsson, J.; Kirpotin, S.N. Biogeochemistry of dissolved carbon, major, and trace elements during spring flood periods on the Ob River. Hydrol. Process. 2019, 33, 1579–1594. [Google Scholar] [CrossRef]
  77. Schuur, E.A.G.; McGuire, A.D.; Schädel, C.; Grosse, G.; Harden, J.W.; Hayes, D.J.; Hugelius, G.; Koven, C.D.; Kuhry, P.; Lawrence, D.M.; et al. Climate change and the permafrost carbon feedback. Nature 2015, 520, 171–179. [Google Scholar] [CrossRef]
  78. Biskaborn, B.K.; Smith, S.L.; Noetzli, J.; Matthes, H.; Vieira, G.; Streletskiy, D.A.; Schoeneich, P.; Romanovsky, V.E.; Lewkowicz, A.G.; Abramov, A.; et al. Permafrost is warming at a global scale. Nat. Commun. 2019, 10, 1–11. [Google Scholar] [CrossRef] [Green Version]
  79. Turetsky, M.R.; Abbott, B.W.; Jones, M.C.; Anthony, K.W.; Olefeldt, D.; Schuur, E.A.G.; Koven, C.; McGuire, A.D.; Grosse, G.; Kuhry, P.; et al. Permafrost collapse is accelerating carbon release. Nature 2019, 569, 32–34. [Google Scholar] [CrossRef] [Green Version]
  80. Anisimov, O.A.; Shiklomanov, N.I.; Nelson, F.E. Variability of seasonal thaw depth in permafrost regions: A stochastic modeling approach. Ecol. Model. 2002, 153, 217–227. [Google Scholar] [CrossRef]
  81. Pavlov, A.V.; Moskalenko, N.G. The thermal regime of soils in the north of Western Siberia. Permafr. Periglac. Process. 2002, 13, 43–51. [Google Scholar] [CrossRef]
  82. Anisimov, O.; Reneva, S. Permafrost and changing climate: The Russian Perspective. AMBIO A J. Human Environ. 2006, 35, 169–175. [Google Scholar] [CrossRef]
  83. Moskalenko, N.G. Permafrost and vegetation changes in the Nadym region of West Siberian northern taiga due to the climate change and technogenesis. Kriosfera Zemli 2009, 8, 18–23. (In Russian) [Google Scholar]
  84. Frey, K.E.; McClelland, J.W. Impacts of permafrost degradation on arctic river biogeochemistry. Hydrol. Process. 2009, 23, 169–182. [Google Scholar] [CrossRef]
  85. Anisimov, O.; Kokorev, V.; Zhil’tsova, Y. Temporal and spatial patterns of modern climatic warming: Case study of Northern Eurasia. Clim. Chang. 2013, 118, 871–883. [Google Scholar] [CrossRef]
  86. Walvoord, M.A.; Kurylyk, B.L. Hydrologic impacts of thawing permafrost—A review. Vadose Zone J. 2016, 15, 20. [Google Scholar] [CrossRef]
  87. Karlsson, J.M.; Lyon, S.W.; Destouni, G. Temporal behavior of lake size-distribution in a thawing permafrost landscape in Northwestern Siberia. Remote Sens. 2014, 6, 621–636. [Google Scholar] [CrossRef] [Green Version]
  88. Tank, S.E.; Lesack, L.F.W.; Hesslein, R.H. Northern delta lakes as summertime CO2 absorbers within the arctic landscape. Ecosystems 2009, 12, 144–157. [Google Scholar] [CrossRef]
Figure 1. Map of the study area in the Western Siberia Lowland (WSL), Russia. Color shading represents different permafrost zones of the WSL according to ref. [61]. Red squares indicate the studied sites. Panels (A), (B), (C1,C2), and (D1,D2) refer to the sites in the continuous, discontinuous, sporadic, and isolated permafrost zones, respectively. The inserts (A,B,C1,C2,D1,D2) are from Google Maps®.
Water 12 01830 g001
Figure 2. Dependence of the concentration of dissolved organic carbon (DOC) (A) and SO4 (B) in lake waters of the isolated permafrost zone on the water surface area (Kogalym).
Water 12 01830 g002
Figure 3. Dependence of the concentration of DOC (A) and N-NO3 (B) in lake waters of the sporadic permafrost zone on the water surface area (Khanymey).
Water 12 01830 g003
Figure 4. Dependence of the concentration of pH (A), Li (B), Mn (C), and Co (D) in lake waters of the discontinuous permafrost zone on the water surface area (Urengoy).
Water 12 01830 g004
Figure 5. Dependence of pH and element concentration in lake waters of continuous permafrost zone on the water surface area (Tazovsky): pH (A), Ca (B), Cu (C), Mo (D), Sr (E), Sb (F), and U (G).
Water 12 01830 g005
Figure 6. The ratio of concentrations of chemical elements between different hydrological seasons (summer/spring and autumn/summer): isolated (A), sporadic (B), discontinuous (C), and continuous (D) permafrost zones. The diagrams show elements with statistically significant differences recorded for at least one compared pair (p < 0.05).
Water 12 01830 g006
Figure 7. Increase in pH and concentrations of some chemical elements in different hydrological seasons in the permafrost profile of Western Siberia: pH (A), Mo (B), DIC (C), CO2 (D), Mg (E), Ca (F), Sr (G), and U (H).
Water 12 01830 g007
Figure 8. Decrease in concentrations of chemical elements during all three hydrological seasons across the permafrost profile of Western Siberia: SO4 (A), Cs (B), Pb (C), Cd (D), and Sb (E).
Water 12 01830 g008
Figure 9. Elements whose concentrations exhibited a maximum in the sporadic and discontinuous permafrost zones: DOC (A), Al (B), Cr (C), and Mn (D).
Water 12 01830 g009
Figure 10. Elements that showed a sharp increase in concentrations in the discontinuous and continuous permafrost zones during individual seasons: Si (A), K (B), and Zn (C).
Water 12 01830 g010
Figure 11. Seasonal increase in pools of chemical elements in thermokarst lakes in summer relative to spring, across the permafrost gradient of Western Siberia: DOC (A), DIC (B), Se (C), Li (D), B (E), Na (F), Mg (G), Al (H), Si (I), Ti (J), Cr (K), Ni (L), Sr (M), Zr (N), Sb (O), Nd (P), Th (Q), U (R), Ptot (S), and Ba (T). A value of 100% (Rsummer/spring = 1) means that the summer and spring periods exhibit the same pools of elements.
Water 12 01830 g011
Figure 12. Principal component analysis (PCA) (A) and HCA (B) treatment of dissolved elements and studied parameters of lake waters during all seasons.
Water 12 01830 g012
Table 1. Prediction of change in concentrations (factor of increase or decrease relative to the current state) of DOC, DIC, and trace elements in lake waters on climate change and 2° to 4° northward (N) shift of the permafrost zones. SC—specific conductivity; SUVA245—specific ultraviolet absorbance.
ElementContinuous
into
Discontinuous
Discontinuous
into
Sporadic
Sporadic
into
Isolated
ElementContinuous
into
Discontinuous
Discontinuous
into
Sporadic
Sporadic
into
Isolated
SC1.050.921.34Ga0.571.112.45
pH1.4610.99As2.170.710.97
CH40.211.964.21Se1.130.741.63
CO21.641.31.24Rb3.20.511.03
Cl0.741.320.9Sr3.31.731.05
SO42−1.760.490.43Y2.781.811.97
SUVA2450.980.991.24Zr2.510.844.22
DOC0.630.932.05Nb0.810.675.64
DIC3.551.151.23Mo4.841.081.99
P-PO40.941.251.59Cd0.350.871.04
N-NO33.210.161.43Sb1.020.690.92
N-NH40.140.533.48Cs0.40.252.46
Li3.11.030.98Ba6.841.861.66
B3.230.61.56La2.250.524.48
Na1.711.291.27Ce1.723.181.51
Mg9.860.970.99Pr3.072.131.97
Al0.541.372.4Nd3.142.051.98
Si0.92.630.77Sm1.762.31.23
Ptot0.961.314.93Eu4.931.591.56
K3.520.750.81Gd2.692.131.67
Ca5.281.531Tb2.771.761.76
Ti1.180.814.04Dy2.671.72.05
V1.810.841.65Ho2.571.72.2
Cr0.911.072.45Er2.61.822.11
Mn1.012.21.35Tm2.451.832.1
Fe1.841.751.19Yb2.551.891.92
Co1.872.291.87Lu2.611.981.81
Ni3.591.134.5Hf1.441.334.18
Cu2.171.591.34Pb0.390.811.02
Zn1.481.291.12Th2.021.113.45
U5.870.92.6

