Floating Ice Transport Conditions at the Cross-Sections Between Pier Columns in Open Ice-Water Two-Phase Flow Canals

1
State Key Laboratory of Simulation and Regulation of Water Cycle in River Basin, China Institute of Water Resources and Hydropower Research, Beijing 100038, China
2
School of Civil Engineering, Tianjin University, Tianjin 300072, China
*
Author to whom correspondence should be addressed.
†
Xiangpeng Mu and Juan Bao contributed equally to this work.
Water 2020, 12(6), 1813; https://doi.org/10.3390/w12061813
Submission received: 29 May 2020
/
Revised: 19 June 2020
/
Accepted: 22 June 2020
/
Published: 24 June 2020
Abstract
:Floating ice is easy to jam at the cross-sections contracted by bridge pier, gate pier, etc., in ice-water two-phase flow canals. To solve the problem, the critical hydraulic conditions of floating ice transport at the cross-sections between pier columns were explored in this study. Based on the generalized physical model of the cross-sections between pier columns of water transfer canals, the movement and transport characteristics of floating ice in front of the pier columns were studied under different hydraulic conditions and ice conditions, and the critical hydraulic conditions necessary for floating ice to pass through the cross-sections between pier columns were analyzed. Moreover, dimensional analysis and regression analysis were carried out in order to establish an empirical equation for calculating the critical water flow Fr (Froude number) for the floating ice to be transported through the cross-sections between pier columns, thus providing a basis for the ice jam risk assessment and hydraulic regulation of ice-water two-phase flow canals, as well as control of the emergent ice drainage of canals during freezing periods.
1. Introduction
Water transfer under ice cover is the most common mode of water transfer during winter at high latitudes. The thermal insulation provided by the ice cover prevents the formation of frazil-ice beneath it. In long-distance water transfer projects in China, e.g., South-to-North Water Diversion Middle Route Project, the Water Transfer Project from the Yellow River to Qingdao, the Emergent Water Transfer Project from the Yellow River to Tianjin, and the Water Transfer Project from Miyun to Beijing, as well as in the canal projects of northern Europe and Russia, water is transferred under ice cover in winter. A large number of theoretical research results and practical experiences have been obtained in the field of water transfer under ice cover worldwide [1,2,3,4,5,6]. Before the onset of winter, measures such as reducing the water flow Fr of the canal and setting up ice boom should be taken to promote the formation of ice cover as soon as possible during the freezing period. Once the ice cover has formed, as long as the discharge and the water level of the canal remain stable during the freezing period, the ice cover could be stabilized, thereby achieving safe water transfer throughout the freezing period. Therefore, water transfer under ice cover is a relatively reliable and safe way to transport water during freezing periods.
In northwestern China, however, there have been numerous canal projects in places such as Qinghai and Xinjiang, which failed to consider water transfer in winter at the start of construction. With the rapid economic and social development in these regions, the problem of water shortages in winter has become increasingly prominent. These water transfer canals have to cope with the problem of water transfer during freezing periods. In high-latitude, high-altitude areas such as Xinjiang and Qinghai, the maximum thickness of ice cover in winter reaches more than 1 m. If these canals adopt the conventional mode of transferring water under ice cover in winter, the water transfer capacity of these canals will be greatly reduced, making it difficult to meet the needs of urban water supply or water diversion for power generation. Additionally, in extremely cold weather, the ice can fill the entire canal, completely preventing it from transferring water. Hence, water transfer without ice cover is the only method applicable to wide-shallow canal projects in winter [7]. At present, the main techniques for achieving water transfer without ice cover include the thermal insulation method, the temperature-increase method, and the hydraulic regulation method [8]. The thermal insulation method consists of adding a thermal insulation cover to the canal in order to shield the water in the canal from the cold atmosphere outside; the temperature-increase method involves raising the temperature of the water by extracting groundwater alongside the canal and adding it to the canal. It is difficult to promote these methods on a large scale due to high renovation costs and limitations in underground water resources. Compared with the thermal insulation method and the temperature-increase method, the hydraulic regulation method is a more economical and feasible technical approach. This method consists of increasing the ice transport capacity of a canal through hydraulic regulation, i.e., preventing the floating ice from blocking any section of the canal and enabling the ice to be transferred downstream along with the water. For long-distance wide-shallow water transfer canals, ice-water two-phase flow is a comparatively economical and feasible water transfer technology during freezing periods. Reasonable hydraulic regulation can realize safe ice-water two-phase flow in winter without requiring the engineering transformation of existing wide-shallow water canals, thereby alleviating the pressure of limited regional water supplies and saving investment in engineering transformation, which can yield substantial social and economic benefits.
For ice-water two-phase flow, since the water lacks thermal insulation of ice cover, the canal water surface will continue to lose heat, and new frazil-ice will be generated continuously. Therefore, compared with water transfer under the ice cover, ice-water two-phase flow is much more difficult to regulate and runs a higher risk of ice flood disaster. Prototype observations indicate that the density of frazil slush floating on the water surface can reach a maximum of 90–100%, and the thickness of the floating ice is 20–30 cm [9,10]. When the amount of ice exceeds the ice transport capacity of the canal’s cross-section, the floating ice will stagnate and accumulate on the water surface, further blocking the canal and forming an ice jam. Consequently, the ice and water flowing downstream subsequently, with nowhere to go, will overflow the banks or even breach, triggering an ice flood disaster. For canals, the cross-sections contracted by bridge pier, gate pier, etc., have an even greater impact on blocking floating ice than bends. Ice bridges can easily form in front of gate piers and bridge piers, which will then develop into ice jams. This conclusion has been widely recognized internationally [11]. Therefore, it is assumed that the ice transport capacity of the narrow cross-sections between pier columns is the bottleneck of the entire canal that determines the lower limit of the ice transport capacity of a canal project. Hence, the movement and transport characteristics of floating ice at the cross-sections between pier columns are the key factors to be explored in the hydraulic regulation of ice-water two-phase flow canals.
Regarding the interaction between bridge piers and floating ice, numerous studies have been carried out on the influence of the pier columns on the formation of ice bridges and the initiation of ice jams. Urroz et al. [12] conducted a test to determine the effect on ice conveyance of bridge-pier position around a wavelength of the sinuous flume, finding that deleterious effects on ice conveyance in sinuous rivers of bridge crossings can be minimized by locating bridges at the apex of bends, rather than along straight reaches between bends. Using a model test, Tyminski [13] confirmed that streamlined bridge piers cause smaller changes to the velocity field than rectangular, minimizin the water swelling in front of the pier and exhibit the best ice-passing capacity. Considering shape of ice floes, ice cover roughness and clearance between bridge piers, Carstensen [14] carried out a model experiment in a hydraulic flume to study the initial ice arching formation of non-uniform fragmented ice floes at the upstream faces of edged and rounded bridge piers. In China, Wang et al. [15] explored the influence of piers on the evolution of ice jams as well as changes in the thickness of ice jams under the influence of piers using an S-shaped water flume.
Based on the similarity principle of ice movement, Yu et al. [16] constructed the irregularly-shaped model ice using paraffin with mixed with a little gypsum powder, in order to simulate ice blocking around the bridge in thawing period and, more specifically, to study the effect by the Baoshen Railway Bridge to be built across the Yellow River on water level. As for the Yellow River highway Bridge, Hou et al. [17] investigated the influence of bridge piers on ice jams and water level in the river section around this bridge and analyzed ice jam mechanisms. Using numerical simulation, Lu et al. [18] studied the influence of bridge piers on the water levels of ice jams during the freeze-up period. Wu et al. [19] probed the ice-passing capacity of the cross-sections between pier columns under different hydraulic conditions, ice-block sizes and ice amounts, establishing a regression equation through the relevant dimensional analysis in order to obtain the relationship between the amount of ice discharged from the cross-sections between pier columns and the Froude number based on block thickness, Ft. Judging from the current research results worldwide, the ice-hydraulic studies at the cross-sections between bridge piers have mostly been based on water transfer under ice cover, with an emphasis on the blocking effect of bridge piers on ice cover and the impacts of ice jams on water level. There have been few studies, however, on the ice transport capacity and ice-passing conditions of bridge pier sections with ice-water two-phase flow as the background. Research on the ice transport capacity of the cross-sections between pier columns is still in its early stages, and the results are not yet sufficient to support the safe operation of the ice-water two-phase flow canal, an insufficiency that restricts the promotion and application of the ice-water two-phase flow mode to some extent.
In this study, by means of physical model test, the model ice made of paraffin was used to investigate the movement and transport mechanisms of floating ice through the cross-sections between pier columns, the relationship between the critical hydraulic conditions necessary for floating ice to pass through the cross-sections between pier columns and water depth, the floating ice parameters, and the way ice makes contact with pier columns. In addition, the dimensional analysis method was used to obtain the empirical equation for calculating the critical water flow Fr required for the floating ice to be transported through the cross-sections between pier columns. As the relationship for assessing the ice jam risks of the ice-water two-phase flow canal, this empirical equation provides a scientific basis for the hydraulic regulation of long-distance water transfer canals under the ice-water two-phase flow mode.
2. Materials and Methods
2.1. Test Equipment
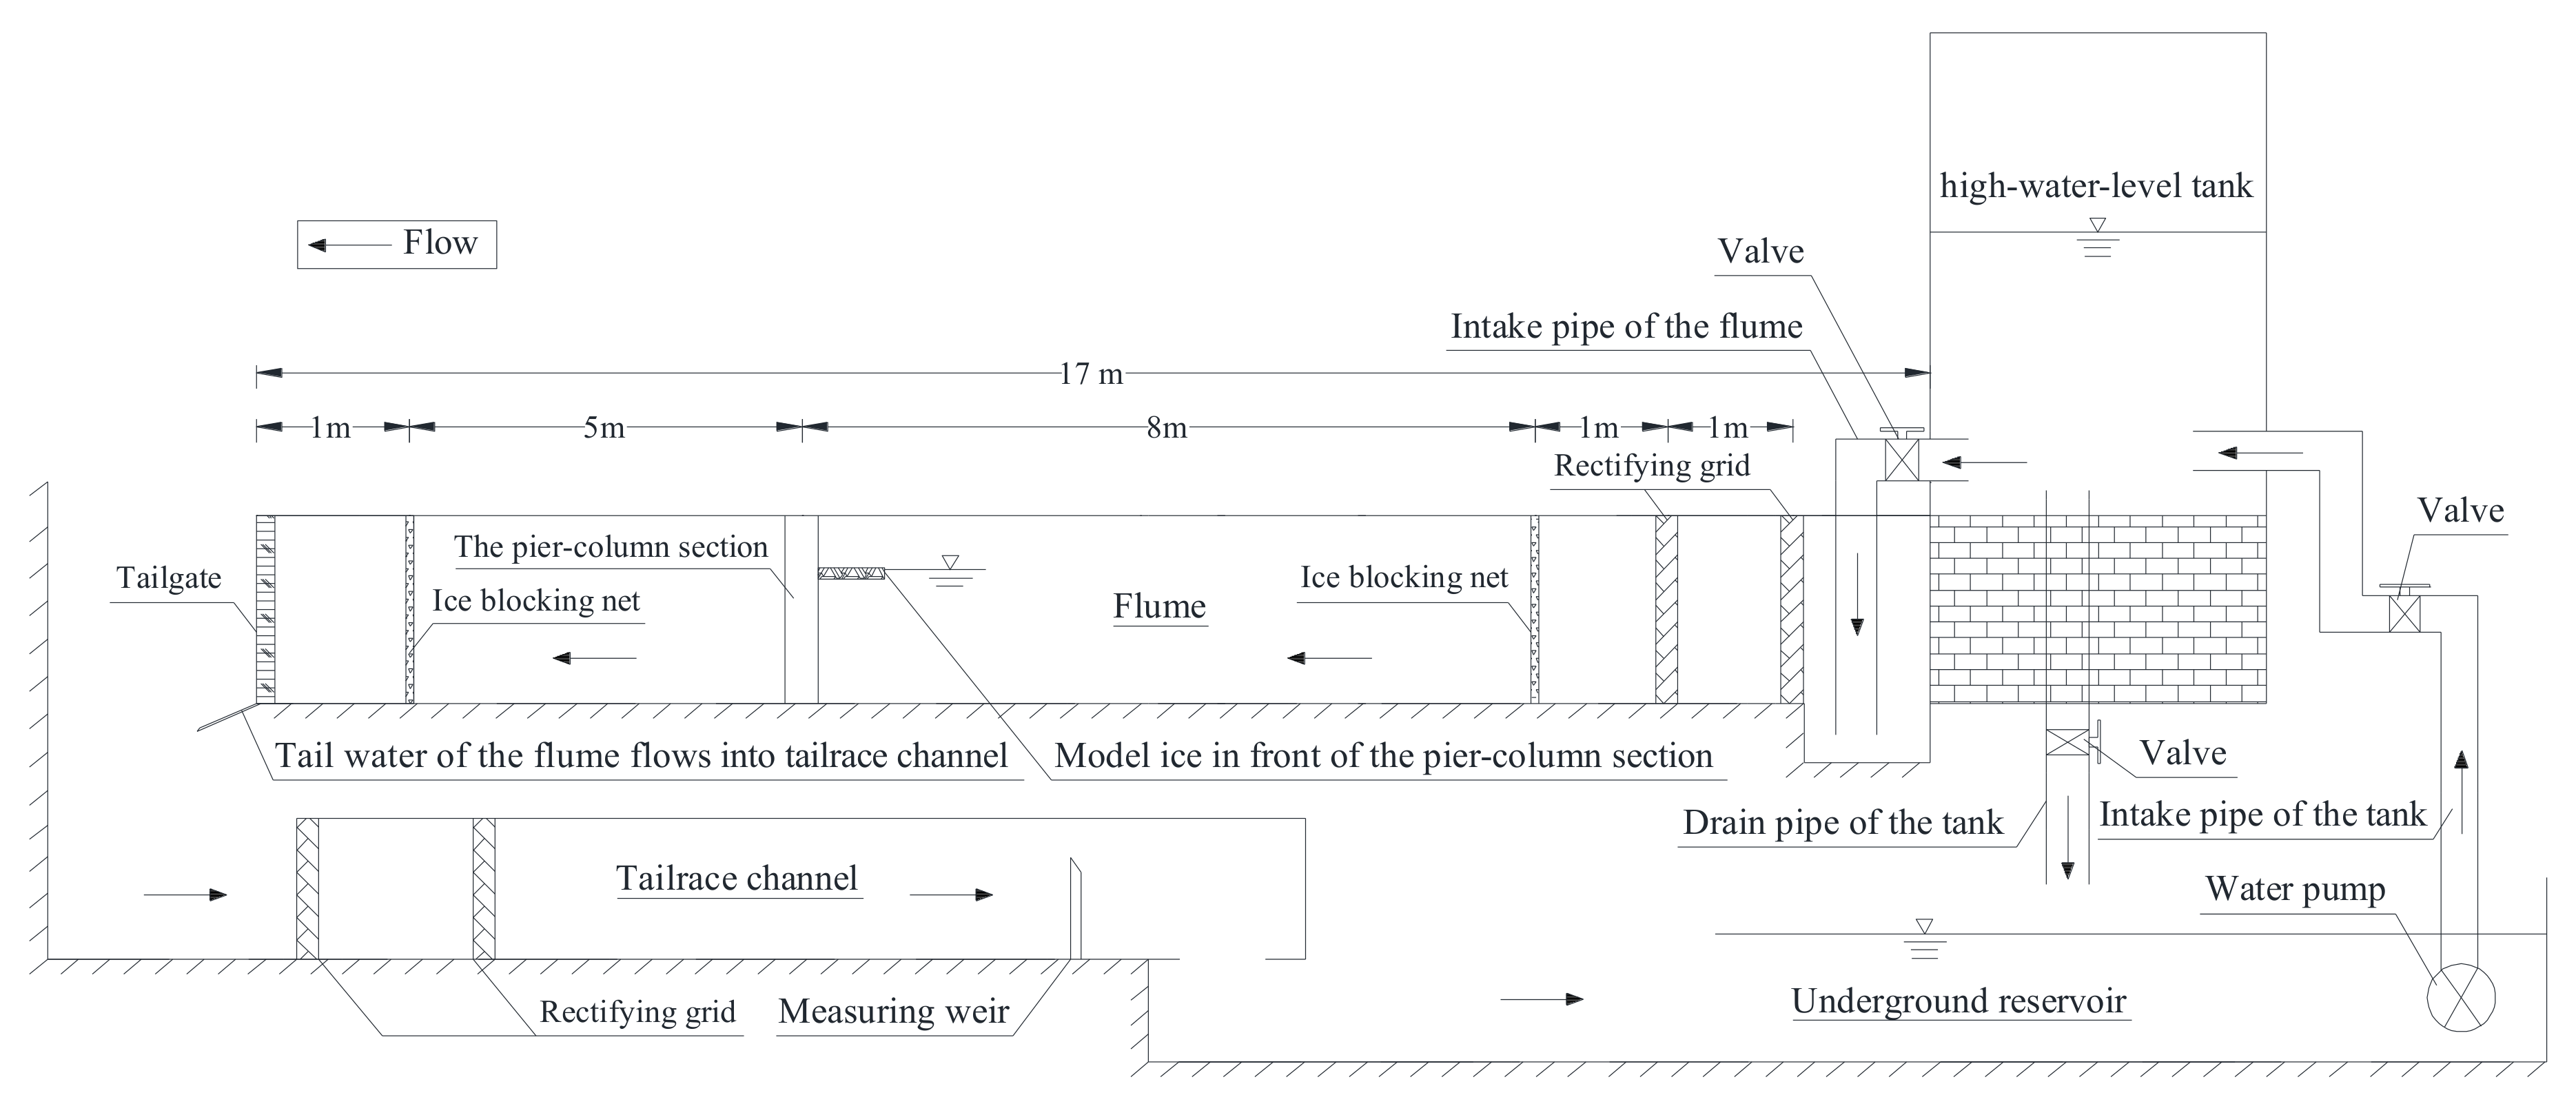
The experiment was carried out in an indoor test flume. With a length of 17 m, a width of 0.8 m, and a bottom slope of 0.5%, the flume was made of PVC boards at the side walls and the bottom plate. Water was diverted from an upstream high-water-level tank through a steel diversion pipe equipped with a flow adjustment valve. The discharge of the flume was controlled by a water supply pump, an adjustable overflow weir in high water tank, a water-out fine-tuning valve of the high-water-level tank, and a flow adjustment valve for the diversion pipe of the flume. A rectifying grid was situated at the head of the flume in order to smooth the water flow. The downstream section of the flume was equipped with a tailgate to control the water depth in the flume. The flume could handle a maximum water depth of 0.65 m. The specific testing apparatus used in this study is shown in Figure 1.
Four cylindrical model pier columns, namely, 2 middle piers and 2 semi-circular side piers, were placed 6 m from the outlet of the flume and 8 m from the upstream rectifying grid. The diameter of the middle piers was 10.0 cm, the radius of side piers was 5.0 cm, and the clear width between the pier columns was 16.7 cm.
2.2. Model Ice
This experiment attempted to simulate the movement of floating ice in front of the pier columns and study the critical hydraulic conditions required for the ice to pass through the cross-sections between pier columns. Therefore, the model ice was required to meet the kinematic similarity. In-depth studies have been carried out on the similarity laws of model ice [20,21,22]. In order to effectively simulate the movement of the floating ice, an important condition is that the flow in model and prototype should have the same water flow Fr, i.e., the gravity similarity should be meet. In addition, the density of the model ice should be equal to that of natural ice. In this test, the model ice was made of industrial semi-refined paraffin and had a density of 0.903 g/cm3, which is basically the same as that of natural ice, making it possible to accurately simulate the flipping and diving of floating ice.
2.3. Test Methods
Floating ice originates from ice floes or ice trays formed by the adhesion of frazil-ice or from shattered shore ice or ice cover; thus, most floating ice is irregularly shaped. In order to more efficiently analyze the influence of the planar size of ice on the transport of ice through the cross-sections between pier columns, the shapes of natural floating ice were generalized to square-shaped model ice in this test. As for the size of the model ice, it was required that the plane side length of the ice should be equal to or greater than the clear width between the pier columns, so that when the velocity or critical water flow Fr was relatively small, the model ice of various sizes would jam in front of the pier columns. The critical conditions required for the floating ice to pass through the cross-sections between pier columns were explored by varying the hydraulic conditions. Based on this, model ice blocks of 4 planar sizes were simulated, with plane side lengths (L) of 16.0, 20.0, 24.0, and 32.0 cm and ratios of the plane side length of the ice block to the clear width between the pier columns (hereafter referred to as the ratio of length to width L/D) of 0.96, 1.20, 1.44, and 1.92, respectively. Different from sea ice, floating ice in canals is thin, with a thickness (t) that is much smaller than its planar size. In this study, model ice blocks of 2 thicknesses, 3 cm and 6 cm, were tested.
When the floating ice reaches and stagnates in front of the pier columns, the front edge effect and the Venturi effect will be caused on the bottom surface of the floating ice because of the velocity difference between the water flow and the floating ice, thus resulting in the pressure decrease on the bottom surface of the floating ice. Different from rivers, secondary currents will be caused for the effect of the wall in water transfer canals, when the B/H of the canal is small to a certain extent (B is the water surface width, H is the water depth). Although the secondary current in the vertical main flow direction is smaller than the main flow in magnitude, it will show a significant three-dimensional property, which is typically represented by the velocity dip phenomenon, i.e., the position whereby the maximum velocity appears below the water surface [23]. From this point of view, the laboratory flume is similar to the actual canal. However, there is no quantitative evaluation about how the dip phenomenon affects the Venturi effect and the front edge effect on the bottom of the ice block. In previous studies, critical flow Fr was always used as the criterion when studying the floating ice losing stability at the front edge of the ice cover or passing through the cross-sections between pier columns. The proposed critical Fr formula has not yet included the influence of B/H; the main factor is still the ratio of ice size to water depth [24,25]. Therefore, based on previous research results, this study also used critical Fr as the critical index of floating ice passing through the cross-sections between pier columns.
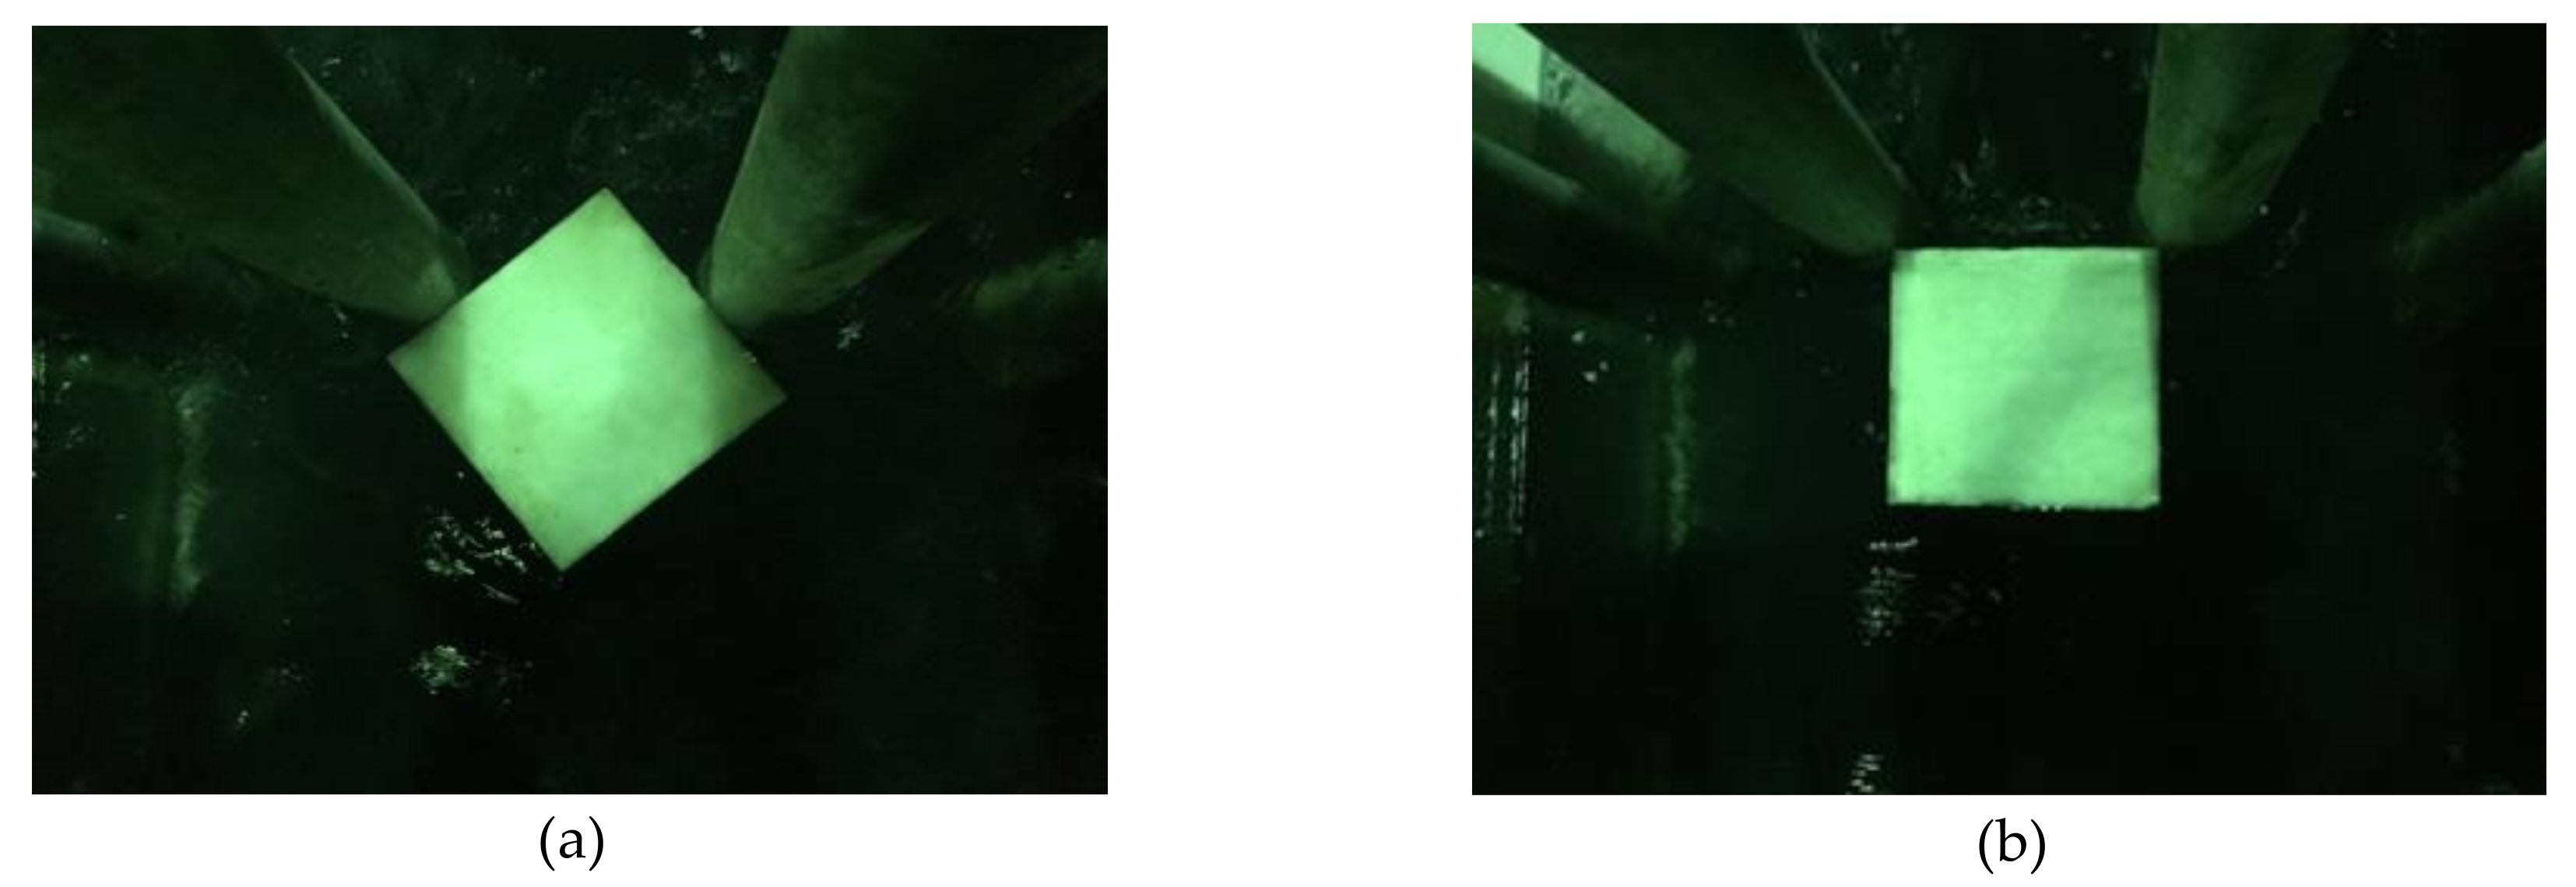
Using the testing apparatus, conditions such as water flow velocity and water depth, size of the model ice, and the angle at which the ice blocks made contact with the pier columns (see Figure 2) were varied, allowing observation of the movement state and process of the floating ice at the cross-sections between the pier columns (e.g., blocking, accumulation, flipping, diving, and passing) to find the critical condition of model ice can pass through the cross-sections between pier columns and measure the critical Fr. The test conditions are shown in the Appendix A.
The water flow in the flume had become very smooth after passing through the rectifying grid. The upstream ice blocking net was set in the downstream of the rectifying grid. During the test, the model ice was put in front of the upstream ice blocking net and flowed downstream when the net was lifted. There was enough distance between the rectifying grid and the downstream piers to ensure that the ice block had a velocity that was basically consistent with the water flow before reaching the piers. The critical hydraulic condition of a single ice block passing through the gap between two middle piers was studied only in this study.
The discharge of the flume was measured by the thin-walled measuring weir at the end of the tailrace channel. The water depth was measured with steel ruler, and measurement section was in the upstream of the piers and 8 cm away from the pier column section. Four points along the vertical flow direction of the measured section were selected for measurement, and the average value of the water depth of the four measuring points was taken as the final water depth. The average flow velocity of the cross section was obtained from the relationship between the discharge and the water depth, and the water flow Fr was calculated based on the average flow velocity and the average water depth of the cross section. The ice transport tests were all carried out in constant flow states. When using a steel ruler to measure the water depth, in order to avoid the turbulence in the water surface caused by the local flow state, the scale of the steel ruler was recorded by photographing. The continuous shooting speed of the camera was 10 photos per second; the shoot lasted 3 s, and the average value of measurement result was taken as the final measured water depth at this time. In fact, the water flow in the water depth measurement section was smooth during the test, and there was basically no turbulence in the water surface. However, it is necessary to adopt the method of continuously collecting water level fluctuations in the case of large turbulence in the local flow state.
In order to find the critical condition of ice passing through the cross-sections between pier columns more quickly and accurately, the test was divided into two parts: pre-test and formal test.
2.3.1. Pre-Test
Step 1: The inflow rate of the flume was adjusted to the set value according to the test conditions in Appendix A.
Step 2: By adjusting the opening degree of the tailgate at the end of the flume to control the water depth of the pier column section, the water flow Fr of the measured water depth section in front of the pier column reached 0.09 (this value is close to the critical value of floating ice flipping and diving at the front edge of the ice cover, but it is not enough to flip and dive in front of the piers).
Step 3: The model ice block was placed between the two middle piers according to a contact mode as shown in Figure 2, so that the model ice block was stuck between the two pier columns as shown in Figure 2.
Step 4: The opening degree of the tailgate at the end of the flume was increased in stages, so that the water depth of the measured section in front of the piers kept decreasing and the water flow Fr kept increasing until the ice flipped, dived and passed through the cross-sections between pier columns. At this time, the tailgate opening, the water depth in front of the piers and the water flow Fr were recorded.
2.3.2. Formal Test
Step 1: The critical opening degree of the tailgate obtained in the pre-test was moderately closed, to increase the water depth in front of the piers by 2 cm on the basis of the critical water depth obtained in the pre-test.
Step 2: After the hydraulic transition process was over and the flume entered the constant flow state, a single ice block in front of the upstream ice blocking net was released, and the ice block would flow downstream to the pier column section. When the model ice was put into the water, the angle of the model ice should be cared, so as to achieve the two contact modes between the ice block and the piers. Since the water flow was very smooth after passing through the rectifying grid, and the secondary current in the vertical main flow direction was smaller than the main flow in magnitude, the ice block would not deviate from the forward direction due to rotation in the downstream process, which could ensure that the model ice obtained the predetermined contact mode with the piers when it reached the pier column section. The state of the ice block at the cross-sections between pier columns was observed. If the ice block was still stuck between the pier columns, the opening degree of the tailgate would be increased to reduce the water depth in front of the piers by 0.5cm.
Step 3: The above Step 2 was repeated until the ice block flipped, dived, and passed through the cross-sections between pier columns. The water depth in front of the piers and the water flow Fr at this time were recorded, that is, the water flow Fr at this time was considered as the critical value of the ice block passing through the cross-sections between pier columns.
Additionally, under various discharge and water depth conditions of the test, every time the water depth in front of the piers decreased by 0.5 cm, the Fr increased by 0.002~0.004. In terms of the operation regulation of water transfer canals during freezing periods, the accuracy of critical flow Fr to 0.01 can meet the requirements of operation control. For example, the commonly used first critical Fr is about 0.06, and the second critical Fr is about 0.08~0.09, etc. Therefore, it is convincing to find the critical Fr of the floating ice passing through the cross-sections between pier columns by increasing the water depth by 0.5 cm each time, which can meet the accuracy requirements. During the formal test, after the water depth of the pier column section was reduced each time, the flume would enter the state of hydraulic transition process, and only after the hydraulic transition process was over and the water flow entered the constant flow state, could the model ice be put. Since the discharge of the flume was controlled by the intake pipe of the upstream high-water-level tank, it could keep the inflow constant in each set of test conditions. During the transition process, the water level in the flume and the overflow rate of the measuring weir at the end of the tailrace channel would fluctuate, so it was necessary to continuously observe the water depth in front of the piers and the overflow rate of the measuring weir at the end of the tailrace channel to judge whether the flume had entered the constant flow state. Concretely, the change of water depth and overflow rate were observed every 1 min; usually 3–10 min after adjusting the water depth, the flume had entered the constant flow state.
3. Results and Analysis
3.1. Movement Pattern of Ice Blocks at the Cross-Sections Between Pier Columns
Since the plane side lengths of the ice blocks of different sizes were equal to or greater than the clear width between the pier columns, when the water flow velocity or water flow Fr was small, the model ice blocks flowing downstream would be blocked by the pier columns, thereby stagnating in front of the pier columns. Similar to the force applied on the floating ice at the front edge of the ice cover, stagnated ice blocks impeded by pier columns will be affected by the front edge effect and the Venturi effect under the action of water flow [26], i.e., the water flow will be separated and accelerated at the front edge of the stagnated ice blocks, forming a negative pressure area within a certain range at the front edge of the bottom of the ice block. In addition, when the ice is floating on the water surface, the portion immersed in the water reduces the cross-section of the water, which accelerates the average water flow velocity of the water at the bottom of the ice block and further reduces the pressure at the bottom of the floating ice. Influenced by the front edge effect and the Venturi effect, when the flow conditions cause the total negative pressure generated at the bottom of the ice block to exceed the buoyancy of the ice block, or as the generated torque destabilizes the ice block, the ice block begins to dive or flip.
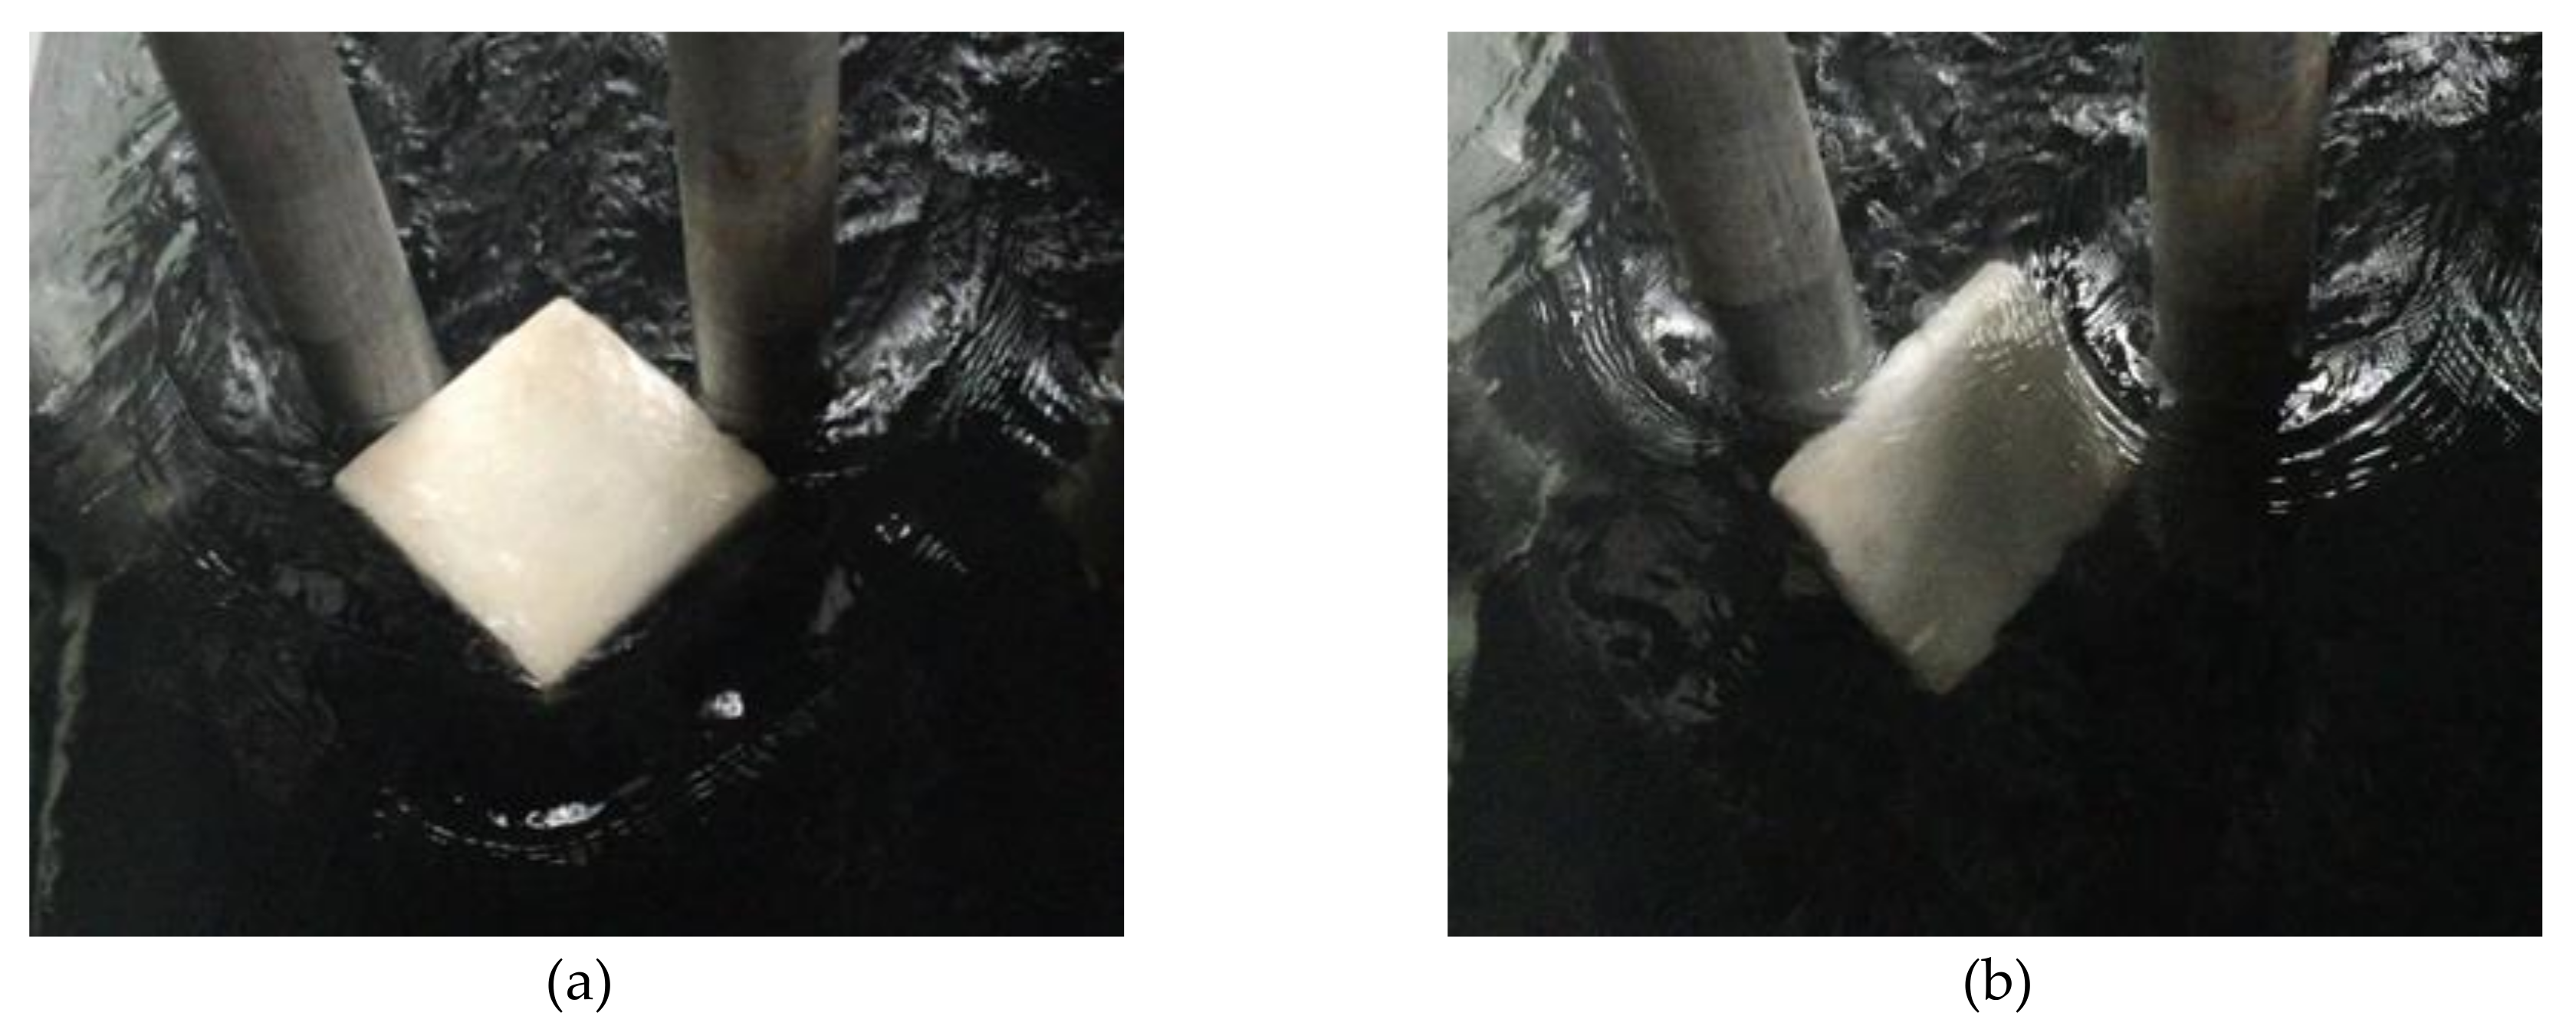
According to the test results, when the water flow conditions do not reach the levels that cause the ice blocks to flip and dive in front of the pier columns, i.e., when the water flow velocity or Fr of the flume is relatively small, the ice blocks will stagnate between the pier columns and their state will not change over time (see Figure 3a). When the water flow velocity or Fr increases to a certain level and exceeds a certain critical value, the ice blocks will be deflected vertically under the influence of the front edge effect and the Venturi effect, and descend through the gap between the pier columns (see Figure 3b).
Given the same flow conditions, ice blocks of different sizes have different front edge effects, Venturi effects, and critical hydraulic parameters for passing through the cross-sections between pier columns. Compared with the water flow velocity, the critical water flow Fr, as a dimensionless hydraulic parameter combining the effects of water flow velocity and water depth, is more suitable as a critical parameter for judging whether an ice block can pass through the cross-sections between pier columns. In this study, the key factors affecting the critical Fr of ice transport at the cross-sections between pier columns were analyzed, as well as the ways in which they influence the critical Fr.
3.2. Relationship Between the Critical Fr and Water Depth H, Ice Thickness–Water Depth Ratio t/H of Floating Ice Passing Through the Cross-Sections Between Pier Columns
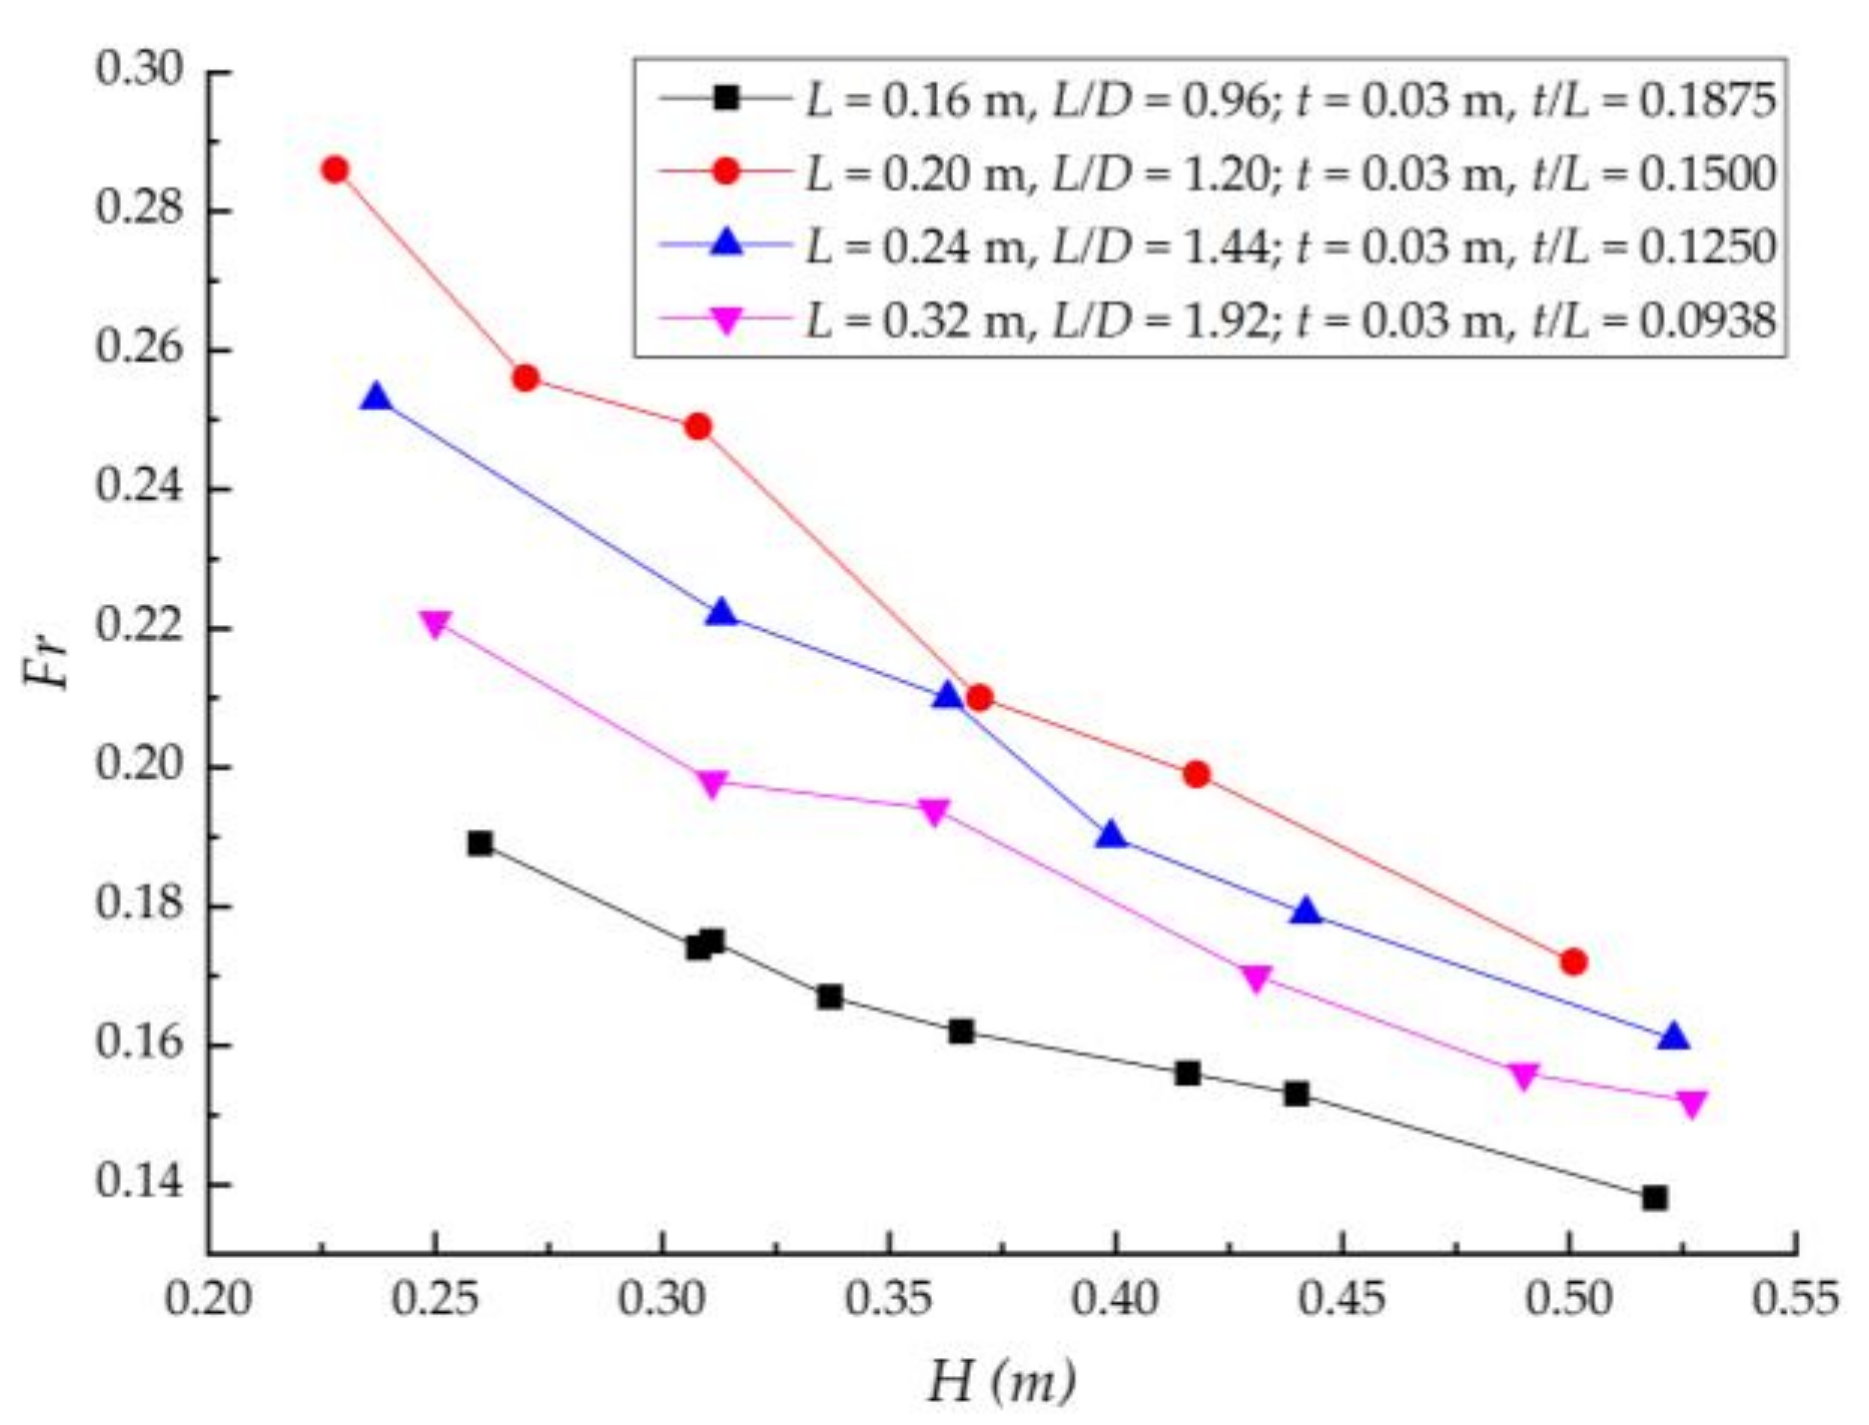
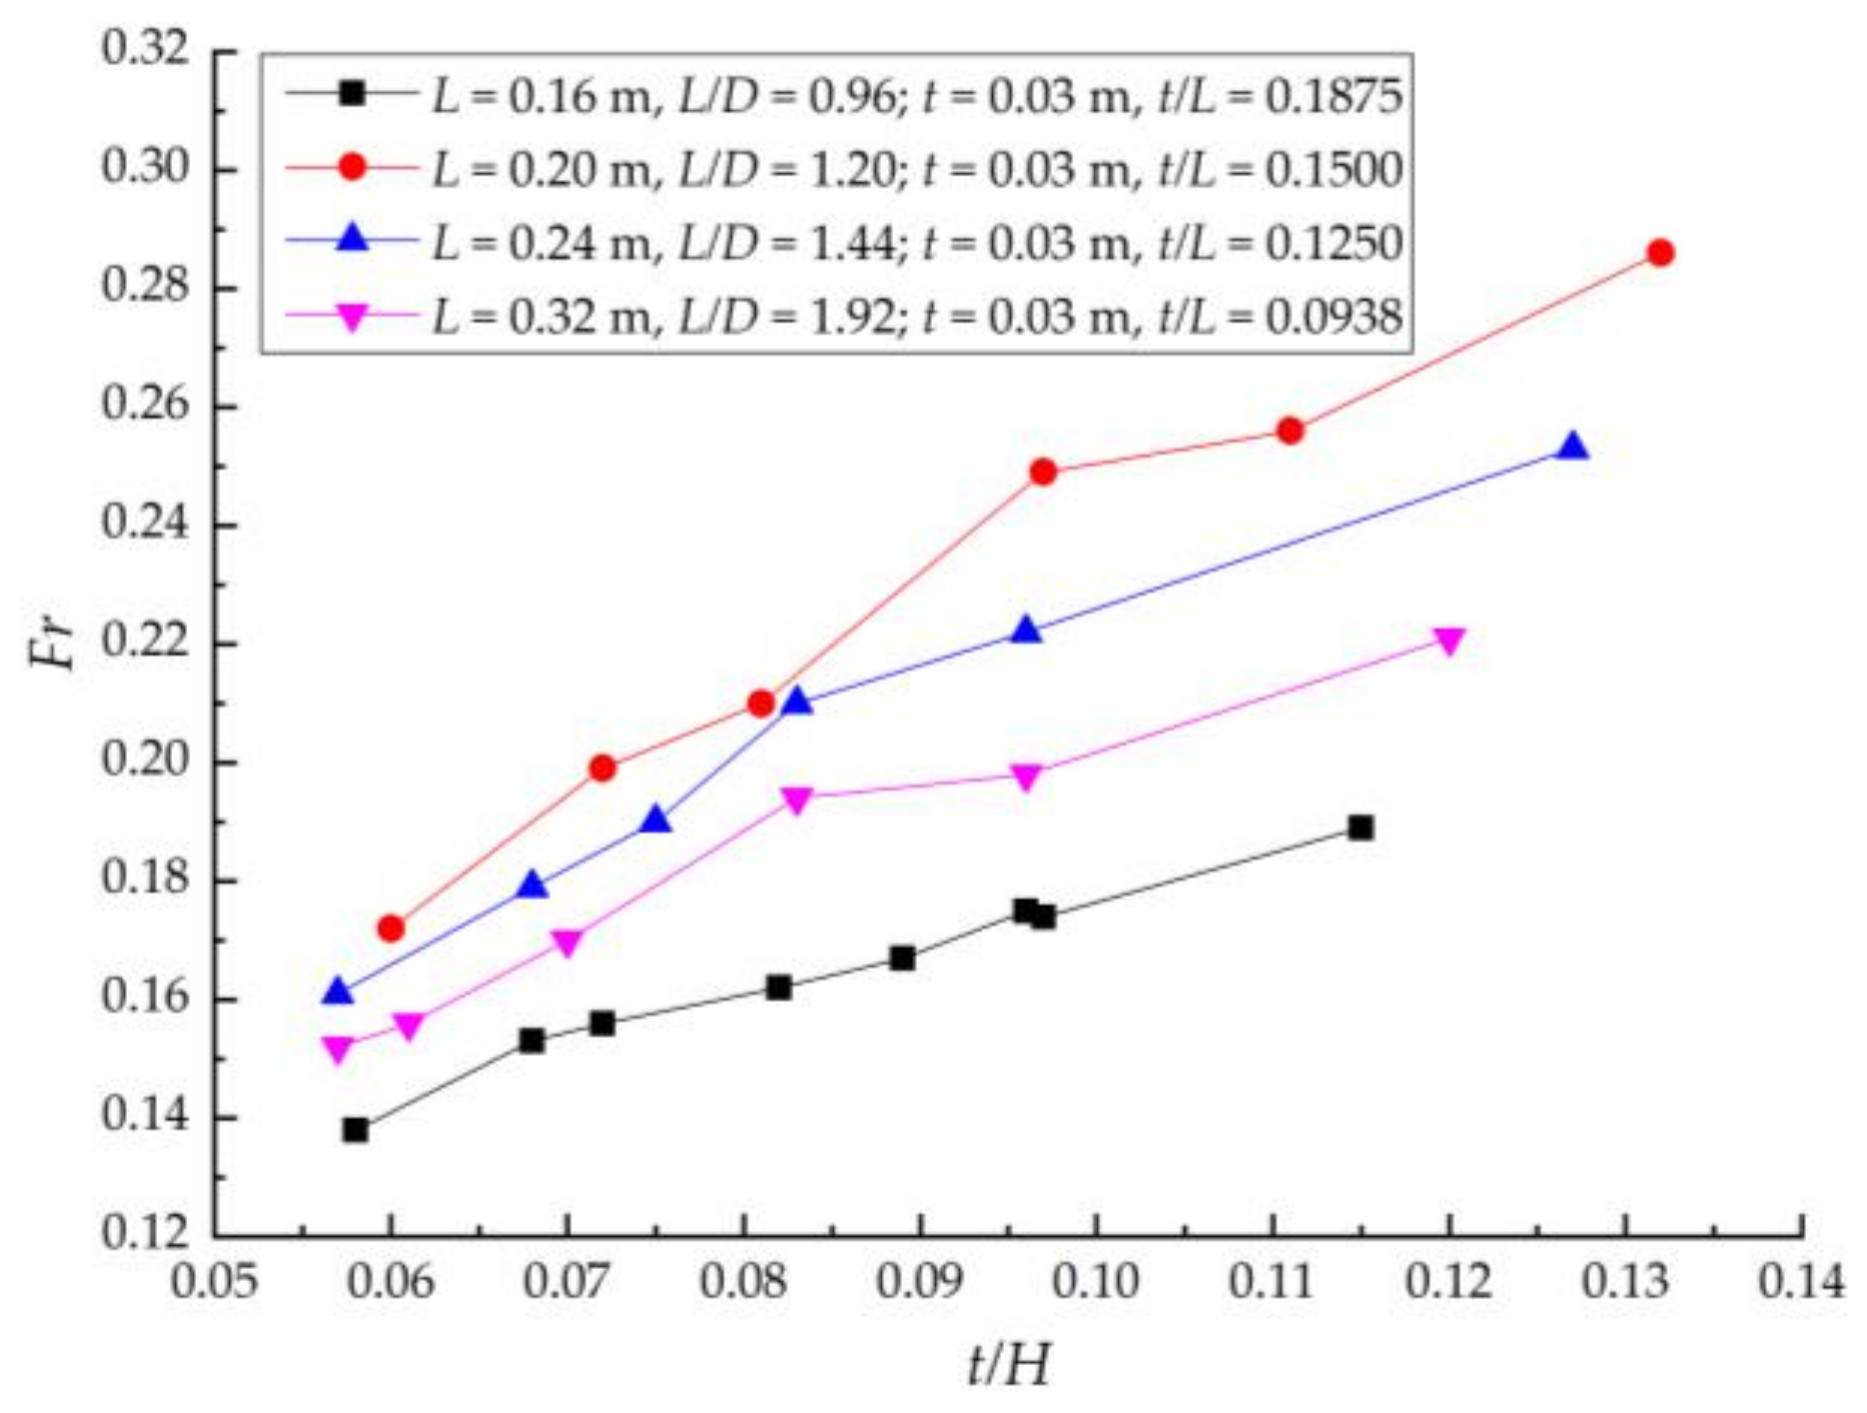
Figure 4 and Figure 5 show the test results concerning the critical Fr required for floating ice to pass through the cross-sections between pier columns at different water depths when 3 cm-thick floating ice of different planar sizes makes contact with the pier columns at a 45° angle (see Figure 2a). Note: Unless otherwise specified, the critical Fr required for floating ice to pass through the cross-sections between pier columns is hereafter referred to as the critical Fr.
As shown in Figure 4, given the same planar ice block size, the critical Fr decreases with increasing water depth, H. For instance, taking an ice block with L = 0.16 m as an example, its critical Fr decreases from 0.189 to 0.138 as the water depth increases from 0.260 m to 0.519 m, which is basically an inverse relationship. Figure 5 shows the relationship between the critical Fr of ice blocks of different planar sizes and the ratio of ice thickness to water depth, t/H (hereafter referred to as the ratio of thickness to depth). As indicated by this figure, given the same planar size, as t/H increases, the critical Fr increases, displaying an essentially positive proportional relationship. For example, again taking an ice block with L = 0.16 m, when the ratio of thickness to depth increases from 0.058 to 0.115, its critical Fr increases from 0.138 to 0.189.
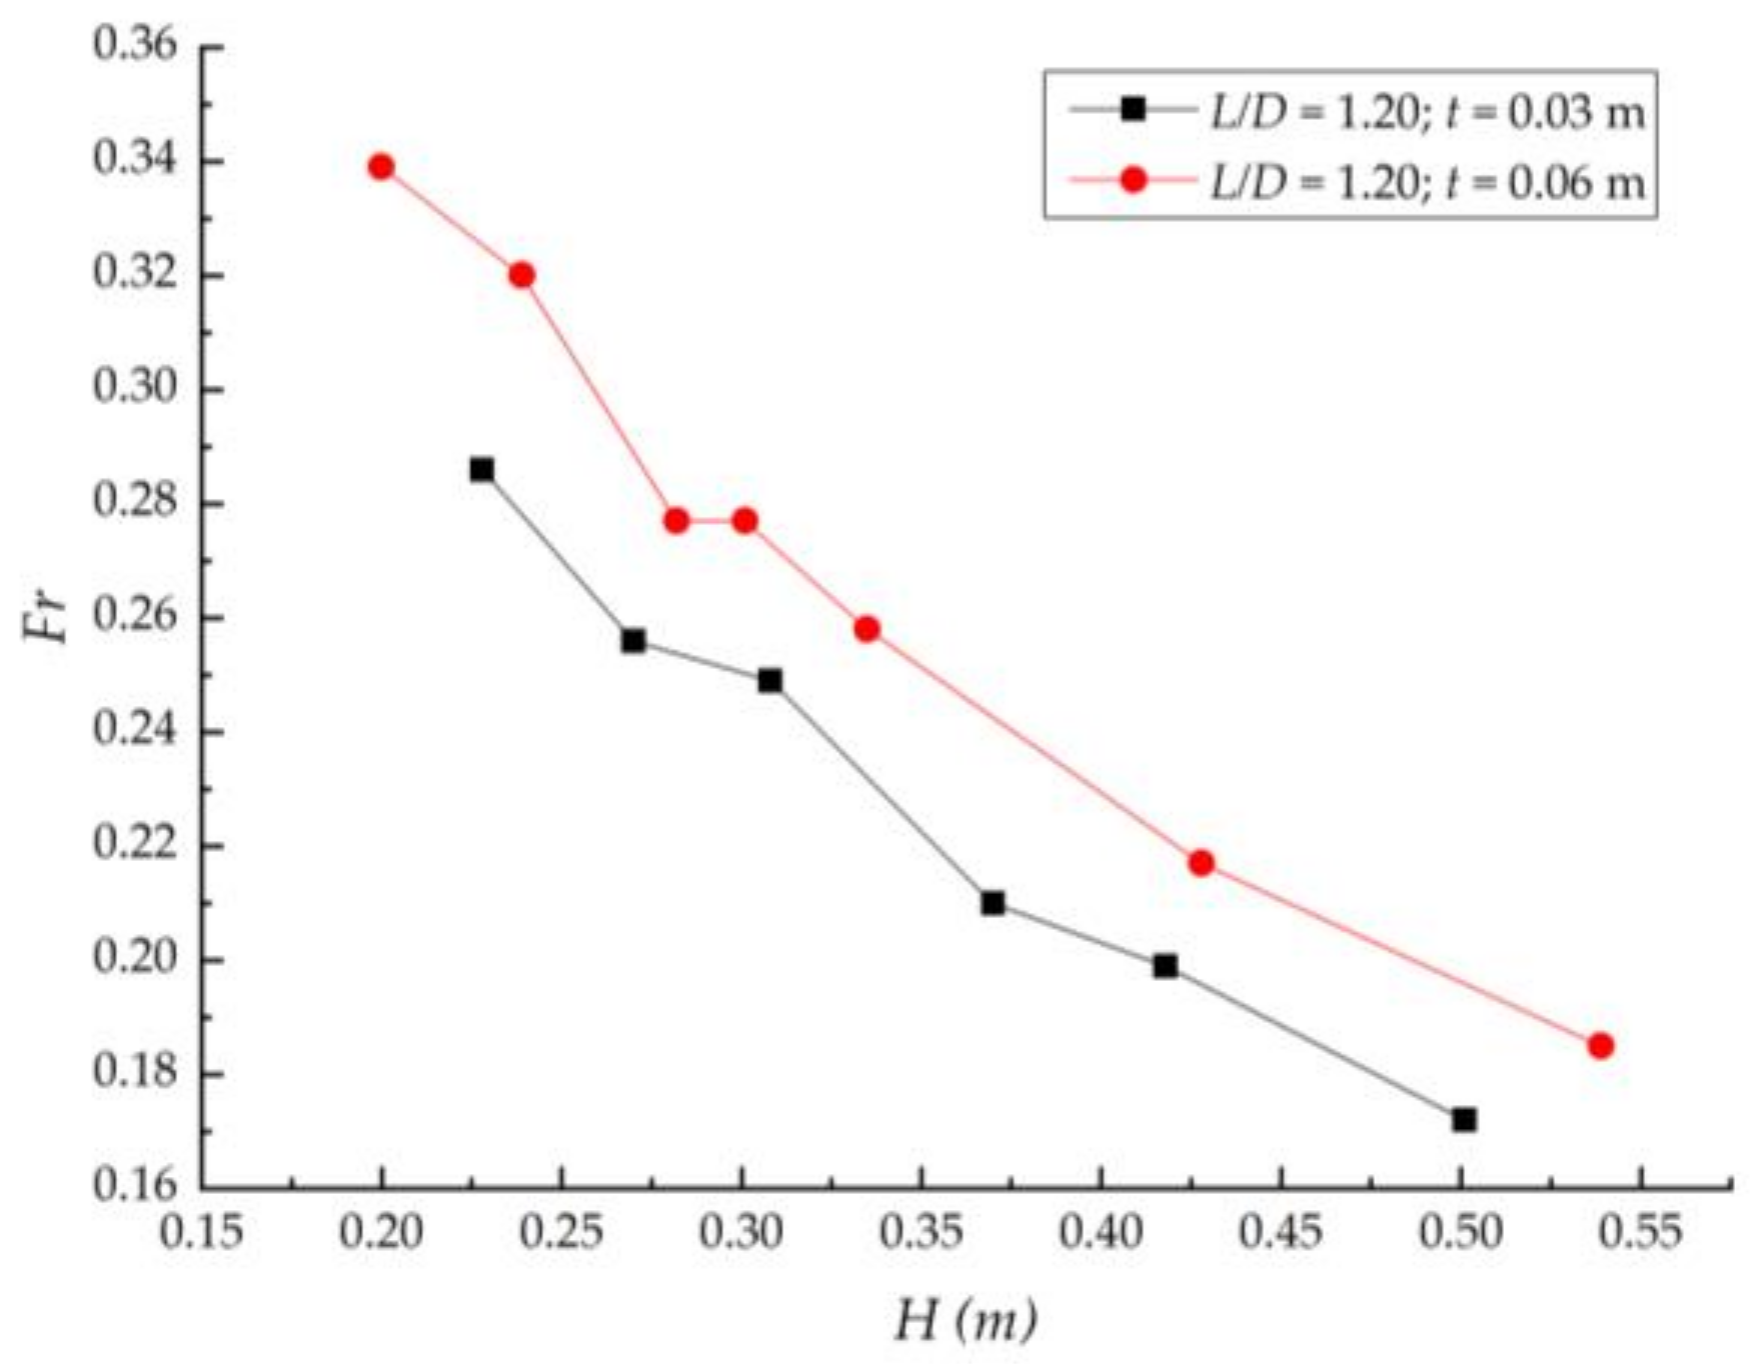
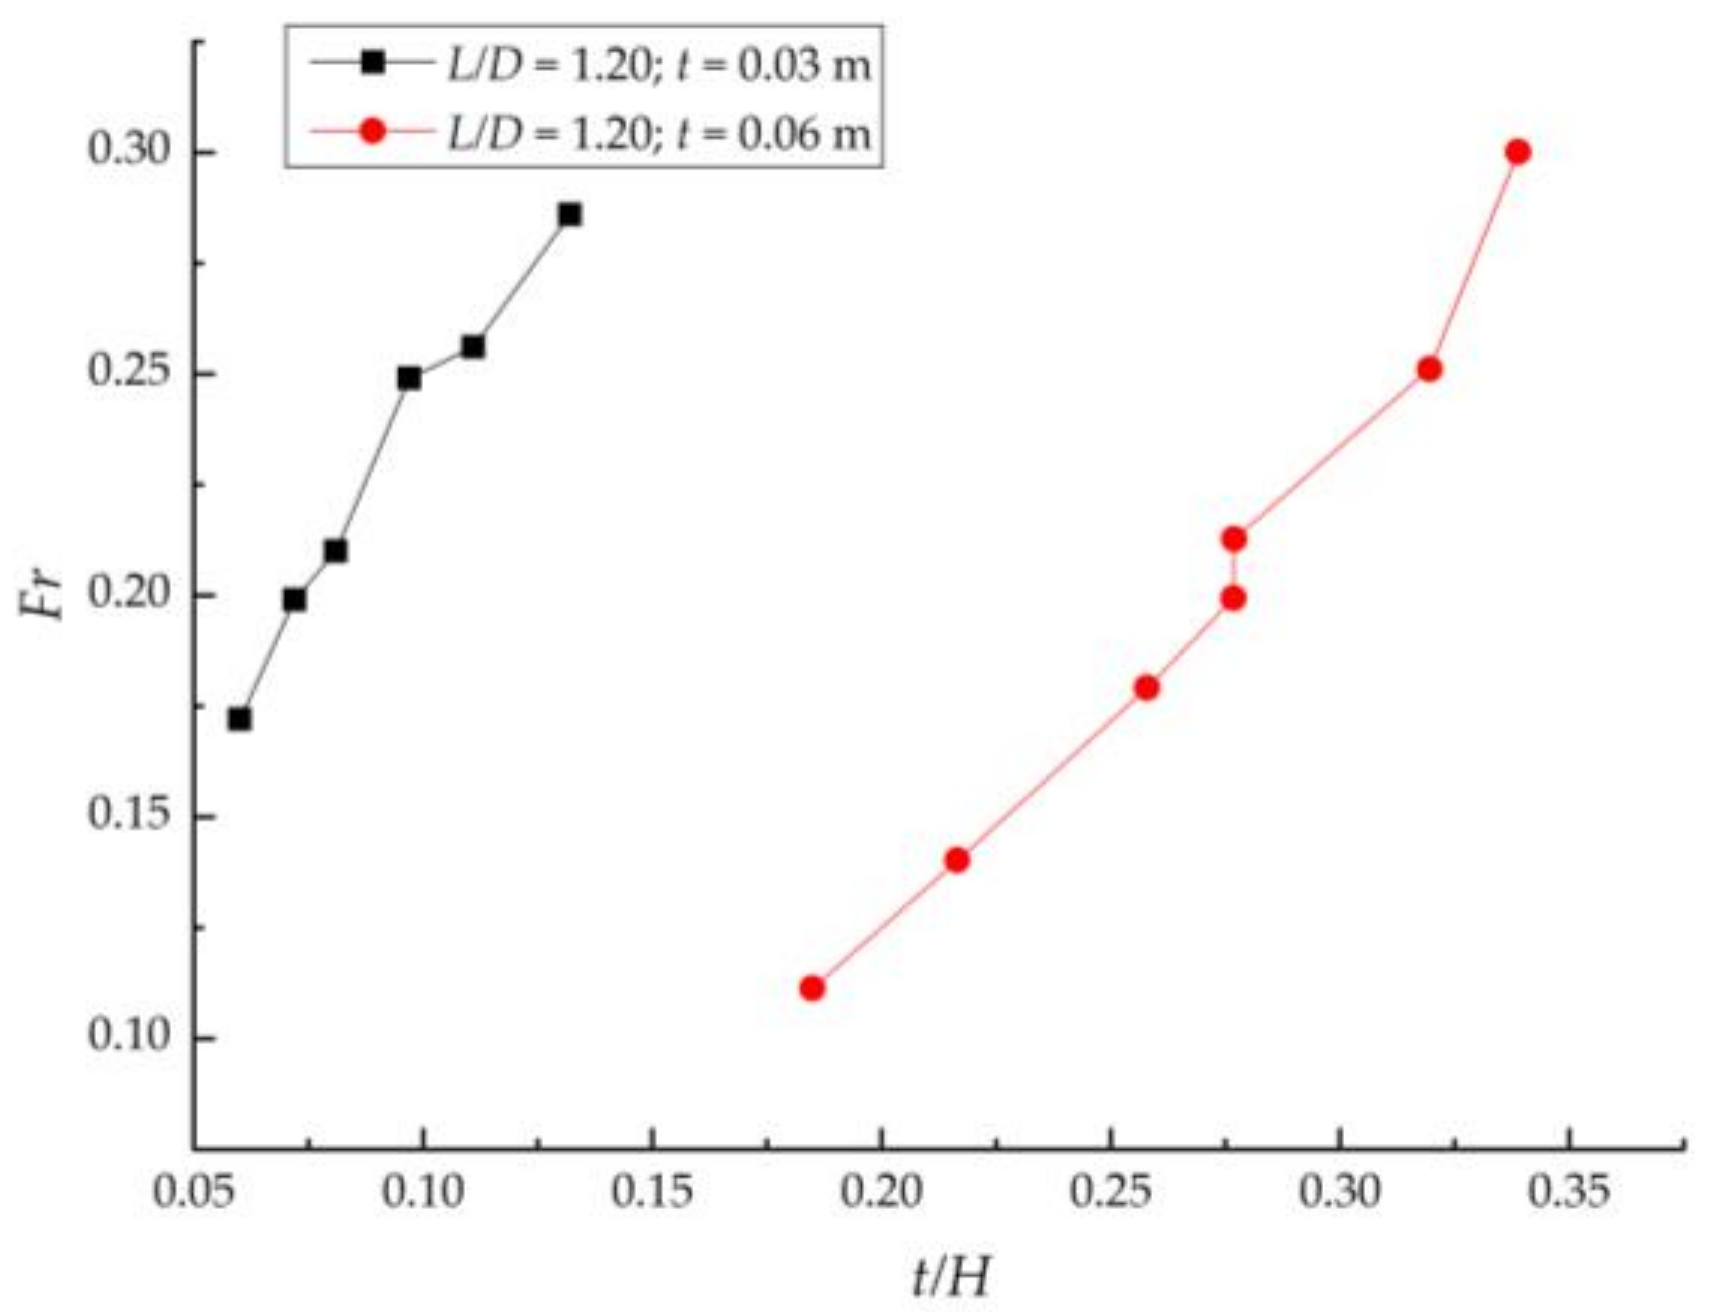
Figure 6 and Figure 7 show the test results concerning the critical Fr at 2 different ice thicknesses when the floating ice (L = 0.20 m) makes contact with the pier columns at 45° angle. The critical Fr decreases with increasing water depth H, while increasing as the t/H increases. Moreover, given the same water depth, the greater the ice thickness, the larger the critical Fr. Due to the constant planar size and increased thickness of the ice block, the submerged depth and volume of the ice block, as well as its buoyancy, will increase. As a consequence, the ice block needs greater water flow to flip and dive, resulting in the requirement of a larger critical Fr for the floating ice to pass through the cross-sections between pier columns.
3.3. Relationship Between Critical Fr and Planar Size of Ice Blocks at the Same Water Depth
From Figure 5, it can be deduced that even if the thickness t or the ratio of thickness to depth t/H of the ice block is the same, the critical Fr will be different if the planar sizes of the ice blocks are different. Figure 8 shows the relationship between the critical Fr and the ratio of length to width L/D when floating ice with the same t/H makes contact with the cross-sections between pier columns at a 45° angle. As shown in the figure, with a constant t/H, as L/D increases, there is a quadratic curve relationship between Fr and L/D, i.e., as the planar size of the ice block increases, the critical Fr initially increases and then decreases. According to the preliminary analysis, as the planar size of the ice block increases, its submerged volume becomes larger, the buoyancy force applied to it increases, and the water flow Fr required for it to flip and dive also increases accordingly. However, as the size of the ice block continues to grow, the contact area between the front edge of the ice block and the water flow increases as well. Consequently, the leading front edge effect of the ice block is enhanced, and the pressure difference caused by the front edge effect increases, causing the critical Fr to then decrease.
3.4. Influence of the Angle at Which the Floating Ice Makes Contact With the Pier Columns on the Critical Fr
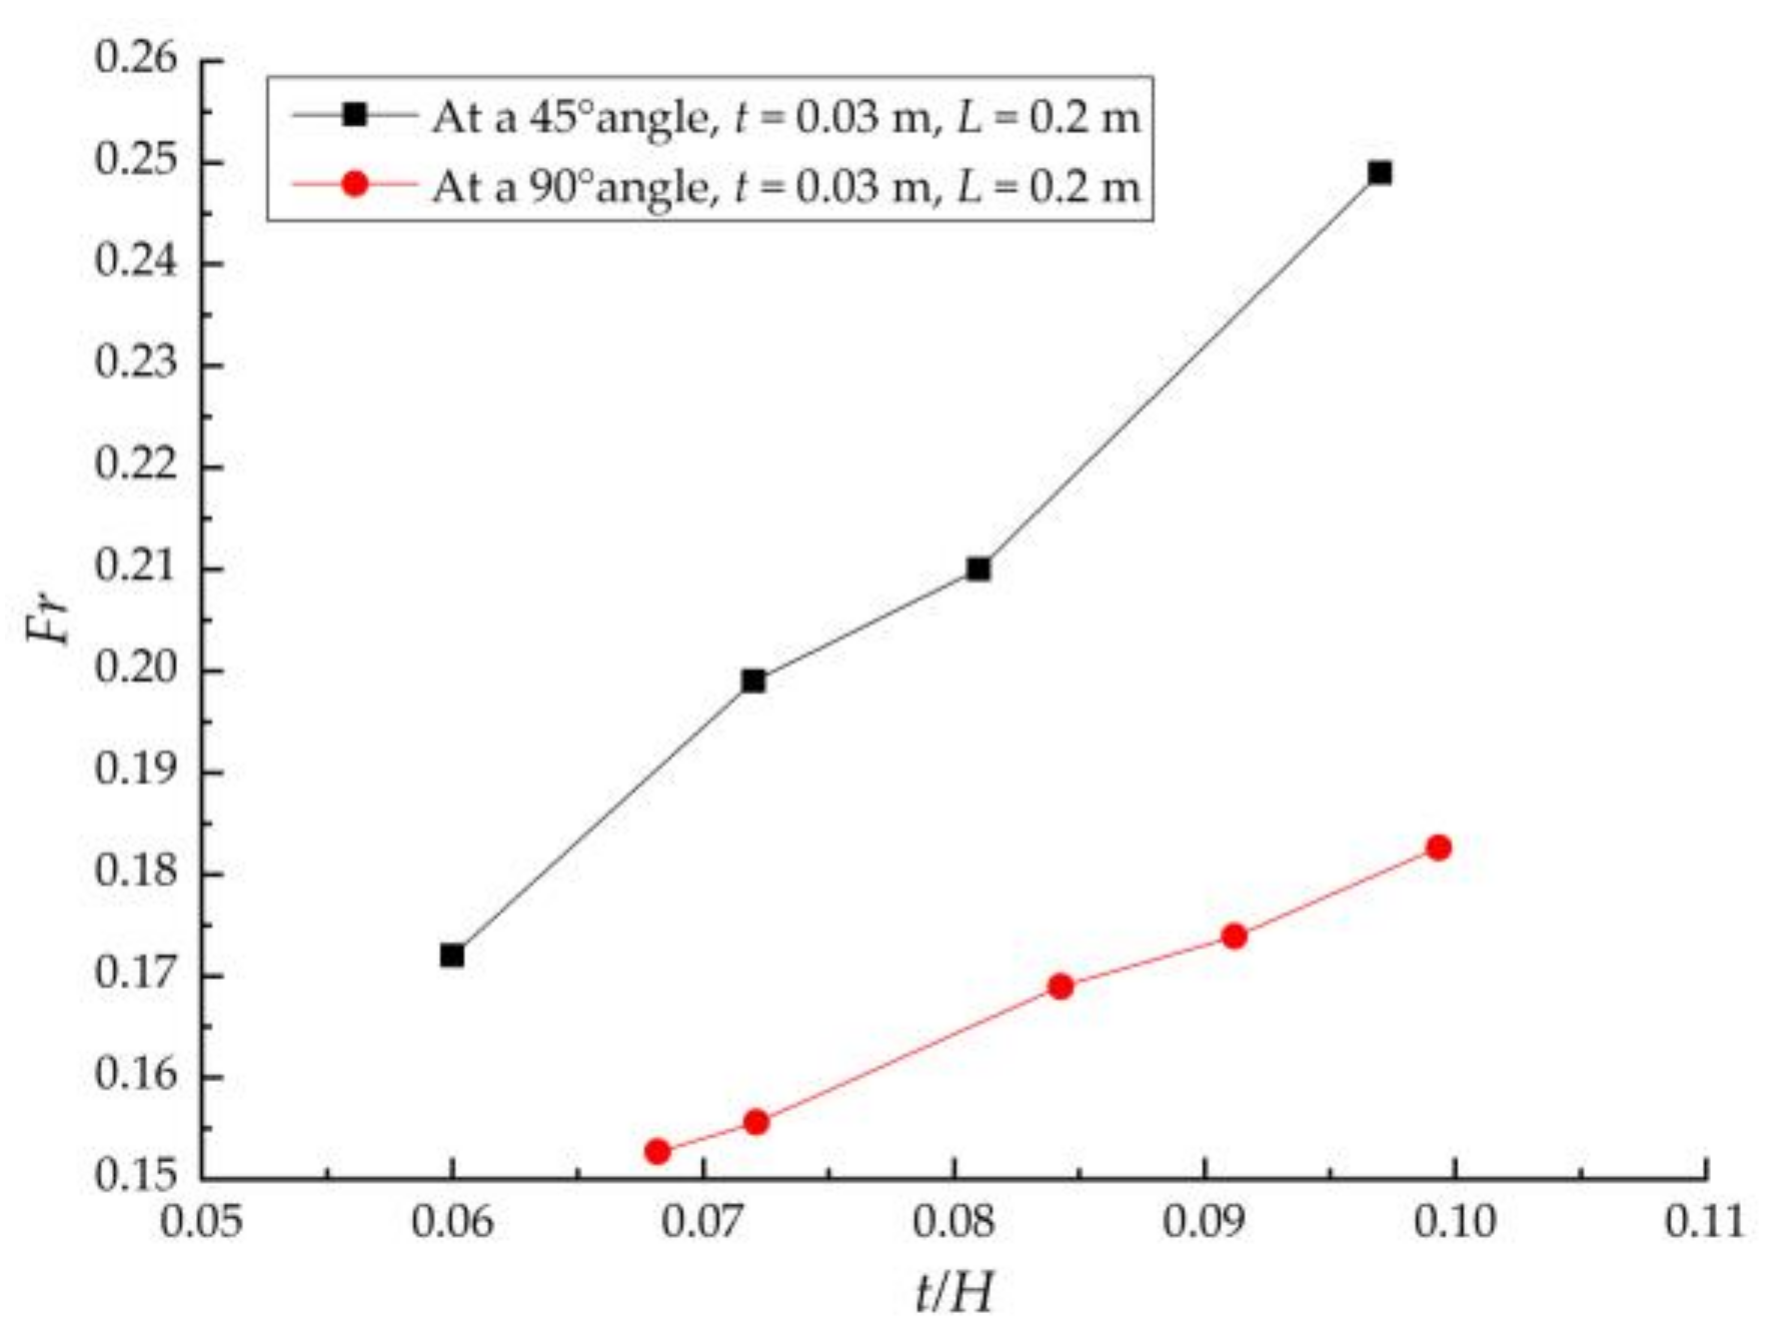
When a single block of model ice reaches the cross-sections between the downstream pier columns, there are primarily 2 ways for the floating ice to make contact with the pier columns. As shown in Figure 2, the ice block can make contact laterally with the pier column cross-sections at an angle of 45° or make contact vertically at an angle of 90°. Given the same planar size, if the ice block makes contact with the pier column cross-sections in different ways, the critical Fr required for the floating ice to pass through the cross-sections between pier columns will differ as well.
Figure 9 shows the relationship between the critical Fr and the ratio of thickness to depth t/H when the ice block makes contact with the pier column cross-sections in 2 different ways. According to the figure, there is a good positive proportional relationship between the critical Fr and the ratio of thickness to depth t/H. In addition, for the same ratio of thickness to depth t/H, the critical Fr of the ice block making contact laterally with the pier column cross-sections at an angle of 45° is greater than its counterpart when the ice block makes contact vertically with the pier column cross-sections. This is primarily due to the fact that when the edge of the ice block laterally contacts the pier column cross-sections at an angle of 45°, the water flow is at an angle of 45° with the edge of the ice block, making the front edge effect of the ice block smaller than that of the ice block making contact vertically with the pier column cross-sections at an angle of 90°. Therefore, the hydraulic conditions required for the ice to flip and dive are strong, and the critical Fr is large. Inversely, the front edge effect is strongest when the front edge of the ice block is orthogonal to the water flow, so the hydraulic conditions required to flip the ice block are weak and the critical Fr is small.
In Section 3.2 and Section 3.3, all the test results concerning the critical Fr were obtained when the front edge of the ice block laterally contacted the pier columns at a 45° angle. In terms of the hydraulic control threshold, the test results are partially safe, which is of more practical significance for guiding the hydraulic control of ice-water two-phase flow.
4. Derivation of the Equation Calculating the Critical Fr of Floating Ice Passing Through the Cross-sections Between Pier Columns
In order to quantitatively analyze the critical Fr required for floating ice to pass through the cross-sections between pier columns, key influencing factors were introduced to express the critical Fr as a general calculation equation:
F(g,ρ,ρi, t, D, L, Q, v, J, B, H) = 0
Where ρ is the density of water (kg/m3), ρi is the density of ice (kg/m3), t is the thickness of ice blocks (m), L is the planar feature size (side length) of ice blocks (m); D is the clear width between the pier columns (m), Q is the water discharge (m3/s), v is the average water flow velocity in front of the pier columns (m/s), J is the slope of the canal (%), B is the width of the canal (m), and H is the water depth in front of the pier columns (m).
The equation of the water flow Fr is as follows:
Fr = v/(gh)1/2
Equation (1) can be simplified as:
F(ρ,ρi, t, D, L, Q, J, B, Fr) = 0
The slopes and widths of canals are constants whose impacts on the gravity flow will be reflected in the water discharge and water flow velocity, the former of which can also be expressed by the water flow velocity. By excluding these variables, and using H, v, and ρ as the basic variables, the Buckingham π method was applied in order to nondimensionalize the variables in the equation, resulting in Equation (4):
F(ρi/ρ, t/H, L/H, D/H, Fr) = 0
Since the planar size L, water depth H, and clear width between pier columns D have the same dimension, L/H and D/H in the equation can be simplified to L/D. By extracting Fr from the equation, the equation for calculating the critical Fr required for floating ice to pass through the cross-sections between pier columns was obtained:
Fr = F(ρi/ρ, t/H, L/D)
Since the ratio of ice density to water density is a constant value under experimental and natural conditions, it is only necessary to consider the effects of t/H and L/D on the critical Fr. The empirical equation for calculating the critical Fr can then be expressed as:
where M and N are correction coefficients related to the ratio of length to width and are determined by the following equations:
Fr = −N + M[0.072 + 1.355t/H − 2.984(t/H)2]
M = −4.680 + 8.933L/D − 3.034(L/D)2
N = −0.531 + 0.825L/D − 0.280(L/D)2
N = −0.531 + 0.825L/D − 0.280(L/D)2
According to Equation (6), when t/H (the thickness of ice blocks/ the water depth in front of the pier columns) ranges from 0.057~0.132 and L/D (the planar feature size of ice blocks/ the clear width between the pier columns) from 0.96–1.92, the range of the critical Fr is 0.151~0.298. Under various ice block sizes, the correlation coefficient between the measured Fr and the Fr calculated by the empirical equation can reach 0.98, indicating a strong correlation.
In actual projects, the size of ice blocks in canal are different, which is not only difficult to determine, but different sizes of floating ice may also exists at the same time, so this study is expected to find out the safest operating conditions for floating ice passing through the cross-sections between pier columns, that is, to find an envelope curve of the critical Fr that can take into account the safe transport of floating ice of various sizes.
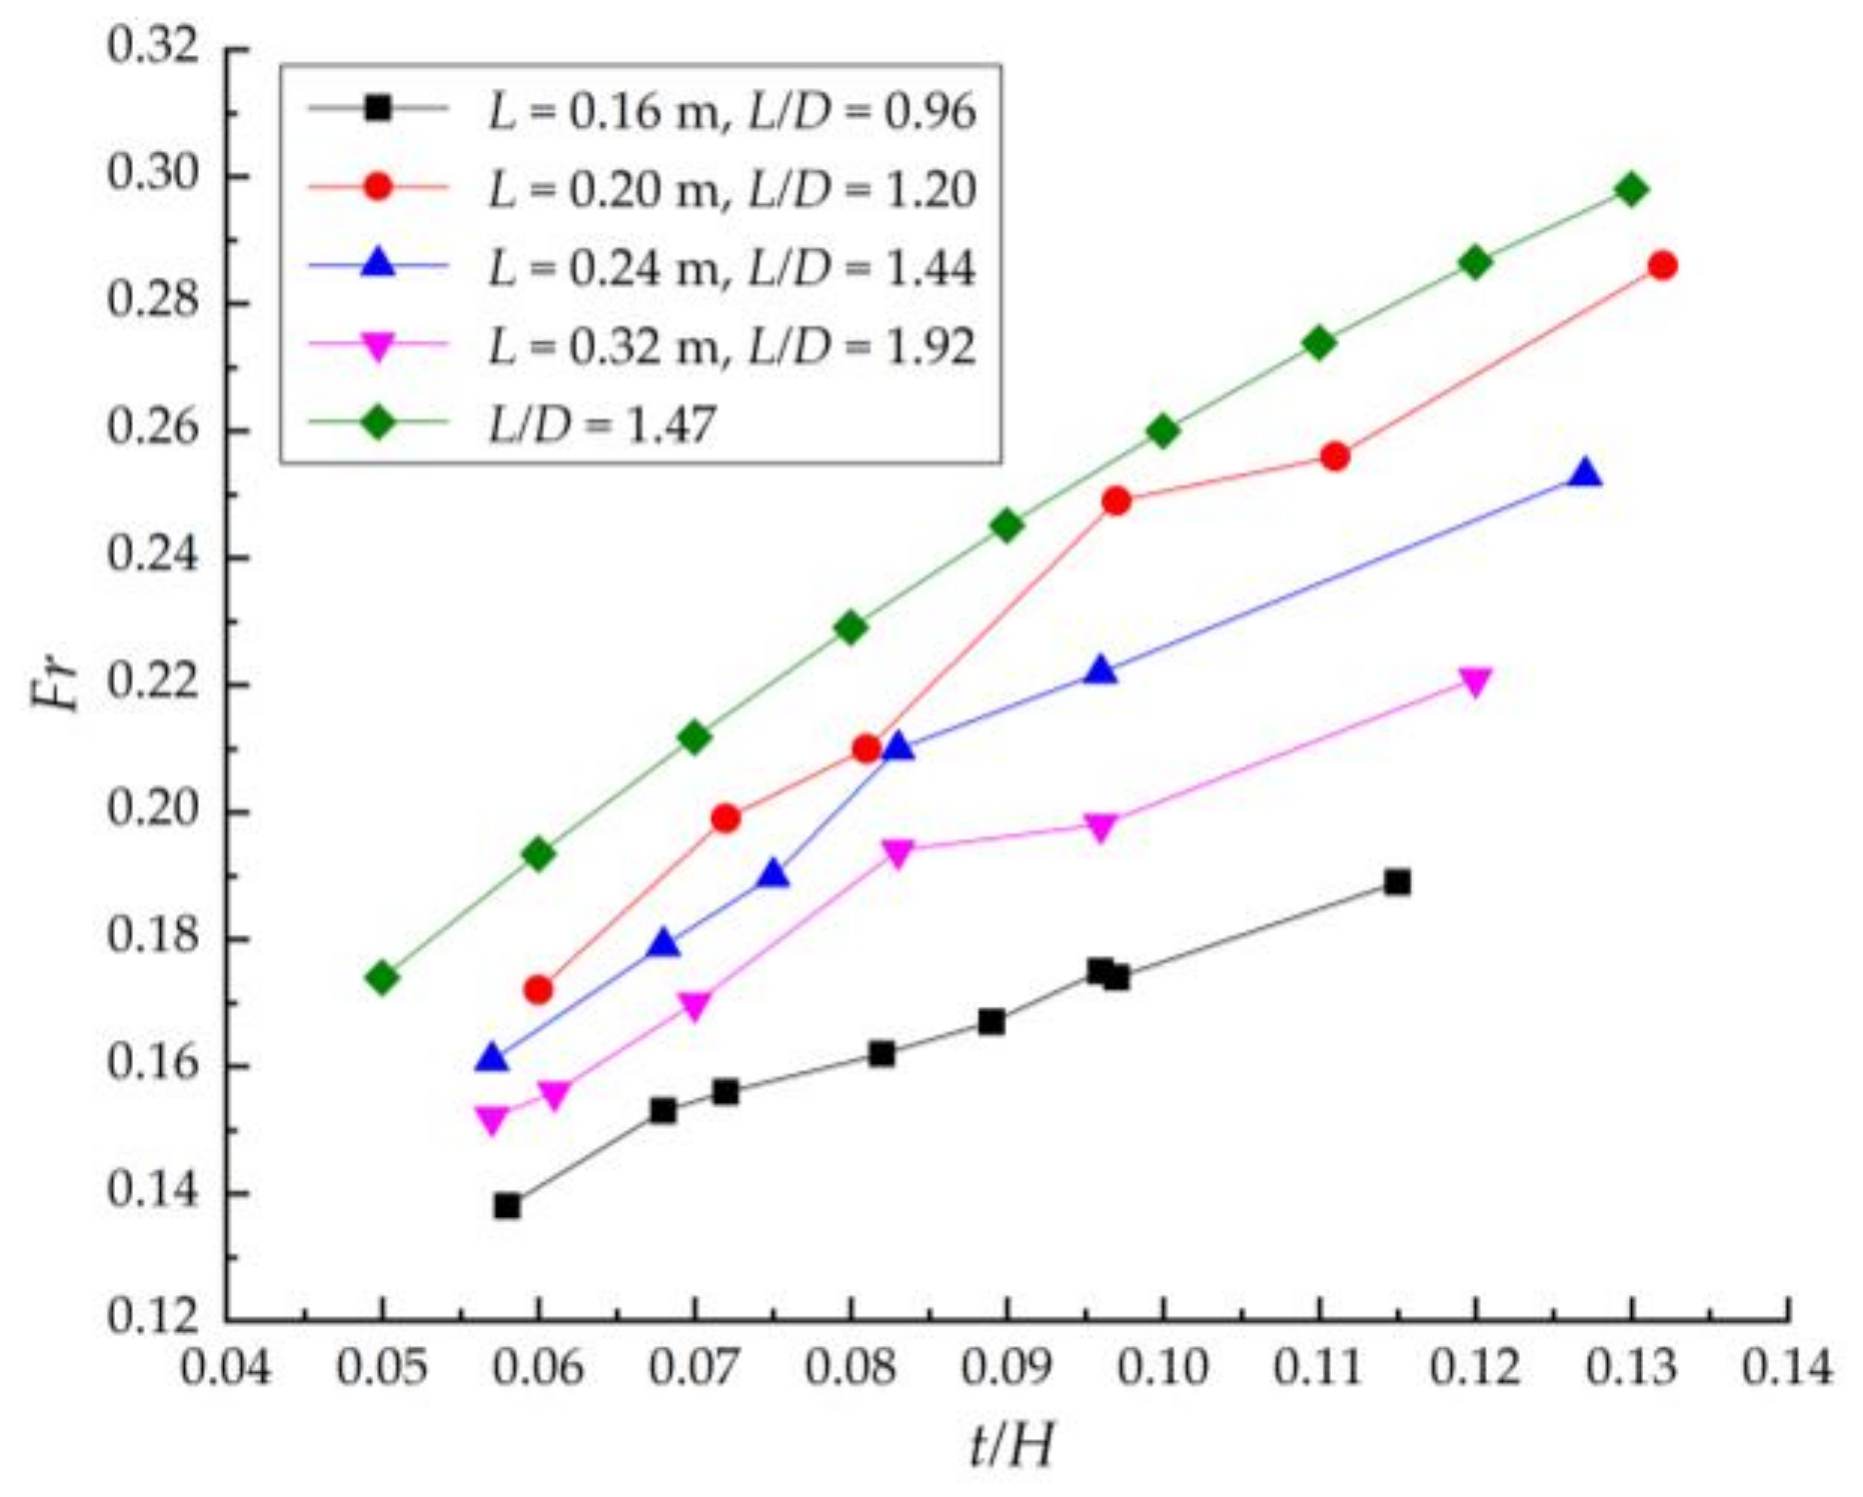
According to the analysis of the test results, when t/H is constant, there is a value in the test conditions L/D = 0.96~1.92, and the corresponding critical Fr reaches its maximum value. According to Equations (6) and (7), using the maximum result of Equation (6) as the goal, the optimization was performed in the range of L/D = 0.96~1.92. The results show that when L/D is 1.47, the critical Fr required for floating ice to pass through the cross-sections between pier columns can be set to the maximum value Frmax. When L/D = 1.47, Equation (6) becomes
Fr = −0.077 + 1.895 × [0.072 + 1.355t/H − 2.984(t/H)2]
Figure 10 shows a comparison between the envelope curve of the critical Fr obtained from Equation (8) and the curves of the critical Fr obtained from tests.
As shown in Figure 10, when L/D = 1.47, the relationship between the critical Fr and t/H is characterized by an envelope curve, i.e., there is a certain safety margin when calculating the critical Fr required for floating ice to pass through the cross-sections between pier columns per Equation (8). Thus, Equation (8) can serve as the basis for hydraulic regulations requiring the assessment of ice jam risk at the cross-sections between pier columns in ice-water two-phase flow canals and be used to guide hydraulic regulation.
5. Suggestions for Risk Assessment and Operation Control of Ice-Water Two-Phase Flow Canals
In this study, the quantitative relations between the critical Fr of floating ice passing through the cross-sections between pier columns and t/H (the thickness of ice blocks/ the water depth in front of the pier columns) and L/D (the planar feature size of ice blocks/ the clear width between the pier columns) were established. The above-mentioned quantities belonging to dimensionless parameters have certain versatility. The flume used in this test and the actual canal project have the characteristics of being narrow and deep in common, and there is a certain degree of dip phenomenon in the flow velocity distribution on the cross section of the water, so there are certain similarities between them. The critical Fr formula obtained from flume test can be used to evaluate the problem of ice blocking in front of the piers in water transfer canals.
Using the diversion canal of a hydropower station in northern Xinjiang, in China, as an example, the generation and development of floating ice along the canal was simulated by constructing a one-dimensional mechanical-mathematical model of canal ice and water [27]. In addition, with Equations (6)–(8) as the criteria for judging whether the floating ice could pass the cross-sections between pier columns, the risk of floating ice transport along the canal was analyzed and evaluated.
This diversion canal has a total length of 58.7 km and a trapezoidal cross-section. It is a wide-shallow canal with a 4-m-wide bottom and a side slope factor of 1:2. The bottom slope of the canal is 1/8000, and the design roughness is 0.0126. Through this canal, the water diverted from the upstream reservoir flows to the downstream power station. There are 2 hydroelectric generating sets in the hydropower station. When a single hydroelectric generating set is used for power generation, the water transfer discharge is 35 m3/s; when both hydroelectric generating sets are used, the water transfer discharge is 70 m3/s. This canal usually experiences ice conditions for 5 months of the year, from November to March. During the canal project, an ice sluice was only situated in front of the forebay of the power station at the end of the canal. If there were no ice jams along the canal, all floating ice was transferred to the forebay of the power station and discharged out of the canal through the ice sluice established there.
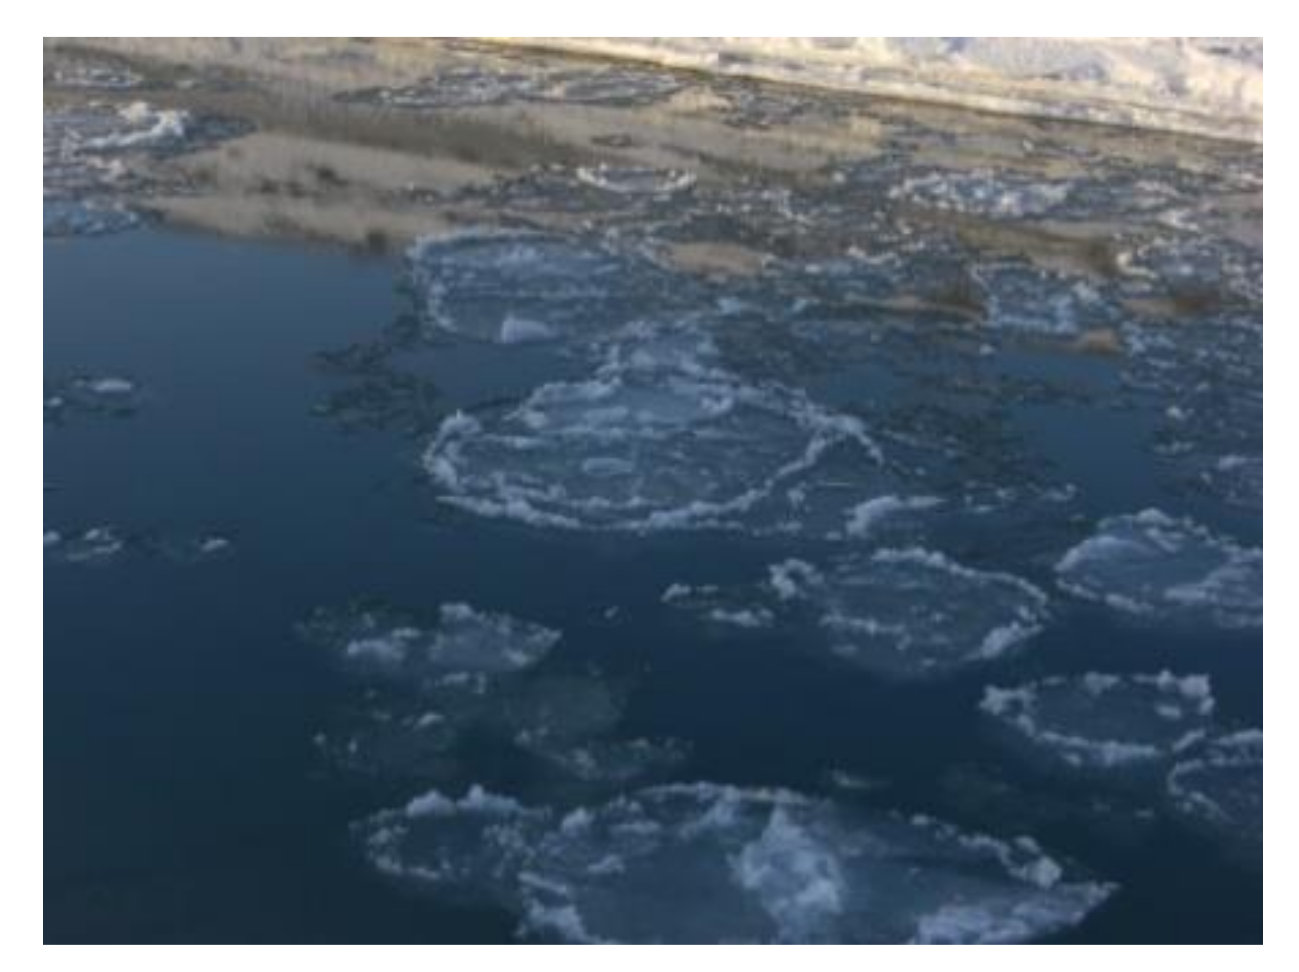
The ice-water two-phase flow mode was applied in this canal during freezing periods. Ice was usually transferred downstream in the canal on the water surface in the form of ice floes, ice trays, and floating ice. In the process of flowing downstream, ice blocks constantly stuck to each other, forming aggregates of increasing size. Figure 11 shows the conditions of ice in the downstream sections of this canal. Most of the ice in the canal is in the form of ice trays. In a single cross-section, there are generally multiple ice trays moving downstream. If the size of the ice aggregates at a certain cross-section of the canal exceed the canal’s ice transport capacity at a specific time, ice blocks stagnate at this cross-section, resulting in an ice jam that will destroy the water transfer conditions of the ice-water two-phase flow. Overtopping dams and even breaches will occur if the ice jam is not coped with in time, while the cross-sections between pier columns face the greatest risk of ice jams.
According to the ice-hydraulic numerical simulation of this 58.7 km canal [27], there is a linear relationship between the volumetric discharge of ice in the canal and the flow path after the water flows out of the reservoir. The further downstream the canal, the larger the ice discharge, the maximum ice discharge appears at the end of the canal. Therefore, the cross-section of the check gate at the end of the canal is the water transfer cross-section that should be most closely monitored and controlled during freezing periods. Table 1 lists the simulation results related to the water and ice conditions under different operating conditions in cold winter years.
Taking a cold winter year as an example, when the water discharge was 35 m3/s, the maximum ice discharge at the end of the canal was 4.17 m3/s, and when the water discharge was 70 m3/s, the maximum ice discharge at the end of the canal was relatively large, reaching 5.06 m3/s [27]. According to the prototype observation, the ice thickness on this canal during the freezing period was generally 10–20 cm. Assuming that there are 2 ice trays in 1 cross-section of the canal, then the ice discharge of 5.06 m3/s at the cross-section can be converted into an ice tray with a diameter of 4.0–5.6 m.
The pier columns of the check gate at the end of the canal has a clear width of 3.5 m, with the ratio of length to width L/D ranging from 1.14–1.60. At a water discharge of 70 m3/s (when both hydroelectric generating sets were used), based on the hydraulic calculation, the water flow Fr in front of the pier columns was 0.239, the water depth was 3.97 m, and the t/H ranged from 0.025–0.050. As shown in Figure 10, when t/H ranges from 0.025–0.050 and L/D ranges from 1.14–1.60, the critical Fr required for floating ice to pass through the cross-sections between pier columns is less than 0.18. Since the water flow Fr in front of the pier column was 0.239 at this time, the floating ice could smoothly pass through the cross-section of the check gate. In addition, by substituting the corresponding t/H and L/D values into Equations (6) and (7), the critical Fr required for the floating ice to pass through the cross-sections between gate piers was calculated, which ranged from 0.117–0.173. According to Equation (8), the critical Fr obtained ranged from 0.120–0.174, which was also less than the water flow Fr in front of the gate piers, i.e., 0.239. Therefore, in cold winter years, when the water transfer discharge is 70 m3/s, the floating ice in the canal can smoothly pass through the cross-sections between gate piers, satisfying the operation requirements of ice-water two-phase flow.
When a single hydroelectric generating set was used for power generation, the water discharge was 35 m3/s, and the water flow Fr was 0.235 of the canal. Although the maximum ice discharge of the canal at this time was less than the corresponding figure when both hydroelectric generating sets were used for power generation, the t/H was greater than that corresponding to the large discharge conditions. The maximum critical Fr required for the floating ice to pass through the cross-sections between gate piers calculated per Equation (8) is 0.21, which is close to the water flow Fr of the canal, indicating certain ice jam risks in front of the gate piers.
Thus, although the ice discharge for a small water discharge was lesser than the ice discharge for a large water discharge, the critical Fr required for floating ice to pass through the cross-sections between pier columns increased due to the increased t/H. This implies that there are higher requirements for hydraulic regulation when the water discharge is relatively small. Moreover, at a small water discharge, the volume ratio of ice to water at the end of the canal is greater than its counterpart when the water discharge is relatively large. Specifically, according to the numerical simulation, the corresponding volume ratios of ice to water were 11.9% and 7.2%, respectively, which will adversely affect the effect of direct removal of drift ice in the forebay of the power station as well as the power generation efficiency of the power station. Hence, for canals applying the ice-water two-phase flow mode, the water discharge should be large in order to ensure safety and operating efficiency of water transfer during freezing periods.
6. Conclusions
With the ice-water two-phase flow canal as the research object, a flume experiment using model ice to simulate the ice transport at the cross-sections between pier columns was carried out in this study in order to explore the movement patterns of the ice blocks and their main influencing factors, as well as the critical hydraulic conditions required for floating ice to pass through the cross-sections between pier columns. Based on our results, the following conclusions were drawn.
- (1)
- The movement and transport state of ice blocks at the cross-sections between pier columns are closely related to the hydraulic conditions in front of the pier columns. When the water flow velocity or Fr in front of the pier columns is comparatively small, the ice blocks will stagnate in front of the pier columns, the state of the ice blocks will not change over time, and the ice blocks will remain stuck between the pier columns. When the water flow velocity or Fr increases to a certain level, i.e., when the water flow velocity or Fr in front of the pier columns exceeds a specific threshold, the ice blocks, under the influence of the front edge effect and the Venturi effect, will flip, dive, and pass through the gap between the pier columns. Compared with the water flow velocity, the dimensionless water flow Fr, which integrates the effects of water flow velocity and water depth, is more suitable as a critical hydraulic control parameter for judging whether ice blocks can pass through the cross-sections between pier columns.
- (2)
- The critical Fr required for the ice blocks to pass through the cross-sections between pier columns is closely related to the water depth H, the ratio of thickness to depth t/H, the ratio of length to width L/D, and the angle at which the ice blocks make contact with the pier columns. For a constant L/D, the critical Fr decreases quadratically with increasing H, and increases quadratically with increasing t/H. Under the conditions of the experiment in this study, for a constant t/H, as L/D increases, the critical Fr increases initially and then decreases. Given the same t/H, when the ice blocks make lateral contact with the pier columns at an angle of 45°, the critical Fr required for the ice blocks to pass through the cross-sections between pier columns is greater than the case in which the ice blocks make vertical contact with the pier columns at an angle of 90°. Both the movement pattern of the ice blocks as well as the relationship between the critical Fr and the influencing factors are the external manifestations of the front edge effect and the Venturi effect of the ice blocks.
- (3)
- Since the cross-sections narrowed by bridge piers or gate piers are locations in the canal with a relatively small ice transport capacity, the cross-sections of bridge piers and gate piers located downstream from water transfer projects should be closely monitored during freezing periods. The empirical equation for calculating the critical Fr required for ice blocks to pass through the cross-sections between pier columns was obtained using dimensional analysis. When the L/D ratio is 1.47, the critical Fr reaches its maximum. The relationship between the critical Fr and t/H when L/D = 1.47 can be used to assess the risks of ice jams in ice-water two-phase flow canals and features a certain safety margin when utilized to determine the hydraulic control necessary to ensure the safe operation of ice-water two-phase flow canals. In addition, there are still many factors that have not been taken into account in this study, such as the influence of dip phenomenon and pier form on critical Fr, which need to be further studied in the future.
Author Contributions
X.M. conceived and designed the experiment; X.M. and Y.C. supervised the research; J.B. and Y.C. conducted the experiment, analyzed the data and results; X.M. and J.B. wrote the manuscript; X.M. and Y.C. reviewed the manuscript. All authors have read and agreed to the published version of the manuscript.
Funding
The National Natural Science Foundation of China: 51579251. The National Key Research and Development Program of China: 2017YFC0405003.
Acknowledgments
This research was supported by the National Natural Science Foundation of China (51579251) and the National Key Research and Development Program of China (2017YFC0405003). Additionally, the authors would like to thank the editor and two anonymous reviewers for their in-depth reviews and constructive comments which have led to substantial improvements of the paper.
Conflicts of Interest
The authors declare no conflicts of interest.
Appendix A
Test Conditions and Results

Table A1.
When L = 0.16 m and t = 0.03 m, The movement state of ice in front of the piers under different water flow conditions (ice block in contact with the pier columns at 45°).
Table A1.
When L = 0.16 m and t = 0.03 m, The movement state of ice in front of the piers under different water flow conditions (ice block in contact with the pier columns at 45°).
| Test Group Number | Discharge Q (m3/s) | Water Depth in Front of the Piers, H (m) | Average Water Flow Velocity V (m2/s) | Water Flow Fr | The Movement State of Ice in Front of the Piers |
|---|---|---|---|---|---|
| 1 | 0.063 | 0.269 | 0.292 | 0.180 | Stagnate |
| 0.063 | 0.26 | 0.302 | 0.189 | Flip and dive | |
| 0.062 | 0.252 | 0.309 | 0.197 | Flip and dive | |
| 2 | 0.075 | 0.331 | 0.287 | 0.159 | Stagnate |
| 0.076 | 0.323 | 0.293 | 0.165 | Stagnate | |
| 0.076 | 0.311 | 0.305 | 0.175 | Flip and dive | |
| 0.076 | 0.302 | 0.314 | 0.183 | Flip and dive | |
| 0.076 | 0.287 | 0.327 | 0.195 | Flip and dive | |
| 3 | 0.082 | 0.346 | 0.296 | 0.161 | Stagnate |
| 0.082 | 0.337 | 0.303 | 0.167 | Flip and dive | |
| 0.082 | 0.329 | 0.312 | 0.174 | Flip and dive | |
| 0.082 | 0.313 | 0.327 | 0.187 | Flip and dive | |
| 4 | 0.088 | 0.379 | 0.291 | 0.151 | Stagnate |
| 0.090 | 0.373 | 0.300 | 0.157 | Stagnate | |
| 0.090 | 0.366 | 0.307 | 0.162 | Flip and dive | |
| 0.090 | 0.356 | 0.316 | 0.169 | Flip and dive | |
| 0.090 | 0.352 | 0.320 | 0.172 | Flip and dive | |
| 5 | 0.100 | 0.456 | 0.274 | 0.130 | Stagnate |
| 0.103 | 0.432 | 0.299 | 0.145 | Stagnate | |
| 0.105 | 0.416 | 0.314 | 0.156 | Flip and dive | |
| 0.104 | 0.4 | 0.325 | 0.164 | Flip and dive | |
| 0.105 | 0.384 | 0.341 | 0.176 | Flip and dive | |
| 6 | 0.111 | 0.45 | 0.309 | 0.147 | Stagnate |
| 0.112 | 0.44 | 0.317 | 0.153 | Flip and dive | |
| 0.113 | 0.424 | 0.334 | 0.164 | Flip and dive | |
| 0.112 | 0.412 | 0.340 | 0.169 | Flip and dive | |
| 7 | 0.128 | 0.531 | 0.300 | 0.132 | Stagnate |
| 0.129 | 0.519 | 0.312 | 0.138 | Flip and dive | |
| 0.129 | 0.505 | 0.320 | 0.144 | Flip and dive |
Table A2.
At the same side length of ice, the critical Fr at different discharges.
| Test Group Number | Side Length of Model Ice L (m) | Discharge, Q (m3/s) | Water Depth in Front of the Piers H (m) | Average Water Flow Velocity V (m2/s) | Ratio of Thickness to Depth t/H | Critical Fr |
|---|---|---|---|---|---|---|
| 1 | 0.16 | 0.063 | 0.260 | 0.302 | 0.115 | 0.189 |
| 0.075 | 0.308 | 0.303 | 0.097 | 0.174 | ||
| 0.076 | 0.311 | 0.305 | 0.096 | 0.175 | ||
| 0.082 | 0.337 | 0.303 | 0.089 | 0.167 | ||
| 0.090 | 0.366 | 0.307 | 0.082 | 0.162 | ||
| 0.105 | 0.416 | 0.314 | 0.072 | 0.156 | ||
| 0.112 | 0.440 | 0.317 | 0.068 | 0.153 | ||
| 0.129 | 0.519 | 0.312 | 0.058 | 0.138 | ||
| 2 | 0.20 | 0.078 | 0.228 | 0.428 | 0.132 | 0.286 |
| 0.090 | 0.270 | 0.416 | 0.111 | 0.256 | ||
| 0.107 | 0.308 | 0.432 | 0.097 | 0.249 | ||
| 0.118 | 0.370 | 0.400 | 0.081 | 0.210 | ||
| 0.134 | 0.418 | 0.402 | 0.072 | 0.199 | ||
| 0.153 | 0.501 | 0.382 | 0.060 | 0.172 | ||
| 3 | 0.24 | 0.073 | 0.237 | 0.386 | 0.127 | 0.253 |
| 0.097 | 0.313 | 0.389 | 0.096 | 0.222 | ||
| 0.115 | 0.363 | 0.396 | 0.083 | 0.210 | ||
| 0.120 | 0.399 | 0.376 | 0.075 | 0.190 | ||
| 0.132 | 0.442 | 0.372 | 0.068 | 0.179 | ||
| 0.153 | 0.523 | 0.365 | 0.057 | 0.161 | ||
| 4 | 0.32 | 0.069 | 0.250 | 0.347 | 0.120 | 0.221 |
| 0.086 | 0.311 | 0.346 | 0.096 | 0.198 | ||
| 0.105 | 0.360 | 0.365 | 0.083 | 0.194 | ||
| 0.120 | 0.431 | 0.349 | 0.070 | 0.170 | ||
| 0.134 | 0.490 | 0.343 | 0.061 | 0.156 | ||
| 0.145 | 0.527 | 0.345 | 0.057 | 0.152 |
Table A3.
At the same side length of ice, the relationship between critical Fr and t/H at different thickness of ice.
Table A3.
At the same side length of ice, the relationship between critical Fr and t/H at different thickness of ice.
| Test Group Number | Thickness of Model Ice t (m) | Side Length of Model Ice L (m) | Discharge Q (m3/s) | Water Depth in Front of the Piers H (m) | Ratio of Thickness to Depth t/H | Critical Fr |
|---|---|---|---|---|---|---|
| 1 | 0.03 | 0.20 | 0.078 | 0.228 | 0.132 | 0.286 |
| 0.090 | 0.270 | 0.111 | 0.256 | |||
| 0.107 | 0.308 | 0.097 | 0.249 | |||
| 0.118 | 0.370 | 0.081 | 0.210 | |||
| 0.134 | 0.418 | 0.072 | 0.199 | |||
| 0.153 | 0.501 | 0.060 | 0.172 | |||
| 2 | 0.06 | 0.076 | 0.200 | 0.300 | 0.339 | |
| 0.094 | 0.239 | 0.251 | 0.320 | |||
| 0.104 | 0.282 | 0.213 | 0.277 | |||
| 0.114 | 0.301 | 0.199 | 0.277 | |||
| 0.125 | 0.335 | 0.179 | 0.258 | |||
| 0.152 | 0.428 | 0.140 | 0.217 | |||
| 0.183 | 0.539 | 0.111 | 0.185 |
Table A4.
At the same side length and thickness of ice, The relationship between critical Fr and t/H at different contact mode between model ice and the piers.
Table A4.
At the same side length and thickness of ice, The relationship between critical Fr and t/H at different contact mode between model ice and the piers.
| Test Group Number | Thickness of Model Ice t (m) | Side Length of Model Ice L (m) | Contact Mode Between Model Ice and the Piers | Discharge Q (m3/s) | Water Depth in Front of the Piers H (m) | Ratio of Thickness to Depth t/H | Critical Fr |
|---|---|---|---|---|---|---|---|
| 1 | 0.03 | 0.20 | Ice block in contact with the pier columns at 45°. | 0.107 | 0.308 | 0.097 | 0.249 |
| 0.118 | 0.370 | 0.081 | 0.210 | ||||
| 0.134 | 0.418 | 0.072 | 0.199 | ||||
| 0.153 | 0.501 | 0.060 | 0.172 | ||||
| 2 | Ice block in contact with the pier columns at 90°. | 0.076 | 0.302 | 0.099 | 0.183 | ||
| 0.082 | 0.329 | 0.091 | 0.174 | ||||
| 0.090 | 0.356 | 0.084 | 0.169 | ||||
| 0.105 | 0.416 | 0.072 | 0.156 | ||||
| 0.112 | 0.440 | 0.068 | 0.153 |
References
- IAHR. River ice jams: A state of the art report. In Proceedings of the 8th International Association for Hydraulics Research, Symposium on Ice; Working Group on Ice; Institute of Hydraulic Research University of Iowa: Iowa, IA, USA, 1986; Volume 3. [Google Scholar]
- Pariset, E.; Hausser, R.; Gagnon, A. Formation of ice covers and ice jams in rivers. J. Hydraul. Div. 1966, 92, 1–24. [Google Scholar]
- Shen, H.T. Research on river ice processes: Progress and missing links. J. Cold Reg. Eng. 2003, 17, 135–142. [Google Scholar] [CrossRef]
- Yang, K.L. Advances of ice hydraulics, ice regime observation and forecasting in rivers. J. Hydraul. Eng. 2018, 49, 81–91. [Google Scholar]
- Shen, H.T. Mathematical modeling of river ice processes. Cold Reg. Sci. Technol. 2010, 62, 3–13. [Google Scholar] [CrossRef]
- Mu, X.P.; Chen, W.X.; Cui, W.; Baiyinbaoligao, G.X.C. Flow management for long distance water diversion canal system during Winter Time. In Proceedings of the 21st IAHR International Symposium on Ice, China, Dalian, China, 11–15 June 2012. [Google Scholar]
- Mu, X.P.; Chen, W.X.; Guo, X.C.; Cui, W. Study on long-distance water transfer channel with thermal insulation cover in winter. J. Hydraul. Eng. 2013, 9, 1071–1079. [Google Scholar]
- Mu, X.P.; Cao, P.; Chen, W.X.; Wu, Y.; Wen, P. Overview of water transfer technology without ice cover and hydraulic control influencing factors of ice-water two-Phase flow of wide-shallow channel during ice period. Water Resour. Power 2016, 12, 132–136. [Google Scholar]
- Jasek, M.; Trevor, B. Mitigation of elevated river freeze-up levels by revised flow regulation. In Proceedings of the CGU HS Committee on River Ice Processes and the Environment 15th Workshop on River Ice, St. John’s, NL, Canada, 15–17 June 2009. [Google Scholar]
- Adalaiti, H.J.; Yu, S.S. Study and prospect of ice damage prevention and control in Xinjiang’s Water conveyance projects. J. Water Resour. Archit. Eng. 2010, 6, 46–49. [Google Scholar]
- Hicks, F. An overview of river ice problems: CRIPE07 guest editorial. Cold Reg. Sci. Technol. 2009, 55, 175–185. [Google Scholar] [CrossRef]
- Urroz, G.E.; Schaefer, J.; Ettema, R. Bridge-pier location and ice conveyancein curved channels. J. Cold Reg. Eng. 1994, 8, 66–72. [Google Scholar] [CrossRef]
- Tyminski, T. Hydraulic model research on bridge piers based on the example of selected bridges in Opole. Rocz. Ochr. Srodowiska 2010, 12, 879–893. [Google Scholar]
- Carstensen, D. Flow under ice cover and jam effects. In Proceedings of the International Conference on Fluvial Hydraulics, River Flow 2012, San Jose, Costa Rica, 5–7 September 2012; pp. 1139–1144. [Google Scholar]
- Wang, J.; Wang, T.; Li, S.Y.; Chen, P.P. Impacts of bridge pier on ice jam initiation and ice thickness in a curved channel—An experimental study. J. Hydraul. Eng. 2017, 5, 588–593. [Google Scholar]
- Yu, S.B.; Gu, Z.G.; Hou, Z.J. Ice physical model of Baoshen Railway Bridge across Yellow River in thawing period. Adv. Sci. Technol. Water Resour. 2014, 7, 57–61. [Google Scholar]
- Hou, Z.J.; Sun, Y.; Gu, Z.G. Experimental study on the ice physical modeling with a spanning river bridge. J. Sediment Res. 2014, 8, 49–54. [Google Scholar]
- Lu, F.F. Impact of Piers on Ice Jam Backwater. Master’s Thesis, Hefei University of Technology, Hefei, China, April 2013. [Google Scholar]
- Wu, Y.; Zhu, M.Y.; Mu, X.P.; Yue, C.F.; Zhou, F.Q. Study on ice-passing capacity of pier-column section in channel. Water Resour. Hydropower Eng. 2017, 9, 126–131. [Google Scholar]
- Chen, C.J. Experimental study of ice sluicing through the diversion tunnel of the Baishan hydroelectric power project. J. Sediment Res. 1983, 9, 42–52. [Google Scholar]
- Sun, Z.C. On the law of similarity of Hydraulic models of drift ice. Yellow River 1985, 1, 3–7. [Google Scholar]
- Bai, S.L.; Zhang, L.Z.; Yu, R.H. A preliminary study on similarity of ice hydromechanic model. J. Sediment Res. 1997, 9, 66–70. [Google Scholar]
- Yang, S.Q.; Tan, S.K.; Lim, S.Y. Velocity distribution and dip-phenomenon insmooth uniform open channel flows. J. Hydraul. Eng. 2004, 130, 1179–1186. [Google Scholar] [CrossRef]
- Ashton, G.D. Froude criterion for ice-block stability. J. Glaciol. 1974, 13, 307–313. [Google Scholar] [CrossRef] [Green Version]
- Ashton, G.D. Ice entrainment through submerged gates. In Proceedings of the 19th IAHR international Symposium on Ice, Using New Technology to Understand Water-Ice Interaction, Vancouver, BC, Canada, 6–11 July 2008; pp. 129–138. [Google Scholar]
- Ambtman, K.E.D.; Hicks, F.E.; Steffler, P.M. Experimental investigation of the pressure distribution beneath a floating ice block. J. Hydraul. Eng. 2011, 137, 399–411. [Google Scholar] [CrossRef]
- Mu, X.P.; Chen, Y.F.; Wu, Y.; Chen, W.X.; Wen, R. Research on ice transport evolution rules and safe operation measures of ice-water two-phase flow canal. South-to-North Water Transf. Water Sci. Technol. 2018, 16, 148–155. [Google Scholar]
Figure 1.
Elevation diagram of test equipment.

Figure 2.
Illustration of the ice block making contact with the pier columns: (a) ice block in contact with the pier columns at 45°; (b) ice block in contact with the pier columns at 90°.
Figure 2.
Illustration of the ice block making contact with the pier columns: (a) ice block in contact with the pier columns at 45°; (b) ice block in contact with the pier columns at 90°.

Figure 3.
The movement state of the ice block in front of the pier columns: (a) Jamming in front of the pier columns; (b) Flipping, diving, and passing through the cross-sections between pier columns.
Figure 3.
The movement state of the ice block in front of the pier columns: (a) Jamming in front of the pier columns; (b) Flipping, diving, and passing through the cross-sections between pier columns.

Figure 4.
Relationship between critical Fr and H.

Figure 5.
Relationship between critical Fr and t/H.

Figure 6.
Relationship between critical Fr and H for different ice thicknesses.

Figure 7.
Relationship between critical Fr and t/H for different ice thicknesses.

Figure 8.
Critical Fr of ice of different sizes for the same t/H.

Figure 9.
Relationship between critical Fr, t/H and different contact angles of ice with the pier columns.
Figure 9.
Relationship between critical Fr, t/H and different contact angles of ice with the pier columns.

Figure 10.
The calculated critical Fr at L/D = 1.47 and the critical Fr obtained from tests.

Figure 11.
Photo of the surface ice in the canal.

Table 1.
Flow and ice parameters of the canal.
| Discharge Q (m3/s) | Water Depth H (m) | Average Water Flow Velocity V (m2/s) | Water Flow Fr | Thickness of Ice Blocks (m) | Diameter of Ice Trays (m) | Ratio of Thickness to Depth t/H | Ratio of Length to Width L/D |
|---|---|---|---|---|---|---|---|
| 70 | 3.97 | 1.49 | 0.239 | 0.1–0.2 | 4.0–5.6 | 0.025–0.050 | 1.14–1.60 |
| 35 | 2.90 | 1.25 | 0.235 | 0.1–0.2 | 3.6–5.2 | 0.034–0.069 | 1.04–1.47 |
© 2020 by the authors. Licensee MDPI, Basel, Switzerland. This article is an open access article distributed under the terms and conditions of the Creative Commons Attribution (CC BY) license (http://creativecommons.org/licenses/by/4.0/).
Share and Cite
MDPI and ACS Style
Mu, X.; Bao, J.; Chen, Y. Floating Ice Transport Conditions at the Cross-Sections Between Pier Columns in Open Ice-Water Two-Phase Flow Canals. Water 2020, 12, 1813. https://doi.org/10.3390/w12061813
AMA Style
Mu X, Bao J, Chen Y. Floating Ice Transport Conditions at the Cross-Sections Between Pier Columns in Open Ice-Water Two-Phase Flow Canals. Water. 2020; 12(6):1813. https://doi.org/10.3390/w12061813
Chicago/Turabian StyleMu, Xiangpeng, Juan Bao, and Yunfei Chen. 2020. "Floating Ice Transport Conditions at the Cross-Sections Between Pier Columns in Open Ice-Water Two-Phase Flow Canals" Water 12, no. 6: 1813. https://doi.org/10.3390/w12061813
Note that from the first issue of 2016, this journal uses article numbers instead of page numbers. See further details here.