Attribution Analysis on Regional Differentiation of Water Resources Variation in the Yangtze River Basin under the Context of Global Warming


1
School of Geographical Sciences, Southwest University, Chongqing 400715, China
2
State Key Laboratory of Hydrology–Water Resources and Hydraulic Engineering, Hohai University, Nanjing 210098, China
3
Department of Geosciences, University of Oslo, P.O. Box 1047 Blindern, 0316 Oslo, Norway
4
State Key Laboratory of Simulation and Regulation of Water Cycle in River Basin, China Institute of Water Resources and Hydropower Research, Beijing 100038, China
*
Author to whom correspondence should be addressed.
Water 2020, 12(6), 1809; https://doi.org/10.3390/w12061809
Submission received: 25 May 2020
/
Revised: 20 June 2020
/
Accepted: 22 June 2020
/
Published: 24 June 2020
Abstract
:Characterized by increasing surface air temperature, global warming has altered the hydrological cycle at global and regional scales. In order to adapt water resources management under the context of global warming, attribution analysis on regional differentiation of water resources in the Yangtze River basin (YRB) was conducted in this study. Meteoro-hydrological variations across the basin were examined for the period 1960–2013, and then a statistic-based method was applied in quantifying the contributions of climate variability and human activities on annual runoff variations in different tributary sub-basins in the YRB. Our observation indicates that both the annual increasing rate and the inter-annual fluctuations of temperature in China and in the YRB were higher than that of the global average since the turn of the century. Climate change analysis indicates that the YRB experienced a hot-wet period during 1994–2002 and a hot-dry period during 2003–2013, since the step change of temperature in 1993. Contributions of climate change and human activities on runoff variations varied spatially in the basin. With reference to the baseline period of 1960–1993, the contribution of climate change played a dominant role in most regions of the basin, especially in those upstream sub-basins. The effect of human activities in the basin was quite complicated, not only its regional differentiation, but also its contribution were opposite during the hot-wet period and the hot-dry period in some sub-basins. The result of this study is helpful in understanding the impacts of climate change and human activities on water resources variation in both temporal and spatial scales.
1. Introduction
Since the industrial revolution, a large quantity of greenhouse gas (GHG) has been released to the atmosphere by human activity, leading to a series of serious environmental problems. Among which, the most widely known greenhouse effects are global warming and the subsequent climate change. It is reported that during the past 100 years (1906–2005), global surface temperature has risen by 0.74 ± 0.18 °C due to the continuous increase of greenhouse gases concentration in the atmosphere [1]. Under this context, there is little debate that climate change will alter the hydrological cycle in a variety of ways [2].
In order to adapt water resources management, investigation on the changes and driving mechanisms of water cycles and water resources at the catchment or regional scale has become one of the most basic issues for global sustainable development [3,4,5]. Climate change and human activities are the two fundamental driving factors for water cycle and catchment water resources. Climate change affects catchment streamflow, mainly through the effects on precipitation and potential evaporation [6,7]. A lot of studies have pointed out that statistical features of precipitation and potential evaporation have changed during the past decades. The enhanced precipitation extremes (e.g., [8]) and the well-known “evaporation paradox” [9] are the two aspects of climate change under global warming. On the other hand, the impact of human activities on local water resources is increasingly prominent. Evidence has demonstrated that human activities have strongly disturbed the basic characteristics of hydrological processes in a wide range of fields. Human activities, such as land use/cover change, agriculture irrigation, reservoir construction, wetland reclamation, as well as direct water extraction can alter the spatiotemporal distribution of river streamflow in varying degrees (e.g., [10,11,12]).
The Yangtze River basin (YRB) plays an important role in maintaining the ecological balance of the environment of China. It is also one of the fastest developing regions in China, which is essential for the socioeconomic development of the country. The river basin covers an area of 1.8 million km2, which accounts for almost 1/5 of China’s total land area. Hydrological modifications in the YRB have been quite prominent in recent decades. Most notably, the increasing floods and droughts frequency since the 1990s has caused great concern for local and central governments. On the other hand, rapid urbanization and the construction of a large number of water conservancy projects in the basin have also caused hydrological changes in varying degrees (e.g., [13,14]). So far, it is evident that there has been a lot of research on climate and streamflow changes in the YRB. For example, Ye et al. [15] studied the spatiotemporal variability of precipitation across the upper YRB. Tian and Yang [16] analyzed the trends of temperature and precipitation in the Yangtze River basin under the context of global warming. Li et al. [17] examined the decadal variations of summer dryness/wetness over the middle and lower reaches of the Yangtze River and the evolution of atmospheric circulation in the last 52 years. Wang et al. [18] studied the relationship between potential and actual evaporation in the YRB in response to the scientific issue of the “evaporation paradox”. Qi et al. [19] analyzed the changing characteristics and causes of runoff in the source regions of the Yangtze River under the background of climate change. Wei et al. [20] analyzed the streamflow changes of the Yangtze River in the past 60 years and investigated the impacts of the East Asian summer monsoon (ENSO) and human activities. All these studies are very useful in understanding the hydro-meteorological responses under global warming in the YRB. However, few studies focus on quantifying the relative effects of climate change and human activities on runoff change in the basin. In addition, due to the large area of the basin, geographical conditions and human activities vary significantly in both space (across the basin) and time and regional responses of water resource systems to climate change and human activities are very different.
This paper extends on previous studies in quantifying the impacts of climate change and human activities on local water resources variation in both temporal and spatial scales in the YRB. Different from previous studies, we emphasize the phase variation of hot-wet and hot-dry periods under the context of global warming, and investigate the potential difference in the impact of human activities on runoff change during the two different climate periods. Analyzing the hydrological responses to climate change and human activities is essential for a profound understanding of the watershed hydrological alteration, and is also critical for regional sustainable development of water resources and ecosystems. For a better and scientific management of water resources, land use planning, and ecological protection in the YRB, quantitative assessment and separation of the effects of climate change and human activities on streamflow changes are quite necessary. Generally, the objectives of this study include:
- systematically investigating the meteoro-hydrological changes in the YRB, especially their phase variation under the context of global warming;
- quantitatively assessing the contribution of climate change and human activities to the changes in runoff and their regional differentiation in the YRB; and
- investigating the potential difference in the impact of human activities on runoff change during the dry and wet periods.
2. Material and Methods
2.1. Study Area
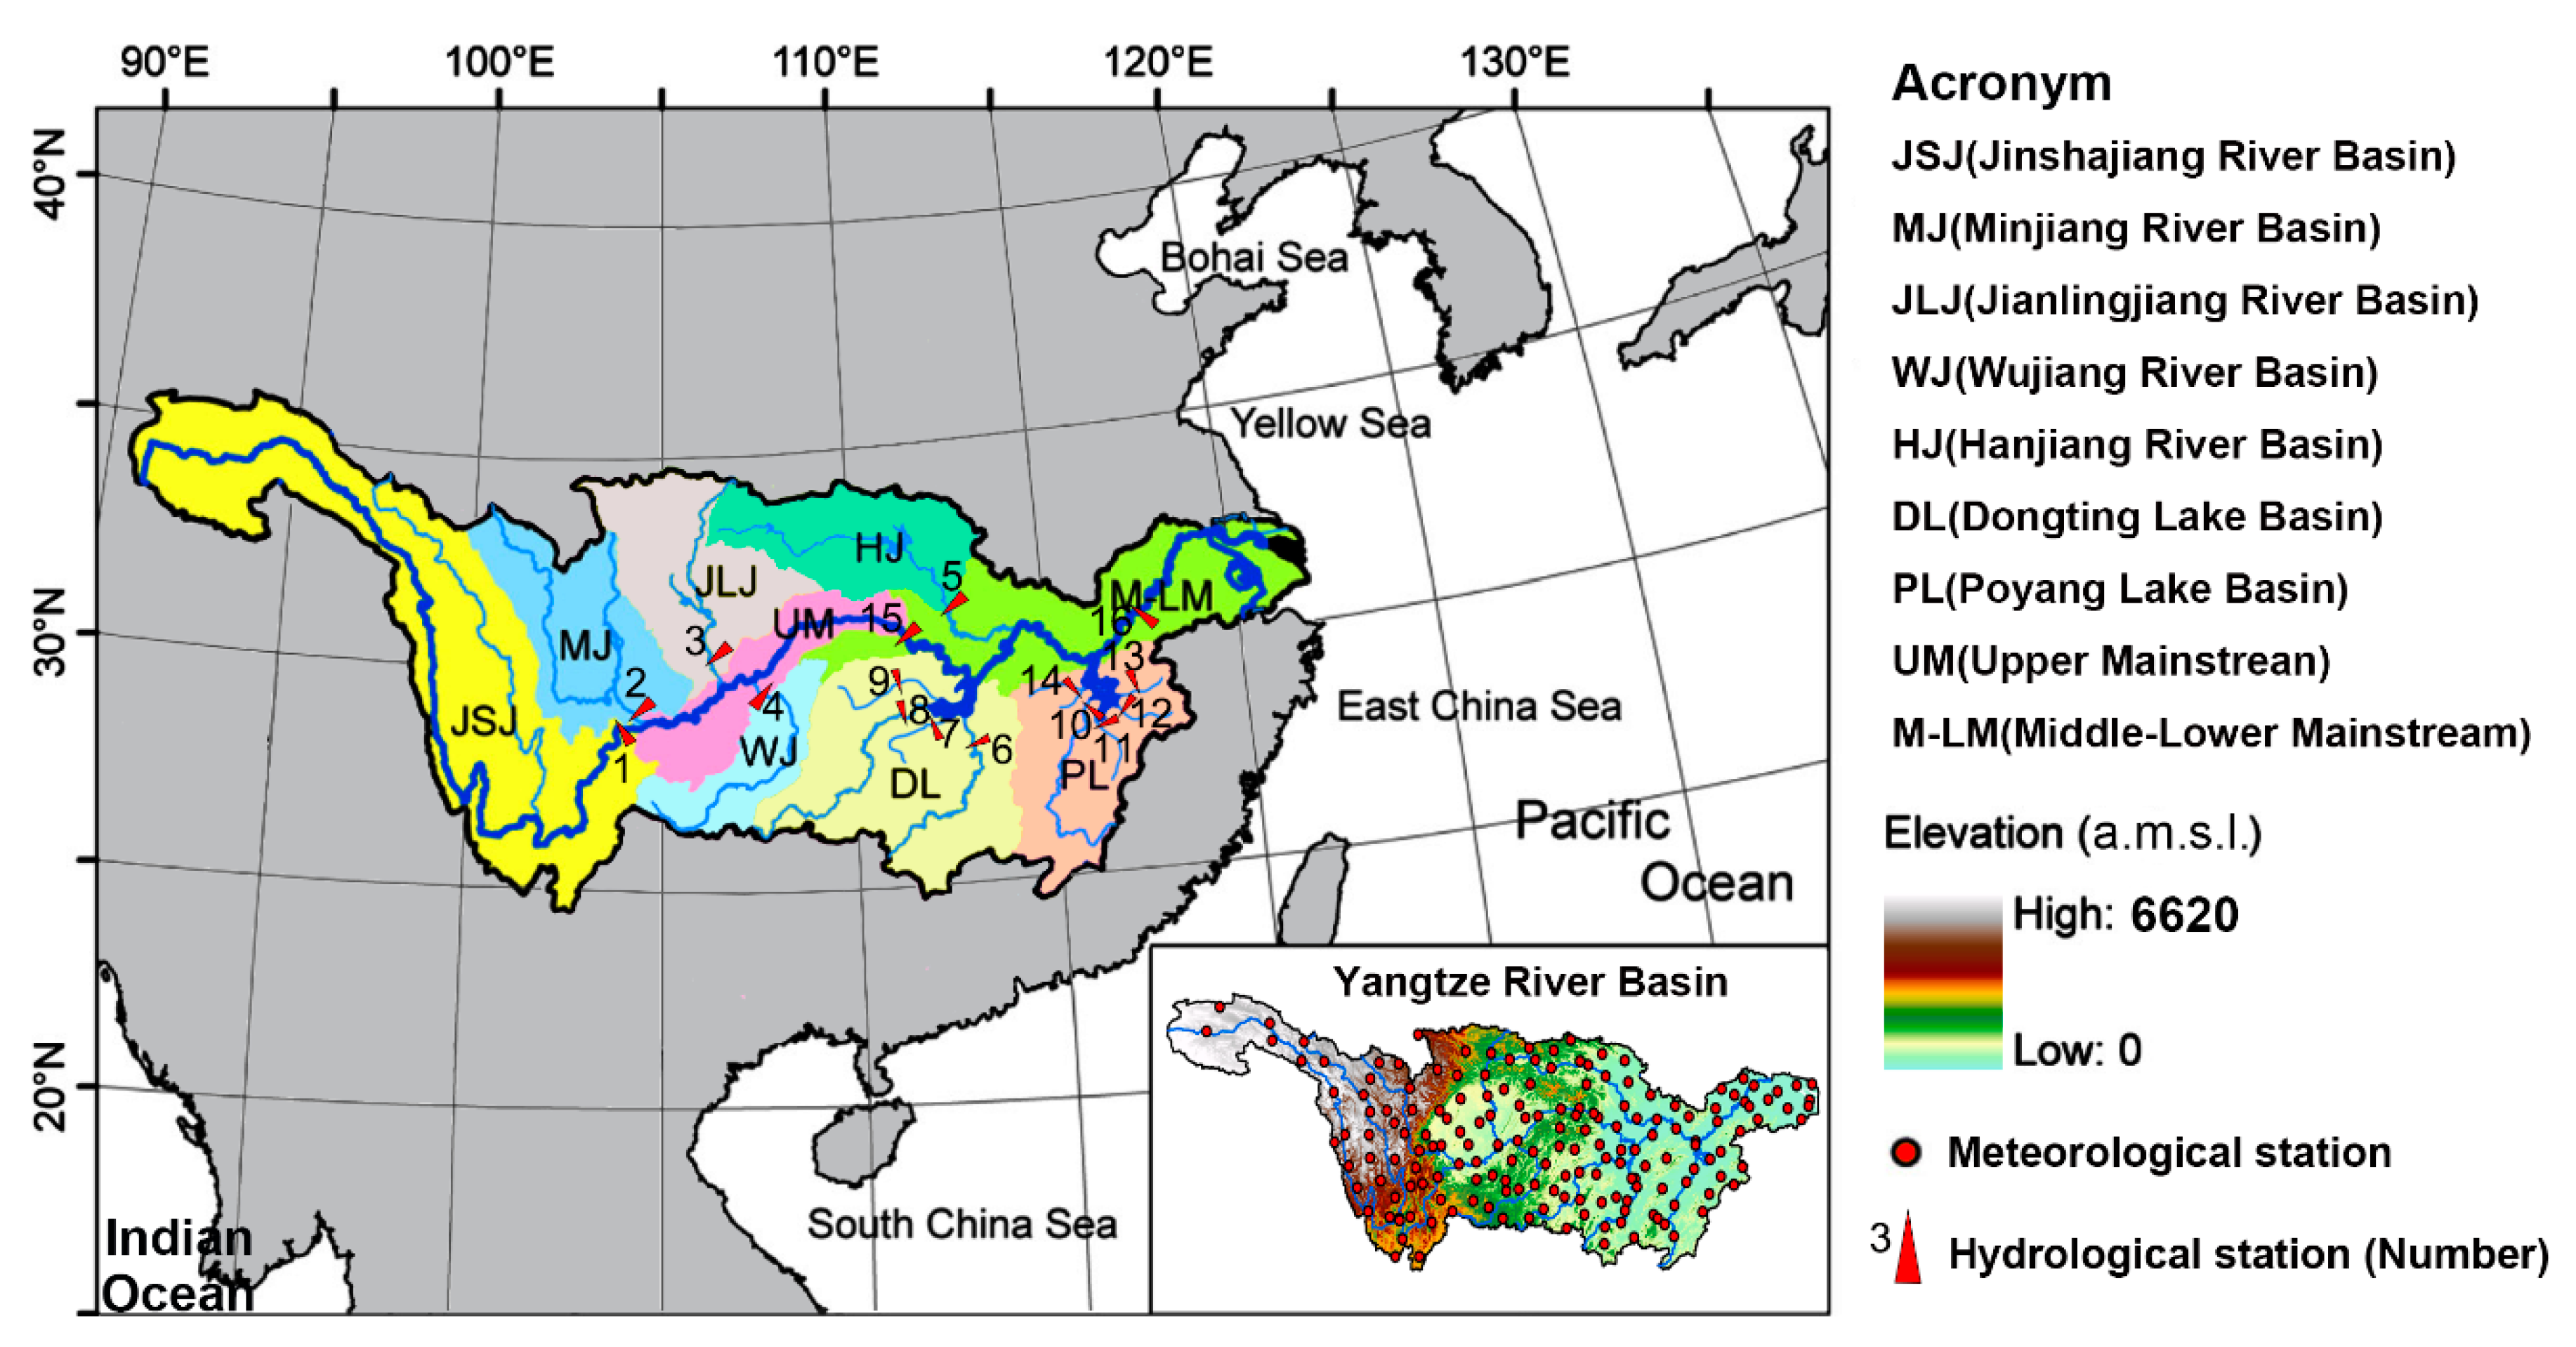
The Yangtze River, located in southern China (24°–36° N, 90°–122° E) (Figure 1), is the longest river in China and the third longest river in the world. The river originates in the Tanggula mountains of the Qinghai-Tibet Plateau and flows about 6300 km eastwards to the East China Sea. Landscape in the YRB varies significantly from west to east, including the high snow mountains with altitude > 4000 m a.m.s.l in the Qinghai-Tibet Plateau, the Yunnan-Guizhou Plateau with altitude between 1000–2000 m, the Sichuan basin with altitude between 200–800 m a.m.s.l, and the hills and floodplains in the middle-lower YRB with altitude <1000 m a.m.s.l.
Climatically, the YRB belongs to the subtropical monsoon region of East Asia. Mean annual temperature is about 14.5 °C and mean annual precipitation is about 1100 mm. The southern part of the basin is close to the tropical zone and the northern part is close to the temperate zone. Precipitation in the YRB is mainly determined by the East Asian Monsoon and the South Asian Monsoon sub-systems. However, due to great differences in landscape topography across the YRB, annual temperature and precipitation vary between −5.2–21.5 °C, and 288.7–2311.4 mm, respectively.
The Yangtze River receives a large number of tributaries from the upper and middle reaches, such as the Mingjiang (MJ), Jialingjiang (JLJ), Wujiang (WJ), Hanjiang (HJ), Dongting Lake (DL), and Poyang Lake (PL) (Figure 1), and river runoff of the main stream increases dramatically. As shown in Table 1, mean annual runoff at Xiangjiaba was 1432 × 108 m³ during the period 1960–2013, which was about 33.5% of the Yichang station and 16.2% of the Datong station. Due to regional differentiation of hydrothermal conditions, river runoff and its annual variation are very different between these river sub-basins. According to the increasing correlation with monsoon precipitation, coefficient of variation (Cv) of river discharge also increased from upper to downstream of the Yangtze River basin.
Annual runoff in the PL sub-basin had the highest Cv, followed by HJ, DL, JLJ, WJ, JSJ(Jingshajiang), and MJ sub-basins. The Cv at Yichang was 0.11 and 0.13 at Datong of the mainstream hydro-stations, which is extremely low compared with data for the other large rivers worldwide [21].
2.2. Available Data
Monthly meteorological data from 152 weather stations inside the YRB (see Figure 1) were obtained from the National Climate Centre of China Meteorological Administration (CMA) (http://data.cma.cn/). The data included monthly precipitation, temperature, relative humidity, sunshine duration, and wind speed during the period 1960–2013. All the climate variables provided by CMA had gone through a standard quality control process before delivery, and with no missing data on the variables used in this study. Based on the meteorological datasets, monthly potential evaporation () of the weather stations was estimated by the Penman–Monteith equation [22], which is recommended by the Food and Agriculture Organization (FAO) of the United Nations.
In addition to the above meteorological data, we also collected annual river discharge of major gauging stations on the mainstream and tributaries of the Yangtze River. These data were extracted from Changjiang Sediment Bulletin 2015 by a Matlab program (Matlab 2015, The MathWorks Inc., Natick, MA, USA) image2data (http://www.useful2you.com/download/). The Changjiang Sediment Bulletin is published every year and can be accessed freely (http://www.cjh.com.cn). In this study, average error between the extracted and observed data of annual river discharge was less than 0.5%, which guaranteed the reliability of the research data. Table 1 shows the basic features of hydrological data of the major gauging stations during 1960–2013. Locations of these gauging stations are shown in Figure 1.
2.3. Analysis of Temporal Variability
The commonly used non-parametric method of the Mann–Kendall’s (MK) test [23,24,25] was applied to analyze the trend of annual hydrological and meteorological data. In this method, the null hypothesis of no trend is rejected if standardized statistics |Z| ≥ 1.96 at 0.05 significance level and rejected if |Z| ≥ 2.32 at 0.01 significance level. The positive value of Z indicates an increasing trend, while a negative value of Z indicates a decreasing trend.
To investigate the possible change point of temperature, precipitation, and potential evaporation of the YRB, the cumulative sum charts (CUSUM) suggested by Taylor [26] were applied. Normally, the long-term upward and downward movements of the cumulative sum curve reflect an increasing and decreasing period of the variable, and the transition of the two processes may indicate the occurrence of the change point.
2.4. Budyko–Fu Based Hydrological Sensitivity Estimation
For a given watershed, the long-term water balance can be quantified as:
where is average annual precipitation (mm/year), is the average annual actual evapotranspiration (mm/year), is average annual runoff depth (mm/year), and is the average annual change in water storage of the watershed (mm). Over a long period of time (i.e., 10 years or more), can be reasonably assumed as zero, and then can be estimated as the difference between and .
In practice, the estimation of requires first calculating potential evaporation () and then applying the proper crop coefficients [27]. Budyko [28] proposed that average annual evapotranspiration from a given watershed is determined by the balance between the water supply (precipitation) and evaporation capacity (net radiation or potential evaporation). The simplified equation is given as:
where is the dryness index. When > 1, the watershed is considered to be dry and the energy supply impedes evaporation, while < 1 indicates that the water supply impedes evaporation and the watershed is humid.
Scientists have developed several mathematical Budyko-type hypotheses to describe the Budyko framework (e.g., [28,29,30,31,32,33]). Among these hypotheses, Budyko–Fu was one of the most popular equations that has only one single parameter, making it flexible under different geographical environments. The equation has shown good applicability in China [30].
The mathematical expression of Budyko–Fu is given as:
where is model parameter that may relate to the geographical setting, soil properties, and vegetation [32]. The parameter m can be calibrated by comparing the long-term annual calculated from Equations (1) and (3).
Perturbations in both precipitation and potential evaporation can lead to changes in water balance. Based on the sensitivity relationship, the change in runoff caused by climate change (precipitation and potential evaporation) can be approximated as follows [6,34]:
where ∆P, ∆Ep are the changes in precipitation and potential evaporation in two different periods, respectively; and are the sensitivity parameters of runoff to precipitation and potential evapotranspiration, which are determined by and , respectively. According to Equations (1) and (3), and can be further expressed as follows:
With , the impact of human-induced change in runoff () can be obtained as:
3. Results
3.1. Variation of Regional Temperature
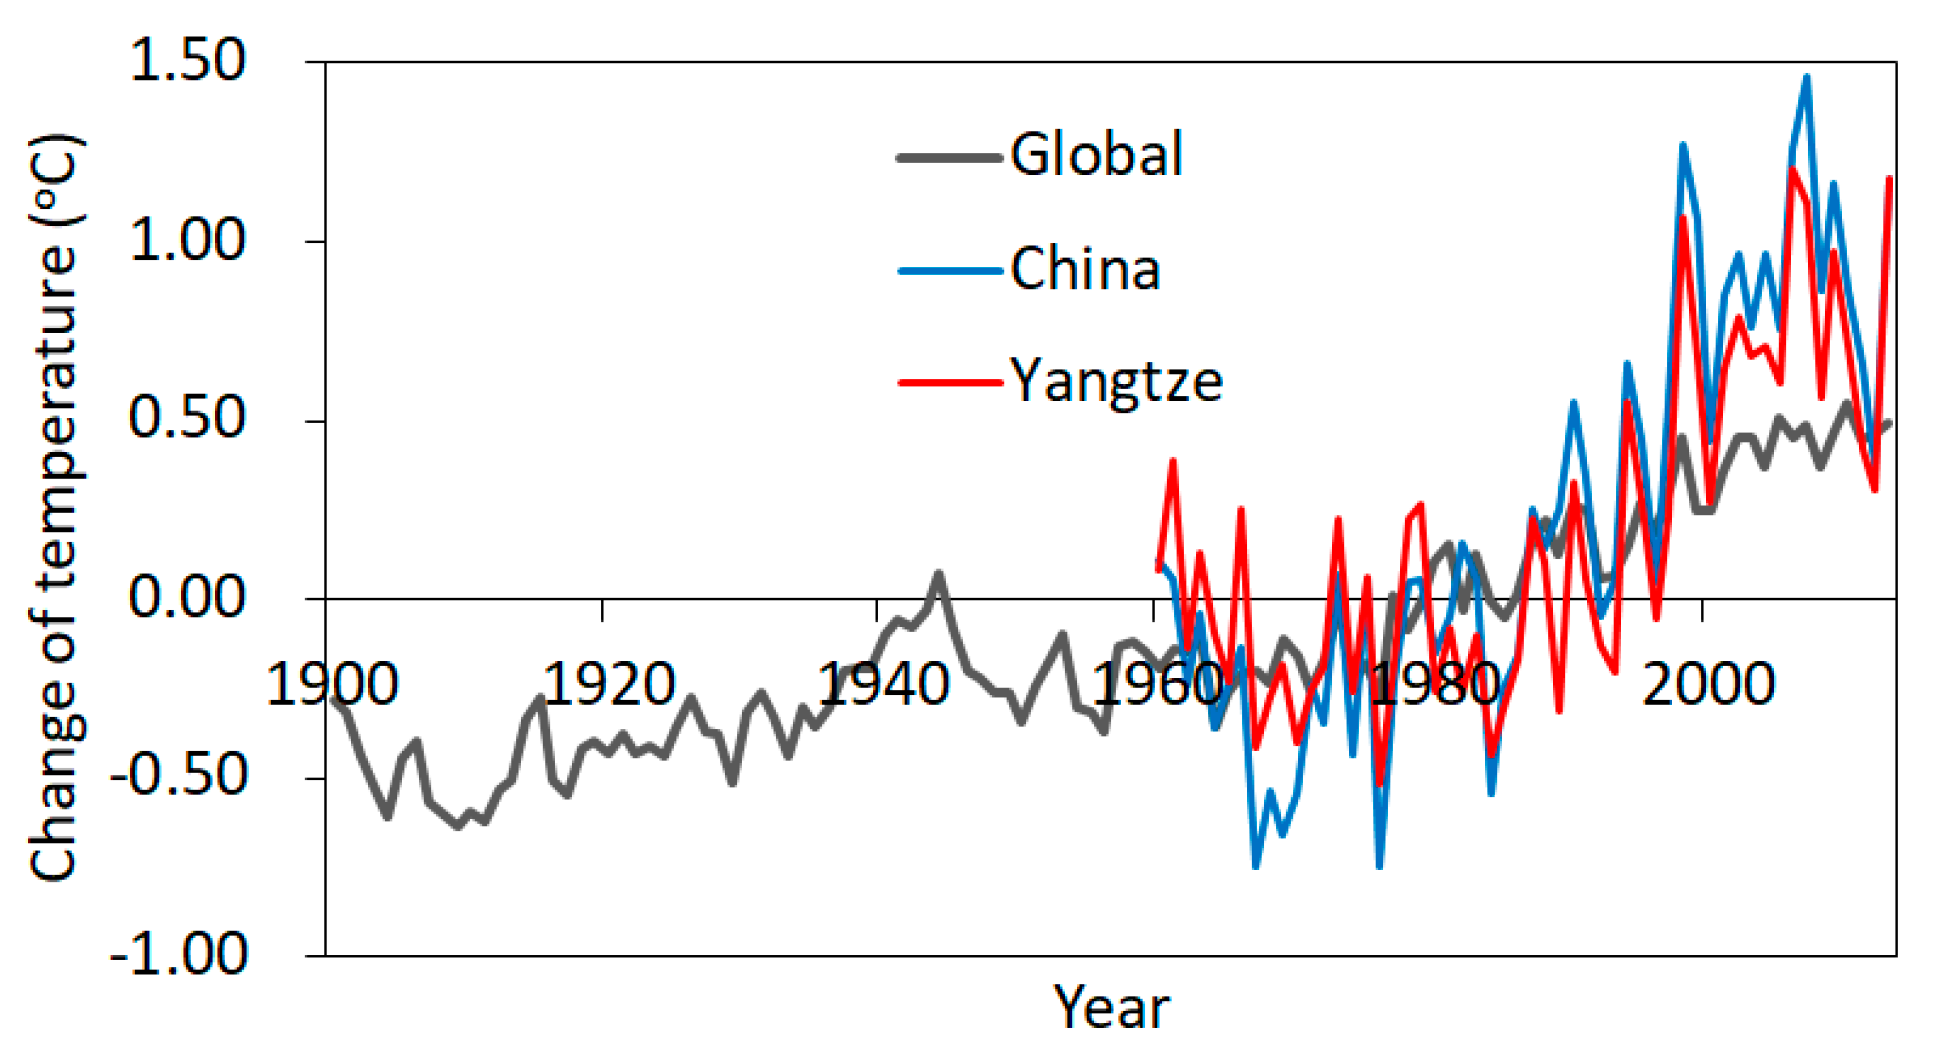
Figure 2 shows the variations of annual temperature at a global scale, in China, and in the YRB. It can be seen in the figure that the increase of temperature was particularly prominent since the earlier 1990s. Annual rate of increase and the inter-annual fluctuations of temperature in China and in the YRB are higher than that of the global average since the turn of the century.
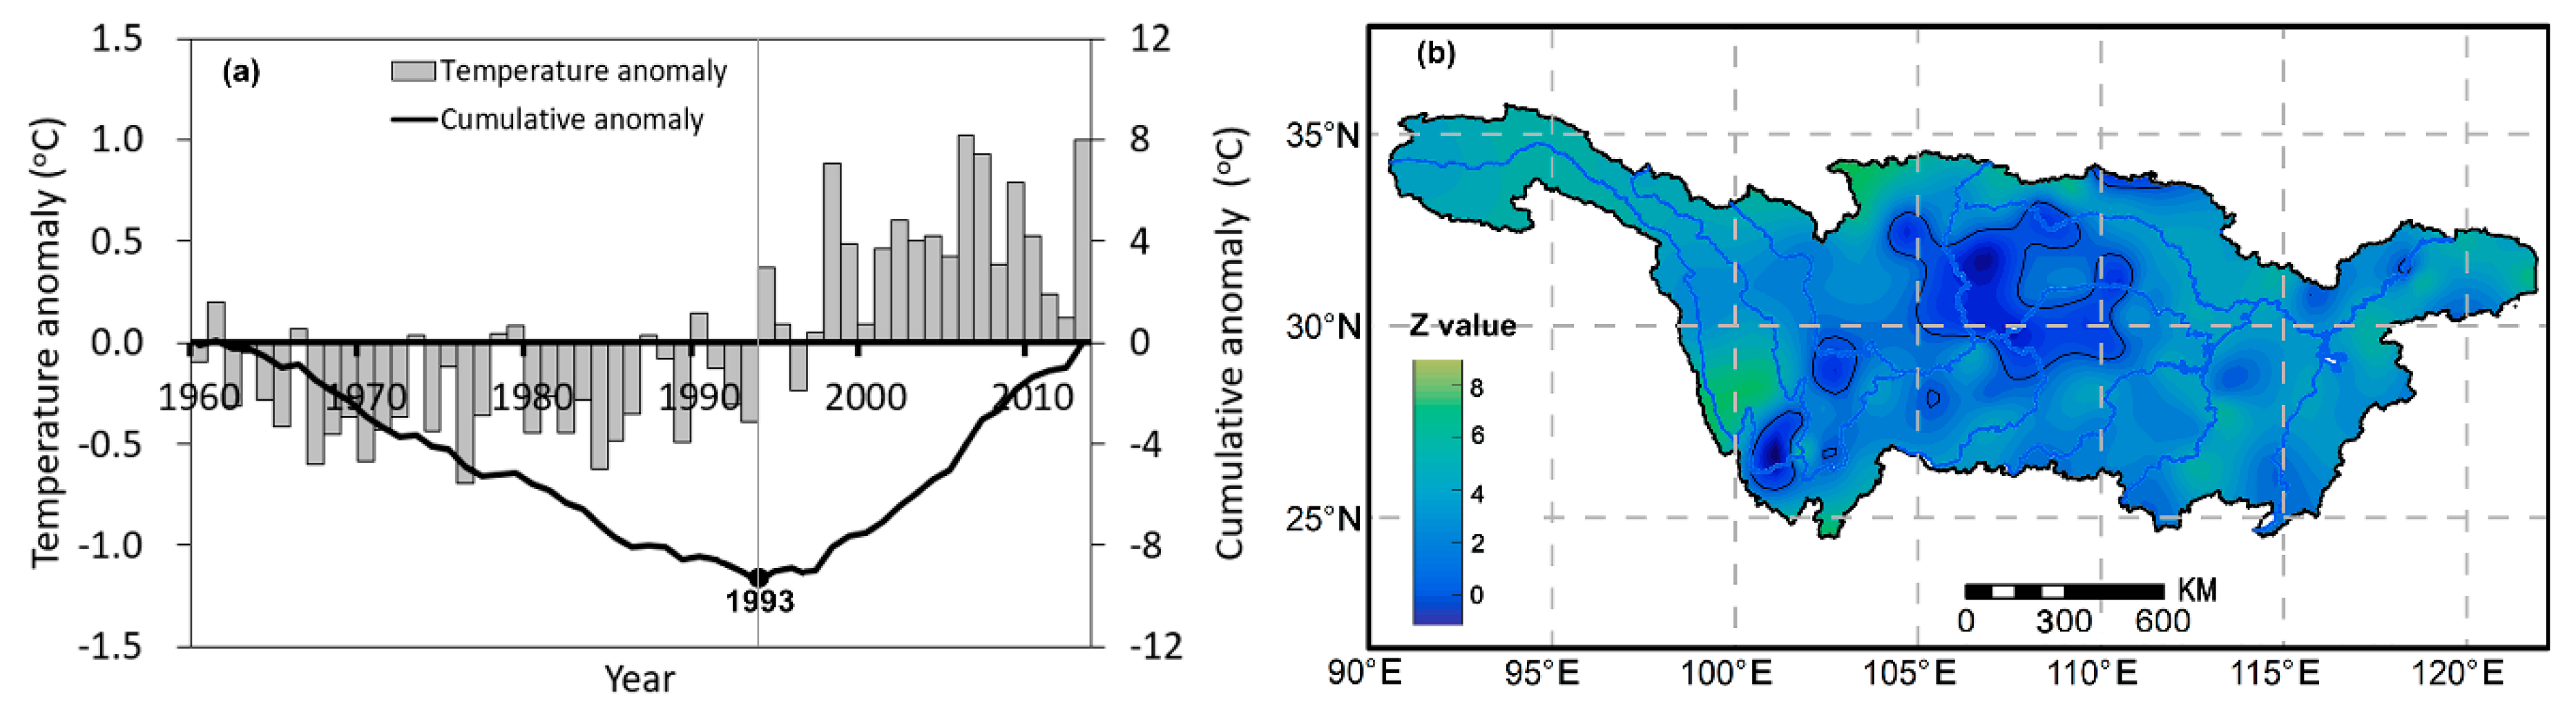
Variation of annual temperature of the YRB showed a significant increasing trend during the period of 1960–2013 (Z value is 4.42). The linear trend rate was about 0.2 °C per decade. According to the cumulative anomaly in Figure 3a, an obvious change point occurred in 1993. Relatively low temperatures of the YRB with negative anomalies prevailed during the period 1960–1993, while it turned to a high temperature period after that. Average temperature of the YRB during 1994–2013 was about 0.74 °C higher than that during 1960–1993. Most notably, the abnormal high temperature has persisted since 1998. Spatially, 87% of weather stations showed a significant increasing trend across the basin. Only three weather stations with decreasing trends were observed in the center and southwest parts of the basin (Figure 3b).
3.2. Variation of Precipitation and Potential Evaporation
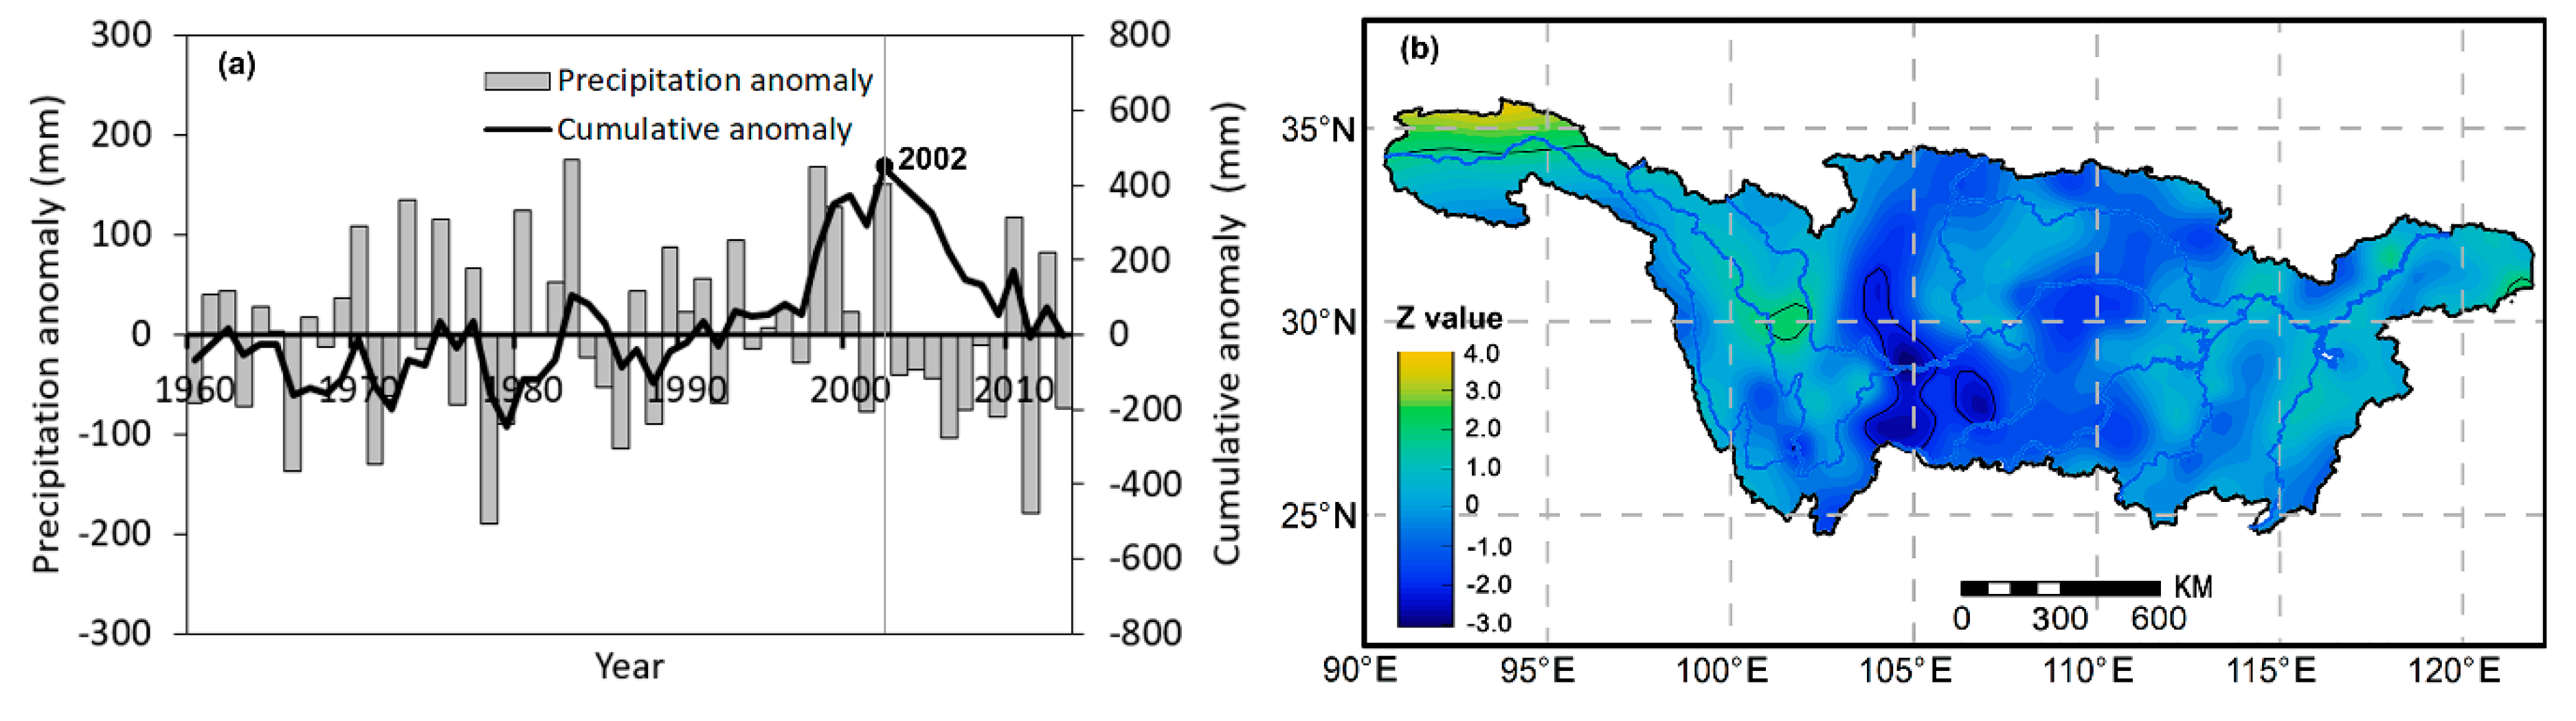
Figure 4a presents the variation of annual precipitation anomaly and its cumulative anomaly during 1960–2013. Generally, precipitation of the YRB showed a large inter-annual fluctuation, while no obvious linear trend can be observed (Z value is −0.39). Cumulative anomaly indicates an inter-decadal oscillation. Since the step change of temperature occurred in 1993, the YRB has experienced a wet period with relatively more precipitation during 1994–2002 and a dry period with relatively less precipitation during 2003–2013.
Spatially, about half of the YRB showed an increasing trend of precipitation while the other half showed a decreasing trend. However, annual precipitation with significant increasing or significant decreasing trends were only observed in few stations (Figure 4b).
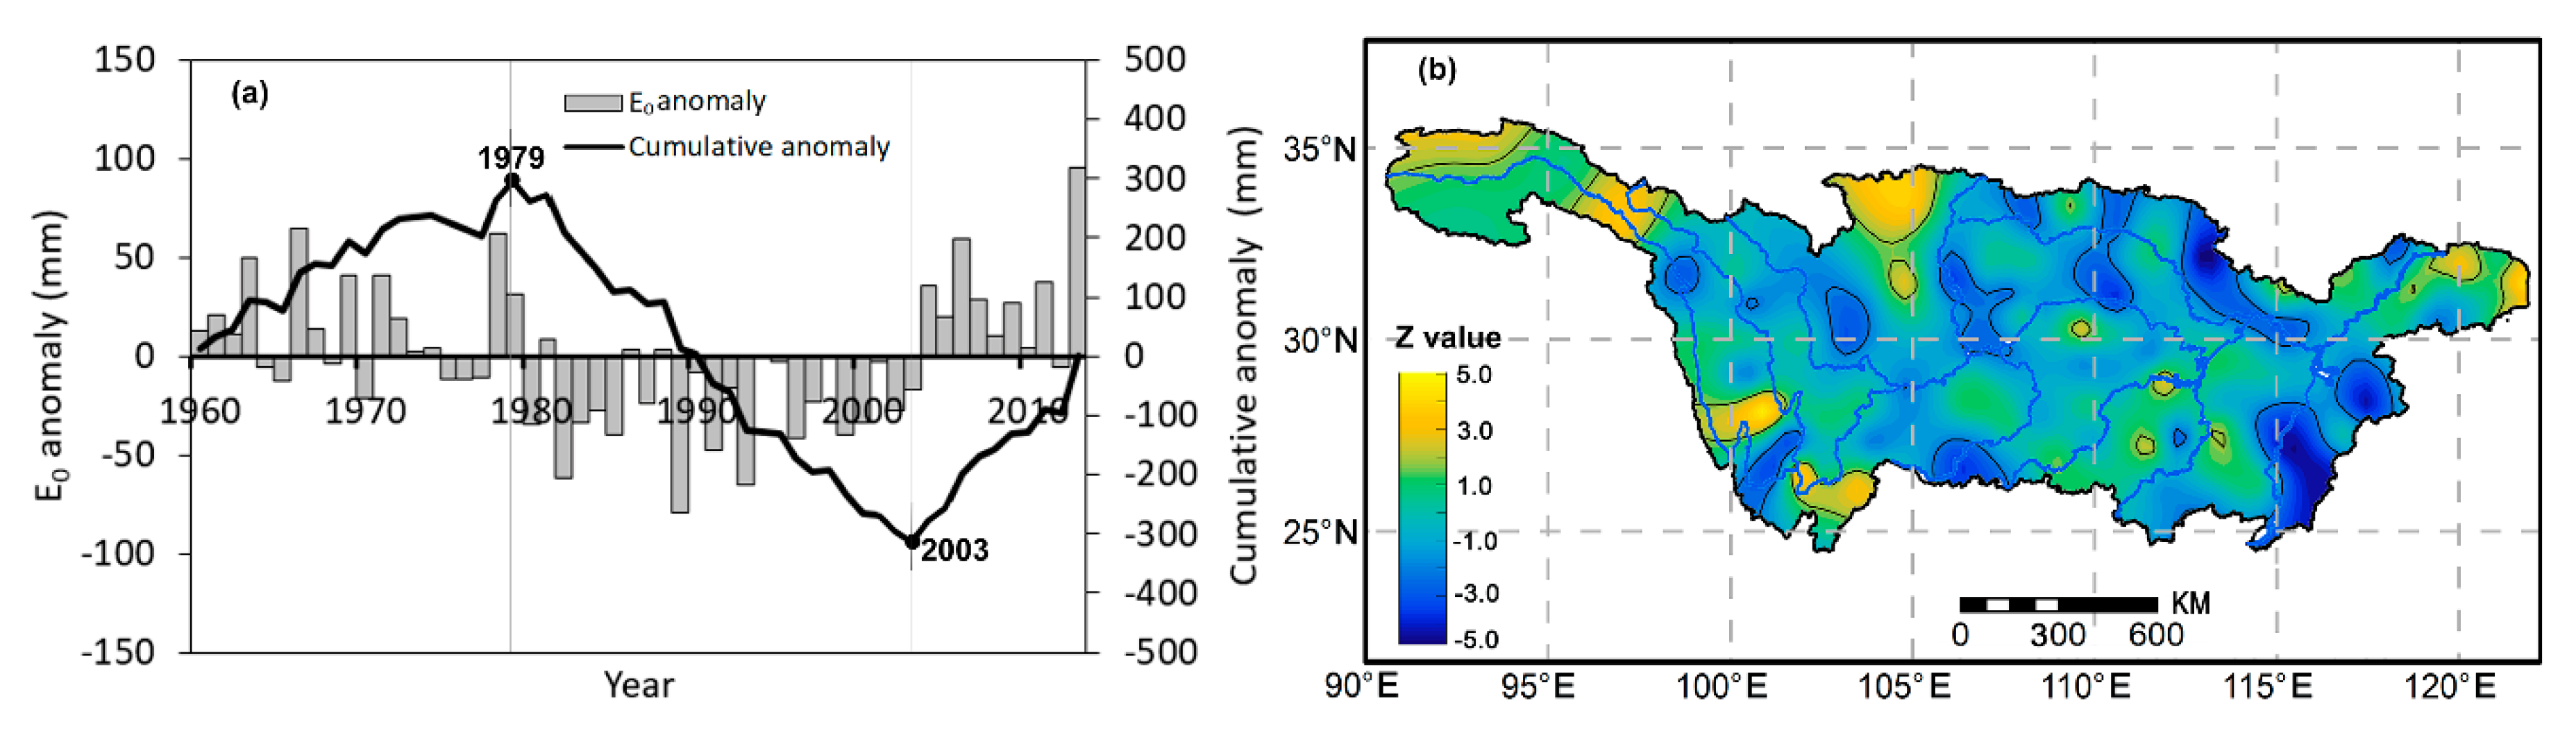
Different from the step change characteristics documented for temperature and precipitation, two obvious change points in 1979 and 2003 can be observed for the annual variation of potential evaporation () during the study period (Figure 5a). The two change points separated the annual variation of into three different periods: a period with relatively strong E0 during 1960–1979, a period with relatively weak E0 during 1980–2003, followed by a period with relatively strong E0 during the most recent years of 2004–2014. Similar to precipitation, the linear trend of was not obvious during the study period (Z value is −0.57). Spatially, areas with significant increasing or decreasing trends of were widely scattered across the basin (Figure 5b).
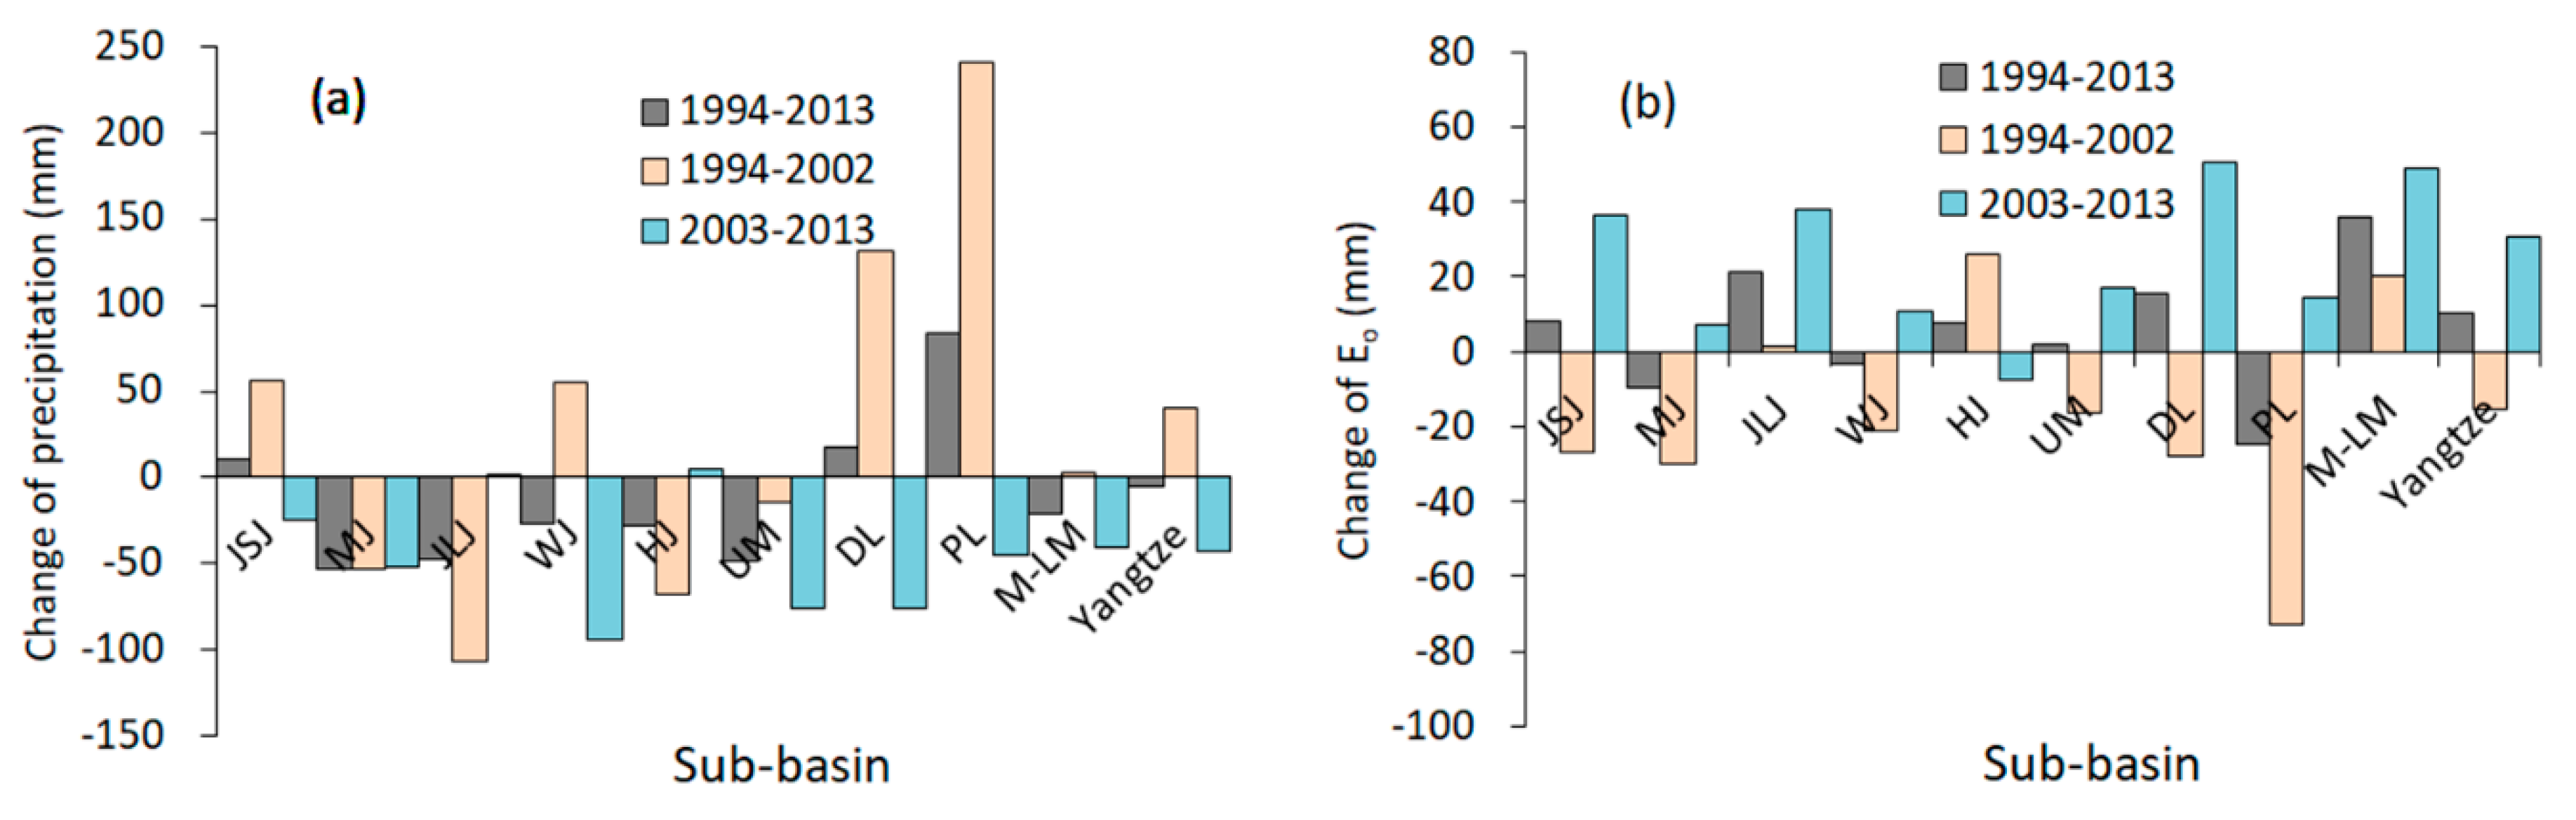
According to the observed step change and cumulative anomaly of temperature, precipitation, and potential evaporation in the basin, climate change of the Yangtze River in recent years can be divided into two different periods: a hot-wet period during 1994–2002 and a hot-dry period during 2003–2013 with reference to the baseline period of 1960–1993. On this basis, regional differentiation of relative changes in precipitation and E0 was then statistically analyzed. It can be seen in Figure 6a that a remarkable increase of precipitation during the hot-wet period of 1994–2002 mainly occurred in the DL and PL sub-basins. However, precipitation in MJ, JLJ, HJ, and UM sub-basins still deceased.
The maximum increase of precipitation in the PL sub-basin was about 240 mm, and the maximum decrease of precipitation in the JLJ sub-basin was about 107 mm. During the hot-dry period of 2003–2013, precipitation in almost all the sub-basins decreased by about 24–94 mm, except for a slight increase of 2.1 mm and 4.8 mm in the JLJ and HJ sub-basins, respectively. In contrast, the E0 in most of the sub-basins decreased during the hot-wet period of 1994–2002, except for a slight increase in HJ and M-LM (Middle-Lower Mainstream) sub-basins (Figure 6b). The maximum decrease in E0 of 72 mm was observed in the PL sub-basin. The increased E0 during the hot-dry period of 2003-2013 was estimated to be 7–50 mm across the YRB, except for a 7.4 mm decrease observed in the HJ sub-basin.
3.3. Variation of Annual Runoff
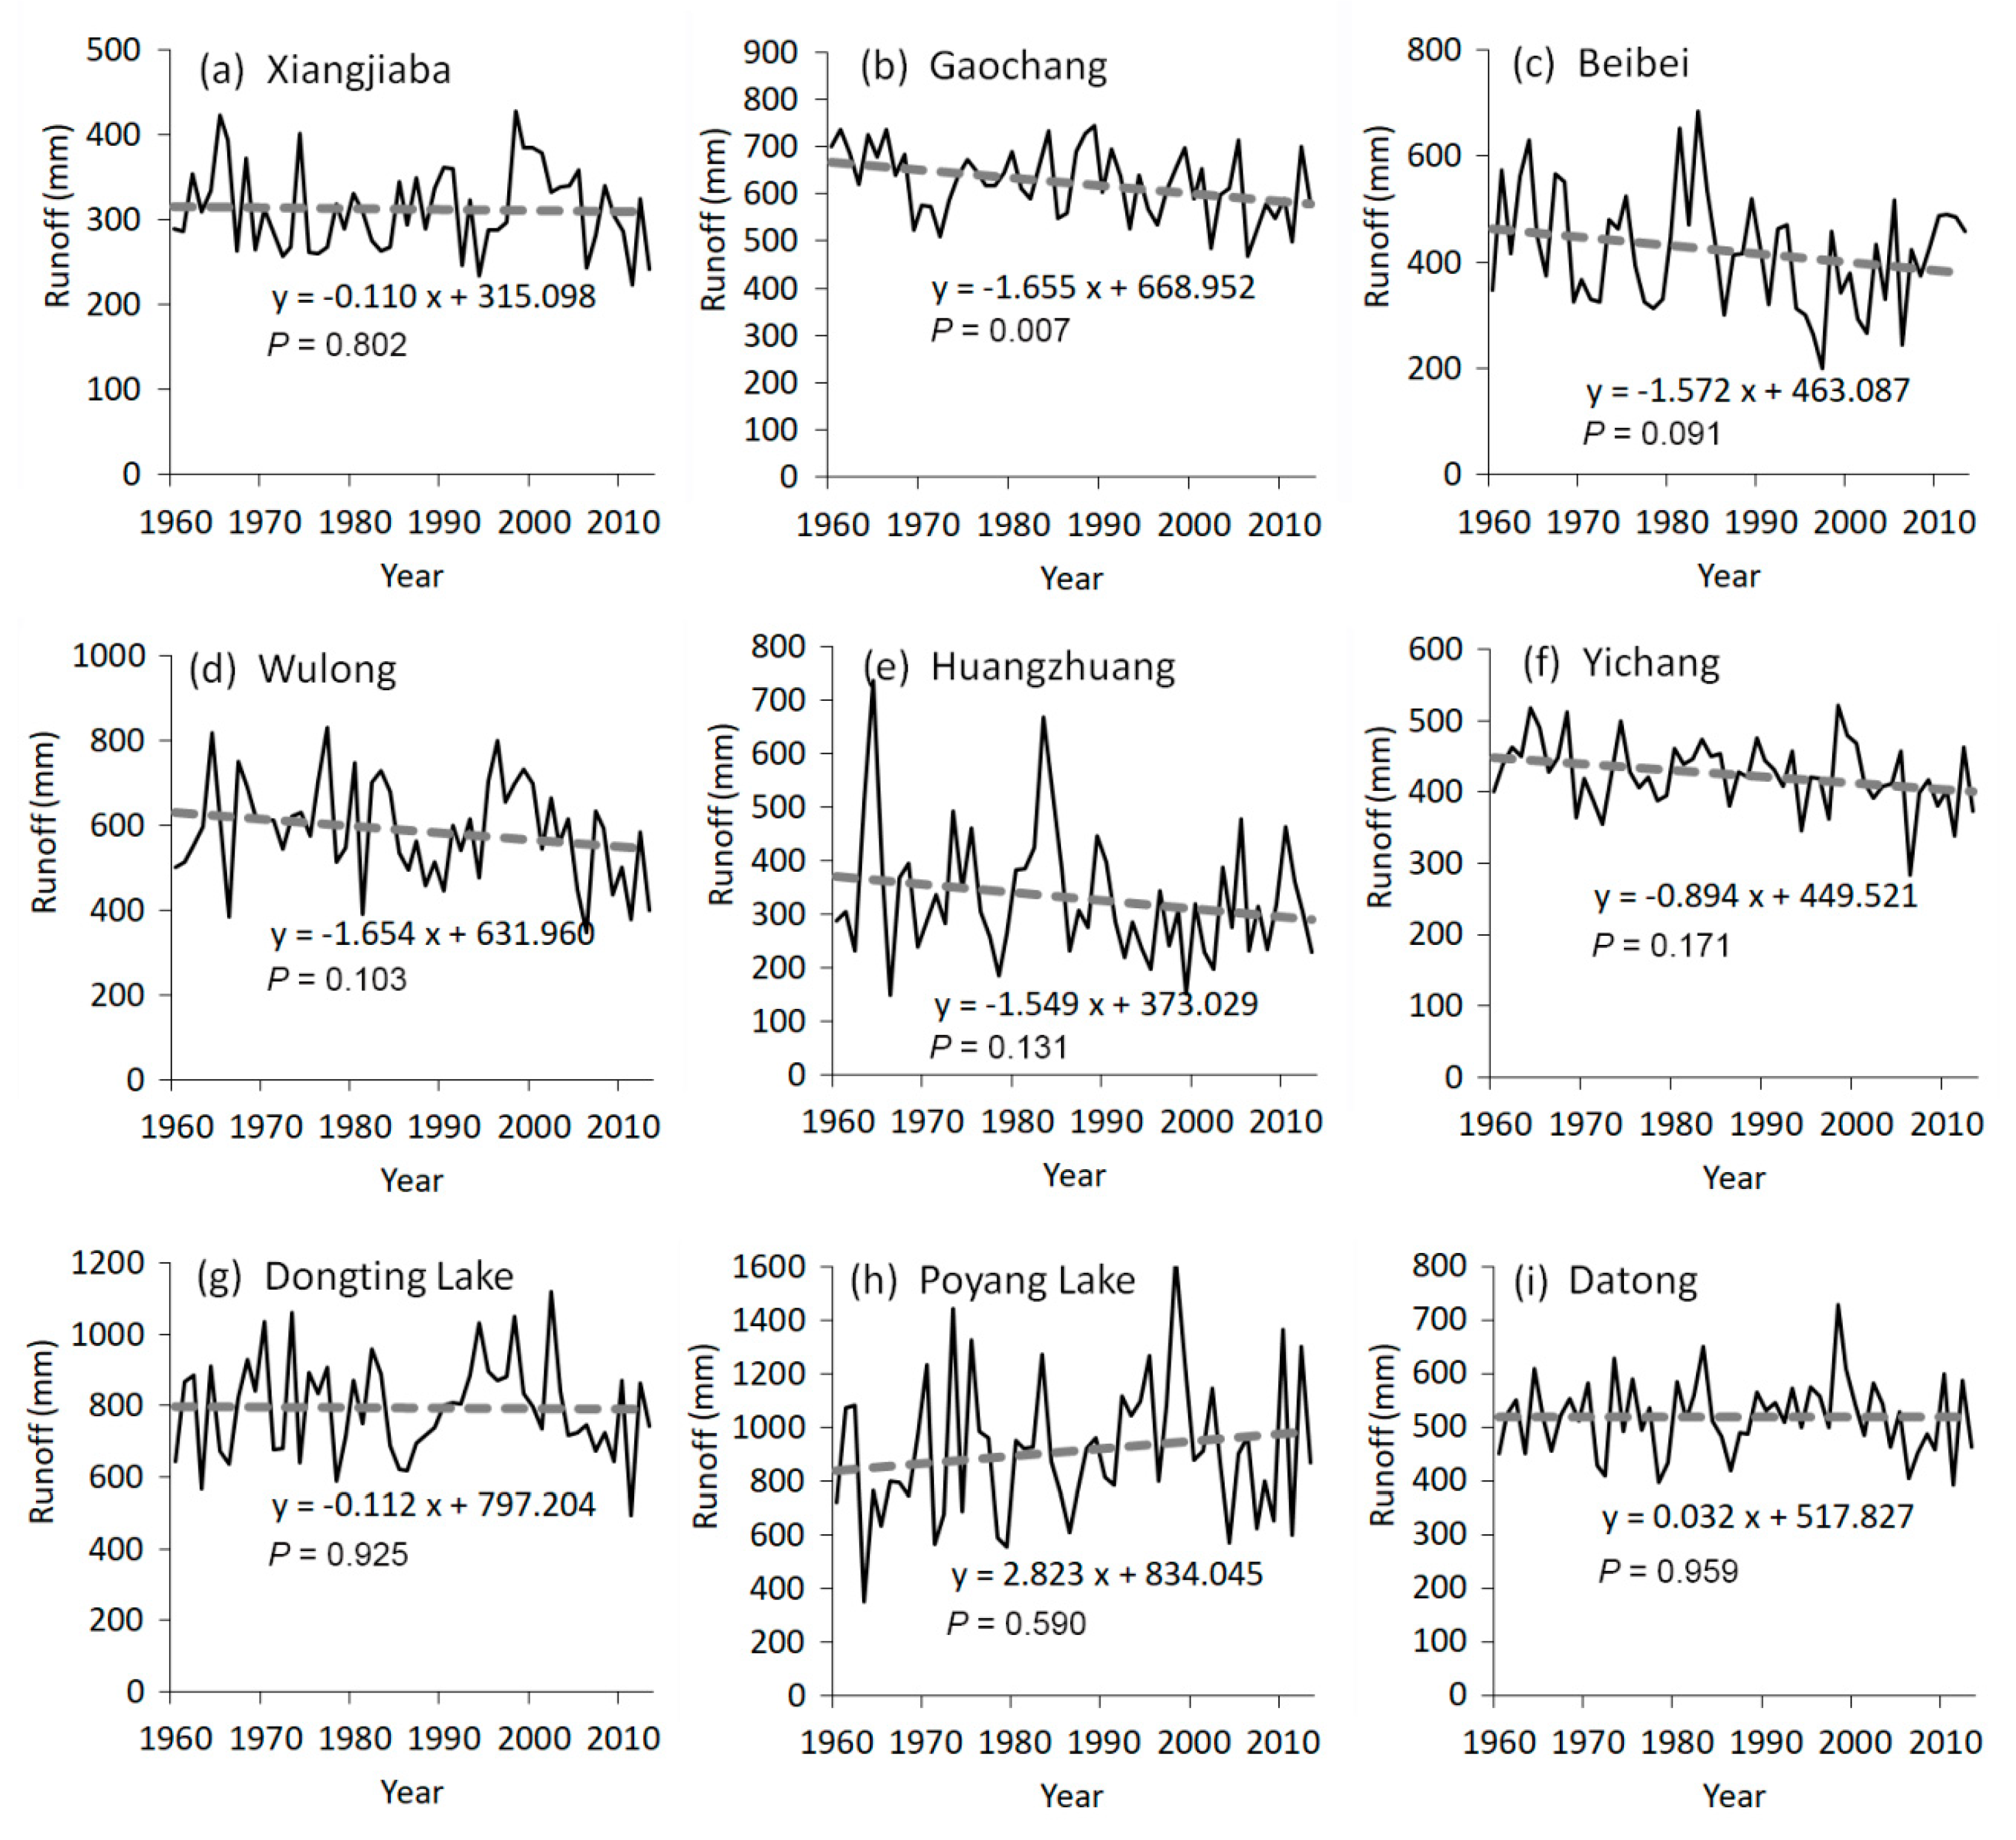
During the study period, runoff of most hydro-stations showed a long-term decreasing trend (Figure 7). The decreasing trend was relatively prominent at Gaochang, Beibei, Wulong, Huangzhuang, and Yichang stations according to the Mann–Kendall’s test. Most notably, the runoff decrease at the Gaochang station reached a significance level of 0.05. In addition, the hydro-stations with decreasing runoff are mainly located in the upper reach of the YRB, except for the Huangzhuang station in the HJ sub-basin. The relative increasing trend was only found in the PL sub-basin in the lower reaches of the YRB. The trend was very weak in the DL sub-basin as well as at the other hydro-stations such as Xiangjiaba and Datong.
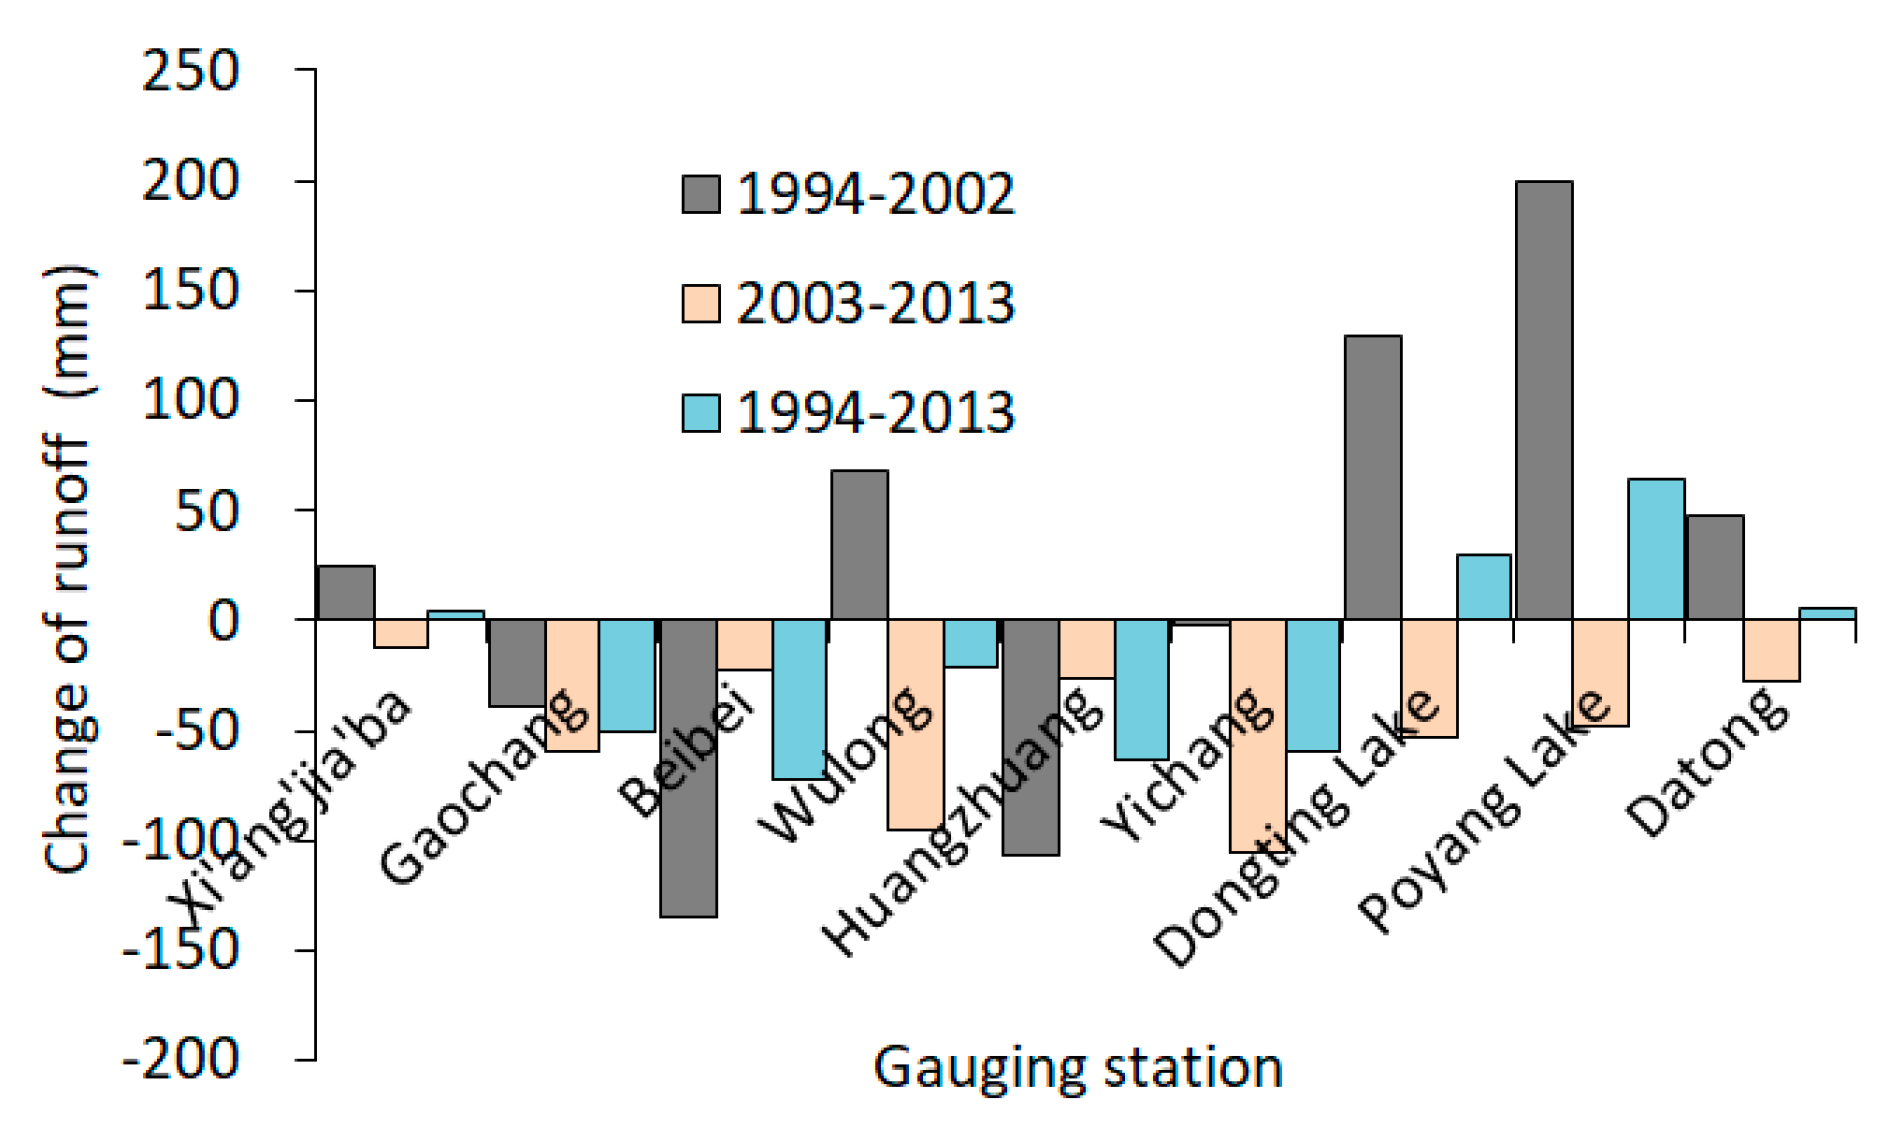
Relative change of runoff during the three different periods was highly consistent with that of precipitation in the basin (Figure 8). With reference to the baseline period of 1960–1993, the increased runoff in the DL and PL sub-basins was about 129 mm and 199 mm, respectively, during the hot-wet period of 1994–2002. In addition, slight increase of runoff was also found at Xiangjiaba, Wulong, and Datong hydro-stations. During the hot-dry period of 2003–2013, runoff of all the hydro-stations was commonly decreased and ranged between −12 mm and −105 mm. For the period of 1994–2013, runoff showed a decreasing trend in all the other sub-basins except for a certain increase in the DL and PL sub-basins.
3.4. Regional Differentiation of Attribution Analysis
Changes in runoff for a given basin can be attributed to the effects of climate variability and human activities. The results of the Budyko–Fu-based hydrological sensitivity estimation in distinguishing the impacts of climate change and human activities in runoff change are shown in Table 2. In this method, m is the only model parameter that needs to be calibrated. According to the hydro-meteorological observations in the baseline period, the optimized for the sub-basins of JSJ, MJ, JLJ, WJ, HJ, DL, PL, and the whole YRB are 1.34, 1.51, 2.12, 1.45, 1.72, 3.20, 7.00, and 2.14, respectively. The difference of m for each sub-basin well reflects the spatial heterogeneity of underlying surfaces across the YRB. With the optimized m values, the sensitivity coefficients of and for each sub-basin and the whole YRB were calculated (Table 2). Generally, the result indicates that the change in runoff was more sensitive to P (precipitation) than to (potential evaporation) across the YRB.
Based on the method of hydrological sensitivity analysis, all the calculated parameters were then used to estimate the impacts of climate change and human activities on the variation of runoff with reference to the baseline period of 1960–1993. It is clear from the table that the change of runoff and its responses to climate change and human activities varied dramatically across the YRB. During the hot-wet period (1994–2002), the increased runoff in JSJ, WJ, DL, and PL sub-basins attributed to climate change was estimated to be 46.4–296.3 mm, while the specific contribution of human activities was −96.7–18.2 mm. Human activities in the WJ and DL sub-basins showed an increasing effect on runoff. In the other sub-basins, such as MJ, JLJ, and HJ, both the contributions of climate change and human activities were negative, and climate change was the dominant driving factor. During the hot-dry period (2003–2013), runoff of all the river sub-basins decreased. The contribution of climate change was negative, which decreased runoff by about 11.2–93.1 mm across the YRB, except for an increasing contribution of 5.1 mm in the HJ sub-basin. In contrast to the negative contribution during the hot-wet period, human activities increased runoff by about 11.5 mm, 40.5 mm, and 5.5 mm in the JSJ, DL, and PL sub-basins, respectively. However, human activities still had a negative contribution on decreasing runoff in the MJ, JLJ, WJ, and HJ sub-basins. Especially, the contribution of human activities in the HJ sub-basin was −31.7 mm, which is larger than the positive contribution of climate change, making it the dominant driving factor for the change of runoff during this period. For the period 1994–2013, in addition to the HJ sub-basin, human activities also dominated the change of runoff in the DL sub-basin, although the contributions in the two sub-basins are opposite. For the whole YRB (gauged at Datong hydro-station), the estimated contribution of climate change on the increase of runoff during the hot-wet period of 1994–2002 was 48.9 mm, while specific contribution of human activities was −1.1 mm. For the hot-dry period of 2003–2013, the estimated contribution of climate change on the decrease of runoff was about −40.9 mm, and the effect of human activities was 12.9 mm.
4. Discussion
According to phase variation of temperature and precipitation, it was revealed that the YRB experienced a hot-wet period during 1994–2002 and a hot-dry period during 2003–2013, with an obvious increase of temperature since 1993. As the YRB belongs to a subtropical monsoon climate, spatiotemporal variation of precipitation is controlled by the East Asian Monsoon sub-system and the South Asian Monsoon sub-system [35]. However, during the hot-wet period of 1994–2002, the increased precipitation of the YRB was mainly contributed by the increased precipitation in the DL and PL sub-basins. Statistics indicate that the most severe floods in the summers of 1998, 1996, and 1995 in the YRB occurred in these regions. The background mechanism was mainly attributable to increased fluctuation of warm season rainfall in the mid-lower YRB as a consequence of a southward shift of major warm-season rain bands to the south of the YRB since 1990 [36]. In contrast to the increased precipitation that mainly occurred in the mid-lower YRB during the hot-wet period, the decrease of precipitation during the hot-dry period of 2003–2013 prevailed all over the basin. This may indicate a new feature of regional climate change under global warming.
During the past decades, the well-known “evaporation paradox” has been widely observed (e.g., [37,38]). In our study, potential evaporation of the YRB also shows a typical phase variation during the past few decades. Potential evaporation of the YRB showed a decreasing trend before 1990s, while it turned to an increasing trend after that. In consideration of temperature variation in the YRB, it is clear that both temperature and calculated E0 showed a consistent increasing trend since the early 1990s. This observation indicates that the so-called “evaporation paradox” in the YRB has disappeared since the early 1990s.
A previous study from Xu et al. [27] revealed that in the YRB, variations of pan evaporation and reference evapotranspiration are mainly affected by net total radiation and wind speed. Wang et al. [39] pointed out that wind speed was the major factor dominating variability of reference evapotranspiration in China, followed by temperature, sunshine duration, and relative humidity. However, the relative contributions of climatic variables to potential evaporation are temporally unstable and vary considerably with large fluctuation [39].
The effect of human activities in the YRB is quite complicated, not only its regional differentiation but also its contribution are very different during the hot-wet period and the hot-dry period in some sub-basins. Generally, the intensity of human activities has been increasing according to the increasing population, irrigation area, and Gross Domestic Product (GDP) in the YRB during the past decades [40]. In comparison to the baseline period of 1960–1993, the calculated runoff ratio (i.e., R/P) in all the sub-basins across the YRB has been reduced during 1994–2013, indicating a weakened runoff generation capacity due to human activities. The weakened runoff generation capacity is possibly related to integrated effects of the increasing forest coverage, irrigation area, and reservoir capacity during the past decades. In addition, Yang et al. [41] contended that the Yangtze River streamflow is affected by increased consumption, which should have the effect of reducing the runoff ratio. However, it should be noted that the major effect of human activities across the YRB is very different. As Chen et al. [42] pointed out that HJ and DL sub-basins have experienced more rapid population growth, urbanization, and dam construction than that of the other sub-basins. The increased forest coverage mainly occurred in the PL and DL sub-basins [43]. Different from the negative contribution in the other sub-basins, the positive contribution of human activities in the DL sub-basin would be more affected by the rapidly decreasing natural wetlands.
In addition, our estimation demonstrated that the contribution of human activities in the JSJ and PL sub-basins was opposite during the hot-wet period and the hot-dry period. It is quite easy to understand the negative contribution of decreasing runoff across the YRB during the hot-wet period. However, positive contribution of increasing runoff was observed during the hot-dry period in two sub-basins. For the PL sub-basin, the positive contribution of human activities may originate from the increased groundwater exploitation during the hot-dry period. Normally, groundwater wells in the YRB are mainly distributed in those of the hilly and floodplain areas, such as in the JLJ, DL, and PL sub-basins [44]. It was reported that in the Hunan Province, which almost covers the area of the DL sub-basin, there are a total of 617 × 104 groundwater wells and annual groundwater exploitation in 2011 was about 16.01 × 10⁸ m3 [44]. During the hot-dry period, it is quite common that the utilization of surface water will be limited and reduced while the exploitation of groundwater will be increased. This will finally lead to the positive contribution of human activities in increasing runoff in some sub-basins. On the other hand, the increased impermeable area due to rapid urbanization since 2000 will also lead to the increase of surface runoff. For the JSJ sub-basin, the positive contribution of human activities in recent years may be affected by dam construction. In the headstream of the Yangtze River, dozens of large hydropower stations have been built or are being built in the JSJ sub-basin over the last few decades. The construction of these hydropower stations will cause massive destruction of original surface vegetation and reduction of forests. On this basis, canopy interception will be weakened, and runoff production capacity will be increased [40]. In general, due the complexity of human activities, further investigation on their integrated effect and regional differentiation on long-term variation of runoff was left for future study.
Errors and uncertainties should be mentioned. In this study, the hydrological sensitivity coefficient (i.e., the sensitivity coefficient of runoff to climate change) was estimated. However, it was commonly suggested that catchment properties were spatially and temporally varied [19,45]. The errors from both the model structures (Budyko–Fu equation) and the model parameter in Fu’s model (m), which we assumed to be temporally consistent, caused the hydrological sensitivity estimation to be not error-free. It is worthy of noting that the method did not consider the recharge of glacial melt water to the river. Some of the headwaters in the YRB, such as JSJ and MJ sub-basins, originate in those high altitude snow mountains. Glacial melt water, which is mainly affected by regional temperature, is another recharge component to streamflow besides regional precipitation.
Normally, glacial melt water is less than 10% of total streamflow, even in those headwater sub-basins of the Yangtze River [46]. However, without this consideration, the quantified effect of climate change on runoff may be underestimated.
5. Conclusions
The current study presents an investigation on quantifying the impacts of climate change and human activities on the variation of water resources in the YRB. The characteristics of phase variation were revealed for temperature, precipitation, and potential evaporation under the context of global warming. During the period of 1960–2013, a significant increase in temperature prevailed throughout the YRB during the study period, while no detectable trend was observed for precipitation and potential evaporation. However, all these meteorological variables have experienced several stages of increase and decrease during the study period. Generally, the YRB experienced a hot-wet period during 1994–2002 and a hot-dry period during 2003–2013, since the step change of temperature occurred in 1993. A slight increasing trend in annual runoff was observed in most hydro-stations across the YRB, except for Gaochang station in the upstream MJ sub-basin.
Attribution analysis indicates that the impacts of climate change and human activities on runoff variations varied spatially in different tributary river sub-basins in the YRB. Climate change played a dominant role in most regions of the YRB, especially in those upstream sub-basins. The effect of human activities in the YRB was quite complicated, not only its regional differentiation, but also its relative contribution was very different during the hot-wet period and the hot-dry period in the same sub-basin. The contribution of human activities in the JSJ and PL sub-basins was negative during the hot-wet period, while it was positive in the hot-dry period. During the hot-dry period, the estimated positive effect of human activities in some mid-lower sub-basins may be attributed to the limited surface water utilization and increased groundwater exploitation. Whereas dam construction that induced deforestation in recent years should also be responsible for the positive effect of human activities in some upper stream sub-basins.
Author Contributions
Conceptualization and writing—original draft preparation, X.Y.; data curation and formal analysis X.Y.; resources and methodology, Z.Z.; writing—review and editing, C.-Y.X.; project and validation, J.L. All authors have read and agreed to the published version of the manuscript.
Funding
This work was financially supported by the Fundamental Research Funds for the Central Universities (XDJK2019B074) and the National Natural Science Foundation of China (51822906).
Acknowledgments
Cordial thanks are extended to Dan Zhang from the Key Laboratory of Watershed Geographic Sciences, Nanjing Institute of Geography and Limnology, China for providing the meteorological data in the YRB.
Conflicts of Interest
The authors declare no conflict of interest.
References
- Trenberth, K.E.; Jones, P.D.; Ambenje, P.; Bojariu, R.; Easterling, D.; Klein Tank, A.; Parker, D.; Rahimzadeh, F.; Renwick, J.A.; Rusticucci, M.; et al. Observations: Surface and Atmospheric Climate Change. In Climate Change 2007. Working Group I: The Physical Science Basis; Cambridge University Press: Cambridge, UK, 2007; pp. 235–336. [Google Scholar]
- Asadi, M.E. Effects of Global Climate Change on Water Resources. J. Agric. Meteorol. 2005, 60, 637–640. [Google Scholar] [CrossRef] [Green Version]
- Lakshmi, V.; Hong, S.B.; Small, E.E.; Chen, F. The influence of the land surface on hydrometeorology and ecology: New advances from modeling and satellite remote sensing. Hydrol. Res. 2011, 42, 95–112. [Google Scholar] [CrossRef] [Green Version]
- Ye, X.; Zhang, Q.; Liu, J.; Li, X.; Xu, C. Distinguishing the relative impacts of climate change and human activities on variation of streamflow in the Poyang Lake catchment, China. J. Hydro. 2013, 494, 83–95. [Google Scholar] [CrossRef]
- Esha, R.I.; Imteaz, M.A. Assessing the predictability of MLR models for long-term streamflow using lagged climate indices as predictors: A case study of NSW (Australia). Hydrol. Res. 2018, nh2018171. [Google Scholar] [CrossRef]
- Milly, P.C.D.; Dunne, K.A. Macroscale water fluxes 2. Water and energy supply control of their inter–annual variability. Water Resour. Res. 2002, 38, 241–249. [Google Scholar] [CrossRef] [Green Version]
- Chien, H.; Yeh, P.J.F.; Knouft, J.H. Modeling the potential impacts of climate change on streamflow in agricultural watersheds of the Midwestern United States. J. Hydrol. 2013, 491, 73–88. [Google Scholar] [CrossRef]
- Lenderink, G.; Meijgaard, E.V. Increase in hourly precipitation extremes beyond expectations from temperature changes. Nat. Geosci. 2008, 1, 511–514. [Google Scholar] [CrossRef]
- Hobbins, M.T.; Ramı´rez, J.A.; Brown, T.C. Trends in pan evaporation and actual evapotranspiration across the conterminous U.S.: Paradoxical or complementary? Geophys. Res. Lett. 2004, 31, 405–407. [Google Scholar] [CrossRef] [Green Version]
- Asharf, A.; Naz, R.; Wahab, A.; Ahmad, B.; Yasin, M.; Saleem, M. Assessment of Landuse Change and Its Impact on Watershed Hydrology Using Remote Sensing and SWAT Modeling Techniques-A Case of Rawal Watershed in Pakistan. JAST 2014, 2, 61–68. [Google Scholar] [CrossRef]
- Zhang, L.L.; Podlasly, C.; Feger, K.H.; Wang, Y.H.; Schwarzel, K. Different land management measures and climate change impacts on the runoff—A simple empirical method derived in a mesoscale catchment on the Loess Plateau. J. Arid Environ. 2015, 120, 42–50. [Google Scholar] [CrossRef]
- Petchprayoon, P.; Blanken, P.D.; Ekkawatpanit, C.; Husseinc, K. Hydrological impacts of land use/land cover change in a large river basin in central–northern Thailand. Int. J. Climatol. 2010, 30, 1917–1930. [Google Scholar] [CrossRef]
- Guo, H.; Hu, Q.; Jiang, T. Annual and seasonal stream flow responses to climate and land–cover changes in the Poyang Lake basin, China. J. Hydrol. 2008, 355, 106–122. [Google Scholar] [CrossRef]
- Zhang, Q.; Li, L.; Wang, Y.G.; Werner, A.D.; Xin, P.; Jiang, T.; Barry, D.A. Has the Three-Gorges Dam made the Poyang Lake wetlands wetter and drier? Geophys. Res. Lett. 2012, 39, L20402. [Google Scholar] [CrossRef] [Green Version]
- Ye, Y.; Liang, L.; Gong, J.; Jiang, Y.; Wang, H. Spatial-temporal variability characteristics of precipitation structure across the upper Yangtze river basin, China. Adv. Water Sci. 2014, 25, 164–171. (in Chinese). [Google Scholar]
- Tian, Q.; Yang, S. Regional climatic response to global warming: Trends in temperature and precipitation in the Yellow, Yangtze and Pearl River basins since the 1950s. Quatern. Int. 2016, 440, 1–11. [Google Scholar] [CrossRef]
- Li, S.; Hou, W.; Feng, T. Decadal variations of summer dryness/wetness over the middle and lower reaches of the Yangtze River and the evolution of atmospheric circulation in the last 52 years. Chinese J. Atmos. Sci. 2015, 39, 885–900. (in Chinese). [Google Scholar]
- Wang, Y.; Liu, B.; Zhai, J.; Su, B.; Luo, Y.; Zhang, Z. Relationship between potential and actual evaporation in Yangtze River Basin. Adv. Climate Change Res. 2011, 7, 393–399. (in Chinese). [Google Scholar]
- Qi, D.; Li, Y.; Chen, Y.; Zhao, X.; Zhou, C. Changing characteristics and causes of runoff in the source regions of the Yangtze River under the background of climate change. J. Glaciol. Geocryol. 2015, 37, 1075–1086. (in Chinese). [Google Scholar]
- Wei, W.; Chang, Y.; Dai, Z. Streamflow changes of the Changjiang (Yangtze) River in the recent 60 years: Impacts of the East Asian summer monsoon, ENSO, and human activities. Quatern. Int. 2014, 336, 98–107. [Google Scholar] [CrossRef]
- McMahon, T.A.; Finlayson, B.L.; Haines, A.T.; Srikanthan, R. Runoff variability: A global perspective. The influence of climate change and climatic variability on the hydrologic regime and water resources. In Proceedings of the Vancouver Symposium, International Association for Scientific Hydrology, Vancouver, BC, Canada, August 1987; Publication no. 168. pp. 3–11. [Google Scholar]
- Allen, R.G.; Pereira, L.S.; Raes, D.; Smith, M. Crop Evapotranspiration Guidelines for Computing Crop Water Requirements; FAO Irrigation and Drainage Paper 56; FAO—Food and Agriculture Organization of the United Nations: Rome, Italy, 1998; p. 300. [Google Scholar]
- Mann, H.B. Nonparametric tests against trend. Econometrica 1945, 13, 245–259. [Google Scholar] [CrossRef]
- Kendall, M.G. Rank Correlation Methods, 4th ed.; London: Griffin, London, UK, 1975; p. 202. [Google Scholar]
- Kahya, E.; Kalayci, S. Trend analysis of streamflow in Turkey. J. Hydrol. 2004, 289, 128–144. [Google Scholar] [CrossRef]
- Taylor, W.A. Change-point analysis: A powerful new tool for detecting changes; Taylor Enterprises: Libertyville, IL, USA, 2000; pp. 1–19. [Google Scholar]
- Xu, C.; Gong, L.; Jiang, T.; Chen, D.; Singh, V.P. Analysis of spatial distribution and temporal trend of reference evapotranspiration and pan evaporation in Changjiang (Yangtze River) catchment. J. Hydrol. 2006, 327, 81–93. [Google Scholar] [CrossRef]
- Budyko, M.I. Climate and Life; Academic Press: New York, NY, USA, 1974; p. 508. [Google Scholar]
- Pike, J.G. The estimation of annual run–off from meteorological data in a tropical climate. J. Hydrol. 1964, 2, 116–123. [Google Scholar] [CrossRef]
- Fu, B.P. On the calculation of the evaporation from land surface. Sci. Atmos. Sinica 1981, 5, 23–31. [Google Scholar]
- Choudhury, B.J. Evaluation of an empirical equation for annual evaporation using field observations and results from a biophysical model. J. Hydrol. 1999, 216, 99–110. [Google Scholar] [CrossRef]
- Zhang, L.; Dawes, W.R.; Walker, G.R. Response of mean annual evapotranspiration to vegetation changes at catchment scale. Water Resour. Res. 2001, 37, 701–708. [Google Scholar] [CrossRef]
- Wang, D.B.; Tang, Y. A one–parameter Budyko model for water balance captures emergent behavior in Darwinian hydrologic models. Geophys. Res. Lett. 2014, 41, 4569–4577. [Google Scholar] [CrossRef] [Green Version]
- Koster, R.D.; Suarez, M.J. A simple framework for examining the interannual variability of land surface moisture fluxes. J. Clim. 1999, 12, 1911–1917. [Google Scholar] [CrossRef]
- Li, F.; Dong, C.; Tang, Q.; Yan, Y. Influence of East and South Asian summer monsoons on runoff in the monsoon region of East China. Adv. Water Sci. 2016, 27, 349–356. (in Chinese). [Google Scholar]
- Hu, Q.; Feng, S.; Guo, H.; Chen, G.; Jiang, T. Interactions of the Yangtze River flow and hydrologic processes of the Poyang Lake, China. J. Hydrol. 2007, 347, 90–100. [Google Scholar] [CrossRef]
- Peterson, T.C.; Golubev, V.S.; Groisman, P.Y. Evaporation losing its strength. Nature 1995, 377, 687–688. [Google Scholar] [CrossRef]
- McVicar, T.R.; Roderick, M.L.; Donohue, R.J.; Li, L.T.; Van Niel, T.G.; Thomas, A.; Grieser, J.; Jhajharia, D.; Himri, Y.; Mahowald, N.M.; et al. Global review and synthesis of trends in observed terrestrial near–surface wind speeds: Implications for evaporation. J. Hydrol. 2012, 416–417, 182–205. [Google Scholar] [CrossRef]
- Wang, Z.; Xie, P.; Lai, C.; Chen, X.; Wu, X.; Zeng, Z.; Li, J. Spatiotemporal variability of reference evapotranspiration and contributing climatic factors in China during 1961–2013. J. Hydrol. 2017, 544, 97–108. [Google Scholar] [CrossRef]
- Wang, Y.; Ding, Y.; Ye, B.; Liu, F.; Wang, J. Contributions of climate and human activities to changes in runoff of the Yellow and Yangtze rivers from 1950 to 2008. Sci. China: Earth Sci. 2013, 56, 1398–1412. (in Chinese). [Google Scholar] [CrossRef]
- Yang, S.L.; Gao, A.; Hotz, H.M.; Zhu, J.; Dai, S.B.; Li, M. Trends in annual discharge from the Yangtze River to the sea (1865–2004). Hydrol. Sci. J. 2005, 50, 1–836. [Google Scholar] [CrossRef] [Green Version]
- Chen, J.; Wu, X.; Finlayson, B.L.; Webber, M.; Wei, T.; Li, M.; Chen, Z. Variability and trend in the hydrology of the Yangtze River, China: Annual precipitation and runoff. J. Hydrol. 2014, 513, 403–412. [Google Scholar] [CrossRef]
- Liu, Y.; Zhu, Y. Vegetation Change of Yangtze River Basin since 1980s: Pattern and Change Rate. Ecol. Environ. Monit. Three Gorges 2016, 1, 39–43. (in Chinese). [Google Scholar]
- Li, X.; Jia, K.; Tan, H. Census result analysis for groundwater well in Yangtze River Basin. Yangtze River 2014, 45, 97–100. (in Chinese). [Google Scholar]
- Donohue, R.J.; Roderick, M.L.; McVicar, T.R. Assessing the differences in sensitivities of runoff to changes in climatic conditions across a large basin. J. Hydrol. 2011, 406, 234–244. [Google Scholar] [CrossRef]
- Yang, J.; Ding, Y.; Liu, S.; Lu, A.; Chen, R. Glacier change and its effect on surface runoff in the source regions of the Yangtze and Yellow rivers. J. Nat. Resour. 2003, 18, 595–602. (in Chinese). [Google Scholar]
Figure 1.
Location of the Yangtze River basin and hydro-meteorological stations. The names of the hydrological stations (from numbers 1 to 16) are given in Table 1.
Figure 1.
Location of the Yangtze River basin and hydro-meteorological stations. The names of the hydrological stations (from numbers 1 to 16) are given in Table 1.

Figure 2.
Comparison of the variation of annual temperature globally and of China and the Yangtze River basin with reference to the average during the period of 1960–2000. Date source: Global temperatures since 1900 were obtained from NASA/GISS (https://climate.nasa.gov/vital-signs/global-temperature/); China temperatures since 1960 were obtained from the China Climate Change Monitoring Bulletin (2016).

Figure 3.
(a) Temporal anomaly (the black bold line denotes cumulative sum) and (b) spatial distribution of the trend of annual temperature during the period 1960–2013. The black contours in the right figure indicate the 0.05 significance level.
Figure 3.
(a) Temporal anomaly (the black bold line denotes cumulative sum) and (b) spatial distribution of the trend of annual temperature during the period 1960–2013. The black contours in the right figure indicate the 0.05 significance level.

Figure 4.
(a) Temporal anomaly (the black bold line denotes cumulative sum) and (b) spatial distribution of the trend of annual precipitation during the period 1960–2013. The black contours in the right figure indicate the 0.05 significance level.
Figure 4.
(a) Temporal anomaly (the black bold line denotes cumulative sum) and (b) spatial distribution of the trend of annual precipitation during the period 1960–2013. The black contours in the right figure indicate the 0.05 significance level.

Figure 5.
(a) Temporal anomaly (the black bold line denotes cumulative sum) and (b) spatial distribution of the trend of annual potential evaporation during the period 1960–2013. The black contours in the right figure indicate the 0.05 significance level.
Figure 5.
(a) Temporal anomaly (the black bold line denotes cumulative sum) and (b) spatial distribution of the trend of annual potential evaporation during the period 1960–2013. The black contours in the right figure indicate the 0.05 significance level.

Figure 6.
Changes of average annual (a) precipitation and (b) potential evaporation during the three different periods with reference to the baseline period of 1960–1993.
Figure 6.
Changes of average annual (a) precipitation and (b) potential evaporation during the three different periods with reference to the baseline period of 1960–1993.

Figure 7.
Variation of runoff of the nine hydro-stations in the Yangtze River basin.

Figure 8.
Relative change of runoff during the three different periods with reference to the baseline period of 1960–1993.
Figure 8.
Relative change of runoff during the three different periods with reference to the baseline period of 1960–1993.


Table 1.
List of hydrological stations and their basic features for 1960–2013.
| Gauging Station (Number) | Sub-Basin | Location | Drainage Area (104 km2) | Mean Annual Runoff (108 m3) | Runoff Depth (mm) | Coefficient of Variation (Cv) |
|---|---|---|---|---|---|---|
| Xiangjiaba (1) | JSJ | 28°38´ N, 104°24´ E | 45.88 | 1432 | 313 | 0.16 |
| Gaochang (2) | MJ | 28°48´ N, 104°25´ E | 13.54 | 844 | 623 | 0.12 |
| Beibei (3) | JLJ | 29°49´ N, 106°28´ E | 15.67 | 658 | 420 | 0.25 |
| Wulong (4) | WJ | 29°19´ N, 107°45´ E | 8.30 | 487 | 586 | 0.20 |
| Huangzhuan (5) | HJ | 31°11´ N, 112°33´ E | 14.21 | 465 | 327 | 0.36 |
| Xiangtan (6) | DL | 27°52´ N, 112°55´ E | 8.16 | 654 | 802 | 0.24 |
| Taojiang (7) | DL | 28°32´ N, 112°07´ E | 2.67 | 226 | 846 | 0.20 |
| Taoyuan (8) | DL | 28°54´ N, 111°29´ E | 8.52 | 633 | 743 | 0.18 |
| Shimen (9) | DL | 29°35´ N, 111°26´ E | 1.53 | 145 | 947 | 0.27 |
| Waizhou (10) | PL | 28°37´ N, 115°49´ E | 8.09 | 682 | 842 | 0.29 |
| Lijiadu (11) | PL | 28°12´ N, 116°09´ E | 1.58 | 123 | 778 | 0.38 |
| Meigang (12) | PL | 28°25´ N, 116°48´ E | 1.55 | 180 | 1162 | 0.34 |
| Hushan (13) | PL | 28°54´ N, 117°18´ E | 0.65 | 70 | 1077 | 0.35 |
| Wanjiabu (14) | PL | 28°51´ N, 115°38´ E | 0.36 | 35 | 976 | 0.32 |
| Yichang (15) | Mainstream | 30°42´ N, 111°17´ E | 100.55 | 4273 | 425 | 0.11 |
| Datong (16) | Mainstream | 30°46´ N, 117°37´ E | 170.54 | 8846 | 519 | 0.13 |
Table 2.
Effects of climate change and human activities on mean annual runoff in the Yangtze River basin.
Table 2.
Effects of climate change and human activities on mean annual runoff in the Yangtze River basin.
| Basins | Hydro-Stations | Periods | |||||||
|---|---|---|---|---|---|---|---|---|---|
| JSJ | Xiangjiaba | 1960–1993 | 310.48 | - | 1.34 | 0.78 | −0.11 | - | - |
| 1994–2002 | 334.69 | 24.21 | - | 46.39 | −22.18 | ||||
| 2003–2013 | 298.44 | −12.03 | - | −23.50 | 11.47 | ||||
| 1994–2013 | 314.75 | 4.28 | - | 7.95 | −3.67 | ||||
| MJ | Gaochang | 1960–1993 | 642.13 | - | 1.51 | 0.81 | −0.23 | - | - |
| 1994–2002 | 603.01 | −39.12 | - | −32.09 | −7.03 | ||||
| 2003–2013 | 582.36 | −59.77 | - | −39.90 | −19.86 | ||||
| 1994–2013 | 591.66 | −50.47 | - | −36.39 | −14.09 | ||||
| JLJ | Beibei | 1960–1993 | 446.82 | - | 2.12 | 0.72 | −0.34 | - | - |
| 1994–2002 | 312.42 | −134.40 | - | −77.54 | −56.86 | ||||
| 2003–2013 | 424.46 | −22.36 | - | −11.22 | −11.14 | ||||
| 1994–2013 | 374.04 | −72.78 | - | −40.39 | −32.38 | ||||
| WJ | Wulong | 1960–1993 | 594.57 | - | 1.45 | 0.83 | −0.22 | - | - |
| 1994–2002 | 662.91 | 68.34 | - | 50.13 | 18.21 | ||||
| 2003–2013 | 498.86 | −95.71 | - | −80.41 | −15.30 | ||||
| 1994–2013 | 572.68 | −21.89 | - | -21.67 | −0.22 | ||||
| HJ | Huangzhuang | 1960–1993 | 353.73 | - | 1.72 | 0.71 | −0.22 | - | - |
| 1994–2002 | 246.55 | −107.18 | - | −54.12 | −53.06 | ||||
| 2003–2013 | 327.09 | −26.64 | - | 5.06 | −31.70 | ||||
| 1994–2013 | 290.84 | −62.89 | - | −21.57 | −41.31 | ||||
| DL | 4-stations | 1960–1993 | 783.26 | - | 3.20 | 0.82 | −0.61 | - | - |
| 1994–2002 | 912.66 | 129.39 | - | 124.94 | 4.45 | ||||
| 2003–2013 | 730.66 | −52.60 | - | −93.07 | 40.47 | ||||
| 1994–2013 | 812.56 | 29.30 | - | 5.03 | 24.26 | ||||
| PY | 5-stations | 1960–1993 | 867.75 | - | 7.00 | 0.94 | −0.90 | - | - |
| 1994–2002 | 1067.4 | 199.67 | - | 296.34 | −96.67 | ||||
| 2003–2013 | 820.18 | −47.58 | - | −53.11 | 5.53 | ||||
| 1994–2013 | 931.44 | 63.68 | - | 104.15 | −40.46 | ||||
| Yangtze | Datong | 1960–1993 | 516.42 | - | 2.14 | 0.73 | −0.35 | - | - |
| 1994–2002 | 564.19 | 47.76 | - | 48.88 | −1.11 | ||||
| 2003–2013 | 488.5 | −27.92 | - | −40.86 | 12.93 | ||||
| 1994–2013 | 522.56 | 6.14 | - | −3.76 | 9.89 |
© 2020 by the authors. Licensee MDPI, Basel, Switzerland. This article is an open access article distributed under the terms and conditions of the Creative Commons Attribution (CC BY) license (http://creativecommons.org/licenses/by/4.0/).
Share and Cite
MDPI and ACS Style
Ye, X.; Zhang, Z.; Xu, C.-Y.; Liu, J. Attribution Analysis on Regional Differentiation of Water Resources Variation in the Yangtze River Basin under the Context of Global Warming. Water 2020, 12, 1809. https://doi.org/10.3390/w12061809
AMA Style
Ye X, Zhang Z, Xu C-Y, Liu J. Attribution Analysis on Regional Differentiation of Water Resources Variation in the Yangtze River Basin under the Context of Global Warming. Water. 2020; 12(6):1809. https://doi.org/10.3390/w12061809
Chicago/Turabian StyleYe, Xuchun, Zengxin Zhang, Chong-Yu Xu, and Jia Liu. 2020. "Attribution Analysis on Regional Differentiation of Water Resources Variation in the Yangtze River Basin under the Context of Global Warming" Water 12, no. 6: 1809. https://doi.org/10.3390/w12061809
Note that from the first issue of 2016, this journal uses article numbers instead of page numbers. See further details here.