Article

Conceptual Mini-Catchment Typologies for Testing Dominant Controls of Nutrient Dynamics in Three Nordic Countries

1
Department of Bioscience, Aarhus University, Vejlsøvej 25, 8600 Silkeborg, Denmark
2
Environmental and Biochemical Sciences, The James Hutton Institute, Craigiebuckler, Aberdeen AB15 8QH, Scotland, UK
3
Department of Agroecology, Aarhus University, Blichers Allé 20, 8830 Tjele, Denmark
4
Department of Soil and Environment, Swedish University of Agricultural Sciences, P.O. Box 7014, 750 07 Uppsala, Sweden
5
Water Resources and Environmental Engineering Research Unit, Olulu University, 90014 Oulu, Finland
6
Finnish Environment Institute, Latokartanonkaari 11, 00790 Helsinki, Finland
7
Department of Aquatic Sciences and Assessment, Swedish University of Agricultural Sciences, P.O. Box 7050, 750 07 Uppsala, Sweden
*
Author to whom correspondence should be addressed.
Water 2020, 12(6), 1776; https://doi.org/10.3390/w12061776
Submission received: 3 May 2020 / Revised: 13 June 2020 / Accepted: 16 June 2020 / Published: 22 June 2020
(This article belongs to the Special Issue Land Use and Water Quality)

Abstract

:
Optimal nutrient pollution monitoring and management in catchments requires an in-depth understanding of spatial and temporal factors controlling nutrient dynamics. Such an understanding can potentially be obtained by analysing stream concentration–discharge (C-Q) relationships for hysteresis behaviours and export regimes. Here, a classification scheme including nine different C-Q types was applied to a total of 87 Nordic streams draining mini-catchments (0.1–65 km2). The classification applied is based on a combination of stream export behaviour (dilution, constant, enrichment) and hysteresis rotational pattern (clock-wise, no rotation, anti-clockwise). The scheme has been applied to an 8-year data series (2010–2017) from small streams in Denmark, Sweden, and Finland on daily discharge and discrete nutrient concentrations, including nitrate (NO3), total organic N (TON), dissolved reactive phosphorus (DRP), and particulate phosphorus (PP). The dominant nutrient export regimes were enrichment for NO3 and constant for TON, DRP, and PP. Nutrient hysteresis patterns were primarily clockwise or no hysteresis. Similarities in types of C-Q relationships were investigated using Principal Component Analysis (PCA) considering effects of catchment size, land use, climate, and dominant soil type. The PCA analysis revealed that land use and air temperature were the dominant factors controlling nutrient C-Q types. Therefore, the nutrient export behaviour in streams draining Nordic mini-catchments seems to be dominantly controlled by their land use characteristics and, to a lesser extent, their climate.

1. Introduction

The need for nutrient load reduction from both agricultural and non-agricultural lands to avoid harmful impacts on groundwater and surface water resources, including eutrophication and hypoxia in aquatic ecosystems, is widely recognised [1]. The Baltic Sea is among the most heavily degraded marine ecosystems worldwide, due in part to excessive nutrient loads [2]. Nordic countries in the Baltic region also suffer from nutrient pollution issues and their management requires better understanding of the nutrient sources [3].
Understanding the temporal and spatial mechanisms of nutrient dynamics as well as a diversity of factors controlling the transfer of nutrients to surface waters is essential for setting targets for water quality thresholds and providing catchment-scale non-point nutrient pollution mitigation options [4,5,6]. However, nutrient pollution is particularly difficult to manage, as controlling factors include complex hydrological and biogeochemical processes and relationships between nutrient sources, forms, and their transport to surface waters [6,7,8,9,10,11]. Among the relevant spatial controls of nutrient dynamics, we can mention the distribution and area of land use pressures on water quality, erodibility, and leaching sensitivity for sediment and nutrients, available water for transport, and hydrological connectivity which is related to geology, land use, topography, and climate [12,13,14]. Discharge and nutrient concentrations are basic stream measurements for quantifying nutrient export from catchments and are needed for obtaining an integrated understanding of stream hydrological and biogeochemical processes [15]. Moreover, assessments of the temporal variability of controls on nutrients transported by streams and their drivers, including agricultural land use/management, hydro-meteorological variables, and nutrient pathways [16,17,18] are important for designing water quality management strategies [19].
Understanding the complexity of catchment-scale spatial and temporal mechanisms of nutrient dynamics and loads is difficult and demanding [5,17]. Many studies have investigated the relationship between discharge (Q) and concentration (C) to characterise the temporal and spatial variability of nutrient loads and several indicators have been suggested [20,21,22,23,24,25,26,27,28,29,30,31,32,33,34,35,36,37]. Some earlier studies have proposed that relationships between C and Q can be described using log-linear relationships. These relationships can be chemo-static, i.e., constant C across all Q values, or chemo-dynamic with either a positive relationship defined as enrichment where C increases with Q or dilution when C decreases with increasing Q [20,21,22,25,26,32].
Given that a log-linear relationship between C and Q often does not sufficiently capture the variability of the data, some researches have suggested splitting concentration–discharge (C-Q) curves at the median flow to analyse the C-Q relationships during low and high flows separately [36,37]. Hysteresis patterns in C-Q relationships have also analysed to identify time lags between C and Q during runoff events [29,38]. Hysteresis patterns can either be clockwise (higher concentrations at the rising limb compared with the falling limb of the hydrograph) or anticlockwise (lower concentrations at the rising limb compared with the falling limb of the hydrograph).
When developing typologies describing similarities in catchment solute exports, there is a need for including both spatial and temporal controlling factors. To this end, a classification scheme for deriving typologies from low-frequency (e.g., monthly) water quality data distinguishing between nine different C-Q relationship types, defined as combinations of export behaviour and the rotational pattern of the hysteresis has been developed [35]. To be able to better represent catchment and substance-specific export characteristics, they used C-Q relationships with hydrograph segmentation where C-Q curves were split at an automatically derived optimal segmentation discharge, and introduced separate C-Q models for rising and falling hydrograph limbs. Assessing export behaviour and rotational pattern of the hysteresis based on water quality data in mini-catchments seems promising to gain more knowledge about C-Q dynamics and their spatial controls. The importance of mini-catchments is due to the intimate connection between terrestrial and aquatic ecosystems. This is of great significance for water resource management because small headwater streams markedly influence the downstream water quality [39].
Therefore, the main objectives of our study were to explore mini-catchment similarity in C-Q relationships for different N and P forms and to identify spatial and temporal controls on in-stream nutrient concentrations. We hypothesised that development of a mini-catchment typology can assist in informing stakeholders on the expected impacts of climate change, land use change, and nutrient management for the resulting nutrient losses and eutrophication impacts. To address these objectives, we investigated daily discharge and discrete nutrient (nitrate, organic N, dissolved reactive P, and particulate P) concentration data collected over an 8-year period from 87 small streams in Denmark, Sweden, and Finland.

2. Materials and Methods

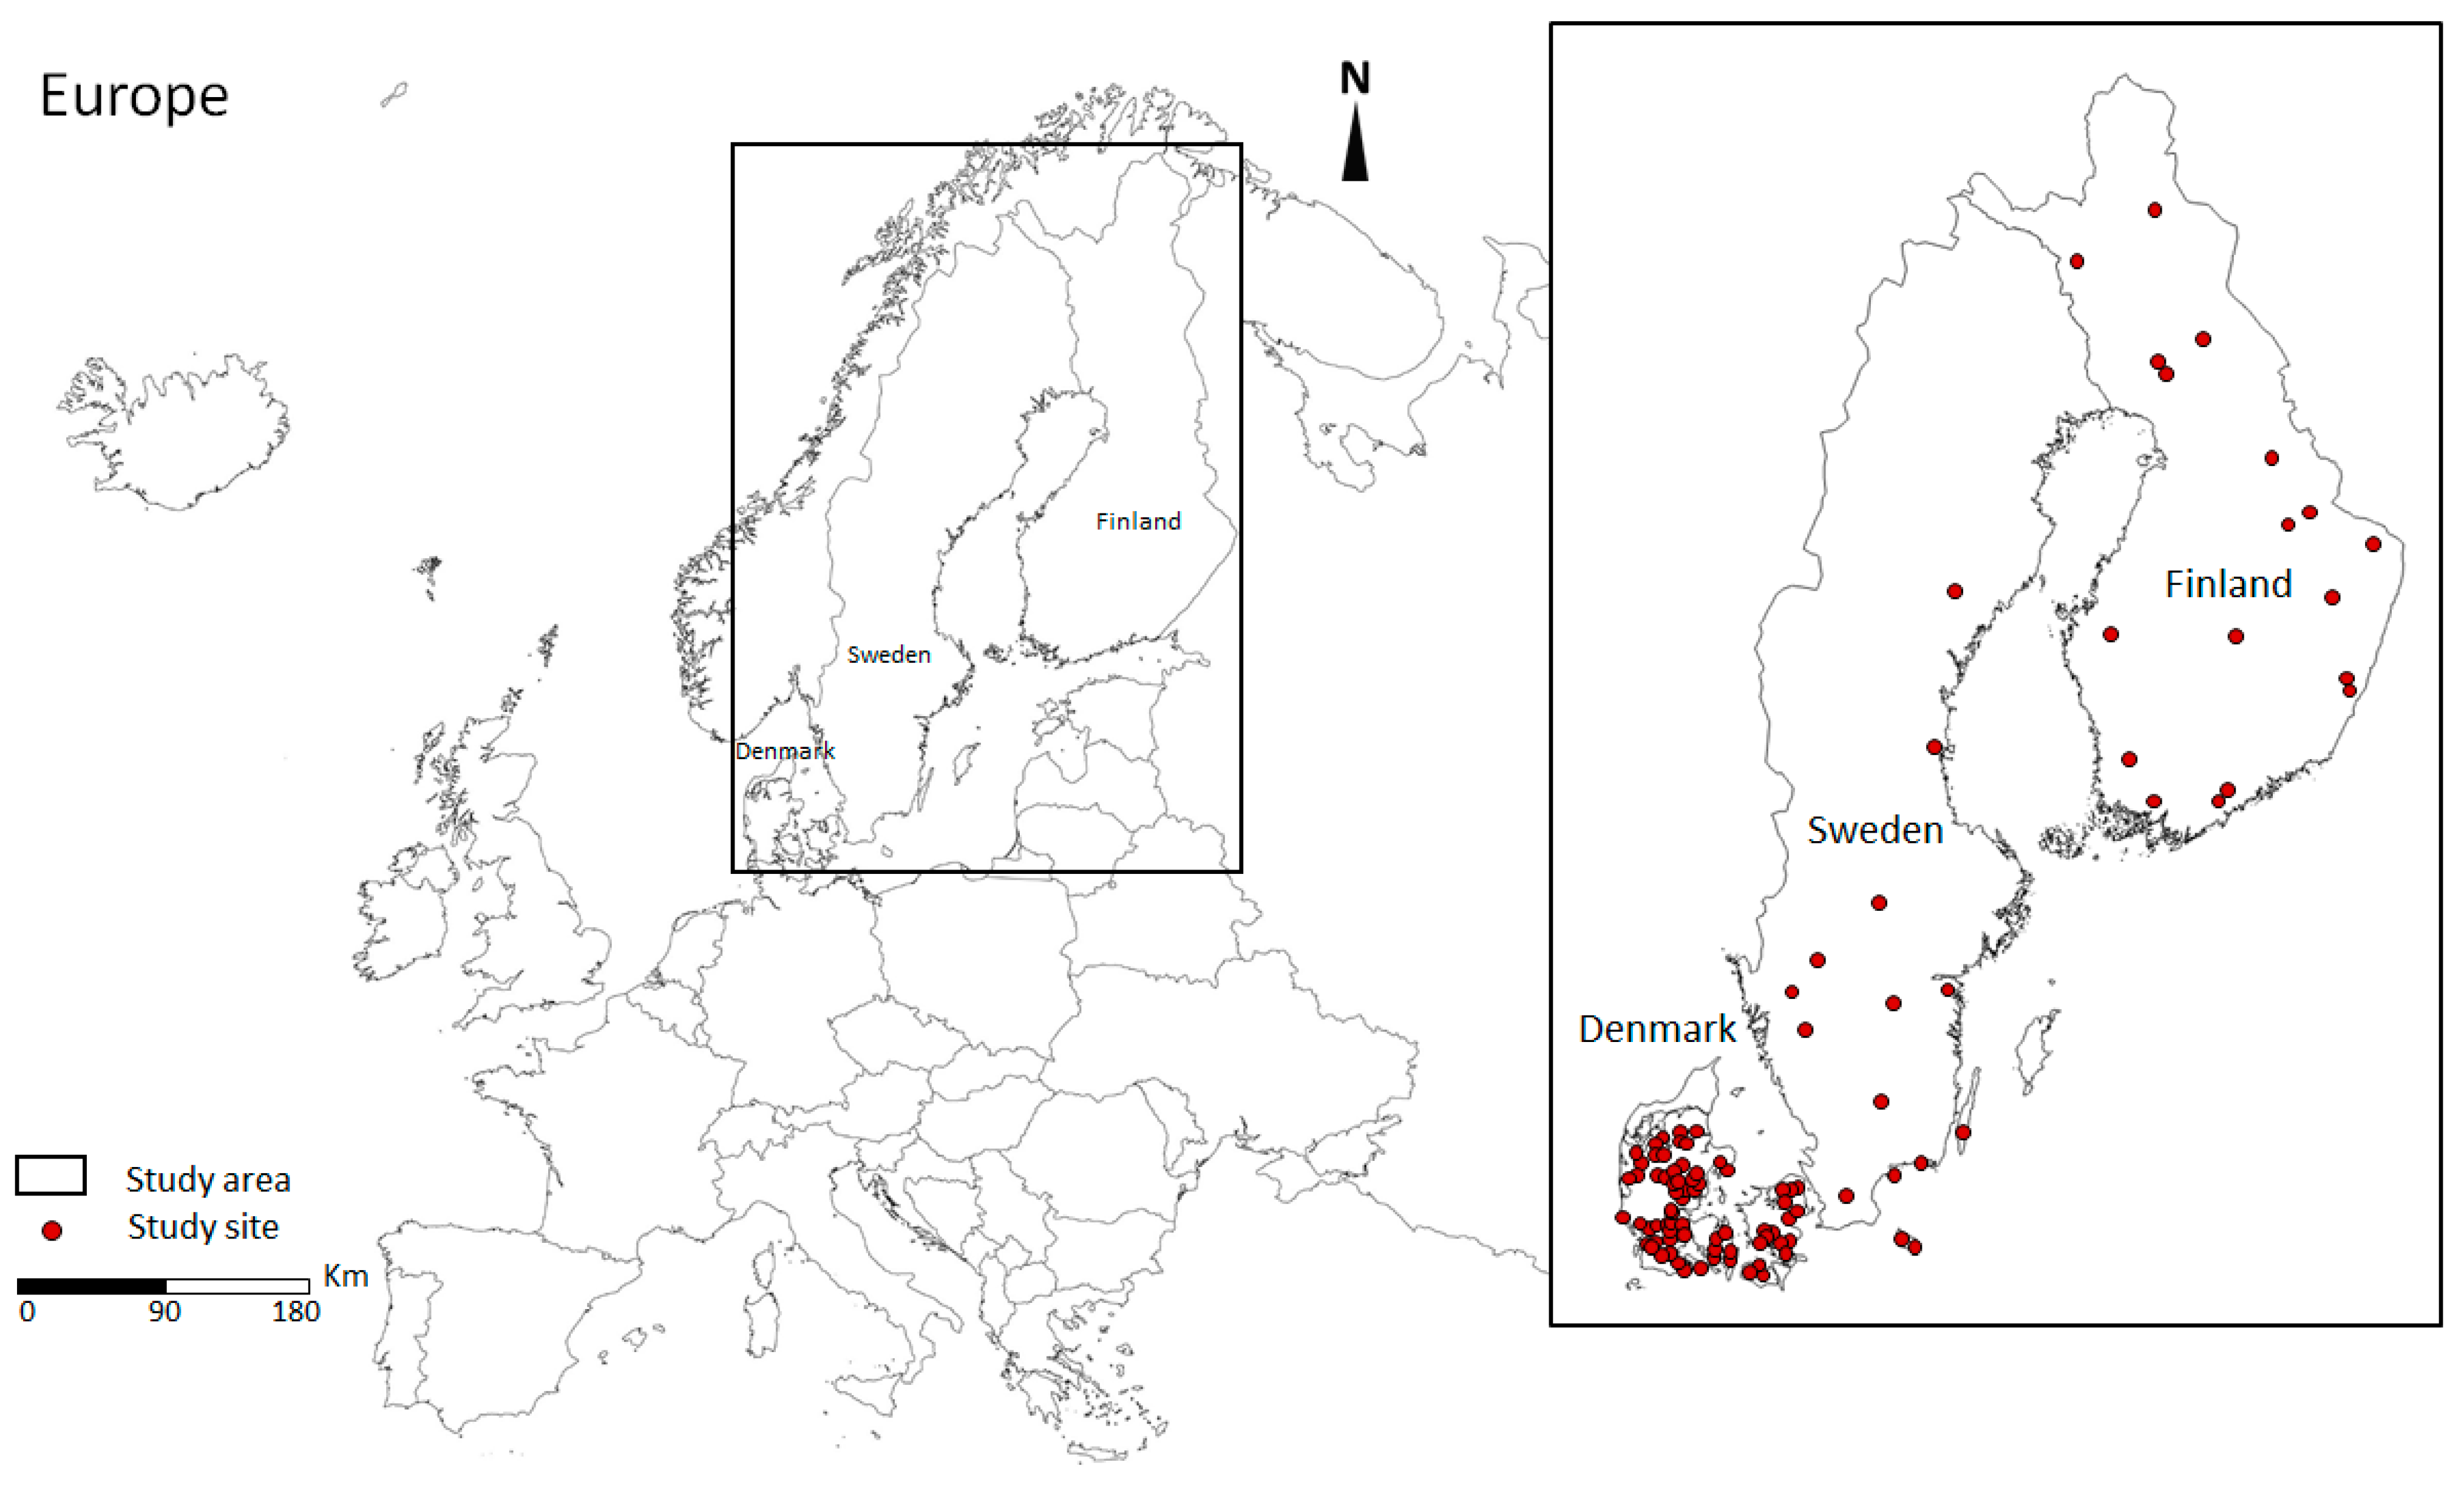
2.1. Data and Study Sites

Discharge and nutrient concentration data were obtained from a total of 87 Nordic streams draining catchments with a size ranging from 0.1 km² to 65 km² in Denmark, Sweden, and Finland (Figure 1). An 8-year daily record (2010–2017) of stream discharge and weekly to bi-weekly concentration measurements for nitrate (NO3), total organic N (TON calculated as total N minus NO3), dissolved reactive phosphorus (DRP) and particulate P (PP defined as total P minus DRP) were available. We used 56 stations in Denmark, 13 in Sweden, and 18 in Finland (Table 1, Table S1).
The Danish data were extracted from the national monitoring database (ODA) at Aarhus University [40]. The Swedish data on agricultural catchments were extracted from the river flow monitoring programs for small agricultural catchments [41]. Data on forested (non-agricultural) catchments were obtained from the Swedish Integrated Monitoring programme [42]. The Finnish data were extracted from the hydrological database of the Finnish Environment Institute (SYKE) [43]. Mean annual precipitation in the study region ranges from 513 mm to 763 mm (standard reference period 1971–2000) and mean daily air temperature between −0.42 °C and 8.84 °C (standard reference period 1971–2000). The climatic characteristics with a resolution of a 0.5 degree grid (50 km) were derived from a database provided by the Swedish Meteorological and Hydrological Institute (SMHI). Land use data were reported as percentages of agriculture (including arable and grassland used for agriculture) and nature (including forested and naturally vegetated land) and were derived separately for each catchment in Denmark [44], Sweden [41,42], and Finland [45,46] (Table S2). As built up areas and open water areas (watercourses, ponds, lakes, etc.) are not included, land use values do not necessarily sum to 100%. Soil characteristics were derived from the 1:5000000 scale FAO Digital Soil Map of the World (DSMW). Soils were reclassified into 6 classes (Table S3) based on percentages of sand, till, moraine, sediment, gravel, and organic soil.

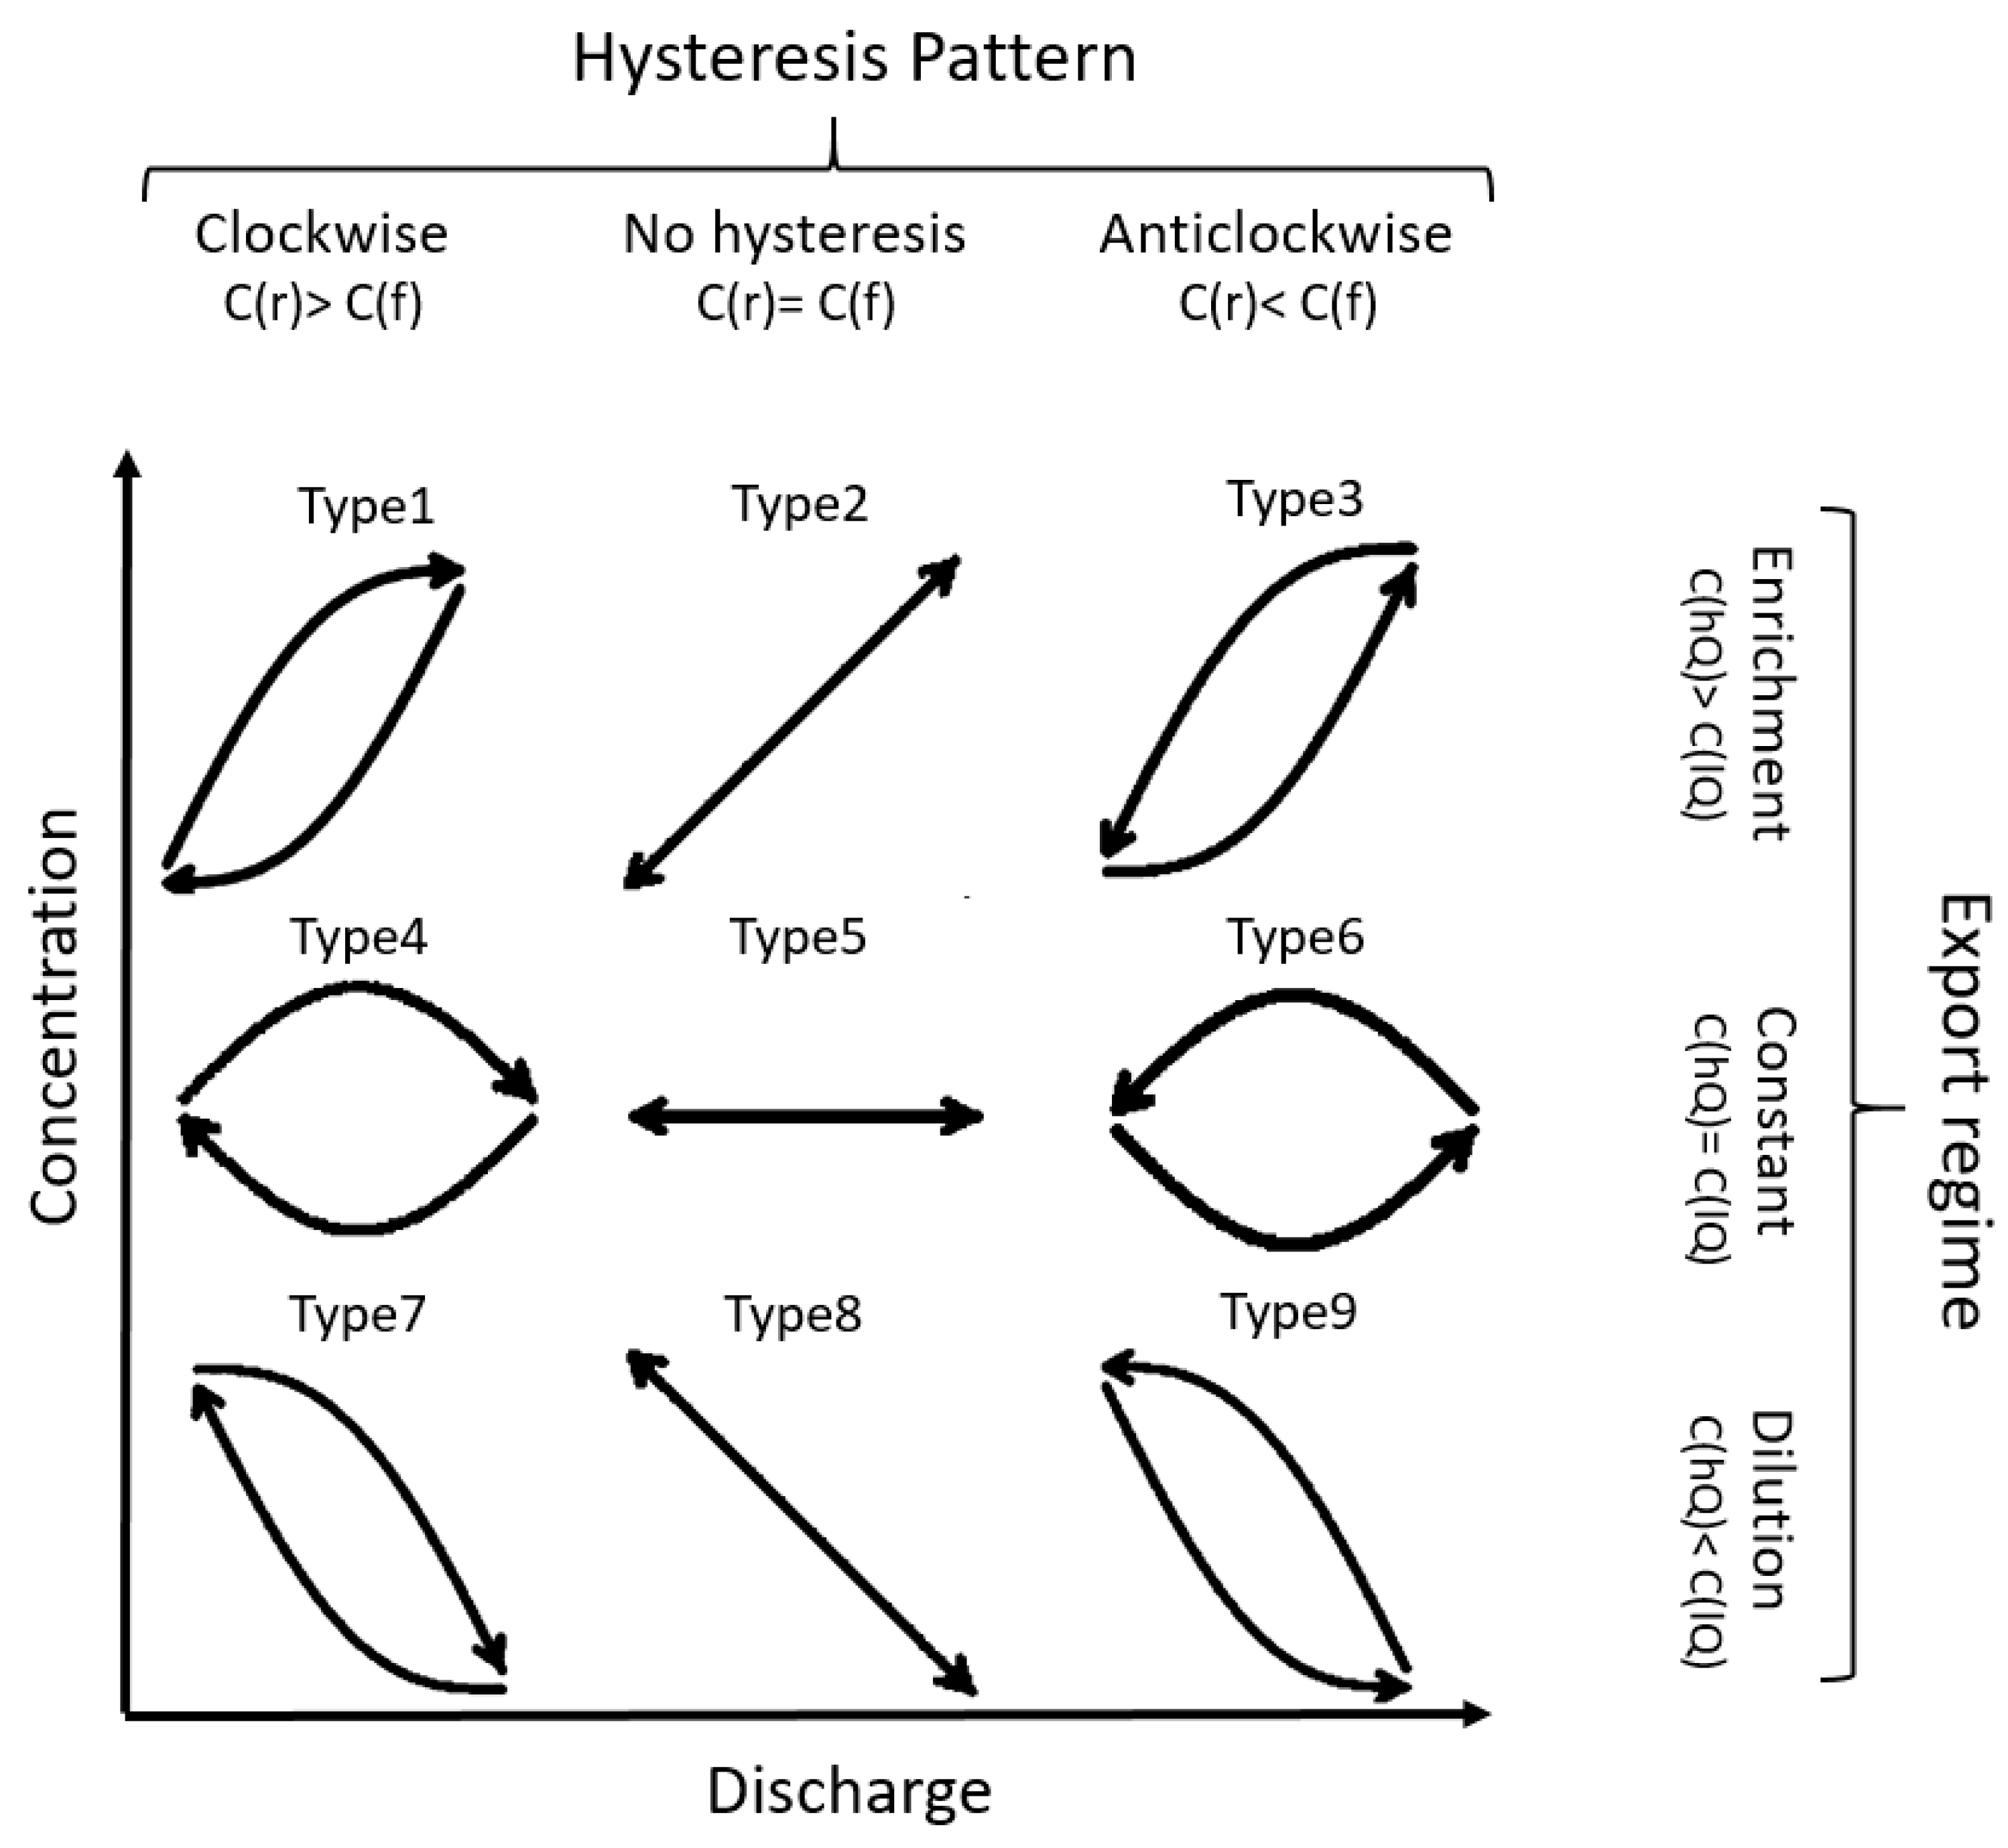
2.2. Analysis of Concentration–Discharge (C-Q) Relationships and Classification

We classified nine types of concentration–discharge (C-Q) relationships based on export regime and hysteresis [35] (Figure 2). We distinguished three export regimes: enrichment (increase of C with Q), constant (no significant relationship between C and Q) and dilution (decrease of C with Q), and three hysteresis patterns: clockwise, no hysteresis, and anticlockwise. An export regime showing enrichment is likely the result of solute mobilisation due to large element storage such as nitrate leaching from arable soils and mobilisation of legacy nutrients in the catchment [25,47]. A constant export regime may be indicative of a similar element distribution, fixed source areas, or concurrent hydrological and biogeochemical processes [26,37,48]. In contrast, dilution regimes are caused by source limitation such as a decrease in the number of point sources or exhaustion of catchment pools [25]. Clockwise hysteresis may be related to a fast response to flushing or erosional processes while anticlockwise hysteresis may be caused by delayed transport processes from, e.g., groundwater and upstream parts of the catchment [33].
C-Q relationships were specified according to a power-law model (Equation (1)):
C = a Q b
where   C is concentration, a a coefficient with units of concentration/discharge, Q discharge, and b is a unitless exponent representing the slope of the log-transformed C-Q relationship. All models were fit using R-3.6.1 [49] using the nlsLM function in minpack.lm [50]. To better represent specific export characteristics at catchment scale, we used an automatically derived optimal segmentation discharge and separate C- Q models for rising and falling hydrograph limbs [35]. We estimated parameters for four different C-Q models depending on whether the chemical measurement was made on a rising or falling limb of the hydrograph and if flow was higher or lower than the optimal segmentation value. We identified export regimes on the basis of modeled concentrations (N = 200, 100 each for rising and falling limb based on power-law models) considering high/low flow quantiles and hysteresis. Modeled rather than observed concentrations were used for classification and better comparability between catchments with differing chemical sampling frequencies.
The analysis of hysteresis patterns was based on discretization of runoff events in long-term daily discharge time series into rising and falling hydrograph limbs. Runoff events were defined as consecutive time periods when daily discharge exceeded base flow using the function base flows in the R package hydrostats [51]. To define rising and falling limbs of the hydrograph, we considered rising limbs as the periods between the day with the lowest discharge before an event until the peak flow of the event and falling limbs as the days after peak flow until the lowest flow after the discharge event. Clockwise hysteresis was identified by higher concentrations on the rising limb. Anticlockwise hysteresis was identified by higher concentrations on the falling limb. When there were no significant differences in concentration between the rising and falling limbs of the hydrograph, we assumed that there was no hysteresis. We classified C-Q types using these models (Equation 1). Hysteresis patterns were assessed by comparing concentrations on the rising and the falling limb using the Kruskal-Wallis test (p-value ≤0.05). To investigate whether hydrological regime has any significant importance for export regime, linear correlations (R2) between base-flow index (BFI) and the exponent of the C-Q relationships for NO3, TON, DRP, and PP were calculated. The BFI was defined as the sum of base flows divided by the total flow [52] using the function base flows in the R package hydrostats [51].

2.3. Links between C-Q Types and Catchment Characteristics

C-Q types and catchment behaviour were separately related to climatic characteristics (mean daily climate norms for precipitation and air temperature between 1971–2000), catchment area, land cover (agriculture and nature), and soil types (Table S2) in each catchment. To investigate similarity C-Q relationships and to explore dominant influences on the respective groupings, multivariate analyses of the C-Q relationships and catchment controls for each of the N and P forms were performed using Principal Component Analysis (PCA) [53]. PCA is a statistical technique for reducing the dimensionality of large datasets to increase interpretability while simultaneously minimising information loss [54]. It uses an orthogonal transformation to convert a set of observations of possibly correlated variables into a set of values of linearly uncorrelated principal components that successively maximise variance [55]. We used a PCA Biplot to simultaneously display information on the observations (C-Q types for each N and P form) and the variables (catchment characteristics) [53]. Two-dimensional Biplots represent the information contained in two of the principal components and are an approximation of the original multidimensional space [54]. Biplots typically display the first two principal component axes because the first principal component (PC1) always is the direction in space along which projections have the largest variance and the second principal component (PC2) is the direction, which maximizes variance among all directions orthogonal to the first [56].

3. Results

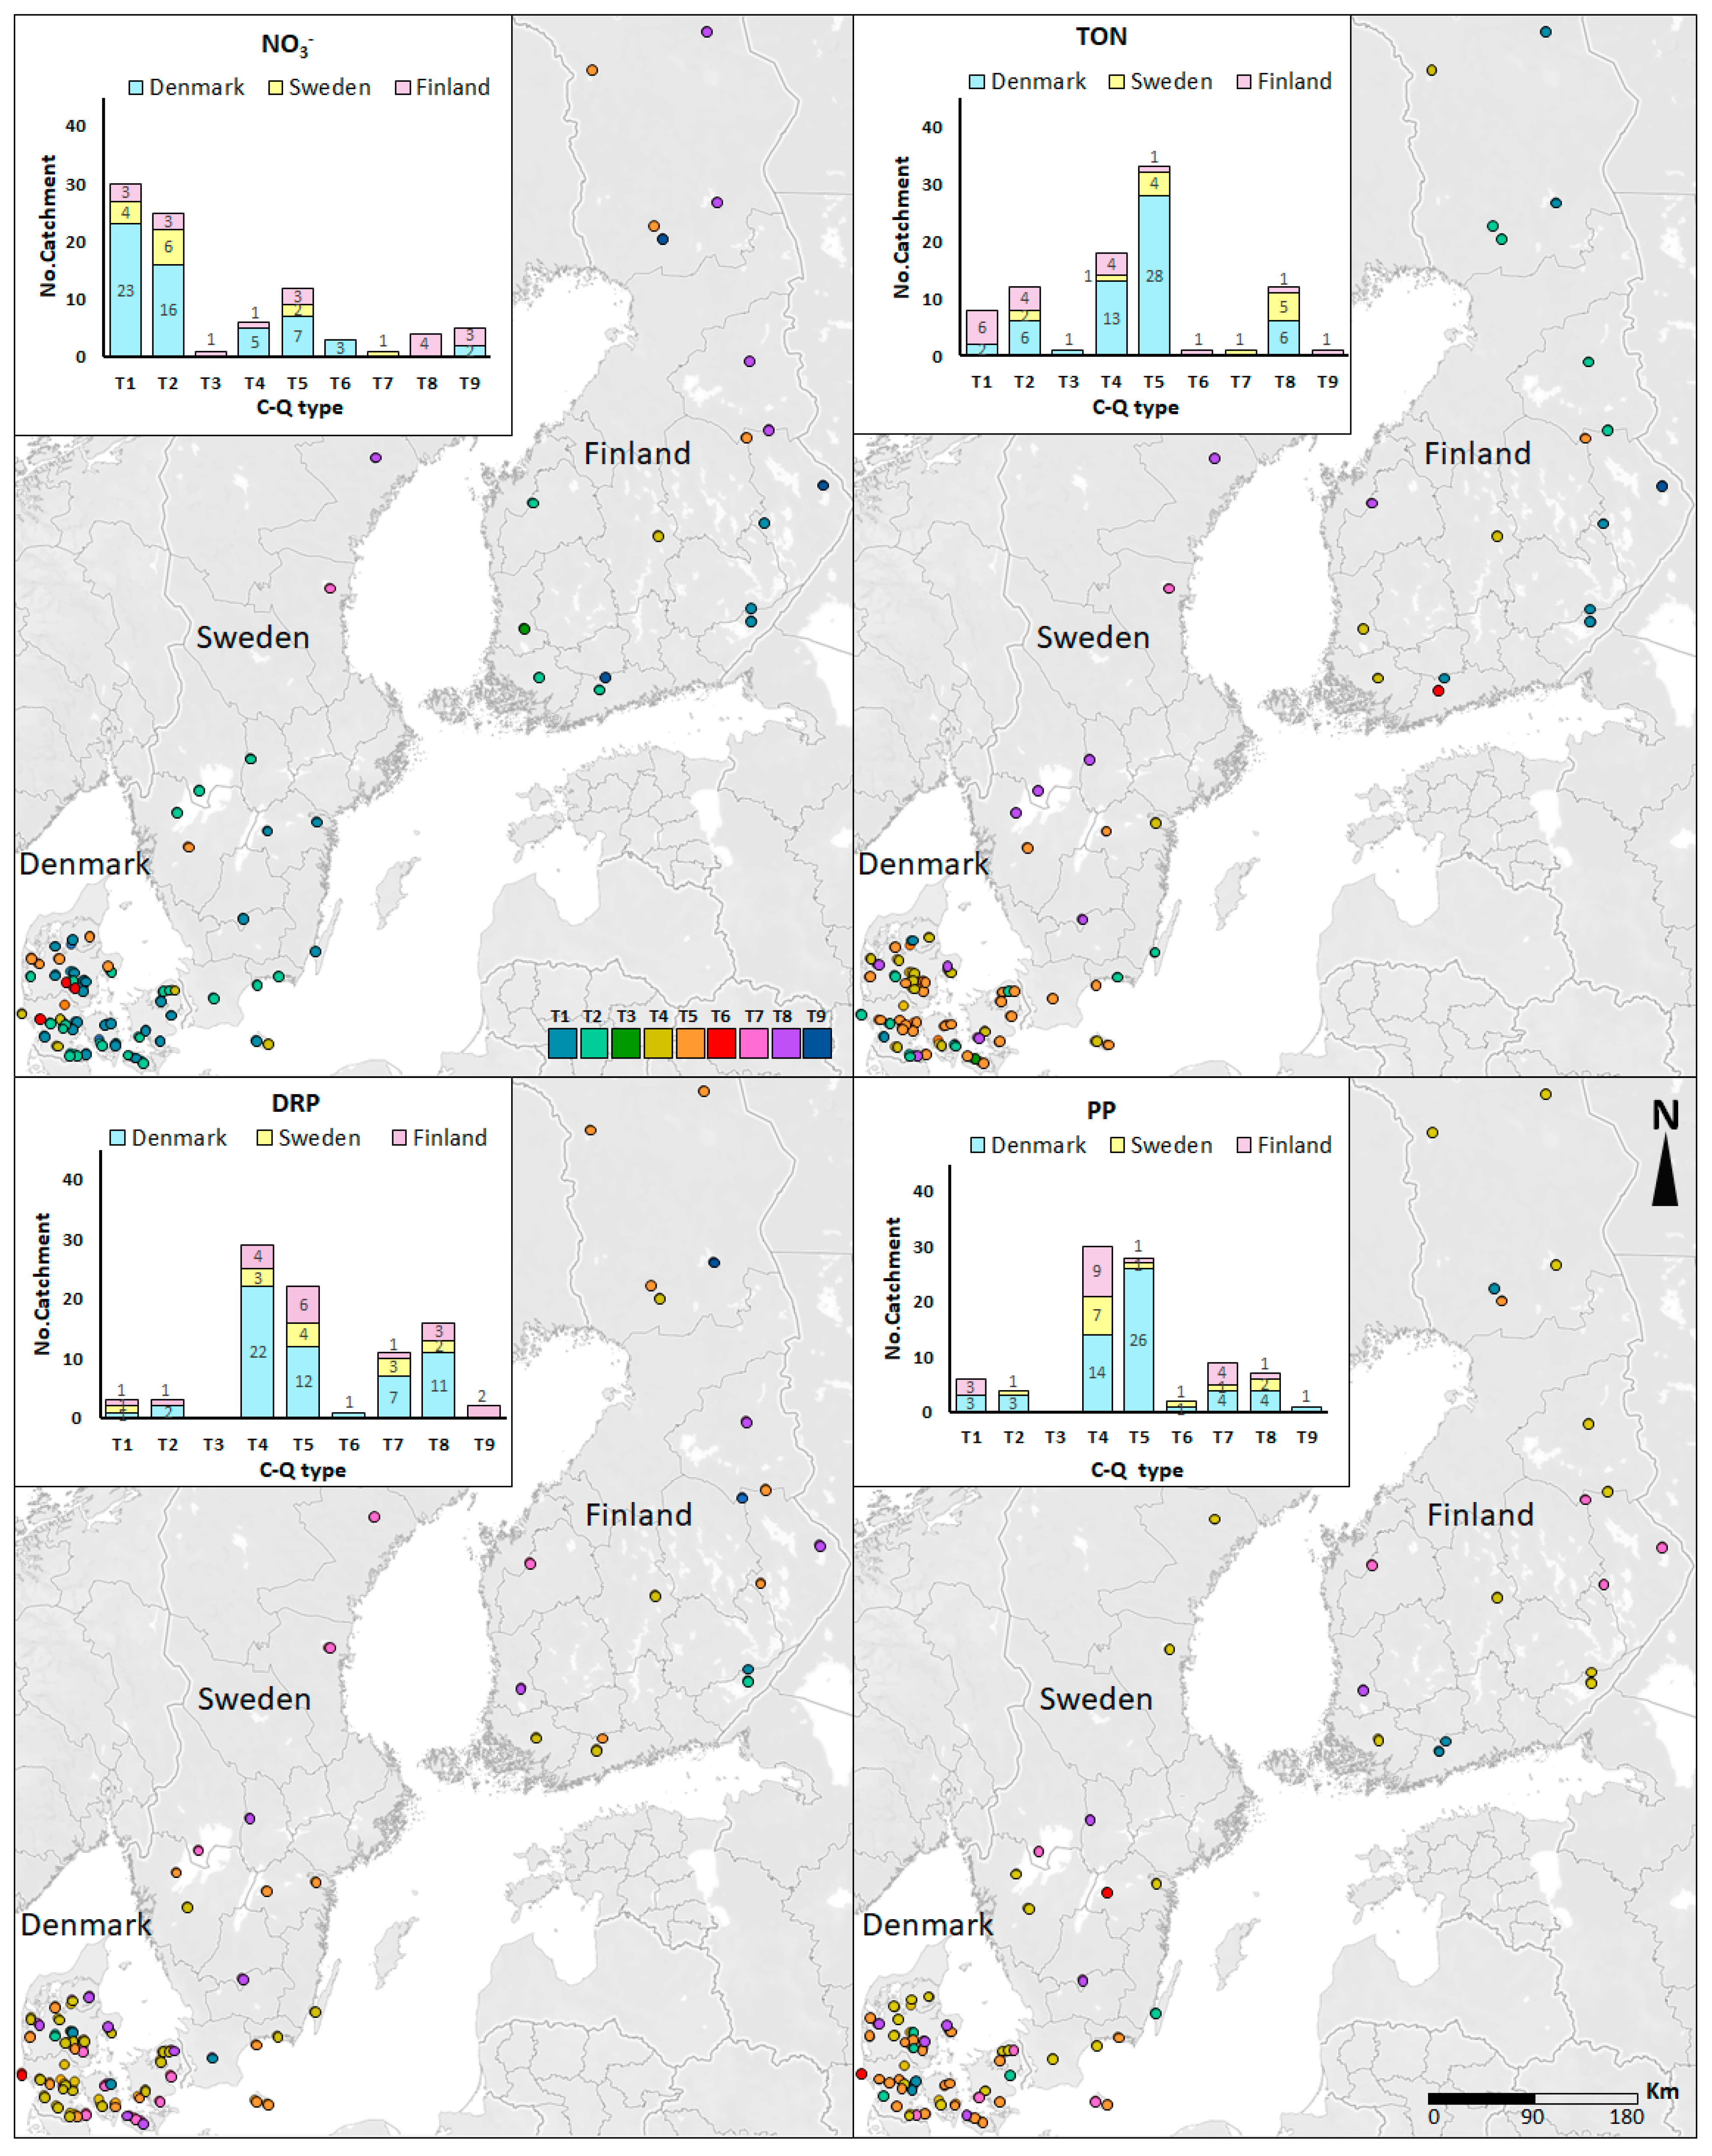
3.1. Classification of C-Q Relationships for Nutrient Forms

The results for NO3 in the Nordic region showed enrichment in 64% of the catchments (Figure 3 and Table 2), a constant relationship for 24% of the catchments, and dilution accounting for the remaining 12% (Figure 3 and Table 2). Country-specific analysis for NO3 showed enrichment dominated in both the Danish (70%) and the Swedish (77%) mini-catchments (Figure 3). In the Finnish mini-catchments, dilution was also of high importance (39%) (Figure 3). The dominant NO3 hysteresis patterns in the region were no hysteresis (48%) and clockwise (42%), while anti-clockwise occurred in only 10% of the catchments (Table 2). The Danish mini-catchments showed primarily clockwise hysteresis patterns (50%), whereas the no hysteresis pattern was most prevalent in the Swedish (62%) and Finnish (56%) mini-catchments (Figure 3). The regional results for TON differed from those of NO3; a constant C-Q regime type was the dominant behaviour (60%), followed by dilution (24%) and enrichment (16%) (Figure 3 and Table 2).
Country specific analysis of TON showed constant behaviour dominated in both the Danish (73%) and the Swedish (46%) mini-catchments (Figure 3). However, in the Swedish mini-catchments, dilution also was of high importance (39%) (Figure 3). In the Finnish mini-catchments, enrichment (56%) was the dominant behaviour (Figure 3). The dominant regional TON hysteresis pattern was no hysteresis (66%), followed by clockwise (31%) and anti-clockwise (3%) (Table 2). The dominant hysteresis pattern was no hysteresis in Denmark (71%) and Sweden (85%), while the clockwise pattern dominated in Finland (56%) (Figure 3).
The regional DRP C-Q results showed dominance of constant behaviour for a total of 59% of the mini-catchments but with a high number of catchments showing dilution behaviour (33%) and very few showing enrichment (8%) (Figure 3 and Table 2). National patterns for DRP were similar with dominance of constant behaviour (Figure 3). The dominant hysteresis patterns for DRP in the region were clockwise (50%), followed by no hysteresis (47%) and anti-clockwise (3%) (Table 2). Clockwise hysteresis patterns prevailed in Denmark (54%), whereas no hysteresis prevailed in Sweden (54%) and Finland (56%) (Figure 3).
Similar to DRP, C-Q regional relationships for PP were dominated by constant behaviour (69%), followed by dilution (20%) and enrichment (11%) (Figure 3 and Table 2). No major national differences could be seen for PP C-Q behaviour (Figure 3). The dominant regional hysteresis pattern for PP in the region was clockwise (53%) followed by no hysteresis (44%) and anti-clockwise (3%) (Table 2). In the Danish mini-catchments, no hysteresis pattern was clearly the most prominent (59%), whereas clockwise hysteresis dominated in Sweden (54%) and Finland (89%) (Figure 3). Further information on C−Q relationship types for nutrient forms is provided in supporting material Table S4.
The relationships between hydrological regime measured as BFI and export regime for NO3, TON, DRP, and PP were also investigated (Figure S1). Export regime for all four nutrient forms shows significant relationships to the base-flow (BFI) index (Figure S1). Although statistically significant relationships were obtained for NO3, TON, DRP, and PP, the explanatory power of the linear regression was often low. The influence of hydrological regime was strongest for TON (R2 = 0.45 ) and less so for PP (R2 = 0.11 ), DRP (R2 = 0.27), and NO3− (R2 = 0.13 ).

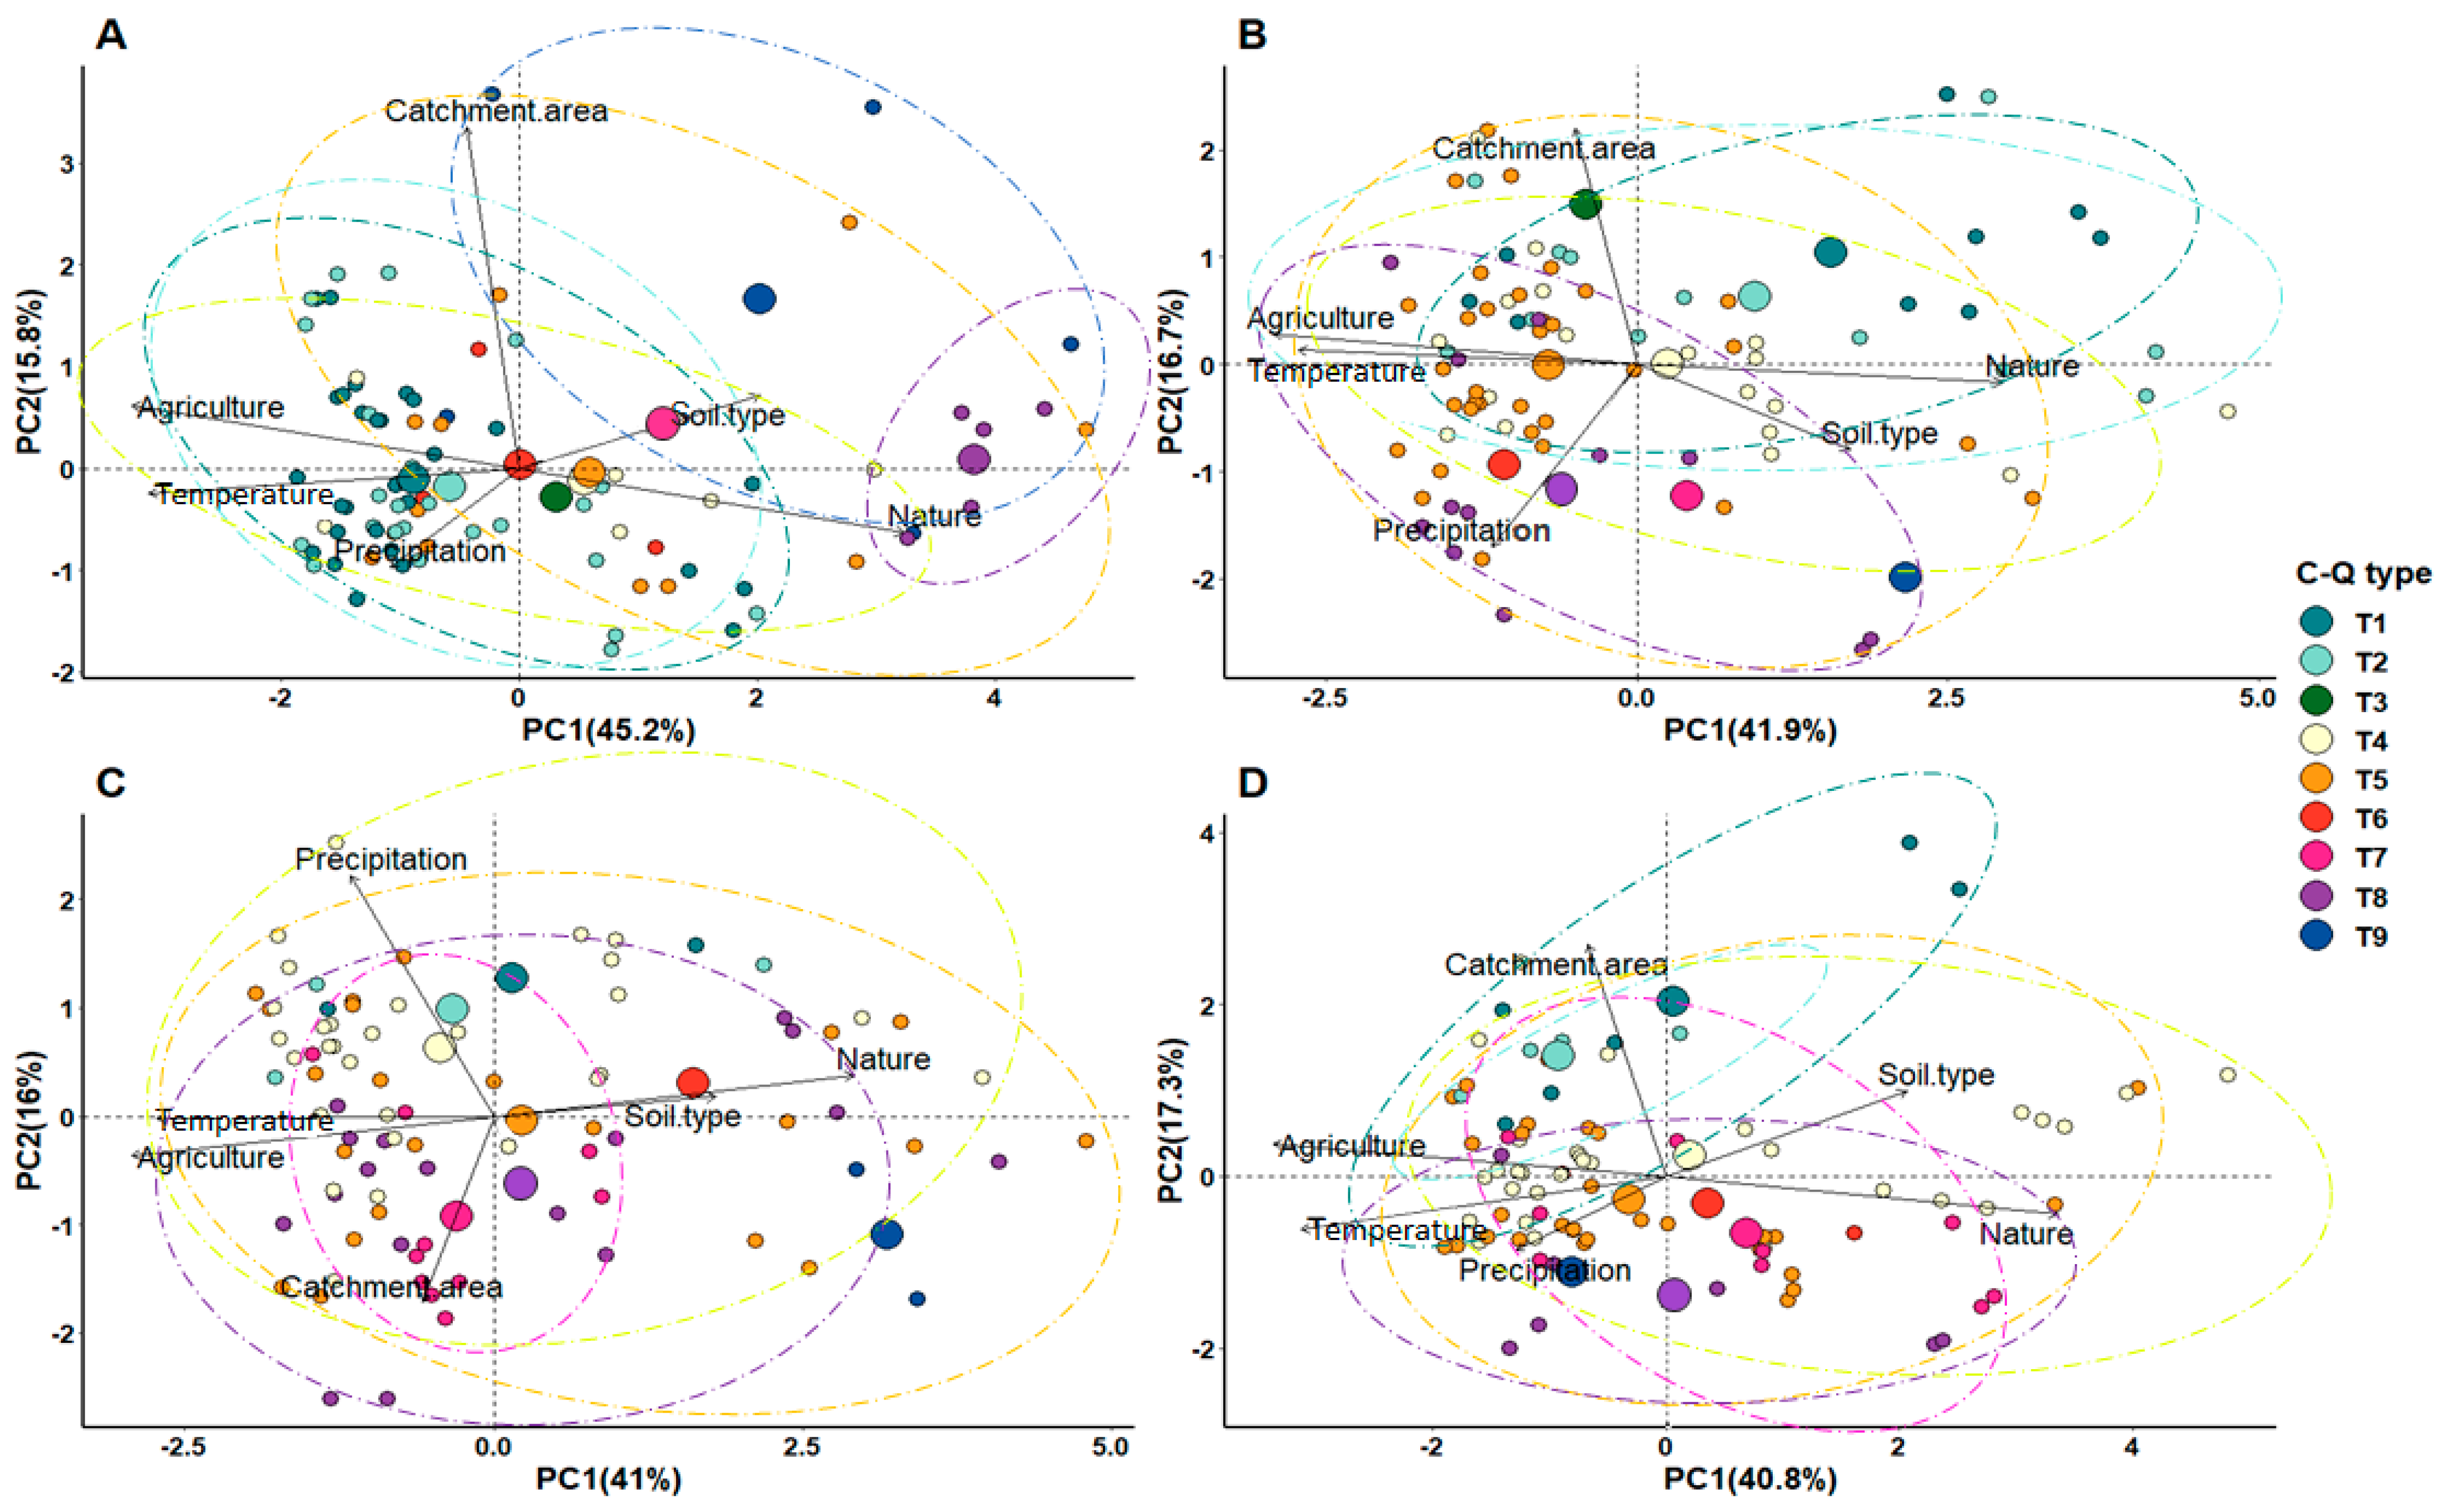
3.2. Associations between C-Q Types and Catchment Characteristics

Bi-plots showing C-Q relationship types and catchment parameters for each of NO3, TON, DRP, and PP are presented in Figure 4. Further information on each PCA is provided in supporting materials Table S5.
In the PCA analysis for NO3, PC1 explained 45.2% of the variance, whereas PC2 explained 15.8% (Figure 4A). The most important catchment characteristics for NO3 are land use type and air temperature; for example, enrichment (T1, T2, and T3) is mainly related to agricultural percentage cover and higher air temperature (Figure 4A). In the case of constant and dilution behaviour (T4–T8) they are principally related to percentage natural land cover and lower air temperatures. However, soil type and annual precipitation also seem to be important parameters in case of the two dilution behaviours T7 and T9 (Figure 4A).
For TON, the PCA analysis showed that PC1 explains 41.9% of the variance (agriculture and air temperature) and PC2 explains 16.7% of the variance (catchment area and precipitation) (Figure 4B). Other important explanatory parameters for TON are low annual precipitation for enrichment types T1 and T2, whereas the constant (T6) and the dilution type (T9) are related to catchments having high annual precipitation. In case of the enrichment type (T3) larger catchment size is a dominant controlling parameter and the dilution types (T7 and T9) are related to catchment soil type (Figure 4B).
The most important catchment characteristics for DRP are land use types and air temperature, which were related to PC1 that explained 41% of the variance. PC2, which was related to precipitation and catchment area explained 16% of the variation (Figure 4C). However, precipitation also seems to influence enrichment types T1 and T2 and the constant type (T4) (Figure 4C).
As for PP, PC1 explained 40.8% and PC2 17.3% of the variance (Figure 4D). The most important catchment characteristics are land use types and air temperature for PC1 and catchment area for PC2. The regime types T1 and T2 are positively related and T8 is negatively related to catchment area. The constant regime types T4, T5, and T6 are related to a mixed-signal of catchment land use dominance.

4. Discussion

4.1. Classification of C-Q Relationships for Nutrient Forms

The classification of C-Q relationships obtained from low-frequency concentration data in Nordic mini-catchments according to export regime and hysteresis patterns provided insight into catchment behaviour and nutrient export patterns. We found a broad range of C-Q types in the catchments, whereby all C-Q types occur for all nutrient forms investigated with the exception of C-Q type 3 (i.e., enrichment in combination with anti-clockwise hysteresis) which does not occur for DRP and PP (Table 2). The complete range of C-Q types in our study might be ascribed to the fact that only statistically significant patterns of enrichment and dilution over the entire discharge range are considered, while other patterns, which might show non-statistically significant enrichment or dilution, are summarised as constant. Furthermore, the mini-catchments are very heterogeneous, including upland and lowland catchments with contrasting hydro-climatic conditions, topography, and land use and soil types.
Similar to an earlier Finnish study [25], enrichment behaviour (T1, T2, T3) occurs commonly in catchments with large and relatively homogeneous element stores for nutrients, indicating transport-limited export. As for NO3, enrichment dominated in all countries, suggesting that high amounts of NO3 in agricultural catchment soils are readily available for leaching. This finding is consistent with other studies that showed enrichment for NO3 in catchments having a high proportion of agricultural areas [24,35,37,57]. The clockwise hysteresis pattern, which dominated the smaller Danish catchments, also points to a fast transport of NO3 from soils to streams, which might be linked to the dominance of tile-drained arable fields situated near to stream channels [58].
For TON, the differences in response behaviour—constant in Denmark (73%), constant (43%), and dilution (43%) in Sweden and enrichment in Finland (56%)—might be explained by differences in catchment sources and pathways. Finnish mini-catchments also had a clockwise hysteresis pattern, while no hysteresis characterised the majority of Danish and Swedish mini-catchments. This suggests that the source areas for TON in Finland might be tightly linked to riparian peatlands, whereas in Denmark and Sweden TON might be transported from more distant soil sources. Enrichment of TON (T3) can probably also be seen in streams draining dense livestock catchments with high manure and slurry inputs [35]. Constant behaviour of TON (T4, T5, T6) can result from reciprocal interactions between different drivers such as simultaneous enrichment and dilution in different parts of a catchment. Constant behaviour cannot be ascribed to the dominant spatial controls in the catchments [35]. Nevertheless, our results contrast with another study [47] evaluating variation in C-Q slopes derived from long-term low frequency N and P measurements that showed strong chemostatic behavior due to saturation and agricultural legacy effects.
Dilution behaviour (T7, T8, T9) commonly occurs in catchments with source-limited export, e.g., due to relatively low nutrient storage in non-agricultural catchments. For instance, a general association between bog (wetland) land cover and dilution caused by denitrification for NO3 is consistent with other studies [59,60]. Additionally, high volumes of available water for transport in wet catchments may cause dilution of TON [35,37]. Dilution behaviour can also be described by the dilution of downstream agricultural or natural or urban sources by runoff from upstream, more natural parts of the catchments.
For both DRP and PP, constant behaviour dominated in all mini-catchments in all countries, suggesting the existence of legacy P sources. For PP, the constant behaviour can possibly be explained by tight connection of legacy sources with the streams, e.g., stream banks can be a major source of PP [59,61]. For DRP, in one-third of the mini-catchments a dilution pattern was observed (Table 2). The dilution behaviour of DRP and PP can be ascribed to natural sources or (down-stream) point sources, which is consistent with other studies [35,37]. Dilution of DRP in catchments with a high percentage of agricultural land may indicate source-limited mobilisation of legacy stores in the catchments. The dilution pattern for DRP may also be attributed to point sources such as scattered households since these are often constant throughout the year and hence become diluted during high-flow periods.
A clockwise hysteresis pattern was found, principally for DRP and PP (Table 2). Clockwise hysteresis (T1, T4, T7) is a sign of fast responses of particulate and solute export to runoff events [33] and shows a close relationship or high connectivity between sources and receiving streams. This emphasises the importance of understanding the contribution of mini-catchments to P mobilisation [62,63]. Clockwise hysteresis of DRP and PP is associated mostly with a small percentage of natural land cover in the catchment points towards a strong influence of fast and highly connected transport pathways and point sources. The importance of artificial drainage as shortcuts of P exports has been demonstrated in many previous studies of water and nutrient losses in agricultural catchments [64,65]. Unfortunately, no detailed information about the occurrence of artificial drainage systems was available for this study. Therefore, the impact of artificial drainage on DRP and PP hysteresis patterns remains to be investigated. Anti-clockwise hysteresis (T3, T6, T9) can be explained by delayed transport processes due to the transport time within soils, the transport time between source areas and the catchment outlet as well as in-stream processing [33]. No significant association between the hysteresis patterns of N forms and catchment characteristics were found in this study. However, the hysteresis patterns documented for N forms might be explained by retardation of flow in soils, denitrification in wetlands, and the spatial differences in N losses within the catchment, triggering different response times between runoff events and N concentrations at the catchment outlets.
The contrasting behaviour of N and P can further be attributed to differences in nutrient sources such as a stronger influence of non-point sources on N than on P that generally originates from point sources [35]. Furthermore, differences in chemical properties and thus transport pathways might result in more homogeneous mobilisation of N from the entire catchment, P being predominantly mobilised from critical source areas with a high potential for surface runoff and a high connectivity with the river network [66,67].

4.2. Associations between C-Q Types and Catchment Characteristics

Associations between nutrient signals in different C-Q types and catchment characteristics are generally explained by a mixture of factors within the catchments related to source/pathways (i.e., extent and distribution of nutrient storage), soil properties (e.g., organic or mineral soils), and land use (cropping systems, agricultural intensity), hydrogeology (i.e., the available water for transport and hydrological connectivity), and climate (e.g., role of snow melt) and human impacts through drainage and point source discharges.
A conceptual understanding of the potential controls on in-stream nutrient concentrations underlying the C-Q classification (Figure 2) can be associated with catchment characteristics (Figure 4). Our multivariate analysis revealed an obvious association between C-Q classification and land use, which loaded strongly on PC1 for all nutrient forms. Catchment having the highest proportion of agricultural land showed dominance of enrichment types for NO3, whereas dilution types were dominant for catchments having high proportions of natural land (forest or mixed types of natural vegetation) (Figure 4). These findings confirm the results of a study that aimed to elucidate the patterns and driving factors behind the N fluxes in a set of catchments in Uruguay and Denmark, which differ in land use and hydro-climatic conditions [68].
Average air temperature was found to be a co-driving parameter with land use for the different C-Q types and this is in line with air temperature being a strong controlling factor for mineralization of organic matter in soils, length of growing season, crop yield, and hence for removal of nutrients with harvest. Annual precipitation was important for TON, giving rise to constant or dilution types (T6 and T8) when it is high and enrichment types (T1–T3) when it is low (Figure 4B). This suggests different mechanisms for TON transport across the Nordic region as it can be supply-limited in wetter catchments but is transport-limited in drier catchments. Annual precipitation exerted an opposite control on DRP C-Q relationships as higher values were linked to enrichment types and lower values to dilution types (Figure 4C). This pattern can possibly be explained by high legacy P stores in agricultural catchments and the impact of snow and soil frost in the drier, more northerly regions of the Nordic countries.
In Nordic catchments, snowmelt can contribute high amounts of water (up to 70%) to the annual runoff depending on the local annual climate. Snow and soil frost may affect C-Q relationships in several ways. In colder Nordic regions, snow accumulates from late autumn and melts in late spring and early summer. This leads to groundwater dominated discharge minima in February–March and snowmelt dominated runoff maxima in April–May. As the concentration of dissolved nutrients in streams depends partly on groundwater discharge, such conditions may strongly affect C-Q relationships and lead to a prevalence of dilution and anticlockwise C-Q types. Frozen soils often have low infiltration capacity [69]. Much of the snow melting on top of frozen soils discharges to streams with no or minimal soil contact, and this leads to low concentrations or dilution of all nutrient forms studied here [70]. On the other hand, snow melting on unfrozen soils can infiltrate and generate runoff of pre-event water. In such cases, concentrations of both dissolved and particulate bound nutrients might increase with runoff, just as in rain-generated hydrologic events.
Other studies have also looked at potential links between C-Q parameters and catchment characteristics. In most cases, correlations were poor [24,57] but these works evidenced relationships with catchment area, land use, and lithology. Similar to our study, a study in larger catchments in Scotland [35] did not identify any dominant spatial controls on stream nutrient concentration response with changes in flow. However, using C-Q typologies to classify catchments based on their export behaviour could still be used as part of a decision support system for the improvement of monitoring design and for spatially targeting of catchment scale mitigation measures. For example, in the spatial targeting of measures, application of transport mitigation measures (e.g., constructed wetlands) may be appropriate for catchment/nutrient combinations showing enrichment export regimes [71], while source mitigation measures may be more useful for catchment/nutrient combinations characterised by dilution export regimes [72]. Further, for enrichment export regimes, a higher frequency of water chemistry sampling may be appropriate compared with constant (medium-frequency) and dilution-type catchment/nutrient combinations [73].
The development of catchment typologies based on solute export behaviour and hysteresis could be useful for the transfer of information from data-rich to data-poor catchments [74], for impact assessment of climate, environmental and management changes on water quality and for parameterisation of water quality models [35]. However, finding the association between the typology presented here and catchment characteristics, e.g., topography, geology, and land use may be challenging owing to the complexity of different responses to both spatial and temporal mechanisms [5,14]. Within-catchment heterogeneity may also affect the links between catchment characteristics and C-Q relationships [23,32,75].

4.3. Evaluation of Methodology

Evaluating the limitations and uncertainties of water quality studies may contribute to increased awareness among watershed managers and policy makers, which in the end may contribute to more informed decisions. All catchment studies have limitations as well as technical and conceptual uncertainties that must be addressed. One potential limitation of this study is that catchments have a rapid response to precipitation inputs and sub-daily hydrographs were not available. However, the typology presented here is related to seasonal hysteresis patterns not the short terms brehavior during individual runoff events.
Uncertainties arise from many sources. These could include the way that export regime and hysteresis patterns are conceptualized and statistically tested, the mathematical functions relating concentrations to discharge may be an over-simplification of reality, the breakpoints assigned for modelling concentrations for different discharge quantiles, and how catchment characteristics are assumed to influence hydrological and nutrient flow processes. Within all of these issues there are also multiple interactions that may further contribute to uncertainties, and it is very difficult if not impossible to address all such issues. Further, uncertainties in input data such as soil map classifications, land use map classification, flow and concentration data could also contribute to uncertainties that will propagate to the final classification. In our study, we assumed that the reclassified soil, land use classes, and concentration data had no uncertainties, but in reality their uncertainty will affect the correlation between the different soil classes, land use classes, concentration data, and the C-Q types of the catchments. However, it may be possible to reduce the uncertainty in classification by obtaining a better understanding of the mini-catchments relative to soil types, land use types and hydrogeology (e.g., tile drainage) and their respective C-Q types. Thus, for a better representation of areas influencing in-stream water quality, it might be appropriate to investigate C-Q types in even smaller catchments (i.e., few hectares) with relatively homogeneous characteristics throughout.
PCA is a good data summary tool when the patterns of interest can be projected onto linear, orthogonal components. However, PCA also has limitations that must be considered when interpreting the output: the underlying structure of the data must be linear, patterns that are highly correlated may be unresolved because all PCs are uncorrelated, and the goal of PCA is to explain the maximum amount of variance and not necessarily to find clusters [76]. The method of selecting input data for PCA analysis is also an important factor to consider when interpreting the results.

5. Conclusions

Our work demonstrates the use of a novel nutrient concentration (C) and discharge (Q) (C-Q) classification [35] on 8 years of water quality data from 87 Nordic mini-catchments situated in Denmark, Finland, and Sweden. The dominant export regimes for nitrogen (N) were enrichment for nitrate and constant for total organic N. For phosphorus (P), both particulate P and dissolved reactive P were characterised by a constant export regime. Clockwise rotational hysteresis patterns dominated for nitrate, dissolved reactive P and particulate P, whereas a no hysteresis pattern dominated for total organic N.
As expected, our results showed that catchment land use exerted a dominant control on the C-Q types. Nutrient export behaviour in streams draining Nordic mini-catchments is determined by catchment land use characteristics and, to a lesser extent, by climate. All of these factors are important elements to be considered in future surface water nutrient management plans.

Supplementary Materials

The following are available online at https://www.mdpi.com/2073-4441/12/6/1776/s1.

Author Contributions

Conceptualisation, F.H. and B.K. (Brian Kronvang); methodology, F.H., I.P. and B.K. (Brian Kronvang); formal analysis, F.H.; investigation, all authors; resources, H.T., K.K., H.M. and A.L.; data curation, F.H.; writing – original draft preparation, F.H.; writing – review and editing, B.K. (Brian Kronvang), M.F., B.K. (Bjørn Kløve), K.K., H.M., I.P., J.W.M.P. and A.L; visualisation, F.H.; supervision, B.K. (Brian Kronvang); funding acquisition, B.K. (Brian Kronvang). All authors have read and agreed to the published version of the manuscript.

Funding

This study was part of the Nordic Centre of Excellence BIOWATER project and funded by Nordforsk (project number 82263).

Acknowledgments

We thankfully acknowledge valuable English language edits by Anne Mette Poulsen. The climatic characteristics with a resolution of a 0.5 degree grid (50 km) were derived from a database provided by the Swedish Meteorological and Hydrological Institute (SMHI) within the contract C3S_441_Lot1_SMHI of the Copernicus Climate Change Service (C3S), https://swicca.eu/). Further, Ina Pohle was supported by the Scottish Government’s Rural and Environment Science and Analytical Services Division (RESAS).

Conflicts of Interest

The authors declare no conflict of interest.

References

  1. Diaz, R.J.; Rosenberg, R. Spreading dead zones and consequences for marine ecosystems. Science 2008, 321, 926–929. [Google Scholar] [CrossRef] [PubMed]
  2. Reusch, T.B.; Dierking, J.; Andersson, H.C.; Bonsdorff, E.; Carstensen, J.; Casini, M.; Czajkowski, M.; Hasler, B.; Hinsby, K.; Hyytiäinen, K.; et al. The Baltic Sea as a time machine for the future coastal ocean. Sci. Adv. 2018, 4, 8195. [Google Scholar] [CrossRef] [PubMed] [Green Version]
  3. Smol, M.; Preisner, M.; Bianchini, A.; Rossi, J.; Hermann, L.; Schaaf, T.; Kruopienė, J.; Pamakštys, K.; Klavins, M.; Ozola-Davidane, R.; et al. Strategies for Sustainable and Circular Management of Phosphorus in the Baltic Sea Region: The Holistic Approach of the InPhos Project. Sustainability 2020, 12, 2567. [Google Scholar] [CrossRef] [Green Version]
  4. Bouwman, A.F.; Bierkens, M.F.P.; Griffioen, J.; Hefting, M.M.; Middelburg, J.J.; Middelkoop, H.; Slomp, C.P. Nutrient dynamics, transfer and retention along the aquatic continuum from land to ocean: Towards integration of ecological and biogeochemical models. Biogeosciences 2016, 10, 1–23. [Google Scholar] [CrossRef] [Green Version]
  5. Lundberg, C.J.; Lane, R.R.; Day, J.W., Jr. Spatial and temporal variations in nutrients and water-quality parameters in the Mississippi River-influenced Breton Sound Estuary. J. Coast. Res. 2014, 30, 328–336. [Google Scholar] [CrossRef]
  6. Stutter, M.I.; Langan, S.J.; Cooper, R.J. Spatial and temporal dynamics of stream water particulate and dissolved N, P and C forms along a catchment transect, NE Scotland. J. Hydrol. 2008, 350, 187–202. [Google Scholar] [CrossRef]
  7. Dong, Z.; Driscoll, C.T.; Campbell, J.L.; Pourmokhtarian, A.; Stoner, A.M.; Hayhoe, K. Projections of water, carbon, and nitrogen dynamics under future climate change in an alpine tundra ecosystem in the southern Rocky Mountains using a biogeochemical model. Sci. Total Environ. 2019, 650, 1451–1464. [Google Scholar] [CrossRef] [PubMed]
  8. Lintern, A.; Webb, J.A.; Ryu, D.; Liu, S.; Waters, D.; Leahy, P.; Bende-Michl, U.; Western, A.W. What are the key catchment characteristics affecting spatial differences in riverine water quality? Water Resour. Res. 2018, 54, 7252–7272. [Google Scholar] [CrossRef]
  9. Miller, M.P.; Tesoriero, A.J.; Hood, K.; Terziotti, S.; Wolock, D.M. Estimating discharge and nonpoint source nitrate loading to streams from three end-member pathways using high-frequency water quality data. Water Resour. Res. 2017, 53, 10201–10216. [Google Scholar] [CrossRef] [Green Version]
  10. Wang, J.; Chen, G.; Kang, W.; Hu, K.; Wang, L. Impoundment intensity determines temporal patterns of hydrological fluctuation, carbon cycling and algal succession in a dammed lake of Southwest China. Water Res. 2019, 148, 162–175. [Google Scholar] [CrossRef] [PubMed]
  11. Yang, S.; Büttner, O.; Kumar, R.; Jäger, C.; Jawitz, J.W.; Rao, P.S.C.; Borchardt, D. Spatial patterns of water quality impairments from point source nutrient loads in Germany’s largest national River Basin (Weser River). Sci. Total Environ. 2019, 697, 134145. [Google Scholar] [CrossRef] [PubMed]
  12. Bernal, S.; von Schiller, D.; Sabater, F.; Martí, E. Hydrological extremes modulate nutrient dynamics in Mediterranean climate streams across different spatial scales. Hydrobiologia 2018, 719, 31–42. [Google Scholar] [CrossRef] [Green Version]
  13. Bracken, L.J.; Wainwright, J.; Ali, G.A.; Tetzlaff, D.; Smith, M.W.; Reaney, S.M.; Roy, A.G. Concepts of hydrological connectivity: Research approaches, pathways and future agendas. Earth Sci. Rev. 2013, 119, 17–34. [Google Scholar] [CrossRef] [Green Version]
  14. Wood, M.E.; Macrae, M.L.; Strack, M.; Price, J.S.; Osko, T.J.; Petrone, R.M. Spatial variation in nutrient dynamics among five different peatland types in the Alberta oil sands region. Ecohydrology 2016, 9, 688–699. [Google Scholar] [CrossRef]
  15. Jarvie, H.P.; Smith, D.R.; Norton, L.R.; Edwards, F.K.; Bowes, M.J.; King, S.M.; Scarlett, P.; Davies, S.; Dils, R.M.; Bachiller-Jareno, N. Phosphorus and nitrogen limitation and impairment of headwater streams relative to rivers in Great Britain: A national perspective on eutrophication. Sci. Total Environ. 2018, 621, 849–862. [Google Scholar] [CrossRef] [PubMed] [Green Version]
  16. Hawtree, D.; Nunes, J.P.; Keizer, J.J.; Jacinto, R.; Santos, J.; Rial-Rivas, M.E.; Boulet, A.K.; Tavares-Wahren, F.; Feger, K.H. Time series analysis of the long-term hydrologic impacts of afforestation in the Águeda watershed of north-central Portugal. Hydrol. Earth Syst. Sci. 2015, 19, 3033–3045. [Google Scholar] [CrossRef] [Green Version]
  17. Knapp, J.L.; Freyberg, J.V.; Studer, B.; Kiewiet, L.; Kirchner, J.W. Concentration-discharge relationships vary among hydrological events, reflecting differences in event characteristics. Hydrol. Earth Syst. Sci. Discuss. 2020, 7, 1–27. [Google Scholar]
  18. Vale, S.S.; Dymond, J.R. Interpreting nested storm event suspended sediment-discharge hysteresis relationships at large catchment scales. Hydrol. Process. 2020, 34, 420–440. [Google Scholar] [CrossRef]
  19. Scheffer, M.; Bascompte, J.; Brock, W.A.; Brovkin, V.; Carpenter, S.R.; Dakos, V.; Held, H.; Van Nes, E.H.; Rietkerk, M.; Sugihara, G. Early-warning signals for critical transitions. Nature 2009, 461, 53–59. [Google Scholar] [CrossRef]
  20. Meybeck, M.; Laroche, L.; Dürr, H.H.; Syvitski, J.P.M. Global variability of daily total suspended solids and their fluxes in rivers. Glob. Planet. Chang. 2003, 39, 65–93. [Google Scholar] [CrossRef]
  21. Moatar, F.; Meybeck, M.; Raymond, S.; Birgand, F.; Curie, F. River flux uncertainties predicted by hydrological variability and riverine material behaviour. Hydrol. Process. 2013, 27, 3535–3546. [Google Scholar] [CrossRef]
  22. Moatar, F.; Floury, M.; Gold, A.J.; Meybeck, M.; Renard, B.; Chandesris, A.; Minaudo, C.; Addy, K.; Piffady, J.; Pinay, G. Stream solutes and particulates export regimes: A new framework to optimize their monitoring. Front. Ecol. Evol. 2019, 7, 516. [Google Scholar] [CrossRef] [Green Version]
  23. Moatar, F.; Meybeck, M. Compared performances of different algorithms for estimating annual nutrient loads discharged by the eutrophic River Loire. Hydrol. Process. Int. J. 2005, 19, 429–444. [Google Scholar] [CrossRef]
  24. Godsey, S.E.; Kirchner, J.W.; Clow, D.W. Concentration–discharge relationships reflect chemostatic characteristics of US catchments. Hydrol. Process. Int. J. 2009, 23, 1844–1864. [Google Scholar] [CrossRef]
  25. Basu, N.B.; Destouni, G.; Jawitz, J.W.; Thompson, S.E.; Loukinova, N.V.; Darracq, A.; Zanardo, S.; Yaeger, M.; Sivapalan, M.; Rinaldo, A.; et al. Nutrient loads exported from managed catchments reveal emergent biogeochemical stationarity. Geophys. Res. Lett. 2010, 37. [Google Scholar] [CrossRef]
  26. Musolff, A.; Schmidt, C.; Selle, B.; Fleckenstein, J.H. Catchment controls on solute export. Adv. Water Resour. 2015, 86, 133–146. [Google Scholar] [CrossRef]
  27. Musolff, A.; Fleckenstein, J.H.; Rao, P.S.C.; Jawitz, J.W. Emergent archetype patterns of coupled hydrologic and biogeochemical responses in catchments. Geophys. Res. Lett. 2017, 44, 4143–4151. [Google Scholar] [CrossRef]
  28. Zhang, Q. Synthesis of nutrient and sediment export patterns in the Chesapeake Bay watershed: Complex and non-stationary concentration-discharge relationships. Sci. Total Environ. 2018, 618, 1268–1283. [Google Scholar] [CrossRef]
  29. Minaudo, C.; Dupas, R.; Gascuel-Odoux, C.; Roubeix, V.; Danis, P.A.; Moatar, F. Seasonal and event-based concentration-discharge relationships to identify catchment controls on nutrient export regimes. Adv. Water Resour. 2019, 131, 103379. [Google Scholar] [CrossRef]
  30. Aguilera, R.; Melack, J.M. Concentration-discharge responses to storm events in coastal California watersheds. Water Resour. Res. 2018, 54, 407–424. [Google Scholar] [CrossRef]
  31. Hunsaker, C.T.; Johnson, D.W. Concentration-discharge relationships in headwater streams of the Sierra Nevada, California. Water Resour. Res. 2017, 53, 7869–7884. [Google Scholar] [CrossRef]
  32. Zuecco, G.; Penna, D.; Borga, M.; van Meerveld, H.J. A versatile index to characterize hysteresis between hydrological variables at the runoff event timescale. Hydrol. Process. 2016, 30, 1449–1466. [Google Scholar] [CrossRef] [Green Version]
  33. Bieroza, M.Z.; Heathwaite, A.L. Seasonal variation in phosphorus concentration–discharge hysteresis inferred from high-frequency in situ monitoring. J. Hydrol. 2015, 524, 333–347. [Google Scholar] [CrossRef] [Green Version]
  34. Winnick, M.J.; Carroll, R.W.; Williams, K.H.; Maxwell, R.M.; Dong, W.; Maher, K. Snowmelt controls on concentration-discharge relationships and the balance of oxidative and acid-base weathering fluxes in an alpine catchment, East River, Colorado. Water Resour. Res. 2017, 53, 2507–2523. [Google Scholar] [CrossRef]
  35. Pohle, I.; Glendell, M.; Baggaley, N.; Stutter, M. A classification scheme for concentration-discharge relationships based on long-term low-frequency water quality data. In Geophysical Research Abstracts; EGU2019-7425; EGU General Assembly: Vienna, Austria, 2019; Volume 21. [Google Scholar]
  36. Meybeck, M.; Moatar, F. Daily variability of river concentrations and fluxes: Indicators based on the segmentation of the rating curve. Hydrol. Process. 2012, 26, 1188–1207. [Google Scholar] [CrossRef] [Green Version]
  37. Moatar, F.; Abbott, B.W.; Minaudo, C.; Curie, F.; Pinay, G. Elemental properties, hydrology, and biology interact to shape concentration-discharge curves for carbon, nutrients, sediment, and major ions. Water Resour. Res. 2017, 53, 1270–1287. [Google Scholar] [CrossRef]
  38. Dupas, R.; Jomaa, S.; Musolff, A.; Borchardt, D.; Rode, M. Disentangling the influence of hydroclimatic patterns and agricultural management on river nitrate dynamics from sub-hourly to decadal time scales. Sci. Total Environ. 2016, 571, 791–800. [Google Scholar] [CrossRef]
  39. Alexander, R.B.; Boyer, E.W.; Smith, R.A.; Schwarz, G.E.; Moore, R.B. The role of headwater streams in downstream water quality 1. JAWRA J. Am. Water Resour. Assoc. 2007, 43, 41–59. [Google Scholar] [CrossRef] [Green Version]
  40. NOVANA 2017-21. Se Det Nationale Overvågningsprogram for Vandmiljø og Natur (NOVANA)2017-21. Available online: http://mst.dk/service/publikationer/publikationsarkiv/2017/okt/novana-2017-21/ (accessed on 3 April 2019).
  41. Kyllmar, K.; Forsberg, L.S.; Andersson, S.; Mårtensson, K. Small agricultural monitoring catchments in Sweden representing environmental impact. Agric. Ecosyst. Environ. 2014, 198, 25–35. [Google Scholar] [CrossRef]
  42. Löfgren, S.; Aastrup, M.; Bringmark, L.; Hultberg, H.; Lewin-Pihlblad, L.; Lundin, L.; Karlsson, G.P.; Thunholm, B. Recovery of soil water, groundwater, and streamwater from acidification at the Swedish Integrated Monitoring catchments. Ambio 2011, 40, 836–856. [Google Scholar] [CrossRef] [Green Version]
  43. Linjama, J.; Järvinen, J.; Kivinen, Y. The Finnish Environment. In Hydrological Yearbook 2006–2010; Korhonen, J., Haavanlammi, E., Eds.; Finnish Environmental Institute: Helsinki, Finland, 2012; p. 8. [Google Scholar]
  44. Levin, G.; Iosub, C.I.; Jepsen, M.R. Basemap02: Technical Documentation of a Model for Elaboration of a Land Use and Land-Cover Map for Denmark; Aarhus University, DCE—Danish Centre for Environment and Energy: Aarhus, Denmark, 2017. [Google Scholar]
  45. Vuorenmaa, J.; Rekolainen, S.; Lepistö, A.; Kenttämies, K.; Kauppila, P. Losses of nitrogen and phosphorus from agricultural and forest areas in Finland during the 1980s and 1990s. Environ. Monit. Assess. 2002, 76, 213–248. [Google Scholar] [CrossRef] [PubMed]
  46. Tattari, S.; Koskiaho, J.; Kosunen, M.; Lepistö, A.; Linjama, J.; Puustinen, M. Nutrient loads from agricultural and forested areas in Finland from 1981 up to 2010—Can the efficiency of undertaken water protection measures seen? Environ. Monit. Assess. 2017, 189, 95. [Google Scholar] [CrossRef] [Green Version]
  47. Bieroza, M.Z.; Heathwaite, A.L.; Bechmann, M.; Kyllmar, K.; Jordan, P. The concentration-discharge slope as a tool for water quality management. Sci. Total Environ. 2018, 630, 738–749. [Google Scholar] [CrossRef] [PubMed] [Green Version]
  48. Li, L.; Bao, C.; Sullivan, P.L.; Brantley, S.; Shi, Y.; Duffy, C. Understanding watershed hydrogeochemistry: 2. Synchronized hydrological and geochemical processes drive stream chemostatic behavior. Water Resour. Res. 2017, 53, 2346–2367. [Google Scholar] [CrossRef] [Green Version]
  49. R Core Team. R: A Language and Environment for Statistical Computing; R Foundation for Statistical Computing: Vienna, Austria, 2019; Available online: http://www.R-project.org/ (accessed on 12 December 2010).
  50. Elzhov, T.V.; Mullen, K.M.; Spiess, A.N.; Bolker, B. Minpack. lm: R Interface to the Levenberg-Marquardt Nonlinear Least-Squares Algorithm Found in MINPACK, Plus Support for Bounds. R package version 1.2-1. 2016. Available online: https://cran.r-project.org/web/packages/minpack.lm/minpack.lm.pdf (accessed on 19 June 2010).
  51. Bond, N. Hydrostats: Hydrologic Indices for Daily Time Series Data. R package version 0.2.7. 2019. Available online: https://cran.r-project.org/web/packages/hydrostats/hydrostats.pdf (accessed on 19 June 2010).
  52. Gustard, A.; Bullock, A.; Dixon, J.M. Low Flow Estimation in the United Kingdom; IH report no. 108; Institute of Hydrology: Wallingford, UK, 1992. [Google Scholar]
  53. Gabriel, K.R. The biplot graphic display of matrices with application to principal component analysis. Biometrika 1971, 58, 453–467. [Google Scholar] [CrossRef]
  54. Jolliffe, I.T.; Cadima, J. Principal component analysis: A review and recent developments. Philos. Trans. R. Soc. A Math. Phys. Eng. Sci. 2016, 374, 20150202. [Google Scholar] [CrossRef]
  55. Gower, J.C.; Lubbe, S.G.; Le Roux, N.J. Understanding Biplots; John Wiley & Sons: New York, NY, USA, 2011. [Google Scholar]
  56. Abdi, H.; Williams, L.J. Principal component analysis. Wiley Interdiscip. Rev. Comput. Stat. 2010, 2, 433–459. [Google Scholar] [CrossRef]
  57. Diamond, J.S.; Cohen, M.J. Complex patterns of catchment solute–discharge relationships for coastal plain rivers. Hydrol. Process. 2018, 32, 388–401. [Google Scholar] [CrossRef]
  58. Grant, R.; Laubel, A.; Kronvang, B.; Andersen, H.E.; Svendsen, L.M.; Fuglsang, A. Loss of dissolved and particulate phosphorus from arable catchments by subsurface drainage. Water Res. 1996, 30, 2633–2642. [Google Scholar] [CrossRef]
  59. Laubel, A.; Kronvang, B.; Hald, A.B.; Jensen, C. Hydromorphological and biological factors influencing sediment and phosphorus loss via bank erosion in small lowland rural streams in Denmark. Hydrol. Process. 2003, 17, 3443–3463. [Google Scholar] [CrossRef]
  60. Stutter, M.I.; Graeber, D.; Evans, C.D.; Wade, A.J.; Withers, P.J.A. Balancing macronutrient stoichiometry to alleviate eutrophication. Sci. Total Environ. 2018, 634, 439–447. [Google Scholar] [CrossRef] [PubMed]
  61. Kronvang, B.; Audet, J.; Baattrup-Pedersen, A.; Jensen, H.S.; Larsen, S.E. Phosphorus load to surface water from bank erosion in a Danish lowland river basin. J. Environ. Qual. 2012, 41, 304–313. [Google Scholar] [CrossRef] [PubMed] [Green Version]
  62. Bol, R.; Gruau, G.; Mellander, P.E.; Dupas, R.; Bechmann, M.; Skarbøvik, E.; Bieroza, M.; Djodjic, F.; Glendell, M.; Jordan, P.; et al. Challenges of reducing phosphorus based water eutrophication in the agricultural landscapes of northwest Europe. Front. Mar. Sci. 2018, 5, 276. [Google Scholar] [CrossRef] [Green Version]
  63. Dupas, R.; Musolff, A.; Jawitz, J.W.; Rao, P.S.C.; Jäger, C.G.; Fleckenstein, J.H.; Rode, M.; Borchardt, D. Carbon and nutrient export regimes from headwater catchments to downstream reaches. Biogeosciences 2017, 14, 4391. [Google Scholar] [CrossRef] [Green Version]
  64. Koch, S.; Kahle, P.; Lennartz, B. Spatio-temporal analysis of phosphorus concentrations in a North-Eastern German lowland watershed. J. Hydrol. Reg. Stud. 2018, 15, 203–216. [Google Scholar] [CrossRef]
  65. Laubel, A.; Jacobsen, O.H.; Kronvang, B.; Grant, R.; Andersen, H.E. Subsurface Drainage Loss of Particles and Phosphorus from Field Plot Experiments and a Tile-Drained Catchment. J. Environ. Qual. 1999, 28, 576–584. [Google Scholar] [CrossRef]
  66. Sliva, L.; Williams, D.D. Buffer zone versus whole catchment approaches to studying land use impact on river water quality. Water Res. 2016, 35, 3462–3472. [Google Scholar] [CrossRef]
  67. Sharpley, A.N.; Kleinman, P.J.; Jordan, P.; Bergström, L.; Allen, A.L. Evaluating the success of phosphorus management from field to watershed. J. Environ. Qual. 2009, 38, 1981–1988. [Google Scholar] [CrossRef]
  68. Goyenola, G.; Graeber, D.; Meerhoff, M.; Jeppesen, E.; Mello, F.-D.; Vidal, N.; Fosalba, C.; Ovesen, N.B.; Gelbrecht, J.; Mazzeo, N.; et al. Influence of Farming Intensity and Climate on Lowland Stream Nitrogen. Water 2020, 12, 1021. [Google Scholar] [CrossRef] [Green Version]
  69. Lundberg, A.; Ala-Aho, P.; Eklo, O.; Klöve, B.; Kværner, J.; Stumpp, C. Snow and frost: Implications for spatiotemporal infiltration patterns–A review. Hydrol. Process. 2016, 30, 1230–1250. [Google Scholar] [CrossRef]
  70. Eskelinen, R.; Ronkanen, A.; Marttila, H.; Isokangas, E.; Kløve, B. Effects of soil frost on snowmelt runoff generation and surface water quality in drained peatlands. Boreal Environ. Res. 2016, 21, 556–570. [Google Scholar]
  71. Carstensen, M.V.; Hashemi, F.; Hoffmann, C.C.; Zak, D.; Audet, J.; Kronvang, B. Efficiency of mitigation measures targeting nutrient losses from agricultural drainage systems: A review. Ambio 2020. [Google Scholar] [CrossRef] [PubMed]
  72. Hashemi, F.; Kronvang, B. Multi-functional benefits from targeted land use changes in a Danish catchment. Ambio 2020. under review. [Google Scholar]
  73. Kronvang, B.; Bruhn, A.J. Choice of sampling strategy and estimation method for calculating nitrogen and phosphorus transport in small lowland streams. Hydrol. Process. 1996, 10, 1483–1501. [Google Scholar] [CrossRef]
  74. Krause, S.; Freer, J.; Hannah, D.M.; Howden, N.J.; Wagener, T.; Worrall, F. Catchment similarity concepts for understanding dynamic biogeochemical behaviour of river basins. Hydrol. Process. 2014, 28, 1554–1560. [Google Scholar] [CrossRef] [Green Version]
  75. Ali, G.; Wilson, H.; Elliott, J.; Penner, A.; Haque, A.; Ross, C.; Rabie, M. Phosphorus export dynamics and hydrobiogeochemical controls across gradients of scale, topography and human impact. Hydrol. Process. 2017, 31, 3130–3145. [Google Scholar] [CrossRef]
  76. Lever, J.; Krzywinsk, M.; Altman, N. Points of significance: Principal component analysis. Nat. Methods 2017, 14, 641–642. [Google Scholar] [CrossRef] [Green Version]
Figure 1. Locations of the mini-catchments investigated in the study.
Water 12 01776 g001
Figure 2. Schematic of the concentration–discharge (C-Q) classification considering both export regime and hysteresis pattern resulting in 9 types of C-Q relationships. Hysteresis patterns include: clockwise (concentration (C) at the rising limb (r) is higher than at the falling limb (f)), no hysteresis (no difference in concentrations at the rising and falling limbs), and anticlockwise (concentration at the falling limb is higher than at the rising limb). Export regime includes: enrichment (concentration increases with discharge) and constant (concentration does not change with discharge) and dilution (concentration decreases with discharge—lower C at high (hQ) than at low discharge (lQ)). Modified from [35].
Water 12 01776 g002
Figure 3. C-Q relationship types (T1–T9) characterising mini-catchments in three Nordic countries: Denmark, Sweden, and Finland, including nitrate (NO3), total organic N (TON), dissolved reactive P (DRP), and particulate P (PP), considering export regime (enrichment, constant, and dilution) and hysteresis patterns (clockwise, anticlockwise, and no hysteresis).
Water 12 01776 g003
Figure 4. Principal Component Analysis (PCA)—Biplot for C-Q relationship types (T1-T9) of mini-catchments in Denmark, Sweden, and Finland for nitrate (NO3) (A), total organic N (TON) (B), dissolved reactive P (DRP) (C), and particulate P (PP) (D). Variables are C-Q relationship types and catchment characteristics: land use (agriculture and nature), climate (mean daily precipitation and air temperature), soil type, and catchment area (km2). PC 1 and 2 are the percentages of variance explained by principal component 1 and 2, respectively. Large individual points represent the centroid of the nine C-Q relationship types. Ellipses are drawn around the clusters.
Water 12 01776 g004
Table 1. Numbers of stations and total number of nutrient monitoring concentrations for N (nitrate and total organic N) and P forms (dissolved reactive P and particulate P) per year for streams in Denmark, Sweden, and Finland, including mean, range, and standard deviation (SD).
CountryNumber of Stations Number of Nutrient Concentration Observations
per Year per Station
N formsP forms
MeanRangeSDMeanRangeSD
MaxMinMaxMin
Denmark5610427655471052656044
Sweden131862091431618620914316
Finland1812320057371201925236
Table 2. Results on the percentage of mini-catchments in three Nordic countries: Denmark, Sweden, and Finland, considering export regime (enrichment, constant, and dilution) and hysteresis patterns (clockwise, anti-clockwise, and no hysteresis) including nitrate (NO3), total organic N (TON), dissolved reactive P (DRP), and particulate P (PP).
Nutrient FormCatchments Categorized Based on Export Regime or Hysteresis Pattern (%)
Export RegimeHysteresis Pattern
EnrichmentConstantDilutionClockwiseNo HysteresisAnti-Clockwise
NO3642412424810
TON24601631663
DRP8593350473
PP11692053443

