Article

Structure and Physicochemical Properties of Water Treated under Methane with Low-Temperature Glow Plasma of Low Frequency

1
Faculty of Chemistry, University of Gdansk, Wita Stwosza St. 63, 80-308 Gdansk, Poland
2
Institute of Chemistry, Jan Długosz University, Armii Krajowej Ave. 13-15, 42 201 Częstochowa, Poland
3
Faculty of Food Technology, University of Agriculture in Krakow, Balicka Str. 122, 30 149 Krakow, Poland
4
Institute of Chemistry and Inorganic Technology, Krakow University of Technology, Warszawska Str. 24, 31 155 Krakow, Poland
5
Nantes Nanotechnological Systems, Dolnych Młynów Str. 24, 59 700 Bolesławiec, Poland
6
Scientific Society of Szczecin, Wojska Polskiego Street, 96, 71481 Szczecin, Poland
*
Author to whom correspondence should be addressed.
Water 2020, 12(6), 1638; https://doi.org/10.3390/w12061638
Submission received: 5 May 2020 / Revised: 31 May 2020 / Accepted: 1 June 2020 / Published: 8 June 2020

Abstract

:
Our former studies delivered a strong evidence that water indirectly treated with low-temperature, low-pressure glow plasma of low frequency (GP) changed its structure depending on the atmosphere in which such treatment was performed (air, ammonia, and nitrogen) and on the time of the treatment (0 to 120 min). In every case, water of different physicochemical characteristics and interesting biological functions was produced. Therefore, the relevant studies were extended to treating deionized water with GP under methane. The resulting samples were characterized by means of ultraviolet/visible (UV/VIS), Fourier transformation infrared-attenuated total reflectance (FTIR-ATR), electron spin resonance (ESR) and Raman spectroscopies, differential scanning calorimetry (DSC), thermogravimetry, pH, conductivity, and refractive index. The generated samples of water had entirely different physicochemical properties from those recorded for water treated with GP in the air and under both ammonia and nitrogen. The treatment of water with GP under methane did not produce clathrates hosting methane molecules. Thermogravimetry delivered an evidence that the treatment with GP increased the aqueous solubility of methane. That solubility non-linearly changed against the treatment time.

1. Introduction

In our recent paper, the structure and physicochemical properties of water treated with low-temperature, low-pressure glow plasma of low frequency (GP) in the air [1] was presented. GP was developed in the proximity of the treated water. Under fixed parameters of the GP generation, the structure and physicochemical properties of the resulting water depended on the treatment time. In a series of subsequent papers, the benefits resulting from the use of that water were shown. Thus, that water stimulated growth and pathogenicity of entomopathogenic fungi used as biopesticides [2]. Murawski et al. demonstrated the benefits of cryopreservation of ram [3] and boar [4] semen in such water. The barley malt quality could be improved when GP-treated water was applied [5]. Watering peppermint with GP-treated water had no essential effect on the yield of the essential oil and a plant crop yield, but the composition of the essential oil dramatically changed. The menthol content in it was distinctly lower and, simultaneously, the bactericidal properties of that oil increased. Several new components of that oil could be characterized. Bioaccumulation of cations and anions in leaves, stems, and roots also changed [6]. Several interesting applications of water treated with GP in contact with the air are presented in a newly published monograph [7]. Applications presented therein were based on unpublished research reports dealing with plant cultivation and animal breeding.
These findings prompted us to study the treatment of water with GP under ammonia. The treatment of hard water with GP under ammonia protected precipitation of a scale in kettles, heat exchangers, and pipe-lines. On heating of so treated hard water, a separated fine precipitate did not agglomerate into a hard scale [8]. Recently, a specific kind of water was presented [9] when water was treated with GP under oxygen-free nitrogen [9]. Treating water with GP in contact with the air resulted in the formation of aqueous clathrates including excited singlet oxygen molecules. Water treated with GP under nitrogen contained aqueous clathrates with various free radical species of molecular nitrogen. Their nature depended on the treatment time. The effect of such water upon the growth and composition of essential oil of basil (Ocinum basilicum L.) [10] and another study upon the growth of cress [11] prompted us to study a treatment of water with GP under methane, following identical conditions of the GP treatment, as applied in former studies.
Under normal atmospheric pressure, methane poorly solubilizes in water and its amount in g/kg distilled water ranges from almost 0.04 to 0.0235 at 0 °C and 20 °C, respectively [12]. As the pressure elevates, that solubility increases. That solubility depends also on the water salinity [13]. In the Solar System as well as in the floor of oceans aqueous methane clathrates CH4·5.75H2O or 4CH4·23H2O are formed, respectively, as a result of low temperature and high pressure [14,15,16,17].
Since GP deteriorates the macrostructure of water, the treated water solubilizes various compounds better and its smaller clusters more readily permeate biological membranes. It makes the GP-treated water a good vector for its solutes [1,2,3,4,5,6,7]. Hence, one might anticipate that the treatment water with GP would increase the aqueous solubility of methane.
Spas in Iwonicz Zdrój, Rymanów Zdrój (Poland), and Truskawiec (Ukraine) are known for mineral water, so-called “naftusia” (naphtusya). Apart from some minerals (about 0.82 mg/L), it also contains hydrocarbons penetrating the water from underground deposits of petroleum located nearby [18,19,20]. Naftusia is recommended for curing several health disorders [21,22]. Thus, among the potential applications of water treated with GP under methane, its therapeutic value could be taken into account.

2. Materials and Methods

2.1. Materials

2.1.1. Water

Commercially available deionized water of pH 7.02 ± 0.04, electromotive force (EMF) = 351.8 ± 0.3 mV (glass versus calomel electrode at 25 °C) and conductivity γ = 0.444 ± 0.004 mS/cm was used.

2.1.2. Methane

Methane from the municipal gas supply system of Częstochowa ( Poland) was used. It contained 95.5% of methane, 3.816% ethane, 0.216% propane, 0.031% i-butane, 0.030% n-butane, 0.06% i-pentane, 0.04% n-pentane, 0.06% C6+ hydrocarbons, 0.605% N2, and 0.030% CO2.

2.2. Methods

2.2.1. Treatment of Water with GP

Through the deionized water a stream of methane was bubbled for 15 min. Its flow rate depended on the volume of the water sample. In case of the 200 mL sample, the rate of 10 mL/min was maintained. That water (200 mL) was placed in 250-mL glass bottles and free space over the liquid was additionally filled with methane. The whole system was placed in the metallic chamber at the distance of 5 cm from the plasma generator (Scheme shown in a previous paper [9]) and exposed to GP for 5, 15, 30, 60, and 90 min. Plasma of 38 °C was generated at 5 × 10⁻³ mbar, 800 V, 50 mA, and 10 KHz frequency. The produced water was stored at ambient temperature in 100-mL closed teflon containers [23].

2.2.2. pH

The measurements at 25 °C for all samples (both control samples and those treated with GP for 5 to 90 min) were performed in triplicates with a laboratory multifunction meter CP-501 (Elmetron, Zabrze, Poland) equipped with a HYDROMET, Type ERH-11 combined glass-calomel electrode.

2.2.3. Conductivity

Estimations were performed at 25 °C with an ELMETRON CPC-505 instrument (Elmetron, Zabrze, Poland) equipped in an ELMETRON EC-60 sensor. The estimations were taken in triplicates for both control samples and these were treated with GP for 5 to 90 min).

2.2.4. Refractive Index

Lab refractometer RL from PZO Warsaw, Poland was used. Measurements performed at 22 °C were triplicated.

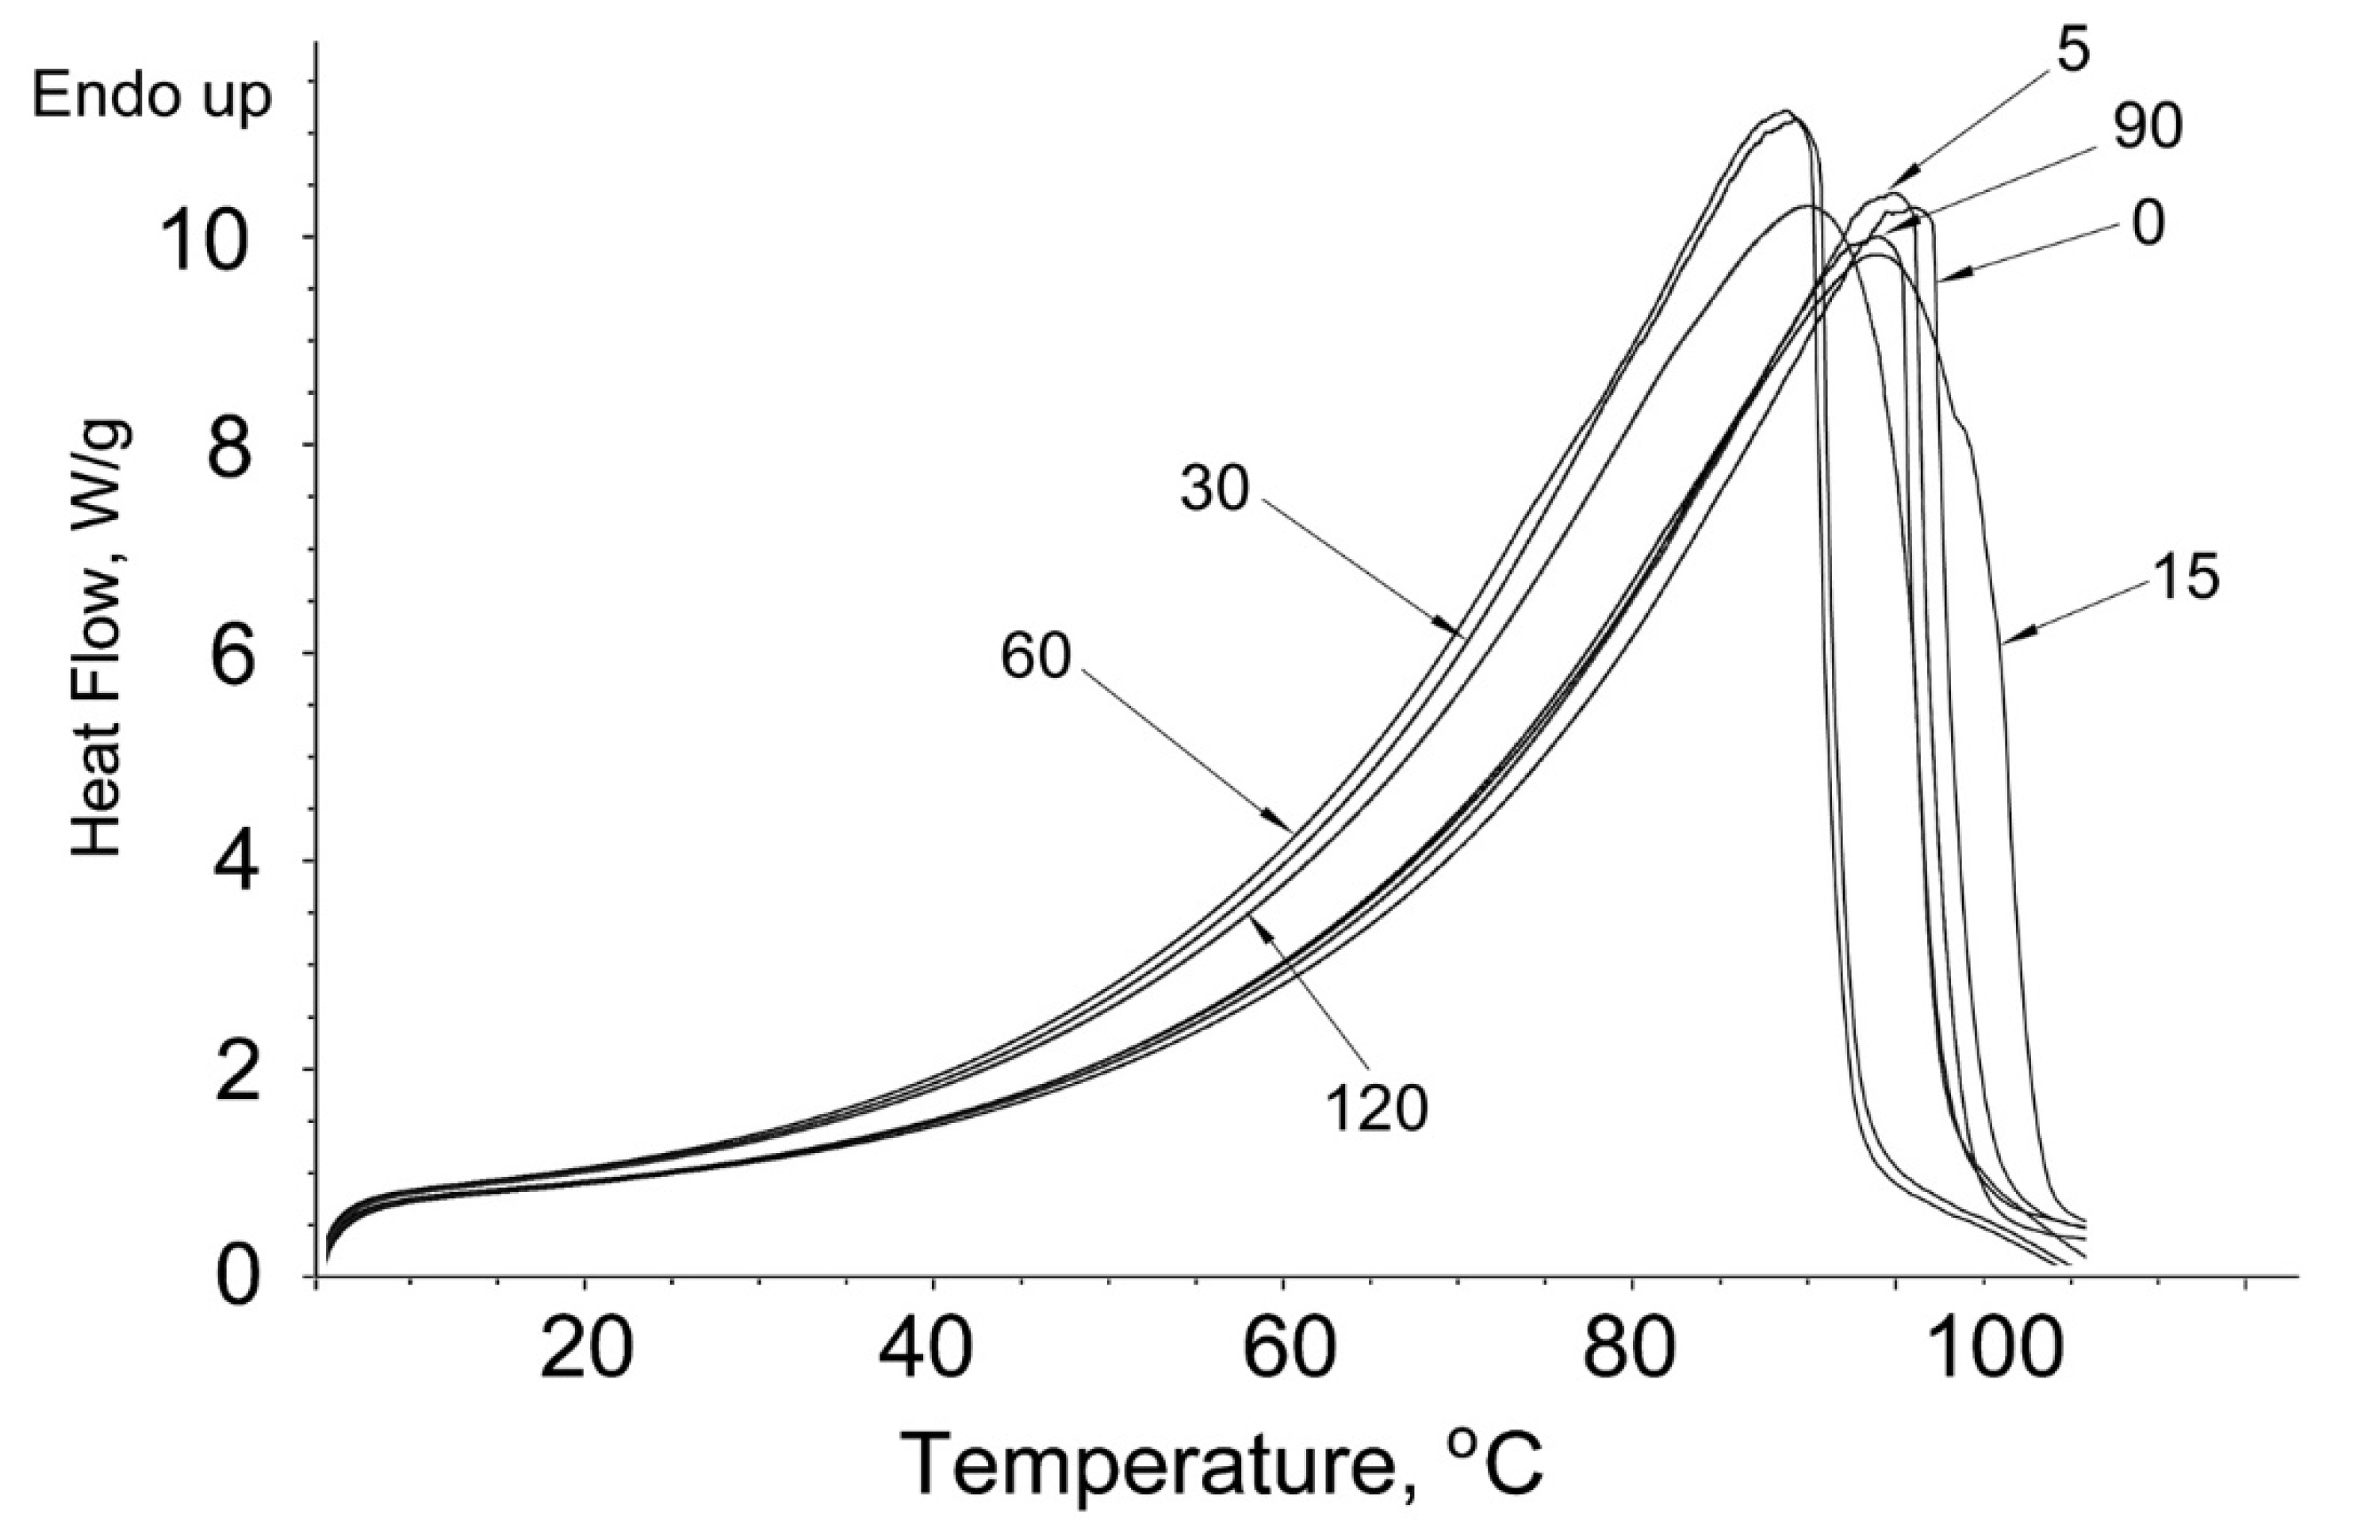
2.2.5. Differential Scanning Calorimetry (DSC)

Differential scanning calorimeter DSC 2500 (TA Instruments, New Castle, DE, USA) was used. Multipoint calibration (Hg, In, Sn, Bi, Zn, and CsCl) was involved. Analyzed samples (12 mg) were hermetically sealed in alumina capsules. The capsules were then punctured and cooled down to −20 °C with the rate of 10 °C/min followed with heating to 140 °C with the same rate at 50 mL/min nitrogen flow rate. Characteristic temperatures and enthalpy of transitions (Tonset, Tmid, Tend, and ΔH) were determined with Proteus Analysis (Netzsch, Selb, Germany) software. Experiments were duplicated.

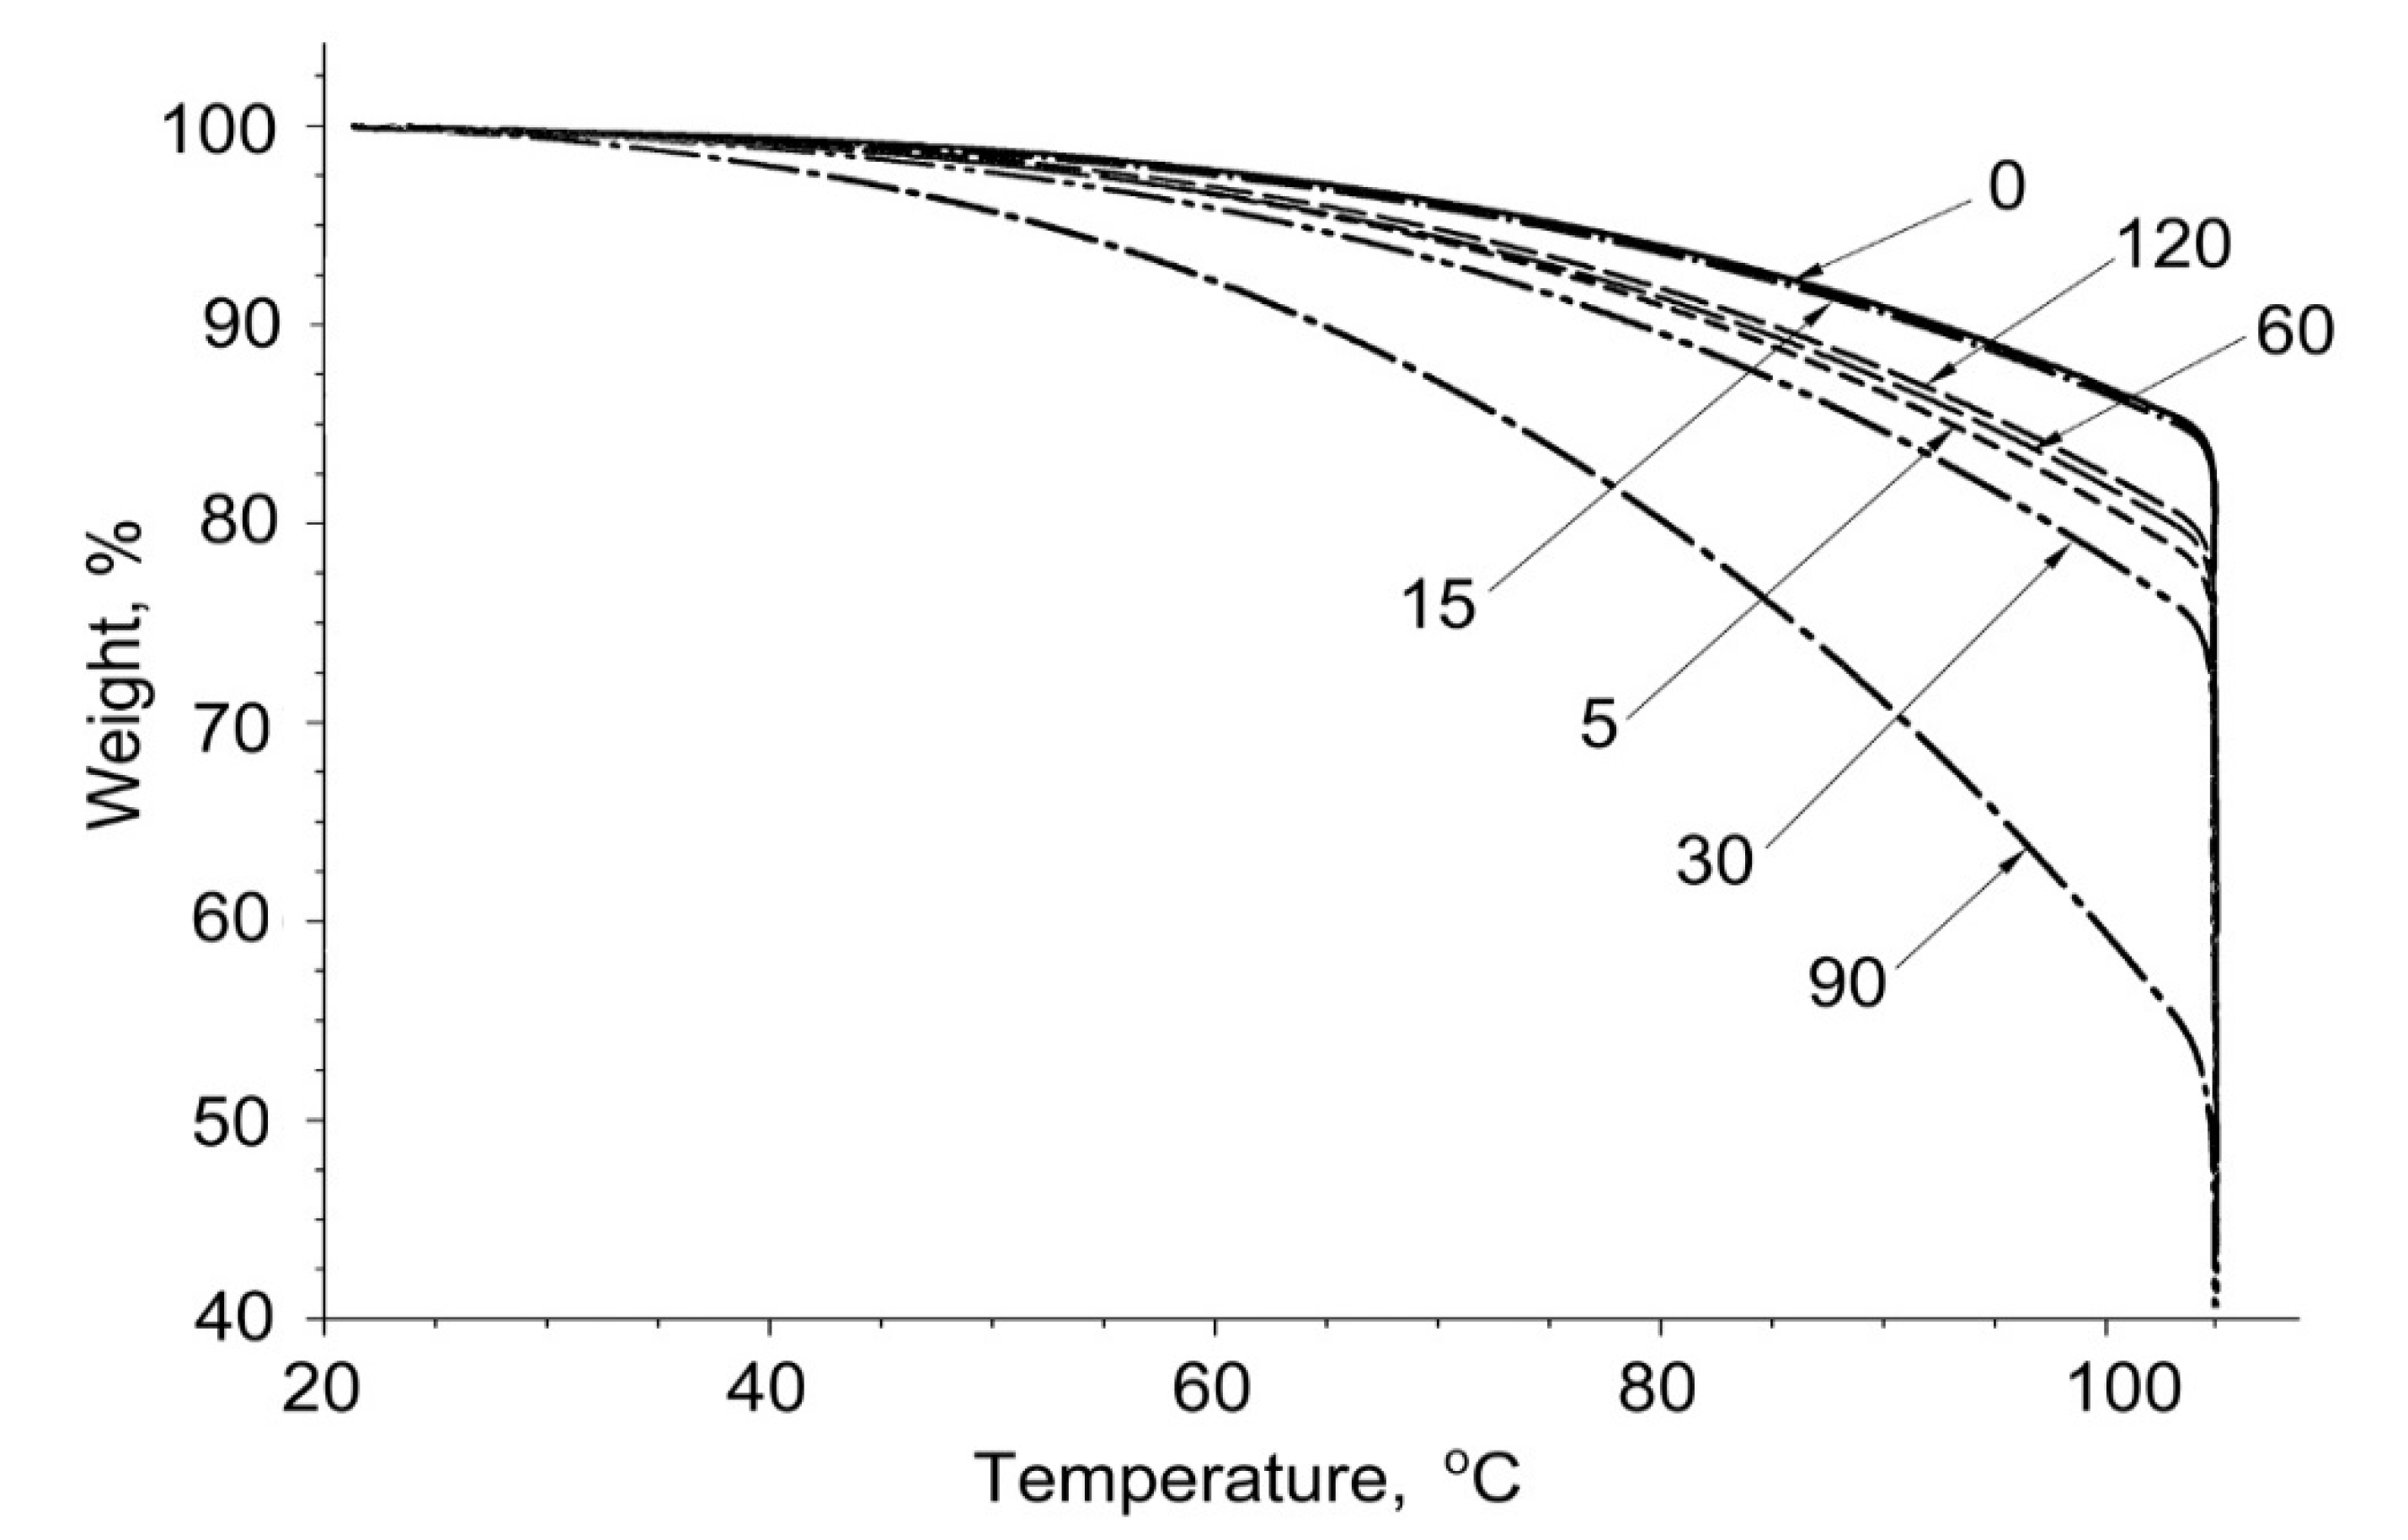
2.2.6. Thermogravimetry

DSC 2500, instrument manufactured by TA Instruments, New Castle, DE, USA was used. The sample was heated from +20 to 120 °C with the rate of 10 °C/min at the 50 mL/min nitrogen flow.

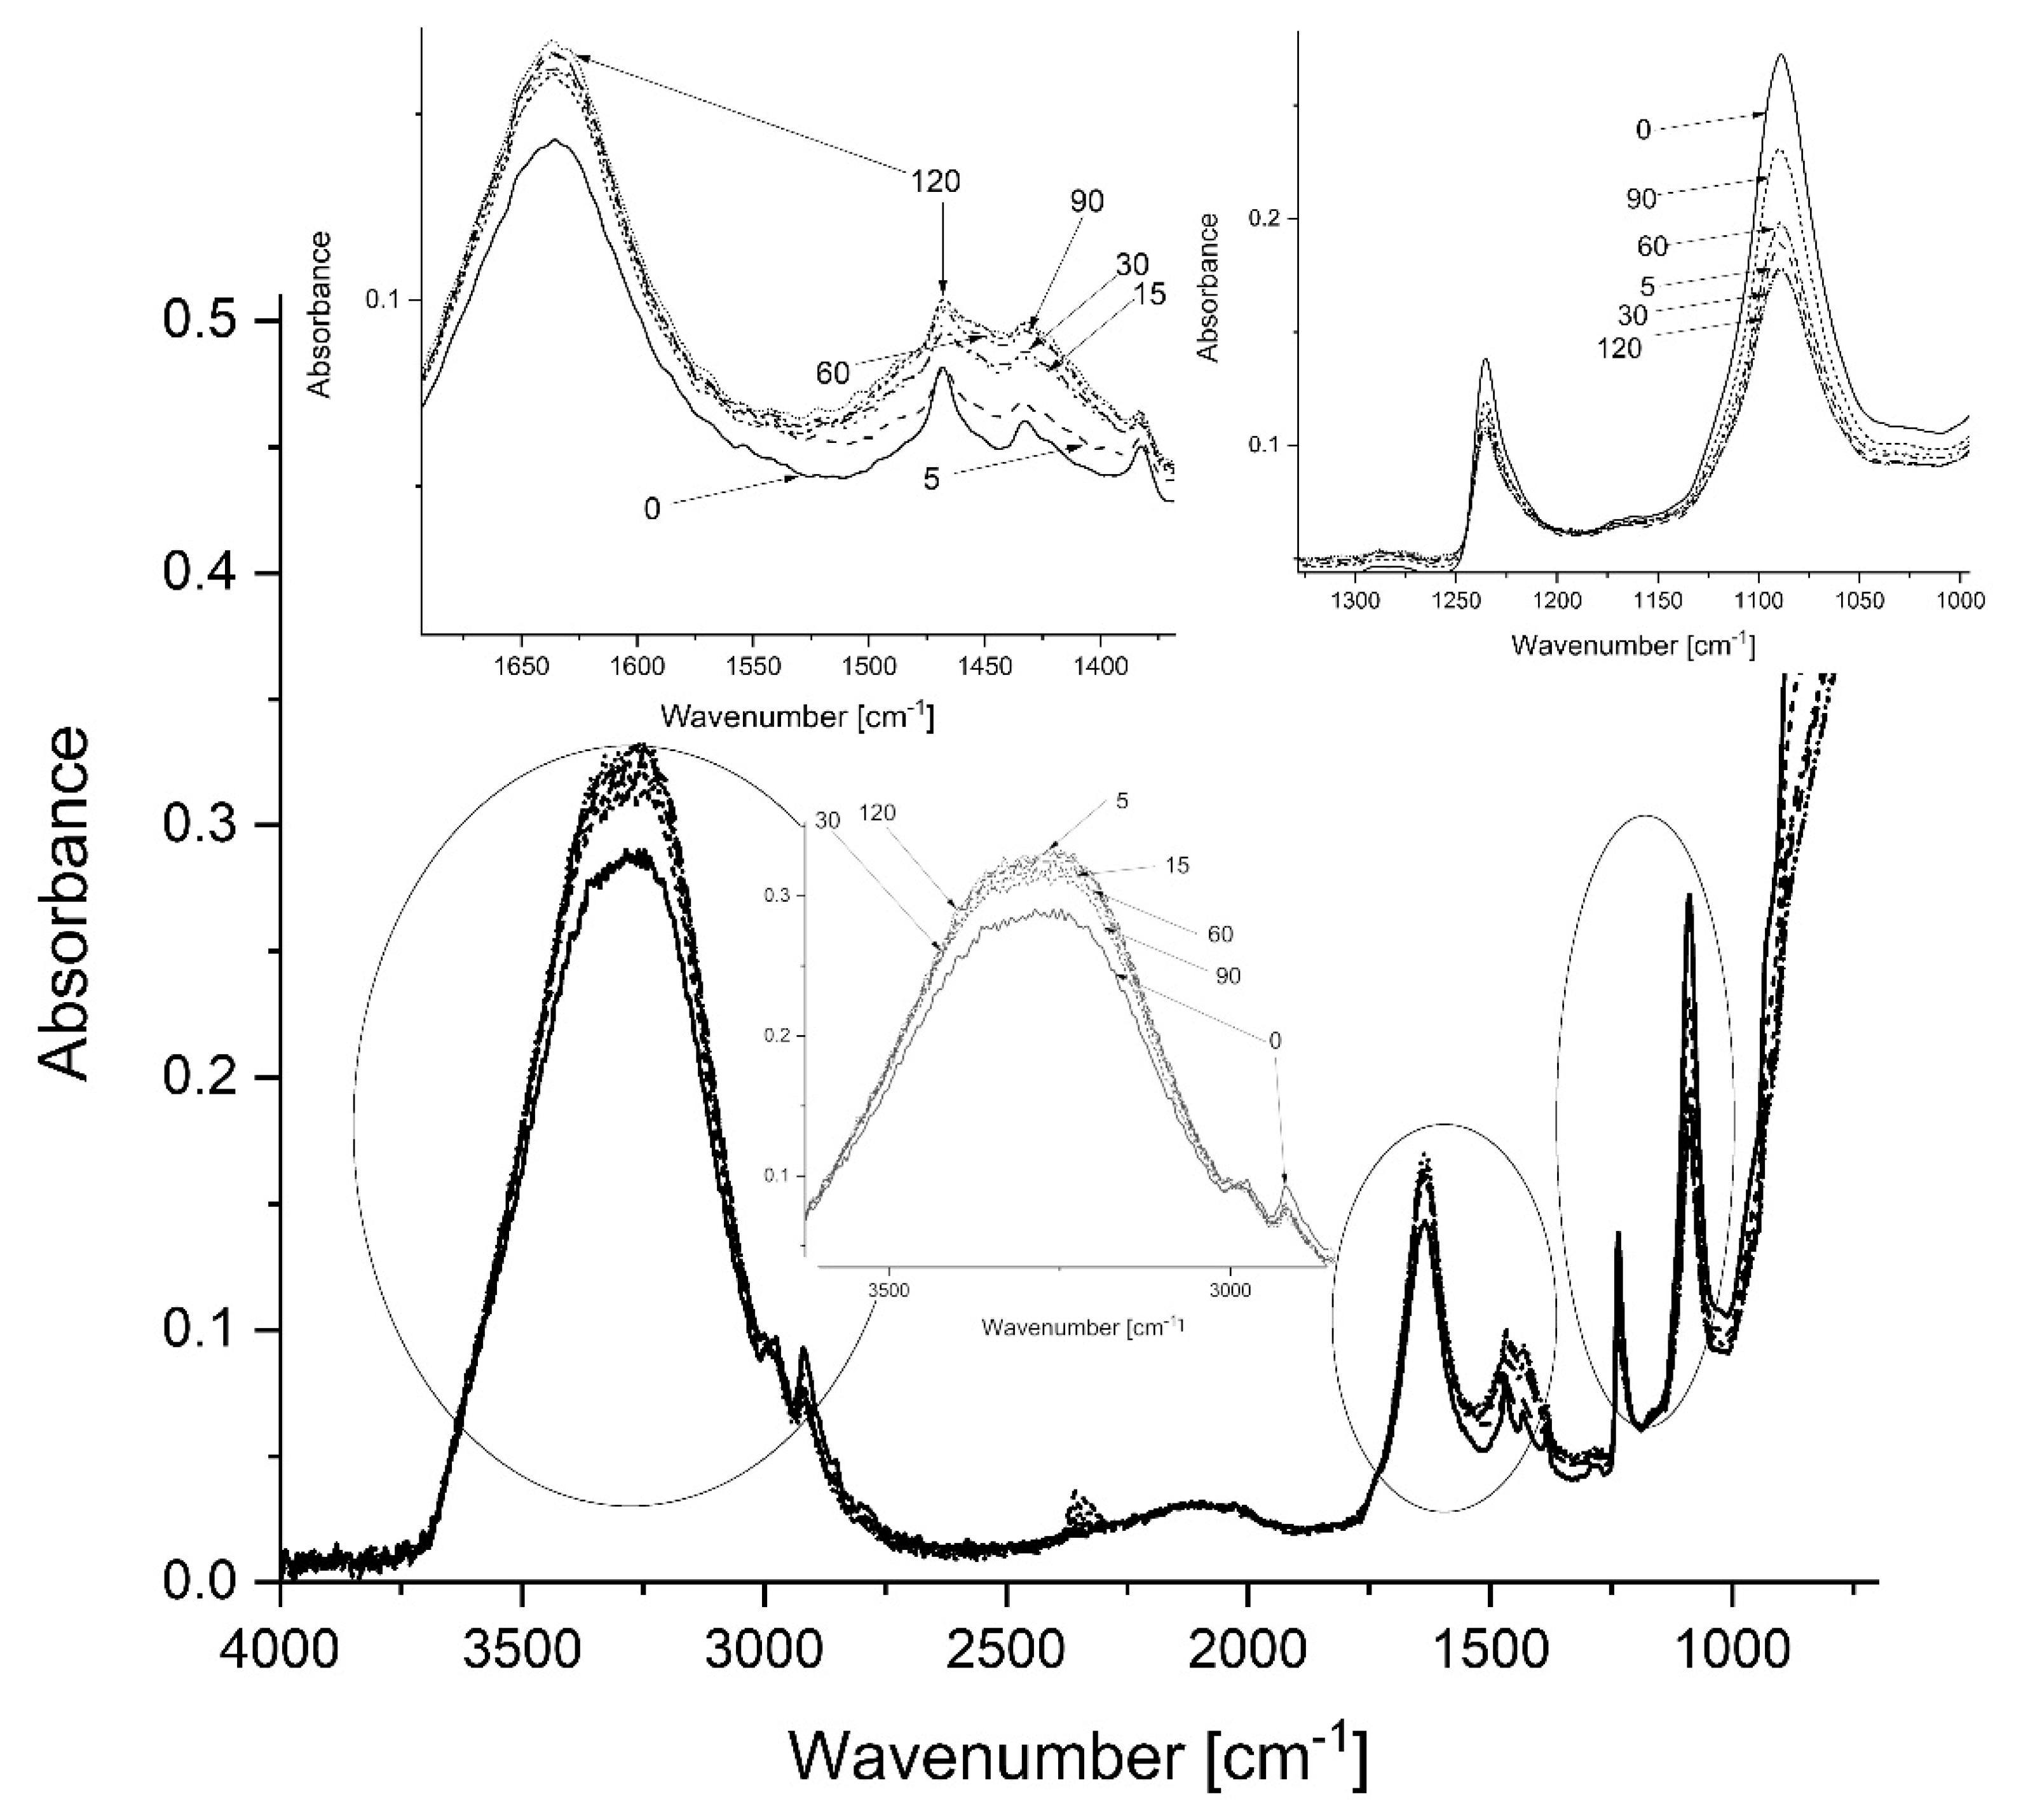
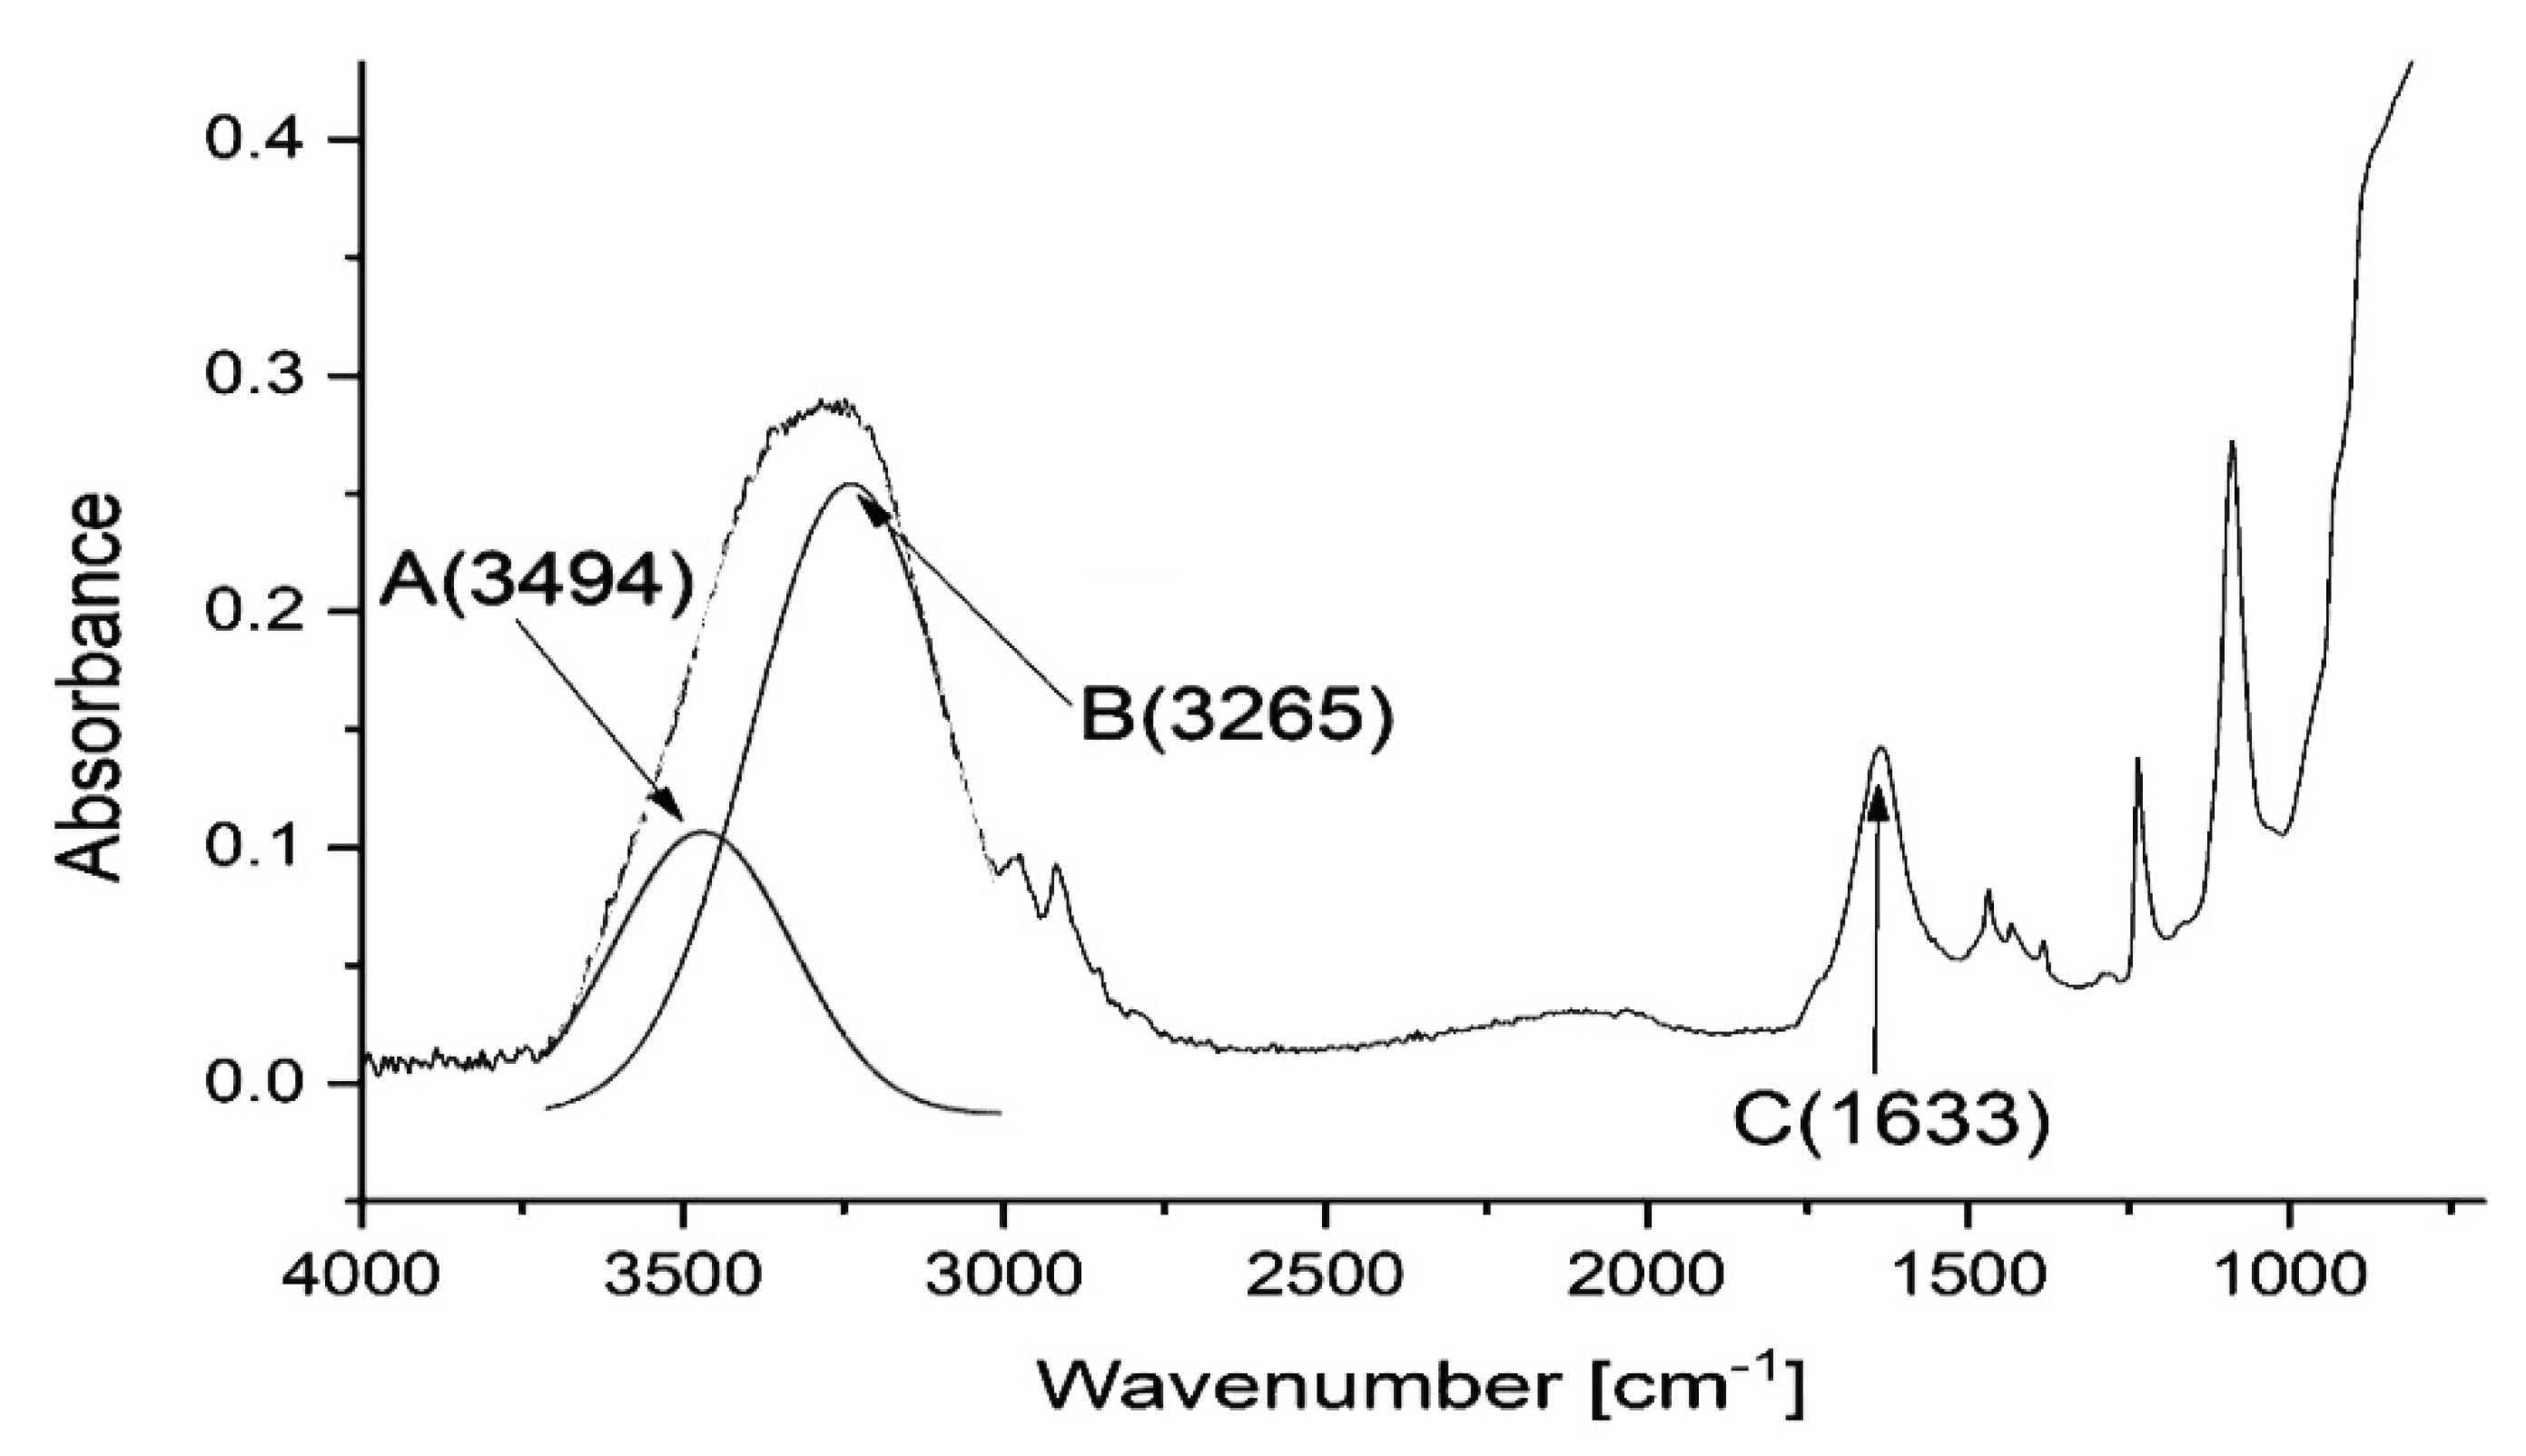
2.2.7. Fourier Transformation Infrared-Attenuated Total Reflectance (FTIR-ATR) Spectra

The FTIR-ATR spectra of the film were recorded following the method previously described [1]. Thus, the measurements were performed in the range of 4000–700 cm−1 at resolution of 4 cm−1 using a Mattson 3000 FT-IR (Madison, WI, USA) spectrophotometer. That instrument was equipped with a 30SPEC 30° reflectance adapter fitted with the MIRacle ATR accessory from PIKE Technologies Inc., Madison, WI, USA.

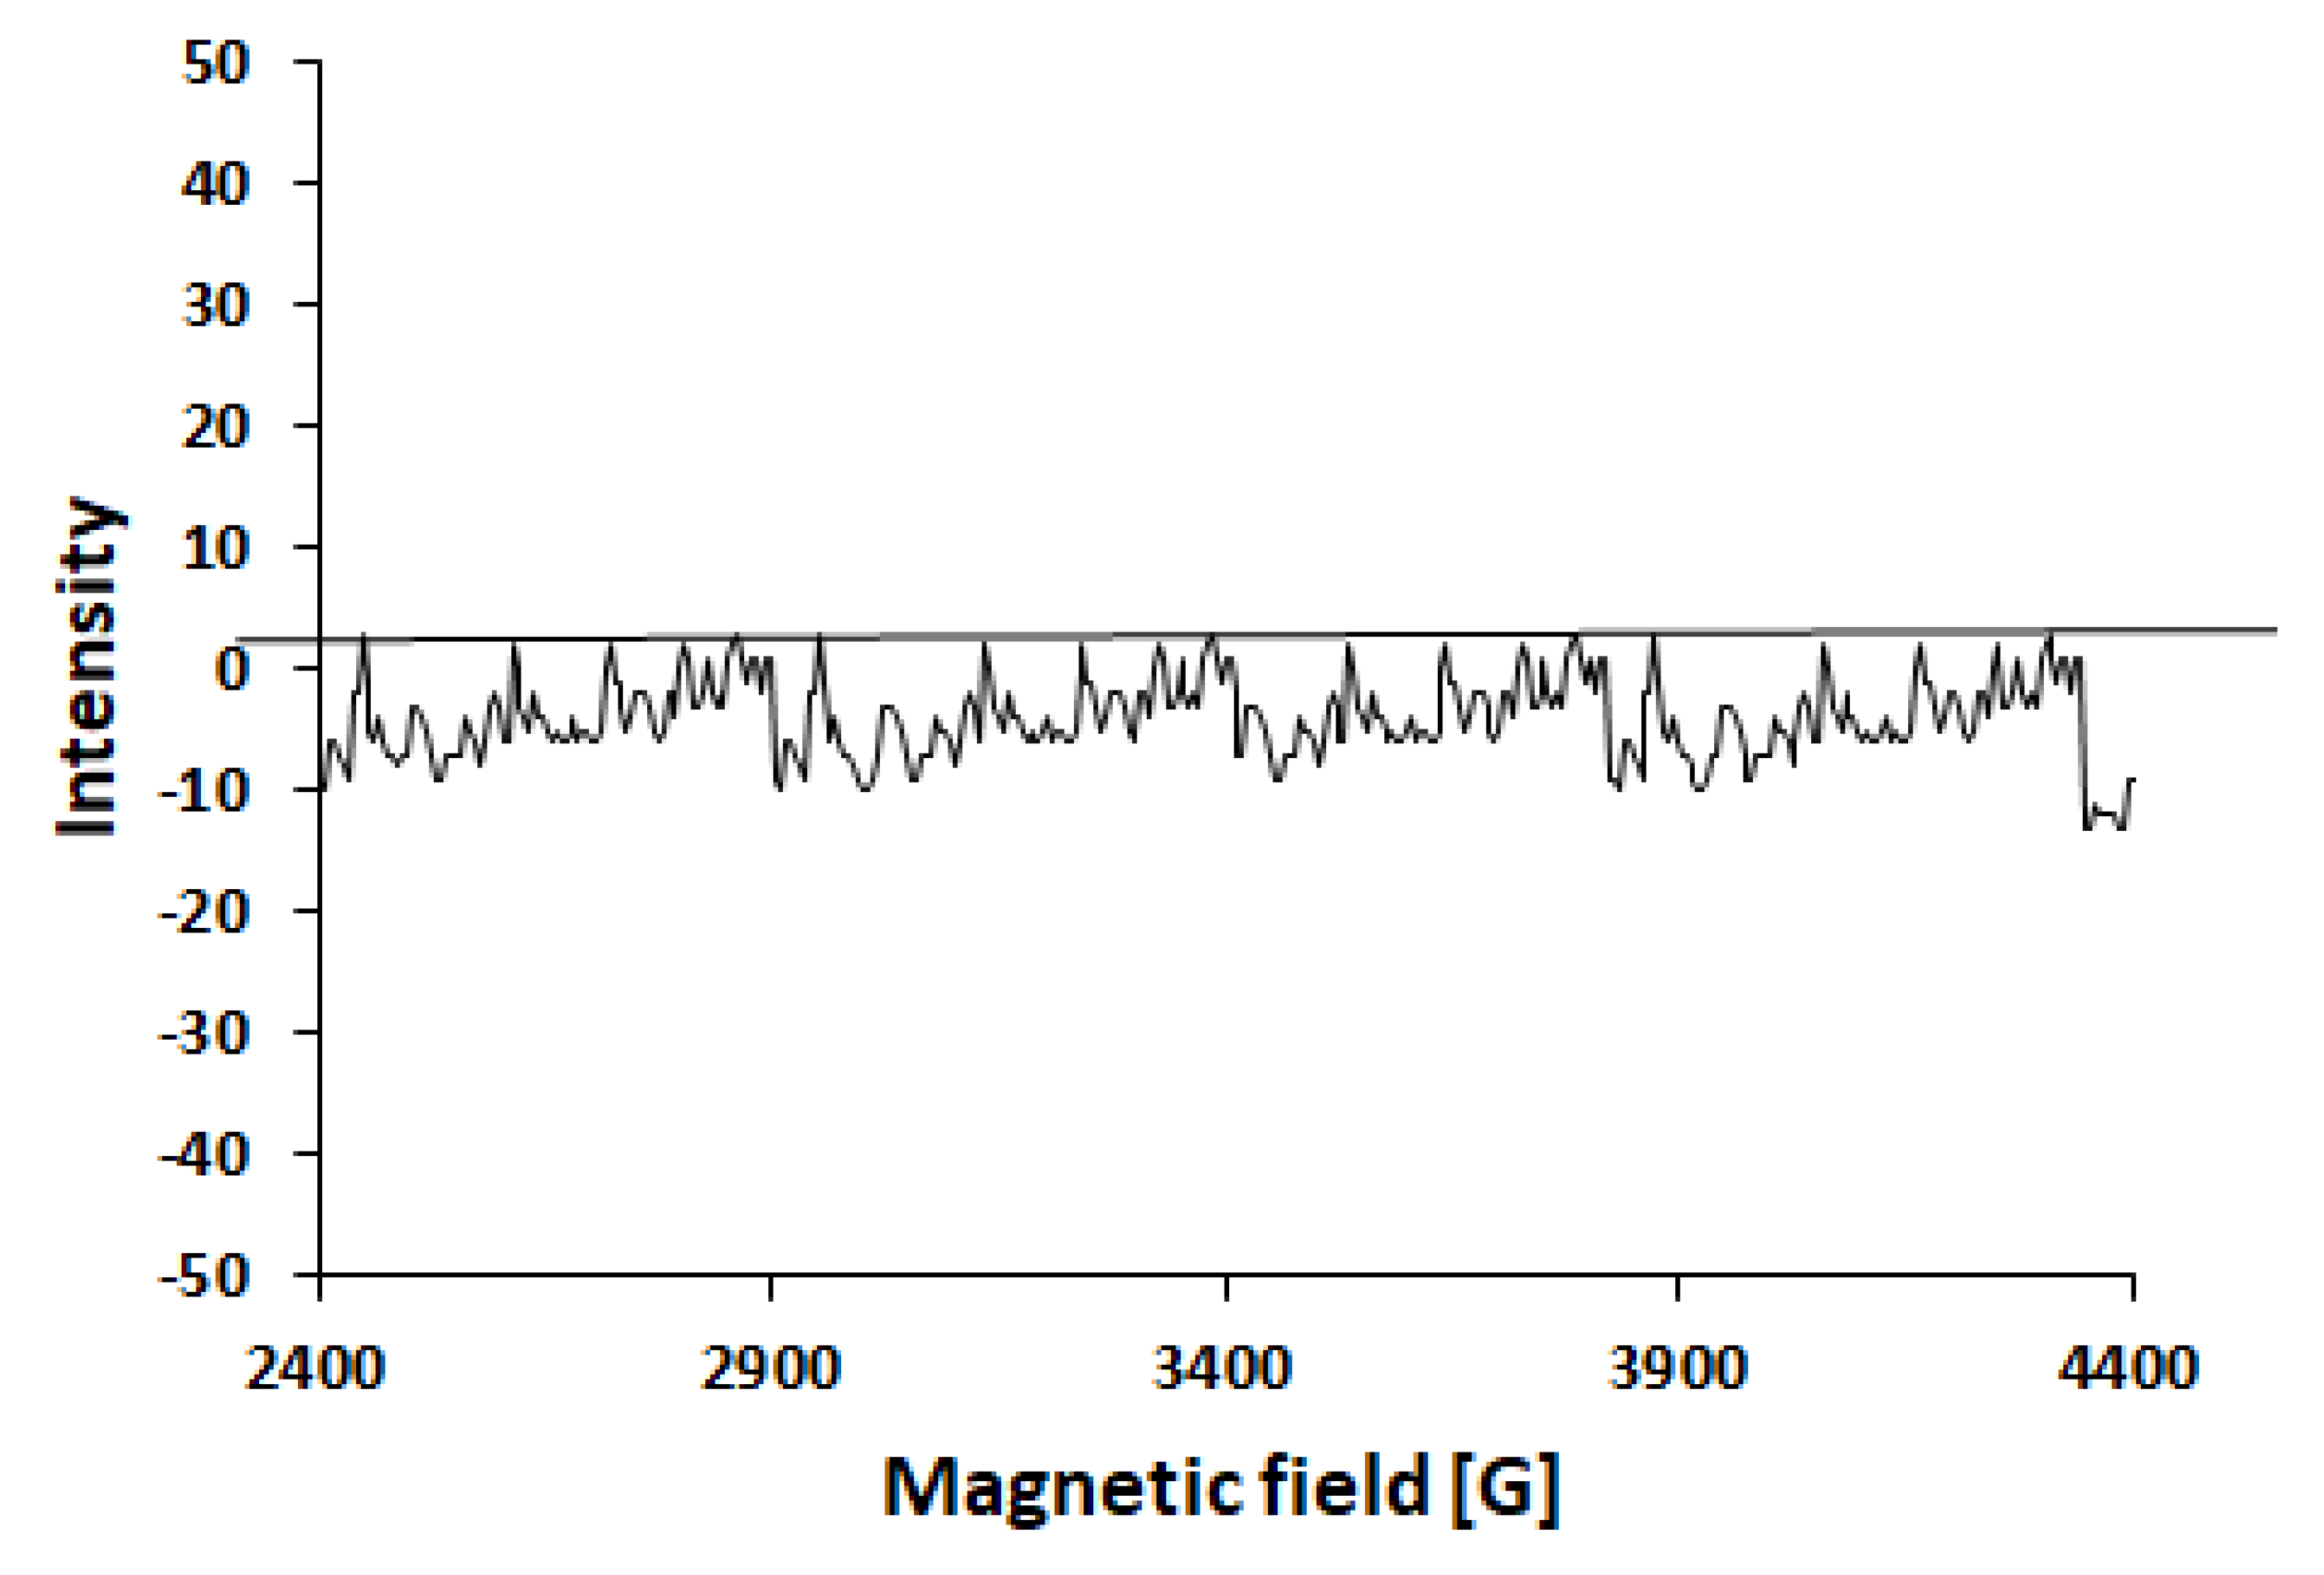
2.2.8. Electron Spin Resonance (ESR) Spectra

The spectra as 1st derivative were recorded at room temperature employing an instrument constructed at Wroclaw Technical University. The range of the X-band (ν = 9.5 GHz, λ = 3.158 cm) was employed at the 20–25 dB attenuation and 2048 s swiping time. An EPR controller software designed for taking the EPR spectra was applied. For samples saturated with nitrogen, g ≈ 2.16.

2.2.9. Ultraviolet/Visible (UV/IS) Absorption Spectra

The spectra were recorded with a Thermo Scientific Evolution 220 (Thermo Fischer Scientific, USA) spectrophotometer in the wavelength range of 190–1100 nm, in a quartz gas tight cell of 10-mm path length. The method was described previously [1]. The instrument was set on automatic measuring mode at medium scan speed and 1.0 nm slit width.

2.2.10. Raman Spectra

The spectra were taken with a Perkin-Elmer MPF44A Fluorescence Spectrophotometer (Waltham, MA, USA) equipped with a xenon lamp (excitation at 330 ± 1 nm and slit 2.0 nm) and a 4-mL quartz gas tight cell, following the method described in previous reports [1,5,9]. The spectra were recorded at 22 °C for control distilled water stored in contact with the air, control distilled water saturated with methane, and distilled water saturated with methane exposed to GP for 5, 15, 30, 60, 90, and 120 min.

3. Results and Discussion

The effect of the treatment of water with GP upon its macrostructure was well documented by spectral measurements.
The UV absorption spectra invariantly demonstrated the band at 220 nm which resulted from the 1A11B1 transition [24] (Figure 1). In the spectrum of water saturated with methane prior to the treatment with GP, that band of absorbance of about 2.4 a.u. showed a vibrational structure resulting from simultaneous low transmissions in both light beams. The GP treatment for 5 min elevated the maximum of that band up to about 2.6 a.u., accompanied by a subtle 10-nm upshift. The spectrum of the water treated for 120 min perfectly fitted the same pattern of that band. Prolonged treatment led to a decrease in the intensity of that band to an extent providing a less intensive shoulder of the Reyleigh scattering band with its maximum below 200 nm. The intensity of that shoulder depended on the treatment time. It decreased in the order: treated for 60 min > for 30 min > for 90 min. That is along the increasing ordering and rigidity of the macrostructure.
The FTIR-ATR absorption spectra (Figure 2) demonstrated an increase in the intensity of the νOH band centered around 3250 cm−1. That increase reflected some deterioration of the macrostructure releasing an increasing number of the hydroxyl groups not engaged in the formation of intermolecular hydrogen bonds. Differences in the absorbance of that band in the spectra of the GP-treated water were fairly subtle, but an insight in these spectra showed that it decreased as a consequence of the treatment time in the order: 120 min > 5 min > 30 min > 60 min > 15 min > 90 min. Absorbance of the νOH around 1650 cm−1 changed in a similar order. Absorbance of the bands which could be assigned to the C–H vibrations and bending in the molecules of methane, that is, the bands at ~2900, 1400, 1200, and 1100 cm−1 decreased with the treatment time. Again, the decrease was not linear against the treatment time, which meant that methane was somehow incorporated into the water macrostructure.
Table 1 demonstrates that removal of dissolved air by blowing it with methane increased the number of the water molecules vibrating asymmetrically. The GP treatment of water saturated with methane for the first 5 min increased their number, then gradually fairly regularly decreased, against the treatment time, their number. Solely, there was practically no effect of the treatment time upon the number of asymmetrically vibrating water molecules treated for 5 and 15 min.
Figure 3 presents an approach to the Gaussian distribution of the FTIR-ATR spectra presented in Figure 2.
Regardless of the treatment time of water with GP, its ESR spectra demonstrated no free radical signals (Figure 4).
In the case of water treated with GP in the air [1], under ammonia [8], and nitrogen [9], based on the Raman spectra, the formation of aqueous clathrates of the corresponding gases was postulated. The appearance of the bands centered around 400 nm (5303 cm−1 Raman shift) following the intensive band at around 370 nm (3276 cm−1 Raman shift) was the criterion for the clathrate formation.
Except for the water treated for 15 min, the Raman band of the treated water located at 373 nm (Figure 5) was not followed by any longer wavelength band. In that exceptional spectrum, a longer wavelength shoulder could be observed. The corresponding Cp value was another sign of a certain specificity of so treated water.
The intensity of the 373 nm band of the scattering spectrum (the corresponding Raman shift of 3494 cm−1) was sensitive to the GP treatment time and that dependence on the treatment time was non-linear. The intensity of that band decreased in the order: W0 > W120 > W30 > W15 > W90 > W60.
Saturation with methane and GP treatment did not influence the original pH and conductivity of water. Similarly, the refractive index (RI = 1.3314) remained unchanged. DSC measurements revealed that GP had a minor effect on temperature of the principal endothermal effect of water saturated with methane (Figure 6 and Table 2). The temperature measured at maximum was always lower than that for untreated water. It could be interpreted as a result of a transformation of primary macrostructure into another one containing objects of smaller size more readily leaving the liquid phase. Similarly as in the spectral measurements presented above, DSC measurements also pointed to a specific structure of water treated with GP for 15 min. The corresponding DSC graph (Figure 6) demonstrated an additional shoulder located at about 103 °C.
The increase in the endothermal effect did not parallel the temperature changes. The sample treated for 60 min exhibited the most endothermal effect. Depending on the treatment time it declined in the order:
standard > non-treated water > 90 > 5 > 15 > 120 > 30 > 60 min
Non-linear changes of both parameters against the treatment of the samples with GP reflected building different, treatment time-depended macrostructures. Such effects were also observed in our studies on water treated with GP in the air [1], ammonia [8], and nitrogen [9], as well as computations performed for corresponding aqueous clathrates [25].
The thermodynamic data for GP-treated deionized water saturated with methane (Table 3) also non-linearly changed against the treatment time. That showed that the treatment for 15 and 60 min required the lowest and the highest specific heat, Cp, of the thermal transition, respectively. The saturation of the water with methane significantly increased the enthalpy of the thermal transition already prior to the treatment with GP. The treatment influenced also the enthalpy in the manner irregular against the time. The lowest enthalpy was noted for the water treated for 30 min. The resulting preparation (WM30) disposed with the highest entropy (ΔS).
Treatment time-dependent enthalpy values (ΔH) declined in the same order as did entropy values, that is:
30 > 90 > methane-free water > 60 > 120 > 15 > 5 > 0 min
Thermogravimetric measurements threw a light on the solubility of methane in water depending on the treatment time (Figure 7). The thermogravimetric curves did not provide any signal related to the temperature-dependent evolution of methane from particular samples. Instead, clear differences in the sudden loss of the weight above 100 °C could be seen and the magnitude of that loss for depending on their GP treatment time increased in the order:
90 > 30 > 5 > 60 > 120 > 15 > 0 min
It meant that until the boiling point of those samples was reached the samples lost consecutively 46.0, 24.7, 22.5, 20.6, 19.5, 16.0, and 15.5% of their weight.
Certainly, the observed weight loss could not be directly related to the loss of dissolved methane. The order shift
15 > 120 > 5 > methane-free water > 90 > 0 (non-treated water) > 60 > 30 min
reflected, first of all, the degree of deterioration of the water macrostructure.
However, this order did not fall in line with the order of the thermal effects observed in the DSC measurements (Figure 5 and Table 1). The orders of the treatment time-dependent thermal effects
15 < 0 < 5 < 120 < 90 < 30 < 60
and their intensity
30 < 60 < 0 < 90 < 5 < 120 < 15
differed from one another. Such incompatibility of those orders supported the assumption that the aqueous solubility of methane changed depending on the GP treatment time. These orders could speak in favor of arresting methane molecules in some niches of the water macrostructures.

4. Conclusions

Removal of the air dissolved in water by blowing with methane increased the number of the water molecules vibrating asymmetrically. The GP treatment of water for over 5 min gradually fairly regularly against the treatment time decreased their number against the treatment time. The formed macrostructure of water presented a dynamic system which developed smaller size units more readily leaving the liquid phase. The process involved much higher energy for defeating forces binding these newly formed structures with the surrounding macrostructure. The most remarkable changes of the macrostructure were observed in water treated with GP for 15 min. The pattern of the Raman spectrum suggested the formation of specific aqueous clathrates of methane.

Author Contributions

A.C. run pH, conductivity measurements, W.C. run ESR spectra, K.K. run UV-VIS and Infrared Spectra, H.K. run Raman spectra, refractive index, D.K. Thermogravimetry measurements, Z.O. equipped a research team in nanowater, P.T. invented the project, coordinated study and designed the text of this report, J.A.S. run substantial remarks and discussion of the subject. All authors jointly participated in interpretation of all data and in writing report. All authors have read and agreed to the published version of the manuscript.

Funding

This research did not receive any specific grant from funding agencies in the public, commercial, or not-for-profit sectors.

Acknowledgments

Authors feel very much indebted to Krzysztof Gorący, DSc and Krzysztof Kowalczyk DSc. of West-Pomeranian University of Technology in Szczecin (Poland) for DSC and thermogravimetric measurements.

Conflicts of Interest

No conflict of interest is known to the authors.

References

  1. Białopiotrowicz, T.; Ciesielski, W.; Domański, J.; Doskocz, M.; Fiedorowicz, M.; Grąż, K.; Khachatryan, K.; Kołoczek, H.; Kozak, A.; Oszczęda, Z.; et al. Structure and physicochemical properties of water treated with low-temperature low-frequency plasma. Curr. Phys. Chem. 2016, 6, 312–320. [Google Scholar] [CrossRef]
  2. Jaworska, M.; Oszczęda, Z.; Tomasik, P. Water treated with low-temperature, low-pressure, low-frequency glow plasma as a stimulant of pathogenicity and reproduction of biopesticides. Part I. Entomopathogenic fungi. Pol. J. Nat. Sci. 2018, 33, 561–568. [Google Scholar]
  3. Murawski, M.; Schwarz, T.; Grygier, J.; Patkowski, K.; Oszczęda, Z.; Jelkin, I.; Kosiek, A.; Gruszecki, T.M.; Szymanowska, A.; Skrzypek, T.; et al. The utility of nanowater for ram semen cryopreservation. Exp. Biol. Med. 2015, 240, 611–617. [Google Scholar] [CrossRef] [PubMed] [Green Version]
  4. Szymanowicz, J.; Schwartz, T.; Murawski, M.; Małopolska, M.; Oszczęda, Z.; Tuz, R.; Nowicki, J.; Bartkowski, P.M. Storage, of bear semen at 16–18 °C in thew long term commercial extender prepared witg deionized water or nanowater. Anim. Reprod. 2019, 16, 1–7. [Google Scholar] [CrossRef] [PubMed]
  5. Pater, A.; Zdaniewicz, M.; Satora, P.; Khachatryan, G.; Oszczęda, Z. Application of water treated with low-temperature, low-pressure glow plasma for quality improvement of barley malt. Biomolecules 2020, 10, 267. [Google Scholar] [CrossRef] [PubMed] [Green Version]
  6. Pisulewska, E.; Ciesielski, W.; Jackowska, M.; Gąstoł, M.; Oszczęda, Z.; Tomasik, P. Cultivation of peppermint (Mentha piperita rubescens) using water treated with low-pressure, low-temperature glow plasma of low frequency. EJPAU. Ser. Biotechnol. 2018, 21, #01. [Google Scholar]
  7. Tomasik, P. Essentials of Nanotechnology in Food Technology and Cosmetics; Sophia Scientific Editorial Board: Warsaw, Poland, 2019. (In Polish) [Google Scholar]
  8. Oszczęda, Z.; Tomasik, P.; Ciesielski, W.; Kulawik, D. A Way of Removal of Permanent and Temporary Water Hardness Applying Low-Temperature, Low-Pressure Glow Plasma of Low-Frequency. Polish Patent Appl. 426720, 20 August 2018. [Google Scholar]
  9. Chwastowski, J.; Ciesielska, K.; Ciesielski, W.; Khachatryan, K.; Koloczek, H.; Kulawik, D.; Oszczeda, Z.; Tomasik, P.; Witczak, M. Structure and physicochemical properties of water treated under nitrogen with low-temperature glow plasma. Water 2020, 12, 1314. [Google Scholar] [CrossRef]
  10. Ciesielski, W.; Gąstoł, M.; Girek, T.; Kulawik, D.; Oszczęda, Z.; Pisulewska, E.; Tomasik, P. Water treated with low-pressure, low-temperature glow plasma affects the growth and essential oil of basil (Ocinum basilicum L.), private information. Int. Agrophys. submitted.
  11. Ciesielska, K.; Ciesielski, W.; Girek, T.; Kulawik, D.; Oszczęda, Z.; Tomasik, P. Cultivation of cress involving water treated under different atmospheres with low-temperature, low-pressure glow plasma of low-frequency, private information. Int. Agrophys. submitted.
  12. EngineeringToolbox. Available online: https://www.engineeringtoolbox.com/gases-solubility-water-d_1148.html (accessed on 4 June 2020).
  13. Blount, C.W.; Price, L.C. Solubility of Methane in Water under Natural Conditions. A Laboratory Studies, Report, US Dept. Energy. 1982; DOE/ET/12145-1. Available online: https://www.osti.gov/servlets/purl/5281520 (accessed on 4 January 2020).
  14. Ruppel, C.; Pohlman, J.; Casso, M. Data and Calculations to Support the Study of the Sea-Air Flux of Methane and Carbon Dioxide on the West Spitsbergen Margin in June 2014: U.S. Geological Survey Data Release. 2017. Available online: https://doi.org/10.5066/F7M906V0 (accessed on 4 January 2020).
  15. Sánchez, M.; Santamarina, C.; Teymouri, M.; Gai, X. Coupled numerical modeling of gas hydrate-bearing sediments: From laboratory to field-scale analyses. JGR Solid Earth. 2018, 123, 10326–10348. [Google Scholar]
  16. Chong, Z.R.; Yang, S.H.B.; Babu, P.; Linga, P.; Li, X.-S. Review of natural gas hydrates as an energy resource: Prospects and challenges. Appl. Energy. 2016, 162, 1633–1652. [Google Scholar] [CrossRef]
  17. Hoffmann, R. Old gas, new gas. Am. Sci. 2006, 94, 16–18. [Google Scholar] [CrossRef]
  18. Winid, B.; Lewkiewicz, A. Mineral waters from Rymanow-Zdrój, relations between their chemical components in the period of the latest decade. Gosp. Sur. Mineral. 2006, 22, 51–72. (In Polish) [Google Scholar]
  19. Winid, B.; Lewkiewicz-Małysa, A. Curative mineral waters from Iwonicz Zdroj in view of their hydrodynamic indices. Gosp. Sur. Mineral. 2005, 21, 49–67. (In Polish) [Google Scholar]
  20. Chowaniec, J.; Operacz, T. Mineral and curative waters from Iwonicz Zdrój—Rudawka Rymanowska anticline. Biul. Państw. Inst. Geol. 2013, 456, 81–88. (In Polish) [Google Scholar]
  21. Available online: https://pl.wikipedia.org/wiki/Ryman%C3%B3w-Zdr%C3%B3j#Wody_mineralne (accessed on 3 January 2020).
  22. Available online: https://dvoryk-leva.com.ua/pl/health/279-voda-naftusya-pl (accessed on 3 January 2020).
  23. Oszczeda, Z.; Elkin, I.; Strek, W. Equipment for Treatment of Water with Plasma. Polish Patent PL 216025 B1, 28 February 2014. [Google Scholar]
  24. Chaplin, M. Water Structure and Science. 2016. Available online: www.1.lsbu.ac.uk/water/water_vibrational_spectrum.html (accessed on 22 February 2020).
  25. Ramya, K.R.; Venkathathan, A. Density functional theory study of oxygen clathrate hydrates. Indian J. Chem. 2013, 52A, 1063–1065. [Google Scholar]
Figure 1. Ultraviolet/visible (UV/VIS) absorption spectra of water treated with glow plasma of low frequency (GP) for 0 to 120 min.
Water 12 01638 g001
Figure 2. Fourier transformation infrared-attenuated total reflectance (FTIR-ATR) spectra of deionized water GP treated under methane for 0 to 120 min.
Water 12 01638 g002
Figure 3. Notation of the bands taken under consideration in the Gaussian distribution of the νOH band.
Water 12 01638 g003
Figure 4. Electron Spin Resonance (ESR) spectra of the samples of water saturated with methane. The spectra of such water after the GP treatment regardless the GP treatment time are identical.
Water 12 01638 g004
Figure 5. The scattering spectrum included Raman band of water treated with GP under methane for 0 to 120 min. Excitation by 330 ± 1 nm/ 2 nm slit at 22 °C. Notation: 1, non-treated water saturated with methane (control); 2–6, water saturated with methane treated for 120, 30, 15, 90, and 60 min, respectively.
Water 12 01638 g005
Figure 6. Differential scanning calorimetry (DSC) diagrams of the water saturated with methane treated with GP for 0 to 120 min. Speed: 10 °C/min.
Water 12 01638 g006
Figure 7. Thermograms of water treated with GP for 0 to 120 min measured after 10 days. Speed 10 °C/min.
Water 12 01638 g007
Table 1. Results of the Gaussian distribution of the νOH in FTIR spectra of deionized water GP-treated under methane for 0 to 120 min.
Sample aA(3494)B(3265)C(1633)A/BA/CB/C
W0.06420.32660.16330.1970.3932.000
W00.10620.25420.14240.4180.7461.785
W050.17760.27480.16620.6461.0691.653
W5150.16570.26660.16170.6221.0251.649
W15300.16580.28080.16620.5900.9981.690
W30600.15390.28180.16230.5460.9481.736
W60900.15170.27530.16070.5510.9441.713
W901200.13800.30040.16960.4590.8141.771
a Deionized control water.
Table 2. Characteristics of the differential scanning calorimetry (DSC) curves.
Sample aTemperature at Peak (°C) Heat Flow Intensity (W/g) Heat of Vaporization (J/g)
Standard b100.00 cn.d. d2257.0 c
WM096.11−10.262057.1
WM594.81−10.482050.3
WM1594.05−9.822049.9
WM3089.37−11.202132.2
WM6088.86−11.232154.1
WM9094.11−10.002048.4
WM12090.11−10.262106.3
a Numbers following W (water saturated with methane) correspond to the time (min) of the GP treatment; b Deionized, methane-free, non-treated water; c Data for pure water at 1013 mbar; d Not determined.
Table 3. Thermodynamic data for deionized water saturated with methane (WM) treated with GP for 0 to 120 min.
Sample a (Immediately)CpΔHΔS
(J/g.K)(J/g)(J/g.K)
W34.377−17704.7690
WM035.837−13463.6266
WM532.980−14513.9095
WM1526.107−14874.0065
WM3033.935−18454.9710
WM6036.378−17654.7555
WM9031.559−17884.8175
WM12032.847−17424.6935
a W—control pure deionized water.

