Article

Short-Term Effects of Fertilization on Dissolved Organic Matter in Soil Leachate

1
Institute for Land and Water Management Research, Federal Agency for Water Management, 3252 Petzenkirchen, Austria
2
Institute for Soil Physics and Rural Water Management, University of Natural Resources and Life Sciences, 1180 Vienna, Austria
3
WasserClusterLunz—Biologische Station GmbH, 3293 Lunz am See, Austria
4
Institute of Hydrobiology and Aquatic Ecosystem Management, University of Natural Resources and Life Sciences, 1180 Vienna, Austria
5
Institute of Agronomy, University of Natural Resources and Life Sciences, 3430 Tulln, Austria
6
Institute for Soil Research, University of Natural Resources and Life Sciences, 3430 Tulln, Austria
*
Author to whom correspondence should be addressed.
Water 2020, 12(6), 1617; https://doi.org/10.3390/w12061617
Submission received: 14 May 2020 / Revised: 29 May 2020 / Accepted: 4 June 2020 / Published: 5 June 2020
(This article belongs to the Special Issue Transformation of Dissolved Organic Matter in Aquatic Landscapes)

Abstract

:
Besides the importance of dissolved organic matter (DOM) in soil biogeochemical processes, there is still a debate on how agricultural intensification affects the leaching of terrestrial DOM into adjacent aquatic ecosystems. In order to close this linkage, we conducted a short-term (45 day) lysimeter experiment with silt loam and sandy loam undisturbed/intact soil cores. Mineral (calcium ammonium nitrate) or organic (pig slurry) fertilizer was applied on the soil surface with a concentration equivalent to 130 kg N ha−1. On average, amounts of leached DOC over 45 days ranged between 20.4 mg (silt loam, mineral fertilizer) and 34.4 mg (sandy loam, organic fertilizer). Both, mineral and organic fertilization of a silt loam reduced concentration of dissolved organic carbon (DOC) in the leachate and shifted its composition towards a microbial-like signature (BIX) with a higher aromaticity (Fi) and a lower molecular size (E2:E3). However, in sandy loam only mineral fertilization affected organic matter leaching. There, lowered DOC concentrations with a smaller molecular size (E2:E3) could be detected. The overall effect of fertilization on DOC leaching and DOM composition was interrelated with soil texture and limited to first 12 days. Our results highlight the need for management measures, which prevent or reduce fast flow paths leading soil water directly into aquatic systems, such as surface flow, fast subsurface flow, or drainage water.

1. Introduction

Soil stores twice as much carbon as the atmosphere [1], with an estimated soil organic carbon storage of 1462 to 1548 Pg in the first 100 cm of the soil profile [2]. Soil carbon storage is increasingly threatened by the conversion of land into areas for intensive agricultural production. By now, already 37.7% of the global terrestrial surface area is used for agricultural production [3]. However, in an effort to improve global food security for an exponentially growing human population, the conversion of land to agricultural areas is expected to increase further, and the production per square meter is predicted to intensify [4].
The latter, intensive production, is often achieved through the application of nitrogen-based fertilizers, with a predicted annual application of 118 million tons of N globally by 2020 [5]. Decades of high fertilizer application rates have increased the overall nitrogen content in soils, thus fueling mineralization rates which, in turn, enhanced the depletion of naturally occurring soil organic carbon [6]. This has implications for the receiving stream and river ecosystems. Land conversion has increased carbon transport from soils to aquatic systems from approximately 1.1 Pg y−1 to 1.9 Pg y−1 globally [7]. These terrestrial carbon fluxes are mostly of organic origin [8], whereby the largest share is in dissolved form (dissolved organic matter, DOM; [9]).
Overall, the intensification of agricultural production has altered both the concentration and the composition of DOM in fluvial systems through the reduction of the soil organic matter pool, alterations of hydrological pathways due to extensive drainage networks, and changes of in-stream microbial processes resulting from increased nutrient and light availability [10,11]. Terrestrial dissolved organic matter (DOM) plays a central role in the dynamics of stream and river ecosystems, affecting processes such as metabolism, the balance between autotrophy and heterotrophy, acidity, nutrient uptake, and bioavailability of heavy metals and organic pollutants [12,13,14,15,16]. Excessive DOM inputs from agricultural catchments may promote heterotrophy and bacterial production in streams, thus negatively affecting the stream’s metabolism and health [13,17]. However, despite its importance to stream processes, restoration and management activities rarely incorporate DOC as a major management criterion. Therefore, it is imperative to know how and to what extent agricultural management practices, such as fertilization, may change the composition of terrestrial DOM discharged into streams.
During the last decade, several studies have evaluated the impact of agriculture on DOM composition in streams and/or catchments. Intensification of agriculture tends to increase protein-like, labile, and microbially-transformed organic matter with low redox states and low molecular weight and aromaticity [11,18,19]. However, in some studies, organic matter in agricultural streams exhibited highly complex structures with high levels of humified and microbial-derived DOM [10,20]. These partly contradicting results arise from the fact that aquatic DOM is shaped by the terrestrial DOM source, which depends on land use, soil texture, and agricultural management practices, the flow paths by which the DOM is transported to the stream (e.g., overland flow, groundwater, drainage water), and the various in-stream microbial transformation processes [21]. Therefore, in order to evaluate the potential impacts of fertilization on aquatic DOM composition, these different factors have to be analyzed separately.
The retention of DOM against leaching depends on the chemical nature and physical properties of sites available to interact with the ions and molecules present in soil solution [22,23]. For instance, soil clay minerals and metal hydrous oxides [24] are able to adsorb organic matter. The association between organic matter and inorganic soil colloids determines if enrichment or depletion of carbon is the dominating process [25]. Consequently, distinct soil properties control which of the concurrent processes, stabilization or biodegradation, is dominating soil organic matter cycling. Stabilization of carbon may remove otherwise biodegradable organic matter from solution. Soil organic matter can be protected from microbial decomposition in clay minerals by reducing its accessibility [26]. Additionally, the balance between carbon stabilization and biodegradation is controlling the organic matter content of the surface soils [27,28]. Furthermore, leaching of nutrients and organic carbon is directly proportional to water flow [29]. Soil texture determines the water flow and water holding capacity, thereby controlling the leaching of dissolved nutrients in soils [30].
Besides soil properties, fertilization alters the pedogenic DOM composition by influencing the abundance as well as the activity of soil microorganisms. Nitrate especially promotes microbial decomposition of DOM, which is indicated by positive correlations between nitrate content and aromaticity of the water extractable organic matter (WEOM) found in soils [31]. Furthermore, Fang et al. [32] observed an increase in aromaticity and molecular complexity of WEOM caused by mineral fertilization of an alpine meadow.
In contrast to mineral fertilizers, which only add inorganic nutrients to the system, organic fertilizers provide an additional carbon source, thus changing the internal carbon cycling and affecting the DOM leaching. In a study testing non-fertilized controls and mineral (NPK) fertilized samples of an Ultisol, an increase of molecular weight and higher ratio of microbially derived WEOM were observed, while organic fertilization had no impact on WEOM [33]. Furthermore, organic fertilization of forest soils did not affect WEOM compositions [34]. One problem, however, is the current lack of a standardized method to obtain WEOM in soils. This is crucial since WEOM concentration and its composition is affected by several factors, such as the extraction solution (water or diluted salt solution), soil pre-treatments (fresh or air-dried), soil solution ratios, and the contact time [35]. In order to evaluate DOM leaching in soils accurately, systematic studies attempting to preserve soil aggregate structure while conducting their experiments are needed [26,30]. Consequently, we used undisturbed soil cores with different soil textures in lysimeter experiments to study the impacts of fertilization and soil texture on the composition and concentration of leached DOM in soil pore water. We hypothesized that:
(A)
Both, mineral and organic fertilization will increase the concentrations of leached dissolved organic carbon (DOC) in the soil pore water and will shift DOM composition towards more labile compounds.
(B)
Pore water of coarser textured sandy loam will exhibit higher DOC concentrations than finer textured silt loam soil.
In order to evaluate the immediate response of soil DOM to fertilization, we established a short-term (45 days) lysimeter experiment using silt loam and sandy loam, sampled in its undisturbed condition. Mineral (calcium ammonium nitrate) or organic (pig manure) fertilizer was added on top of the soil surface with a concentration equivalent to 130 kg N ha−1. In the following days, soil cores were subjected to continuous rainfall simulated in an in vitro environment. Changes in the concentration of leached DOC and the composition of DOM were assessed in 6-day intervals using spectrophotometric and spectrofluorometric methods.

2. Materials and Methods

2.1. Study Sites and Soil Sampling

The study sites are representative of productive soil managed as agricultural crop land. However, the complexity of the experimental setup limited the number of possible soils/replicates. Because of the limited number of soils that could be tested, we decided to focus on two soils differing in soil texture, as literature has shown that soil texture is a driving factor for leaching [36]. We selected silt loam, because it is one of the most dominating textures in European agriculture [37], and we compared this with a sandy loam because of its different soil physical properties. Firstly, the undisturbed Ap horizon (0–16 cm) of a silt loam was sampled in Petzenkirchen, Lower Austria (49°9′ N, 15°9′ O; 323 m.a.s.l.). The climate around Petzenkirchen can be classified as humid with a mean annual temperature of 9.5 °C and a mean annual precipitation of 823 mm y−1. This agricultural soil is cultivated with maize as the dominating crop. Secondly, the undisturbed Ap horizon (0–16 cm) of a sandy loam soil was collected in Rutzendorf, Lower Austria (48°12′ N, 16°3′ O, 156 m.a.s.l.). This region can be described as semi-humid with a mean annual temperature of 9.5 °C and a mean annual precipitation of 529 mm y−1. The soil is agriculturally managed with vegetables and cereals in the crop rotation.
For the lysimeter experiment, twelve soil cores (Ap horizon; 0–16 cm, Ø 15 cm) were sampled in its undisturbed condition at each study site. Due to the limited number of available lysimeters, sampling of the soil cores was performed sequentially. For ensuring similar initial conditions regarding the soil porosity, soil cores were taken three days after seedbed preparation. Silt loam soil was sampled in Petzenkirchen on 12 April, 2017, while sandy loam soil was sampled in Rutzendorf on 24 October, 2017. Due to the high contribution of the intensively managed soil surface to microbial turnover [26], we sampled the soil layers to the management depth of 0–16 cm.
Additional samples were taken to measure soil properties in two soil depths, ranging from 0–8 cm and 8–16 cm, respectively. Soil sampling for chemical analysis was bulked for each soil layer. Soil physical properties were measured in undisturbed samples using stainless steel cylinders (height 5 cm; volume: 250 cm3).
In total, six samples for chemical analysis and six samples for assessing soil physical soil properties were taken.

2.2. Lysimeter Experiment

The lysimeter experiments were conducted under controlled environmental conditions of 78% relative humidity and 17 °C air temperature. The latter was chosen to reflect the mean air temperature for the growing season from April till October in lower Austria [38]. Except during sampling, the cores were kept in the dark to minimize algae growth and photodegradation of the DOM in the soil leachate samples.
The factor fertilization consisted of three levels: mineral (calcium ammonium nitrate; NAC27 with 13.5% nitrate and 13.5% ammonium), organic (pig slurry), and a non-fertilized control. The used pig slurry consisted of 1984 mg L−1 total organic carbon and 2500 mg L−1 total nitrogen (with 84% ammonium). All fertilizer treatments were added on top of the soil surface with a concentration equivalent to 130 kg N ha−1. Therefore, at soil cores fertilized with organic fertilizer 90 mg total organic carbon (TOC) were added on each soil core.
Immediately after fertilization, artificial raining of soil cores started with an intensity of 6 mm day−1 using deionized water with a DOC content of <0.5 mg L−1 and electric conductivity of 1–2 µS cm−1. The chosen rainfall intensity was a result of taking into consideration a practical experimental time, sufficient amounts of leachate for the chosen soils and sufficient time to exchange soil water volumes. It corresponds to an event which typically reoccurs two to three times per year [39]. The duration of the experiment was set in a way that soil pore volume was exchanged three times (soil pore volume: 1724 cm3). This required 45 days, and during the entire experiment each soil core received 5 L of deionized water in total. An irrigation head with 18 mounted needles ensured even raining of the soil surface (Figure S1). The pressure potential at the lower end of the soil cores was kept at −60 h Pa throughout the whole experiment, maintaining the soil moisture at field capacity, i.e., at 43 Vol% for the silt loam and 39 Vol% for the sandy loam, respectively. Soil water content and matrix potential within the soil cores were measured at 4 cm and 8 cm depth below the soil surface employing ECH2O EC-5 small moisture sensors (Decagon Devices, WA, USA) and tensiometers (T5-10, METER Group AG, WA, USA).
Due to the low rain intensity, soil leachate had to be collected over longer time periods to obtain enough leachate for chemical analysis. Leachate samples for concentrations of TOC (total organic carbon), nitrate and chloride were collected over six days, resulting in a total of 450 mL leachate. Samples for assessing the DOM composition and DOC concentration were collected for 16 h, resulting in a total of 80 mL leachate. During this collection, the bottles were kept cold with ice cubes at 4 °C. The DOM samples were immediately filtered with pre-combusted GFF-filters (Whatman) and stored in pre-combusted glass vials in the dark at 4 °C until analysis within 24 h.

2.3. Chemical Analysis

2.3.1. Soil Sample

Soil samples were air dried, sieved <2 mm, and analyzed for pH [40], water content at sampling time (gravimetrically after drying at 105 °C), total organic carbon (TOC; dry combustion, [41]), and total inorganic carbon (Scheibler procedure, [42]).
After the lysimeter experiment, soil cores were cut horizontally into two layers (0–8 cm and 8–16 cm, respectively). Total organic and inorganic carbon was analyzed to obtain the remaining organic carbon of the specific soil layer. Results are shown in the Supplementary (Table S1).

2.3.2. Soil Leachate

TOC and DOC concentrations were determined using gas chromatography (TOC-L, Shimadzu, Japan) following the procedure described in [43]. Accuracy of DOC measurements was ±5% up to 50 mg L−1, based on repeated measurements of potassium hydrogen phthalate standard solutions.
Due to incomplete removal of dissolved inorganic carbon during the last five observations of the second experiment, DOC concentrations had to be predicted from the absorbance spectra for these samples by using a two-component model obtained from absorbance at 254 nm and 350 nm (R2 = 0.99; [44]). Chloride and nitrate concentrations were measured by ion chromatography ([45]; Dionex ICS-900 Ion Chromatograph, Thermo Fischer; MA, USA), while ammonia was determined photometrical (Agilent 8453, CA, USA) using the modified procedure of [46] for water samples.

2.4. Soil Physical Analysis

Hydro-pedological characteristics, such as water retention curve and hydraulic conductivity function, of soil were analyzed using the HYPROP® system (Meter Group AG; Munich, Germany). For this purpose, pressure heads within a soil sample (stainless-steel cylinders; height 5 cm; volume: 250 cm3) were measured continuously at two depths, supplemental water evaporation from soil surface was quantified by weighing [47].
Additionally, bulk density [48] was measured in undisturbed samples using stainless steel cylinders (height 5 cm; volume: 250 cm3), while the particle size distribution was evaluated using the sieving/pipette method after reference [49]. Soil texture was classified according to World Reference Base (WRB) the international standard for soil classification [50]. Results are shown in the Supplementary (Table S1).

2.5. DOM Characteristics

DOM composition was determined via optical characteristics using spectrophotometric and spectrofluorometric methods at WasserClusterLunz GmbH (emission-excitation matrices, EEMs; [51]). Spectral absorbance was analyzed at 0.5 nm increments between 200 nm and 700 nm in a 0.05 m quartz cuvette using a spectral photometer (UV1700 Pharma Spec, Shimadzu Corporation, Kyoto, Japan, [52]). DOC concentrations of these samples were determined using gas chromatography (TOC-L, Shimadzu, Japan).
Fluorescence spectra were measured using a fluorescence spectrophotometer (Hitachi F-7000, Hitachi High-Technology Corporation, Tokio, Japan) coupled with a xenon lamp as a source for excitation. Fluorescence intensity was measured at excitation (ex) wavelengths ranging from 200 nm to 450 nm and emission (em) wavelengths ranging between 250 nm to 600 nm in 5 nm increments in a 0.01 m quartz cell [51]. All measurements were baseline-corrected using the Raman spectra of ultrapure water. The whole pre-processing of the dataset included: blank subtraction (ultrapure water), inner-filter effect correction, and the removal and interpolation of Rayleigh and Raman scattering of first and second order [53]. Absorbance and fluorescence analyses were performed at constant room temperature of 21 °C.
The evaluation of recorded fluorescence and absorbance spectra of DOM was done using the “staRdom” package with an inclusion of the “eemR”-package [54] of the R-software 3.5.0 [55]. The following fluorescence indices were calculated: biological index (BIX; [56]), ‘Coble-Peaks’ B, T, A, M, and C [57], fluorescence index (Fi; [51]), and humification index (Hix; [58]). Absorbance slope parameters SUVA254 and E2:E3 were calculated based on [59] and [60], respectively. The parallel factor analysis (PARAFAC) was used to link the fluorophores of the EEMs to chemical components in DOM [53]. Consistency of the PARAFAC analysis was maintained by checking randomness of residuals, visualization of spectral loadings as well as the half-split analysis. The random initialization was set to 250 iterations [53].

2.6. Quality Assurance and Statistical Analysis

The accuracy and precision of the measurements were monitored continuously by internal standards, laboratory replicates, matrix samples, reference material, and standard solutions. The maximum allowed relative standard deviation between replicates was set to 5%.
All statistical analyses were performed using R 3.5.0 [55]. The significance level for all statistical analyses was established at p ≤ 0.05. For the analysis of changes in nutrient and DOC concentrations, 161 soil leachate samples in total were included in the statistics, with four replicates per combination of fertilizer treatment and soil texture and seven observations during each experiment.
Due to outlier correction, one silt loam soil core fertilized with mineral fertilizer had to be excluded from the analyses. All variables were tested for normality using a combination of Shapiro–Wilk test (stats package) and qq-plots (ggplot2 package). The homogeneity of the variances was verified using the Levene test (car package). Response variables were log-transformed to account for non-normal distribution when necessary. Influence of soil texture, fertilizer type, and sampling date on hydrochemistry of the leachate water was tested using repeated measures analysis of variance (MANOVA; multcompView and lsmeas package). When Mauchly’s test had been violated, the Greenhouse Geisser estimates of sphericity were used. If sphericity was met, multiple comparisons of means were calculated with the Tukey’s honestly significant difference test as post-hoc test (TukeyHSD; multcomp package).
For analyzing the DOM composition, a total of 161 soil leachate samples were used allocated to seven observations per experiment with four replicates per fertilization treatment and experimental soil. One soil core had to be excluded from the analysis due to outlier correction. Since prerequisites for parametric statistical evaluation could not be met, a non-parametric test was conducted. The main and interaction effects of soil texture and fertilizer type on the DOM spectra were evaluated using a permutational MANOVA (PERMANOVA; vegan package, Euclidean distance, 999 iterations; [61]). Results of the PERMANOVA were visualized in principal response curves (PRC; vegan package) for each soil texture individually in order to illustrate the impact of fertilizer type and their interaction with time on the DOM composition. PRC is a multivariate response technique based on repeated measures over time, the resulting graph allows one to centralize the analysis on time-dependent treatment effects. As suggested by [62], DOM indices with a species weight between −0.5 and +0.5 were not shown, because they were likely to show either a weak response or a response that is unrelated to fertilization and their interaction with time. The ANOVA-like permutation test (using the constrained correspondence analysis “cca()”- function, vegan package) assessed the significance of the PRC model. Dunnet’s test was applied to assess significant shifts in DOM composition over time, using the first sampling day as a reference (vegan package).

3. Results

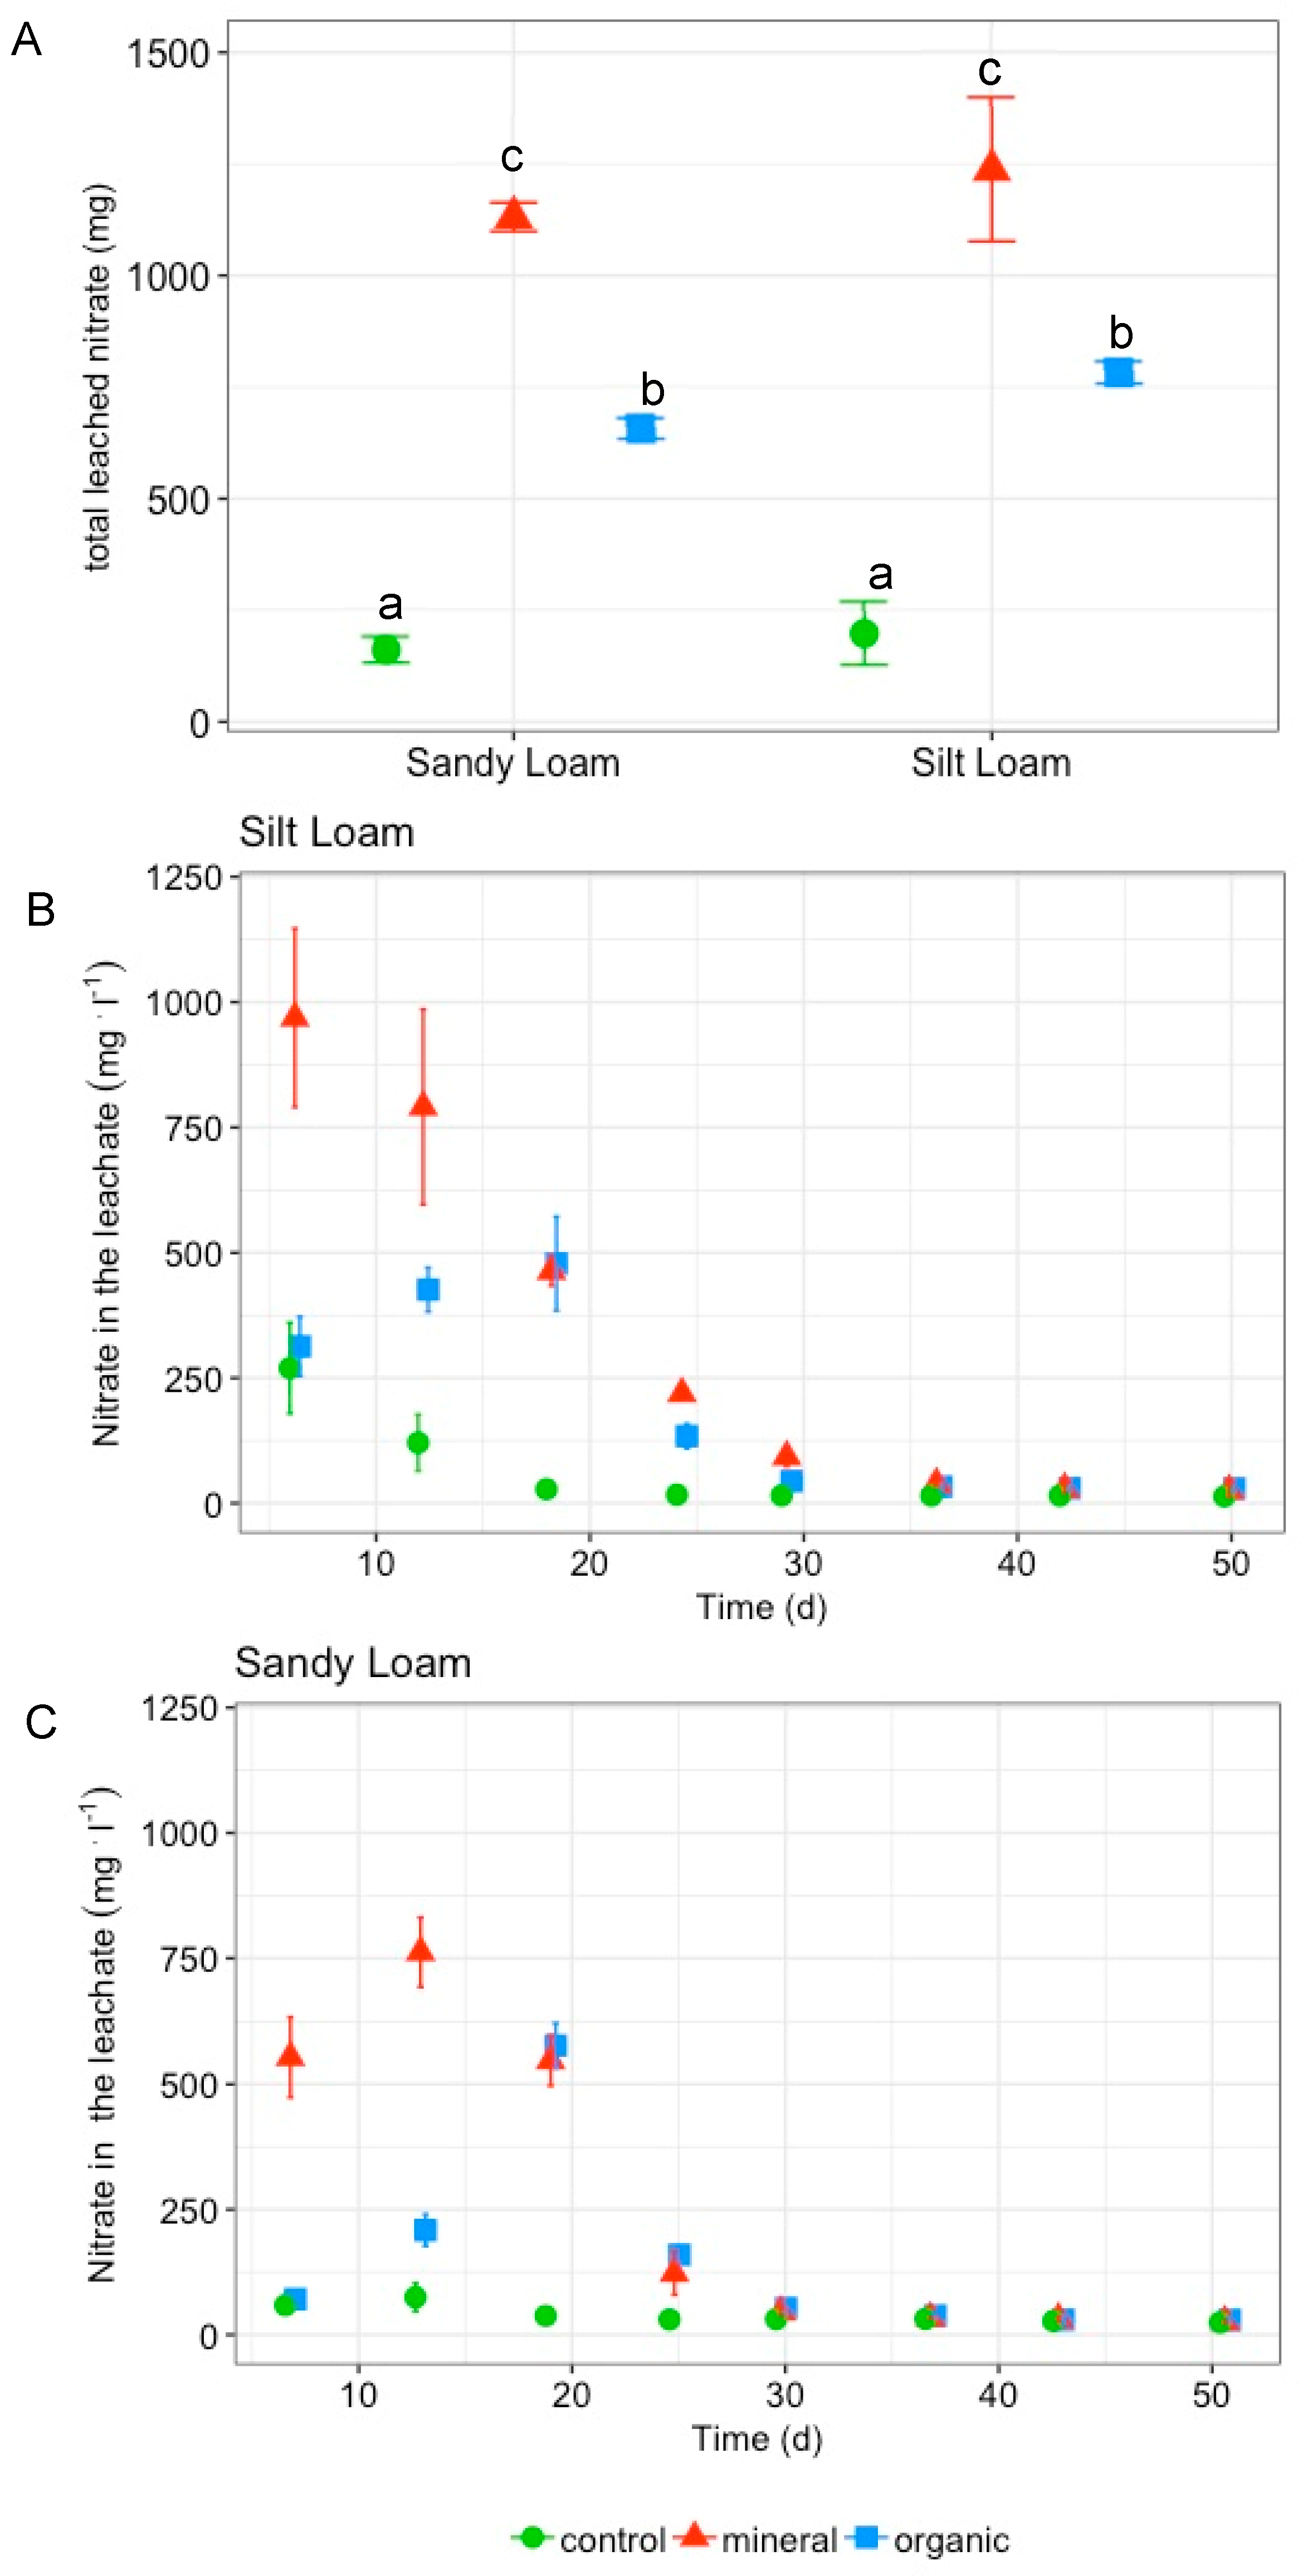
3.1. Leachate Chemistry

In general, both, soil texture and fertilizer type affected the concentrations of TOC, DOC, nitrate, and chloride leached from the soil cores (MANOVA, p ≤ 0.01 and p ≤ 0.001, respectively; Table 1). Additionally, the effect of fertilizer type on TOC and DOC concentrations was interrelated with soil texture (MANOVA, p ≤ 0.05 and p ≤ 0.001, respectively; Table 1). Overall, the effects were most obvious during the first 19 days; afterwards the leached nutrient and organic matter concentrations were more similar between the treatments and the control.
Average amounts of leached DOC over 45 days for each soil core ranged between 20.4 mg (silt loam, mineral fertilizer) and 34.4 mg (sandy loam, organic fertilizer; Figure 1). In silt loam, we observed significantly lower leached DOC amounts in the mineral fertilizer compared to the control (Tukey, p ≤ 0.01, n = 21 per treatment). Significant differences were observed in sandy loam only between the organic fertilizer and the control (Tukey, p ≤ 0.05, n = 28 per treatment). Average amounts of leached TOC ranged between 22.3 mg (silt loam, mineral fertilizer) and 38.1 mg (sandy loam, organic fertilizer) and showed similar patterns as DOC. Total amounts of nitrate leached from the cores were highest in the mineral fertilizer treatment, followed by organic fertilizer and the control in both soil textures (Tukey, p ≤ 0.001, for silt loam: n = 21 per treatment, for sandy loam: n = 28 per treatment; Figure 2). Compared to other treatments, only organic fertilization enhanced the total amounts of leached chloride at both soil textures (Tukey, p ≤ 0.001, for silt loam: n = 21 per treatment, for sandy loam: n = 28 per treatment). On average, leached amounts of chloride amounted to 3, 1, and 35 mg in silt loam and 11, 18, and 48 mg in sandy loam for the control, the mineral, and the organic fertilizer, respectively.
Leachate percolating through unfertilized soil cores became gradually depleted in TOC, DOC, nitrate, and chloride concentrations over time, until the concentrations stabilized in both experimental soils at approximately the same low to moderate levels after 19 days (Figure 1 and Figure 2).
Initial nitrate concentrations were higher in sandy loam than in silt loam (TukeyHSD, p ≤ 0.01, for silt loam: n = 3 per observation, for sandy loam: n = 4 per observation; Figure 2), while sandy loam showed higher chloride concentration than silt loam during the first 12 days (TukeyHSD, p ≤ 0.05, for silt loam: i = 3 per observation, for sandy loam: n = 4 per observation). In contrast, initial TOC and DOC concentration of unfertilized soil cores did not differ significantly between silt loam and sandy loam (TukeyHSD, p = 0.375, for silt loam: n = 3 per observation, for sandy loam: n = 4 per observation; Figure 1).
In silt loam, DOC concentrations in the leachate of fertilized soil cores were about half those of the control during the first 19 days and then increased to the same levels as the control (TukeyHSD, p ≤ 0.001, n = 3 per treatment and observation; Figure 1), independent of the fertilizer type. On average, leached DOC concentrations of the silt loam amounted to 10.6, 4.6 and 6.2 mg L−1 on the first sampling date and to 8.0, 6.7 and 9.3 mg L−1 after 24 days for the control, mineral and organic fertilizer, respectively. In contrast to DOC, fertilization enhanced nitrate concentrations in the leachates of silt loam (Figure 2). In soil cores treated with mineral fertilizer, average nitrate concentrations in the leachate decreased continuously over the whole experiment from 969 mg L−1 at the beginning to 26 mg L−1 after 45 days. In contrast, the initial nitrate concentrations of organic fertilization were in the range of unfertilized soil cores with an average of 313 mg L−1 and increased gradually thereafter to a maximum of 463 mg L−1 after 19 days. Afterwards, concentrations declined again to 30 mg L−1. Chloride could only be detected in silt loam treated with organic fertilizer during the first 12 days (TukeyHSD, p ≤ 0.001, n = 3 per treatment and observation).
In sandy loam, DOC concentrations were significantly lower in the treatment with mineral fertilizer than in the control during the first 12 days (TukeyHSD, p ≤ 0.001, n = 4 per treatment and observation; Figure 1). Afterwards concentrations increased, reaching similar levels as the control (TukeyHSD, p = 0.384, n = 4 per treatment and observation). Average DOC concentrations from the organic fertilization were within the fluctuation range of the control throughout the experiment (TukeyHSD, p = 0.669, n = 4 per treatment and observation). Nitrate in fertilized sandy loam cores showed a reverse development to DOC concentrations, with an initial increase after 12 days, followed by a fast decrease to values comparable to the control (Figure 2). The highest nitrate concentrations occurred under mineral fertilization during the first 12 days (TukeyHSD, p ≤ 0.001, n = 4 per treatment and observation). In contrast, nitrate concentrations of organic fertilization were similar to those of the control on the first sampling date (TukeyHSD, p ≤ 0.001, n = 4 per treatment and observation), but increased considerably until day 19 to values comparable to those of the mineral fertilizer treatment. After that, nitrate concentrations declined in the same way as those in the treatments with mineral fertilization. Across all fertilizer types, only organic fertilization resulted in a significant increase of chloride during the first 24 days (TukeyHSD, p ≤ 0.001, n = 4 per treatment and observation). Afterwards, concentrations in the leachate depleted rapidly and were in the range of the unfertilized control (TukeyHSD, p = 0.497, n = 4 per treatment and observation).

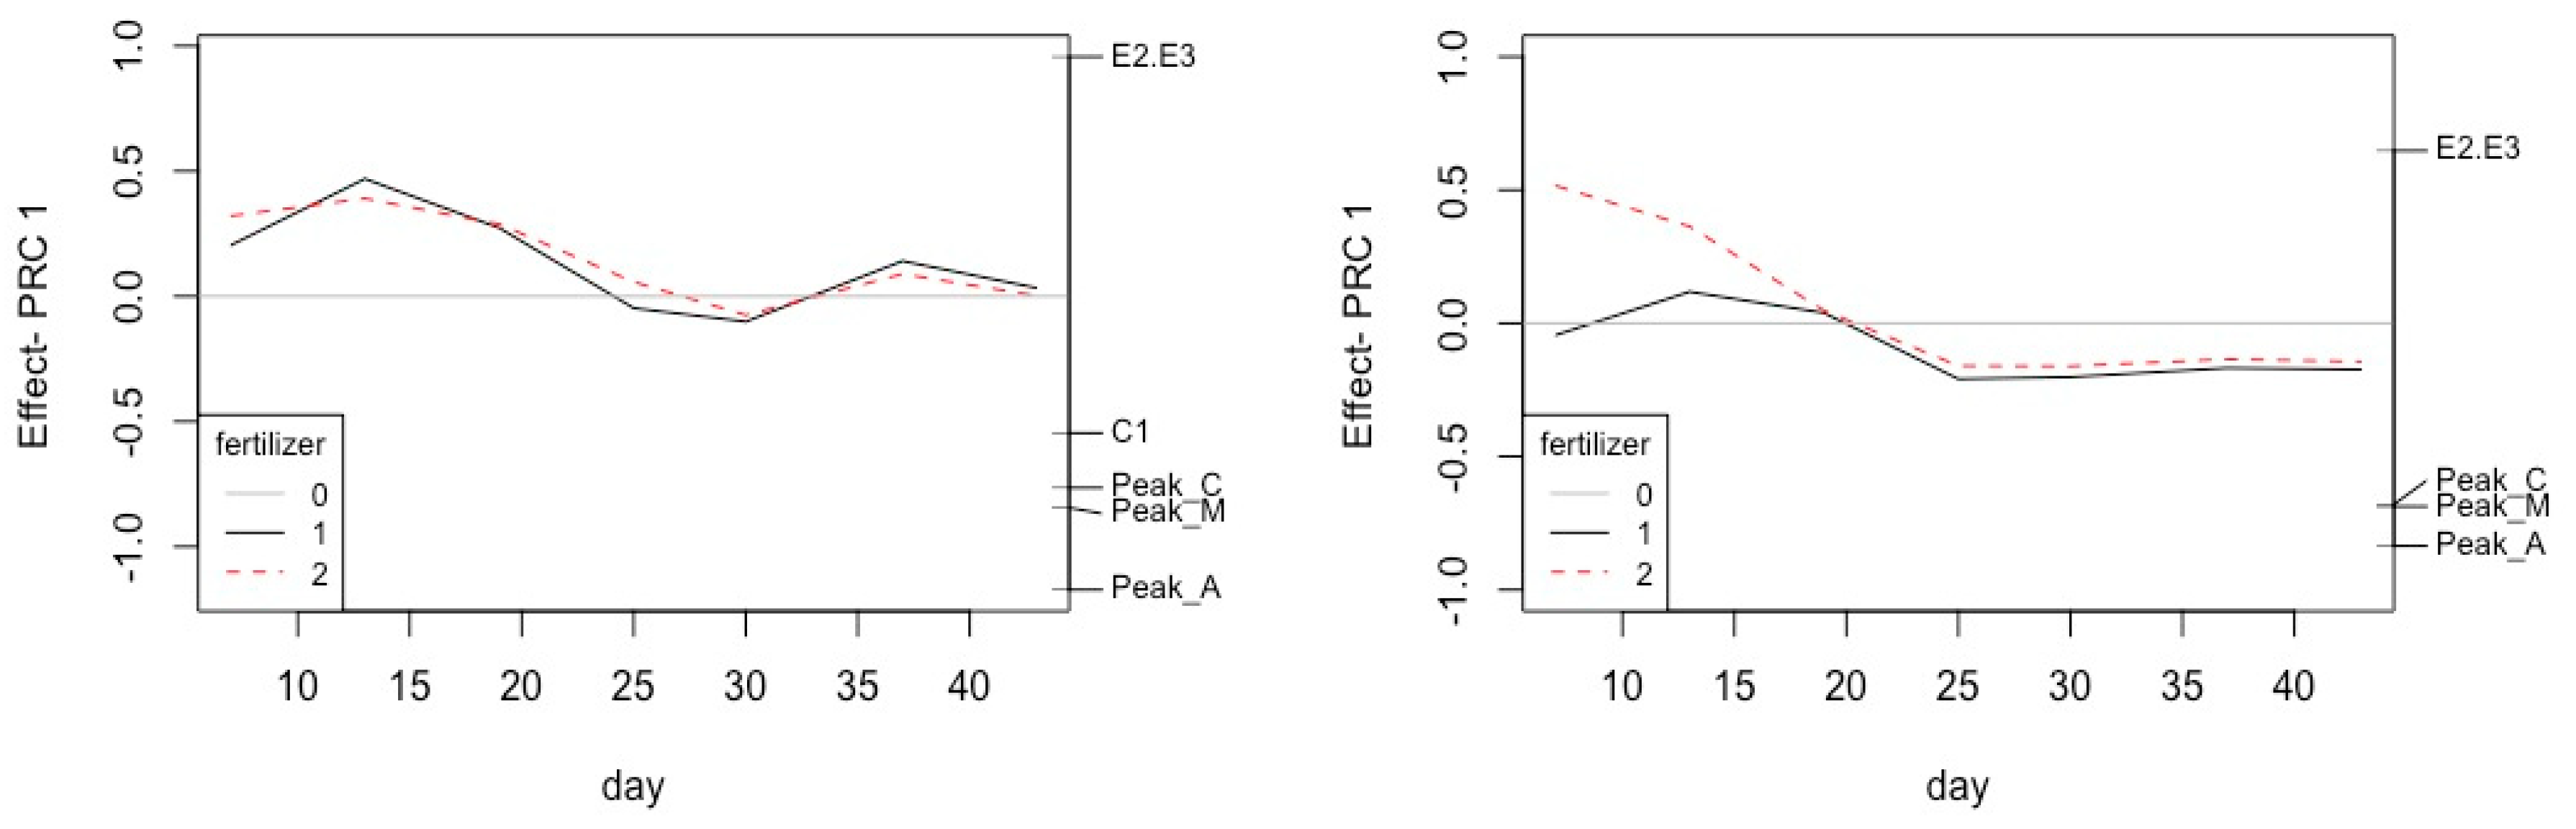
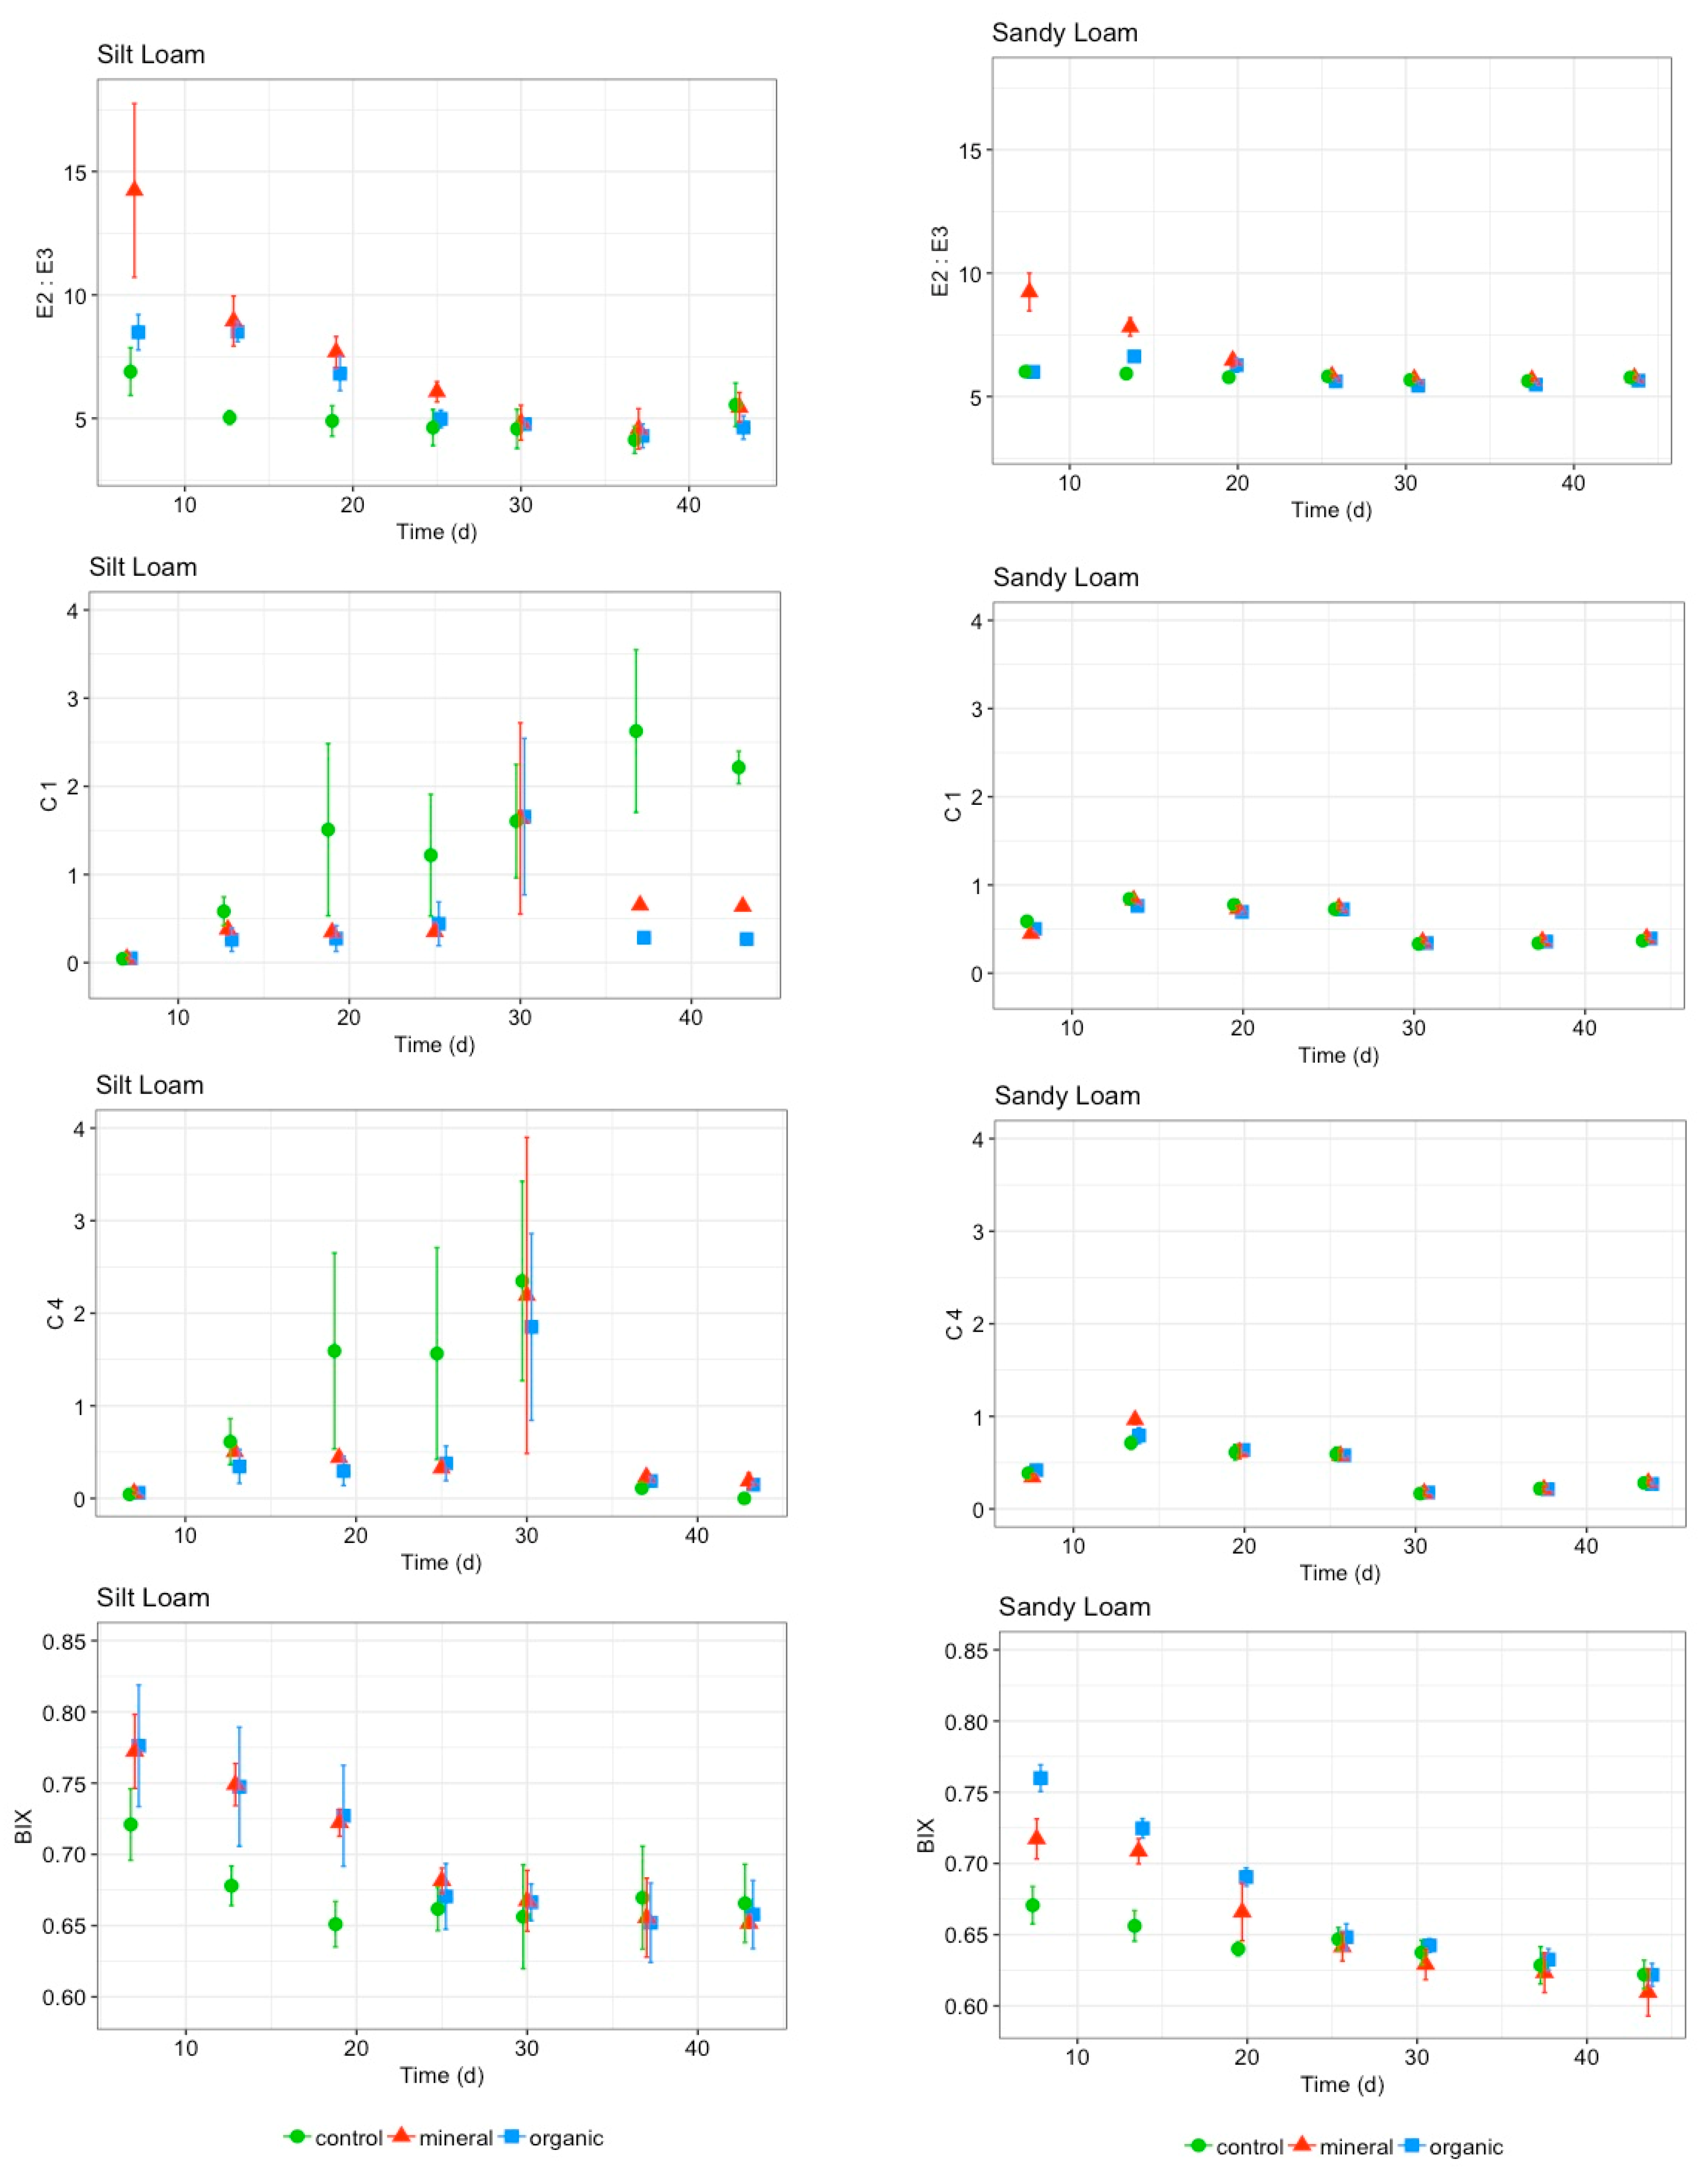
3.2. Composition of Leached Organic Matter

PARAFAC modelling of the emission-excitation matrix (EEM) identified four fluorophores (C1–4; [53]). Table 2 gives an overview about the observed components of PARAFAC modelling, their emission and excitation wavelengths as well as the references they refer to. According to literature, fluorophores C1–3 are similar to humic-like fluorophores, whereby C1 and C3 are supposed to represent terrestrial DOM derived from forests and wetlands [10,57,63], while C2 are probably microbially altered DOM, related to agriculture and with a low molecular weight [10,64]. Fluorophore C4 is similar to protein-tryptophan-like fluorophores [63].
Soil texture, fertilizer type, and their interaction affected DOM composition of the soil leachate significantly (PERMANOVA, p ≤ 0.001; Table 1). Correspondingly, fertilizer type explained 12% (R2) of the variance. In addition, composition of DOM shifted over time and sampling date descripted 26% (R2) of the variance, forming the highest value. The interaction of soil texture and time explained 25% (R2) of the variance, while the variance explained by fertilizer type and its interaction with time and soil texture was less than 10% (PERMANOVA, p < 0.001; Table 1).
The principal response curve (PRC) models calculated for DOM originating from silt loam explained 32% of the total variance composition data (PRC, p ≤ 0.001). For the silt loam, the first canonical axis of the PRC explained 84% of the total variance of the DOM composition (PRC, p < 0.001; Figure 3). This PRC axis revealed an interaction effect of fertilizer type with time (44%, PRC, p ≤ 0.001). Changes in DOM composition are displayed in the curve as well as in corresponding species weights (Figure 3). E2:E3, Peak A, Peak M, Peak C, and C1 were the most representative of the PRC1 type response for the silt loam soil. During the first 19 days, fertilization led to an enrichment of compounds with a low molecular weight (E2:E3), while the DOM of the control composed of mainly humic-like compounds (Peak A, Peak M, Peak C, and C1). Furthermore, freshness index BIX (indicator of freshly produced DOM from microbial activity) and the freshness index Fi (related to aromaticity) correlated positively with fertilization in silt loam (Figure 4). E2:E3 was significantly enhanced by fertilization during the first 19 days (TukeyHSD, p ≤ 0.05 and p ≤ 0.05, n = 3 per observation), while BIX significantly increased between day 6 and day 18 (TukeyHSD, p ≤ 0.05, n = 3 per observation; Figure 4). Additionally, Fi was significantly enhanced by fertilization in the very beginning (TukeyHSD, p ≤ 0.05, n = 3 per observation). However, none of the mentioned indices were affected by fertilizer type (TukeyHSD, p = 0.789, n = 3 per observation).
The principal response curve (PRC) models calculated for DOM originating from sandy loam explained 41% of the total variance composition data (PRC, p ≤ 0.001). The first canonical axis of PRC explained 88% of the total variance for DOM composition of a sandy loam (PRC, p ≤ 0.001; Figure 3). This axis revealed an interaction effect of fertilizer type with time (52%, PRC, p ≤ 0.001). Shifts in DOM composition as well as their species weights are displayed in Figure 3. During the first 12 days mineral fertilization led to an enrichment of DOM compounds with low molecular weight (E2:E3), while the control was rich in humic-like compounds (Peak A, M, and C). None of the PARAFAC Components (C1–4) nor the humification index (HIX) or SUVA254 responded to fertilization of the sandy loam. In general, Fi, BIX, and E2:E3 responded positively to fertilization of sandy loam soil cores (Figure 4). Organic fertilization lead to enhanced BIX during the first 19 days, while mineral fertilization elevated E2:E3 ratio during the first 12 days (TukeyHSD, p ≤ 0.05 and p < 0.01, respectively; n = 3 per observation). Additionally, fertilization increased Fi during the first 12 days (TukeyHSD, p ≤ 0.01, n = 3 per observation), with no response to fertilizer type (TukeyHSD, p = 0.076, n = 3 per observation).

4. Discussion

4.1. Amounts of Leached DOC

In contrast to our original expectations of enhanced DOC leaching from fertilized soils, fertilization reduced DOC concentrations of the leachate during the first 2–3 weeks. This reduction of DOC leaching disappears with the decrease in nitrate leaching. In controlled laboratory experiments, continuous fertilization with NH4Cl and NaNO3 decreased DOC leaching of a mor humus (Oe and Oa; [73]). Despite the fact that physicochemical properties of the O horizon used by study of [73] are different to our examined Ap horizon, results of reduced DOC concentrations after mineral fertilization goes in line with our examination. Similar to our findings, NH4NO3 fertilization of a tropical Oxisol reduced DOC concentrations in the soil leachate collected at 20 cm soil depth with zero tension lysimeters [74]. Both, [74] and [73] concluded from their results that nitrogen-based fertilization supported DOC mineralization, which in turn lead to a reduction of DOC concentrations in the leachate. Based on this we conclude for our results, nitrate stimulated mineralization of soil organic matter and transformation of organic carbon into carbon dioxide, resulting in a decreased leaching of DOC.
In opposition to the aforementioned, organic fertilization of a sandy loam lead to similar DOC concentrations as in the control throughout the whole experiment. Organic fertilizer adds organic carbon to the soil, thus potentially reducing or even compensating the effects of enhanced mineralization through fertilization. Organic fertilizer added 90 mg total organic carbon (TOC) to our soil cores. In contrast to the control, organic fertilization enhanced TOC losses in sandy loam by 12%, while in silt loam total TOC losses were reduced by 9%. In field lysimeters, organic fertilization with pig manure enhanced leached DOC concentrations in a loamy clay soil [75]. These authors assumed that the observed increase in DOC concentration was mainly caused by the high application rate, which was 4.6 times higher than in our study (600 kg N ha−1 y−1). In another laboratory experiment with similar slurry application rates than ours, organic fertilization did not affect DOC leaching of a silt loam, probably because the DOC was rapidly mineralized by the microbial community as it percolated down the soil core [76]. In deeper soil horizons (up to 50 cm soil depth) DOC leaching is mainly affected by soil physical properties, such as adsorption and/or flow velocity. Therefore, effects of N fertilization on the leaching of DOC decreased markedly with soil depth [77,78]. In addition, slower passage of the water down the soil profile enhances the contact time of DOC with soil colloids, thus covering possible effects of fertilization on DOC leaching. In addition to fertilization, clay and soil moisture content are main factors in controlling DOC concentrations in the soil pore water [79]. Clay is providing a large surface area for DOC sorption [80,81,82], and, sorption of DOC onto clay is mostly irreversible [83]. Due to the occupation of binding sites, DOC sorption decreases with increasing organic carbon content [84]. In our experiment at non-fertilized control treatments, we observed that the amount of leached DOC was significantly higher in silt loam (higher soil organic carbon content; SOC) than in sandy loam (lower SOC), indicating a relationship between SOC and DOC leaching. In contrast, the application of the organic fertilizer showed the reverse pattern, demonstrating that organic fertilization may superimpose this SOC–DOC correlation. Generally, soil texture is creating the basis for soil water flow and water holding capacity, determining the leaching of dissolved organic carbon [30]. The relationship between water flow and water holding capacity is expressed by the hydraulic conductivity (ks). During our experiment, ks for sandy loam was higher than for silt loam. As a result, the sandy loam had a higher discharge rate and DOC was leached more rapidly, reaching steady state conditions earlier than the silt loam. In contrast to the silt loam, organic fertilization of the sandy loam caused an enhanced leaching of DOC, due to the combined effect of high supply of organic matter, lower sorption site density, and higher flow velocity. Consequential, both mineralization and leaching were determined by the water retention time, thus, DOC leaching prevails in the sandy loam with organic fertilization. Finally, the soil organic carbon content of silt loam was not affected during our leaching experiment. However, the soil organic carbon content of the top soil layer (0–8 cm) of the sandy loam was reduced by 37%, during our leaching experiment (Table S1).
In our experiment the overall fertilizer effect on DOC leaching was limited to the first 2–3 weeks and disappeared in the later phase of the experiment. Literature data also shows, that the fertilizer effect on DOC leaching is time depended. Immediately after fertilization, effects on DOC leaching could be observed [75,85], while four months after fertilization no response was found [86].
In the field, the potentially leached organic matter content is generally estimated through soil water extracts. One problem, however, is the current lack of a standardized method to obtain water extractable organic matter (WEOM) in soil. This is crucial since WEOM is affected by several factors, such as the composition of the extractant (deionized water or diluted salt solution), soil pre-treatment (fresh or air-dried), soil solution ratios, and the contact time [35]. Deviations between leached DOC concentrations sampled with zero tension lysimeters and the WEOM content have already been discovered [74]. Such deviations might be caused by overestimating the immobile fraction of organic matter, which is permanently or temporarily sorbed onto soil particles. Consequently, the impact of fertilization on DOC leaching may be difficult to detect by water extractable organic matter concentrations alone. In contrast to controlled laboratory experiments, the complexity of the system increases in in-situ field studies, offering a wide variety of competing processes that might produce and consume organic matter within soils. However, in-situ studies of DOC leaching with zero tension lysimeters depend on the seasonal hydrological variability, which may influence and even postpone the impact of fertilizer on the leached DOC concentrations [78,87]. Controlled laboratory experiments with soil columns as performed in our study have proven to be a promising method in analyzing soil organic carbon leaching [73,76]. Further laboratory studies are needed to disentangle the complex interaction of the various abiotic and biotic factors controlling organic matter leaching from soils.

4.2. Composition of Leached Organic Matter

In accordance with [88] and [33], in our experiment humic-like components were the dominant fractions of leached DOM irrespective of soil and fertilizer type. Initial DOM originating from fertilized silt loam soil revealed a high aromaticity (Fi), a higher microbial activity (BIX) and a smaller molecular size (E2:E3) than the corresponding control. However, in sandy loam only mineral fertilization affected DOM composition and, accordingly, DOM become enriched with microbial-like compounds though this effect was limited to the first 12 days. At both soil textures, initial DOM of the unfertilized control were enriched with humic-like compounds (Coble-Peak A, M, C). We assume that fertilization fueled the microbial decomposition of the soil organic matter, thus shifting DOM towards more labile compounds with low molecular weight and lower aromaticity. With time, leachate became gradually depleted in nitrate, the possibility to incorporate N into organic matter decreased, leading to a loss of protein-like components in the leachate of fertilized soil cores.
In literature, organic fertilization shifted the structure of DOM towards more labile compounds with a higher share of hydroxyl and amino groups, while mineral fertilization (NPK) did not qualitatively affect DOM composition [33,89]. The authors of [89] suggested that long-term organic fertilization led to an enrichment of organic N, thus enhancing the lignin decomposition of crop residues. However, mineral fertilization resulted in an enrichment of hydrophilic compounds [90] or enhanced labile organic compounds, such as carbohydrates, amino sugars, and proteins [91]. In a 56-day incubation experiment, mineral fertilization with NH4Cl accelerated microbial turnover of labile organic carbon, while the decomposition of recalcitrant soil organic matter declined [92]. Microbes might have lowered the decomposition of soil organic matter because their requirements were met by N fertilization [92]. However, other studies showed that long-term fertilization can lead to shifts in microbial decomposer communities, thus resulting in similar DOM compositions across soils and overlaying distinct soil properties [18,91].
Due to sorption onto clay minerals, soil passage causes a molecular fractionation of DOM. Aliphatic and low-polar compounds are preferentially dissolved in the soil solution, whereas unsaturated, aromatic, and highly polar compounds tend to be adsorbed onto soil particles [80]. Furthermore, total soil nitrogen and organic carbon content increased by long-term fertilization is influencing the activity of the soil bacterial community, which in turn will affect soil DOM composition [91].
In our study, the impact of fertilization was controlled by soil texture. Due to the higher discharge rate of the sandy loam, labile organic matter added as organic fertilizer was shortly retained in the soil core and rapidly leached out, consequently no shift in DOM composition were observed.
In our experiment fertilizer-induced changes in DOM composition were time-dependant and decreased with the continuation of the experiment. Labile organic compounds, such as simple carbohydrates, fats and amino acids, are degraded quickly during the first steps of decomposition. Other, more resistant organic substances such as cellulose, hemicellulose, and lignin are partially degraded and transformed at a lower rate. Therefore, soil carbon sequestration leads to stabilized mineral-associated organic matter with slow/marginal microbial degradation and low mobility [27,87].
In this experimental set up, responses of DOM leaching to fertilization were limited to a single fertilizer application. As shown before, long-term fertilization may have different effects. Additionally, the soil depth was restricted to 16 cm. At ecosystem level, a sufficient soil passage will shorten the effects of fertilization on aquatic DOM composition. However, this experiment showed clearly that the effect of fertilization on DOC concentration and DOM composition was interrelated with soil texture. Future research should focus on the effects of shortening leaching pathways or soil drying over longer periods on the concentration and composition of leached DOM.

5. Conclusions

Our experiments with undisturbed soils demonstrate that the effects of fertilization on soil DOM leaching depend on the fertilizer type and are strongly interrelated with soil texture. This has implications on both the amount and the quality of the leached DOM. In our study, fertilization tended to increase the proportion of fresh, microbially transformed DOM, while it generally reduced the amount of leached DOM compared to untreated soils probably due to the stimulation of microbial mineralization of soil organic matter through the enhanced nutrient supply. This effect was more pronounced in the silt loam soil than in sandy loam soil. Consequently, it is possible to deduce that a longer residence time of leachate in soils can reduce the DOM exports from soils into streams. This implies that increased DOM concentrations in agriculturally influenced streams probably do not originate from soil pore water, but from faster flow paths, such as surface runoff (overland flow), subsurface runoff, or drainage water. Further studies are needed to identify the main sources and pathways of terrestrial DOM inputs to stream systems and analyze the underlying mechanisms controlling the relation between DOM transport and processing in the soil.
Due to the spatial extent of agricultural land use and the yearly growing application of nitrogen-based fertilizers, it is reasonable to assume that an increasing proportion of terrestrial DOM inputs to aquatic systems will originate from agricultural areas. Thus, understanding the diverse effects of agricultural practices, such as, e.g., fertilization, tillage, or harvesting, on the export of DOM from different types of soils under different climatic conditions is crucial to protect and sustainably manage freshwater systems in agricultural landscapes.

Supplementary Materials

The following are available online at https://www.mdpi.com/2073-4441/12/6/1617/s1, Figure S1: Schematic illustration of a lysimeter subunit, Table S1: Basic soil properties of the soil cores for the lysimeter set-up.

Author Contributions

Conceptualization, A.T., G.W., and A.E.; methodology, A.T., G.W., and A.E.; software, M.P. and A.T.; validation, G.W. and A.K.; formal analysis, J.S., A.K., and W.W.; investigation, A.T., G.W., and A.E.; resources, G.W., P.S., and A.E.; data curation, A.T. and M.P.; writing—original draft preparation, A.T.; writing—review and editing, A.T., G.W., A.K., J.S., W.W., and P.S.; visualization, A.T.; supervision, G.W. and P.S.; project administration, G.W., A.E., and P.S.; funding acquisition, G.W. and P.S. All authors have read and agreed to the published version of the manuscript.

Funding

This study is an integral part of the project “Organic carbon cycling in streams: Effects of agricultural land use” (www.organic-carbon.at), which focuses on the impacts of agricultural land use on the concentration and composition of terrestrial DOM imported into a stream ecosystem via different flow paths as well as on the microbial processing of terrestrial DOM within the aquatic system. The overall project was funded by the Provincial Government of Lower Austria (https://www.nfb.at/) within the Science Call 2015.

Conflicts of Interest

The authors declare no conflict of interest. The funders had no role in the design of the study; in the collection, analyses, or interpretation of data; in the writing of the manuscript, or in the decision to publish the results.

References

  1. Davidson, E.A.; Janssens, I.A. Temperature sensitivity of soil carbon decomposition and feedbacks to climate change. Nature 2006, 440, 165–173. [Google Scholar] [CrossRef] [PubMed]
  2. Batjes, N.H. Total carbon and nitrogen in the soils of the world. Eur. J. Soil Sci. 2014, 65, 10–21. [Google Scholar] [CrossRef]
  3. FAO. Available online: http://www.fao.org/faostat/en/#data/RL (accessed on 10 September 2017).
  4. Bread Wheat: Improvement and Production; Curtis, B.C.; Rajaram, S.; Gómez Macpherson, H.; Food and Agriculture Organization of the United Nations (Eds.) Plant Production and Protection Series; Food and Agriculture Organization of the United Nations: Rome, Italy, 2002; ISBN 978-92-5-104809-2. [Google Scholar]
  5. FAO. World Fertilizer Trends and Outlook to 2018. Available online: http://www.fao.org/3/a-i4324e.pdf (accessed on 10 September 2017).
  6. Jones, A.; Panagos, P.; Erhard, M.; Tóth, G.; Barcelo, S.; Bouraoui, F.; Bosco, C.; Dewitte, O.; Gardi, C.; Hervás, J.; et al. The State of Soil in Europe: A Contribution of the JRC to the European Environment Agency’s Environment State and Outlook Report—SOER 2010; Publications Office: Luxembourg, 2012; ISBN 978-92-79-22805-6. [Google Scholar]
  7. Regnier, P.; Friedlingstein, P.; Ciais, P.; Mackenzie, F.T.; Gruber, N.; Janssens, I.A.; Laruelle, G.G.; Lauerwald, R.; Luyssaert, S.; Andersson, A.J.; et al. Anthropogenic perturbation of the carbon fluxes from land to ocean. Nat. Geosci. 2013, 6, 597–607. [Google Scholar] [CrossRef]
  8. Battin, T.J.; Luyssaert, S.; Kaplan, L.A.; Aufdenkampe, A.K.; Richter, A.; Tranvik, L.J. The boundless carbon cycle. Nat. Geosci. 2009, 2, 598–600. [Google Scholar] [CrossRef]
  9. Alvarez-Cobelas, M.; Angeler, D.G.; Sánchez-Carrillo, S.; Almendros, G. A worldwide view of organic carbon export from catchments. Biogeochemistry 2012, 107, 275–293. [Google Scholar] [CrossRef]
  10. Graeber, D.; Gelbrecht, J.; Pusch, M.T.; Anlanger, C.; von Schiller, D. Agriculture has changed the amount and composition of dissolved organic matter in Central European headwater streams. Sci. Total Environ. 2012, 438, 435–446. [Google Scholar] [CrossRef]
  11. Wilson, H.F.; Xenopoulos, M.A. Effects of agricultural land use on the composition of fluvial dissolved organic matter. Nat. Geosci. 2009, 2, 37–41. [Google Scholar] [CrossRef]
  12. Bernhardt, E.S.; Likens, G.E. Dissolved Organic Carbon Enrichment Alters Nitrogen Dynamics in a Forest Stream. Ecology 2002, 83, 1689. [Google Scholar] [CrossRef]
  13. Fischer, H.; Sachse, A.; Steinberg, C.E.W.; Pusch, M. Differential retention and utilization of dissolved organic carbon by bacteria in river sediments. Limnol. Oceanogr. 2002, 47, 1702–1711. [Google Scholar] [CrossRef]
  14. Yamashita, Y.; Jaffé, R. Characterizing the Interactions between Trace Metals and Dissolved Organic Matter Using Excitation−Emission Matrix and Parallel Factor Analysis. Environ. Sci. Technol. 2008, 42, 7374–7379. [Google Scholar] [CrossRef]
  15. Tank, J.L.; Rosi-Marshall, E.J.; Griffiths, N.A.; Entrekin, S.A.; Stephen, M.L. A review of allochthonous organic matter dynamics and metabolism in streams. J. N. Am. Benthol. Soc. 2010, 29, 118–146. [Google Scholar] [CrossRef] [Green Version]
  16. Derenne, S.; Nguyen Tu, T.T. Characterizing the molecular structure of organic matter from natural environments: An analytical challenge. Comptes Rendus Geosci. 2014, 346, 53–63. [Google Scholar] [CrossRef]
  17. Lipson, D.A. The complex relationship between microbial growth rate and yield and its implications for ecosystem processes. Front. Microbiol. 2015, 6. [Google Scholar] [CrossRef] [PubMed] [Green Version]
  18. Wu, M.; Zhang, J.; Bao, Y.; Liu, M.; Jiang, C.; Feng, Y.; Li, Z. Long-term fertilization decreases chemical composition variation of soil humic substance across geographic distances in subtropical China. Soil Tillage Res. 2019, 186, 105–111. [Google Scholar] [CrossRef]
  19. Hosen, J.D.; McDonough, O.T.; Febria, C.M.; Palmer, M.A. Dissolved Organic Matter Quality and Bioavailability Changes Across an Urbanization Gradient in Headwater Streams. Environ. Sci. Technol. 2014, 48, 7817–7824. [Google Scholar] [CrossRef] [PubMed]
  20. Heinz, M.; Graeber, D.; Zak, D.; Zwirnmann, E.; Gelbrecht, J.; Pusch, M.T. Comparison of Organic Matter Composition in Agricultural versus Forest Affected Headwaters with Special Emphasis on Organic Nitrogen. Environ. Sci. Technol. 2015, 49, 2081–2090. [Google Scholar] [CrossRef]
  21. Stanley, E.H.; Powers, S.M.; Lottig, N.R.; Buffam, I.; Crawford, J.T. Contemporary changes in dissolved organic carbon (DOC) in human-dominated rivers: Is there a role for DOC management? Freshw. Biol. 2012, 57, 26–42. [Google Scholar] [CrossRef]
  22. Baldock, J.A.; Skjemstad, J.O. Role of the soil matrix and minerals in protecting natural organic materials against biological attack. Org. Geochem. 2000, 31, 697–710. [Google Scholar] [CrossRef]
  23. Silveira, M.L.A. Dissolved organic carbon and bioavailability of N and P as indicators of soil quality. Sci. Agric. 2005, 62, 502–508. [Google Scholar] [CrossRef]
  24. Vázquez-Ortega, A.; Hernandez-Ruiz, S.; Amistadi, M.K.; Rasmussen, C.; Chorover, J. Fractionation of Dissolved Organic Matter by (Oxy)Hydroxide-Coated Sands: Competitive Sorbate Displacement during Reactive Transport. Vadose Zone J. 2014, 13. [Google Scholar] [CrossRef] [Green Version]
  25. Qualls, R.G.; Richardson, C.J. Factors controlling concentration, export, and decomposition of dissolved organic nutrients in the Everglades of Florida. Biogeochemistry 2003, 62, 197–229. [Google Scholar] [CrossRef]
  26. Kravchenko, A.N.; Negassa, W.C.; Guber, A.K.; Rivers, M.L. Protection of soil carbon within macro-aggregates depends on intra-aggregate pore characteristics. Sci. Rep. 2015, 5. [Google Scholar] [CrossRef] [PubMed] [Green Version]
  27. Cleveland, C.C.; Neff, J.C.; Townsend, A.R.; Hood, E. Composition, Dynamics, and Fate of Leached Dissolved Organic Matter in Terrestrial Ecosystems: Results from a Decomposition Experiment. Ecosystems 2004, 7. [Google Scholar] [CrossRef]
  28. Neff, J.C.; Asner, G.P. Dissolved Organic Carbon in Terrestrial Ecosystems: Synthesis and a Model. Ecosystems 2001, 4, 29–48. [Google Scholar] [CrossRef] [Green Version]
  29. Fei, K.; Deng, L.; Zhang, L.; Sun, T.; Wu, Y.; Fan, X.; Dong, Y. Lateral transport of soil total carbon with slope runoff and interflow: Effects of rainstorm characteristics under simulated rainfall. CATENA 2019, 179, 39–48. [Google Scholar] [CrossRef]
  30. Tiemeyer, B.; Pfaffner, N.; Frank, S.; Kaiser, K.; Fiedler, S. Pore water velocity and ionic strength effects on DOC release from peat-sand mixtures: Results from laboratory and field experiments. Geoderma 2017, 296, 86–97. [Google Scholar] [CrossRef]
  31. Seifert, A.-G.; Roth, V.-N.; Dittmar, T.; Gleixner, G.; Breuer, L.; Houska, T.; Marxsen, J. Comparing molecular composition of dissolved organic matter in soil and stream water: Influence of land use and chemical characteristics. Sci. Total Environ. 2016, 571, 142–152. [Google Scholar] [CrossRef]
  32. Fang, H.; Cheng, S.; Yu, G.; Xu, M.; Wang, Y.; Li, L.; Dang, X.; Wang, L.; Li, Y. Experimental nitrogen deposition alters the quantity and quality of soil dissolved organic carbon in an alpine meadow on the Qinghai-Tibetan Plateau. Appl. Soil Ecol. 2014, 81, 1–11. [Google Scholar] [CrossRef]
  33. Xu, P.; Zhu, J.; Fu, Q.; Chen, J.; Hu, H.; Huang, Q. Structure and biodegradability of dissolved organic matter from Ultisol treated with long-term fertilizations. J. Soils Sediments 2018, 18, 1865–1872. [Google Scholar] [CrossRef]
  34. Ohno, T.; Bro, R. Dissolved Organic Matter Characterization Using Multiway Spectral Decomposition of Fluorescence Landscapes. Soil Sci. Soc. Am. J. 2006, 70, 2028. [Google Scholar] [CrossRef]
  35. De Feudis, M.; Cardelli, V.; Massaccesi, L.; Hofmann, D.; Berns, A.E.; Bol, R.; Cocco, S.; Corti, G.; Agnelli, A. Altitude affects the quality of the water-extractable organic matter (WEOM) from rhizosphere and bulk soil in European beech forests. Geoderma 2017, 302, 6–13. [Google Scholar] [CrossRef]
  36. Autio, I.; Soinne, H.; Helin, J.; Asmala, E.; Hoikkala, L. Effect of catchment land use and soil type on the concentration, quality, and bacterial degradation of riverine dissolved organic matter. Ambio 2016, 45, 331–349. [Google Scholar] [CrossRef] [PubMed] [Green Version]
  37. Ballabio, C.; Panagos, P.; Monatanarella, L. Mapping topsoil physical properties at European scale using the LUCAS database. Geoderma 2016, 261, 110–123. [Google Scholar] [CrossRef]
  38. BMBWF ZAMG- Zentralanstalt für Meterologie und Geodynamik. Available online: https://www.zamg.ac.at/cms/de/aktuell (accessed on 10 September 2017).
  39. BMLRT eHYD. Available online: www.ehyd.gv.at (accessed on 10 September 2017).
  40. ISO 10390:2005. Soil Quality—Determination of pH; International Organization for Standardization: Geneva, Switzerland, 2005. [Google Scholar]
  41. ISO 10694:1995. Soil Quality—Determination of Organic and Total Carbon After Dry Combustion (Elementary Analysis); International Organization for Standardization: Geneva, Switzerland, 1995. [Google Scholar]
  42. DIN EN ISO 10693:2014. SOIL QUALITY-DETERMINATION OF CARBONATE CONTENT—VOLUMETRIC METHOD (ISO 10693:1995); German Institute for Standardisation (Deutsches Institut für Normung): Geneva, Switzerland, 2014. [Google Scholar]
  43. ÖNORM EN 1484:2019 04 15. Wasseranalytik-Anleitung zur Bestimmung des gesamten organischen Kohlenstoffs (TOC) und des gelösten organischen Kohlenstoffs (DOC); Österreichisches Normungsinstitut: Wien, Austria, 1997. [Google Scholar]
  44. Carter, H.T.; Tipping, E.; Koprivnjak, J.-F.; Miller, M.P.; Cookson, B.; Hamilton-Taylor, J. Freshwater DOM quantity and quality from a two-component model of UV absorbance. Water Res. 2012, 46, 4532–4542. [Google Scholar] [CrossRef] [Green Version]
  45. ÖNORM EN ISO 10304-1. Wasserbeschaffenheit-Bestimmung von Gelösten Anionen Mittels Flüssigkeits-Ionenchromatographie-Teil 1: Bestimmung von Bromid, Chlorid, Fluorid, Nitrat, Nitrit, Phosphat und Sulfat (ISO 10304-1:2007); Österreichisches Normungsinstitut: Geneva, Switzerland, 2016. [Google Scholar]
  46. ÖNORM L. 1091. Chemische Bodenuntersuchungen-Bestimmung von Mineralischem Stickstoff-Nmin-Methode; Österreichisches Normungsinstitut: Wien, Austria, 1999. [Google Scholar]
  47. Schindler, U.; Durner, W.; von Unold, G.; Mueller, L.; Wieland, R. The evaporation method: Extending the measurement range of soil hydraulic properties using the air-entry pressure of the ceramic cup. J. Plant Nutr. Soil Sci. 2010, 173, 563–572. [Google Scholar] [CrossRef]
  48. ÖNORM EN ISO 11272. Bodenbeschaffenheit-Bestimmung der Trockenrohdichte (ISO 11272:2017); Österreichisches Normungsinstitut: Geneva, Switzerland, 2017. [Google Scholar]
  49. ISO 11277. Soil Quality-Determination of Particle Size Distribution in Mineral Soil Material-Method by Sieving and Sedimentation; International Organization for Standardization: Geneva, Switzerland, 1998. [Google Scholar]
  50. Working Group WRB, IUSS. World Reference Base for Soil Resources 2014, update 2015 Internation Soil Classifcation System for Naming Soils and Creating Legends for Soil Maps; World Soil Resources Reports No. 106; FAO: Rome, Italy, 2015; ISBN E-ISBN 978-92-5-108370-3. [Google Scholar]
  51. McKnight, D.M.; Boyer, E.W.; Westerhoff, P.K.; Doran, P.T.; Kulbe, T.; Andersen, D.T. Spectrofluorometric characterization of dissolved organic matter for indication of precursor organic material and aromaticity. Limnol. Oceanogr. 2001, 46, 38–48. [Google Scholar] [CrossRef]
  52. Chin, Y.P.; Aiken, G.; O’Loughlin, E. Molecular Weight, Polydispersity, and Spectroscopic Properties of Aquatic Humic Substances. Environ. Sci. Technol. 1994, 28, 1853–1858. [Google Scholar] [CrossRef]
  53. Murphy, K.R.; Stedmon, C.A.; Graeber, D.; Bro, R. Fluorescence spectroscopy and multi-way techniques. PARAFAC. Anal. Methods 2013, 5, 6557. [Google Scholar] [CrossRef] [Green Version]
  54. Pucher, M.; Wünsch, U.; Weigelhofer, G.; Murphy, K.; Hein, T.; Graeber, D. staRdom: Versatile Software for Analyzing Spectroscopic Data of Dissolved Organic Matter in R. Water 2019, 11, 2366. [Google Scholar] [CrossRef] [Green Version]
  55. R: A Language and Environment for Statistical Computing; Version 2.6.2; R Core Team: Vienna, Austria, 2019.
  56. Huguet, A.; Vacher, L.; Relexans, S.; Saubusse, S.; Froidefond, J.M.; Parlanti, E. Properties of fluorescent dissolved organic matter in the Gironde Estuary. Org. Geochem. 2009, 40, 706–719. [Google Scholar] [CrossRef]
  57. Coble, P.G. Characterization of marine and terrestrial DOM in seawater using excitation-emission matrix spectroscopy. Mar. Chem. 1996, 51, 325–346. [Google Scholar] [CrossRef]
  58. Ohno, T. Fluorescence Inner-Filtering Correction for Determining the Humification Index of Dissolved Organic Matter. Environ. Sci. Technol. 2002, 36, 742–746. [Google Scholar] [CrossRef] [PubMed]
  59. Helms, J.R.; Stubbins, A.; Ritchie, J.D.; Minor, E.C.; Kieber, D.J.; Mopper, K. Absorption spectral slopes and slope ratios as indicators of molecular weight, source, and photobleaching of chromophoric dissolved organic matter. Limnol. Oceanogr. 2008, 53, 955–969. [Google Scholar] [CrossRef] [Green Version]
  60. Twardowski, M.S.; Boss, E.; Sullivan, J.M.; Donaghay, P.L. Modeling the spectral shape of absorption by chromophoric dissolved organic matter. Mar. Chem. 2004, 89, 69–88. [Google Scholar] [CrossRef]
  61. Oksanen, J.; Blanchet, F.G.; Kindt, R.; Legendre, P.; O’Hara, R.G.; Simpson, G.; Solymos, P.; Stevens, H.; Wagner, H. Multivariate Analysis of Ecological Communities in R: Vegan Tutorial. R Package Version 1.7; University of Oulu: Oulu, Finland, 2013. [Google Scholar]
  62. Van den Brink, P.J.; Braak, C.J.F.T. Principal response curves: Analysis of time-dependent multivariate responses of biological community to stress. Environ. Toxicol. Chem. 1999, 18, 138–148. [Google Scholar] [CrossRef]
  63. Romero, C.M.; Engel, R.E.; D’Andrilli, J.; Chen, C.; Zabinski, C.; Miller, P.R.; Wallander, R. Bulk optical characterization of dissolved organic matter from semiarid wheat-based cropping systems. Geoderma 2017, 306, 40–49. [Google Scholar] [CrossRef] [Green Version]
  64. Tfaily, M.M.; Corbett, J.E.; Wilson, R.; Chanton, J.P.; Glaser, P.H.; Cawley, K.M.; Jaffé, R.; Cooper, W.T. Utilization of PARAFAC-Modeled Excitation-Emission Matrix (EEM) Fluorescence Spectroscopy to Identify Biogeochemical Processing of Dissolved Organic Matter in a Northern Peatland. Photochem. Photobiol. 2015, 91, 684–695. [Google Scholar] [CrossRef]
  65. Williams, C.J.; Yamashita, Y.; Wilson, H.F.; Jaffé, R.; Xenopoulos, M.A. Unraveling the role of land use and microbial activity in shaping dissolved organic matter characteristics in stream ecosystems. Limnol. Oceanogr. 2010, 55, 1159–1171. [Google Scholar] [CrossRef]
  66. Chai, L.; Huang, M.; Fan, H.; Wang, J.; Jiang, D.; Zhang, M.; Huang, Y. Urbanization altered regional soil organic matter quantity and quality: Insight from excitation emission matrix (EEM) and parallel factor analysis (PARAFAC). Chemosphere 2019, 220, 249–258. [Google Scholar] [CrossRef]
  67. Ziegelgruber, K.L.; Zeng, T.; Arnold, W.A.; Chin, Y.-P. Sources and composition of sediment pore-water dissolved organic matter in prairie pothole lakes. Limnol. Oceanogr. 2013, 58, 1136–1146. [Google Scholar] [CrossRef]
  68. Stedmon, C.A.; Markager, S. Resolving the variability in dissolved organic matter fluorescence in a temperate estuary and its catchment using PARAFAC analysis. Limnol. Oceanogr. 2005, 50, 686–697. [Google Scholar] [CrossRef]
  69. Olefeldt, D.; Devito, K.J.; Turetsky, M.R. Sources and fate of terrestrial dissolved organic carbon in lakes of a Boreal Plains region recently affected by wildfire. Biogeosciences 2013, 10, 6247–6265. [Google Scholar] [CrossRef] [Green Version]
  70. Cory, R.M.; McKnight, D.M. Fluorescence Spectroscopy Reveals Ubiquitous Presence of Oxidized and Reduced Quinones in Dissolved Organic Matter. Environ. Sci. Technol. 2005, 39, 8142–8149. [Google Scholar] [CrossRef] [PubMed]
  71. Gao, S.-J.; Zhao, C.; Shi, Z.-H.; Zhong, J.; Liu, J.-G.; Li, J.-Q. Spectroscopic Characteristics of Dissolved Organic Matter in Afforestation Forest Soil of Miyun District, Beijing. J. Anal. Methods Chem. 2016, 2016, 1480857. [Google Scholar] [CrossRef]
  72. Fellman, J.B.; Hood, E.; Spencer, R.G.M. Fluorescence spectroscopy opens new windows into dissolved organic matter dynamics in freshwater ecosystems: A review. Limnol. Oceanogr. 2010, 55, 2452–2462. [Google Scholar] [CrossRef]
  73. Sjöberg, G.; Bergkvist, B.; Berggren, D.; Nilsson, S.I. Long-term N addition effects on the C mineralization and DOC production in mor humus under spruce. Soil Biol. Biochem. 2003, 35, 1305–1315. [Google Scholar] [CrossRef]
  74. Lu, X.; Gilliam, F.S.; Yu, G.; Li, L.; Mao, Q.; Chen, H.; Mo, J. Long-term nitrogen addition decreases carbon leaching in a nitrogen-rich forest ecosystem. Biogeosciences 2013, 10, 3931–3941. [Google Scholar] [CrossRef] [Green Version]
  75. Long, G.-Q.; Jiang, Y.-J.; Sun, B. Seasonal and inter-annual variation of leaching of dissolved organic carbon and nitrogen under long-term manure application in an acidic clay soil in subtropical China. Soil Tillage Res. 2015, 146, 270–278. [Google Scholar] [CrossRef]
  76. Lloyd, C.E.M.; Michaelides, K.; Chadwick, D.R.; Dungait, J.A.J.; Evershed, R.P. Tracing the flow-driven vertical transport of livestock-derived organic matter through soil using biomarkers. Org. Geochem. 2012, 43, 56–66. [Google Scholar] [CrossRef]
  77. Adams, A.B.; Harrison, R.B.; Sletten, R.S.; Strahm, B.D.; Turnblom, E.C.; Jensen, C.M. Nitrogen-fertilization impacts on carbon sequestration and flux in managed coastal Douglas-fir stands of the Pacific Northwest. For. Ecol. Manag. 2005, 220, 313–325. [Google Scholar] [CrossRef]
  78. Don, A.; Schulze, E.-D. Controls on fluxes and export of dissolved organic carbon in grasslands with contrasting soil types. Biogeochemistry 2008, 91, 117–131. [Google Scholar] [CrossRef] [Green Version]
  79. De Troyer, I.; Merckx, R.; Amery, F.; Smolders, E. Factors Controlling the Dissolved Organic Matter Concentration in Pore Waters of Agricultural Soils. Vadose Zone J. 2014, 13, 1–9. [Google Scholar] [CrossRef]
  80. Huang, Z.; Lv, J.; Cao, D.; Zhang, S. Iron plays an important role in molecular fractionation of dissolved organic matter at soil-water interface. Sci. Total Environ. 2019, 670, 300–307. [Google Scholar] [CrossRef] [PubMed]
  81. Nguyen, T.-T.; Marschner, P. Retention and loss of water extractable carbon in soils: Effect of clay properties. Sci. Total Environ. 2014, 470–471, 400–406. [Google Scholar] [CrossRef]
  82. Singh, M.; Sarkar, B.; Sarkar, S.; Churchman, J.; Bolan, N.; Mandal, S.; Menon, M.; Purakayastha, T.J.; Beerling, D.J. Stabilization of Soil Organic Carbon as Influenced by Clay Mineralogy. In Advances in Agronomy; Elsevier: Amsterdam, The Netherlands, 2018; Volume 148, pp. 33–84. ISBN 978-0-12-815179-2. [Google Scholar]
  83. Avneri-Katz, S.; Young, R.B.; McKenna, A.M.; Chen, H.; Corilo, Y.E.; Polubesova, T.; Borch, T.; Chefetz, B. Adsorptive fractionation of dissolved organic matter (DOM) by mineral soil: Macroscale approach and molecular insight. Org. Geochem. 2017, 103, 113–124. [Google Scholar] [CrossRef] [Green Version]
  84. Bolan, N.S.; Adriano, D.C.; Kunhikrishnan, A.; James, T.; McDowell, R.; Senesi, N. Dissolved Organic Matter. In Advances in Agronomy; Elsevier: Amsterdam, The Netherlands, 2011; Volume 110, pp. 1–75. ISBN 978-0-12-385531-2. [Google Scholar]
  85. Lei, Z.; Sun, H.; Li, Q.; Zhang, J.; Song, X. Effects of Nitrogen Deposition on Soil Dissolved Organic Carbon and Nitrogen in Moso Bamboo Plantations Strongly Depend on Management Practices. Forests 2017, 8, 452. [Google Scholar] [CrossRef] [Green Version]
  86. Wang, Q.K.; Wang, S.L.; Liu, Y.X. Responses to N and P fertilization in a young Eucalyptus dunnii plantation: Microbial properties, enzyme activities and dissolved organic matter. Appl. Soil Ecol. 2008, 40, 484–490. [Google Scholar] [CrossRef]
  87. Kaiser, K.; Kalbitz, K. Cycling downwards—Dissolved organic matter in soils. Soil Biol. Biochem. 2012, 52, 29–32. [Google Scholar] [CrossRef]
  88. Zhang, X.; Li, Z.; Nie, X.; Huang, M.; Wang, D.; Xiao, H.; Liu, C.; Peng, H.; Jiang, J.; Zeng, G. The role of dissolved organic matter in soil organic carbon stability under water erosion. Ecol. Indic. 2019, 102, 724–733. [Google Scholar] [CrossRef]
  89. Ferrari, E.; Francioso, O.; Nardi, S.; Saladini, M.; Ferro, N.D.; Morari, F. DRIFT and HR MAS NMR characterization of humic substances from a soil treated with different organic and mineral fertilizers. J. Mol. Struct. 2011, 998, 216–224. [Google Scholar] [CrossRef]
  90. McDowell, W.H.; Magill, A.H.; Aitkenhead-Peterson, J.A.; Aber, J.D.; Merriam, J.L.; Kaushal, S.S. Effects of chronic nitrogen amendment on dissolved organic matter and inorganic nitrogen in soil solution. For. Ecol. Manag. 2004, 196, 29–41. [Google Scholar] [CrossRef]
  91. Li, X.-M.; Chen, Q.-L.; He, C.; Shi, Q.; Chen, S.-C.; Reid, B.J.; Zhu, Y.-G.; Sun, G.-X. Organic Carbon Amendments Affect the Chemodiversity of Soil Dissolved Organic Matter and Its Associations with Soil Microbial Communities. Environ. Sci. Technol. 2019, 53, 50–59. [Google Scholar] [CrossRef] [PubMed] [Green Version]
  92. Zang, H.; Blagodatskaya, E.; Wang, J.; Xu, X.; Kuzyakov, Y. Nitrogen fertilization increases rhizodeposit incorporation into microbial biomass and reduces soil organic matter losses. Biol. Fertil. Soils 2017, 53, 419–429. [Google Scholar] [CrossRef]
Figure 1. Mean (±standard deviation; SD) dissolved organic carbon (DOC) in the soil leachate: (A): Mean (±SD) total DOC amount: a summation of all time series within each treatment (left: sandy loam; right: silt loam); statistical significance of difference between treatments within the soil textures are indicated with letters (Tukey; p ≤ 0.05; Silt loam: n = 21, sandy loam: n = 28). (B,C): Temporal response curve of the mean (±SD) DOC concentration in the soil leachate percolating through silt loam ((B), n = 3) and sandy loam ((C), n = 4); Shapes indicating different fertilizer application: control (circle); mineral (triangle) and organic (square).
Water 12 01617 g001
Figure 2. Mean (±SD) nitrate (NO3) of the soil leachate: (A): Mean (±SD) totally NO3 amount: a summation of all time series within each treatment (left: sandy loam; right: silt loam); statistical significance of difference between treatments are indicated with letters (Tukey; p ≤ 0.05; silt loam: n = 21, sandy loam: n = 28). (B,C): temporal response curve of the mean (±SD) NO3 concentration in the soil leachate percolating through silt loam ((B), n = 3) and sandy loam ((C), n = 4). Shapes indicating different fertilizer application: control (circle); mineral (triangle) and organic (square).
Water 12 01617 g002
Figure 3. The first component of the principal response curves (PRC) of the silt loam (left) and sandy loam (right) DOM dataset are shown, using the control soil core as an internal reference (indicated by 0; grey line). The species weights shown in the right part of each PCR. Secondary axis shows the affinity of each indices with the response shown in each figure. For the sake of clarity, only species with a species weight larger than +0.5 or smaller than –0.5 are shown. The effect of DOM to fertilization is indicated by the resulting response curves (1 (black line) = organic; 2 (red dashed line) = mineral).
Water 12 01617 g003
Figure 4. Effects of fertilizer type on dissolved organic matter (DOM) composition percolating through silt loam (left) and sandy loam (right). Mean (±SD) values of indices describing the size of the molecule (E2:E3; first line), humic-like component (C1; second line), protein-like component (C5, third line) and the degree of microbial activity (BIX; last line) over time are displayed (silty loam: n = 3; sandy loam: n = 4).
Water 12 01617 g004
Table 1. Statistical results testing the effects of soil texture (soil), fertilizer type and time (days) on the concentration of leached nutrients (TOC, DOC, NO3) as well as on the optical properties of the leached organic matter (DOM composition) by using repeated measures MANOVA and permutational MANOVA (PERMANOVA) are given. Interaction between factors are marked with *.
FactorRepeated Measures MANOVAPERMANOVA
TOCDOCNO3ClECpHDOM Composition
p-Valuep-Valuep-Valuep-Valuep-Valuep-Valuep-ValueR2
Soil texture<0.0010.0090.001<0.001<0.001<0.001<0.0010.132
Fertilizer type <0.001<0.001<0.001<0.001<0.0010.093<0.0010.085
days<0.001<0.001<0.0010.673<0.001<0.001<0.0010.213
Soil * fertilizer type0.011<0.0010.6360.6730.4570.912<0.0010.067
Soil * days<0.001<0.001<0.001<0.001<0.001<0.001<0.0010.275
Fertilizer * days<0.001<0.001<0.001<0.001<0.0010.256<0.0010.066
Soil * Fertilizer type * Days<0.001<0.0010.0280.2320.1460.777<0.0010.042
Residuals0.119
TOC, total organic carbon; DOC, dissolved organic carbon; NO3, nitrate; Cl, Chloride; EC, electrical conductivity; MANOVA, repeated measures analysis of variance.
Table 2. Four components (C1–4) are identified by parallel factor analysis (PARAFAC) modeling. Range and maximum of emission and excitation wavelengths (nm) are given; Secondary peaks are displayed in brackets; including previous identification by literature.
ComponentEmission (nm)Excitation (nm)Beforehand Identified as:
1420–500
475
245–430
245 (360)
Humic-like [10,57,65]; oxidized quinone-like [66]; Terrestrial or ubiquitous [57,65] derived from organic matter (OM) from plant and soil [67]
2350–450
390
245–380
<245 (320)
Humic-like [10,63,65]; terrestrial [68] fulvic/humic [69] microbially altered DOM [64]
3360–510
425
245–320
<245
Humic-like [10,65] terrestrial OM products, mainly forest and wetlands [68] oxidized quinones-like [70]
4 320–400
350
245–330
280 (245)
Tryptophan-like [10,71], microbial processing; Protein-tannin-like [63], amino acids, free or bound in proteins; indicate intact proteins or less degraded peptide material [72]

