Changes in Extreme Precipitation across 30 Global River Basins


1
School of Civil Engineering and Transportation, South China University of Technology, Guangzhou 510641, China
2
State Key Laboratory of Subtropical Building Science, South China University of Technology, Guangzhou 510641, China
3
State Key Laboratory of Water Resources and Hydropower Engineering Science, Wuhan University, Wuhan 430072, China
4
China Water Resources Pearl River Planning Surveying & Designing Co., LTD., Guangzhou 510640, China
*
Author to whom correspondence should be addressed.
Water 2020, 12(6), 1527; https://doi.org/10.3390/w12061527
Submission received: 8 May 2020
/
Revised: 23 May 2020
/
Accepted: 25 May 2020
/
Published: 27 May 2020
Abstract
:Extreme precipitation can cause disasters such as floods, landslides and crop destruction. A further study on extreme precipitation is essential for enabling reliable projections of future changes. In this study, the trends and frequency distribution changes in extreme precipitation across different major river basins around the world during 1960–2011 were examined based on two of the latest observational data sets respectively collected from 110,000 and 26,592 global meteorological stations. The results showed that approximately a quarter of basins have experienced statistically significant increase in maximum consecutive one-day, three-day and five-day precipitation (RX1day, RX3day and RX5day, respectively). In particular, dramatic increases were found in the recent decade for the Syr Darya River basin (SDR) and Amu Darya River basin (ADR) in the Middle East, while a decrease in RX3day and RX5day were seen over the Amur River basin in East Asia. One third of basins showed remarkable changes in frequency distributions of the three indices, and in most cases the distributions shifted toward larger amounts of extreme precipitation. Relative to the subperiod of 1960–1984, wider range of the three indices over SDR and ADR were detected for 1985–2011, indicating intensification along with larger fluctuations of extreme precipitation. However, some basins have frequency distributions shifting toward smaller amounts of RX3day and RX5day, such as the Columbia River basin and the Yellow River basin. The study has potential to provide the most up-to-date and comprehensive global picture of extreme precipitation, which help guide wiser public policies in future to mitigate the effects of these changes across global river basins.
1. Introduction
Flood, landslide and soil erosion triggered by extreme precipitation are among the major hazards that pose threats to society and the environment [1,2,3,4,5,6,7]. The understanding of extreme precipitation features is beneficial for the forecasting and management of these hazards. However, extreme precipitation is becoming substantially more intense and unpredictable, with larger fluctuations than the past largely due to climate change, and it always displays high spatiotemporal heterogeneity [8,9,10,11]. Exploring extreme precipitation behaviors across various regions enables a comprehensive understanding of how it changes in space and time under the changing environment [12,13].
A variety of literatures have revealed extreme precipitation changes at different spatial scales. Alexander et al. (2006) examined global trends and probability distributions of extreme precipitation, showing that extreme precipitation has increased on the whole for the 20th century, but the probability distribution of maximum one-day precipitation (RX1day) does not exhibit remarkable changes [11]. Asadieh and Krakauer (2014) analyzed trends in global extreme precipitation and found that both observations and models show generally upward trends in extreme precipitation since the beginning of 1900s, and the changes for tropic regions are the largest [14]. Through using a global atmospheric model for forecasting of extreme precipitation, Akio et al. (2016) showed that RX1day and maximum five-day precipitation (RX5day) are increasing even though the mean precipitation is decreasing [15]. Shi and Durran (2016) held the viewpoint that, in mountainous regions, the sensitivity of extreme precipitation to global warming is lower than in oceanic regions or plains [16]. Zhang and Zhou (2019) stated that, for global monsoon regions, extreme precipitation is on the rise and its correlation with warming climate is distinctive [17].
Regionally, in North America, a study has revealed a strong relationship between extreme precipitation and hurricane activities based on a 25-year observational analysis [18]. Costa and Soares (2007) assessed the uncertainty of spatiotemporal interpolation of an extreme precipitation index using the southern region of continental Portugal as an example and made conclusions of a higher spatial continuity of extreme precipitation but a weaker relationship between altitude and the index in recent decades [19]. Vyshkvarkova and Voskresenskaya (2018) pointed out an abnormal phenomenon over the southern Russia where the wetting trend is negligible, not necessarily following the global overall upward trend of extreme precipitation [20]. A similar phenomenon is found for the Northwestern Highlands of Ethiopia, where evidence of increasing extreme precipitation is lacking [21]. Over eastern Asia, Gayoung et al. (2018) projected the average and extreme precipitation intensity in Korea in future and found an increased intensity for the future period 2021–2100 compared to the present [22]. For China, there are also many studies regarding extreme precipitation across different regions. For example, Wu et al. (2016) investigated extreme precipitation characteristics over 11 basins in China and revealed strengthened RX1day in the Liaohe River Basin (LB) together with strengthened RX5day in the Songhua River Basin [23]. Another example is the study of Wang et al. (2015) which explored seasonal extreme precipitation changes over the arid regions of northwest China [24]. In India, Gupta and Jain (2020) discovered that the annual total precipitation is decreasing, while extreme precipitation shows an opposite trend [25].
Although the aforementioned studies provide beneficial information on extreme precipitation features, most of them are regional and their conclusions may not completely agree because of the use of varying indices, data sets, methodologies and study periods. Compared to regional studies, global studies enable a direct comparison of extreme precipitation characteristics across different regions and can provide a large-scale picture of extreme precipitation characterization [26,27]. However, there are relatively few global-scale literatures at present and, more importantly, the existing studies seldom investigate extreme precipitation characteristics (e.g., frequency or probability distributions) from different subperiods, but rather, from the whole period of record, which hampers the formulation of integrated information regarding changing properties of extreme precipitation under the backdrop of climate change. Furthermore, there is no systematic study of extreme precipitation over various river basins worldwide. From the hydrological perspective, flood analyses rely on precipitation conditions within a basin rather than in a region, country, or continent [28]. The lack of sufficient knowledge on extreme precipitation over different basins across the globe has restricted governors or river managers from making flood adaptations and mitigation strategies appropriate to each basin.
To overcome the shortage, we set out to reveal trends and frequency distribution changes in extreme precipitation across different major river basins globally. Our study aims to draw the most up-to-date and comprehensive global picture of extreme precipitation at the basin scale which would be beneficial for river flood managements over different basins around the world.
2. Materials and Methods
2.1. Sourced Data and Global Basins
Daily precipitation data used in this study came from two sources; one is the data covering 1929–present generated from more than 110,000 meteorological stations around the world, which were obtained from the National Oceanic and Atmospheric Administration (https://www.ncei.noaa.gov/data/global-summary-of-the-day/archive/), and the other is the data for the period 1929–2017 obtained from the National Climate Data Center GSOD dataset produced by the National Centers for Environmental Information, covering 26,592 stations globally (https://www.ncdc.noaa.gov/). Most of the analyses in the current study were based on the first data set and the second data set was served as the complementary one; if there is no data from the first data set for a specific basin, or the data are less sufficient than the GSOD data set, then the GSOD data are used instead. Meanwhile, before the data were used, a quality control procedure was applied, including examination of internal consistency, and suspected and erroneous data. To reduce errors caused by insufficient sampling and record length, we chose 9181 stations with near-continuous (less than 10% of missing data each year) observations during 1960–2011 in which the missing data are minimum.
There are a wide range of river basins around the world and we paid special attention to the top 60 basins ranked by their drainage areas. However, some of the basins suffer from insufficient meteorological stations (the ones selected from the quality control procedure). Finally, 30 major basins were selected which are in different continents. Details of the basins are listed in Table 1.
2.2. Extreme Precipitation Indices
In this study, three indices were selected to characterize extreme precipitation, namely, annual maximum consecutive one-day, three-day, and five-day precipitation (RX1day, RX3day, and RX5day, respectively). RX1day is defined as the maximum daily precipitation in a year, and RX3day is defined as the maximum consecutive three-day precipitation in a year; RX5day is referred to as the maximum consecutive five-day precipitation in a year [20]. RX1day events usually represent extreme showers that can induce flash floods, while RX3day and RX5day events are more indicative of wet periods which can trigger high water levels in large-scale basins [20]. Moreover, these indices are considered suitable for characterizing extreme heavy precipitation that has devastating impacts on society and the environment, and is typically used to represent the probability of rare events during the design of infrastructure and in other applications. The three indices are now widely used for the analysis of extreme precipitation over different regions [29,30].
2.3. Linear Trend Analysis
We employed the linear regression for the trend analyses. It is a relatively simple but robust trend analysis method that is commonly used [31,32,33]. The linear function can be given by:
where is the regression coefficient signifying the slope of the trend, is the constant and is the noise term. The Kolmogorov–Smirnov test was applied to determining the significance of trends (the 0.05 significance level) [34].
3. Results
3.1. Trend
Figure 1 shows the basins with significant trends in RX1day (insignificant trend results were not presented for simplicity). In North America, basin #14 has experienced significant increase in RX1day with a rate of 0.82 mm/year, and the maxima is found around the 1980s. In Europe, a significant upward trend is seen over basin #5, where the maxima of RX1day occurred around 2000s reaching to approximately 250 mm. However, for other European basins, no significant trend exists. It is noteworthy that basins #15 and #16 in the Middle East have encountered large fluctuations of RX1day since 2000, particularly in the recent years. These are tending toward increasing trends; the maxima occurred in 2010. The overall trends during 1960–2011 are 3.11 mm/year and 4.13 mm/year, respectively. By comparison, although RX1day over basin #8 also displays a significant upward trend, the slope is only 0.18 mm/year. For North and East Asia, significant upward trends are visible in basins #1 and #21. More specifically, the trend slope of basin #1 is larger than that of basin #21. Basin #27, located in South Africa, presents an increase in RX1day and the trend becomes steeper after 2000.
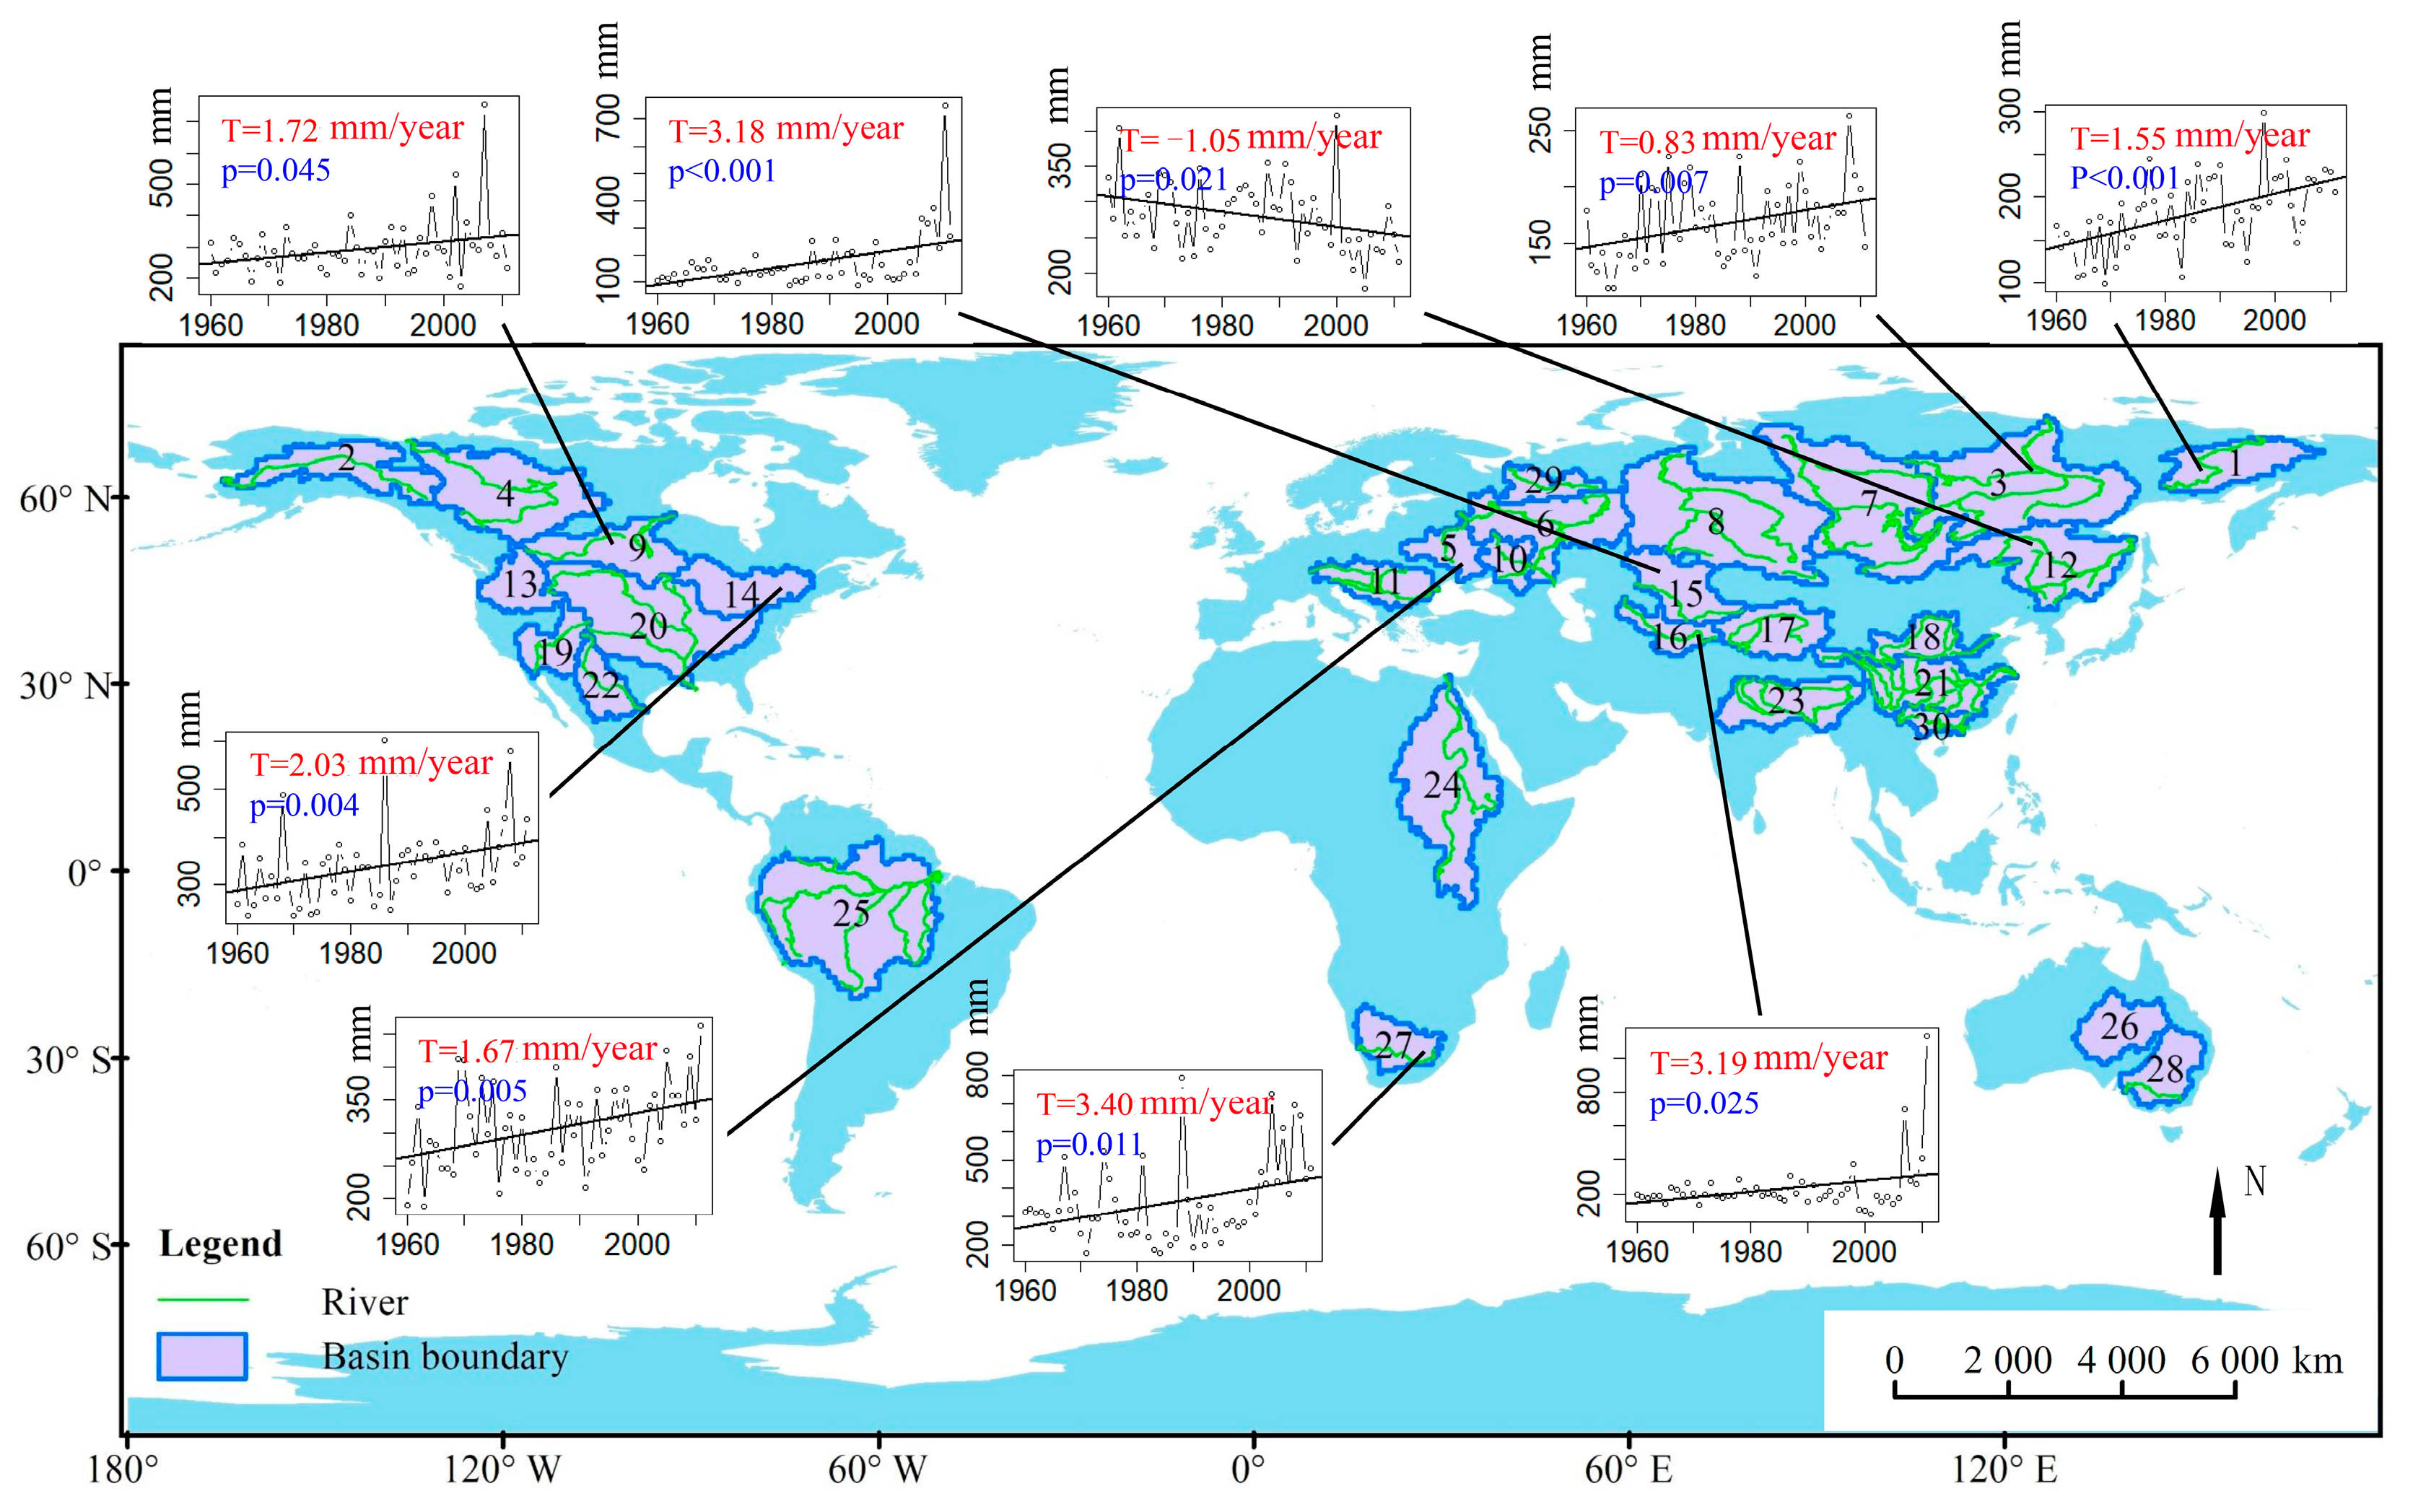
Figure 2 depicts the basins with significant trends in RX3day. Apparently, the trends of RX3day over basins #1, #5, #14, #15, #16 and #27 are similar to those of RX1day, which are significantly upward. Specifically, the interannual fluctuation patterns of RX1day and RX3day are similar in basins #14, #15 and #16. In addition, RX3day over basins #15 and #16 has increased dramatically in the most recent decade, and the maxima in basin #16 observed in 2011 exceeds 1000 mm. On the other hand, there are some basins where RX3day shows significant upward trends but RX1day does not, including basins #3 and #9, where the trend slopes are 0.83 mm/year and 1.72 mm/year, respectively. It is noted that RX3day in basin #12, located in East Asia, exhibits a significant downward trend during 1960–2011, different from those in the other basins; the changing slope is −1.05 mm/year with a p value of 0.021 and the decreasing trend is more apparent after 1990 than before. Also note that some basins do not show significant trends in RX3day but RX1day, for example basins #8 and #21.
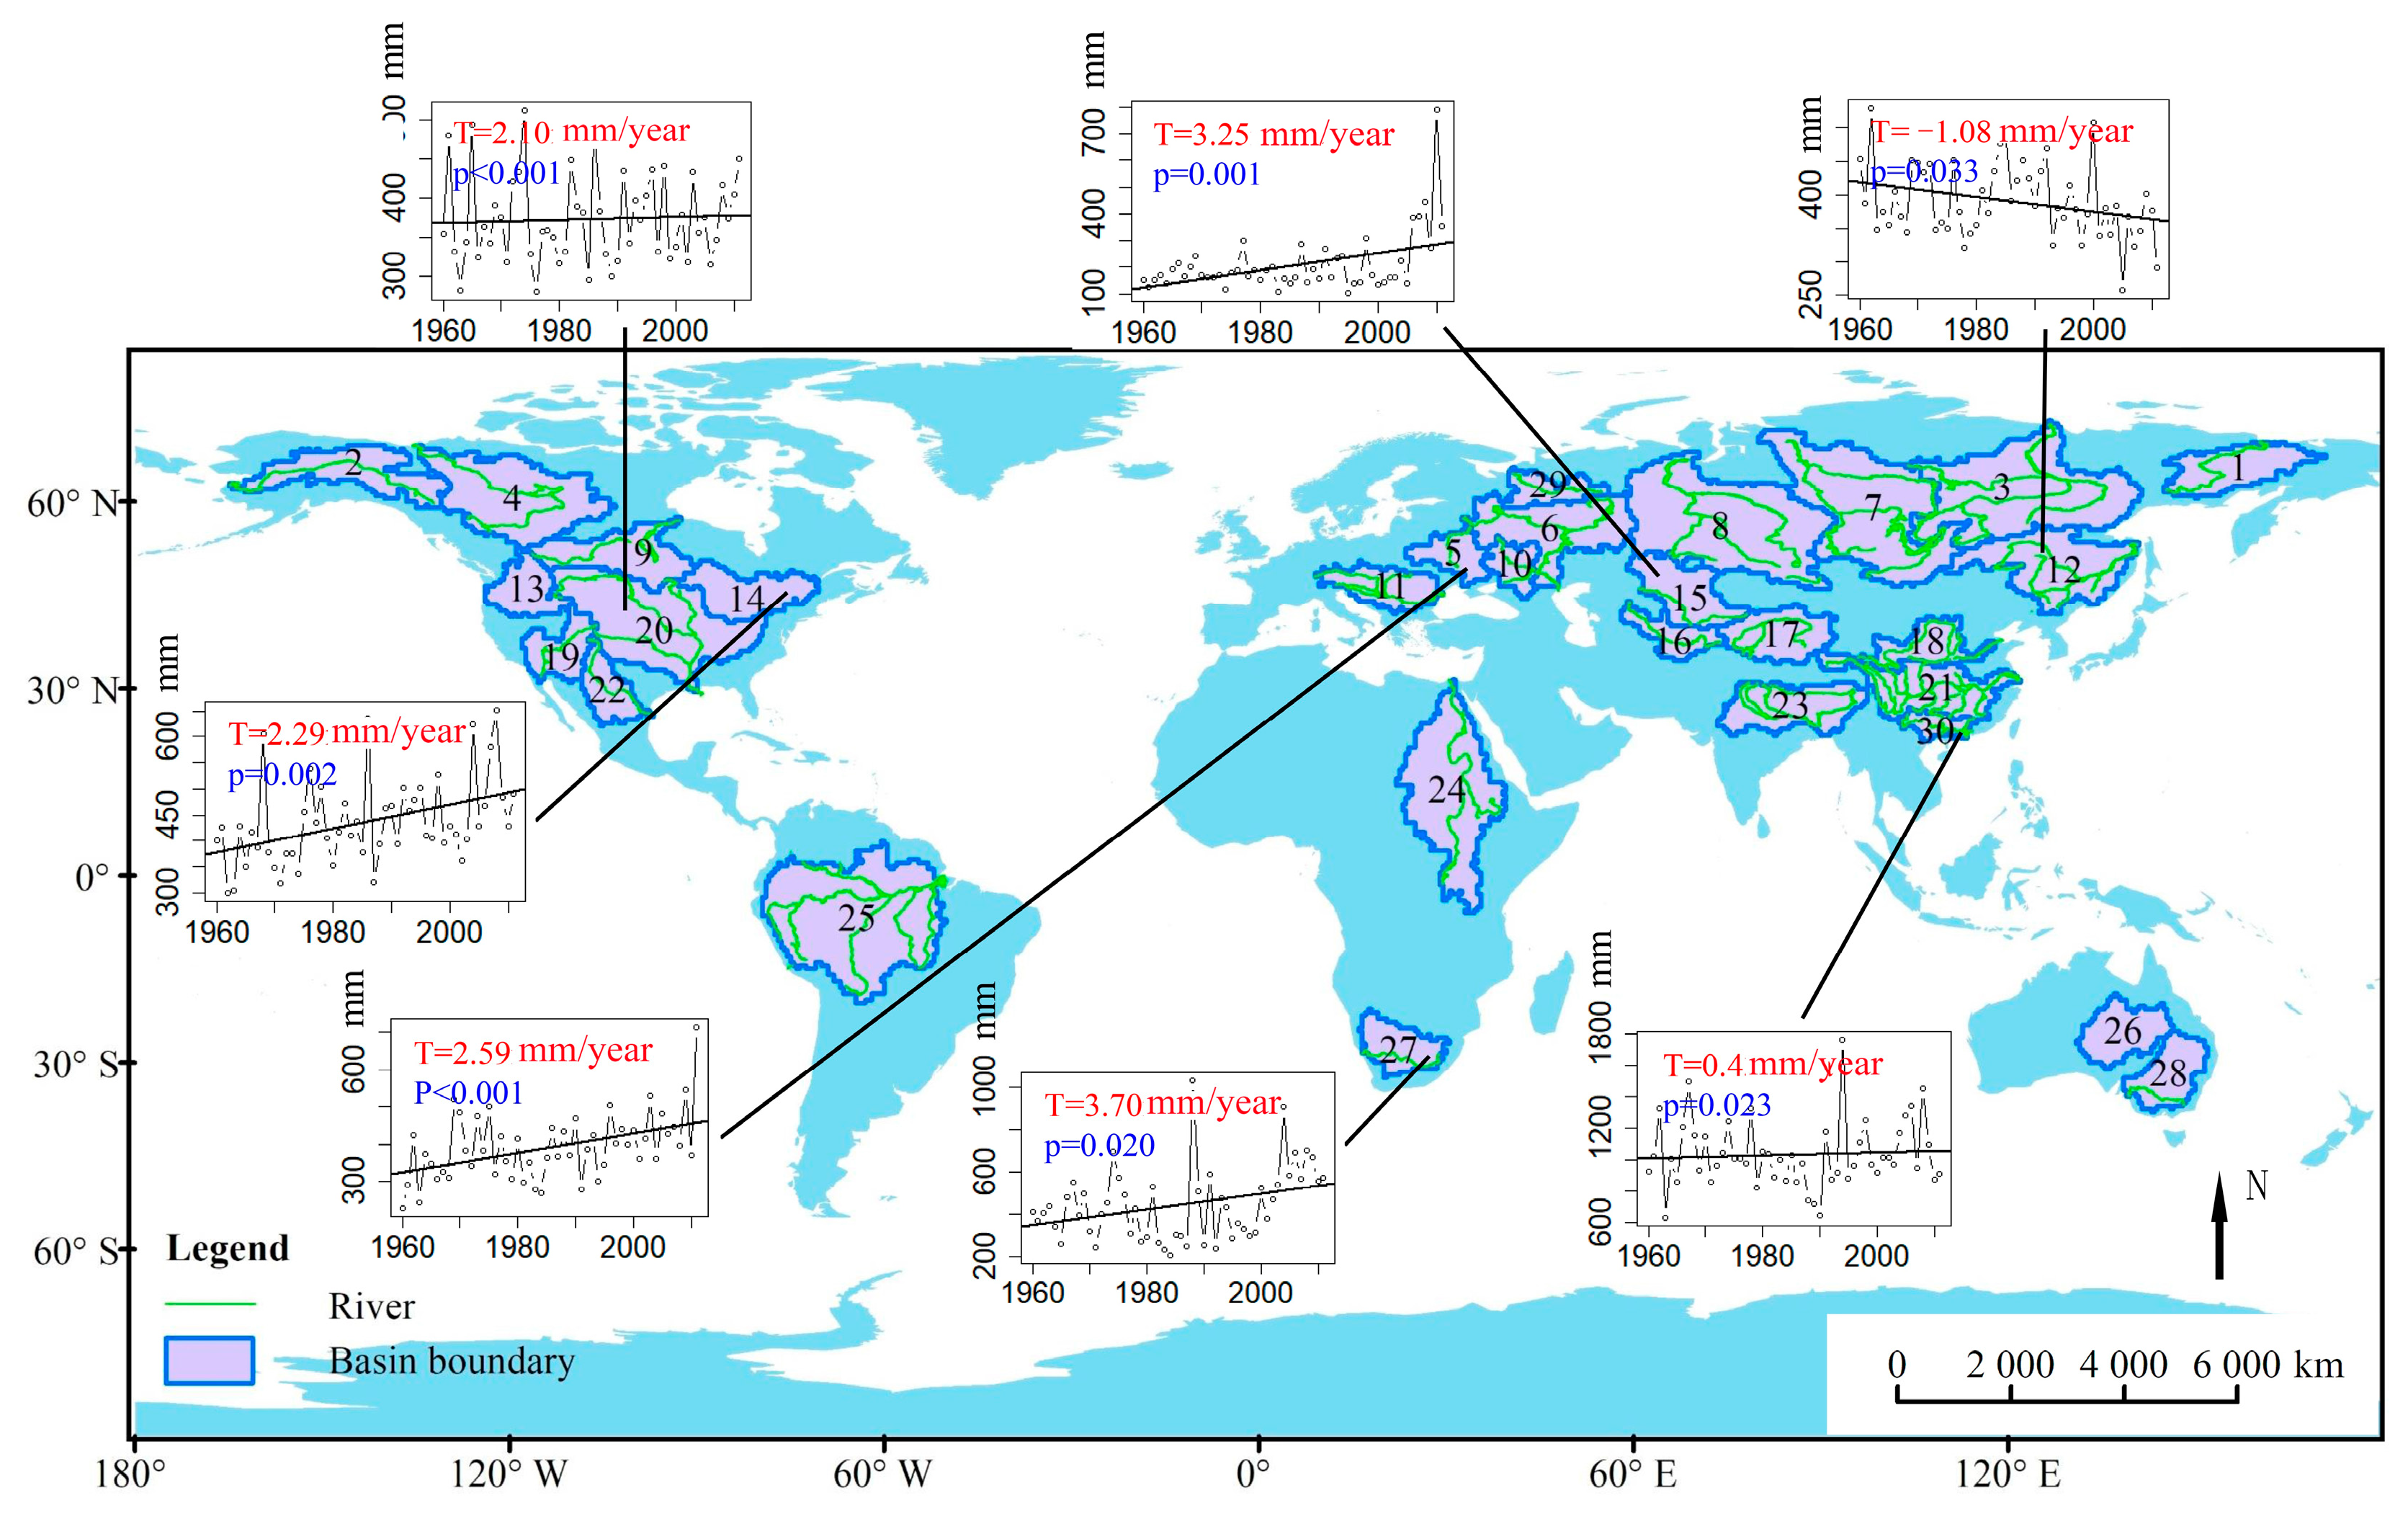
Figure 3 illustrates significant trends in RX5day for some basins. The trends over #5, #12, #14, #15, and #27 basins are similar with RX3day trends, with the one over basin #12 in East Asia being significantly downward and the others over the remaining four basins being significantly upward. The largest trend is found in basin #27, where RX5day increases with a rate of 3.70 mm/year. In particular, basin #15 has faced dramatically increasing RX3day in recent years, with a maxima observed in 2010 exceeding 700 mm. Compared to the patterns of RX1day, it can be found that, except for basin #12, both RX1day and RX5day over basins #5, #14, #15 and #27 display significant upward trends. Apart from the above basins, basins #20 and #30 also have significant increasing RX5day with large interannual fluctuations for the period of record, but both trends are not steep (2.10 mm/year and 0.43 mm/year respectively).
3.2. Frequency Distribution Changes
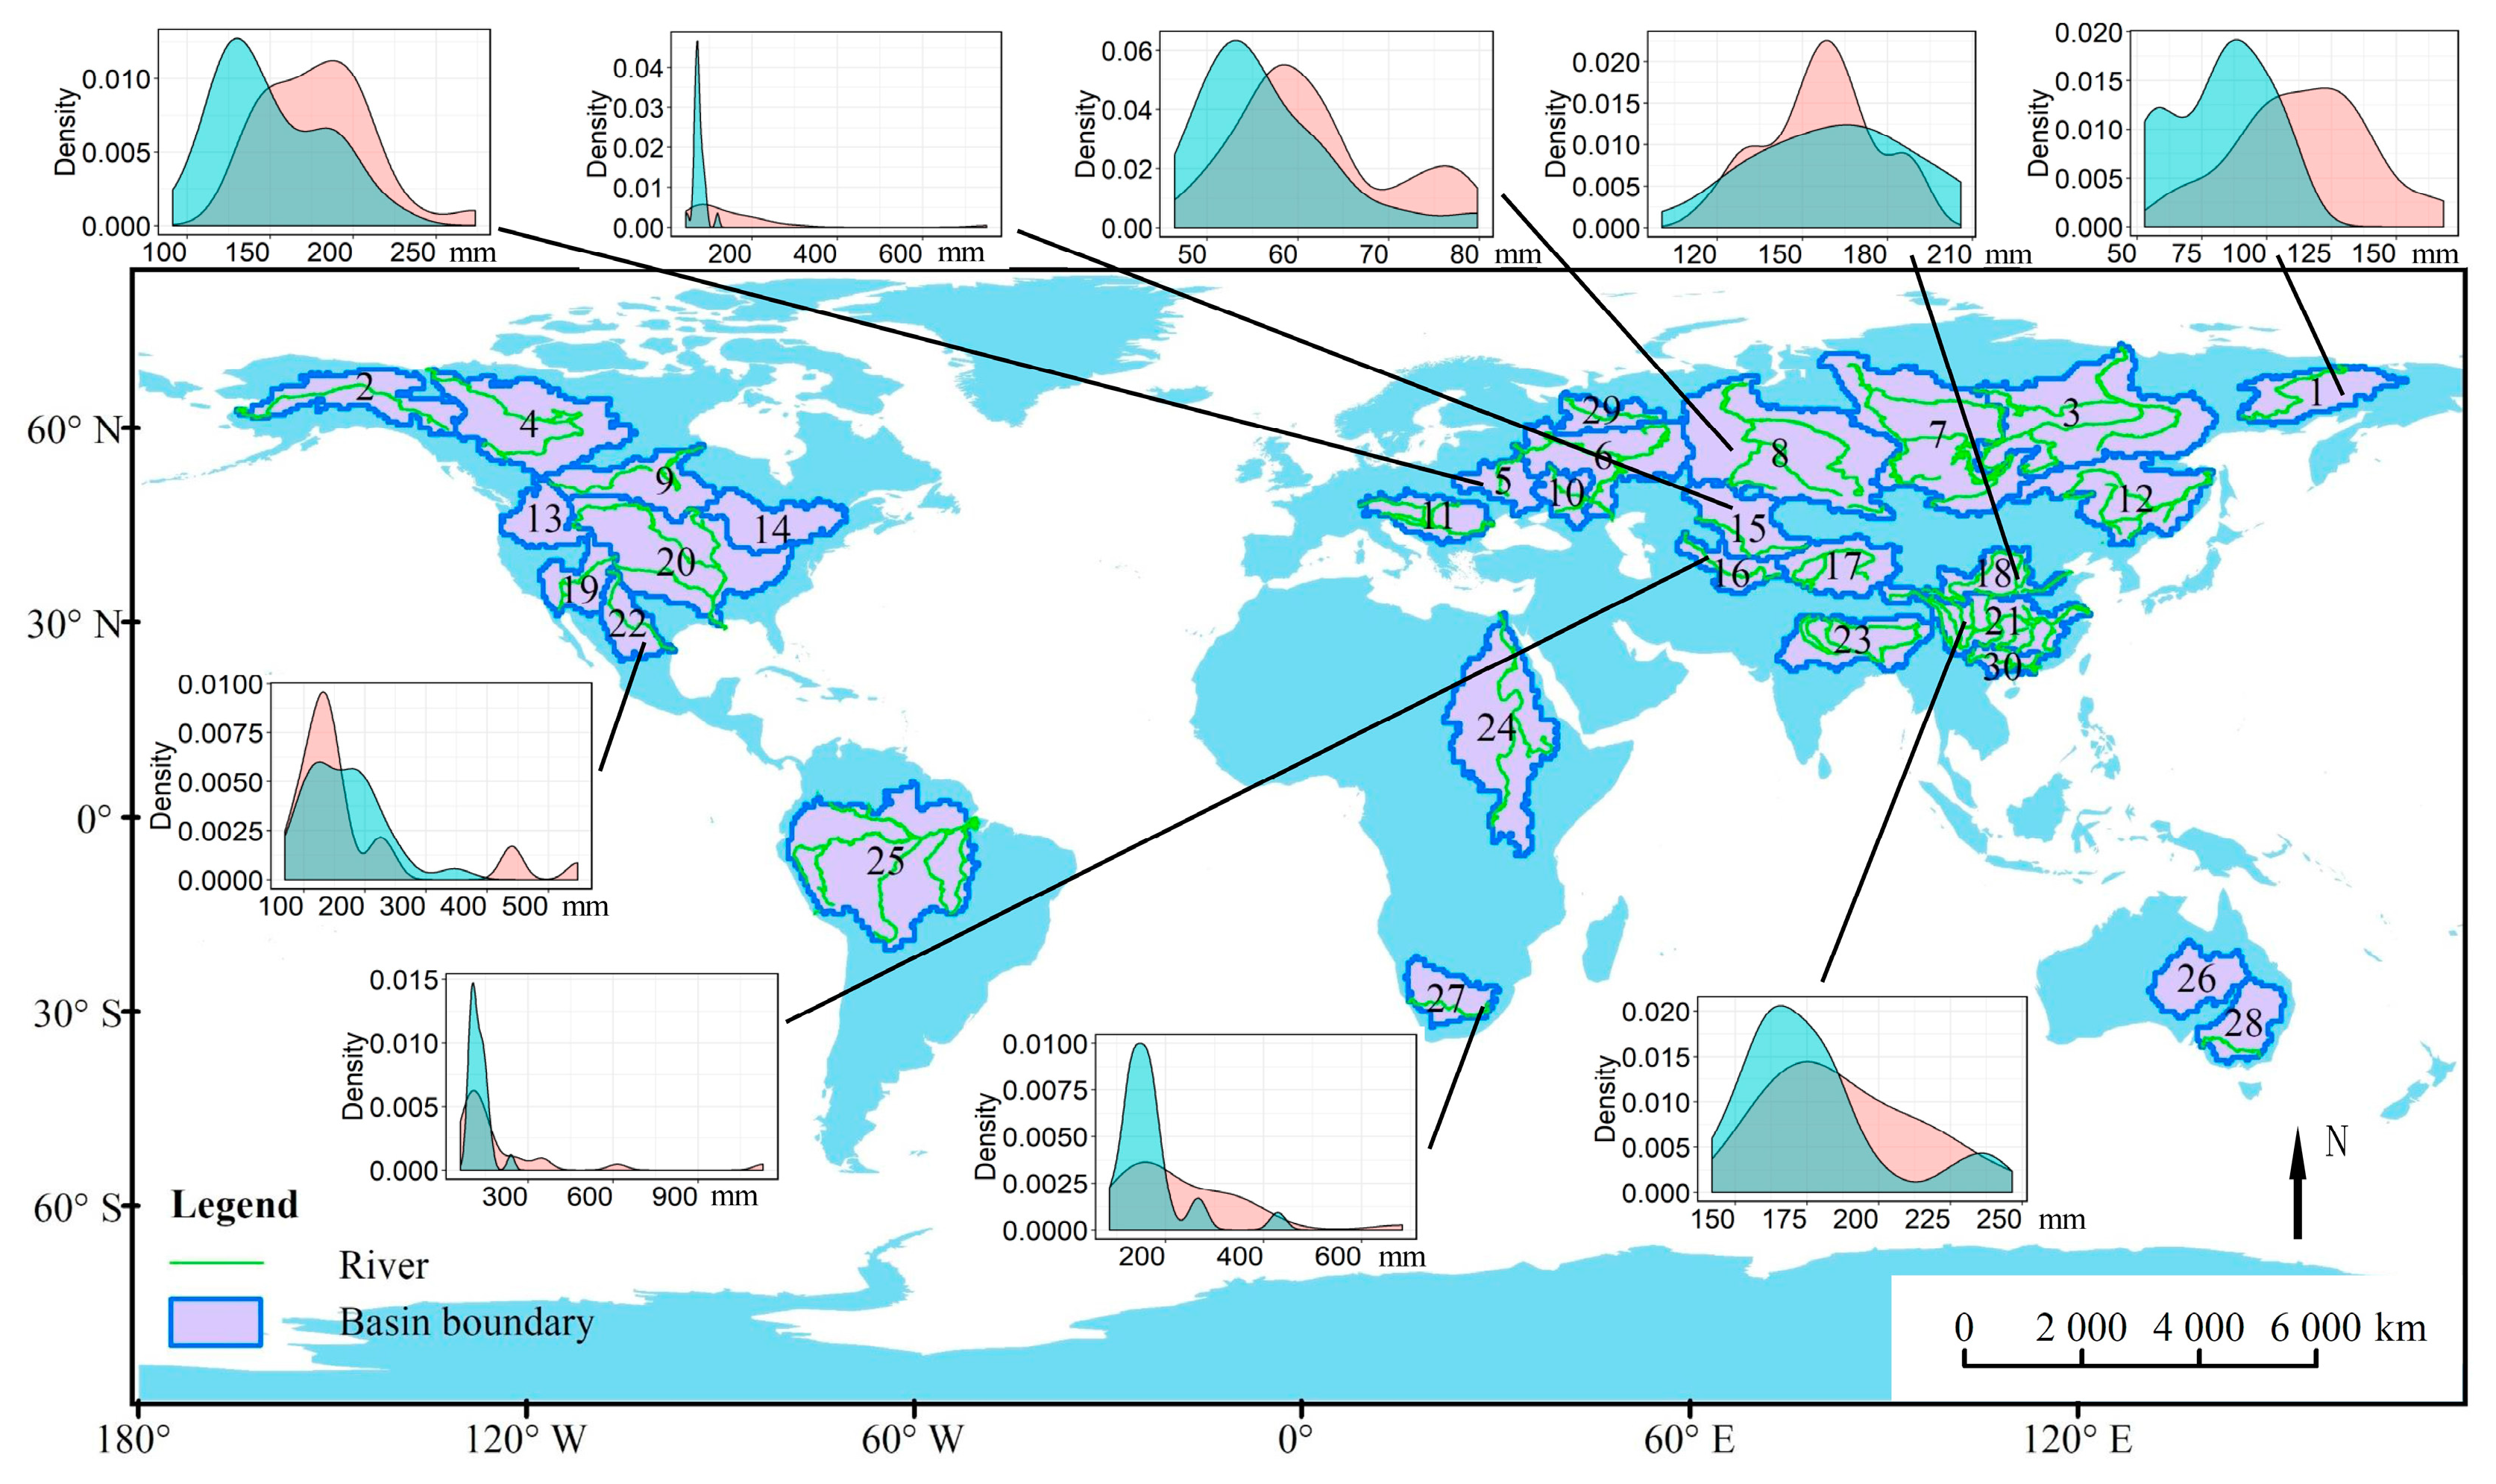
To explore changes in frequency distributions of RX1day, RX3day, and RX5day, the data were split into two equal subperiods: 1960–1984 and 1985–2011. Figure 4 presents the basins where distinct changes (either the shapes of distributions for the two subperiods differ substantially, or the peaks of two distribution curves show a visible horizontal distance) in frequency distributions of RX1day during 1960–1984 and 1985–2011 were found, from which it can be seen that, in most cases, significant distribution changes exist in the basins where significant trends in RX1day are found. Correspondingly, RX1day exhibits strengthening trends during the subperiod of 1985–2011 with increasing frequencies of larger amount, and this is particularly true for basins #1, #5 and #8. Note that basin #18 shows visible changes in the frequency distributions between 1960–1984 and 1985–2011, although its trend is not statistically significant (Figure 1). It is also noteworthy that the distribution changes over basins #15 and #16 in the Middle East and that over basin #27 in South Africa all show a larger range of RX1day in 1985–2011 compared to the other subperiod. In particular, RX1day over basins #15 and #16 for the 1985–2011 period can be larger than 300 mm and, in some cases, it can reach 600 mm or even larger, whereas that for the 1960–1984 period is generally lower than 300 mm. As for basin #27, RX1day during the latter subperiod can be larger than 400 mm but is generally lower than 400 mm during 1960–1984.
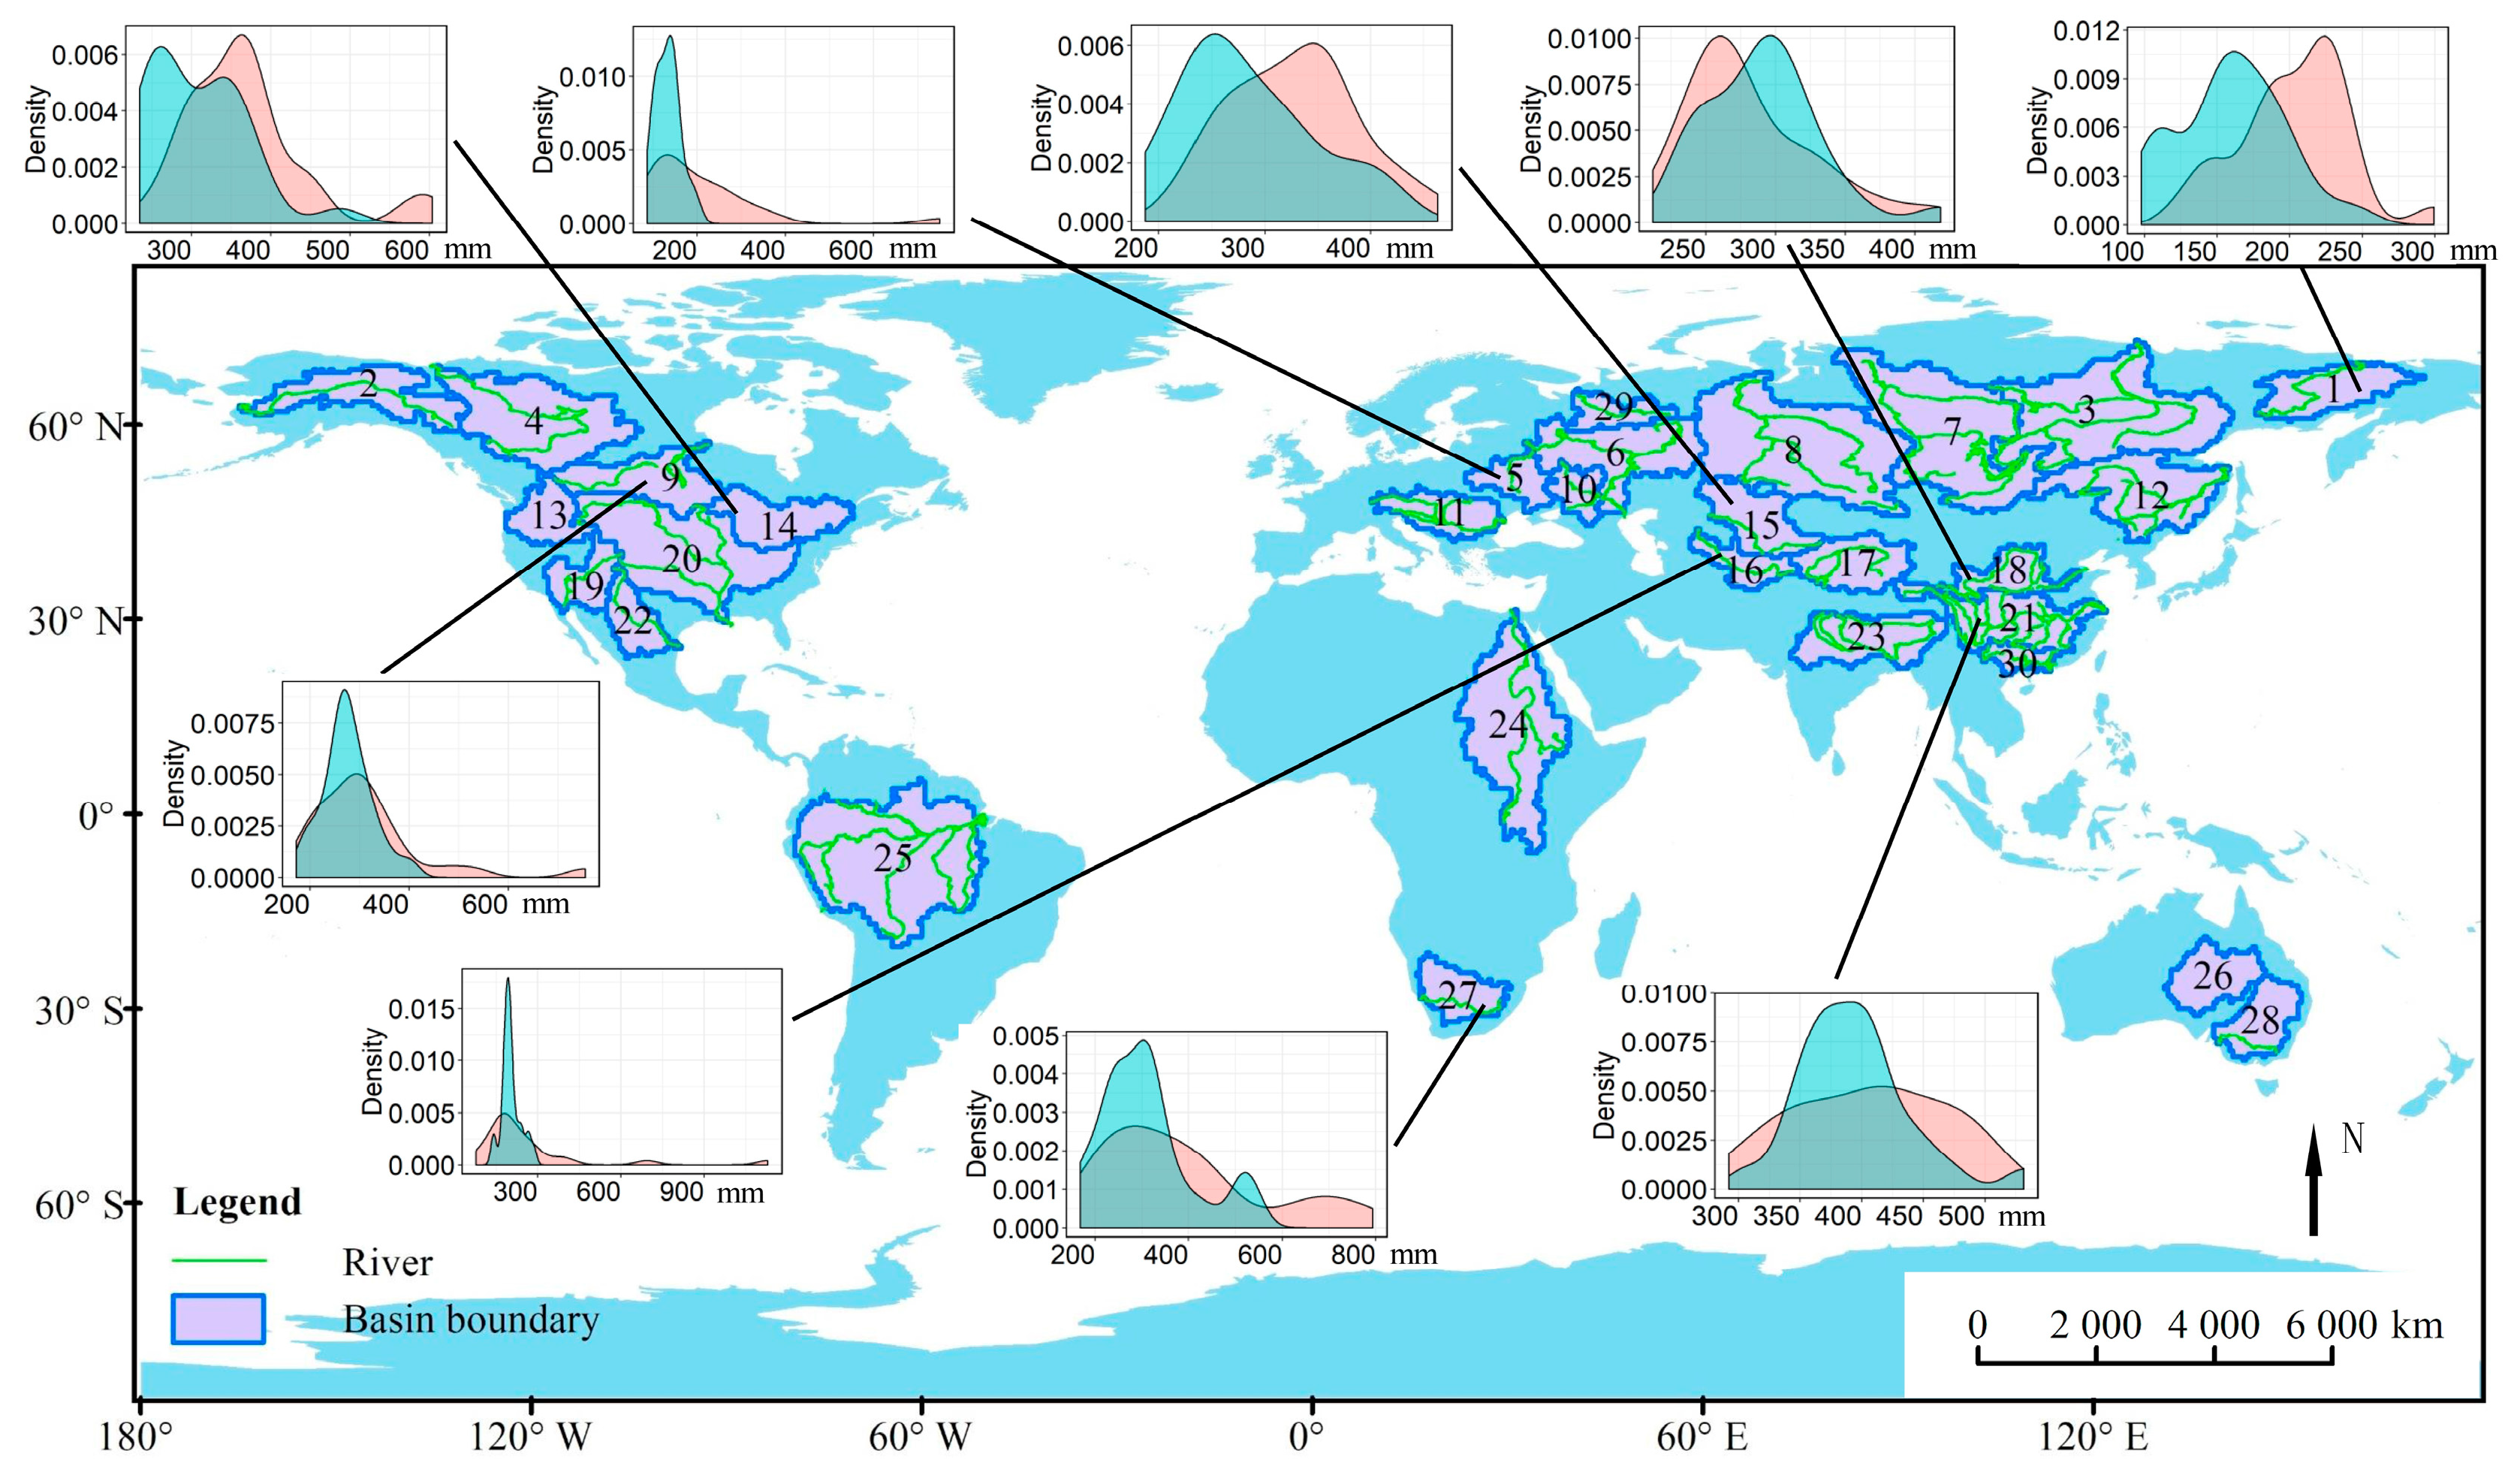
When looking into the frequency distribution changes in RX3day, as shown in Figure 5, it is found that the basins with distinct distribution changes generally encountered significant trends in RX3day, such as basins #1, #5, #15 and #16 (Figure 2). More specifically, a strengthening of RX3day is remarkable in basins #1, #14 and #15 during 1985–2011 relative to 1960–1984. Larger range of RX3day can be found in basins #5 and #16, respectively located in Europe and the Middle East; during 1985–2011, RX3day larger than 300 mm occurred in some cases for both the basins, whereas such a situation never occurred for the period of 1960–1984. Combining with the results from Figure 2, there are some basins dominated by significant trends in RX3day, but the frequency distributions between the two subperiods do not change remarkably, for example, basin #3 in North Asia and basin #12 in East Asia. Contrarily, basins #18 and #21 present distinct changes in frequency distributions. Specifically, RX3day has shifted towards a smaller amount in basin #18, while the frequency distribution becomes more dispersive indicating increased frequency of RX3day larger than 450 mm and smaller than 350 mm in the latter subperiod than the former subperiod.
Figure 6 shows the distinct frequency distribution changes in RX5day. Note that prominent changes exist in basins #5, #14, #15 and #27 where significant trends are diagnosed (Figure 3), while basins #1, #9, #13 and #16 are examined to have visible changes in frequency distributions but the trends are not statistically significant. In addition, basins #12, #20 and #30 all show significant trends in RX5day, but their frequency distributions do not seemingly follow such changes. Remarkable frequency distribution changes toward larger amounts of RX5day are found to basins #1, #5, #14 and #27 basins, respectively located in North Asia, Europe, North America and South Africa. For basin #13, RX5day shows the opposite situation; namely, it shifts towards a smaller amount, indicating decreased RX5day. In the Middle East, it is found that both basins #15 and #16 are characterized by larger range of RX5day during 1985–2011 relative to the period 1960–1984, which is quite different from other basins. Specifically, RX5day larger than 400 mm is observed in some cases for both of the basins, however this does not occur during the former subperiod. When looking more closely at the results, basins #9 and #27 also have a larger range of RX5day during the latter subperiod to some extent; amounts larger than 600 mm occurred in basin #9 basin during 1985–2011 rather than 1960–1984, and amounts larger than 1000 mm are observed over basin #27 for the latter subperiod, whereas amounts during the former subperiod are mainly smaller than 1000 mm.
4. Discussion
Analyses of extreme precipitation trends and its frequency distribution changes, established using a 52-year span of data (1960–2011) gathered from 30 major basins around the world, have revealed a significant rise of RX1day, RX3day and RX5day over some basins, in accord with previous studies [35,36,37,38]. In particular, basins #15 and #16 in the Middle East show dramatic increase in RX1day, RX3day and RX5day for the recent years. This implies that flood risk as well as other extreme precipitation-induced hazards may increase over these basins. The countries in the Middle East should, therefore, make more hazard mitigation measures to avoid potential increased losses resulting from strengthened extreme precipitation. However, all these do not indicate that RX1day, RX3day and RX5day are strengthening in all global major river basins, as can be seen from the exception of basin #12 in East Asia, where RX3day and RX5day show declines for the period of record. On the other hand, we show remarkable changes in the frequency distributions of extreme precipitation over some basins, such as the RX1day, RX3day and RX5day over basin #1, the RX1day and RX5day over basin #5 and the RX3day and RX5day over basin #14, all of which shift toward larger amount suggesting intensified extreme precipitation at local scales. However, some basins display changes toward smaller amounts of extreme precipitation, such as the RX3day over basin #18 and the RX5day over basin #13. In addition, we found a larger range of extreme precipitation over basins #15 and #16 for 1985–2011 relative to 1960–1984. Therefore, attention should be paid to the apparent changing features of extreme precipitation for these basins and we suggest that the responsible stakeholders and administrations should consider the necessity of modifying current flood strategies to more feasibly cope with the extremes.
The intensification of RX1day, RX3day and RX5day across a majority of the basins in our study is largely due to global warming and climate change. Higher temperature may enhance evaporation and increase the moisture content in the atmosphere, leading to an increase in extreme precipitation [39,40]. As further illustrated in a previous study, against the background of global warming, extreme precipitation is more sensitive to climate change and the relationship between extreme precipitation and temperature is closer than the past [41]. Another study has demonstrated that global observed RX1day has increased by about 5.73 mm on the whole in the past 110 years, approximately 10%/K since the 1900s [42]. The El Niño-Southern Oscillation (ENSO) is the Earth’s strongest source of year-to-year climate variability, which has an impact on regional climate regimes over many regions, including the central Asia [43]. Under climate change, ENSO is expected to exhibit larger fluctuations [44], and might result in larger variability of extreme precipitation over basins #15 and #16 as illustrated in Figure 1, Figure 2 and Figure 3. Apart from the global temperature rise, we argued that changes in extreme precipitation could be also partly impacted by local topography and geography [10,28]. In our study, the trends and frequency distribution changes in extreme precipitation over basins #5 and #10 situated in Europe are different (one is significant but the other is not), although the two basins are considered adjacent to each other and the controlled climates are possibly similar (as the drainage areas are relatively small). To some extent, the topography difference between these two basins is partly responsible for the local various trends and distribution changes in extreme precipitation. Furthermore, the location of mountain chains with respect to dominant wind direction is another possible factor causing extreme precipitation changes. For example, although basin #12 is located in East Asia facing the western Pacific, the Changbai Mountains along the east edge of the basin could block water vapor transport from the western Pacific to the basin, and possibly contribute to the downward trend in extreme precipitation.
It should be noted that the meteorological stations employed in this study are mostly located in North America, Eurasia and other economically developed regions. In South America and Africa, however, there are relatively few stations available for our analysis. Such an unavoidable problem also exists in previous studies [45,46] and some attempted to solve the problem by gridding the station data, although the gridded data precision in regions with sparse stations might be compromised [47,48]. We only selected two major river basins in South America and Africa, i.e., the Amazon and Nile basins regardless of other basins such as the Congo and Parana basins. However, we found no significant trends or changes regarding RX1day, RX3day and RX5day in either the Amazon or Nile basin. Taye and Willems (2012) found that extreme precipitation in the Blue Nile basin, one of the major source basins of the Nile, shows a particular variation pattern [49]. The 1980s had statistically significant negative anomalies compared to the basic period of 1964–2009, and the 1960s–1970s and 1990s–2000s had less significant positive anomalies; however, no consistent trend exists after then [49]. The inconsistent trends in their study somewhat support our findings. For the Amazon basin, Da Silva et al. (2019) stated that most of the extreme precipitation indices presented insignificant trends in the Amazon basin, again in line with our results [50]. Therefore, although the data for South America and Africa are limited in the current study, the statistical results in these regions are reasonable and convincing. Overall, our study could contribute to the scientific community as well as local public policymakers, by providing a better understanding and more details on changes in extreme precipitation. These insights can support wiser public policies to mitigate the effects of these changes. Future work should also be conducted regarding the possible drivers of extreme precipitation across different river basins.
5. Conclusions
In this study, the trends and frequency distribution changes in RX1day, RX3day and RX5day over 30 river basins around the world during 1960–2011 were examined, and the main findings can be summarized below.
(1) Approximately a quarter of the basins showed significant upward trends in RX1day, RX3day and RX5day for the period of record, particularly for basins #15 and #16 in the Middle East, where dramatic increases were observed in the recent decade. In contrast, basin #12 in East Asia has experienced significant declines in RX3day and RX5day.
(2) Remarkable changes in the frequency distributions of RX1day, RX3day and RX5day are found in one third of the basins, such as basins #1, #5 and #14, where the indices have shifted toward larger amounts, suggesting intensification of extreme precipitation. Larger ranges of RX1day, RX3day and RX5day over basins #15 and #16 are also found for 1985–2011 relative to 1960–1984, suggesting that extreme precipitation became more extreme in recent decades. In addition, some basins have experienced diminished extreme precipitation, such as RX3day over basin #18 and RX5day over basin #13.
Our study is expected to provide a better understanding and more details on changes in extreme precipitation across different river basins, contributing to the scientific community and policymakers in terms of river flood managements and environment protection.
Author Contributions
X.F. wrote the original draft. Z.W. provided conceptualization. X.W. provided supervision and directed the study. J.Y. provided data curation and interpretation. S.Q. and J.Z. designed figures and tables. All authors have read and agreed to the published version of the manuscript.
Funding
The research is financially supported by the China Postdoctoral Science Foundation (2019M662919), the National Natural Science Foundation of China (51879107, 51709117), the Guangdong Basic and Applied Basic Research Foundation (2019A1515111144), and the Water Resource Science and Technology Innovation Program of Guangdong Province (2020-18).
Acknowledgments
The authors wish to express their gratitude to all authors of the numerous technical reports used for this paper.
Conflicts of Interest
The authors declare no conflict of interest.
References
- Bouwer, M.L. Have disaster losses increased due to anthropogenic climate change? Bull. Am. Meteorol. Soc. 2011, 92, 39–46. [Google Scholar] [CrossRef] [Green Version]
- Yin, J.; Gentine, P.; Zhou, S.; Sullivan, S.C.; Wang, R.; Zhang, Y.; Guo, S. Large increase in global storm runoff extremes driven by climate and anthropogenic changes. Nat. Commun. 2018, 9, 1–10. [Google Scholar] [CrossRef] [Green Version]
- Yin, J.; Guo, S.; He, S.; Guo, J.; Hong, X.; Liu, Z. A copula-based analysis of projected climate changes to bivariate flood quantiles. J. Hydrol. 2018, 566, 23–42. [Google Scholar] [CrossRef]
- Wu, X.; Wang, Z.; Guo, S.; Liao, W.; Zeng, Z.; Chen, X. Scenario-based projections of future urban inundation within a coupled hydrodynamic model framework: A case study in Dongguan City, China. J. Hydrol. 2017, 547, 428–442. [Google Scholar] [CrossRef]
- Salesa, D.; Amodio, A.M.; Rosskopf, C.M.; Garfì, V.; Cerdà, A. Three topographical approaches to survey soil erosion on a mountain trail affected by a forest fire. Barranc de la Manesa, Llutxent, Eastern Iberian Peninsula. J. Environ. Manag. 2020, 264, 110491. [Google Scholar] [CrossRef]
- Liu, Z.; Yang, M.Y.; Zhang, J.Q. Spatial distribution pattern of soil-wind erosion on slope farmlands in the wind-water erosion crisscross region of the Loess Plateau, China. Chin. Sci. Bull. 2016, 61, 511. [Google Scholar] [CrossRef] [Green Version]
- Benaud, P.; Anderson, K.; Evans, M.; Farrow, L.; Brazier, R.E. National-scale geodata describe widespread accelerated soil erosion. Geoderma 2020, 371, 114378. [Google Scholar] [CrossRef]
- Singh, V.; Goyal, M.K. Spatio-temporal heterogeneity and changes in extreme precipitation over eastern Himalayan catchments India. Stoch. Environ. Res. Risk Assess. 2017, 31, 2527–2546. [Google Scholar] [CrossRef]
- Wang, Z.; Zeng, Z.; Lai, C.; Lin, W.; Wu, X.; Chen, X. A regional frequency analysis of precipitation extremes in Mainland China with fuzzy c-means and L-moments approaches. Int. J. Climatol. 2017, 37, 429–444. [Google Scholar] [CrossRef]
- Wang, Z.; Lai, C.; Chen, X.; Yang, B.; Zhao, S.; Bai, X. Flood hazard risk assessment model based on random forest. J. Hydrol. 2015, 527, 1130–1141. [Google Scholar] [CrossRef]
- Alexander, L.V.; Zhang, X.; Peterson, T.C.; Caesar, J.; Gleason, B.; Klein Tank, A.M.G.; Haylock, M.; Collins, D.; Trewin, B.; Rahimzadeh, F.; et al. Global observed changes in daily climate extremes of temperature and precipitation. J. Geophys. Res. Atmos. 2006, 111, D5. [Google Scholar] [CrossRef] [Green Version]
- Mishra, A.K.; Singh, V.P. Changes in extreme precipitation in Texas. J. Geophys. Res. 2010, 115, D14106. [Google Scholar] [CrossRef]
- Wu, X.; Guo, S.; Yin, J.; Yang, G.; Zhong, Y.; Liu, D. On the event-based extreme precipitation across China: Time distribution patterns, trends, and return levels. J. Hydrol. 2018, 562, 305–317. [Google Scholar] [CrossRef]
- Asadieh, B.; Krakauer, N.Y. Global trends in extreme precipitation: Climate models versus observations. Hydrol. Earth Syst. Sci. 2014, 11, 11369–11393. [Google Scholar] [CrossRef] [Green Version]
- Kitoh, A.; Endo, H. Changes in precipitation extremes projected by a 20-km mesh global atmospheric model. Weather Clim. Extremes 2015, 321, 41–52. [Google Scholar] [CrossRef] [Green Version]
- Shi, X.; Durran, D. Sensitivities of Extreme Precipitation to Global Warming Are Lower over Mountains than over Oceans and Plains. J. Clim. 2016, 29, 4779–4791. [Google Scholar] [CrossRef]
- Zhang, W.; Zhou, T. Significant increases in extreme precipitation and the associations with global warming over the global land monsoon regions. J. Clim. 2019, 32, 8465–8488. [Google Scholar] [CrossRef]
- Barlow, M. Influence of hurricane-related activity on North American extreme precipitation. Geophys. Res. Lett. 2010, 38, 155–170. [Google Scholar] [CrossRef]
- Costa, A.C.; Soares, A. Space-Time Interpolation and Uncertainty Assessment of an Extreme Precipitation Index Using Geostatistical Cosimulation. In Proceedings of the Workshops IEEE International Conference on Data Mining, Omaha, NE, USA, 28–31 October 2007; pp. 589–594. [Google Scholar]
- Vyshkvarkova, E.V.; Voskresenskaya, E.N. Changes of extreme precipitation in Southern Russia. In IOP Conference Series Earth and Environmental Science; IOP Publishing: Bristol, UK, 2018; Volume 107. [Google Scholar]
- Shang, H.; Yan, J.; Gebremichael, M.; Ayalew, S.M. Trend analysis of extreme precipitation in the Northwestern Highlands of Ethiopia with a case study of Debre Markos. Hydrol. Earth Syst. Sci. 2011, 15, 1937–1944. [Google Scholar] [CrossRef] [Green Version]
- Kim, G.; Cha, D.-H.; Park, C.; Lee, G.; Jin, C.-S.; Lee, D.-K.; Suh, M.-S.; Ahn, J.-B.; Min, S.-K.; Hong, S.-Y.; et al. Future changes in extreme precipitation indices over Korea. Int. J. Climatol. 2018, 38, 862–874. [Google Scholar] [CrossRef]
- Wu, X.; Wang, Z.; Zhou, X.; Lai, C.; Lin, W.; Chen, X. Observed changes in precipitation extremes across 11 basins in China during 1961–2013. Int. J. Climatol. 2016, 36, 2866–2885. [Google Scholar] [CrossRef]
- Wang, S.; Jiang, F.; Ding, Y. Spatial coherence of variations in seasonal extreme precipitation events over Northwest Arid Region, China. Int. J. Climatol. 2015, 35, 4642–4654. [Google Scholar] [CrossRef]
- Gupta, V.; Jain, M.K. Impact of enso, global warming, and land surface elevation on extreme precipitation in India. J. Hydrol. Eng. 2020, 25, 1. [Google Scholar] [CrossRef]
- Wang, A.K.; Dominguez, F.; Schmidt, A.R. Extreme precipitation spatial analog: In search of an alternative approach for future extreme precipitation in urban hydrological studies. Water 2019, 11, 1032. [Google Scholar] [CrossRef] [Green Version]
- Frich, P.; Alexander, L.V.; Della-Marta, P.; Gleason, B.; Haylock, M.; Tank, A.M.G.K.; Peterson, T. Observed coherent changes in climatic extremes during the second half of the twentieth century. Clim. Res. 2002, 19, 193–212. [Google Scholar] [CrossRef] [Green Version]
- Seekao, C.; Pharino, C. Assessment of the flood vulnerability of shrimp farms using a multicriteria evaluation and GIS: A case study in the Bangpakong Sub-Basin, Thailand. Environ. Earth Sci. 2016, 75, 1–13. [Google Scholar] [CrossRef]
- Min, S.K.; Zhang, X.; Zwiers, F.W.; Hegerl, G.C. Human contribution to more-intense precipitation extremes. Nature 2011, 470, 378–381. [Google Scholar] [CrossRef]
- Sarr, M.A.; Branger, F.; Zorome, M.; Kermadi, S.; Seidou, O. Recent trends in selected extreme precipitation indices in Senegal-A changepoint approach. J. Hydrol. Amsterdam. 2013, 505, 326–334. [Google Scholar] [CrossRef]
- Wu, X.; Guo, S.; Liu, D.; Hong, X.; Liu, Z.; Liu, P.; Chen, H. Characterization of rainstorm modes along the upper mainstream of Yangtze River during 2003-2016. Int. J. Climatol. 2018, 38, 1976–1988. [Google Scholar] [CrossRef]
- Caroletti, G.N.; Barstad, I. An assessment of future extreme precipitation in western Norway using a linear model. Hydrol. Earth Syst. Sci. 2010, 14, 2329–2341. [Google Scholar] [CrossRef] [Green Version]
- Soulis, E.D.; Sarhadi, A.; Tinel, M.; Suthar, M. Extreme precipitation time trends in Ontario, 1960-2010. Hydrol. Process. 2016, 30, 4090–4100. [Google Scholar] [CrossRef]
- López-Rodríguez, F.; García-Sanz-Calcedo, J.; Moral-García, F.J.; García-Conde, A.J. Statistical study of rainfall control: The Dagum distribution and applicability to the Southwest of Spain. Water 2019, 11, 453. [Google Scholar] [CrossRef] [Green Version]
- Yu, L.-L.; Xia, Z.-Q.; Li, J.-K.; Cai, T. Climate change characteristics of Amur River. Water Sci. Eng. 2012, 6, 131–144. [Google Scholar]
- Mandal, S.; Srivastav, R.K.; Simonovic, S.P. Use of Beta Regression for Statistical Downscaling of Precipitation in the Campbell River Basin, British Columbia, Canada. J. Hydrol. 2016, 538, 49–62. [Google Scholar] [CrossRef]
- Sun, S.; Huang, G.; Fan, Y. Multi-indicator evaluation for extreme precipitation events in the past 60 years over the Loess Plateau. Water 2020, 12, 193. [Google Scholar] [CrossRef] [Green Version]
- Bartholy, J.; Pongrácz, R. Analysis of precipitation conditions for the Carpathian Basin based on extreme indices in the 20th century and climate simulations for 2050 and 2100. Phys. Chem. Earth 2010, 35, 43–51. [Google Scholar] [CrossRef]
- Dai, A. Increasing drought under global warming in observations and models. Nat. Clim. Chang. 2013, 3, 171. [Google Scholar] [CrossRef] [Green Version]
- Yin, J.; Guo, S.; Gu, L.; He, S.; Ba, H.; Tian, J.; Li, Q.; Chen, J. Projected changes of bivariate flood quantiles and estimation uncertainty based on multi-model ensembles over China. J. Hydrol. 2020, 585, 124760. [Google Scholar] [CrossRef]
- Zeng, Z.; Lai, C.; Wang, Z.; Chen, X.; Zhang, Z.; Cheng, X. Intensity and spatial heterogeneity of design rainstorm under nonstationarity and stationarity hypothesis across mainland China. Theor. Appl. Climatol. 2019, 138, 1795–1808. [Google Scholar] [CrossRef]
- Trenberth, K.E. Atmospheric Moisture Residence Times and Cycling: Implications for Rainfall Rates and Climate Change. Clim. Chang. 1998, 39, 667–694. [Google Scholar] [CrossRef]
- Bothe, O.; Fraedrich, K.; Zhu, X. Precipitation climate of Central Asia and the large-scale atmospheric circulation. Theor. Appl. Climatol. 2012, 108, 345–354. [Google Scholar] [CrossRef]
- Loubere, P.; Creamer, W.; Haas, J. Evolution of the El Nino-Southern Oscillation in the late Holocene and insolation driven change in the tropical annual SST cycle. Global Planet. Chang. 2013, 100, 129–144. [Google Scholar] [CrossRef]
- Kiktev, D.; Sexton, D.M.H.; Alexander, L.; Folland, C.K. Comparison of Modeled and Observed Trends in Indices of Daily Climate Extremes. J. Clim. 2003, 16, 3560–3571. [Google Scholar] [CrossRef]
- Knippertz, P.; Martin, J.E. Tropical plumes and extreme precipitation in subtropical and tropical West Africa. Q. J. R. Meteorol. Soc. 2005, 131, 2337–2365. [Google Scholar] [CrossRef] [Green Version]
- Pielke, R.A. Reanalysis of US National Weather Service flood loss database. Nat. Hazards Rev. 2005, 6, 13–22. [Google Scholar]
- Hallegatte, S.; Green, C.; Nicholls, R.J.; Corfee-Morlot, J. Future flood losses in major coastal cities. Nat. Clim. Chang. 2013, 3, 802–806. [Google Scholar] [CrossRef]
- Taye, M.T.; Willems, P. Temporal variability of hydro-climatic extremes in the Blue Nile basin. Water Res. 2012, 48, 3513. [Google Scholar]
- Evangelista, D.S.P.; Moisés, S.E.S.C.; Constantino, S.M.H.; de Melo Barbosa, A.L. Precipitation and air temperature extremes in the Amazon and northeast Brazil. Int. J. Climatol. 2018, 39, 579–595. [Google Scholar]
Figure 1.
Trends in maximum one-day precipitation (RX1day) for different river basins. The x-axis in each panel shows the time and the y-axis is the amount of RX1day for the corresponding year. Numbers within basins signify basin ID as listed in Table 1.
Figure 1.
Trends in maximum one-day precipitation (RX1day) for different river basins. The x-axis in each panel shows the time and the y-axis is the amount of RX1day for the corresponding year. Numbers within basins signify basin ID as listed in Table 1.

Figure 2.
Trends in maximum three-day precipitation (RX3day) for different river basins. The x-axis in each panel shows the time and the y-axis is the amount of RX3day for the corresponding year. Numbers within basins signify basin ID as listed in Table 1.
Figure 2.
Trends in maximum three-day precipitation (RX3day) for different river basins. The x-axis in each panel shows the time and the y-axis is the amount of RX3day for the corresponding year. Numbers within basins signify basin ID as listed in Table 1.

Figure 3.
Trends in maximum five-day precipitation (RX5day) for different river basins. The x-axis in each panel shows the time and the y-axis is the amount of RX5day for the corresponding year. Numbers within basins signify basin ID as listed in Table 1.
Figure 3.
Trends in maximum five-day precipitation (RX5day) for different river basins. The x-axis in each panel shows the time and the y-axis is the amount of RX5day for the corresponding year. Numbers within basins signify basin ID as listed in Table 1.

Figure 4.
Changes in frequency distributions of RX1day for different river basins. The green and pink shadings in each panel represent the distributions for the period of 1960-1984 and 1985-2011, respectively. The x-axis in each panel shows amount of RX1day and the y-axis is the corresponding frequency distribution density.

Figure 5.
Changes in frequency distributions of maximum three-day precipitation RX3day for different river basins. The green and pink shadings in each panel represent the distributions for the period of 1960–1984 and 1985–2011, respectively. The x-axis in each panel shows amount of RX3day and the y-axis is the corresponding frequency distribution density.

Figure 6.
Changes in frequency distributions of maximum five-day precipitation RX5day for different river basins. The green and pink shadings in each panel represent the distributions for the period of 1960–1984 and 1985–2011, respectively. The x-axis in each panel shows amount of RX5day and the y-axis is the corresponding frequency distribution density.


Table 1.
Thirty river basins from all over the globe used in this study.
| ID | Name | Continent | Area (106 km2) | Climate |
|---|---|---|---|---|
| 1 | Kolyma | Asia | 0.66 | Semi-humid |
| 2 | Yukon | North America | 0.83 | Semi-humid |
| 3 | Lena | Asia | 2.46 | Semi-humid |
| 4 | Mackenzie | North America | 1.67 | Semi-humid |
| 5 | Dnieper | Europe | 0.5 | Humid |
| 6 | Volga | Europe | 1.37 | Humid |
| 7 | Yenisei | Asia | 2.82 | Humid |
| 8 | Ob | Asia | 3.11 | Semi-humid |
| 9 | Saskatchewan River | North America | 0.38 | Semi-humid |
| 10 | Don | Asia | 0.45 | Semi-humid |
| 11 | Danube | Europe | 0.78 | Humid |
| 12 | Amur | Asia | 2.13 | Semi-humid |
| 13 | Columbia | North America | 0.71 | Semi-humid |
| 14 | Saint Lawrence River | North America | 0.3 | Semi-humid |
| 15 | Syr Darya River | Asia | 2.2 | Arid |
| 16 | Amu darya | Asia | 4.65 | Arid |
| 17 | Tarim River | Asia | 1.02 | Arid |
| 18 | Huanghe | Asia | 0.84 | Semi-arid |
| 19 | Colorado | North America | 0.81 | Arid |
| 20 | Mississippi | North America | 1.32 | Semi-humid |
| 21 | Yangtze | Asia | 1.84 | Humid |
| 22 | Grand River | North America | 0.57 | Semi-arid |
| 23 | Ganges | Asia | 1.54 | Humid |
| 24 | Nile | Africa | 3.8 | Semi-arid |
| 25 | Amazon | South America | 5.93 | Humid |
| 26 | Great Artesian Basin | Oceania | 1.75 | Arid |
| 27 | Orange River | Africa | 1.02 | Semi-arid |
| 28 | Murray | Oceania | 0.96 | Semi-arid |
| 29 | N.Dvina | Asia | 0.28 | Humid |
| 30 | Zhujiang | Asia | 0.45 | Humid |
© 2020 by the authors. Licensee MDPI, Basel, Switzerland. This article is an open access article distributed under the terms and conditions of the Creative Commons Attribution (CC BY) license (http://creativecommons.org/licenses/by/4.0/).
Share and Cite
MDPI and ACS Style
Feng, X.; Wang, Z.; Wu, X.; Yin, J.; Qian, S.; Zhan, J. Changes in Extreme Precipitation across 30 Global River Basins. Water 2020, 12, 1527. https://doi.org/10.3390/w12061527
AMA Style
Feng X, Wang Z, Wu X, Yin J, Qian S, Zhan J. Changes in Extreme Precipitation across 30 Global River Basins. Water. 2020; 12(6):1527. https://doi.org/10.3390/w12061527
Chicago/Turabian StyleFeng, Xin, Zhaoli Wang, Xushu Wu, Jiabo Yin, Shuni Qian, and Jie Zhan. 2020. "Changes in Extreme Precipitation across 30 Global River Basins" Water 12, no. 6: 1527. https://doi.org/10.3390/w12061527
Note that from the first issue of 2016, this journal uses article numbers instead of page numbers. See further details here.