A Framework for Improving Reliability of Water Distribution Systems Based on a Segment-Based Minimum Cut-Set Approach


1
School of Civil and Environmental Engineering, University of New South Wales, Sydney, NSW 2052, Australia
2
School of Civil Engineering, Seoul National University of Technology, Seoul 01811, Korea
3
Department of Civil Engineering, The University of Suwon, Hwaseong 18323, Korea
4
School of Civil, Environmental, and Architectural Engineering, Korea University, Seoul 02841, Korea
*
Author to whom correspondence should be addressed.
Water 2019, 11(7), 1524; https://doi.org/10.3390/w11071524
Submission received: 4 July 2019
/
Revised: 16 July 2019
/
Accepted: 20 July 2019
/
Published: 23 July 2019
(This article belongs to the Special Issue Resilient and Robust Water Distribution Systems: State-of-the-Art and Research Challenges)
Abstract
:A framework is presented to effectively improve the water distribution system (WDS) reliability. The proposed framework first classifies pipes in a WDS into three reinforcement types through topological analyses and hydraulic simulations over the WDS; type 1: no reinforcement, type 2: increasing pipe durability, and type 3: installing valve(s) at both ends. Then two rules, rules 1 and 2, are implemented, in which rule 1 first reinforces the pipe with the lowest reliability but rule 2 preferentially reduces damage size by pipe failures represented as the expected number of customers out of service (EN). The proposed method was applied to Cherry Hill network, and considerably improved the WDS reliability from 0.137 to 0.483. Both approaches showed notable differences in changes of the EN at each step of reinforcement, where rule 2 showed a better capability to reduce the EN and detect vulnerable areas in the WDS than rule 1. In addition, a practical approach, maximizing valve installations and minimizing pipe replacements according to the reinforcement types in the system, provided an improved WDS reliability (0.423) close to that of the rule-based approach (0.483) using only 21% of the construction cost by the rule-based approach. The proposed framework can be guidelines for improving the WDS reliability under restricted budget and site conditions.
1. Introduction
A water distribution system (WDS) is a part of the water supply system and serves to transport, distribute and supply water to people, composed of pipes, pumps, valves and so on [1,2]. However, people have suffered problems with WDSs such as insufficient water supply owing to population growth and industrialization, frequent suspension of water supply because of component failures by infrastructure deterioration and/or natural/human-made disasters, and other problems such as water pollutions [3,4].
Given such problematic issues with WDSs, it should be reasonably constructed for supplying water at proper pressure and quality against temporally varying node demands and for minimizing negative effects on water consumers when various incidents happen such as pipe failures [5,6]. However, it is hard to maintain WDSs against the repeatedly occurring mishaps because it generally constructed over a wide range over residential areas, and water pipes are laid underground and used for a long time [7].
The reliability of a WDS is an important indicator of the status of WDS, and plays important roles in the design, operation and proper maintenance planning [8]. Mays [9] classified the WDS reliability as mechanical and hydraulic components. While the mechanical reliability represents the capability of WDS providing continuous and long-term operation with minimal repair, modification and/or replacement of parts, the hydraulic reliability is the degree of satisfying demands and pressure heads at nodes. Therefore, the WDS reliability is appropriately secured when the two types of reliability are simultaneously satisfied.
In this regard, there have been generally two types of methods for estimating the WDS reliability, which are connectivity/topological and hydraulic reliability-based approaches [8]. In the former case, Tung [10] introduced six techniques including event tree, cut-set, tie-set, conditional probability and fault-tree methods, and presented that the cut-set method is most effective in estimating the system reliability. Wagner, et al. [11] presented an analytical method to calculate reachability and connectivity, where reachability of a demand node indicates a circumstance in which the node is connected to no less than one source, and connectivity represents that every demand node links to at least one source in the WDS. However, it was noted that calculating the two metrics is fairly applicable to medium-sized networks. Similarly, Yazdani and Jeffrey [12] evaluated the structure and vulnerability of WDSs using a complex network theory regarding a WDS as a graph consisting of links and nodes. On the other hand, the hydraulic reliability-based approach focuses on evaluating how well the system supplies water under various conditions through hydraulic simulations. Su, Mays, Duan and Lansey [5] proposed a method to estimate the system reliability based on minimum cut-sets. The minimum set of system components causing system failures (e.g., low pressure and suspension of water supply) when destroyed, which is experimentally determined by checking if any system failures happen through multiple hydraulic simulations by removing one or more system parts (e.g., pipe). Wagner, et al. [13] suggested using both analytical and simulation methods together for better assessments of WDS reliability based on simulation results over two WDSs. For this, Jun, et al. [14] suggested a compositive method to estimate the WDS reliability by determining minimum cut-sets of a WDS through the concept of unintended isolation by adopting the concept of segment suggested by Walski [15], representing practical damage extent resulting from pipe failures. PieTrucha-urbaniK and Studziński [16] conducted a case study to identify the extent of damage (i.e., water suspension and pressure changes) through hydraulic simulations with component failures in WDSs; which in turn led to studies analyzing risks due to pipe failures in WDSs [17,18].
In addition, studies have been conducted to improve the WDS reliability. Su, Mays, Duan and Lansey [5] considered the possibility of failure of each pipe in an optimization model. The model is used to determine the optimal combination of pipes in terms of continuity, energy conservation, nodal head boundaries, and reliability constraints. Gupta and Bhave [19] presented a heuristic method for designing WDSs based on reliability. The method is iterative, only contemplates failures of pump and pipe, and is based on a trade-off between WDS reliability and cost. Jun, et al. [20] demonstrated the importance of adequate valve locations for minimizing the size of damage by pipe failures. This was done by analyzing how valve locations influence system reliability and damage. Jun, et al. [21] evaluated the WDS reliability based on a segment-based minimum cut-set method [14] and determined an optimal combination of pipes with various diameters to improve reliability using a metaheuristic algorithm. The authors emphasized that structural modification and/or adding new valves to the system is required for improving reliability in an efficient manner. Yannopoulos and Spiliotis [22] developed a graph theory-based method to present an overall reliability index by determining minimum cut-sets considering mechanical reliability as well as pressure availability at nodes.
As an additional step to assess and improve the WDS reliability, this study aims to present a framework to reasonably improve the WDS reliability. For this purpose, this study adopts the segment-based minimum cut-sets approach presented by Jun, Park, Baek and Kim [14], in consideration of both mechanical and hydraulic reliabilities. Based on this, it was proposed for improving the WDS reliability a rule-based framework that simultaneously selects pipes of which durability is to be improved and locations where valves are to be installed.
This rest of this paper is organized as follows. The methodology for defining and improving the WDS reliability is described in Section 2, and the proposed method was tested with Cherry Hill network [23] and the results are discussed in Section 3 with additional notes and future directions. Finally, the results are summarized, and conclusions are presented in Section 4.
2. Methods
2.1. WDS Reliability Assessment Using A Segment-Based Minimum Cut-Set Approach
In this study, the method developed by Jun, Park, Baek and Kim [14] was adopted for assessing the WDS reliability by which a WDS is improved by maximizing it. The reliability method consists of three concepts: (1) unintended isolation, (2) minimum cut-set, and (3) reliability calculation base on success mode approach as summarized in the following Section 2.1.1, Section 2.1.2 and Section 2.1.3, and further details can be found in the related literature [14,20].
2.1.1. Unintended Isolation
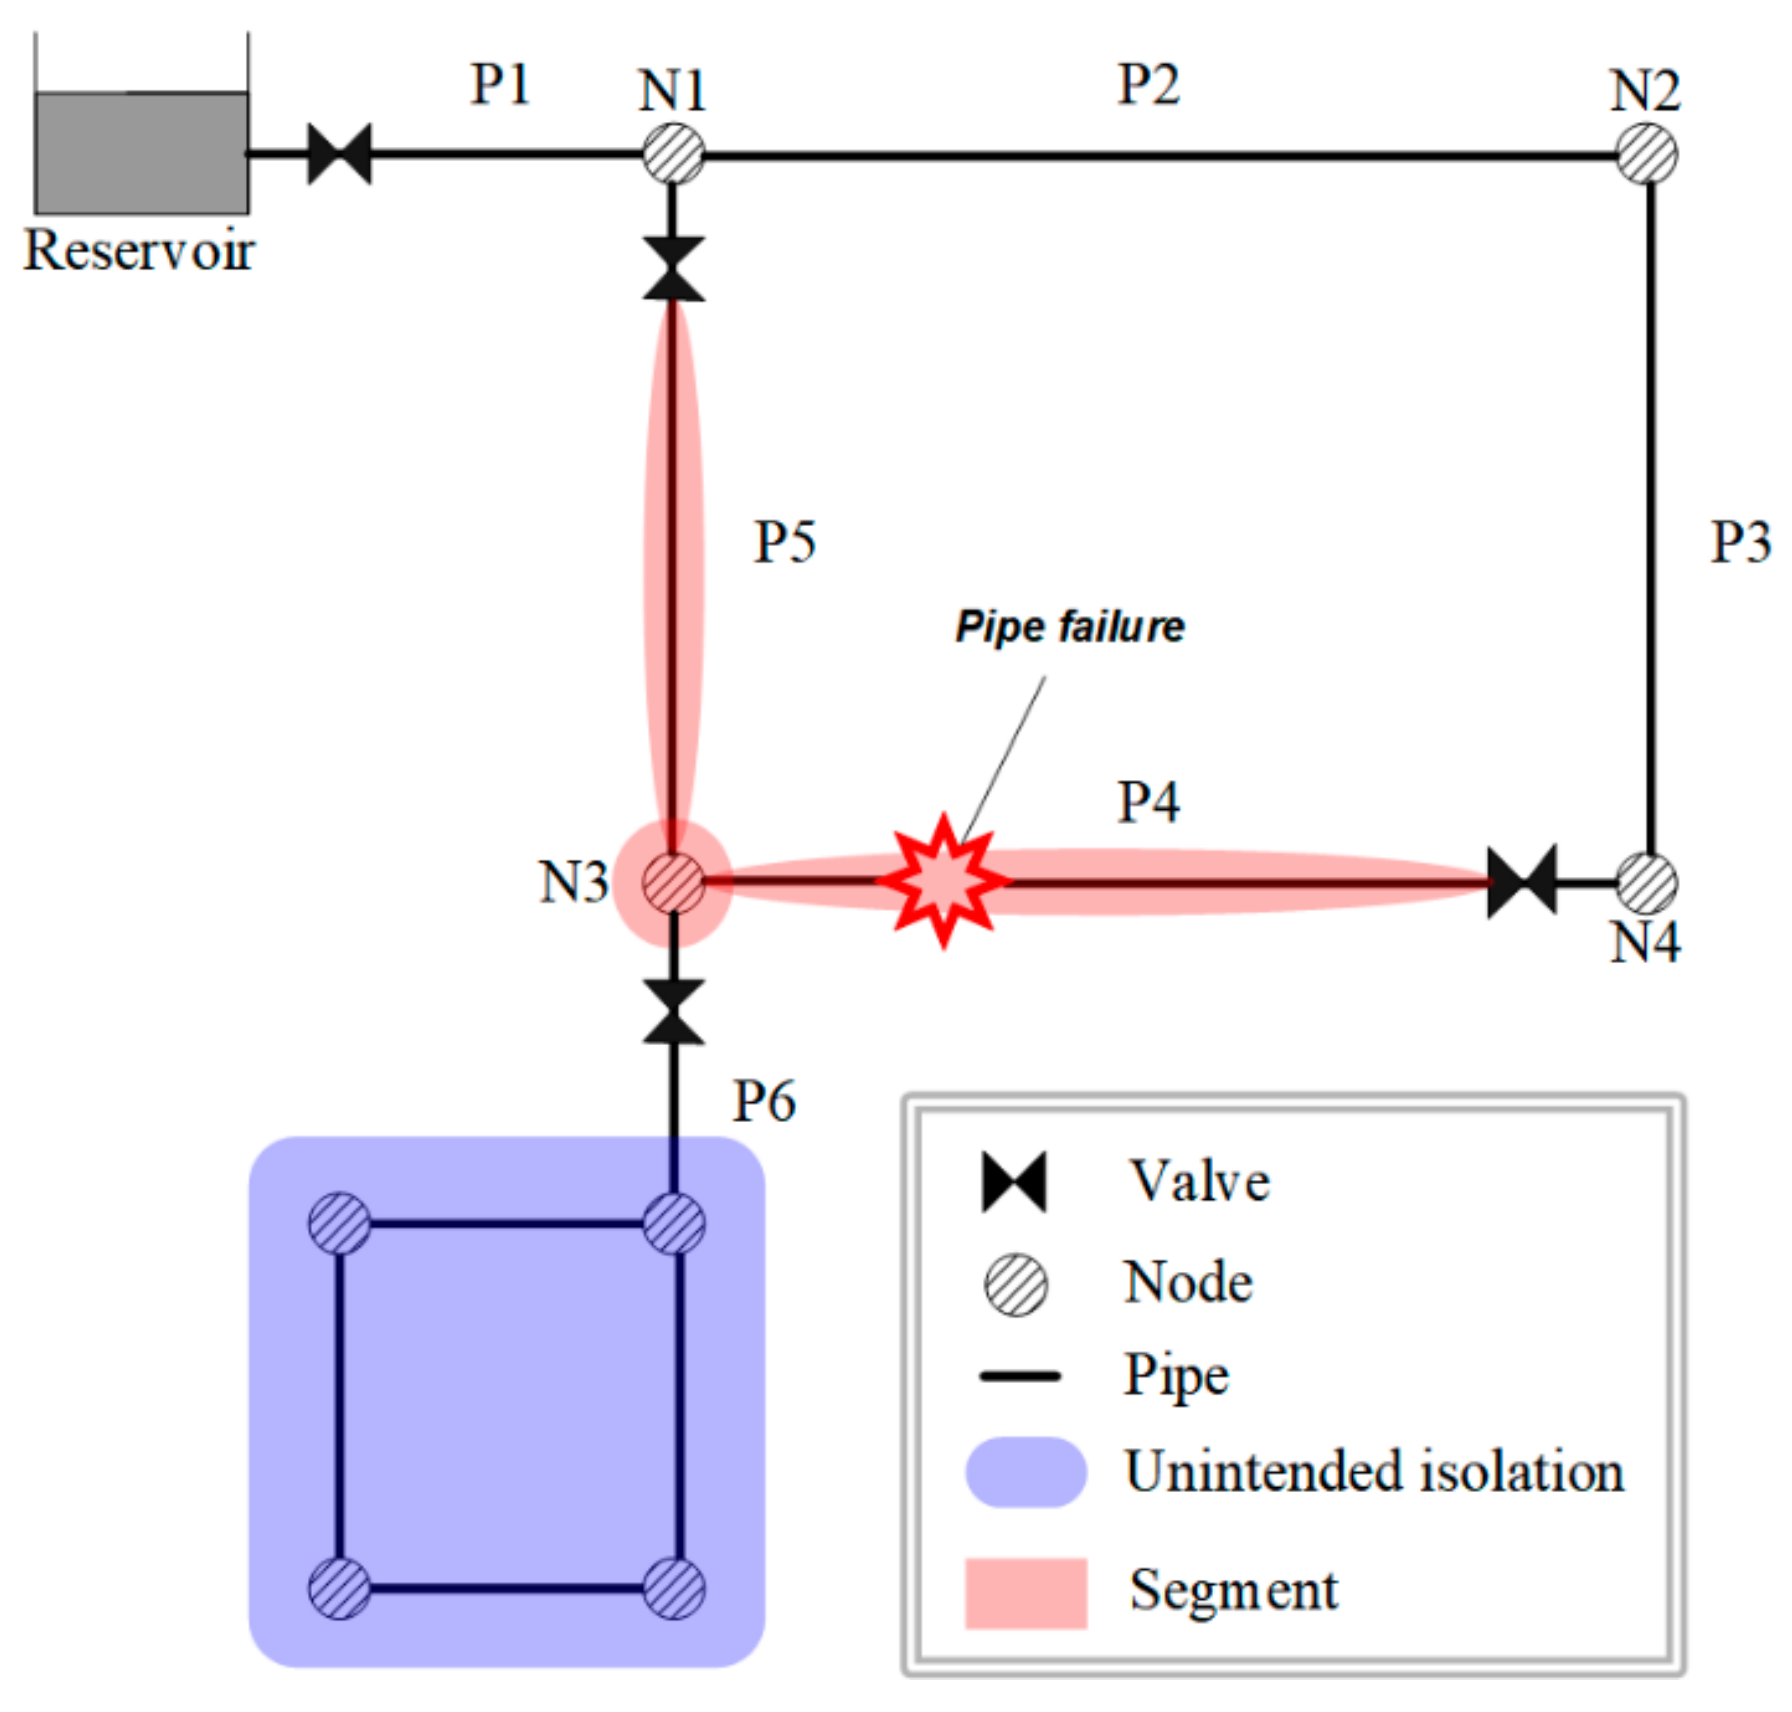
Jun, et al. [24] developed a method for practically estimating the damage extent by combining the concept of “segment” suggested by Walski [15] and the new concept of unintended isolation. Walski [15] characterized a segment as a part of a WDS which should be confined by adjacent on-off valves to repair a broken pipe. For example, as presented in Figure 1, when pipe P4 fails, the segment consisting of pipes P5, P4 and node N3 is blocked by the three on-off valves, and accordingly, water supply on node N4 is suspended. In addition to the segment that is intentionally isolated for repairing pipe P4, other parts of the network might be additionally unlinked from the source according to the network topology. Jun, Loganathan, Kim and Park [24] defined such parts as unintended isolation and developed a graph theory-based searching algorithm when a pipe is broken in the network.
2.1.2. Minimum Cut-Sets
A minimum cut-set is interpreted as the smallest subset of system components which sufficiently and necessarily induces an undesired event in the system [25]. Minimum cut-sets can be determined by a fault-tree analysis which represents the relationship between a potential event influencing system performance and reasons, system components, conditions, and so on [26]. In a fault-tree, the undesired event is called as the top event which should be clearly and unambiguously defined in terms of three factors; what, where and when [26], and sets are combinations of basic events and a cut-set is a set of basic events of which concurrent occurrence activates the top event. A cut-set is regarded as being minimal in case of that it cannot be smaller without losing its characteristic as a cut-set. In other words, when a cut-set contains another cut-set, the top event can occur with only the contained cut-set. So, the large cut-set containing the small cut-set can be excluded from the list of cut-sets.
The reliability assessment model developed by Jun, Park, Baek and Kim [14] defines a top event as follows in terms of the three factors (i.e., what, where and when) in the system.
- What: suspension of water supply and/or low pressure at any node
- Where: node(s), segment(s) and unintended isolation(s)
- When: a pipe failure
Through sequential hydraulic simulations using EPANET2 [23] as a module, minimum cut-sets were determined by the following criteria: when a pipe is broken, if there are (1) one or more nodes isolated in segment(s) or (2) unintended isolation(s) or (3) any nodes with low pressure (<150 kPa) in the network, the pipe is defined as a minimum cut-set. Note that the method regards only pipes as destructible components. In other words, mechanical failures of pumps and sources of water supply were not considered because those failures do not occur frequently and when they fail, it causes a breakdown of the whole system. Instead, the scope of this method was limited to pipe failures which occur more frequently in substance.
2.1.3. Success Mode Approach
Based on the minimum cut-sets determined in the previous step, the WDS reliability can be estimated through the success mode approach suggested by Mays [27], using Equations (1) and (2):
where r is the WDS reliability, S is the success probability, is the k-th segment defined as a minimum cut-set, and is the i-th pipe in . Namely, the WDS reliability is simply represented as a product of reliabilities of pipes which belong to the identified minimum cut-sets by assuming that the probability of simultaneous failures of two or more pipes is zero and the events are mutually exclusive. Jun, Park, Baek and Kim [14] assessed the reliability of each pipe by using the regression equations that Su, Mays, Duan and Lansey [5] derived from historical failure data of the City of St. Louis. Correspondingly, the WDS reliability represents a probability that there is not any suspension of water supply, unintended isolation and low pressure in the WDS for one year.
2.2. Proposed Framework for Improving WDS Reliability
2.2.1. General Criteria for Installing Valves and Increasing Pipe Durability
For the method described in Section 2.1, the following measures should be taken to improve the WDS reliability. The first method is to increase the durability of pipes in the minimum cut-sets. Namely, in Equations (1) and (2), if each increases, the WDS reliability accordingly improves. The second method is structurally reforming the WDS by installing on-off valves for reducing the practical extent of damage and/or constructing alternative paths to unintended isolations, by which, the number of in the equations decreases and therefore the WDS reliability increases.
For the first method (i.e., increasing pipe durability), Jun, Kim, Yoo and Kim [21] presented results of an optimization study, presenting an optimal combination of pipes maximizing the WDS reliability with constrained construction cost. It was carried out over one of the networks given in EPANET2 [23]: Cherry Hill network, Connecticut in the United States, consisting of 88 nodes, 103 pipes, 90 on-off valves and so on. As a result, the study reported the following findings/suggestions based on the optimization results:
- The WDS reliability increases by replacing existing pipes in the minimum cut-sets with more durable (i.e., larger diameters) ones represented by even with the same construction cost.
- Even though the WDS reliability linearly increases in proportion to the construction cost, the increasing rate is not significant. It means that structural modification or installing additional valves to the WDS is required to efficiently improve the WDS reliability.
Given that the structural reformation of a WDS is important for improving the reliability, three methods can be generally considered [1,2]. Those are; (1) to additionally install on–off valves (hereafter simply referred to as valve) to reduce the length of pipe to be isolated for repairing broken pipe(s), (2) to construct alternative paths to minimize unintended isolations, and (3) to construct water tanks for ensuring water supply under emergencies. Among these, the first method, installing valves, is relatively easy to implement and can effectively reduce the damage extent by pipe failures [20], which is well explained by the following example.
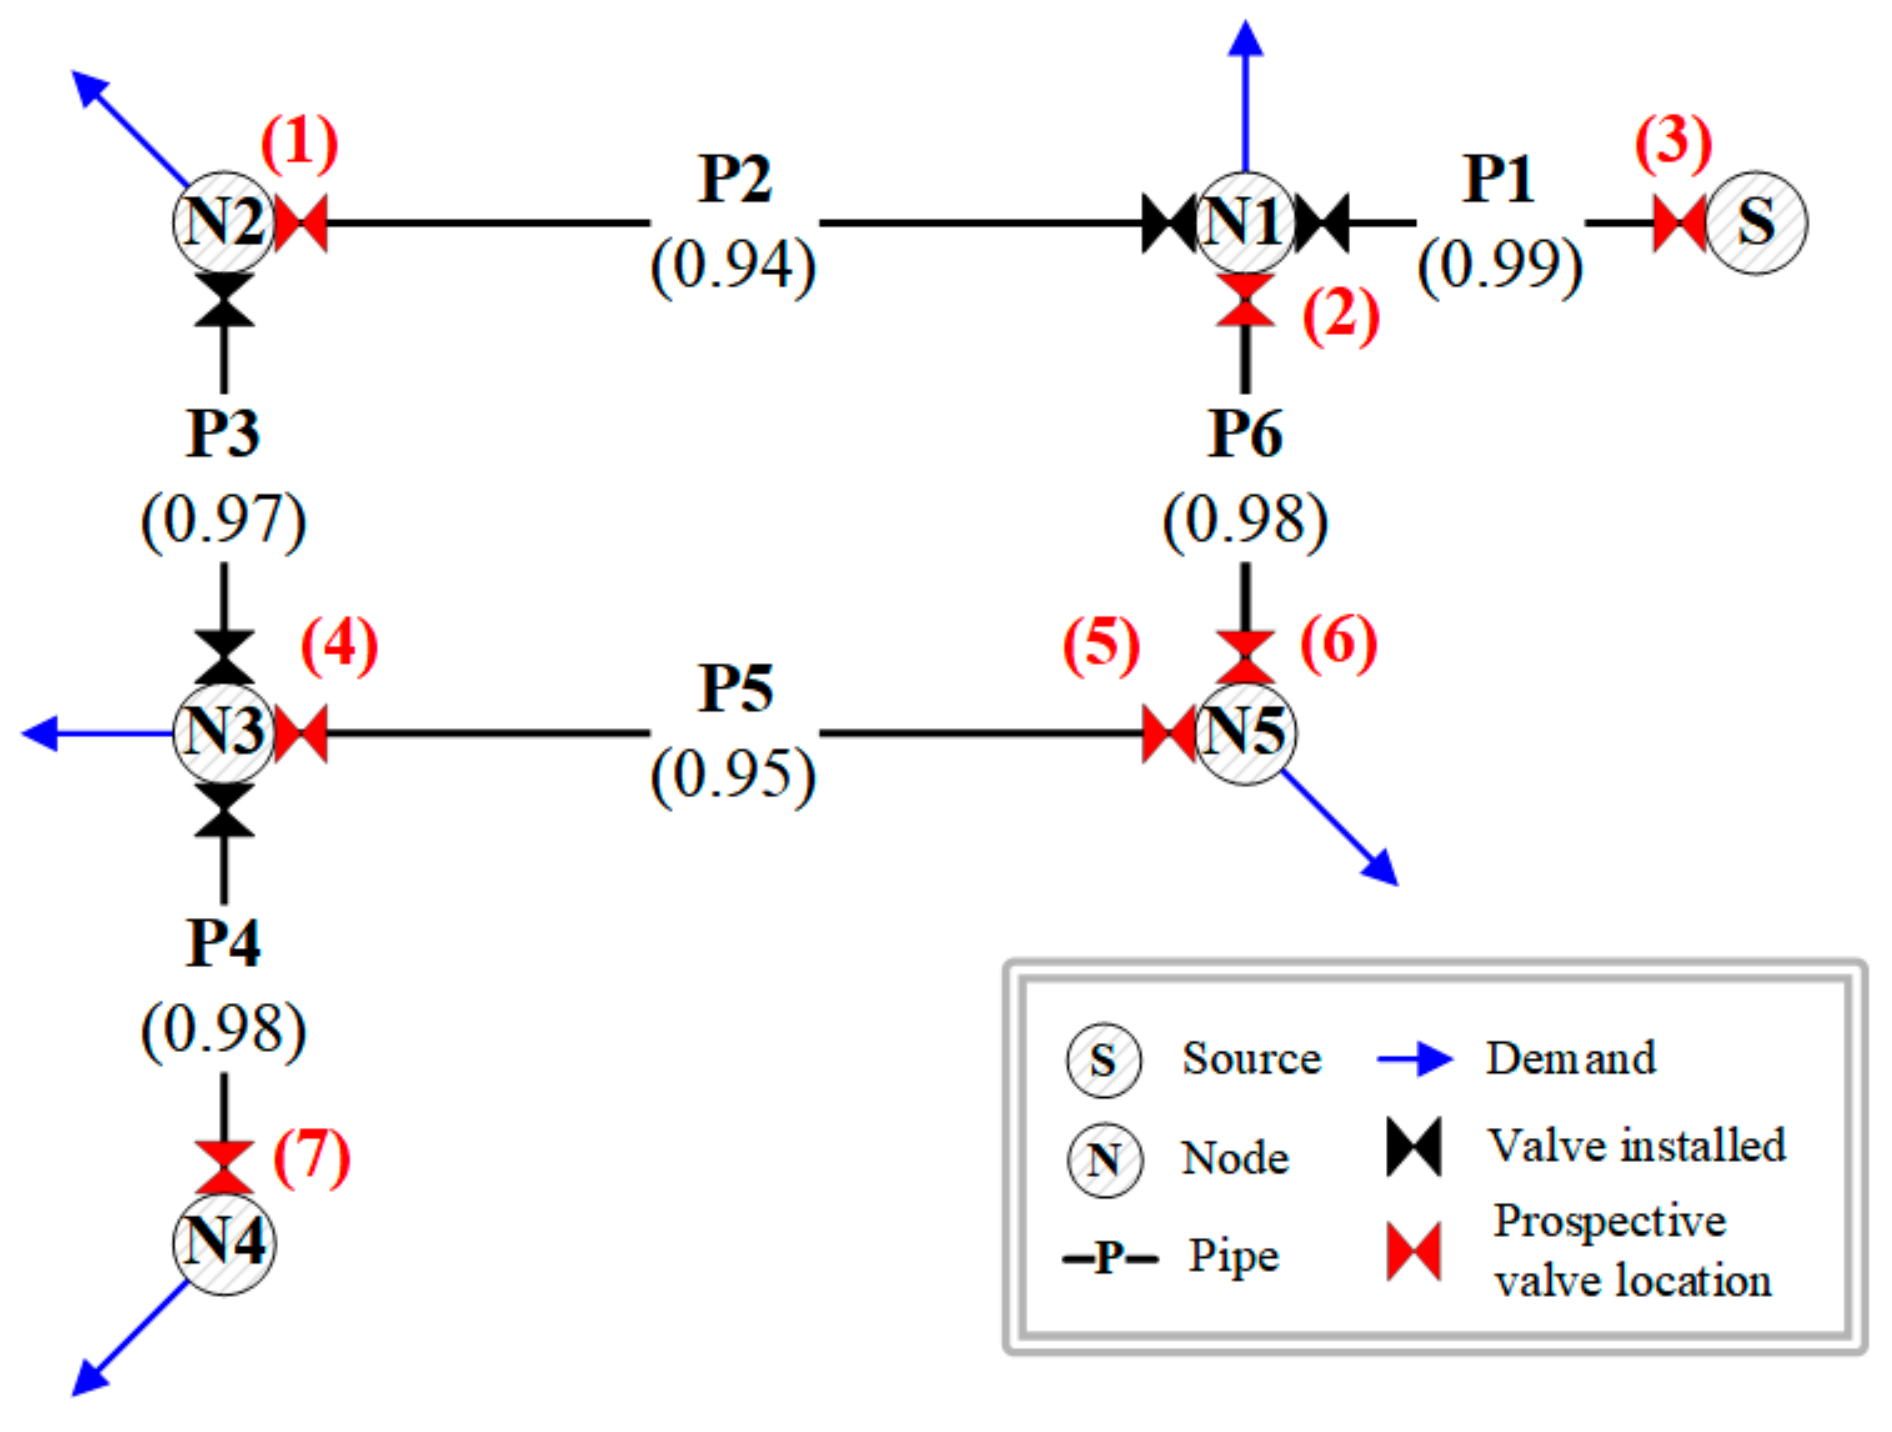
Figure 2 shows an example network where there are seven prospective locations, (1)–(7), for valve installation, and each pipe has different reliability, 0.94–0.99, respectively as presented for each pipe. For simplicity, we considered adding one or two valves and defined the unit cost for installing a valve to be 1 (unitless). Thus, Table 1 shows WDS reliability evaluated by various combinations of valve installation, where Case 1 presents the original status of the network. Here, the WDS reliability was calculated through the success mode approach expressed by Equation (1). For example, 0.903, the value for case 2, is the product of the reliability of the pipes in minimum cut-sets (P1, P4, P5 and P6), i.e., 0.903 = 0.99 × 0.98 × 0.95 × 0.98.
Case 2 presents the highest WDS reliability by installing a valve at position (1), by which P2 can be excluded from the minimum cut-sets. Therefore, any top events such as suspension of water supply, unintended isolation and low pressure, do not occur even if P2 is broken. On the other hand, for case 4, an unintended isolation occurs when P1 is broken because P1 is still in minimum cut-sets even though a valve is installed at (3), and therefore case 4 does not contribute to improving the WDS reliability. In the same manner, for case 6, when P4 is broken, an untended isolation still occurs even though a valve is installed at (7). In addition, as shown in cases 3 and 5, the WDS reliability is different according to where they are, even with the same number of valves to be installed in the WDS. In summary, the following criteria can be generally considered when installing valves.
- It is not necessary to install valves on a pipe which does not belong to minimum cut-sets. This is because the pipe does not cause any top events when broken.
- Even though some nodes can be free from a suspension of water by installing valve(s) around a broken pipe, in case the pipe breaking still causes any top event in the system, it is better to increase the durability of the pipe than installing valves.
- For a segment consisting of two or more pipes, valves should be installed for the weakest pipe. However, if the pipe with the additional valve is broken, no top event should occur in the system. If the top event still occurs due to the pipe breakage, the durability of the pipe should be increased rather than installing the valves.
2.2.2. Proposed Framework for Improving WDS Reliability
Proposed Three Types of Reinforcement
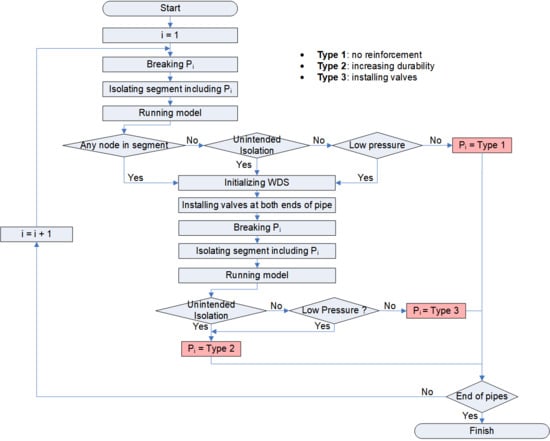
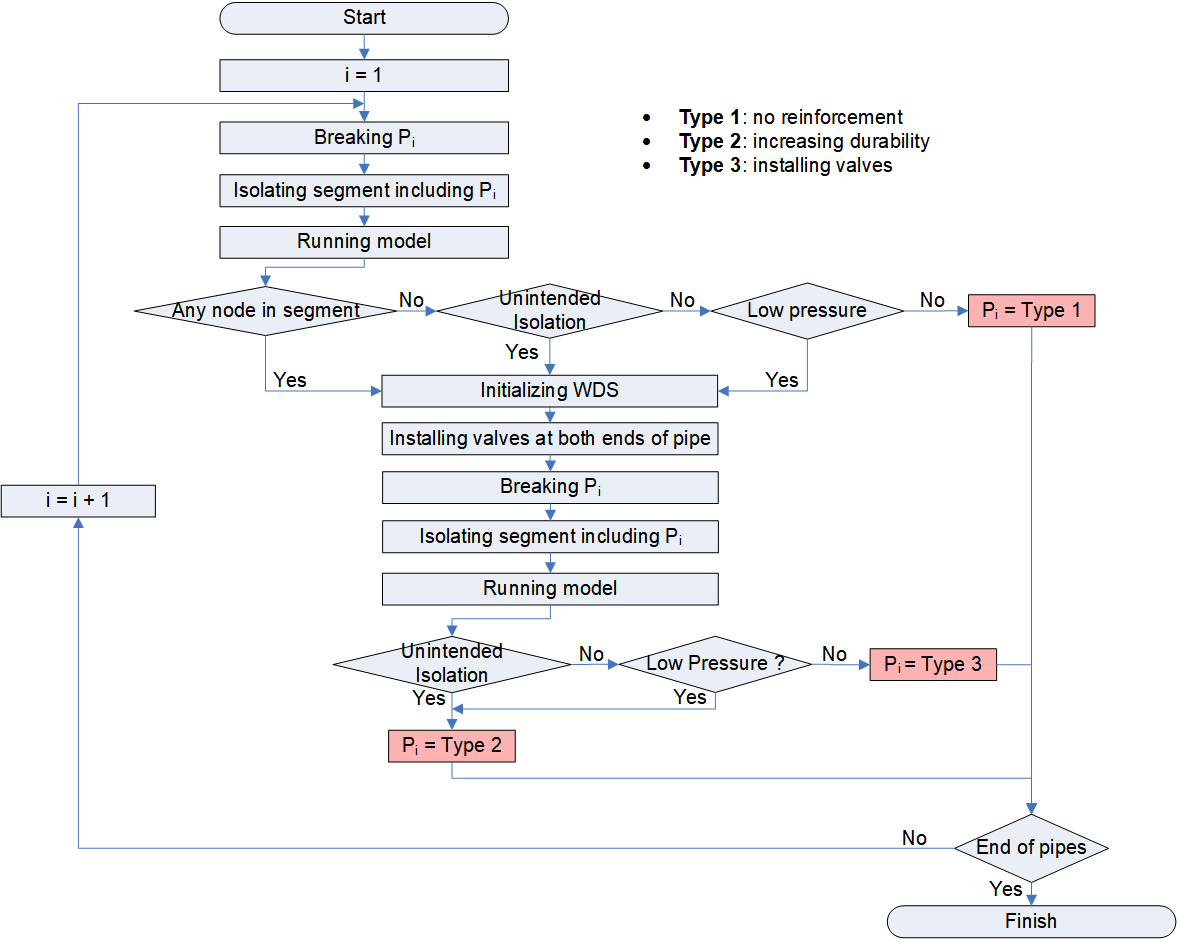
Based on the criteria described in Section 2.2.1, two methods can be generally considered for improving the WDS reliability: increasing pipe durability and installing valve(s), by which this study proposes three reinforcement types; types 1–3 according to the flow chart presented in Figure 3.
First, when a pipe is broken but does not raise any top event in the WDS, the pipe is classified as type 1 and no reinforcement is required. However, when any top event occurs in the WDS by the pipe failure, a hydraulic simulation by EPANET2 [23] is rerun after installing valve(s) at both ends of the broken pipe to check if any top event raises. If there is no top event, the pipe is regarded as type 3. Namely, type 3 pipes are completely isolated without causing any top events by installing one or two valves at both ends of the pipe. In this regard, it is worth noting that installing valves at all possible locations (i.e., type 3 pipes) might be useful for improving the WDS reliability. On the other hand, if any top event still occurs even after installing the valve(s), it is necessary to increase the durability of the pipe without installing the valves, and those pipes are classified as type 2.
Proposed Rules for Improving WDS Reliability
In this study, two rules, rules 1 and 2 were proposed for improving the WDS reliability according to the priority of reinforcement. While rule 1 focuses on improving the on–off WDS reliability constrained to a construction cost, rule 2 prioritizes reducing the damage by pipe failures.
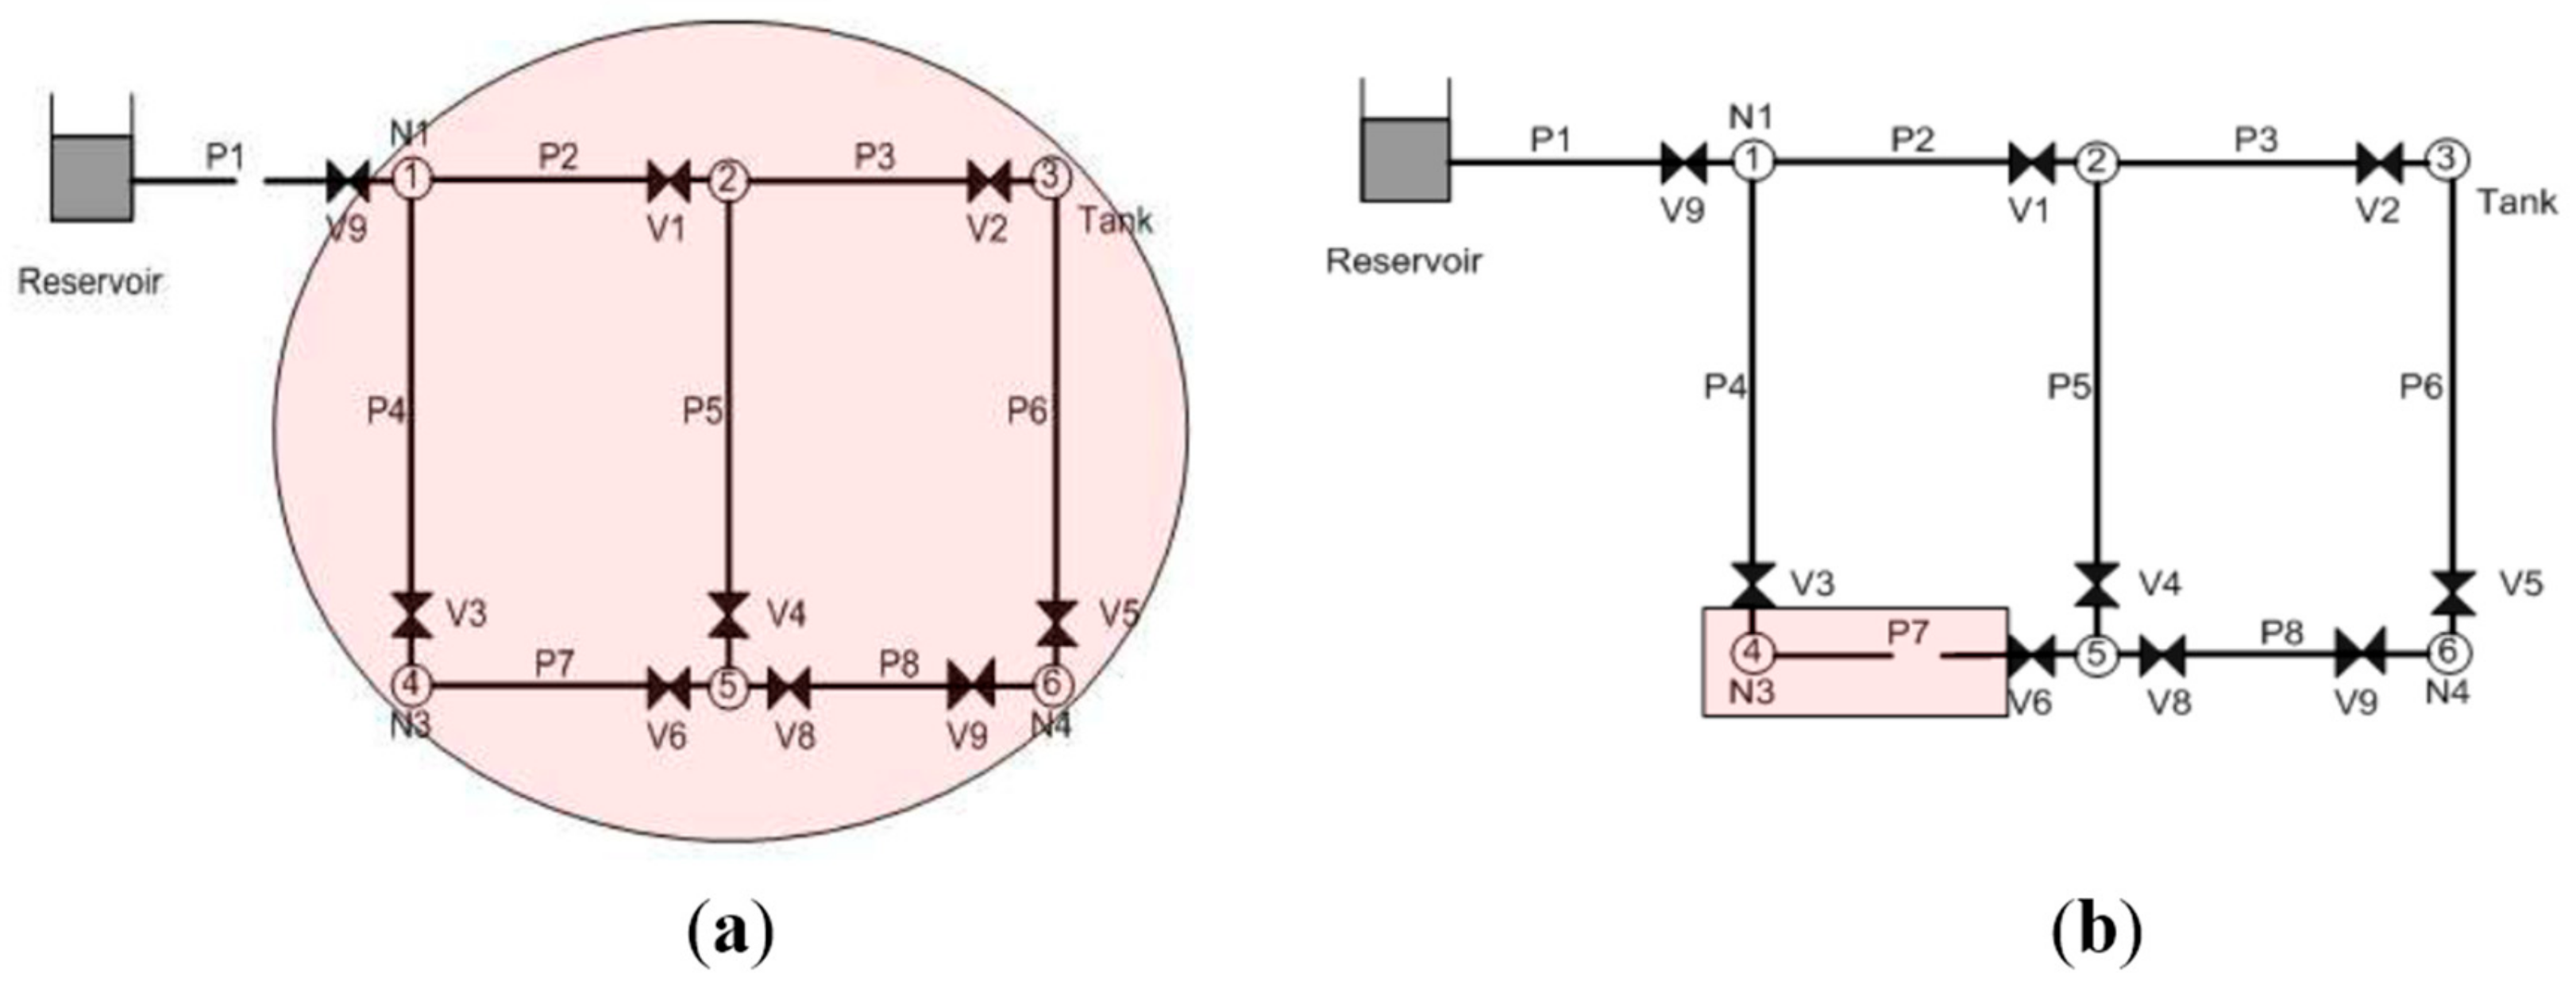
When a pipe in minimum cut-sets is broken, the model presented by Jun, Park, Baek and Kim [14] treats it as a system-off state regardless of damage size. However, the damage size by case would be significantly different. As shown in Figure 4, presenting two example cases of damage extent by pipe failures in a WDS, in case 1 (Figure 4a), if the reliability of P1 is 0.9 and 100 customers belong to the segment including P1, the expected number of customers out of service is calculated as (1 − 0.9) × 100 = 10. In contrast, in case 2 (Figure 4b), if the reliability of P7 is low at 0.5, but the number of customers is only 10, the expected number of customers out of service is only (1 − 0.5) × 10 = 5. That is, even though P1 is more reliable than P7, the damage size of case 1 is larger than case 2. Therefore, rule 1 has a role of lowering the system-off probability and so P7 has higher priority of reinforcement than P1, but rule 2 has a purpose of reducing the damage size by reinforcing P1 before P7. Namely, both rules follow the same method to determine the reinforcement type, but different priorities are applied.
After all pipes in a WDS are classified as types 1 to 3, then rule 1 is simply applied to the WDS from the lowest-reliability pipe, where the regression equations derived by Su, Mays, Duan and Lansey [5] were used for calculating the pipe reliability. Rule 2, on the other hand, aims to effectively reduce the damage size caused by pipe failures. To do this, it is first necessary to quantify the damage size. When a pipe is broken, the segment having the broken pipe should be isolated for repairs by shutting off adjacent valves, and in some cases, an unintended isolation may occur according to the topological structure of the WDS. Therefore, the damage size is directly related to water demand in isolated segments and/or unintended isolations. In rule 2, the priority order of reinforcement should be determined by checking the system on a per-segment basis, but rule 1 does the prioritization through a pipe-by-pipe wise. As a segment loses its function if any pipe in the segment is broken, all pipes in the segment are to be normal if the segment was operational. Therefore, the probability that a segment is in a normal status is calculated as
where is the probability that the i-th segment in minimum cut-sets is operational, is the probability that the j-th pipe in the segment is operational, M is the number of pipes in the segment.
The probability that the segment is not operational (i.e., ) can be simply calculated as
The number of customers out of service (N) can be estimated from the actual population in the isolated zone. In case of that related data does not exist, it can be approximately calculated as
where Q is the average water quantity used per person that was simply assumed as 171 gallon/day/person (0.65 m3/day/person) in this study based on United States Geological Survey Circular 1405: Estimated Use of Water in the United States in 2010 [28], in which the assumed value belongs to the highest category; is water demand at the kth node in the isolated zone; and O is the number of nodes in the zone.
Rule 2 first considers the segment with the largest N and preferentially strengthens the lowest-reliability pipe in the segment. After determining the reinforcement priority, the remaining procedure is identical to those of rule 1.
Finally, the expected number of customers out of service (EN) is calculated for evaluating the improvement as
3. Results and Discussion
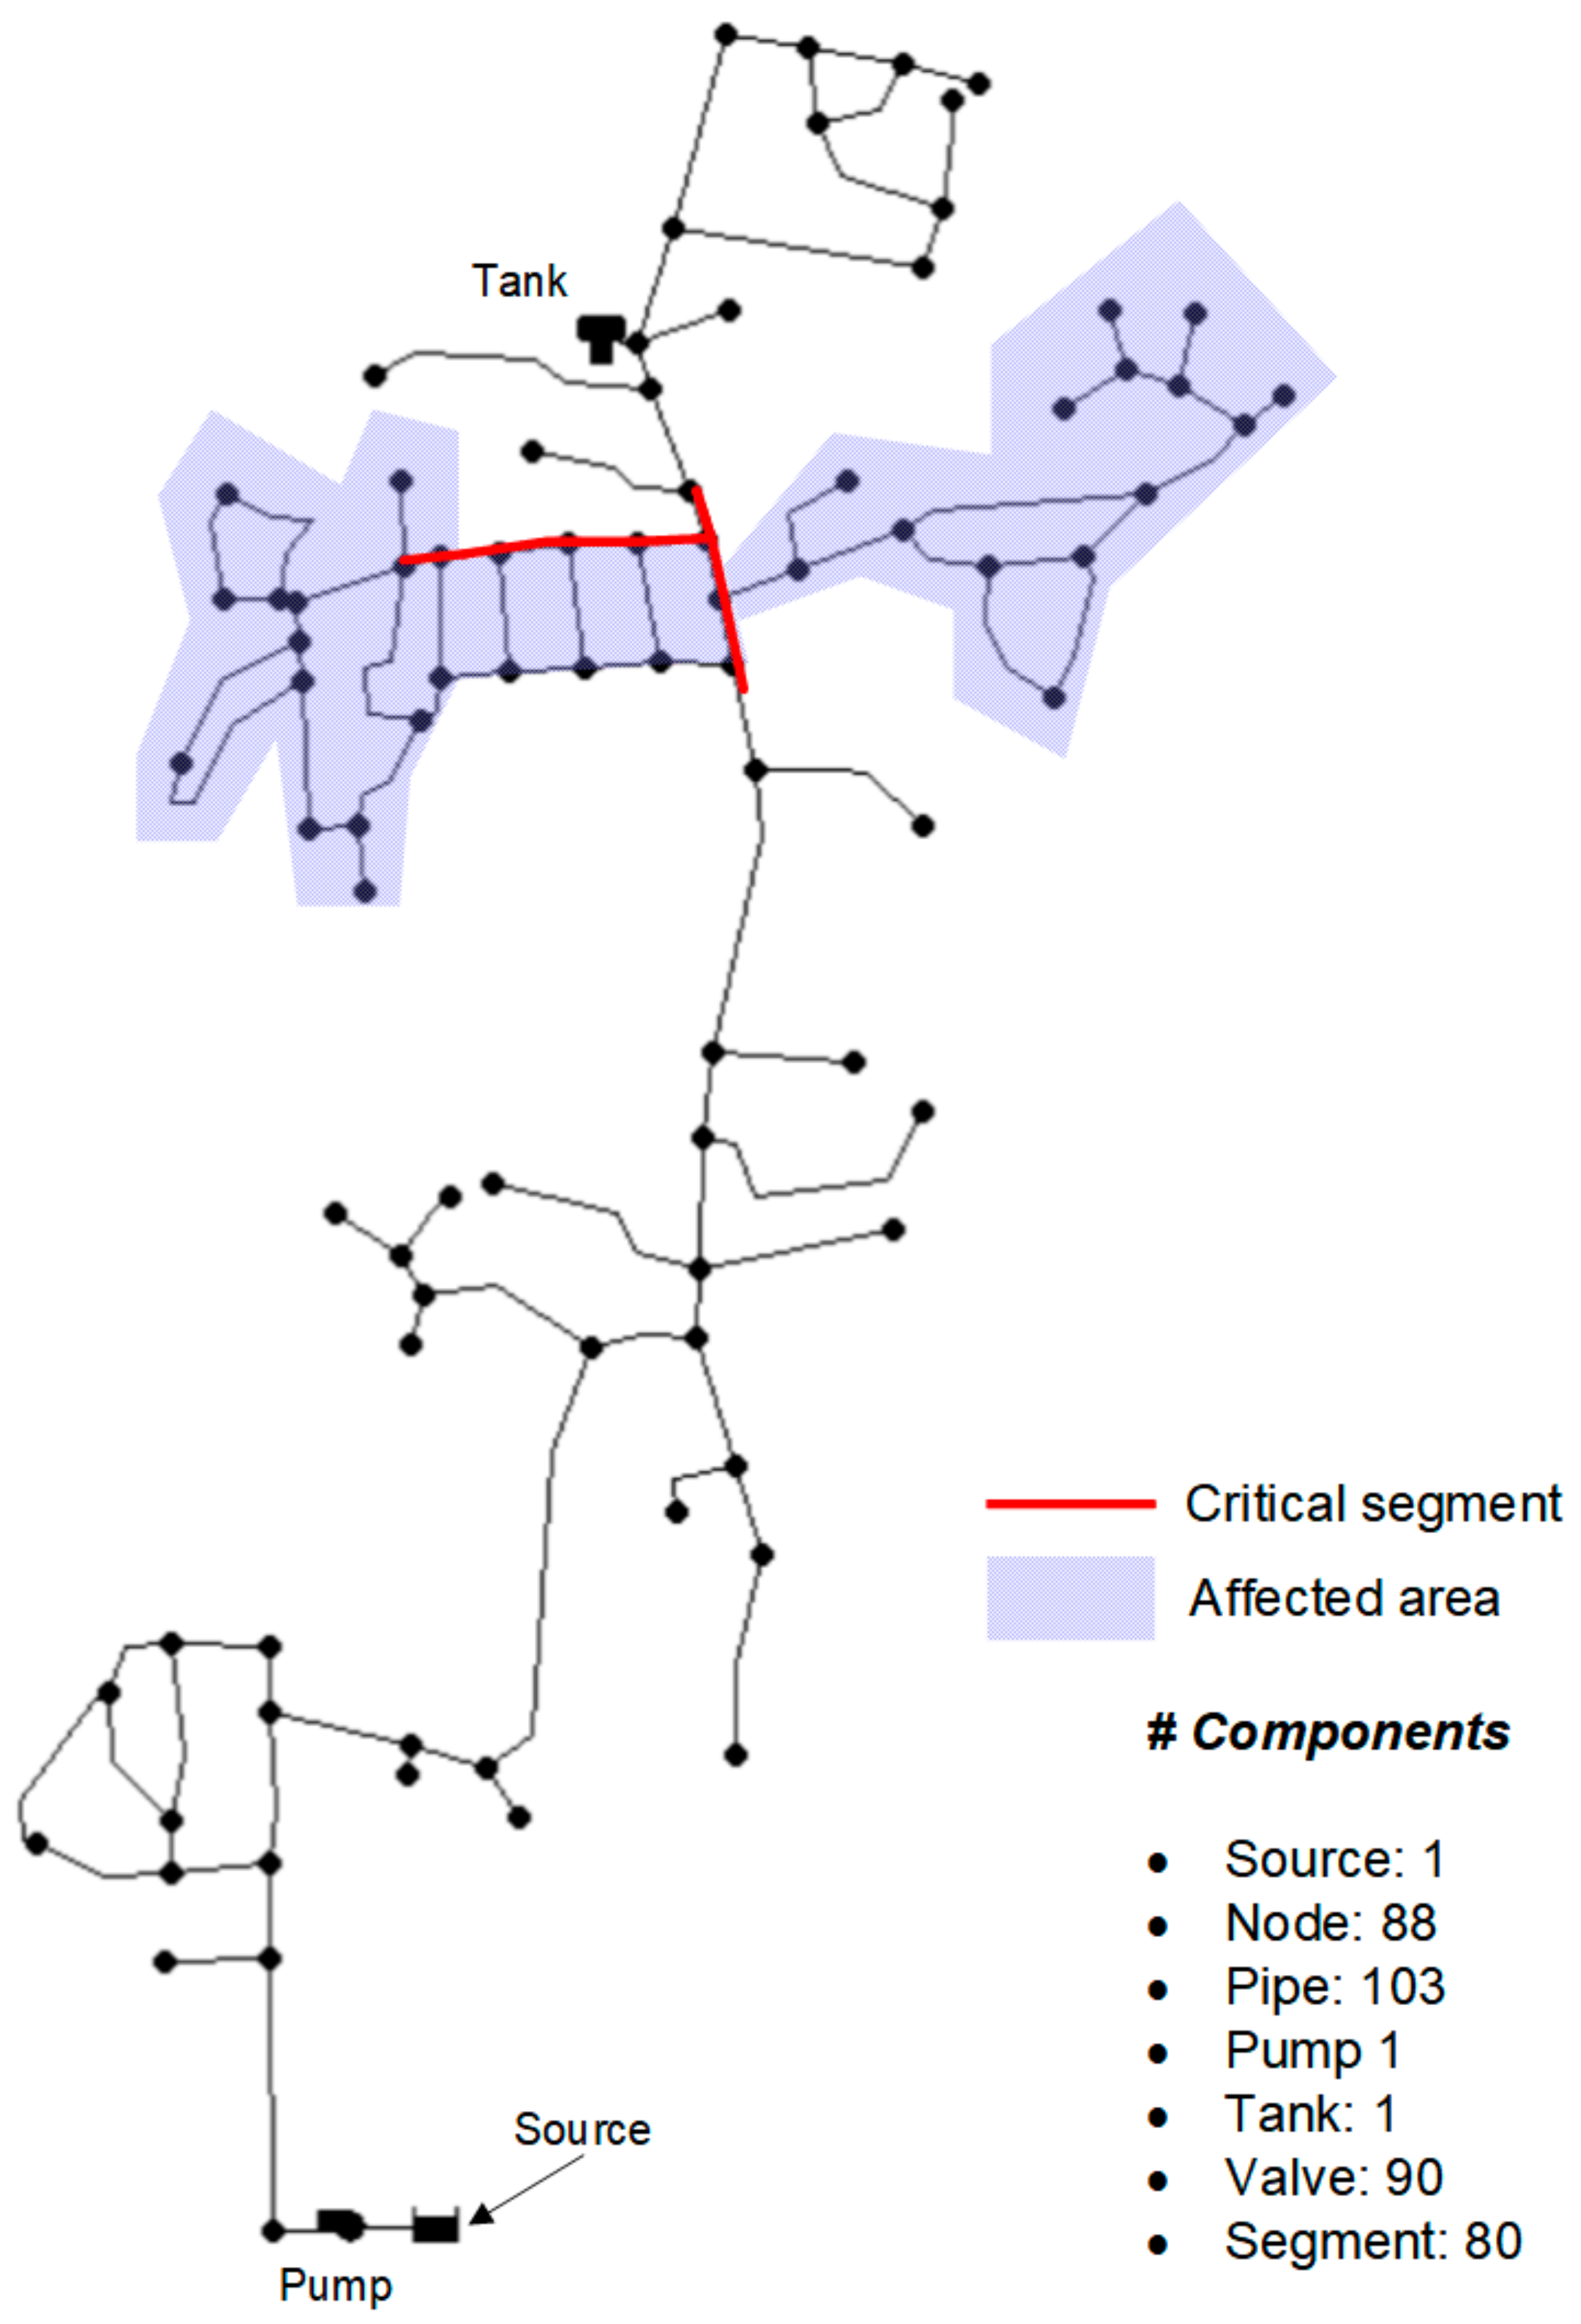
Rules 1 and 2 were applied to Cherry Hill network shown in Figure 5. Equations (7) and (8), suggested by the Korea Water Resources Corporation [29], were used for calculating costs for pipe replacement and valve installation according to pipe diameter (D) and length (L). The units for cost, D and L were converted to United States Dollar (USD), inches and feet respectively for consistency with those of Cherry Hill, and the applied exchange rate was 1000 Korean Won = 1 USD.
3.1. Application Results of Rules 1 and 2
As presented in the first row of Table 2, topological/reliability properties of the original Cherry Hill network are that; (1) the initial WDS reliability is 0.137, (2) the number of pipes in minimum cut-sets is 90 out of 103, (3) the number of segments is 80, and (4) the EN was 286.
For applying rule 1, every 10 pipes were sequentially reinforced from the lowest-reliability pipe according to the three reinforcement types identified by the flow chart in Figure 3. On the contrary, rule 2 first considers the segment having the largest N for reinforcement in which the lowest-reliability pipe is preferably improved. For simplification in applying both rules 1 and 2, type 2 pipes were replaced with ones of which diameter is 2 inches larger. Each case of the reinforcements is represented as cases 1–9 and results are summarized in Table 2. and detailed results of applying rules 1 and 2 are presented in Tables S1 and S2, respectively, in Supplementary Materials.
For both rules, the total reinforcement cost was $2.674 million, and the number of installed valves was 69, and the WDS reliability was improved to 0.483 after the reinforcements representing the probability is 48.3% that there is not any top event in the system for one year. In addition, the EN decreased from 286 to 57, and the number of pipes in minimum cut-sets reduced from 90 to 40 by adding 69 valves in the system while the number of segments increased from 80 to 149.
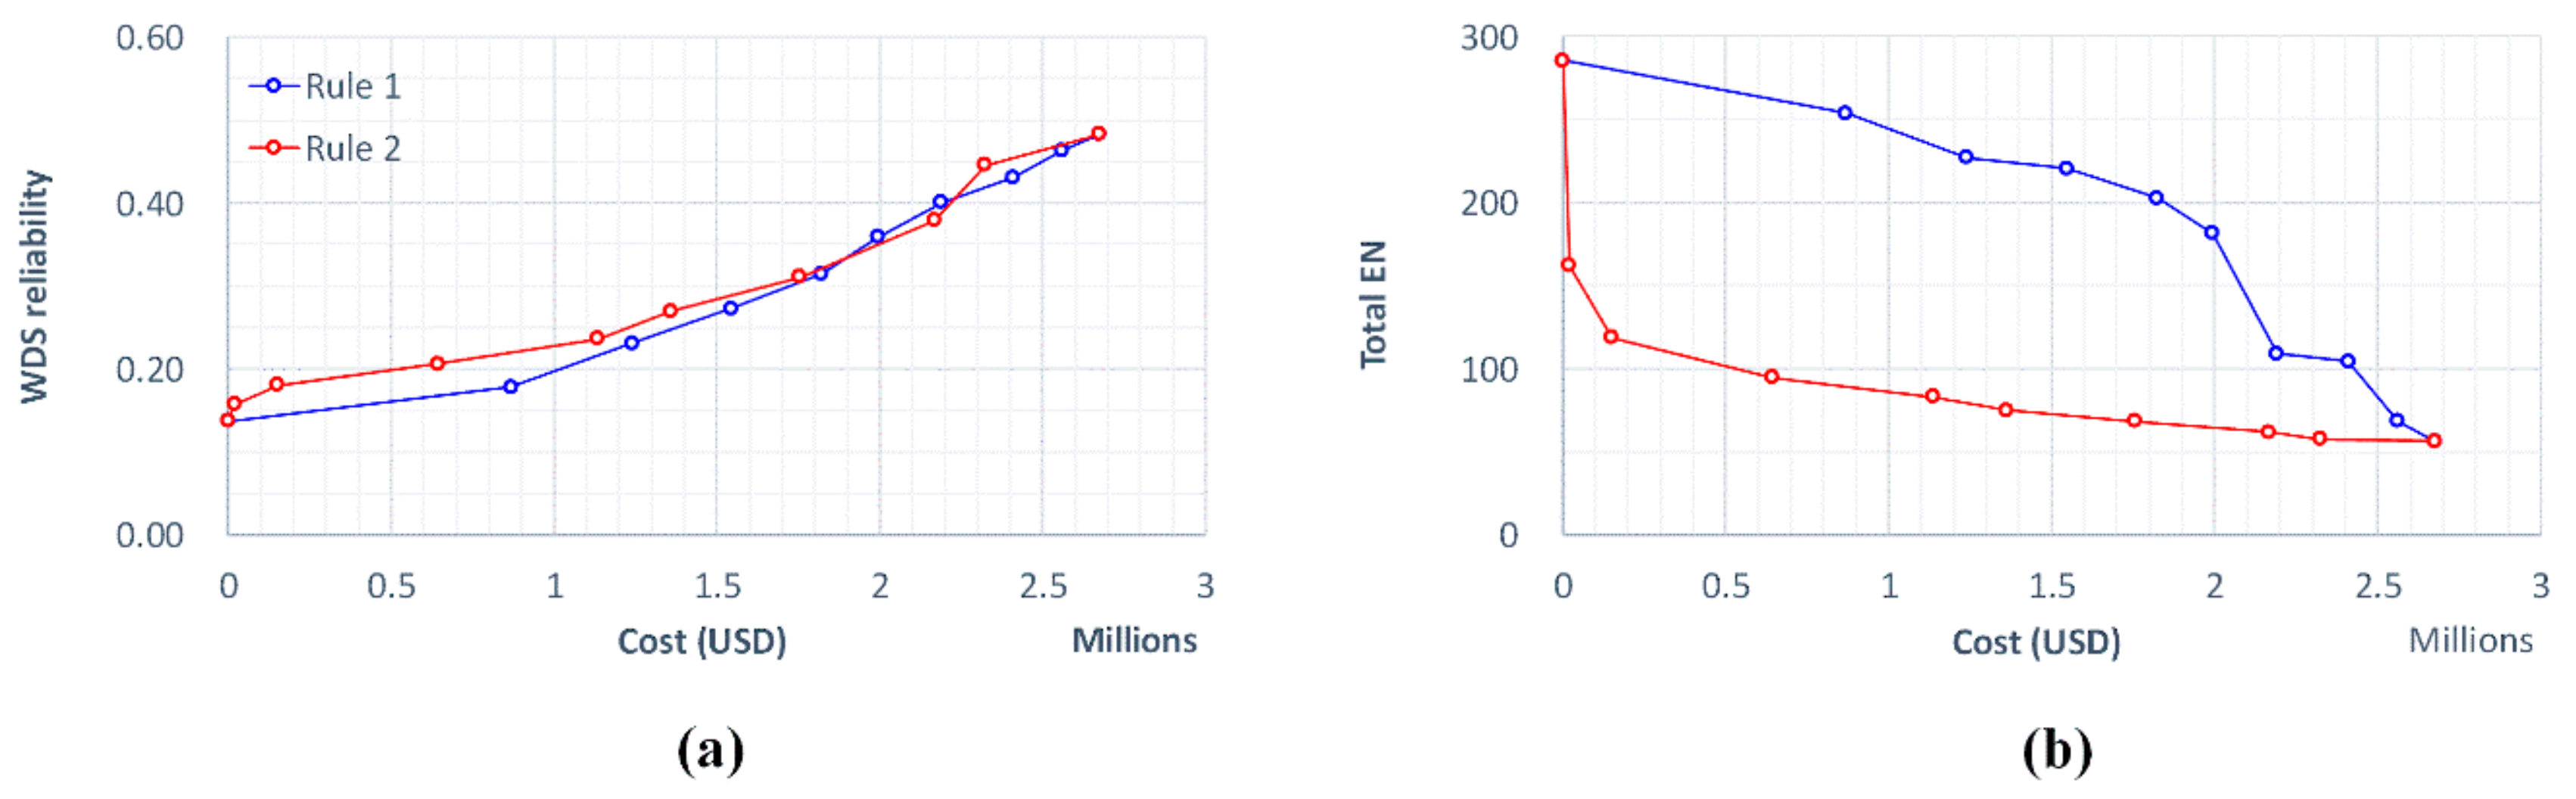
Although both rules 1 and 2 reached the identical results at the final stage, the intermediate process was significantly different from each other as compared in Figure 6.
While both Rules 1 and 2 present similar trends in WDS reliability with increasing cost (Figure 6a), it is worth noting that there exist significant differences for how the EN varies with the cases (Figure 6b). The notable drop from 286 to 161 in the total EN for case 1 in applying rule 2 due to the reinforcement of a segment denoted by the red line in Figure 5. The critical segment, consisting of seven pipes, induces a large number of N (i.e., N = 1182, see Case 1 of Table S2 in Supplementary Materials) over the affected area shaded in Figure 5, when any pipe of the segment is broken and it is isolated by eight adjacent valves. All pipes in the segment were type 3 (i.e., valve installation), and the damage extent by the failure of the segment can be greatly reduced by installing 12 valves on the pipes. This means that rule 2 was useful not only for efficiently decreasing the EN, but also for detecting vulnerable zones in a WDS.
In spite of these notable results, it is important to note that the cost of replacing a pipe is generally much higher than the cost of installing a valve. In the case of improving Cherry Hill by rules 1 and 2, the cost of installing 69 values was only 2.54% of the total cost. Moreover, it is common that the laying of the pipe is significantly restricted by various field conditions [1]. In this regard, this study further implemented an alternative approach in a practical manner which is comparable to the above-presented results. As 40 pipes are type 2 and 50 are in Type 3 among the 90 pipes in the minimum cut sets, 69 valves were first installed on the type 3 pipes and then only two type 2 pipes of which reliability is lower than 0.95 were replaced with new ones of which reliability is more than 0.95. As the results are compared and summarized in Table 3, it is surprising that the improved WDS reliability (0.423) close to that of the rule-based approach (0.483), with only 21% of the construction cost of the rule-based approach. Therefore, it is generally proposed to maximize valve installation and minimize piping replacement to improve WDS reliability, which is effective at a given budget that is consistent with previous research [30,31,32].
3.2. Caveats and Follow-Up Studies
There are some discussion points worth investigating in future studies.
First, the model for estimating the WDS reliability [14] has room for improvement. The model only considers the on-off state by detecting any top events in the system (i.e., suspension of water supply, unintended isolation and low pressure at any node) regardless of the damage size. However, as noted from the results of rules 1 and 2 in this study, it is important to consider both points of view in order to make a reasonable decision to improve the WDS.
Second, it may also be useful to evaluate WDS reliability more practically to account for catastrophic situations that cause concurrent component failures [4,32]. In this study, it was used for the hydraulic simulations demand-driven analysis (DDA) through EPANET2 which is suitable for analyzing systems under normal status. DDA can cause unrealistic hydraulic conditions, such as negative pressures, since node requirements are always assumed to be satisfied [19,27]. Even though the simulations with single-pipe failures in this study might not significantly cause such unrealistic situations, it is necessary to adopt pressure-driven analysis (PDA) or quasi-PDA which is more appropriate for simulating abnormal conditions [33,34,35,36].
Third, additional points need to be considered for more substantial improvements of WDS. The noticeable reduction in the expected number of customers out of service in the early stage of rule 2, reported in Section 3.1, may be limited to Cherry Hill due to the critical segment noted in Figure 5, so applications over a variety of networks are essential for general conclusions. It is also required to develop equations for calculating the pipe reliability by reflecting natural and artificial characteristics of the region. The equation used in this study was developed by using pipe failure records obtained from the City of St. Louis [5] which is questionable for applications over other areas. In addition to this, it is also needed to investigate other methods such as constructing alternative paths with laying pipes and installing water tanks even though installing valve(s) was only considered to structurally improve WDSs in this study.
Lastly, this study only suggests general guidelines for how to improve the WDS reliability. It is necessary to consider benefit-cost relationships and site conditions for optimally determining how to implement WDS enhancements in terms of timing and locations.
4. Summary and Conclusions
In this paper, we proposed a framework to rationally improve the system reliability based on the reliability evaluation model developed by Jun, Park, Baek and Kim [14]. The model [14] was used to assess and improve the WDS reliability and is featured by three modules for identifying unintended isolations, defining minimum cut-sets by the top events, and reliability evaluation through the success mode approach.
The proposed framework begins by classifying pipes in the system into three reinforcement types, types 1–3, through topological analyses and hydraulic simulations. Type 1 pipes need not be reinforced, type 2 pipes are to be improved by increasing the durability, and one or two valves are installed at both ends of type 3 pipes. Then two approaches, rules 1 and 2, were proposed for improving the WDS reliability depending on their purposes. Rule 1 gives priority to pipes with the lowest reliability that can improve the on-off system reliability, while rule 2 focuses on reducing damage caused by pipe failures.
The proposed framework was applied to Cherry Hill network, and significantly improved the WDS reliability from 0.137 to 0.483 by replacing pipes and installing valves by the reinforcement types along with rules 1 and 2. Although both rules eventually yielded the same results at the final stage, the interim process was notably different with regard to the expected number of customers out of service. Rule 2 showed a sharp decline in the early stages with several valves installed in a critical segment in which many customers are out of service when any pipe in the segment failed. This result means that rule 2 is useful not only to reduce damage but also to detect vulnerable areas of WDS. Besides, results with a practical approach were also presented by referring that the cost of installing a valve is much lower than the cost of replacing a pipe. For this purpose, firstly, valves were fully installed for type 3 pipes, and then only two type 2 pipes with relatively low reliability were replaced with larger-diameter pipes. As a result, the alternative approach provided improved WDS reliability (0.423) close to that of the rule-based approach (0.483) using only 21% of the construction cost by the rule-based approach. Therefore, for effectively increasing the WDS reliability, it is generally recommended to install valves as much as possible, but not replace pipes unless it is essential.
In conclusion, this approach can be a guideline for improving WDS reliability in limited budget and site conditions.
Supplementary Materials
The following are available online at https://www.mdpi.com/2073-4441/11/7/1524/s1, Table S1: Detailed results of applying rule 1, Table S2: Detailed results of applying rule 2.
Author Contributions
Conceptualization, S.K., H.D.J. and J.H.K.; methodology, S.K. and H.D.J.; software, H.D.J. and S.K.; validation, S.K.; formal analysis, S.K.; investigation, S.K. and D.G.Y.; writing—original draft preparation, S.K.; writing—review and editing, H.D.J., D.G.Y. and J.H.K.; visualization, S.K.; supervision, H.D.J. and J.H.K.; project administration, H.D.J.; funding acquisition, J.H.K.
Funding
This work was supported by the National Research Foundation of Korea (NRF) grant funded by the Korea government (MSIT). (No. 2019R1A2B5B03069810).
Conflicts of Interest
The authors declare no conflict of interest.
References
- Mays, L.W. Water Distribution Systems Handbook; McGraw-Hill: New York, NY, USA, 2000. [Google Scholar]
- Walski, T.M.; Chase, D.V.; Savic, D.A.; Grayman, W.; Beckwith, S.; Koelle, E. Advanced Water Distribution Modeling and Management; Bentley Institute Press: Crewe, UK, 2003. [Google Scholar]
- Andreou, S.A.; Marks, D.H.; Clark, R.M. A new methodology for modelling break failure patterns in deteriorating water distribution systems: Theory. Adv. Water Resour. 1987, 10, 2–10. [Google Scholar] [CrossRef]
- Yoo, D.G.; Jung, D.; Kang, D.; Kim, J.H.; Lansey, K. Seismic Hazard Assessment Model for Urban Water Supply Networks. J. Water Resour. Plan. Manag. 2015, 142, 04015055. [Google Scholar] [CrossRef]
- Su, Y.; Mays, L.W.; Duan, N.; Lansey, K.E. Reliability-Based Optimization Model for Water Distribution Systems. J. Hydraul. Eng. 1987, 113, 1539–1556. [Google Scholar] [CrossRef]
- Ostfeld, A. Reliability analysis of regional water distribution systems. Urban Water 2001, 3, 253–260. [Google Scholar] [CrossRef]
- World Health Organization. Operation and Maintenance of Urban Water Supply and Sanitation Systems: A Guide for Managers; World Health Organization: Geneva, Switzerland, 1994. [Google Scholar]
- Gheisi, A.; Forsyth, M.; Naser, G. Water Distribution Systems Reliability: A Review of Research Literature. J. Water Resour. Plan. Manag. 2016, 142, 04016047. [Google Scholar] [CrossRef]
- Mays, L.W. Review of Reliability Analysis of Water Distribution Systems; Proc. Symposium: Mackay, Australia, 1996. [Google Scholar]
- Tung, Y.K. Evaluation of Water Distribution Network Reliability; Water Research Cent: Laramie, WY, USA, 1985. [Google Scholar]
- Wagner, J.M.; Shamir, U.; Marks, D.H. Water Distribution Reliability: Analytical Methods. J. Water Resour. Plan. Manag. 1988, 114, 253–275. [Google Scholar] [CrossRef] [Green Version]
- Yazdani, A.; Jeffrey, P. Complex network analysis of water distribution systems. Chaos Interdiscip. J. Nonlinear Sci. 2011, 21, 16111. [Google Scholar] [CrossRef] [PubMed]
- Wagner, J.M.; Shamir, U.; Marks, D.H. Water Distribution Reliability: Simulation Methods. J. Water Resour. Plan. Manag. 1988, 114, 276–294. [Google Scholar] [CrossRef] [Green Version]
- Jun, H.D.; Park, J.I.; Baek, C.W.; Kim, J.H. A Segment-based Minimum Cutset Method for Estimating the Reliability of Water Distribution Systems. J. Korea Water Resour. Assoc. 2007, 40, 735–742. [Google Scholar] [CrossRef]
- Walski, T.M. Water distribution valve topology for reliability analysis. Reliab. Eng. Syst. Saf. 1993, 42, 21–27. [Google Scholar] [CrossRef]
- PieTrucha-urbaniK, K.; Studziński, A. Case Study of Failure Simulation of Pipelines Conducted in Chosen Water Supply System. Eksploat. Niezawodn. 2017, 19, 317–323. [Google Scholar] [CrossRef]
- Pietrucha-Urbanik, K.; Studziński, A. Qualitative analysis of the failure risk of water pipes in terms of water supply safety. Eng. Fail. Anal. 2019, 95, 371–378. [Google Scholar] [CrossRef]
- Studziński, A.; Katarzyna, P.U. Failure Risk Analysis of Water Distributions Systems Using Hydraulic Models on Real Field Data. Ekon. Śr. 2019, 1, 152–165. [Google Scholar]
- Gupta, R.; Bhave, P.R. Comparison of Methods for Predicting Deficient-Network Performance. J. Water Resour. Plan. Manag. 1996, 122, 214–217. [Google Scholar] [CrossRef]
- Jun, H.; Loganathan, G.V.; Deb, A.K.; Grayman, W.; Snyder, J. Valve Distribution and Impact Analysis in Water Distribution Systems. J. Environ. Eng. 2007, 133, 790–799. [Google Scholar] [CrossRef]
- Jun, H.D.; Kim, S.H.; Yoo, D.G.; Kim, J.H. Evaluation of the Reliability Improvement of a Water Distribution System by Changing Pipe. J. Korea Water Resour. Assoc. 2009, 42, 505–511. [Google Scholar] [CrossRef] [Green Version]
- Yannopoulos, S.; Mike, S. Water Distribution System Reliability Based on Minimum Cut Set Approach and the Hydraulic Availability. Water Resour. Manag. 2013, 27, 1821–1836. [Google Scholar] [CrossRef]
- Rossman, L.A. Epanet 2: Users Manual; United States Environmental Protection Agency: Cincinnati, OH, USA, 2000. [Google Scholar]
- Jun, H.; Loganathan, G.V.; Kim, J.H.; Park, S. Identifying Pipes and Valves of High Importance for Efficient Operation and Maintenance of Water Distribution Systems. Water Resour. Manag. 2008, 22, 719–736. [Google Scholar] [CrossRef]
- Fard, N.S. Determination of minimal cut sets of a complex fault tree. Comput. Ind. Eng. 1997, 33, 59–62. [Google Scholar] [CrossRef]
- Blischke, W.R.; Murthy, D.P. Reliability: Modeling, Prediction, and Optimization; John Wiley & Sons: Hoboken, NJ, USA, 2011. [Google Scholar]
- Mays, L.W. Water Supply Systems Security; McGraw-Hill: New York, NY, USA, 2004. [Google Scholar]
- Maupin, M.A.; Kenny, J.F.; Hutson, S.S.; Lovelace, J.K.; Barber, N.L.; Linsey, K.S. Estimated Use of Water in the United States in 2010; US Geological Survey: Reston, VA, USA, 2014. [Google Scholar]
- The Korea Water Resources Corporation. Development of Decision-Support System for Water Pipeline Rehabilitation (Korean); The Korea Water Resources Corporation: Daejeon, Korea, 1995. [Google Scholar]
- Gupta, R.; Baby, A.; Arya, P.; Ormsbee, L. Upgrading Reliability of Water Distribution Networks Recognizing Valve Locations. Procedia Eng. 2014, 89, 370–377. [Google Scholar] [CrossRef] [Green Version]
- Jun, H.; Loganathan, G.V. Valve-Controlled Segments in Water Distribution Systems. J. Water Resour. Plan. Manag. 2007, 133, 145–155. [Google Scholar] [CrossRef]
- Shuang, Q.; Liu, Y.; Tang, Y.; Liu, J.; Shuang, K. System Reliability Evaluation in Water Distribution Networks with the Impact of Valves Experiencing Cascading Failures. Water 2017, 9, 413. [Google Scholar] [CrossRef]
- Baek, C.W.; Jun, H.D.; Kim, J.H. Development of a PDA model for water distribution systems using harmony search algorithm. KSCE J. Civ. Eng. 2010, 14, 613–625. [Google Scholar] [CrossRef]
- Giustolisi, O.; Savić, D.; Kapelan, Z. Pressure-Driven Demand and Leakage Simulation for Water Distribution Networks. J. Hydraul. Eng. 2008, 134, 626–635. [Google Scholar] [CrossRef] [Green Version]
- Lee, H.M.; Yoo, D.G.; Kim, D.Y.; Kim, J.H. Development and Application of Pressure Driven Analysis Model based on EPANET. J. Korean Soc. Hazard Mitig. 2013, 13, 121–129. [Google Scholar] [CrossRef]
- Ozger, S.S.; Mays, L.W. A Semi-Pressure-Driven Approach to Reliability Assessment of Water Distribution Networks; Arizona State University: Phoenix, AZ, USA, 2003. [Google Scholar]
Figure 1.
Example of segment and unintended isolation.

Figure 2.
Example network for explaining structural improvement of water distribution system (WDS) by installing valves.
Figure 2.
Example network for explaining structural improvement of water distribution system (WDS) by installing valves.

Figure 3.
Flow chart for determining three reinforcement types, types 1–3. Pi: i-th pipe.

Figure 4.
Two example cases of damage extent by pipe failures, (a) case 1 by failure of P1 and (b) case 2 by failure of P7, where P: pipe; N: node; V: valve.
Figure 4.
Two example cases of damage extent by pipe failures, (a) case 1 by failure of P1 and (b) case 2 by failure of P7, where P: pipe; N: node; V: valve.

Figure 5.
Cherry Hill network used in this study, where the red line presents a critical segment causing a large affected area (shaded region) when isolated by adjacent values.
Figure 5.
Cherry Hill network used in this study, where the red line presents a critical segment causing a large affected area (shaded region) when isolated by adjacent values.

Figure 6.
Results of applying rules 1 and 2 in terms of (a) cost—WDS reliability and (b) cost—EN, where EN: expected number of customers out of service.
Figure 6.
Results of applying rules 1 and 2 in terms of (a) cost—WDS reliability and (b) cost—EN, where EN: expected number of customers out of service.


Table 1.
Results of water distribution system (WDS) reliability evaluated by valve installations for example network.
Table 1.
Results of water distribution system (WDS) reliability evaluated by valve installations for example network.
| Case | Install Location | Pipes in Minimum Cut-Sets | WDS Reliability | Total Cost |
|---|---|---|---|---|
| 1 | × | P1, P2, P4, P5, P6 | 0.849 | 0 |
| 2 | (1) | P1, P4, P5, P6 | 0.903 | 1 |
| 3 | (2), (6) | P1, P2, P4, P5 | 0.866 | 2 |
| 4 | (3) | P1, P2, P4, P5, P6 | 0.849 | 1 |
| 5 | (4), (5) | P1, P2, P4, P6 | 0.894 | 2 |
| 6 | (7) | P1, P2, P4, P5, P6 | 0.849 | 1 |
Table 2.
Results of applying rules 1 and 2, where MC: minimum cut-sets.
| Rule | Case | WDS Reliability | Number of Pipes in MC | Number of Segments | Number of Valves Installed | Cost (USD, ×106) | Total EN |
|---|---|---|---|---|---|---|---|
| - | Initial | 0.137 | 90 | 80 | - | - | 286 |
| 1 | 1 | 0.178 | 86 | 86 | 6 | 0.868 | 254 |
| 2 | 0.231 | 80 | 94 | 8 | 0.371 | 227 | |
| 3 | 0.273 | 74 | 101 | 7 | 0.305 | 221 | |
| 4 | 0.314 | 68 | 108 | 7 | 0.279 | 203 | |
| 5 | 0.359 | 61 | 118 | 10 | 0.170 | 182 | |
| 6 | 0.401 | 55 | 127 | 9 | 0.197 | 109 | |
| 7 | 0.431 | 51 | 131 | 4 | 0.220 | 105 | |
| 8 | 0.463 | 45 | 140 | 9 | 0.152 | 68 | |
| 9 | 0.483 | 40 | 149 | 9 | 0.112 | 57 | |
| 2 | 1 | 0.157 | 80 | 98 | 18 | 0.020 | 162 |
| 2 | 0.181 | 73 | 111 | 13 | 0.130 | 119 | |
| 3 | 0.206 | 69 | 116 | 5 | 0.492 | 95 | |
| 4 | 0.236 | 65 | 121 | 5 | 0.492 | 83 | |
| 5 | 0.269 | 58 | 130 | 9 | 0.226 | 75 | |
| 6 | 0.311 | 54 | 135 | 5 | 0.394 | 69 | |
| 7 | 0.379 | 49 | 140 | 5 | 0.412 | 62 | |
| 8 | 0.446 | 42 | 147 | 7 | 0.156 | 58 | |
| 9 | 0.483 | 40 | 149 | 2 | 0.351 | 57 | |
| - | - | 69 | 2.674 |
Table 3.
Comparisons of reinforcement results by rule-based and practical approaches, where EN: expected number of customers out of service.
Table 3.
Comparisons of reinforcement results by rule-based and practical approaches, where EN: expected number of customers out of service.
| Item | From | To | |
|---|---|---|---|
| Rule-Based | Practical | ||
| Cost (USD, ×106) | - | 2.674 | 0.549 |
| WDS reliability | 0.137 | 0.483 | 0.423 |
| Total EN | 286 | 57 | 64 |
© 2019 by the authors. Licensee MDPI, Basel, Switzerland. This article is an open access article distributed under the terms and conditions of the Creative Commons Attribution (CC BY) license (http://creativecommons.org/licenses/by/4.0/).
Share and Cite
MDPI and ACS Style
Kim, S.; Jun, H.D.; Yoo, D.G.; Kim, J.H. A Framework for Improving Reliability of Water Distribution Systems Based on a Segment-Based Minimum Cut-Set Approach. Water 2019, 11, 1524. https://doi.org/10.3390/w11071524
AMA Style
Kim S, Jun HD, Yoo DG, Kim JH. A Framework for Improving Reliability of Water Distribution Systems Based on a Segment-Based Minimum Cut-Set Approach. Water. 2019; 11(7):1524. https://doi.org/10.3390/w11071524
Chicago/Turabian StyleKim, Seokhyeon, Hwan Don Jun, Do Guen Yoo, and Joong Hoon Kim. 2019. "A Framework for Improving Reliability of Water Distribution Systems Based on a Segment-Based Minimum Cut-Set Approach" Water 11, no. 7: 1524. https://doi.org/10.3390/w11071524
Note that from the first issue of 2016, this journal uses article numbers instead of page numbers. See further details here.