Analysis of Long-Term Trends of Annual and Seasonal Rainfall in the Awash River Basin, Ethiopia


1
Faculty of Civil and Environmental Engineering, Jimma Institute of Technology, Jimma University, Jimma, Ethiopia
2
Department of Civil, Environmental, and Construction Engineering, Texas Tech University, Lubbock, TX 79409-1023, USA
3
Department of Water Resources Engineering, Adama Science and Technology University, Adama, Ethiopia
*
Authors to whom correspondence should be addressed.
Water 2019, 11(7), 1498; https://doi.org/10.3390/w11071498
Submission received: 23 May 2019
/
Revised: 9 July 2019
/
Accepted: 11 July 2019
/
Published: 19 July 2019
(This article belongs to the Section Hydrology)
Abstract
:With climate change prevailing around the world, understanding the changes in long-term annual and seasonal rainfall at local scales is very important in planning for required adaptation measures. This is especially true for areas such as the Awash River basin where there is very high dependence on rain- fed agriculture characterized by frequent droughts and subsequent famines. The aim of the study is to analyze long-term trends of annual and seasonal rainfall in the Awash River Basin, Ethiopia. Monthly rainfall data extracted from Climatic Research Unit (CRU 4.01) dataset for 54 grid points representing the entire basin were aggregated to find the respective areal annual and seasonal rainfall time series for the entire basin and its seven sub-basins. The Mann-Kendall (MK) test and Sen Slope estimator were applied to the time series for detecting the trends and for estimating the rate of change, respectively. The Statistical software package R version 3.5.2 was used for data extraction, data analyses, and plotting. Geographic information system (GIS) package was also used for grid making, site selection, and mapping. The results showed that no significant trend (at α = 0.05) was identified in annual rainfall in all sub-basins and over the entire basin in the period (1902 to 2016). However, the results for seasonal rainfall are mixed across the study areas. The summer rainfall (June through September) showed significant decreasing trend (at α ≤ 0.1) over five of the seven sub-basins at a rate varying from 4 to 7.4 mm per decade but it showed no trend over the two sub-basins. The autumn rainfall (October through January) showed no significant trends over four of the seven sub-basins but showed increasing trends over three sub-basins at a rate varying from 2 to 5 mm per decade. The winter rainfall (February through May) showed no significant trends over four sub-basins but showed significant increasing trends (at α ≤ 0.1) over three sub-basins at a rate varying from 0.6 to 2.7 mm per decade. At the basin level, the summer rainfall showed a significant decreasing trend (at α = 0.05) while the autumn and winter rainfall showed no significant trends. In addition, shift in some amount of summer rainfall to winter and autumn season was noticed. It is evident that climate change has shown pronounced effects on the trends and patterns of seasonal rainfall. Thus, the study contribute to better understanding of climate change in the basin and the information from the study can be used in planning for adaptation measures against a changing climate.
1. Introduction
Ethiopia is an agrarian nation that is heavily dependent on rain fed agriculture. More than 85% of its population is engaged in dominantly rain-fed agriculture. The irrigation infrastructure are lacking that small variabilities in rainfall have often been translated to droughts and subsequent famines [1,2]. As the most utilized river in the country providing water to most irrigated farms, agro industries, and urban centers, the Awash River is facing a number of challenges. In recent years, the basin is experiencing increasing variability in water availability, deteriorating water quality, and increasing incidence of extreme events- droughts and flooding [3,4,5,6]. Under such conditions, improved understanding of the impact of climate change on annual and seasonal rainfall is vital for policy makers and planners to prepare and plan against the prevailing changes.
According to the Intergovernmental Panel on Climate Change (IPCC) [7], Climate change is long term deviations in mean values of climatic parameters. It is related to natural or anthropogenic activities, causing global warming directly or indirectly. Some of the major underlying human and natural drivers for the climate change are rapid industrialization, deforestation, agricultural activities, and volcanic eruptions. The activities such as fossil fuel burning driven by rapid population and economic growth increase emission of greenhouse gaseous (GHG) in to the atmosphere. The GHG have blanketing effect, allowing sun radiations in to earth’s surface but preventing reflected radiation from going back to the space. While activities such as deforestation release carbon dioxide in to the atmosphere and reduce forest cover, causing carbon dioxide sinking capacity of the earth to decline. Furthermore, the induced global warming itself causes melting of polar ice and this reduces reflective capacity of the earth, thereby increasing the proportion of solar radiations absorbed by the earth surface. This effect is termed as ice-albedo feedback effect. There are also other similar feedback mechanisms aggravating global warming, showing that global warming has ‘self-perpetuating’ nature. Overall, climate change is resulting from changes in atmospheric concertation of GHG and aerosols, in the amount of incoming solar radiation, and in the reflective properties of the earth surfaces. However, increasing amount of GHG in the atmosphere due to anthropogenic activities is the main cause of global warming in 20th century and the warming is responsible for overall climate change [7,8,9,10].
Climate change has been observed across the world, and is often related to global warming. According to the IPCC [10], the global mean temperature has been rising since 1850, and has risen by 0.6 °C in the second-half of the twentieth century. The rising temperature is widespread across the globe; but, it is at a higher rate in northern latitudes and lower in some parts of the oceans. Yet, cooling also has been experienced in a few locations [11]. The change is not limited to temperature. With the close link between the climate systems and the hydrological cycle and its components, alterations in precipitation characteristics, rising atmospheric humidity, increasing evaporation, and change in soil moisture and runoff have also occurred [8]. Accordingly, global precipitation has been increasing over the 20th century. Generally, a very small upward trend of approximately 1.1 mm per decade (with uncertainty ±1.5 mm) has been estimated in the global annual mean precipitation over the period from 1901 to 2005. However, different trends have been observed in annual precipitation across regions and locations [10,12].
In Ethiopia, the national average annual rainfall remained almost constant at least for the last 50 years [1,13]. However, trends of annual and seasonal rainfall vary widely across locations. Seleshi and Zanke [14] reported no significant trend in annual and seasonal rainfall over the central, northern, and the northwestern areas, but decreasing trends over the eastern and the southern areas of Ethiopia in the period from 1982 to 2002. Similarly, Cheung et al. [1] found no significant trend in annual and autumn rainfall (February to May) in all individual watersheds in Ethiopia but a significant decreasing trend for summer rainfall for some catchments over the period from 1960 to 2002. While Viste et al. [15] reported significantly decreasing trends in annual, spring (February to May), and summer (June to September) rainfall over the southern, eastern, and the southwestern areas but no particular trends for annual and seasonal rainfall in the central and north parts of Ethiopia. Teyso & Anjulo [16] reported increasing trends over some locations and decreasing trends over other locations for annual and seasonal rainfall in the Gamo-Gofa zone in southern Ethiopia.
Particularly for the Awash River Basin, Cheung et al. [1] and Viste et al. [15] found no significant trend (α = 0.05) in annual, summer and spring rainfall for the entire Awash River Basin over different periods. Similarly, no significant trend in annual rainfall has been reported in a number of studies for some stations in the Awash River Basin [14,17,18,19]. On the other hand, Rosell [20] found an increasing trend in annual rainfall in six out of the seven stations in the Awash River Basin; whereas, Bekele et al. [18] and Asfaw et al. [21] reported a significant decreasing trend in annual rainfall over some stations in the basin. There are clear contradictions on results for the Awash River basin among the existing publications both for annual and seasonal rainfall.
Trends can be detected using either parametric or non-parametric tests. The parametric test is based on an assumption that the sample data come from a population that follows a normal distribution. The parametric tests have higher efficiency and power than the non-parametric test for normally distributed data. However, they are rarely used for environmental data without adjustments for outlier and missing data. Further, additional uncertainties associated with using the model and difficulties in applying the methods make parametric tests less preferable in hydrological studies. The most widely used parametric method is linear regression [22]. For linear regression, the data needs to be normally distributed and independent. Linear regression is severely affected by outliers, missing data, and the starting and ending values of the time series [22,23,24]. However, linear regression based on ordinary least square (OLS)-based has been used for trend analysis in a number of studies [1,14,15,17,19,25,26,27,28]. For the non-parametric tests, no assumption is made about the distribution of the population. They are simple to use and far less impacted by outlier and missing data than the parametric test. In addition, they represent a measure of monotonic dependence whether linear or not [23]. The power of non-parametric tests rises with increasing sample size, and they can perform better than parametric tests when the data depart from normality.
The non-parametric tests have been favored in hydrological time series analysis due to simplicity and suitability for data with outliers. Even for normally distributed data, non-parametric tests are preferred and safer because they can be applied without prior assumption about the population distribution of the data [22]. The most commonly used non-parametric statistical tests in trend analysis are Mann–Kendall’s for trend test and Sen’s Slope tests for slope estimation [18,29]. The Mann-Kendall (MK) test is a non-parametric approach for testing the significance of monotonic trends, linear or nonlinear, in time series data [30]. The test is based on ranks of observations, not the actual values of the data series, making it uninfluenced by missing and outlier data. The MK test is strongly recommended by the World Meteorological Organization as a standard non-parametric procedure for testing trends. It is widely used in trend analysis of hydro-meteorological time series [21,23,31,32,33]. Similarly, Sen’s Slope estimator has been widely used to estimate the slope of a linear trend for a time series [18,21,23,31].
Trend analysis involves different approaches of data analyses. The approaches can be combinations of different spatial and temporal extent of data. Trends of rainfall can be analyzed at different time scales using station-based rainfall time series [14,18] or area-averaged rainfall time series [1,15,34]. Most of the decisions and actions in water resource management are at an areal scale, requiring results of the analyses at local or regional watershed levels. Furthermore, results of the analyses at one or more stations cannot directly represent a given area or watershed [1,24]. Therefore, analyses of trends of rainfall are practically more important at an areal spatial scale than at point scales. However, area- averaged rainfall would mask real variabilities, especially when station density varies in space [14]. Cheung et al. [1] have also shown the risk of averaging station data when there are an insufficient number of stations, resulting in unrepresentative averaging. This risk is intensified when averaging inconsistent station data for large watersheds. On the other hand, Cheung et al. [1] noted that contradictions in results of the previous trend studies in Ethiopia are attributed to arbitrary division of the study area used in those studies, in addition to poor and inconsistent data quality. Thus, to overcome a similar problem, Cheung et al. [1] have recommended the use of well-defined study areas, i.e., areas defined in an ‘objectively and geographically meaningful manner’ instead of using gauge locations, political boundaries, or any other arbitrary study area. In hydrology, such meaningful and objectively defined study areas are watersheds.
For a number of reasons, sufficient and reliable information regarding trends of annual and seasonal rainfall in the Awash River Basin is not yet available. There are few studies for the entire or parts of the basin. Some station-based climatic trend studies have included few locations from the Awash River Basin [14,17,19,20,21]. While only a few of these studies have included significant parts of the basin or the entire basin [1,15,18,31]. The study by Bekele et al. [18] is the only to exclusively investigate trends of rainfall and temperature over several locations within the Awash River Basins. However, the existing research has a number of limitations. Firstly, most of the previous studies used short record length and low data intensity. He and Gautam [24] considered a data record length less than 50 years as short-record. Accordingly, most studies relevant to the Awash river Basin were based on short-data record length [1,15,18].
However, Wagesho et al. [31] carried out the analysis of trends based on a 50-year data record length at national level including the Awash River basin. As for the data intensity, some of the national studies were based on large numbers of data points [1,15,31]. However, Bekele et al. [18] used rainfall data from four stations to represent the entire basin. Obviously, this is very low data intensity to represent a 116,374 square-km basin with diverse climatological zones. Secondly, most of the studies are based on data analysis at point-scale or arbitrarily defined areas [14,17,18,19,20,31]. Cheung et al. [1] also identified these problems over a number of publications. According to Cheung et al. [1], use of such an arbitrary spatial scale of analysis may cause misleading results due to unrepresentative observations or subsequent unrepresentative averaging. Furthermore, the results would have less practical importance in water resource management, in which information at a watershed level is required for decision making and actions [1,24].
Thirdly, in most studies there are limitations related to data analysis techniques. Several studies for the Awash River Basin used linear regression to assess trends [1,14,15]. He and Gautam [24] noted that the results of trend analysis can be significantly affected by the use of linear regression. Additionally, most of the studies did not consider serial correlation in time series that would result in errors in trend detection [1,14,15,17,18,19,20,21]. Overall, as most of local studies citied above are carried out for areas outside the Awash River basin, it is clear that there are no studies covering significant portion of the Awash River basin with sufficient level of details. On the other hand, the existing local studies for the basin or elsewhere have limitations with respect to data quality, intensity, data record length, the approach of analysis, and the data analysis techniques.
Therefore, this study was carried out to investigate long-term trends and magnitude of trends for areal rainfall on an annual and seasonal basis over the Awash River Basin, in order to address the existing research gaps, and thereby contribute to a better understanding of the impact of climate change on trends of rainfall in the basin. To this end, firstly, long-term rainfall data from a gridded climate dataset were used for more consistent and reliable data, with long record length and high intensity over the study area. Secondly, the data analyses were carried out to a hydrologically meaningful spatial extent at the sub-basin and basin level. Lastly, the most suitable and widely acceptable techniques of trend analysis were applied.
2. Materials and Methods
2.1. Description of the Study Area
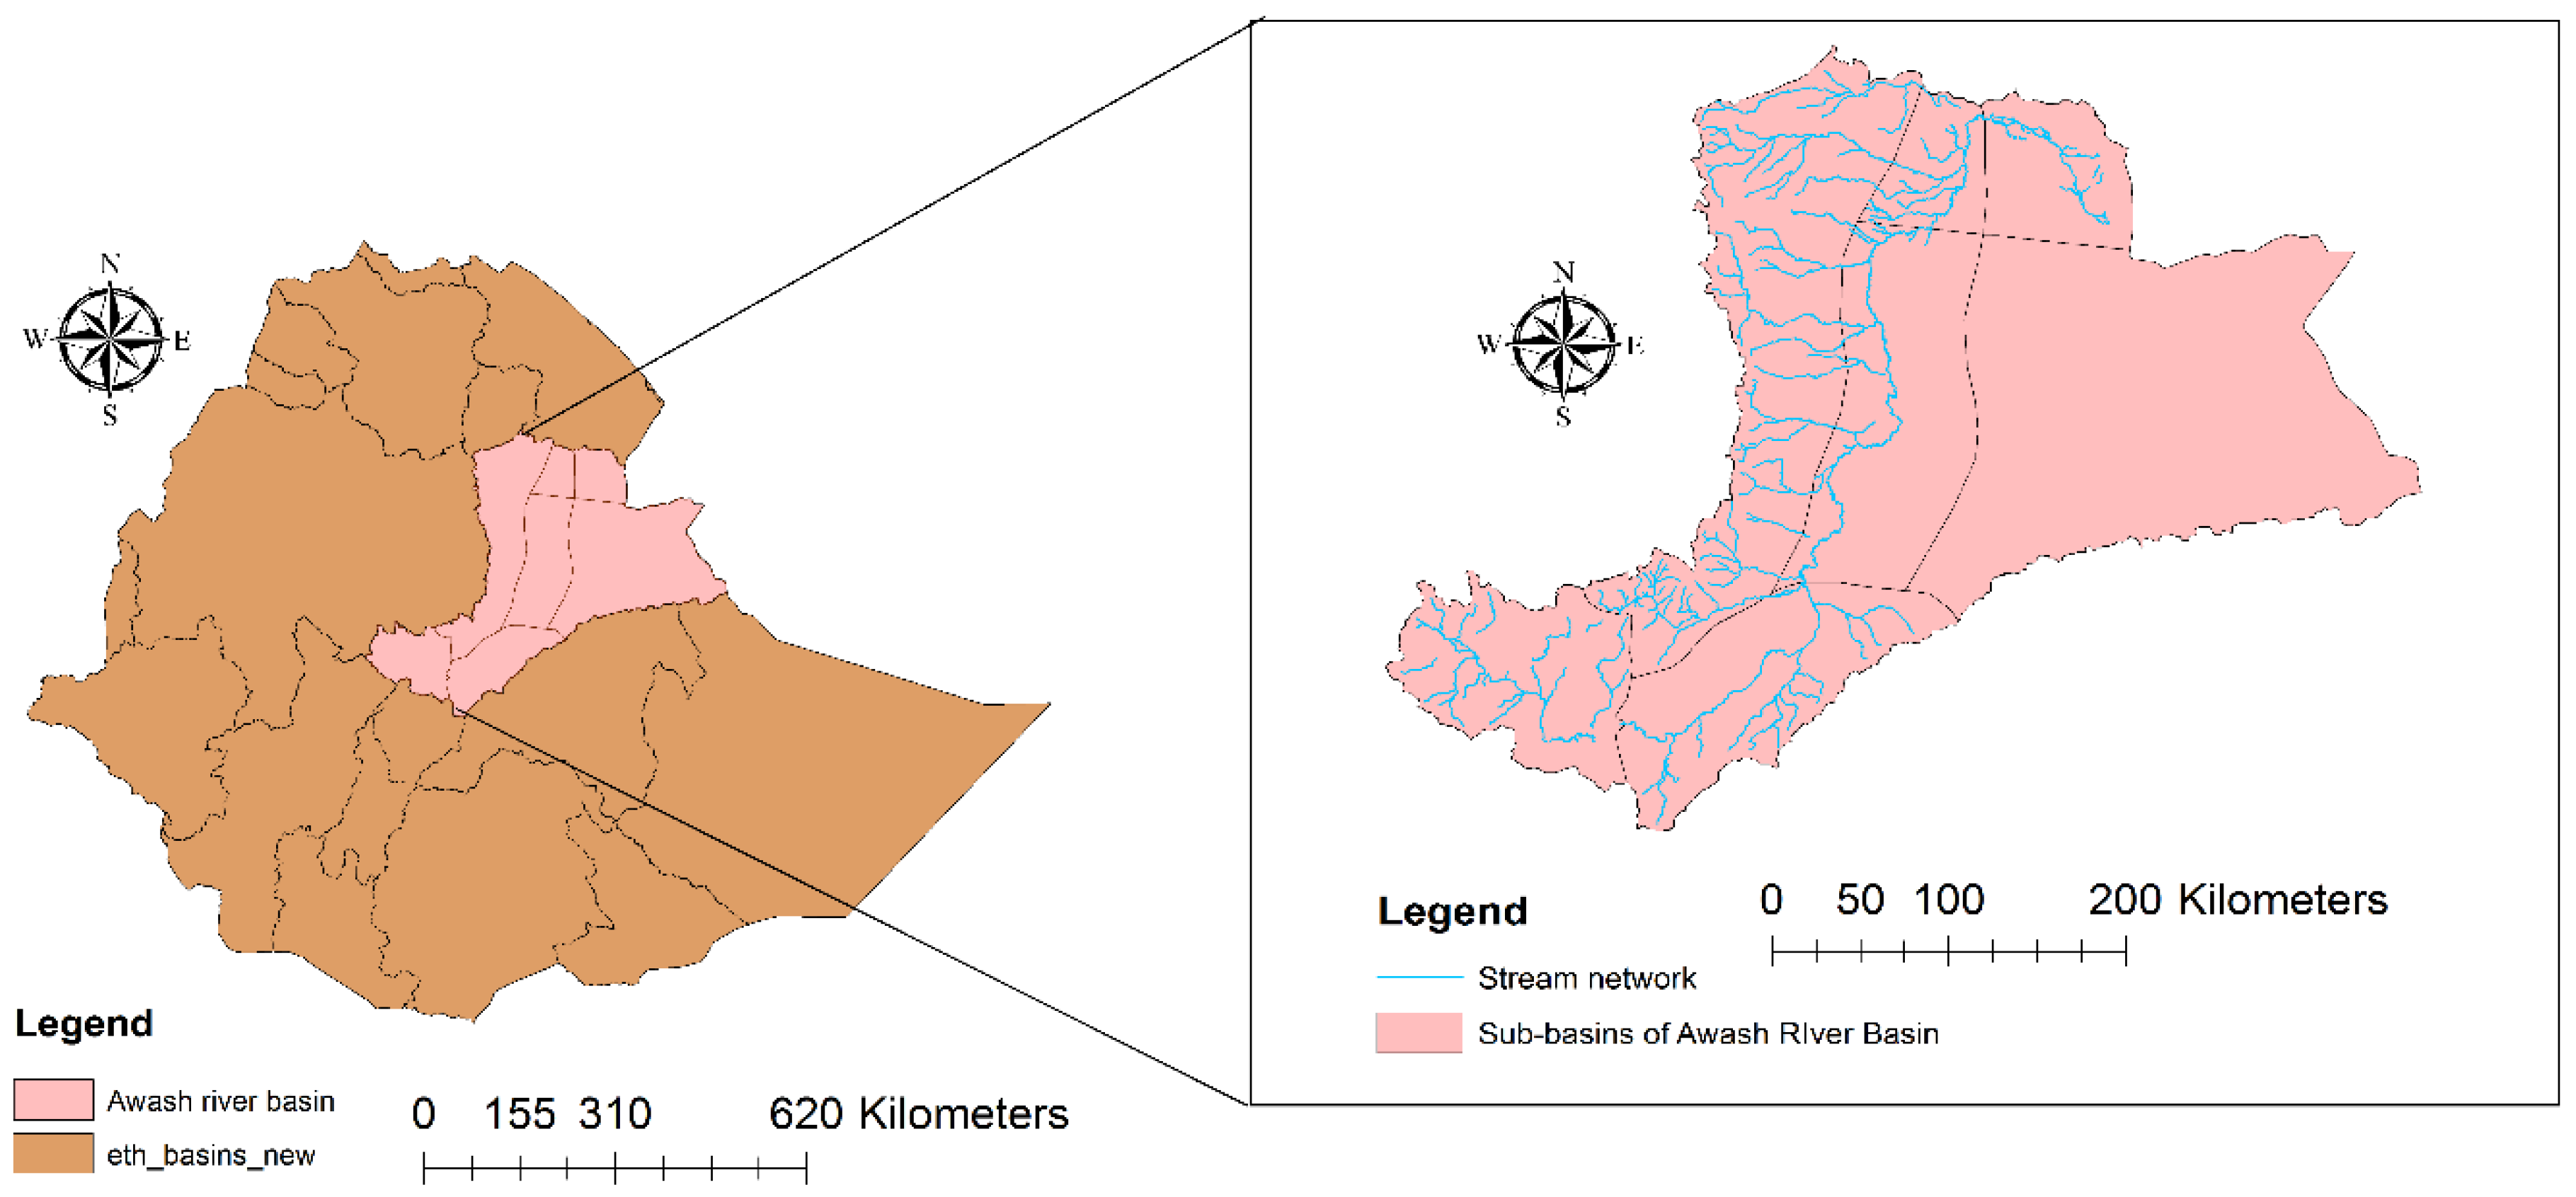
Awash River Basin (ARB) is one of the 12 main river basins in Ethiopia, located at 7°53′ N to 12° N and 37°57′ E to 43°25′ E. The basin extends from the central Ethiopian highland at 4195 m above mean sea level (A.M.S.L) to the lower arid regions at 210 m A.M.S.L in the Danakil Depression (Figure 1). The major landscapes in the basin are highland, escarpment, and rift [3,35]. At the lower end of the Awash River Basin, there is another basin extending to neighboring Djibouti. The part of this basin in Ethiopia is locally known as the Aysha River Basin which is around 2223 square-km [35]. However, several publications annexed the Aysha River Basin into the Awash River Basin [4,6,18,36,37]. Similarly, in Geographic Information System (GIS) shapefile available from the Ministry of Water Resources of Ethiopia, the Aysha River Basin is included in the Awash River Basin, making the total area of the basin 116,374 square-km. However, the actual Awash River Basin does not include the Aysha River Basin and thus ARB is not transboundary river basin [35]. However, in this paper, the term Awash River Basin is used to refer to the entire area, including the Aysha River Basin (Figure 1).
Climatically, the basin comprises humid subtropical areas at the upper basin, the semi-arid areas in the middle, and arid areas at the lower basin. Estimates of the annual rainfall and mean temperature vary in different studies. According to Edossa [4], the mean annual rainfall in the Awash River Basin varies from 160 mm in the northern part of the basin to 1216 mm at the headwater of the Awash River. According to Kerim et al. [3], the mean annual rainfall ranges from 160 mm at Asayita (in the Lower Plain) to 1600 mm at Ankober (in the Western Highlands) while the mean annual temperature varies from 20.8 °C to 29 °C at Koka (in the upland) and Dubti (in the Lower valley), respectively.
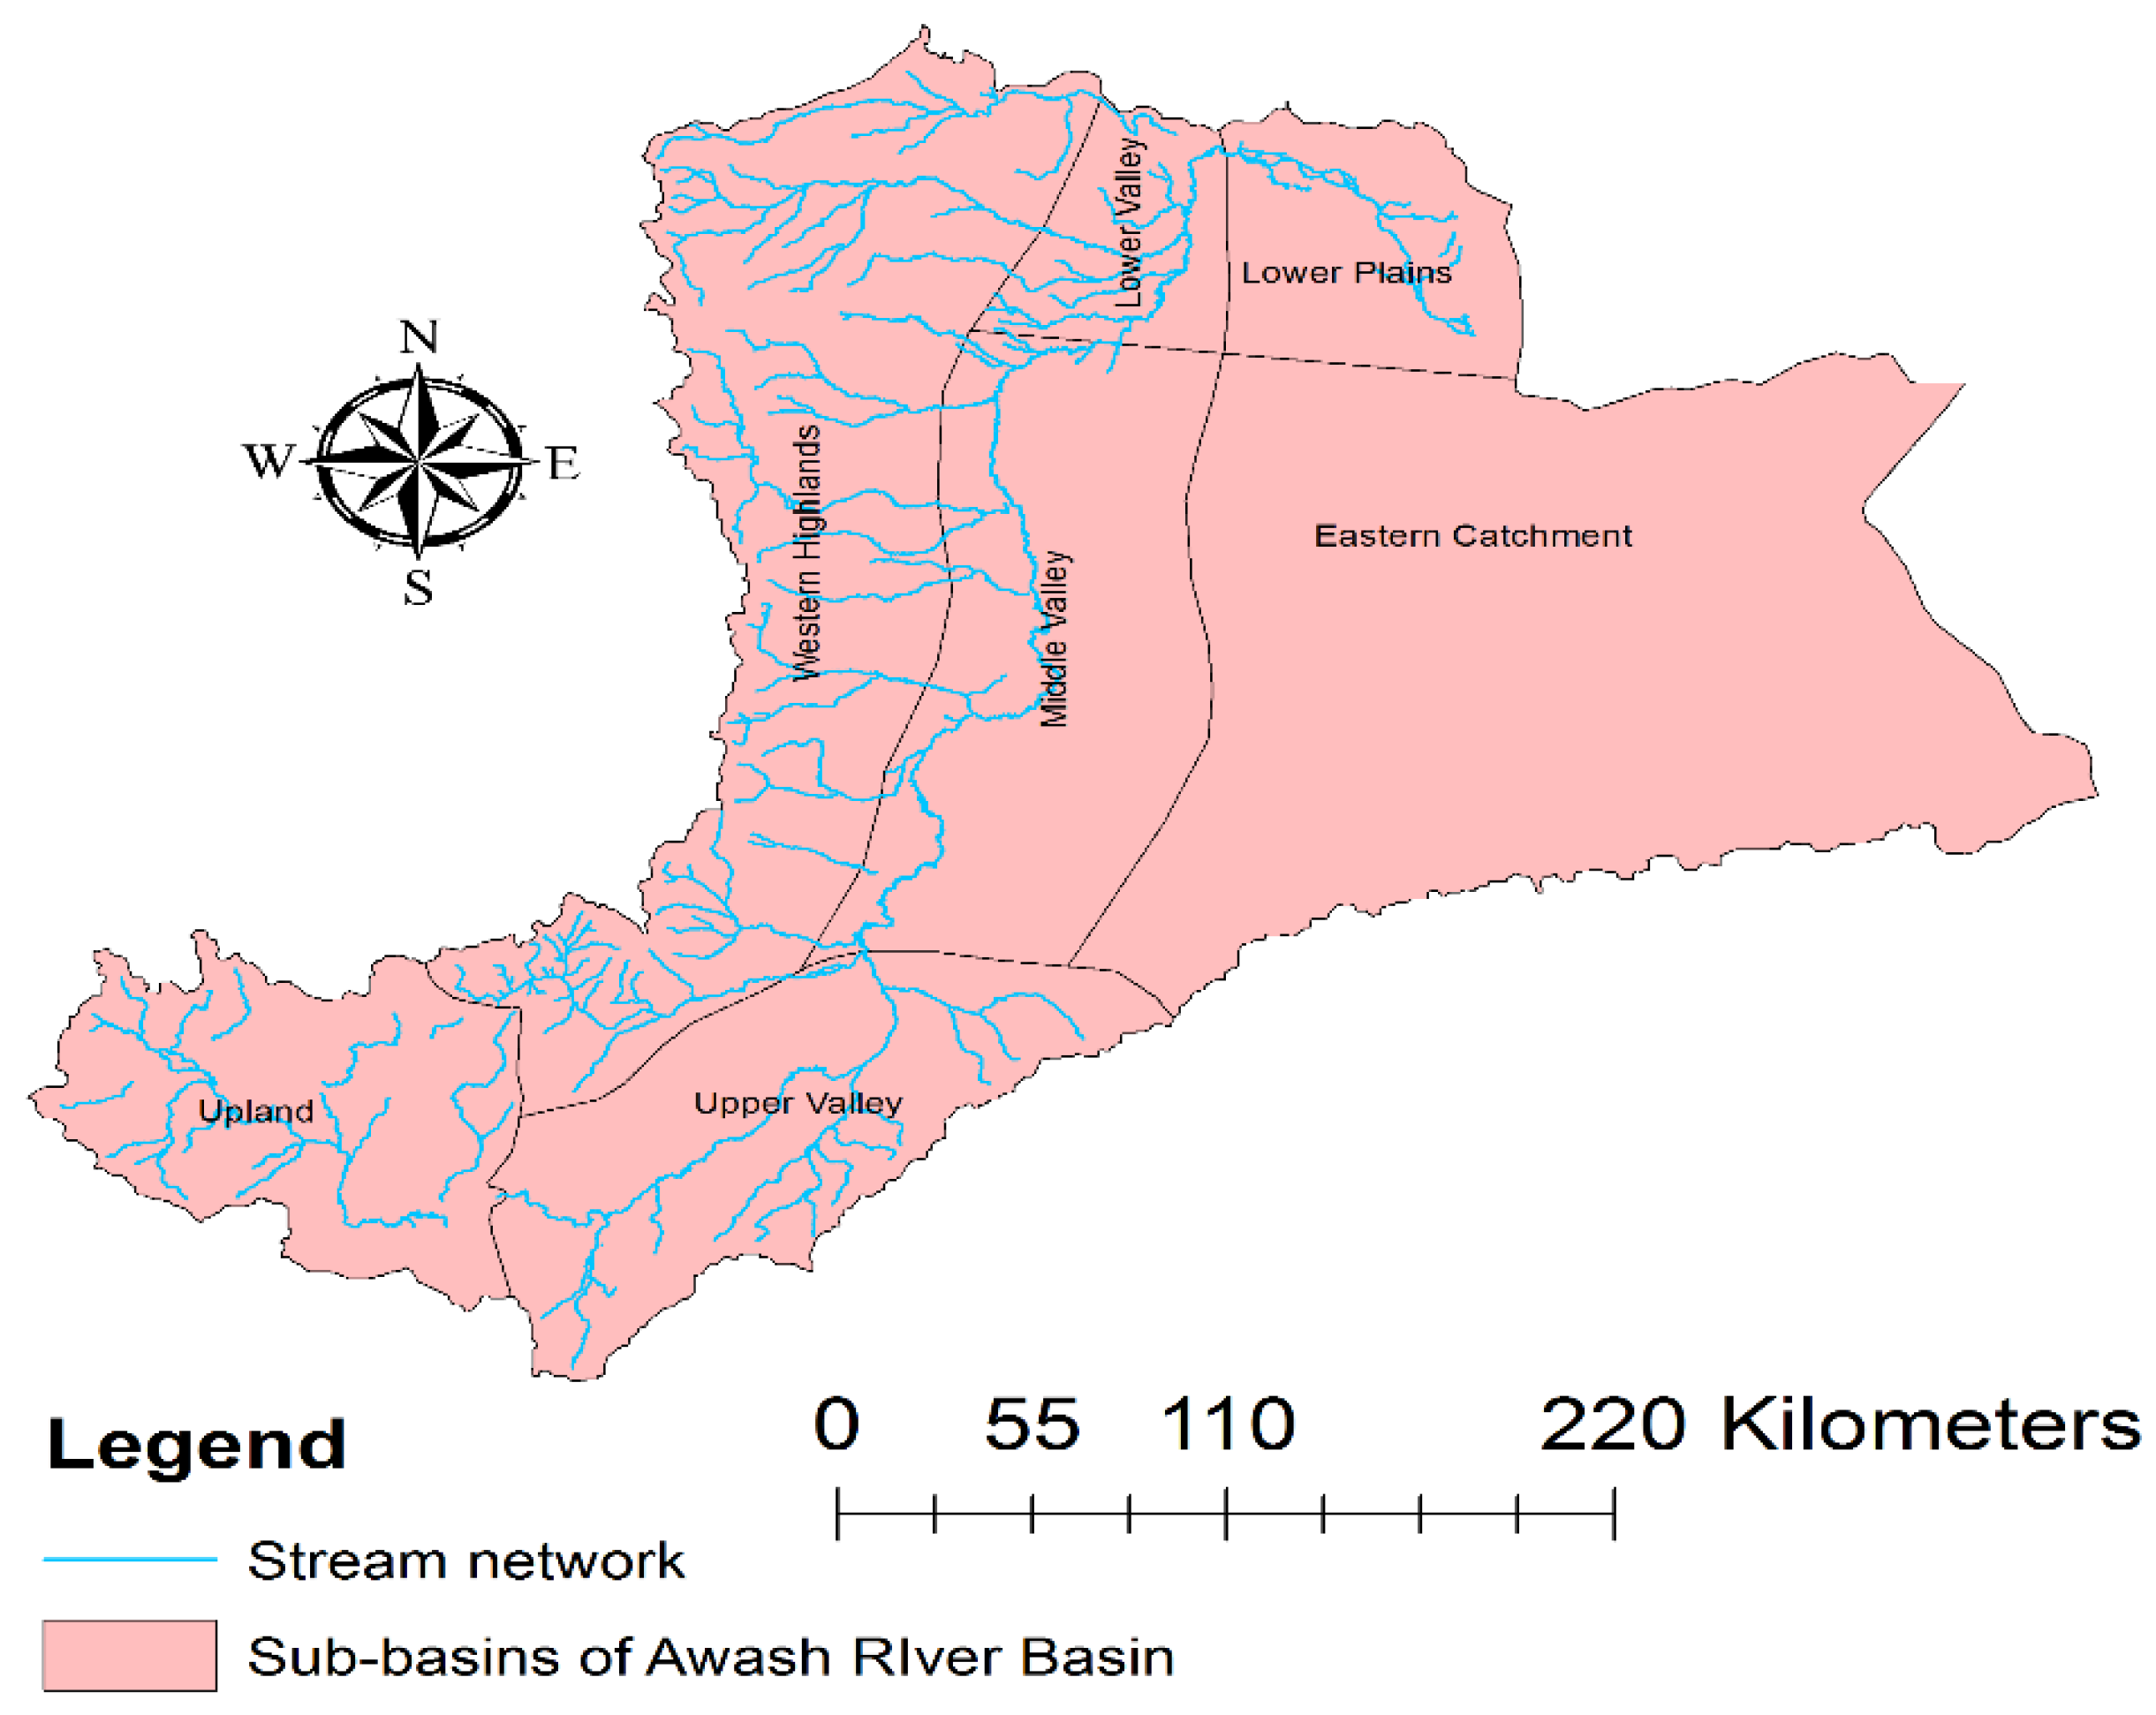
As for the land uses, more than 50% of the land is agricultural, around 39% is covered by grassland and shrubs, and the remaining area is other land uses [6]. Based on interrelated locational, climatic, topographic, agricultural, and administrative factors, the basin has been divided into the upper, the middle, and the lower Awash River Basin [4]. However, hydrologically the basin is divided in to seven main sub-basins (Figure 2). The sub-basins are the Upland (11,229 km2), Upper Valley (13,063 km2), Western Highlands (25,776 km2), Middle Valley (16,259 km2), Eastern Catchment (39,347 km2), Lower Valley (4214 km2), and Lower Plain (6485 km2) (Figure 2). According to Adeba et al. [6], the western 64,000 km2 of the basin generates nearly the entire flow in the basin. The high-stream distribution and density in the western side of the basin (Figure 2) also indicate the relatively high contribution of runoff by the western side of the basin. The maps from Figure 1 to Figure 3 are based on GIS files from Ministry of water resources of Ethiopia and World Bank Groups (https://datacatalog.worldbank.org/dataset/resource).
2.2. Data Collection and Preprocessing
Gauge rainfall data from 23 weather stations in the basin were obtained from the National Metrological Agency (NMA) of Ethiopia. However, the data for most of the stations have short-period records, and had large missing data (more than 25%). Only a few stations have a long record (1960–2015) with a small percentage of missing data (less than 25%). In addition, there are no or few number of stations in some of the sub- basins. Under such conditions, gridded climate datasets can serve as a very important alternative source of data. Gridded climate datasets are a vital source of climate data when meteorological stations are limited, unevenly distributed, and have large amount of missing data [21]. Gridded datasets provide long-record data and can improve data intensity because of high spatial coverage that allows data extraction for a large number of locations. For these reasons, gridded climate datasets are used in a number of studies [21,25,31,38,39].
In this study, data from a recent version of the CRU dataset was used. The CRU Ts version 4.01 (available at http://data.ceda.ac.uk) provides monthly global climate data in different file formats at a 0.5° by 0.5° spatial resolution for the period 1901 to 2016 for several climate variables including air temperature, rainfall, and potential evapotranspiration. In order to validate the dataset, the strength of relationship and similarity between precipitation data from the dataset and observed data at selected metrological stations were assessed using Pearson correlation coefficients and Kolmogorov-Smirnov (KS) test, respectively. This approach has been used by Asfaw et al. [21]. The accuracy of the data from gridded datasets was also evaluated by root mean square error (RMSE). The missing data in time series of observation data were filled by linear interpolation using ImputeTS package in R [40].
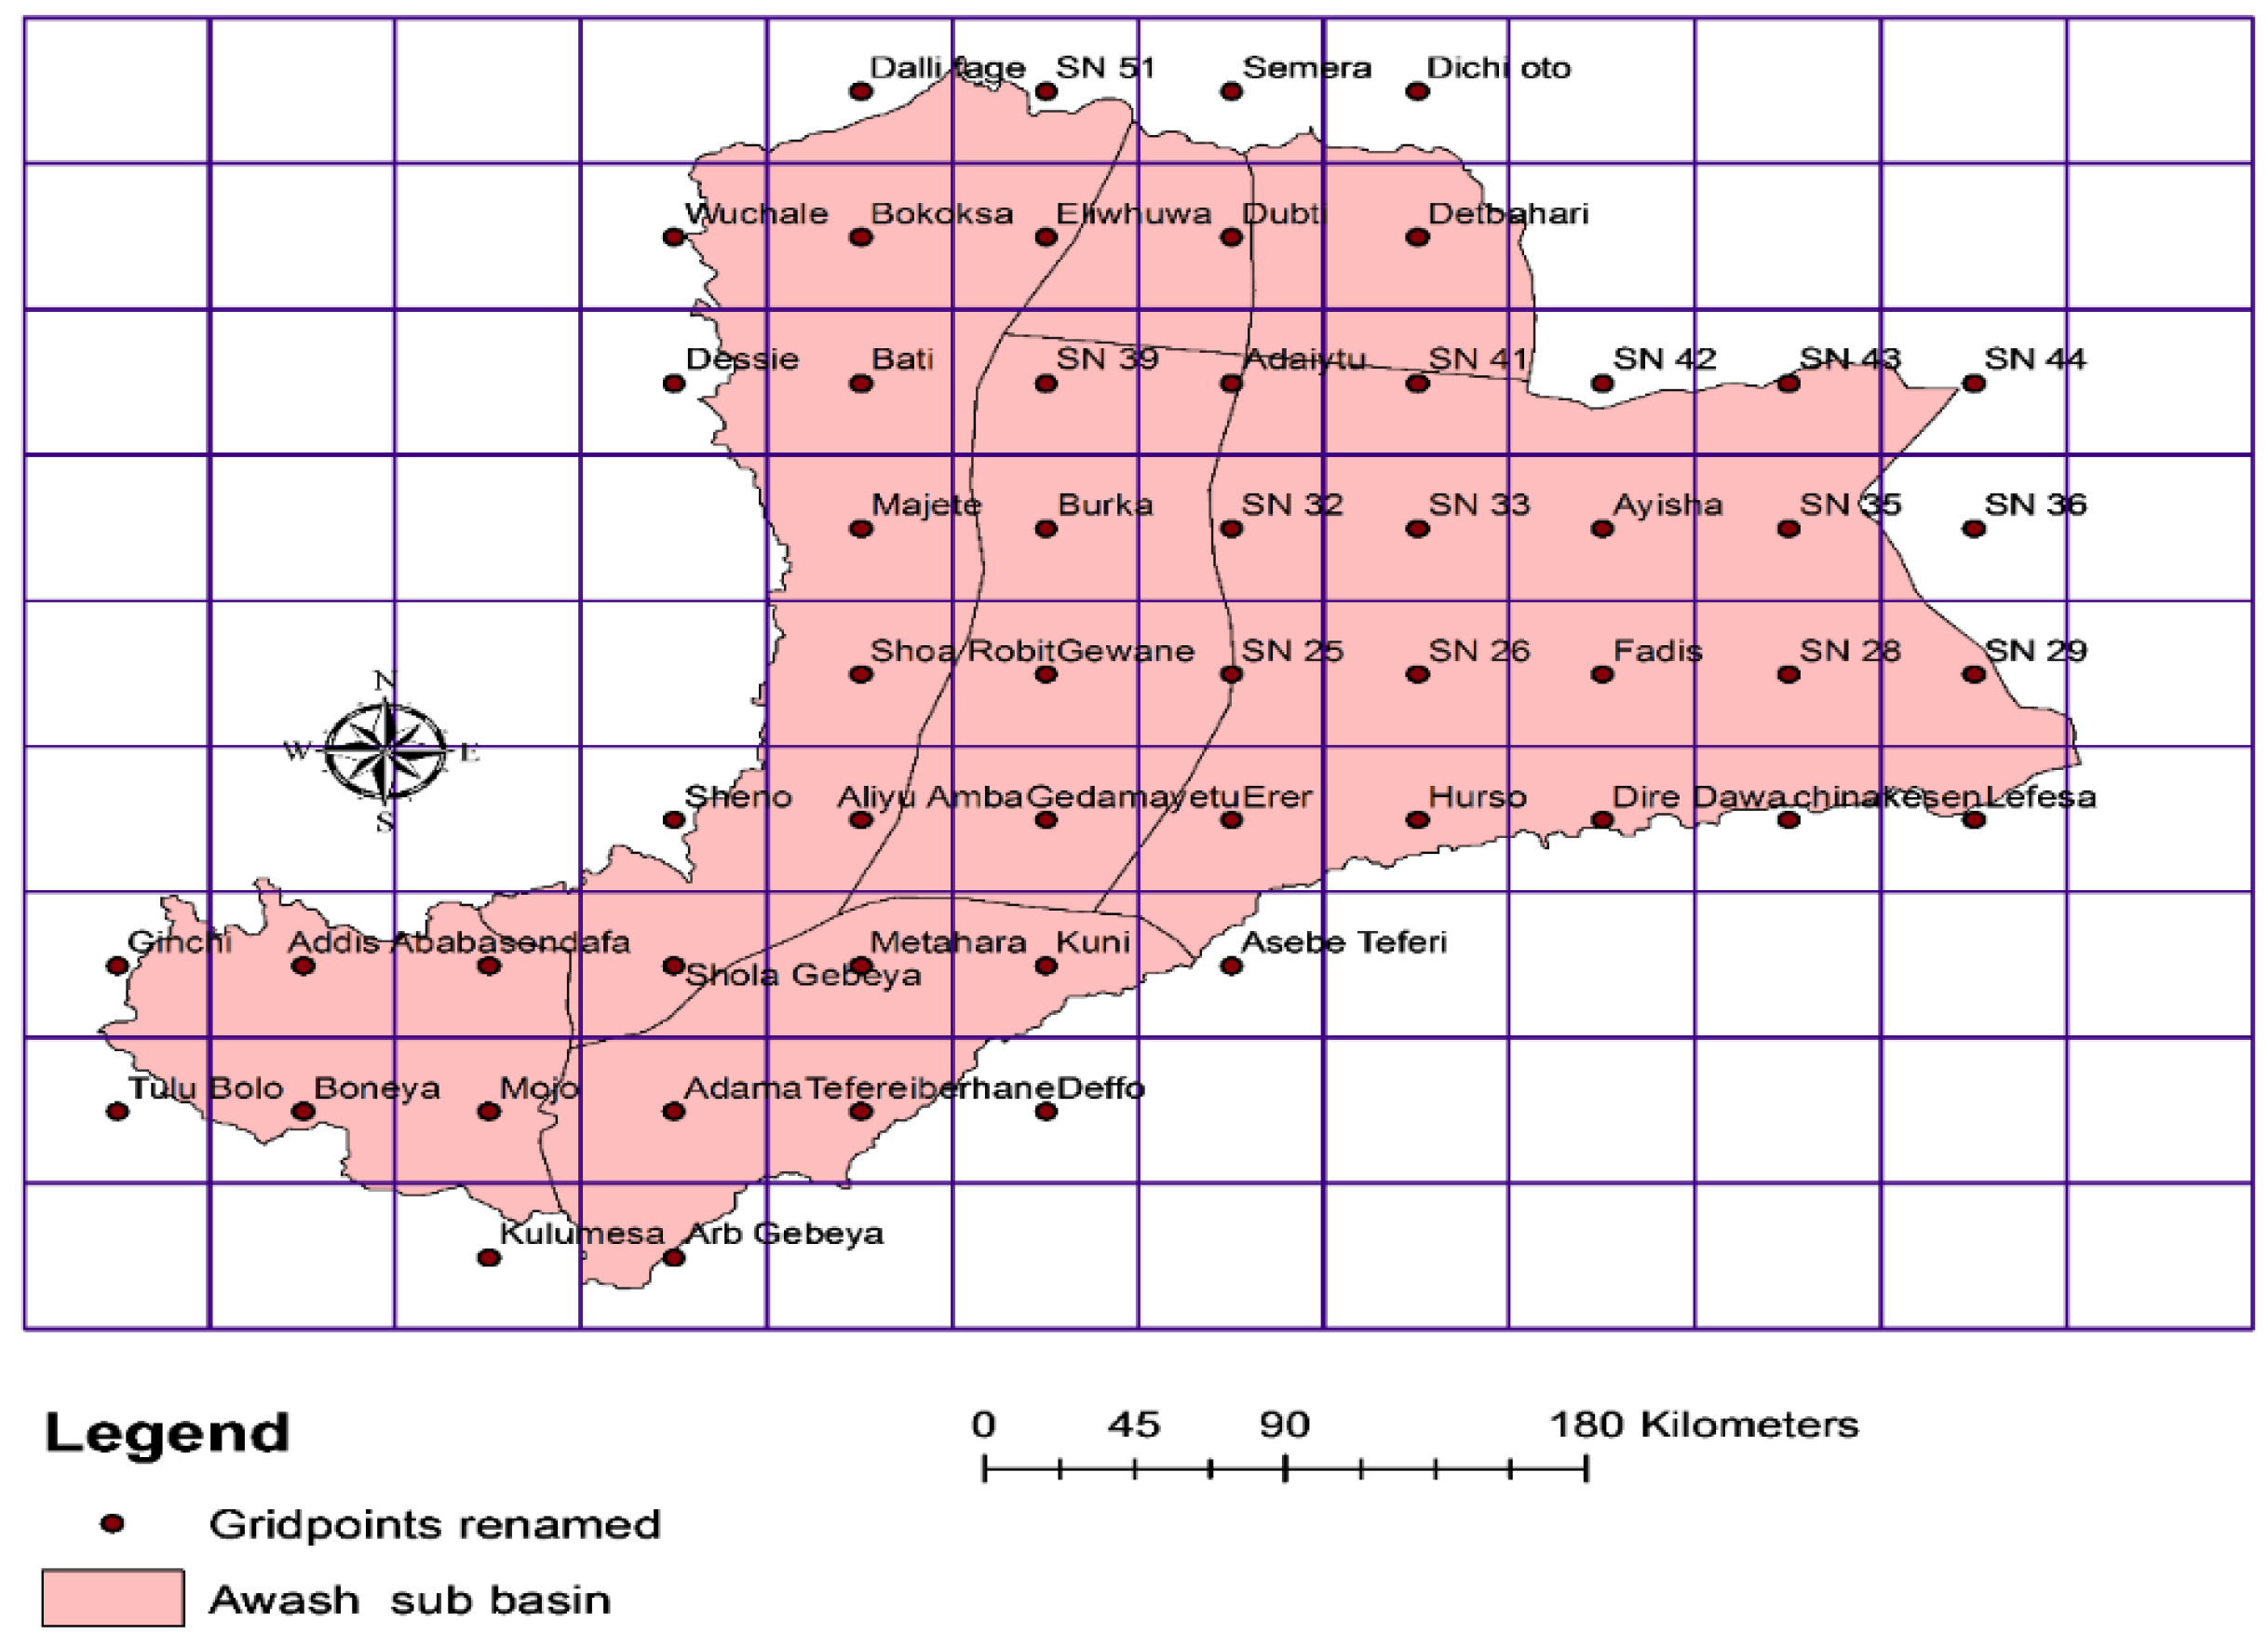
Then, the rainfall data were extracted from the dataset for 54 data points, which are selected by including one point from each grid (0.5 by 0.5 degree) covering the entire basin as shown in Figure 3. The R-Statistical Software version 3.5.2 was used to extract the rainfall data from NetCDF file of the CRU dataset. The Geographic information system (GIS) software package was also used in developing the 0.5 by 0.5 degree- grid, mapping, site selection, and in estimating corresponding areas for each grid point. The monthly data at all data points were area-weighted averaged to get areal rainfall for respective sub-basins and the entire basin, following the suggestion by Cheung et al. [1] for trend analysis at practically meaningful spatial scales; this approach was used in similar studies [1,15,34]. Then, the annual and seasonal time series were created from the monthly areal-rainfall data by aggregating the monthly data using R-software.
Three climatic seasons characterizing the Awash River Basin are locally referred to as Kiremt (June, July, August, and September), Bega (October, November, December, and January), and Belg (February, March, April, and May), respectively. The Kiremt is the main rainy season, the Bega is the dry season, and the Belg is the small rain season. The approximate equivalent for Kiremnt, Bega, and Belg seasons are summer, winter, and autumn, respectively [15,41,42,43]. Accordingly, the seasonal rainfall time series were created for these three climatic seasons.
2.3. Data Analysis
Pearson correlation coefficient(r) relating rainfall data from gridded datasets and observed data from selected meteorological stations was computed by the equation.
where x and y are monthly rainfall data from gridded datasets and from selected meteorological stations, respectively and N = number of observations.
The Kolmogorov-Smirnov (KS) test was applied to compare similarity between population distributions of data from gridded datasets and observed data from selected meteorological stations. The test is based on the following hypotheses
- ➢
- Null hypothesis: samples come from same distribution
- ➢
- Alternative hypothesis: samples do not come from same distribution
The KS test statistics (Dn), the maximum absolute difference between distribution functions of two samples, is computed by
where F exp (xi) and Fobs (yi) are cumulative distribution functions for expected data (rainfall data from gridded dataset) and observed data (rainfall data from Metrological station), respectively.
For ordered observations(x1 ≤ x2 ≤….≤ xn) of the combined sample, the cumulative distribution function is computed by the equation
where i is the number of observations below the value xi and n is the total number of observations.
For two samples, D critical (for α = 0.05) is approximated by
where nx and ny are number of observations in sample variables x and y, respectively.
Then, the decision for KS test is based on test statistics (Dn), the maximum absolute difference between distributions. When Dn is greater than D critical (when p value corresponding to Dn is less than 0.05), the null hypothesis is rejected.
The root mean square error (RMSE) is computed by
where x and y are monthly rainfall data from gridded datasets and from selected meteorological stations, respectively, and N is number of observations.
The Mann-Kendall (MK) test is based on the Mann Kendall test statistics (S) and is computed by
The Sgn(Xj − Xi) values are computed by comparing each pair of the data points Xi and Xj, as follows
The variance () with the correction term for ties is computed by
where p is number of tied groups in the time series, and tj is number of data values in the jth tied group [44].
The standardized value (Z) of the test statistics (S) is computed by
where σ is variance
The MK test is based on the following hypotheses:
- ➢
- Null Hypothesis (H0): There is no monotonic trend in the data series
- ➢
- Alternative hypothesis (HA): There is a monotonic trend in the data series (Two tail)
The decision for the two-tail test is made by comparing the computed Z with critical values. The null hypothesis is rejected when the absolute value of computed Z is greater than the critical values or p-value is less than the selected significance level (α = 0.05 or 0.1). Furthermore, when the null hypothesis is rejected, the direction of trends is upward for positive z-value and the direction of trends is downward for negative z-value [30].
The original MK trend test, however, is based on assumption of random and serially independent time series data. When there is a significance serial correlation in the time series, the test results in increased detections of trends (Type II errors) and a high rejection rate of the null hypothesis (Type I error).
In order to overcome this problem, the original Mann-Kendall test must be modified to account for serially correlated time series data [45,46,47]. Therefore, the presence of significant serial correlation in each of the time series was tested at the selected level of significance (α = 0.05) using Autocorrelation function (ACF) at lag-1. Then, the Modified MK trend test was applied when significant serial correlation was identified in the time series, otherwise, the original Mann-Kendall was applied. This approach has been followed in several studies [31,39,45,46]. In this study, the modified Mk test, called Variance Correction Approach developed by Yue and Wang in 2004, was selected. This approach is based on the assumption of the first order autoregressive AR (1) process. The serial correlation estimated from detrended data is used to calculate correction factor which, in turn, is used to adjust the test variances of the original time series [48]. The original time series data can directly be used without data transformation and the effects of serial correlation at lags beyond lag-1 can be incorporated [46,48,49]. Furthermore, this approach is more suitable to remove the effect of serial correlation when a trend in the data is approximated by a linear trend [46].
The rate of change was estimated by Sen Slope estimator. For Sen Slope, firstly, all sets of slopes (dk) are computed using each pair of Xi and Xj using Equation (10). Then, the Sen Slope (β1) is calculated as the median of all slopes, dk, using Equation (11) [44]. Each set of slopes (dk) is calculated by
The Sen Slope (β1) is calculated by
where i and j are indices for values of the variable X, for all 1 ≤ i < j ≤ n.
3. Results
3.1. Validation of Gridded Climate Dataset
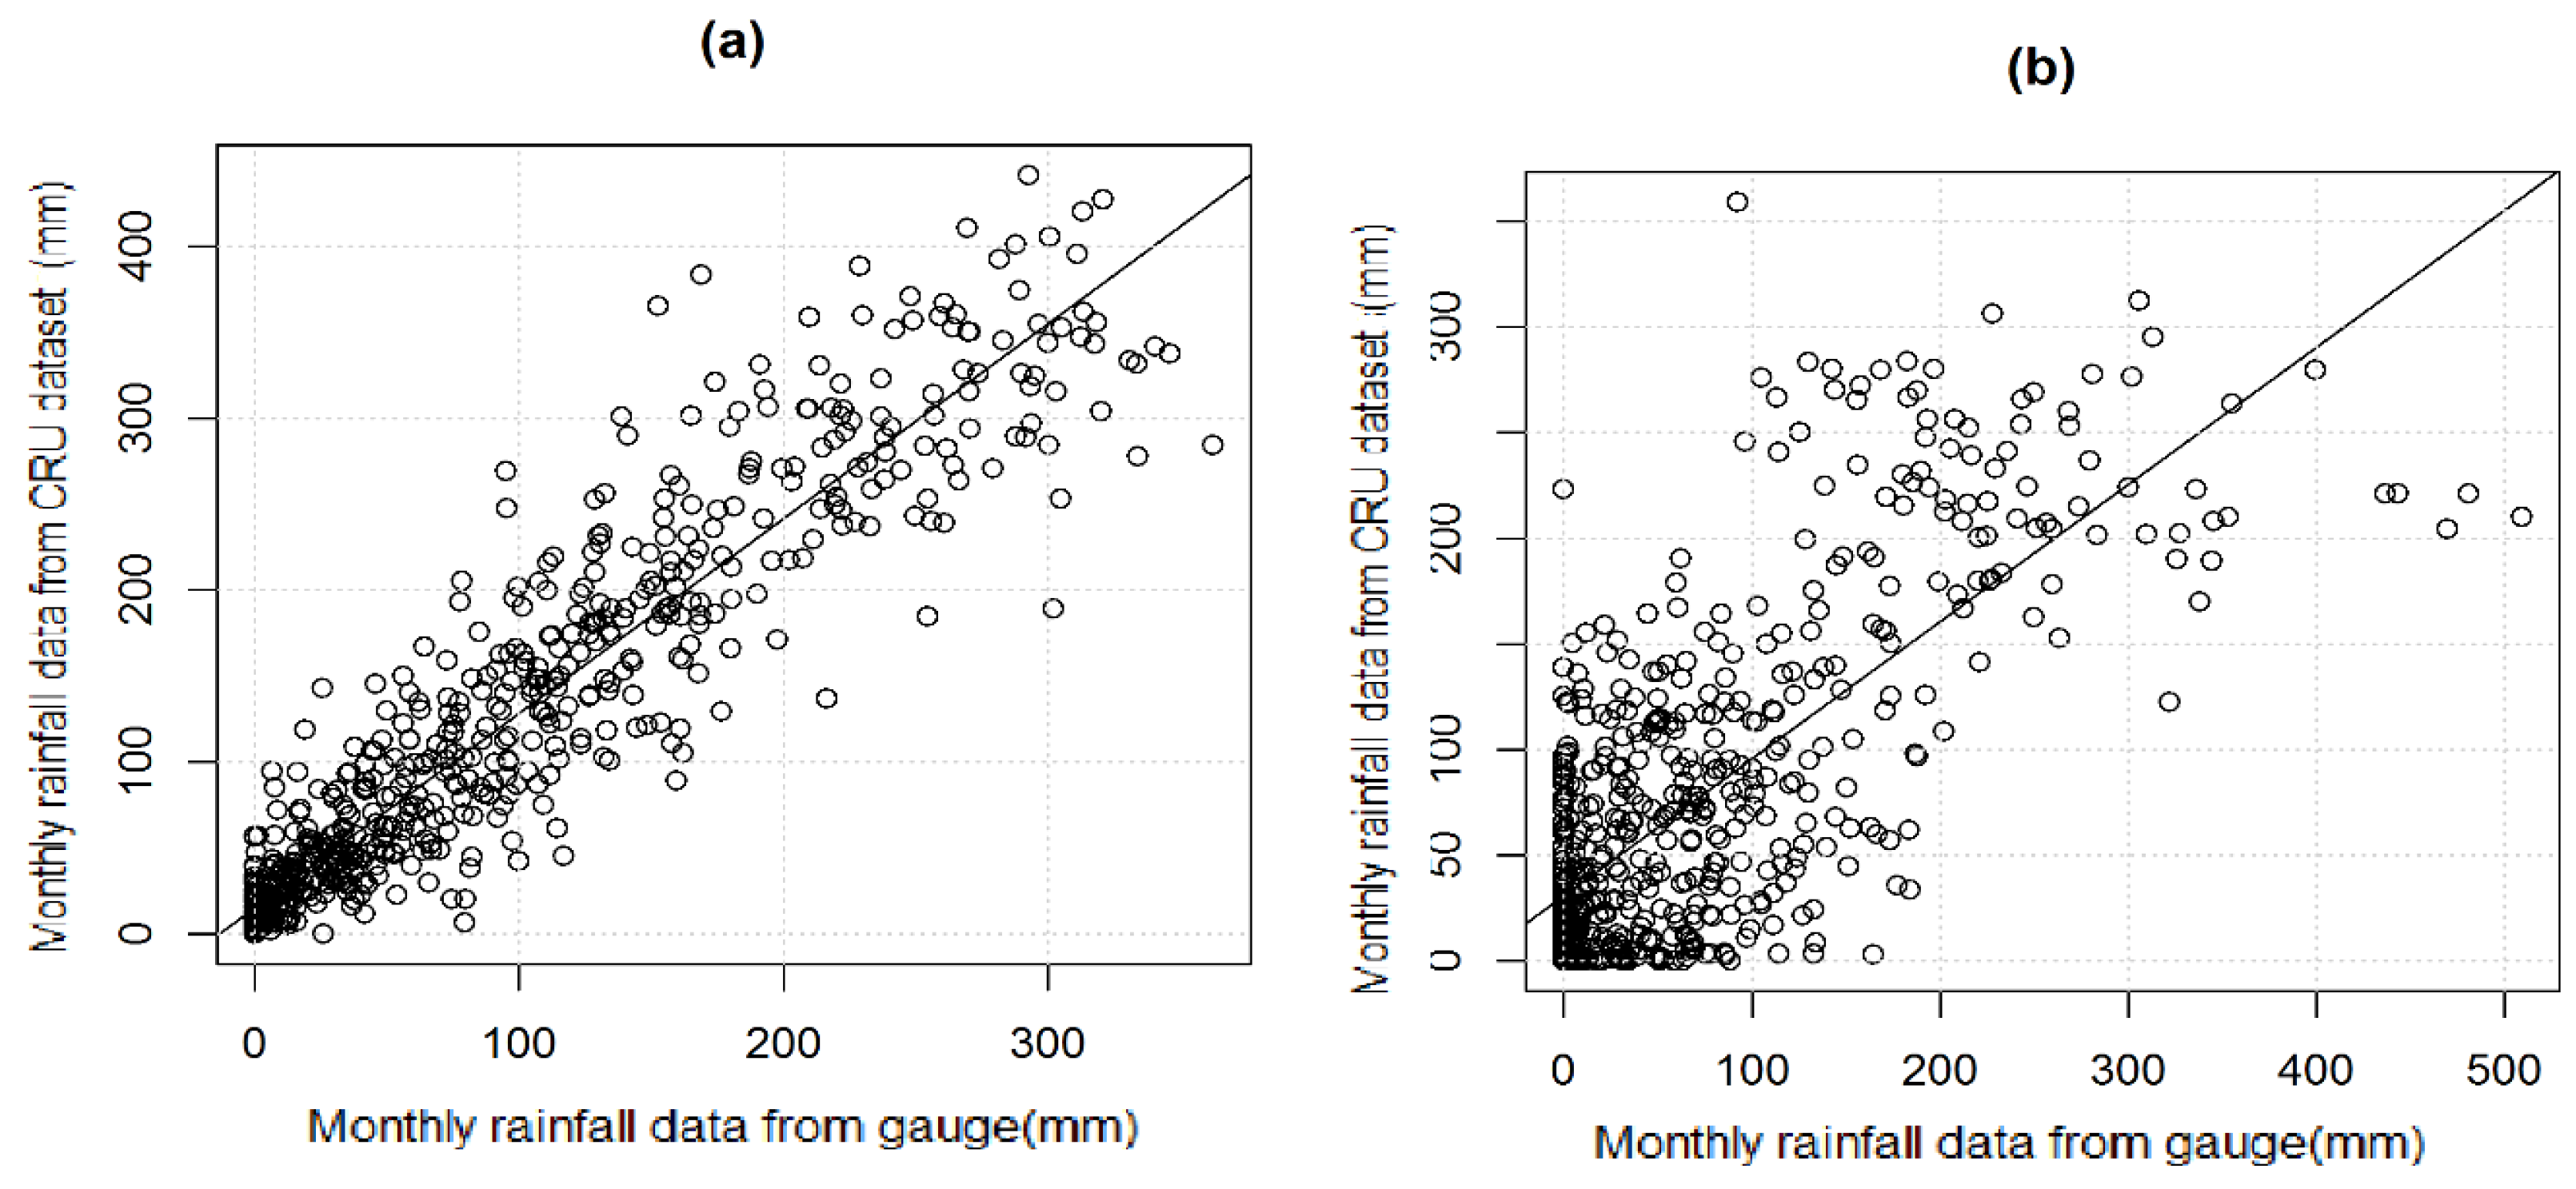
The data from the gridded dataset were compared with observation data at nine selected gauges stations (Table 1), and the results are summarized in Table 2. It is found that monthly rainfall data extracted from the CRU dataset for selected locations are strongly correlated with the corresponding rainfall data from selected gauge stations. The scatter plots (Figure 4) at two selected gauge stations show that the data from CRU dataset are not only strongly correlated to the observed data but also follow the trend of the observed data.
However, for KS test, the calculated test statistics (Dn) is higher than D critical (α = 0.05) for all stations (Table 1). Thus, the null hypothesis of the KS test can be rejected, which implies the data from the CRU dataset do not have similar probability distribution with corresponding rainfall data from gauge stations. The estimated error (RMSE) in the monthly rainfall data from CRU dataset varies from 27.8 mm at Dire Dawa to 97.7 mm at Mezezo.
Studies on evaluation of gridded datasets in Ethiopia are very few. Dinku et al. [50] found strong correlation between data from the CRU dataset and the corresponding gauge rainfall data over some locations in Ethiopian highlands. Asfaw et al. [17] found that data from the CRU dataset are not significantly correlated with observed data. Asfaw et al. [17] also found that data from the CRU dataset did not follow the probability distribution of observed data over some locations in northern central Ethiopia. Ahmed et al. [51] found that data from CRU datasets have shown similar distribution with observation data over some months and regions. However, the data have also shown different distribution with observation data over some other months and regions in Pakistan.
The failure in the CRU dataset to replicate similar probability distribution with observed data could be attributed to inherent uncertainties in the gridded or observed data. On one hand, there are inherent uncertainties, with gridded datasets mainly associated with preparation of datasets. For gauge-based gridded datasets such as the CRU dataset, the number of gauges, quality of gauge data, and the interpolation techniques used during preparation of the datasets are the main causes of uncertainties. As a result, the capability of gridded data to replicate spatial and temporal climate variability might be limited [52,53]. However, the uncertainties associated with random and systemic errors in gridded datasets are fairly low [50]. On the other hand, the quality of observation data itself would affect the result of the evaluation.
However, it seems there is no escape from using gridded data especially for long-term trend analysis under existing data conditions characterized by limited number of gauge stations, low data quality and consistency, and short data record length. It might also be argued that the risk of using poor quality observation data might be more pronounced than the risk of using the gridded data. Some of the additional reasons for using gridded datasets in this study are explained in Section 2.2.
3.2. Trends of Annual Rainfall in the Awash River Basin
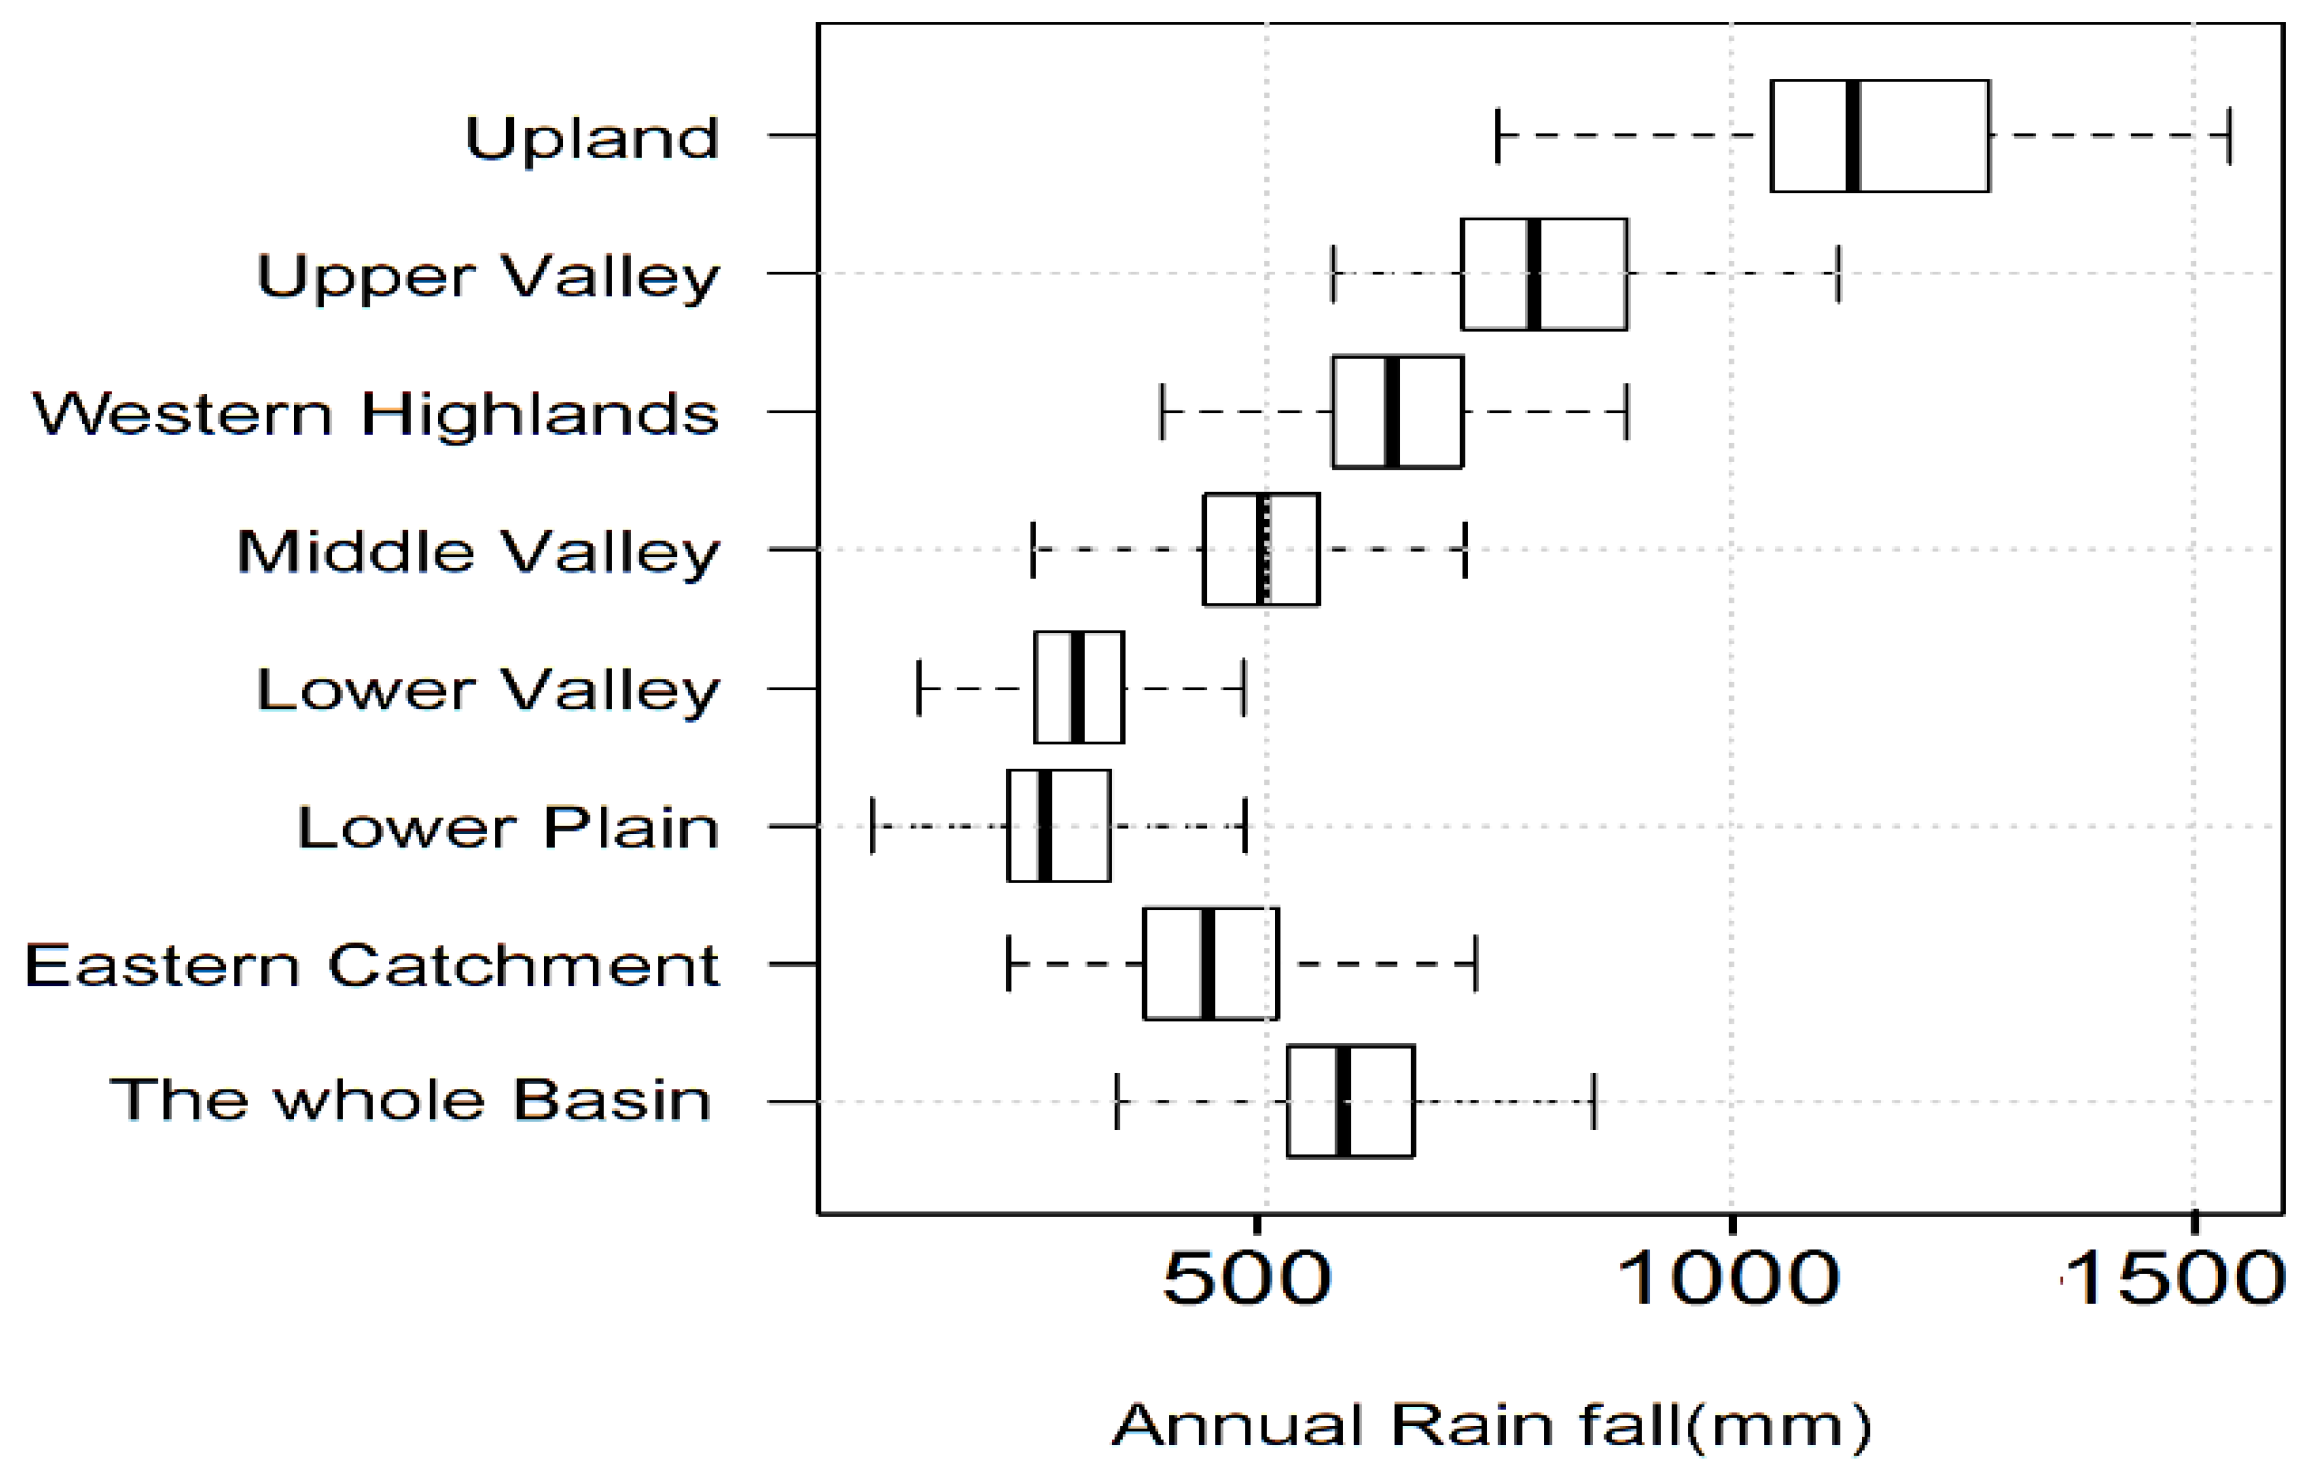
The summary statistics for annual rainfall time series (1901 to 2016) show that the minimum, mean, and maximum annual rainfall over the sub-basins range from 36.3 to 748.6 mm, 276.5 to 1155.2 mm, and 579.6 to 1538.1 mm, respectively. Similarly, the first quarter, median, and third quarter of annual rainfall vary from 221.4 to 1044.8 mm, 261 to 1132.5 mm, and 330.1 to 1277.1 mm, respectively. All lowest values of the statistical parameters are found at the Lower Plain, while the corresponding highest values are found at the Upland Catchment. On the basin level, the minimum, mean, and maximum annual rainfall over the sub-basins are 312.7, 588.8, and 915.2 mm, respectively (Figure 5).
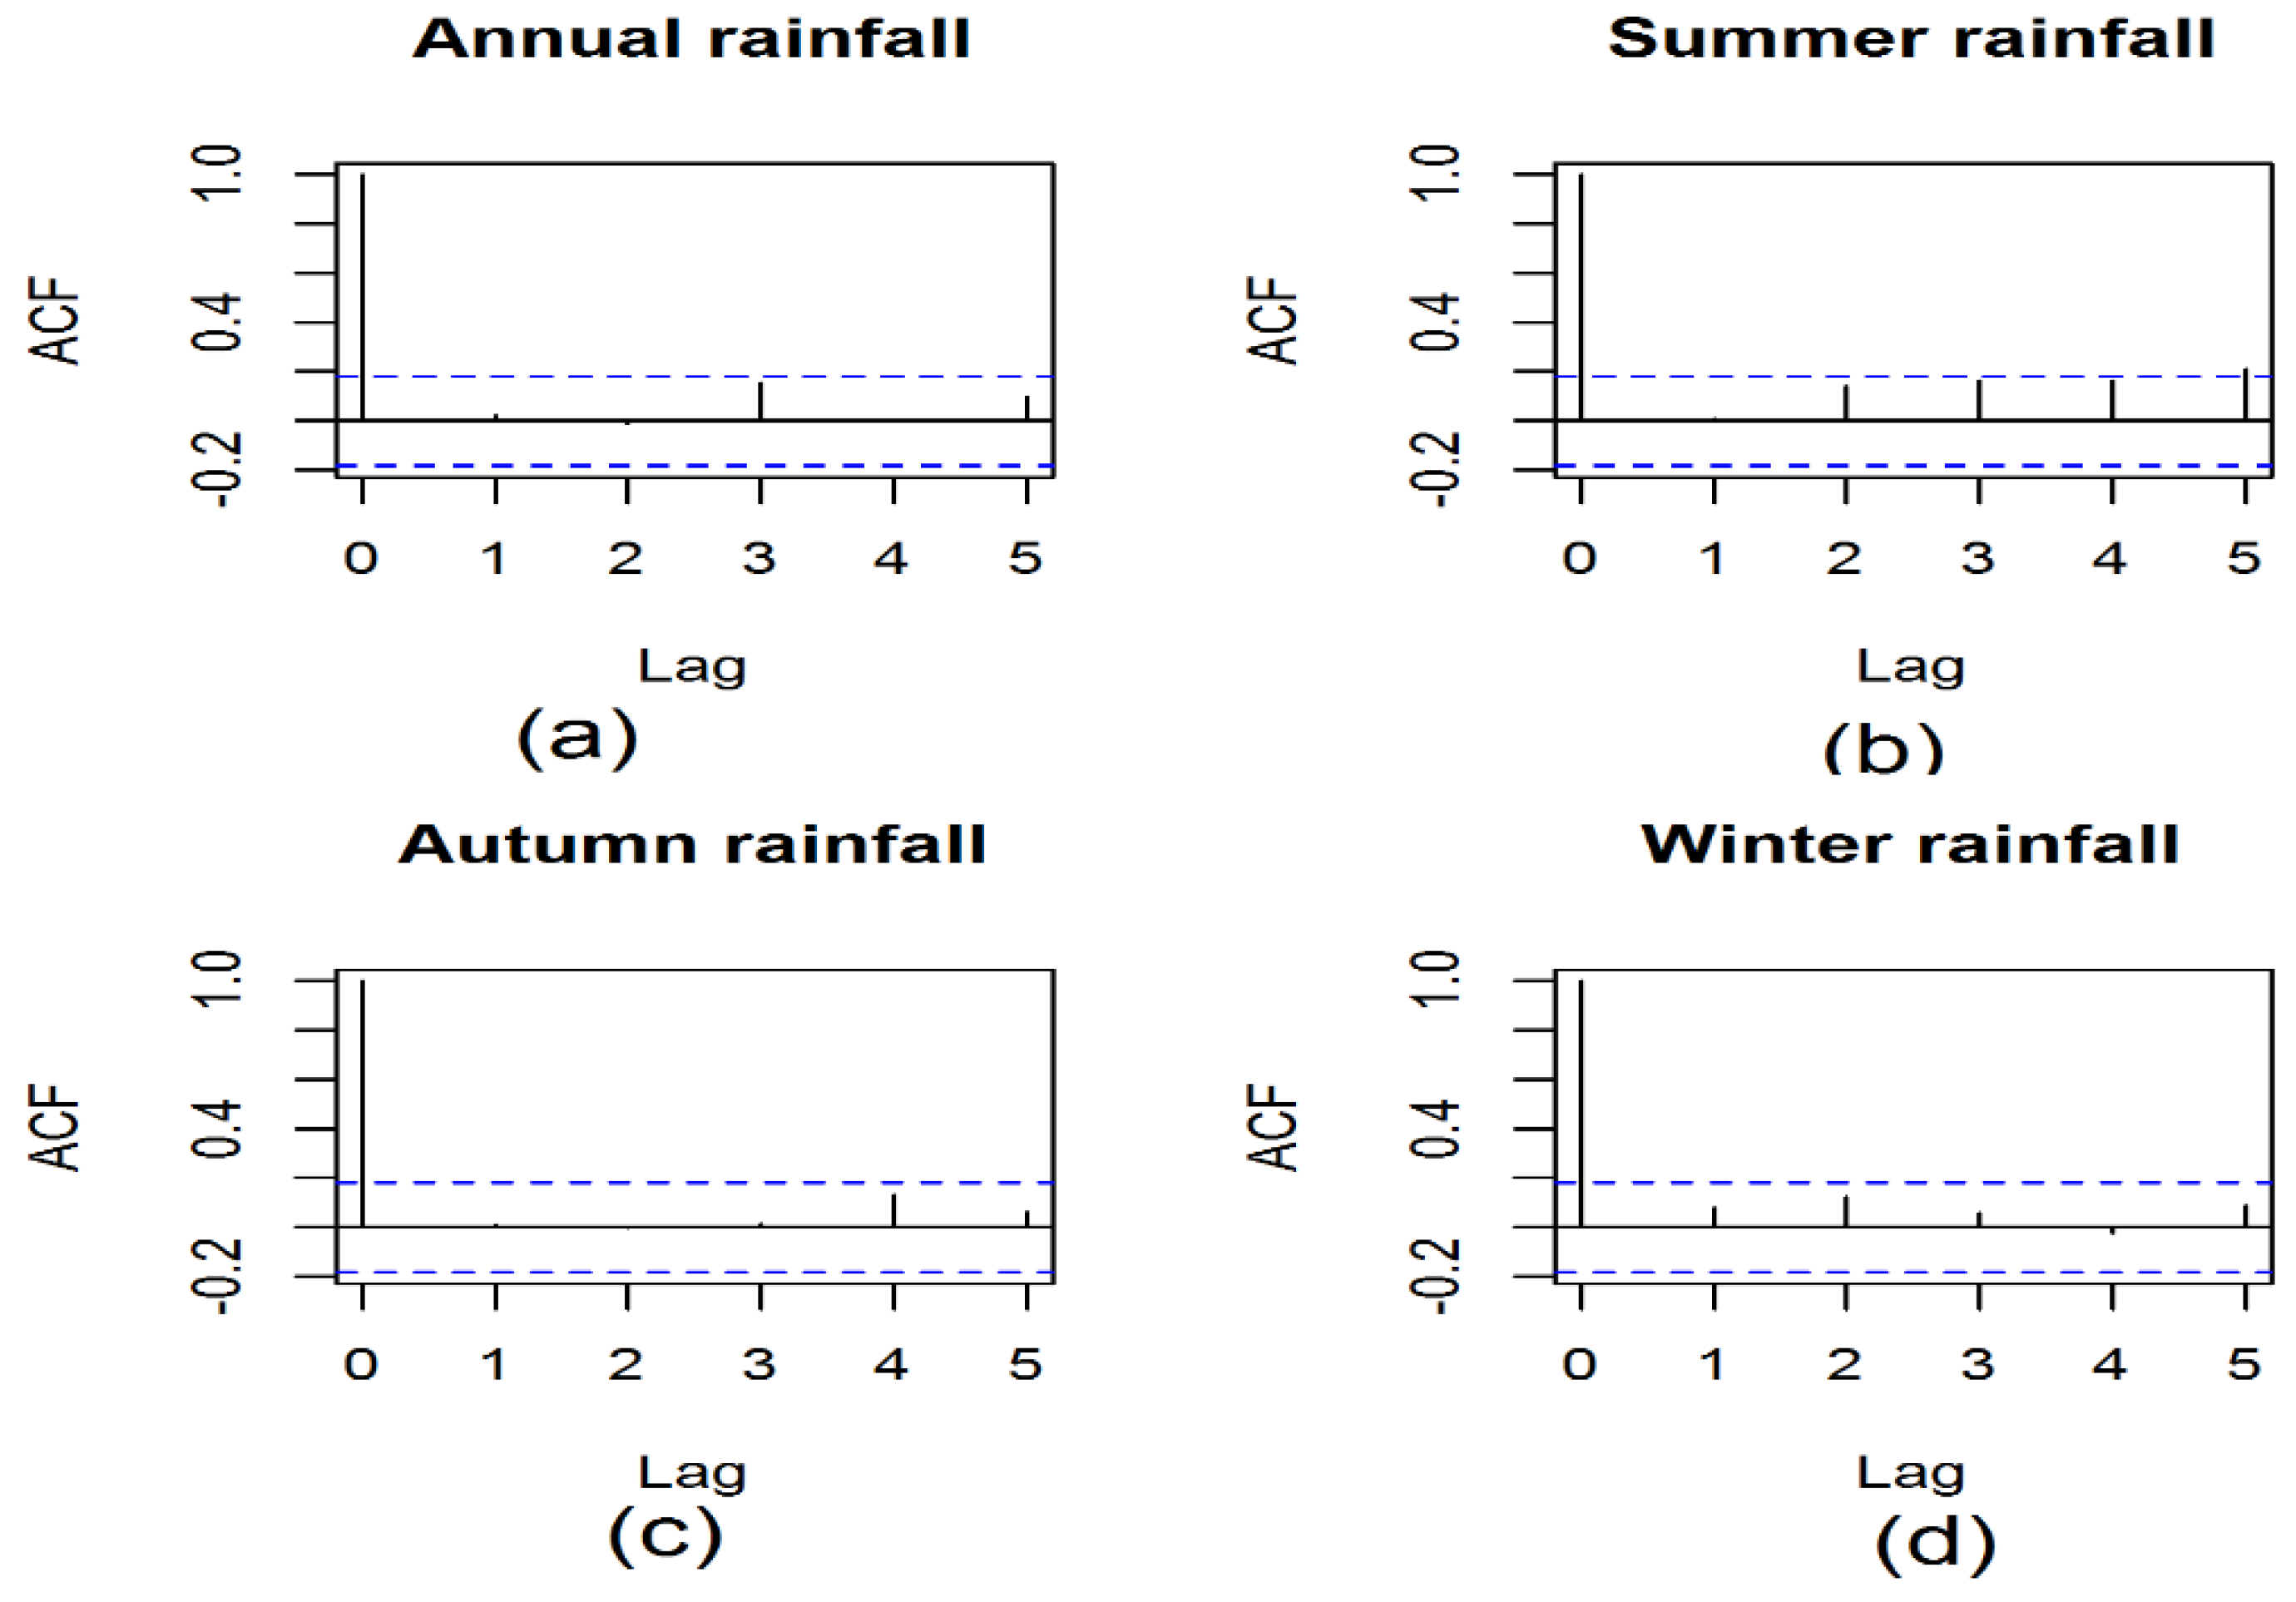
To identify the presence of serial correlation, the ACF plots for annual rainfall time series for all sub-basins and the entire basin were developed using R. For the purpose of illustration, only the ACF plots for the entire basin are shown in Figure 6a. In the ACF plot significant serial correlation is depicted when the vertical lines extend beyond the blue horizontal band (confidence interval at 95%) at lag -1. Accordingly, as shown in Figure 6, no significant serial correlation is found for annual rainfall time series for the entire basin. Similarly, the ACF plots annual rainfall time series for all sub-basins (not shown in the figure) also revealed no significant serial correlation. Thus, the original Mann-Kendall trend test was applied to annual rainfall time series. According to the MK test (Table 3), there has been no significant trend in annual rainfall time series for all sub-basins and for the entire basin over the period 1901–2016. Figure 7 shows the plot for annual rainfall time series for the sub-basins and the entire basin.
3.3. Trend of Seasonal Rainfall in the Awash River Basin
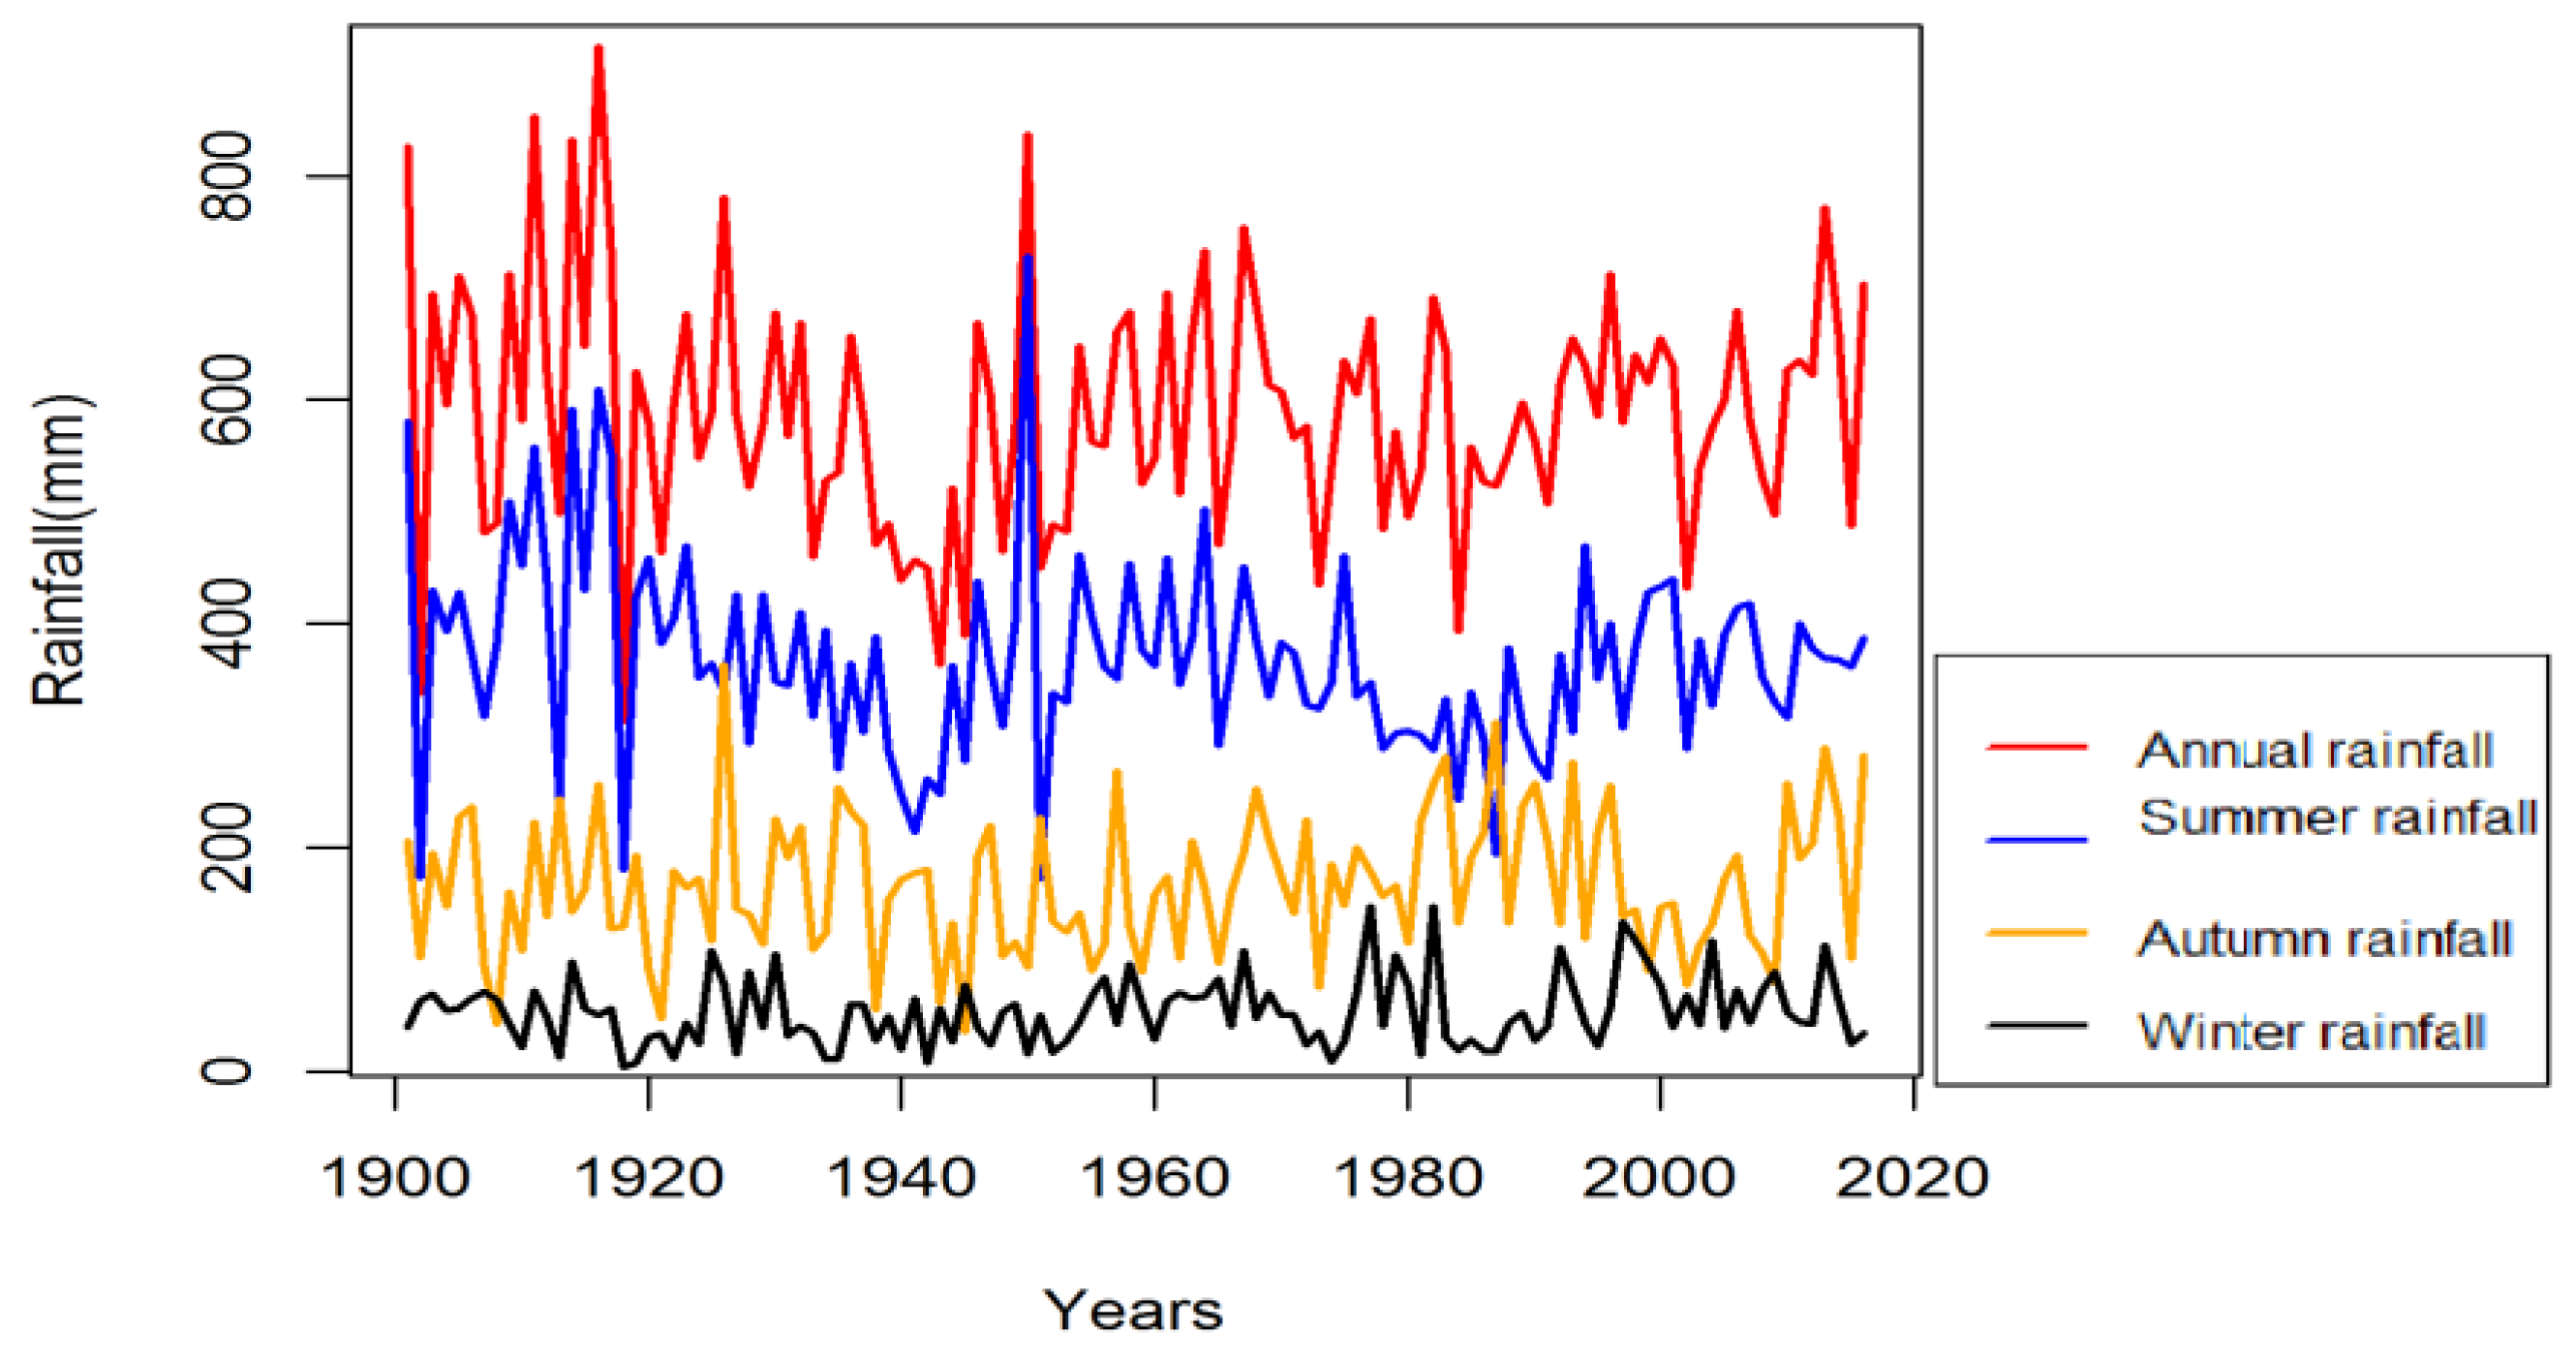
After aggregating the monthly time series data into three seasonal time series, the serial correlation test and subsequent analysis of trend were carried out for the basin and sub-basin. Figure 8 shows the plot of annual and seasonal rainfall time series for the entire basin. The ACF plots for seasonal rainfall time series for all sub-basins and the entire basin were used to identify the presence of serial correlation.
For illustration, the ACF plots for the three seasonal time series for the entire basin is shown in Figure 6b–d. In the ACF plot significant serial correlation is depicted when the vertical lines extend beyond the blue horizontal band (confidence interval at 95%) at lag -1. Accordingly, no significant serial correlation is found for the seasonal rainfall time series for the entire basin (Figure 6b–d). Similarly, the ACF plots of seasonal rainfall time series for all sub-basins (not shown in the figure) also revealed no significant serial correlation. Thus, similar to annual rainfall time series, the original Mann-Kendall trend test was applied to all seasonal rainfall time series.
3.3.1. Trends of Summer Rainfall
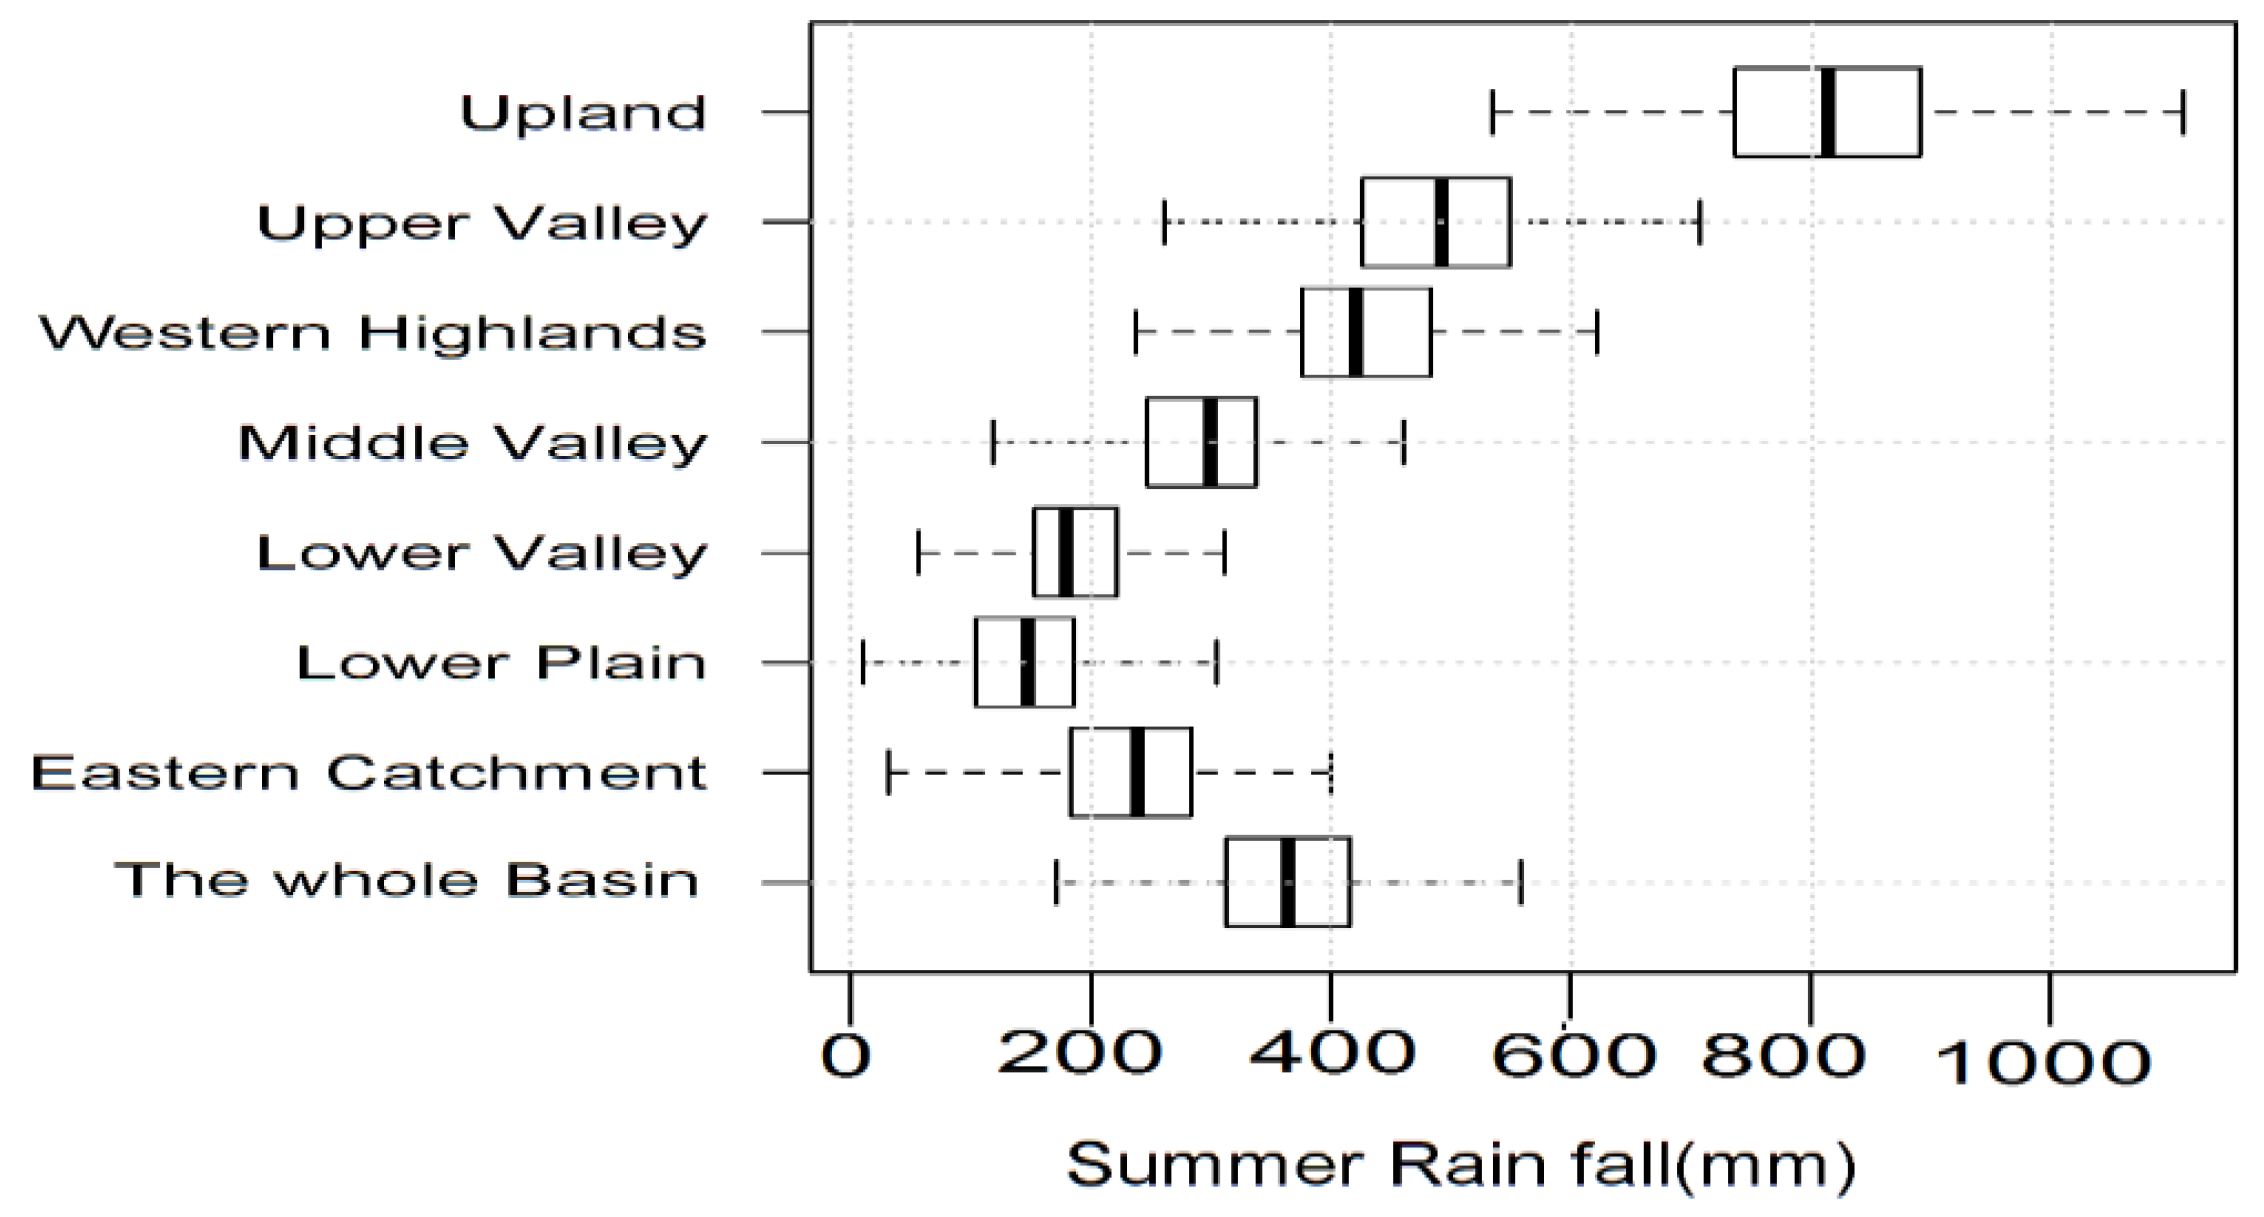
The summary statistics for summer rainfall time series (1901 to 2016) show that the minimum, mean, and maximum annual rainfall over the sub-basins range from 10.5 to 417.7 mm, 159.1 to 818.9 mm, and 458.4 to 1160.8 mm, respectively. Similarly, the first quarter, median, and third quarter vary from 104.5 to 738.1 mm, 148.2 to 813.8 mm, and 184.7 to 888.6 mm, respectively. All lowest values of the statistical parameters are found at the Lower plain, while the corresponding highest values are found at the Upland catchment. On the basin level, the minimum, mean, and maximum annual rainfall over the sub-basins are 171.7, 368.5, and 727.7 mm, respectively (Figure 9).
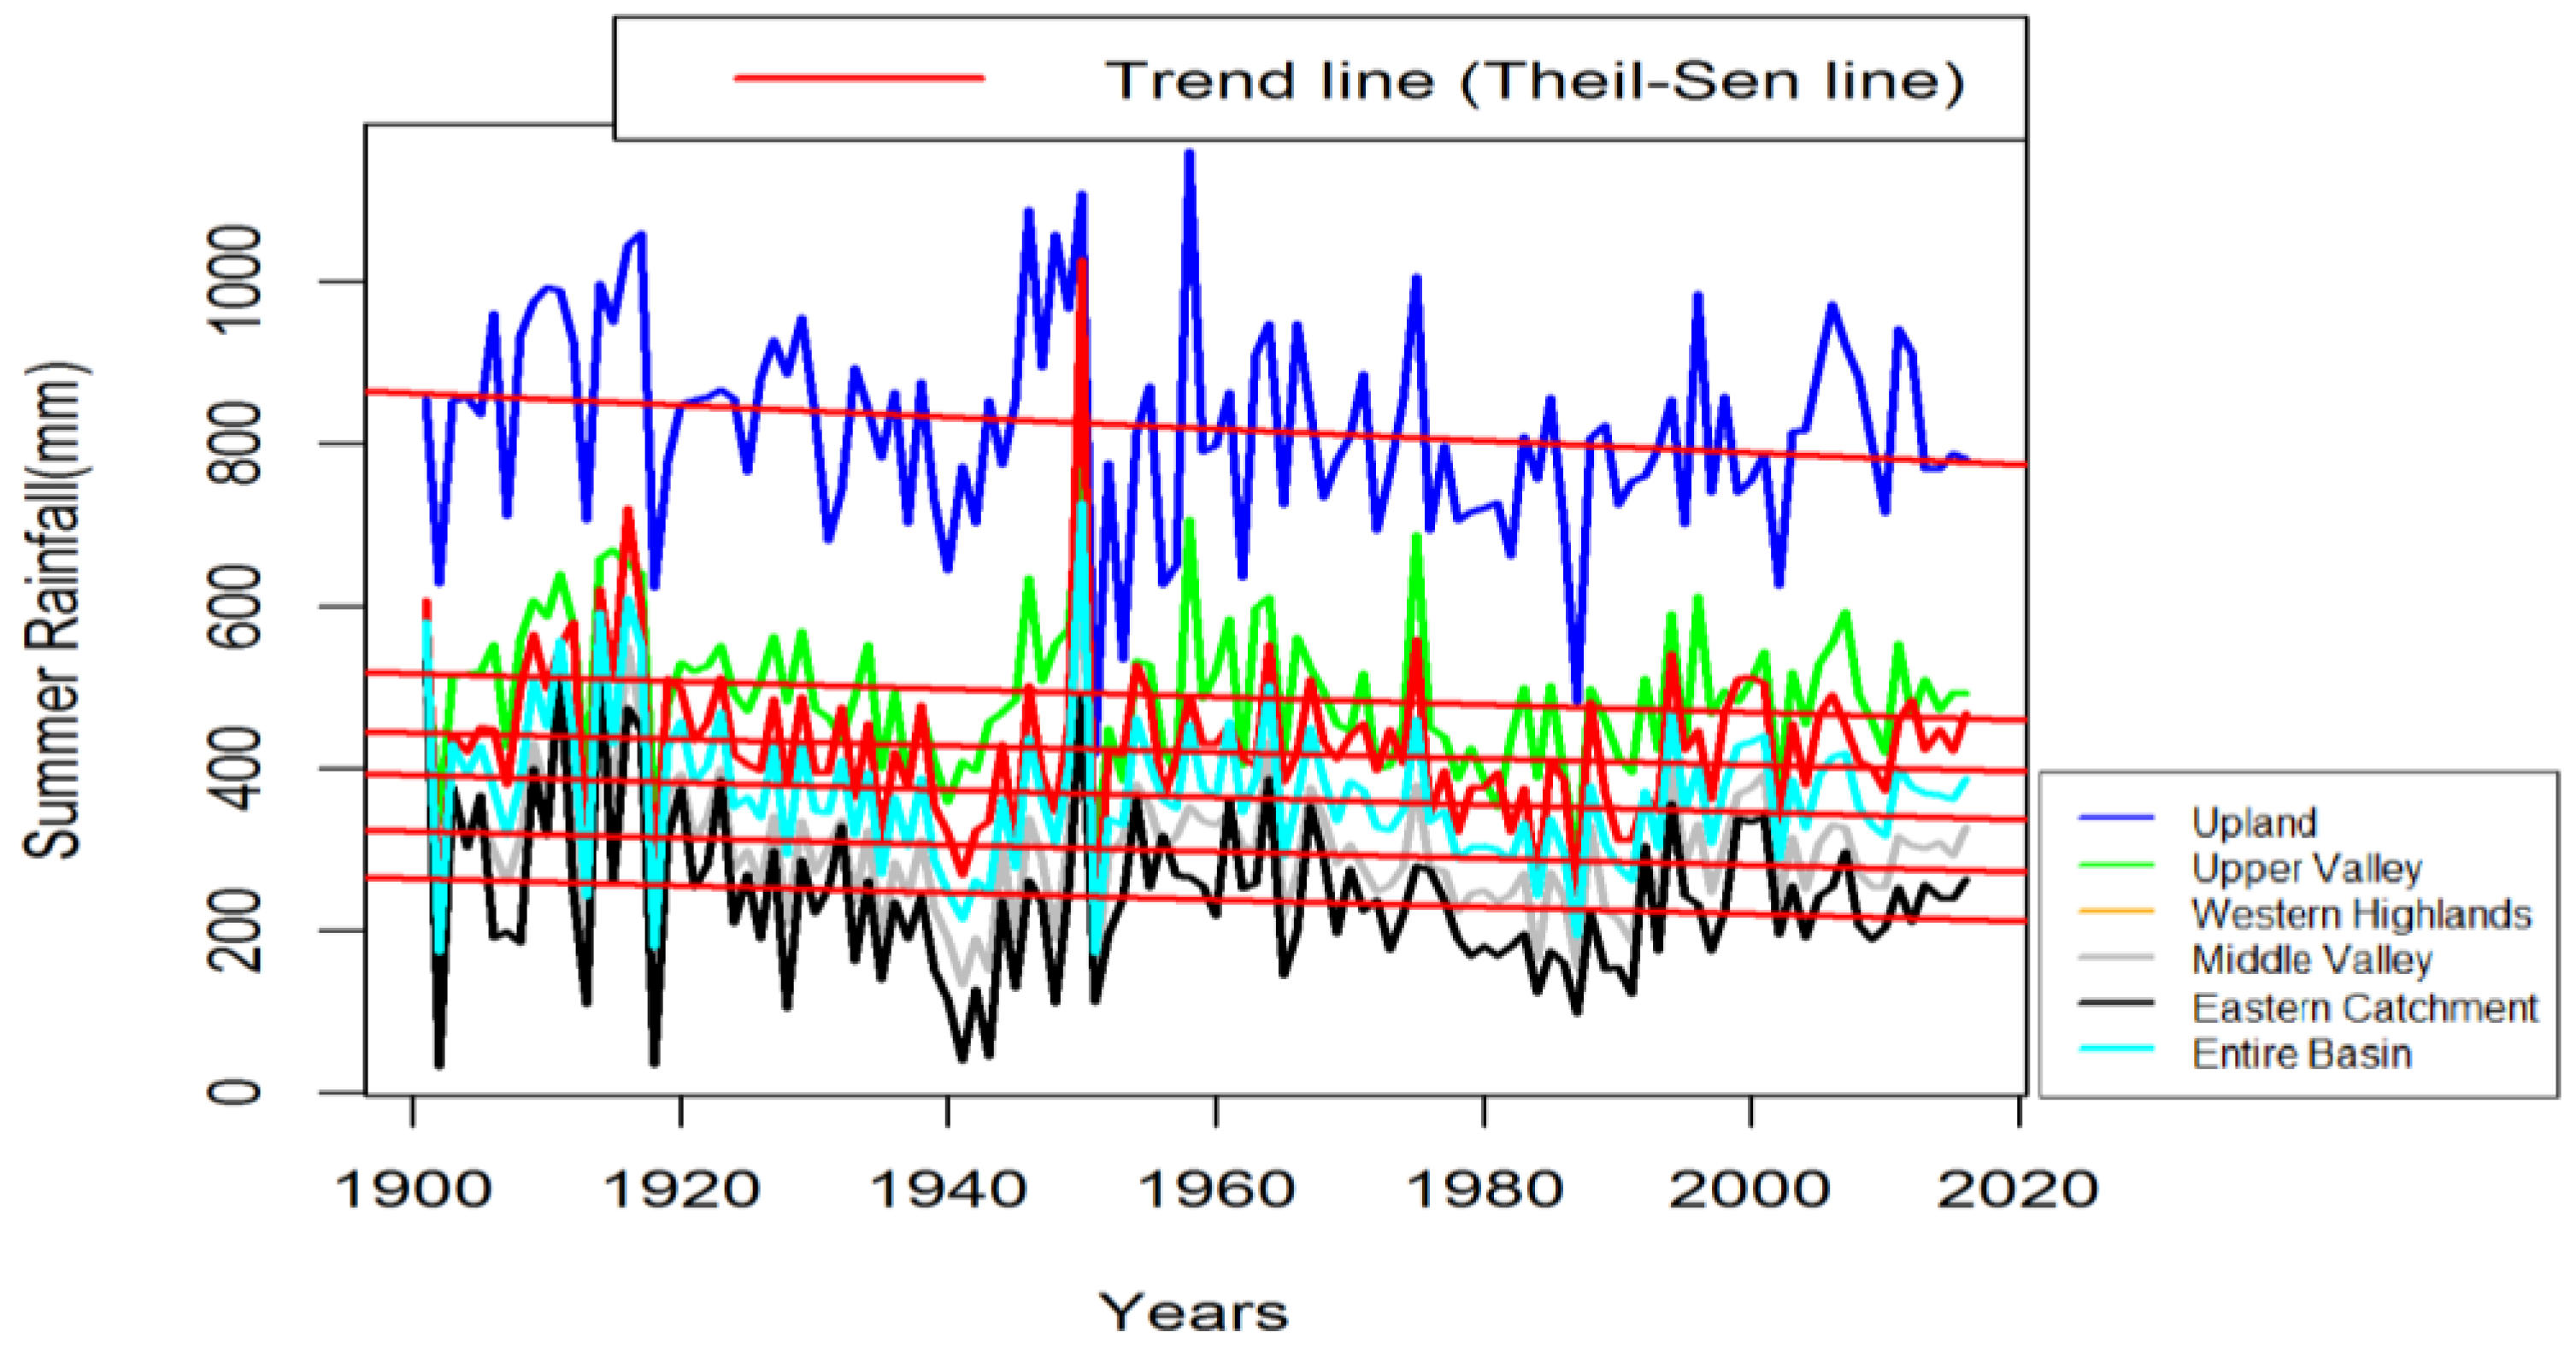
As shown in Table 4, a significant decreasing trend (α = 0.05) was identified in the summer rainfall in three sub-basins: Upland, Upper Valley, and Middle Valley. A significant decreasing trend was also identified for the other two sub-basins (for the Eastern Catchment at α = 0.1 and for the Western Highlands at α = 0.11). Similarly, the basin-averaged summer rainfall season has shown significant decreasing trend (α = 0.05), whereas in two of the seven sub-basins (the Lower Valley and the Lower Plain), no significant trend was identified, despite non-significant decreasing tendency. Thus, the summer rainfall season in the Awash River Basin can be characterized by either decreasing or no trend.
As shown in Table 4, the rate of decline varies from 4 to 7.4 mm per decade across sub-basins. The rate of decline in summer rainfall is estimated at 4.6 mm per decade for the entire basin. Figure 10 shows the plot for winter rainfall and trend line for time series, showing significant increasing trends.
3.3.2. Trends of Autumn Rainfall
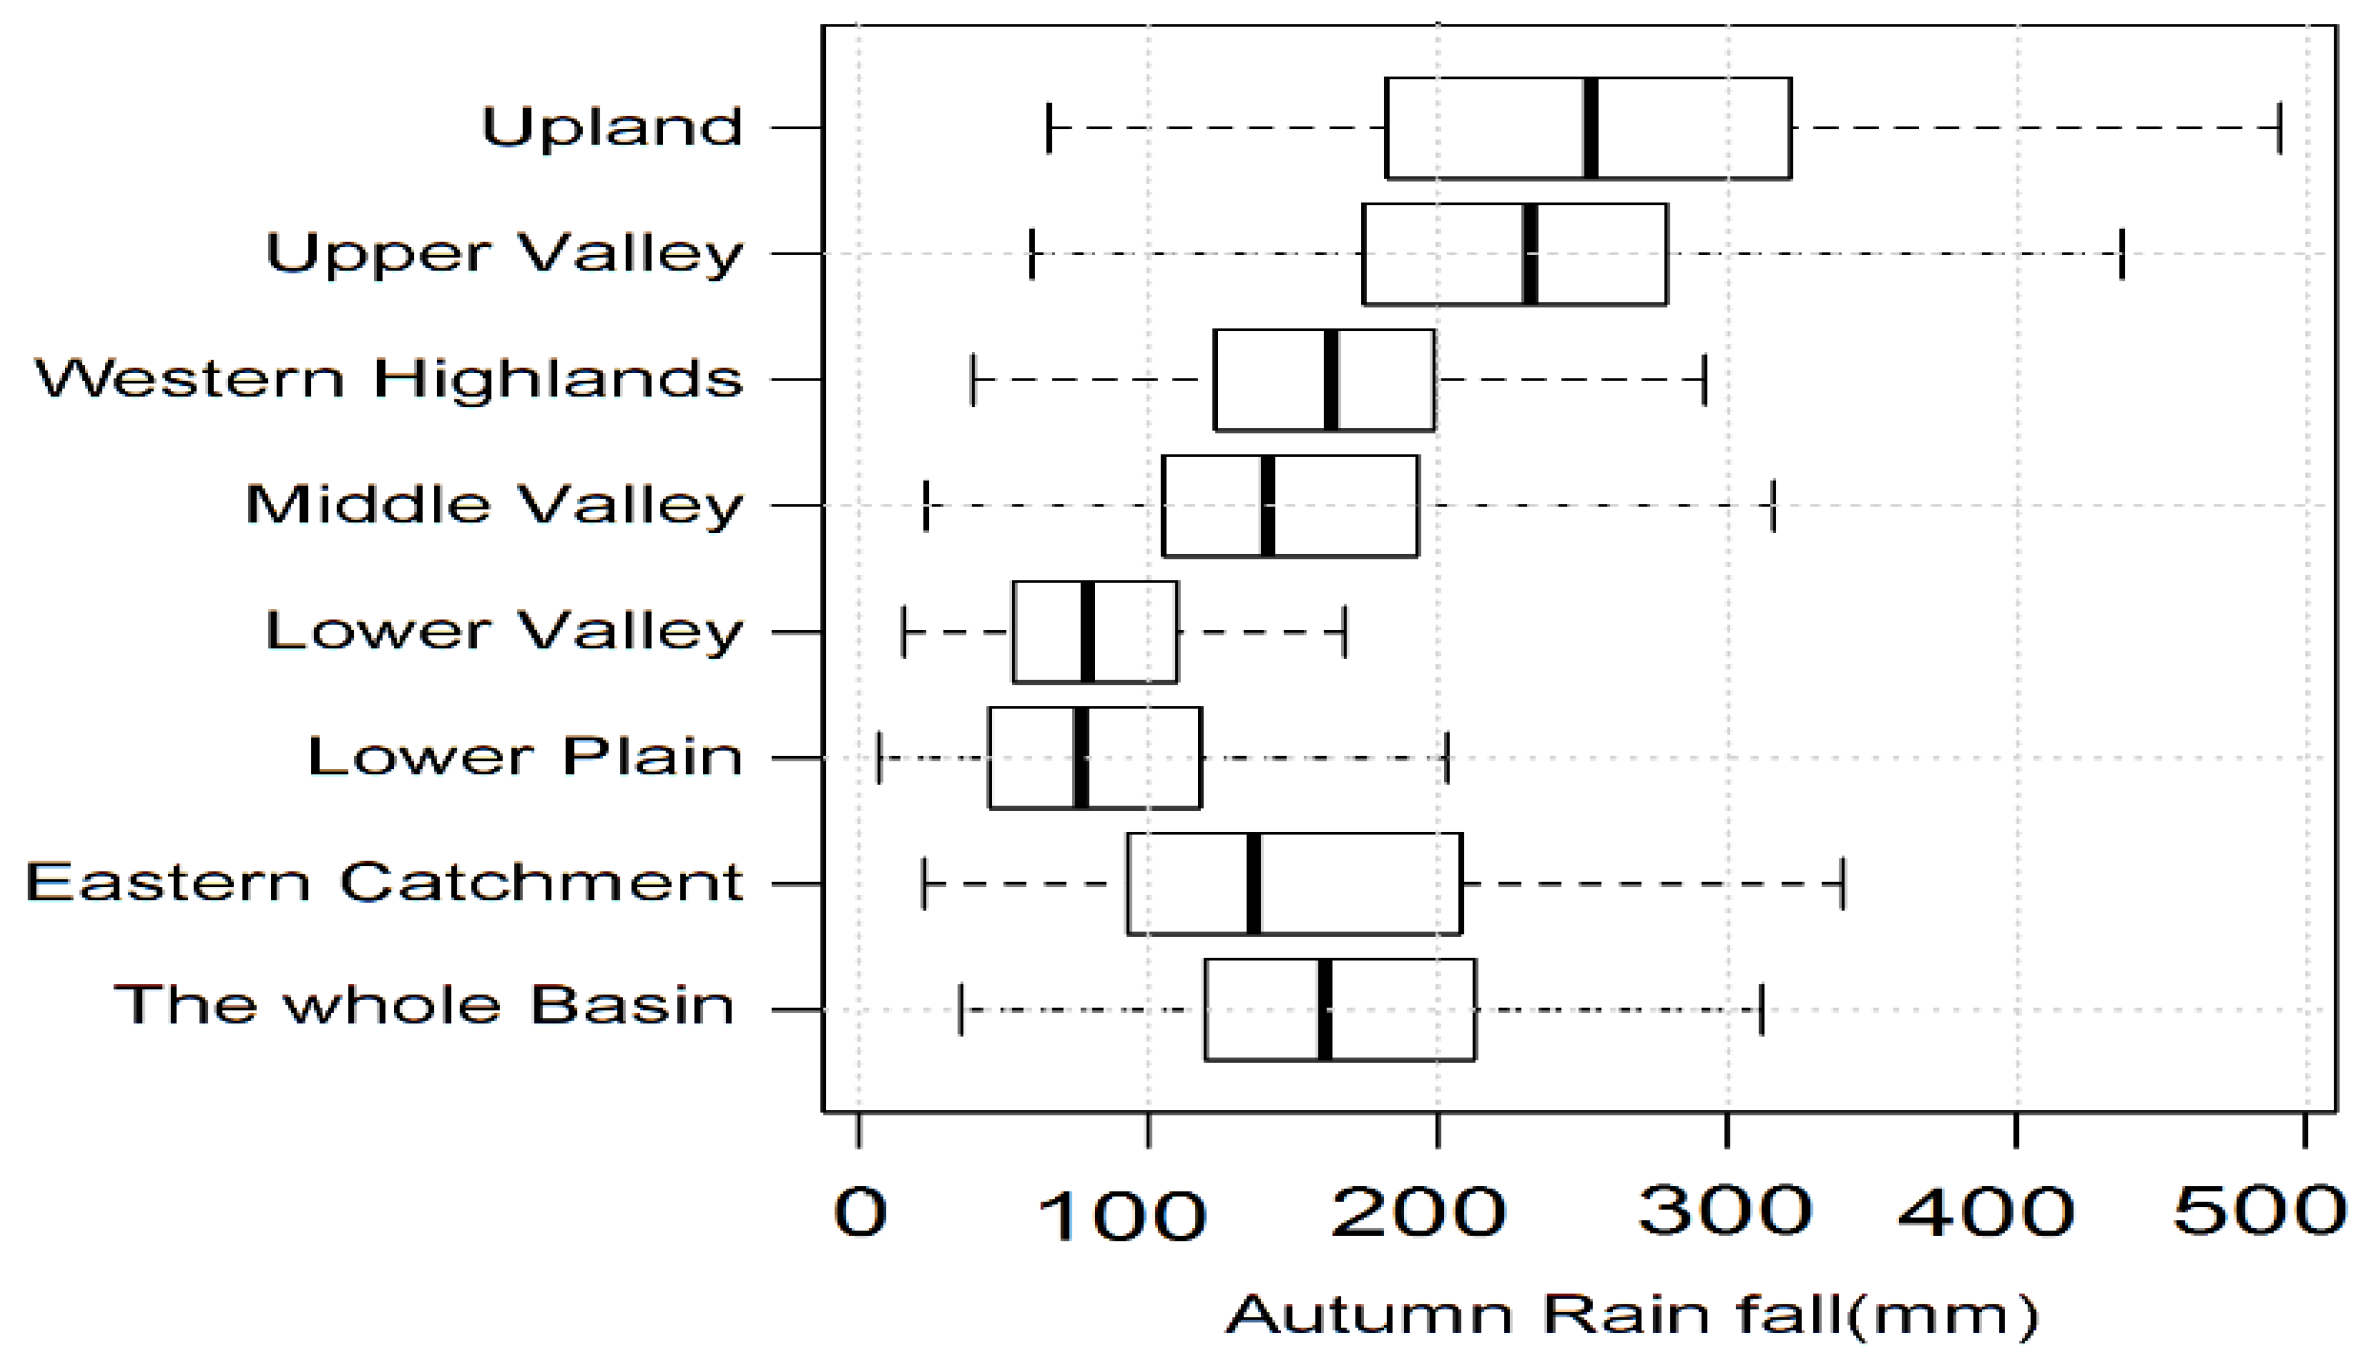
The summary statistics for autumn rainfall time series (1901 to 2016) show that the minimum, mean, and maximum annual rainfall over the sub-basins range from 7.1 to 65.7 mm, 83.59 to 260.7 mm, and 168.2 to 589.3 mm, respectively. Similarly, the first quarter, median, and third quarter vary from 46.6 to 182.6 mm, 76.75 to 252.8 mm, and 109.42 to 320.8 mm, respectively. All of the corresponding highest values of the statistical parameters are found at the Upland catchment, while the lowest values are found in the Lower plain and the Lower valley. At the basin level, the minimum, mean, and maximum autumn rainfall over the sub-basins are 35.7, 167, and 363.4 mm, respectively (Figure 11).
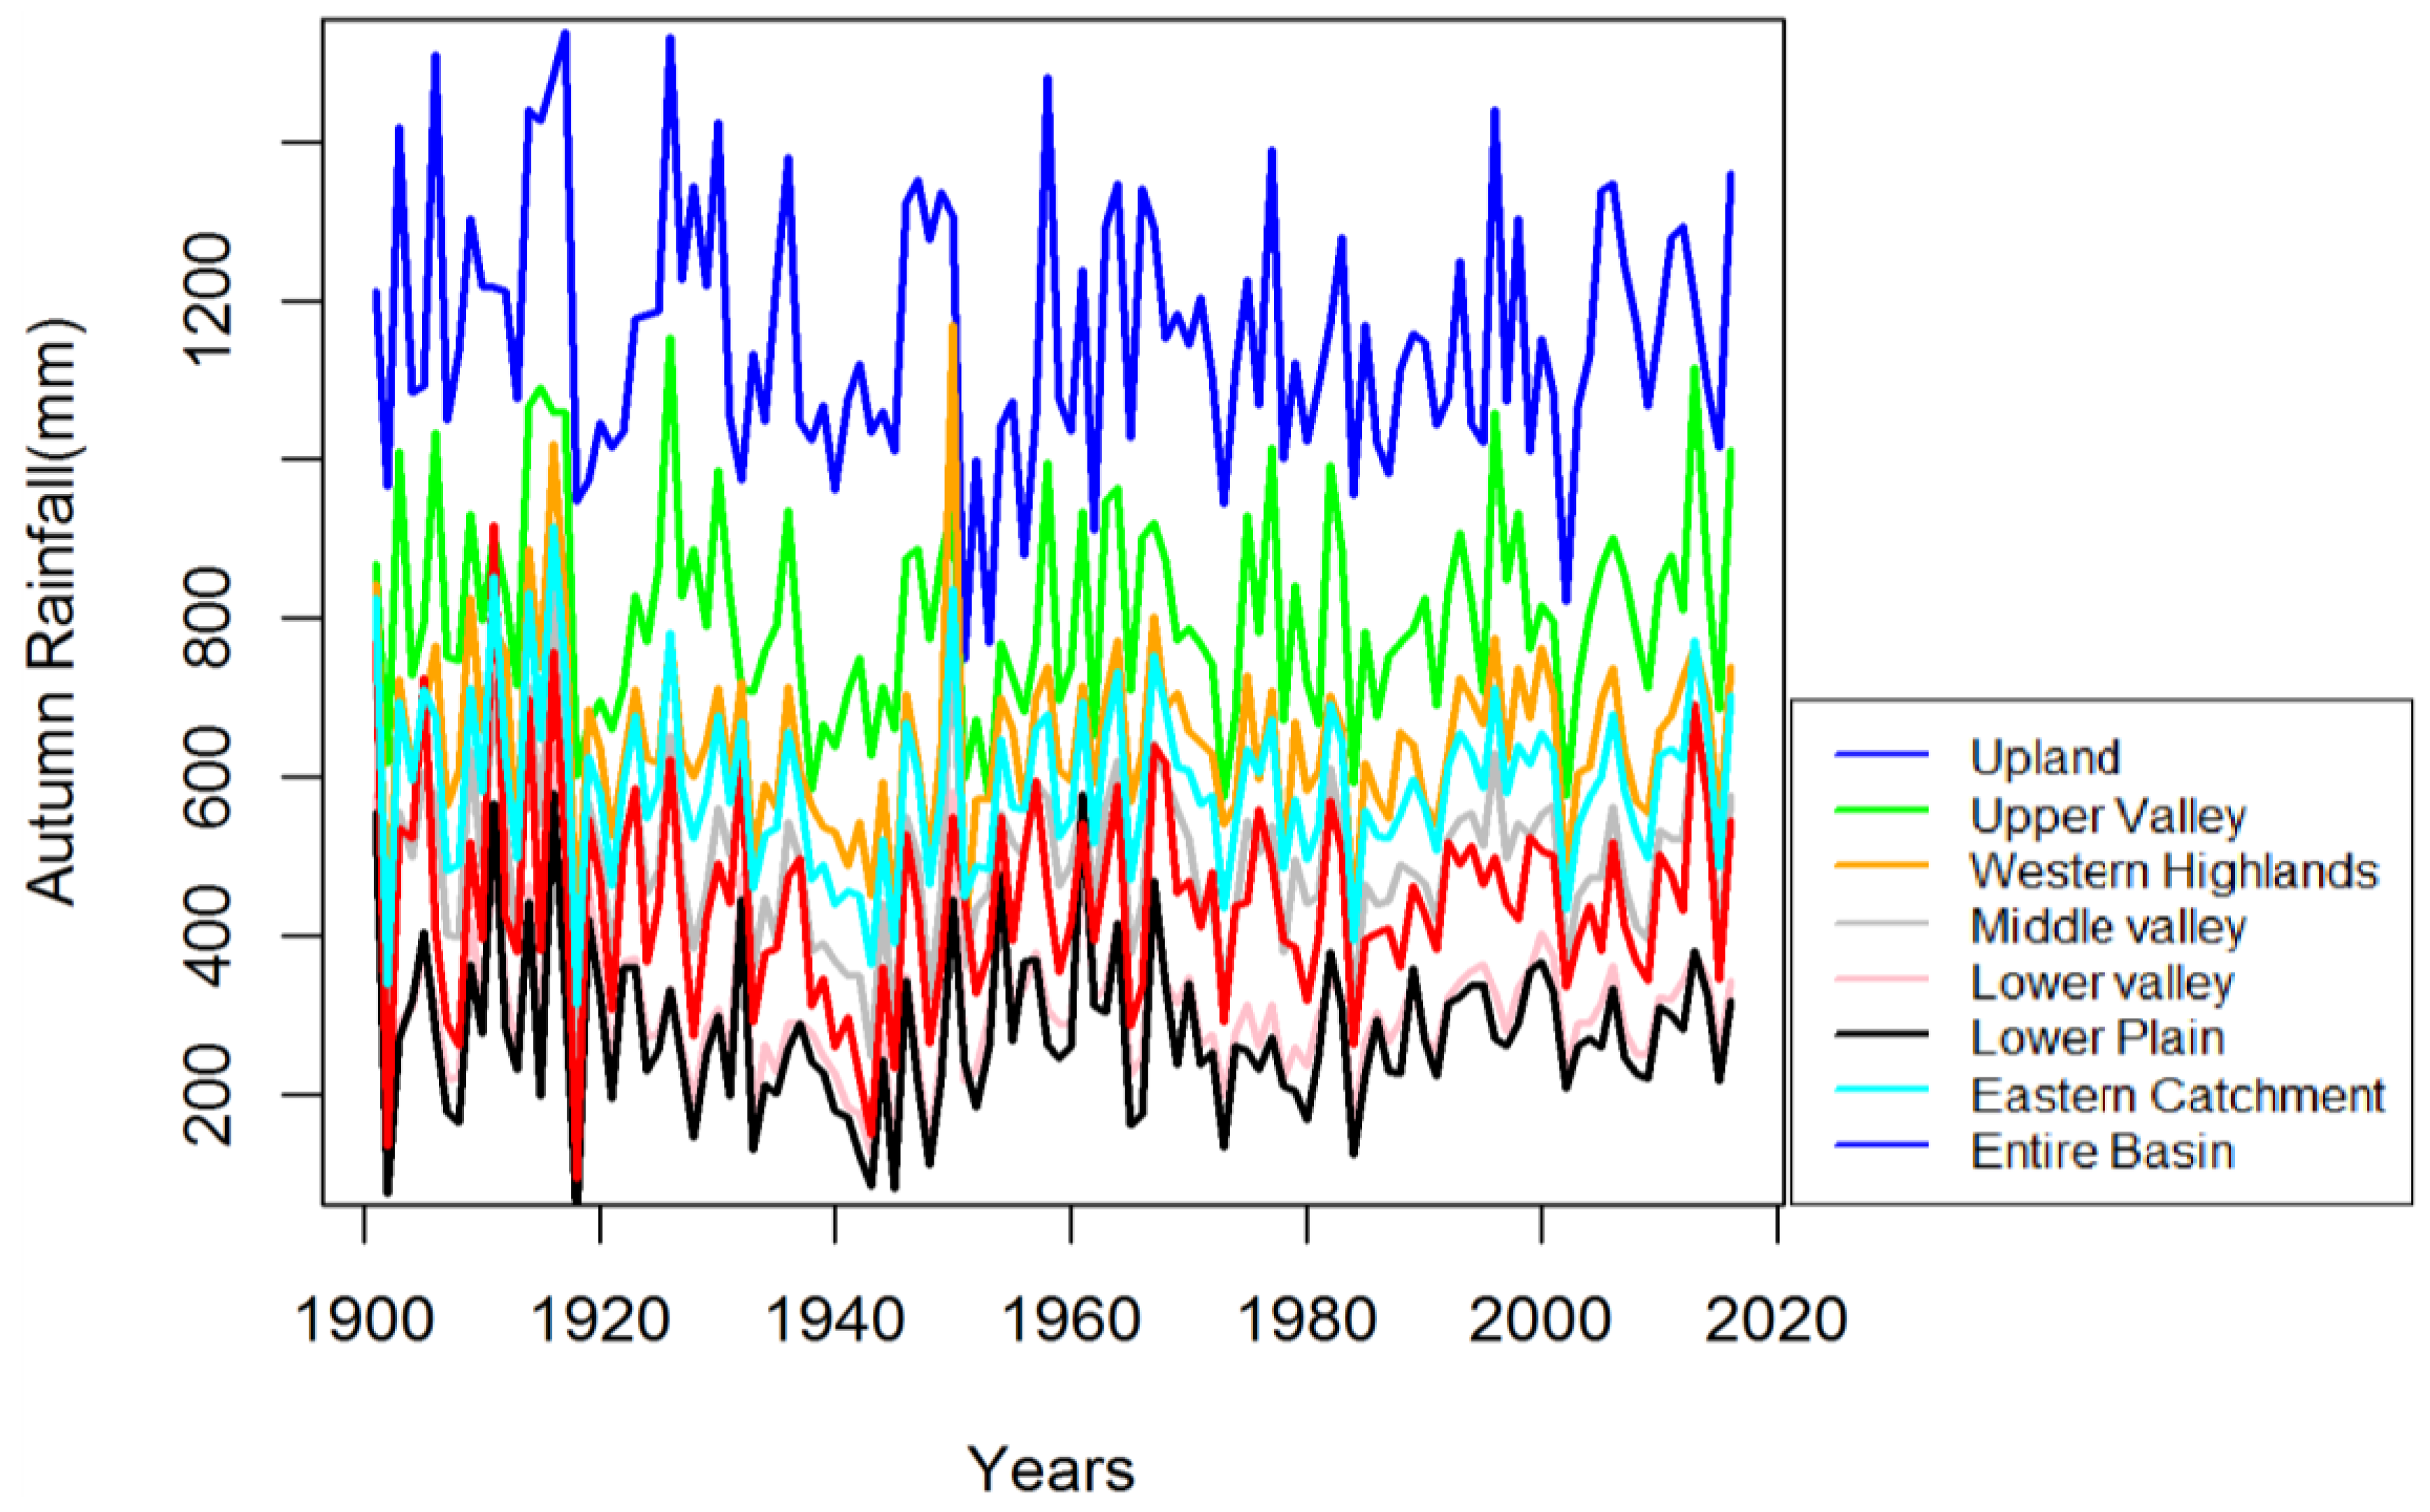
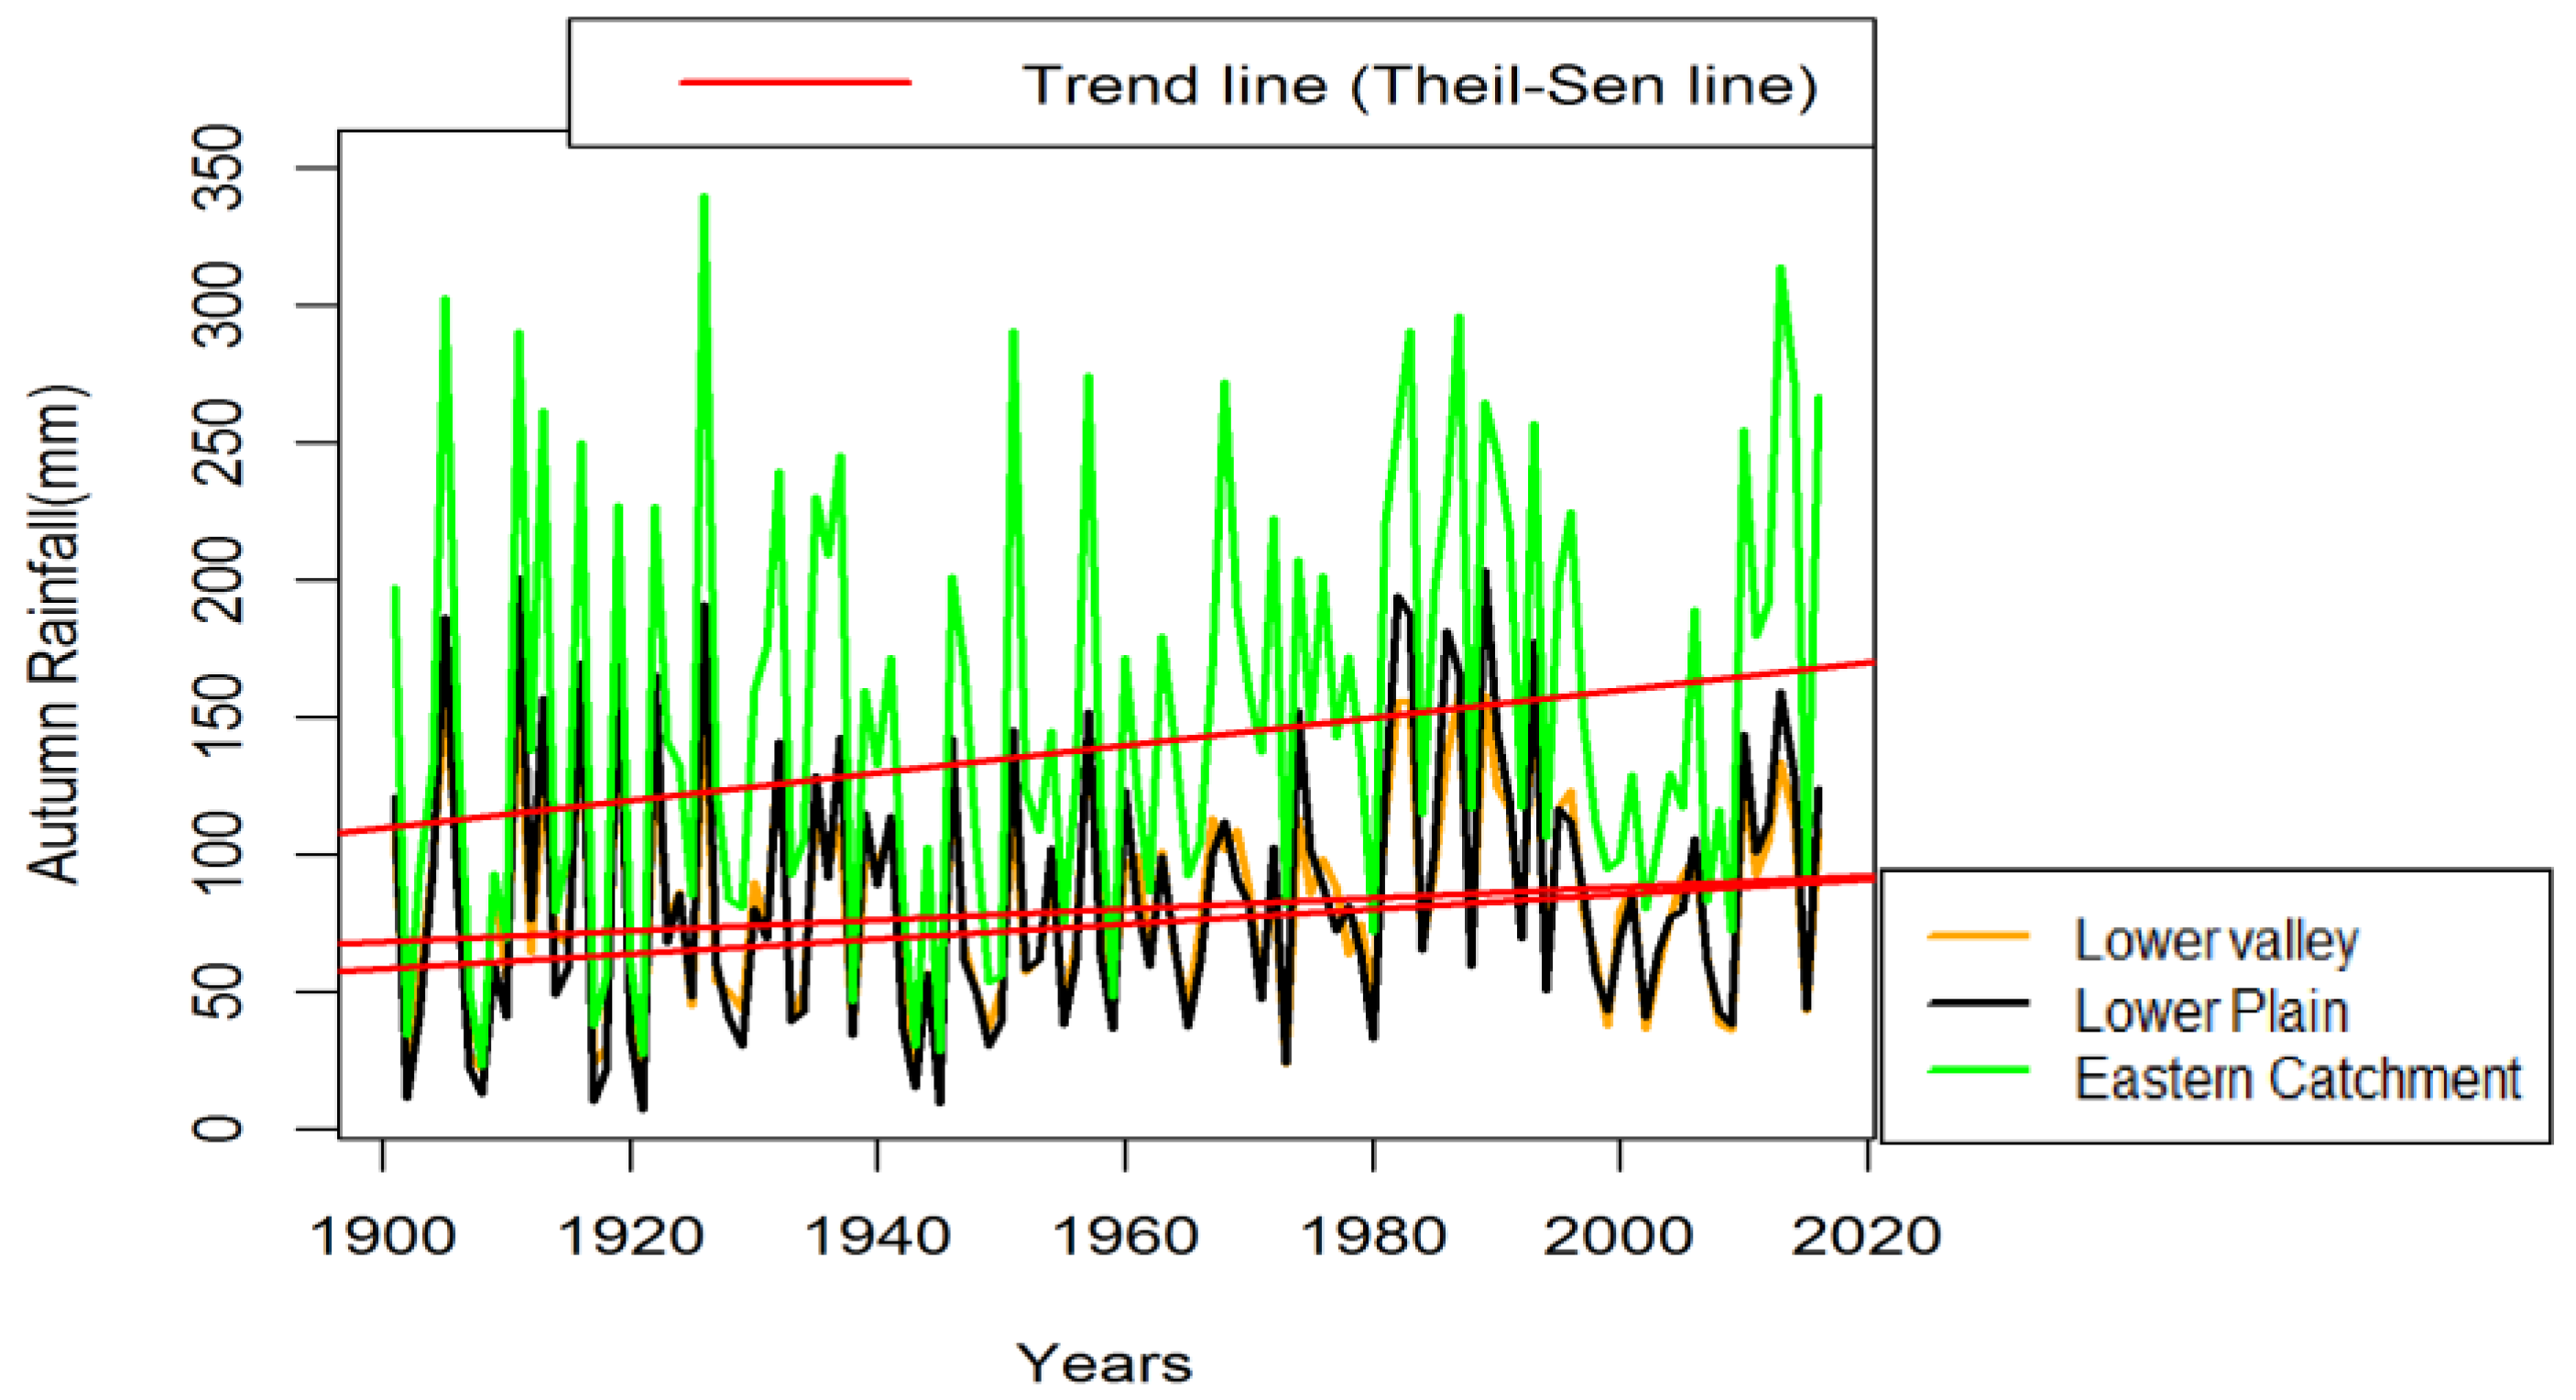
As shown in Table 5, no significant trend was identified in the autumn season for all sub-basins, except the Lower Plain, Eastern Catchment, and Lower Valley, while a significant increasing trend was identified at α = 0.05 in the Lower Plain and the Eastern Catchment, and at α = 0.1 in the Lower Valley. At the basin level, no significant trend was identified for autumn rainfall. Thus, the autumn season rainfall can generally be characterized by either increasing or no trend in the basin. The rate of increase in the autumn rainfall (Table 5) is estimated as 4.6 mm per decade for the entire basin and varying from 2 to 5 mm per decade across the sub-basins. Figure 12 shows the plot for autumn rainfall and trend line for time series, showing significant trends.
3.3.3. Trends of Winter Rainfall
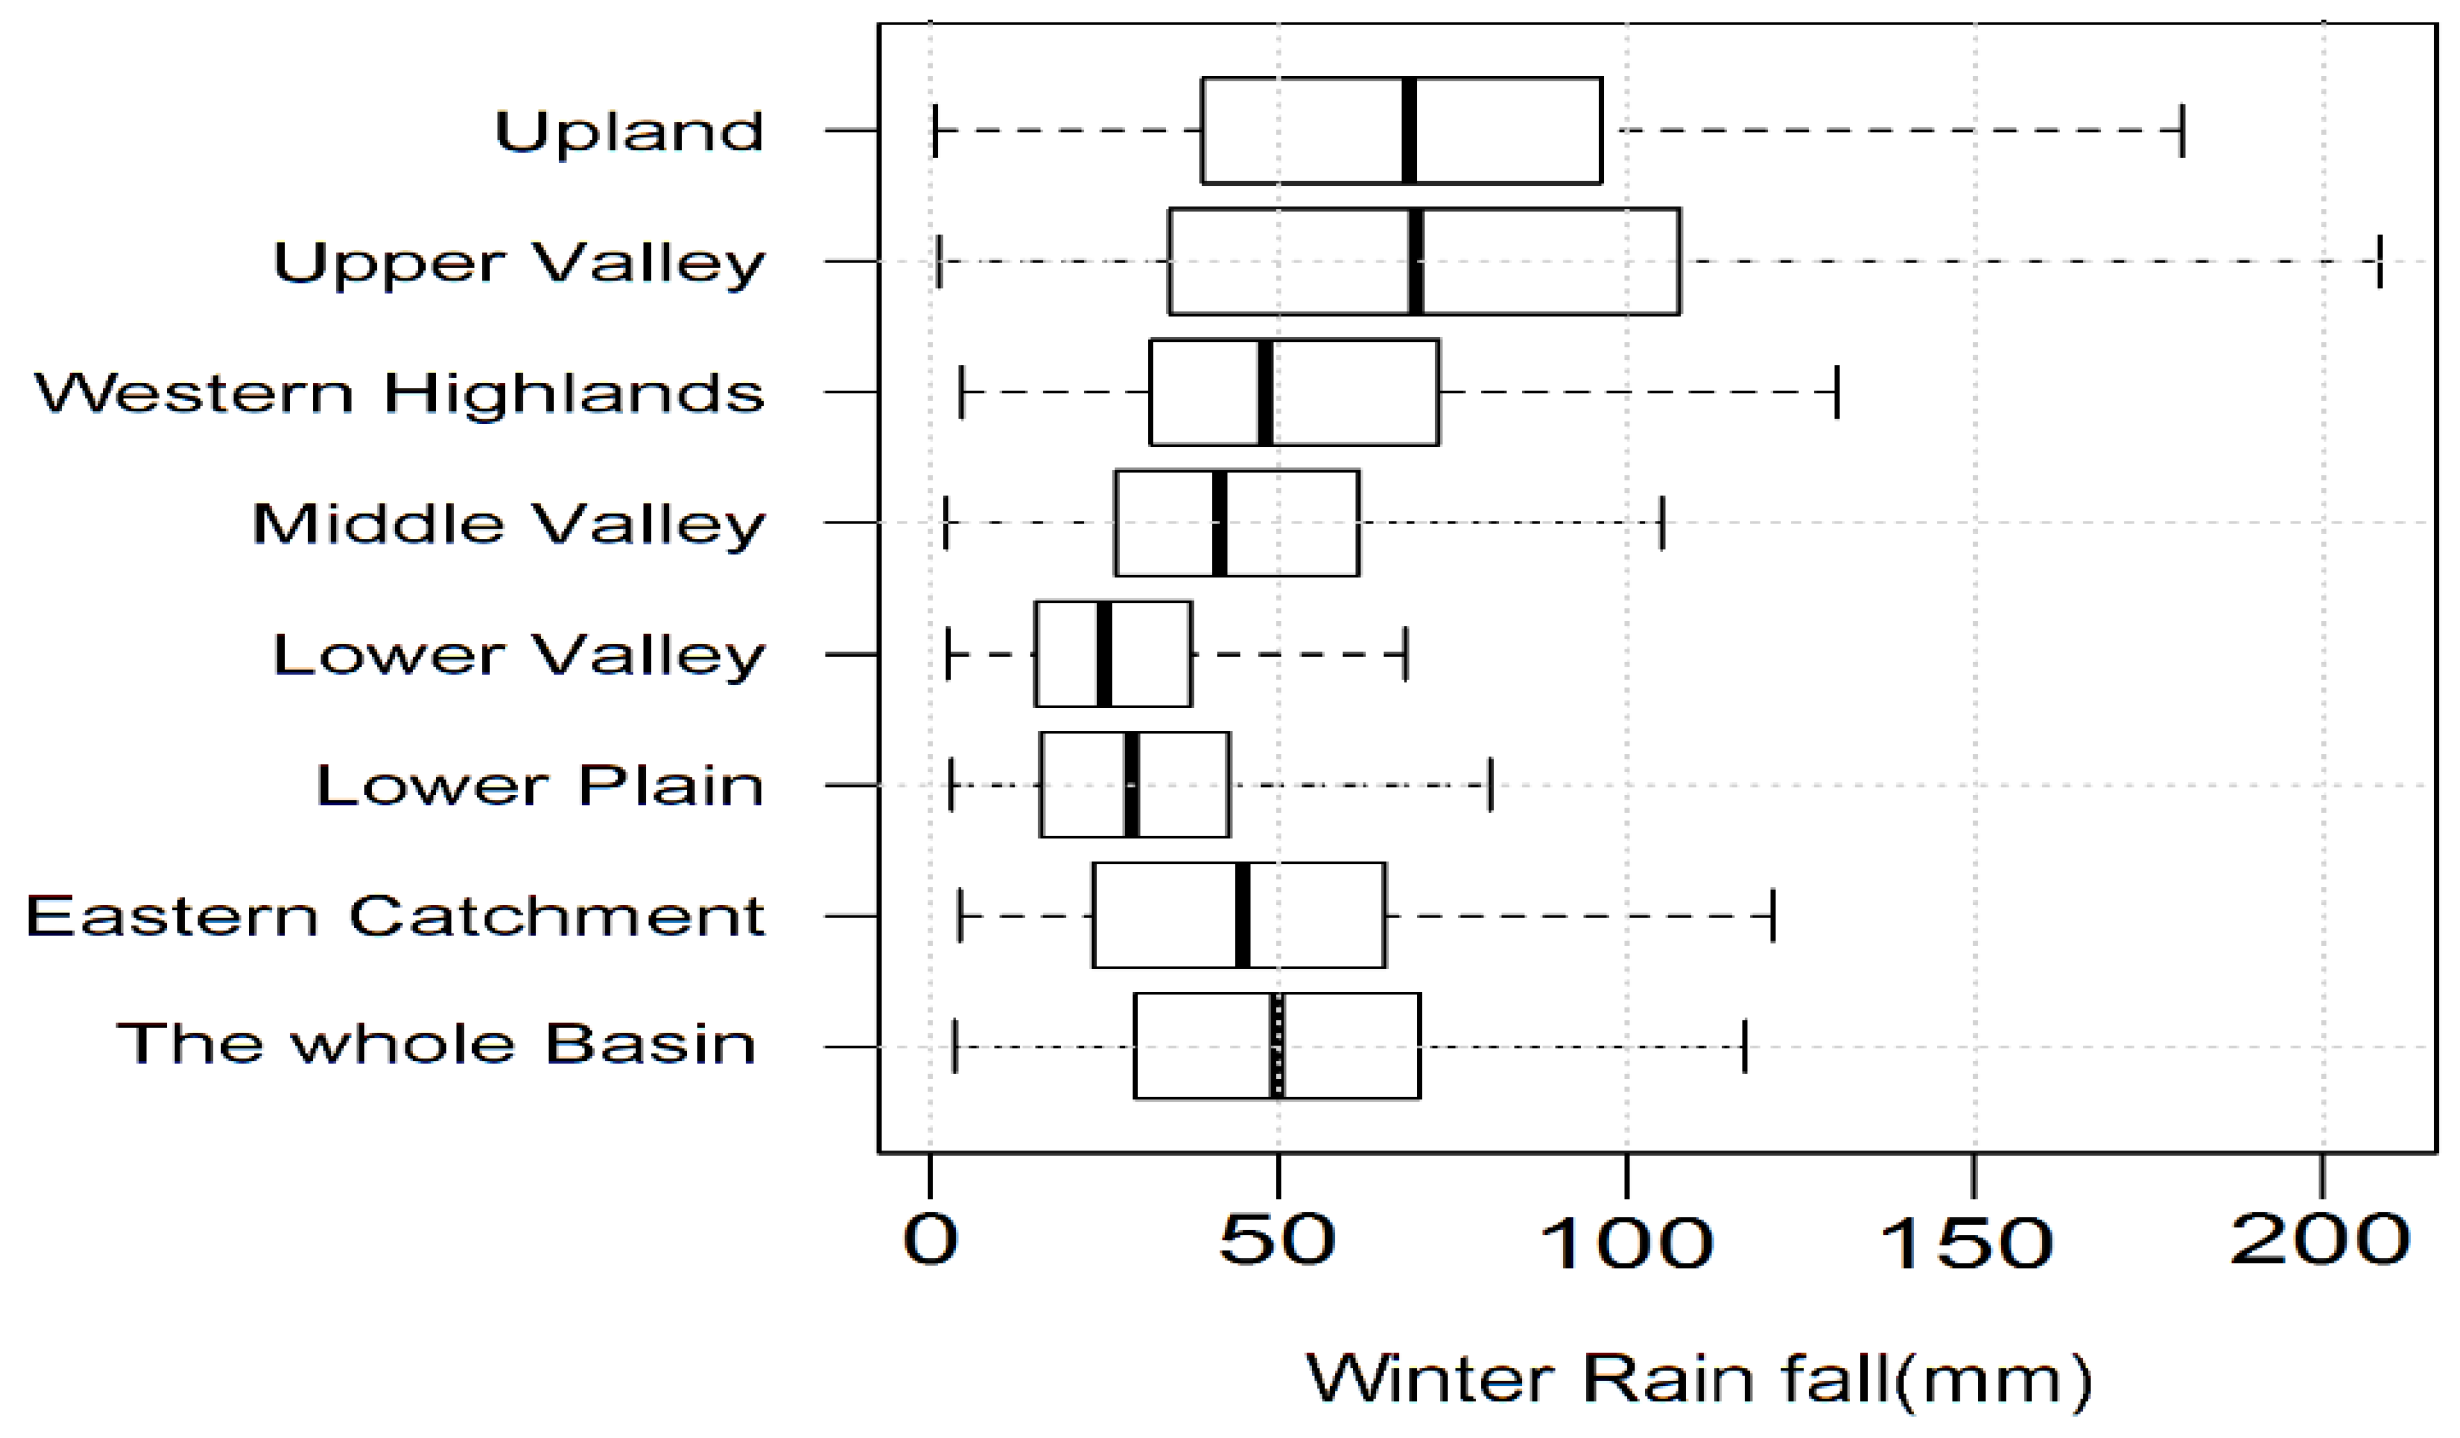
The summary statistics for winter rainfall time series (1901 to 2016) show that the minimum, mean, and maximum annual rainfall over the sub-basins range from 0.6 to 4.4 mm, 26.6 to 78 mm, and 71.1 to 319.4 mm, respectively. Similarly, the first quarter, median, and third quarter vary from 15.18 to 38.98 mm, 24.65 to 69.65 mm, and 37.08 to 107.2 mm, respectively. All lowest values of the statistical parameters are found at the Lower plain, while the corresponding highest values are found at the Upland catchment. On the basin level, the minimum, mean, and maximum annual rainfall over the sub-basins are 3.4, 53.3, and 147.6 mm, respectively (Figure 13).
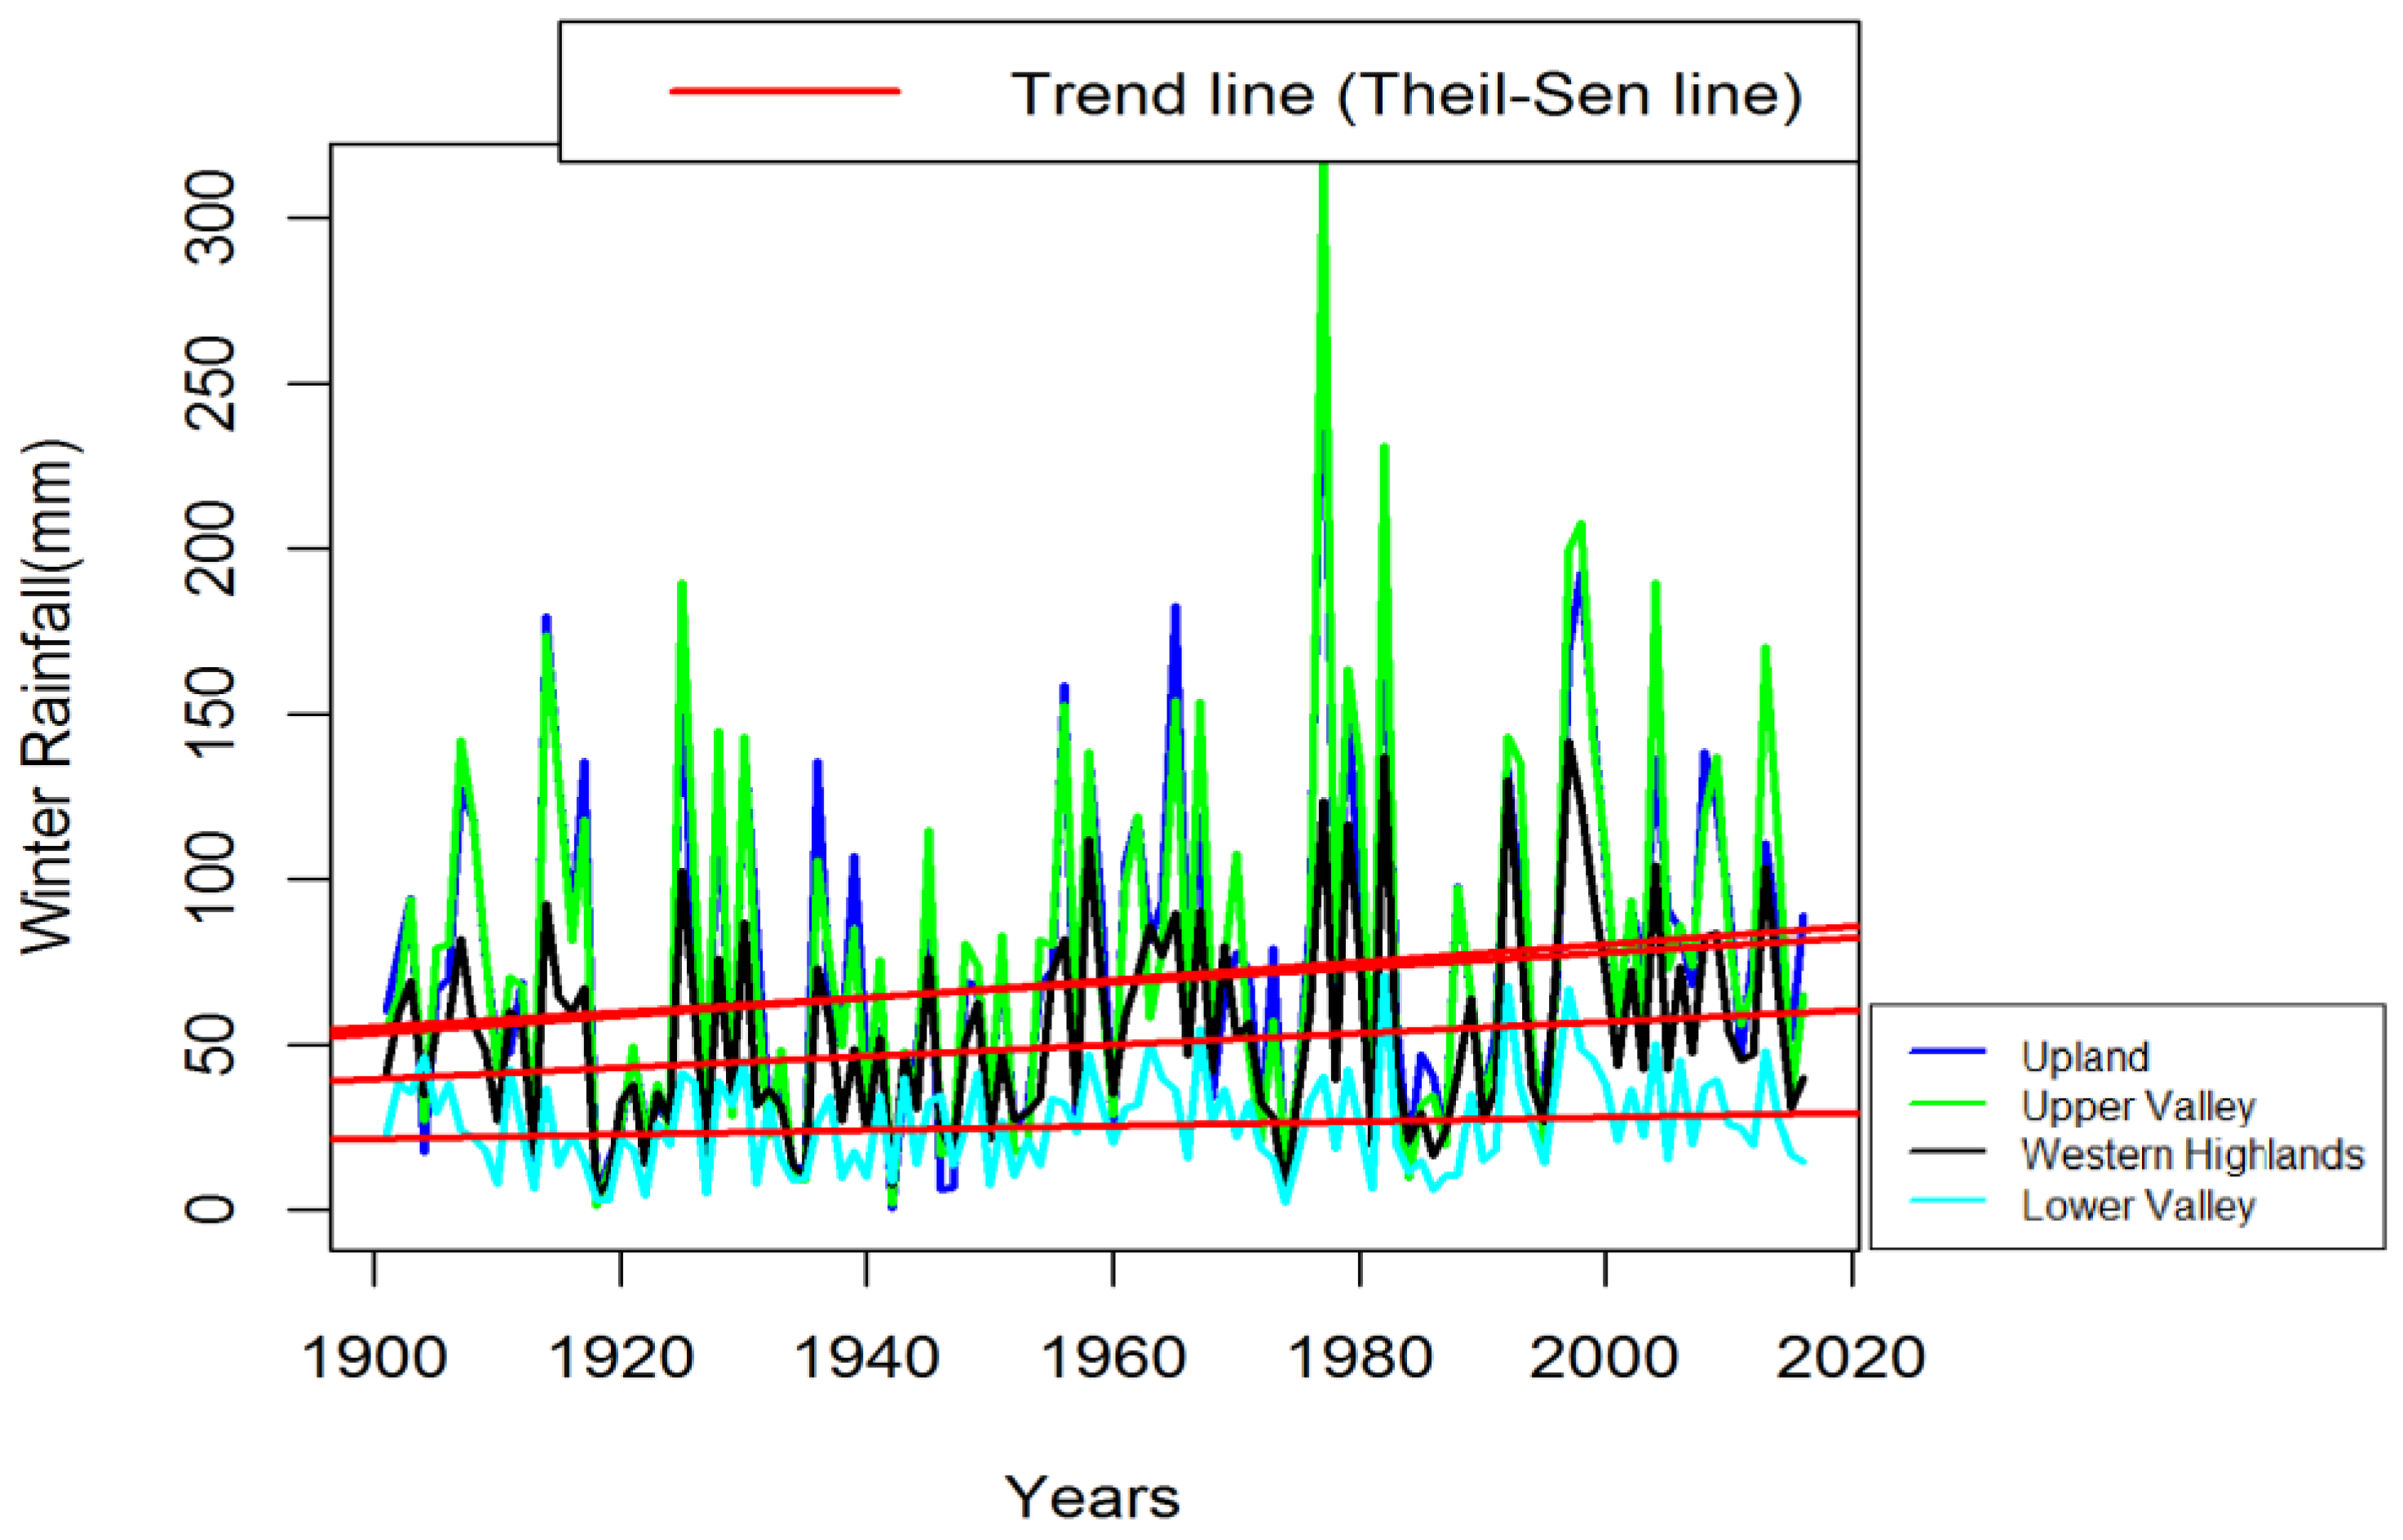
For the winter season, in all sub-basins, except in Upland, Western highlands, and Upper Valley, no significant trend was identified. Similarly, no significant trend was identified for the entire basin, whereas a significant increasing trend was identified at α = 0.05 in the Upland and Western highlands and at α = 0.1 in the Upper Valley (Table 6). Thus, the winter season rainfall in the Awash River Basin can generally be characterized by either increasing or no trend. As for the rate of change, the winter season rainfall rises by 1.2 mm per decade at the basin level and by a rate varying from 0.6 to 2.7 mm per decade across the sub-basins (Table 6). Figure 14 shows the plot for winter rainfall and trend line for time series, showing significant increasing trends.
4. Discussion
For annual rainfall, in agreement with the result, no significant trend was reported in a number of studies for the overall Awash River Basin or for some locations in the basin [1,14,15,17,18,19,31,54]. However, among the above studies, Bekele et al. [18] reported a decreasing trend over two locations in the basin as well. Furthermore, Marshall et al. [27] and Asfaw et al. [21] reported a decreasing trend in annual rainfall over some locations in the basin. On the other hand, Rosell [20] and Degefu and Bewket [23] reported an increasing trend in annual rainfall over several locations in the basin. Outside the Awash River Basin, Tesemma et al. [29] and Mengistu et al. [28] found no significant trend over parts of the Blue Nile River Basin, whereas Addisu et al. [38] found a declining trend in a majority of the locations but no trend in some locations within the Lake Tana Sub-basin. Wegesho et al. [31] reported a decreasing trend in annual rainfall over the northern, northwestern, and western parts of Ethiopia, but an increasing trend over some locations in eastern Ethiopia. Similarly, Teyso and Anjulo [16] reported both increasing and decreasing trends over different locations in the Gamo Gofa zone in south western Ethiopia.
For summer rainfall, the dominantly decreasing trends identified over the sub-basins agree with results of some publications. Wegesho et al. [31] found a significant decreasing trend (at α = 0.1) over most parts of the Awash River Basin over the period 1951–2000. Addisu et al. [38] identified different rates of change for monthly rainfall over the Tana sub-basin. The average of these rates in the summer season is negative, indicating a decreasing trend in the season. Bekele et al. [18] also reported a non-significant decreasing tendency in summer rainfall over locations such as Ginchi, Debrezeit, Dire Dawa, and Messio. However, results from a number of publications contradict both decreasing and no trends identified in this study. Contrary to the identified decreasing trend in this study, Seleshi and Zanke [14] found no significant trend in summer rainfall over a few stations (Addis Ababa, Dire Dawa, and Awash) for the period 1965–2002. Viste et al. [15] reported a decreasing trend for summer rainfall over large parts of the country, including the Awash River Basin. Similarly, Cheung et al. [1] and Wegesho et al. [31] also found no significant trend (α = 0.05) during the summer season for the entire Awash River Basin. Furthermore, no significant trends were identified by Urgessa [54] over three locations (Metahara, Gewane, and Asiyata) in the Awash River Basin, by Alemayehu and Bewket [17] in most of the grid points in the central highlands of Ethiopia, and by Bekele et al. [18] over 9 locations in the Awash River basin.
On the other hand, Mohammed et al. [19] over two locations (Dessie and Haik), Bekele et al. [18] over three locations (Addis Ababa, Koka, and Melkasa), and Rosell [20], over four locations (Majete, Combolcha, Dessie, and Hayik) within the Awash River Basin found significantly increasing trends in the summer rainfall. As for the rate of change, estimates by Asfaw et al. [21] and Viste et al. [15] are a bit higher than the upper limit for the estimated range in this study. Asfaw et al. [21] estimated a decline in summer season rainfall by 13.12 mm per decade for the Woleka sub-basin. Similarly, Viste et al. [15] reported a decline in summer season rainfall at a rate of 13 mm per decade over large parts of the country, including the Awash River Basin. On the other extreme, Asfaw et al. [21] estimated a very low declining rate of 1.93 mm per decade for the Woleka sub-basin.
For autumn rainfall, in agreement with the results, some research reported no significant trend over parts of the Awash River Basin. Seleshi and Zanke [14] reported no trend in autumn rainfall in the central parts of Ethiopia consisting of some parts of the upland catchment of the Awash River Basin. Cheung et al. [1] also found no significant trend in autumn rainfall in the entire Awash River basin, while Urgessa [54] found no trend in three locations (Metahara, Gewane, and Asiyata) in the Awash River Basin. Viste et al. [15] found that the autumn season rainfall shows no trend over large parts of the country, including the Awash River Basin. Similarly, Asfaw et al. [21] reported no trend in autumn season rainfall over some locations in the Woleka sub-basin. On the other hand, in agreement with an increasing trend in Eastern Catchment of the basin, Seleshi and Zanke [14] reported an increasing trend in autumn rainfall. Similarly, Cheung et al. [1] also identified an increasing tendency in the eastern catchment, though it was not statistically significant. Bekele et al. [18] also identified a significant increasing trend in the autumn rainfall at locations such as Dire Dawa in the Eastern catchment. However, in contradiction with the results, Liebmann et al. [55] reported a decreasing March-May rainfall in the Horn African region. Similarly, some local studies also reported a decreasing trend in autumn rainfall in the central highlands of Ethiopia and over the Woleka sub-basin [17,20,21].The estimated rate of change is relatively lower than estimates by some studies. Seleshi and Zanke [14] reported an increasing trend in autumn rainfall at Dire Dawa at a rate of 22 mm per decade. Asfaw et al. [21] estimated a decline in the autumn season rainfall at a rate of 15.03 mm per decade for the Woleka sub-basin. Viste et al. [15] reported a decline in the autumn season rainfall at a rate of 12 mm per decade over a large part of the country, including the Awash River Basin.
There are nearly no publications available dealing with trend analysis of the winter season rainfall for the study area. This might be because of low rainfall in the season. In agreement with results in the study, both increasing and no trend were reported in the available publications. Liebmann et al. [55] reported increasing October–December rainfall over the whole Horn of Africa region. Viste et al. [15], for large parts of the country, including the Awash River Basin and Mengistu et al. [28] for the Blue Nile River Basin, reported no trend for winter season rainfall.
As for the rate of change, the upper limit of the estimated range in this study is closer to the 3 mm per decade estimated by Viste et al. [15] for parts of the country receiving major rainfall in summer, including the Awash River Basin.
However, comparisons of the results of this study with previous studies have been difficult due to differences in sources of data (observed or gridded data), data record length, approach of analysis (point or areal scale), and methods of analysis (parametric, such as linear regression, or non-parametric, such as MK test, or Sen slope estimator), as well as difference in seasonal patterns, in the number of seasons, and the months constituting each season. Especially, the difference in temporal and spatial extent of analysis between this study and previous studies has made the comparisons uneasy. Most of the previous studies relevant to the basin are based on short-data records [1,15,18] and at point-scale or arbitrarily defined areas [14,17,18,19,20,31], while this study is based on long data record (1901 to 2016) and areal scale analysis of rainfall. Cheung et al. [1] have also explained contradictory results in most of the earlier studies due to difference in spatial extent in addition to poor and inconsistent data quality.
It is noted that in some of the sub-basins where significant decreasing summer rainfall has been identified, a significant increasing trend has also been identified in either autumn or winter rainfall. Thus, given no significant trend in annual rainfall over all sub basins and the entire basin, it can be inferred that the decrease in summer rainfall over some of the sub-basins could be compensated for by an increase by either autumn or winter rainfall. For instance, the decrease in summer rainfall over Upland could be compensated for by an increase in winter rainfall. Similarly, the decrease in summer rainfall over of the Upper Valley and Western Highlands could be compensated for by an increase in winter rainfall. Cheung et al. [1] have reported a similar shift in rainfall patterns. However, similar compensation effects between autumn and winter seasons has not been noticed. Overall, the results show that climate change has not induced statistically significant changes in annual rainfall in the basin over the period (1901–2016). However, the amount of seasonal rainfall has been significantly affected by the prevailing climate change over most parts of the basin. A shift in seasonal rainfall has also been noticed due to climate change.
5. Conclusions
The annual rainfall shows no significant change over the 116 years in all sub-basins and over the entire basin. However, trends of seasonal rainfall are different across study areas. The summer rainfall showed significant decreasing trends (α ≤ 0.1) over five sub-basins at rates varying from 4 to 7.4 mm per decade, but showed no trend over two sub-basins—the Lower Valley and Lower plain. The autumn rainfall showed no significant trends over four sub-basins but showed increasing trends over three sub-basins (Lower Valley, Lower plain, and Eastern Catchment) at a rate varying from 1.9 to 5 mm per decade. The winter rainfall showed no significant trends over four sub-basins but showed significant increasing trends over three sub-basins at a rate varying from 0.6 to 2.7 mm per decade. The rate of change is generally highest in summer rainfall, followed by autumn rainfall. The winter rainfall showed the least rate of change over the period (1901 to 2016). On the basin level, summer rainfall has shown significant decreasing trend (α = 0.05), while autumn and winter rainfall have showed no a significant trend.
Understanding the importance of summer rainfall as the main rainy season and the heavy dependence on rain-fed agriculture in Ethiopia and in the basin, the decreasing trend in summer rainfall may have meaningfully impacted the agricultural productivity in the basin.
It is noted that the decrease in summer rainfall over some sub- basins could be compensated for by an increase in either autumn or winter rainfall. However, a similar compensation effect between autumn and winter seasons has not been noticed. Overall, it is clear that climate change has been significantly affecting the trends and patterns of seasonal rainfall in the basin. The impacts of the changes in seasonal rainfall on agricultural and pastoral communities in the basin might need to be studied in detail.
All possible opportunities and challenges related to the prevailing trends, the rate of change, and shifts in seasonal rainfall need to be evaluated. However, at this point, it can be noted that the shift of summer rainfall to autumn or winter might have severe implications for agricultural areas that are receiving insufficient summer rainfall. On the other hand, the increasing autumn or winter rainfall might be considered supportive to livestock and crop production, both to the dry and wet regions. For instance, areas with long and severe dry seasons might get some relief due to the increasing winter rainfall. Overall, the annual rainfall has consistently shown no trend over the basin, indicating that the risk of droughts in the basin may be related to the seasonal distribution of rainfall. Therefore, it is recommended to expand water storage infrastructures, such as dams and reservoirs, and to improve management of water resources to prevent potential seasonal droughts owing to changing seasonal rainfall.
Author Contributions
Conceptualization, S.M. and C.F.; methodology, S.M. and C.F.; validation, C.F. and M.A.; formal analysis, S.M.; investigation, S.M.; resources, S.M. and C.F.; data curation, S.M.; writing—original draft preparation, S.M.; writing—review and editing, S.M., C.F, and M.A.; supervision, C,F. and M.A.; project administration, S.M., C.F and M.A.; funding acquisition, S.M.
Funding
This research received no external funding.
Acknowledgments
The authors would like to acknowledge the National Meteorological Agency of Ethiopia, and Climatic Research Unit (https://data.ceda.ac.uk) for providing climatic data and the Ministry of water resources of Ethiopia, World Bank Groups (https://datacatalog.worldbank.org/dataset/resource/) for providing GIS data, and The R Project for Statistical Computing (https://www.r-project.org) for providing free access of R software and its packages.
Conflicts of Interest
The authors declare no conflict of interest.
References
- Cheung, W.H.; Senay, G.B.; Singh, A. Trends and spatial distribution of annual and seasonal rainfall in Ethiopia. Int. J. Climatol. 2008, 28. [Google Scholar] [CrossRef]
- Awlachew, S.B. Irrigation Potential in Ethiopia; International Water Management Institute: Colombo, Sri Lanka, 2010; p. 60. [Google Scholar]
- Kerim, T.; Abebe, A.; Hussen, B. Study of Water Allocation for Existing and Future Demands under Changing Climate Condition: Case of Upper Awash Sub River Basin. J. Environ. Earth Sci. 2016, 6, 14. [Google Scholar]
- Edossa, D.C.; Babel, M.S.; Das Gupta, A. Drought Analysis in the Awash River Basin, Ethiopia. Water Resour. Manag. 2010, 24, 1441–1460. [Google Scholar] [CrossRef]
- Vivid Economics. Water Resources and Extreme Events in the Awash Basin: Economic Effects and Policy Implications—Vivid Economics—Putting Economics to Good Use; Vivid Economics: London, UK, 2016. [Google Scholar]
- Adeba, D.; Kansal, M.L.; Sen, S. Assessment of water scarcity and its impacts on sustainable development in Awash basin, Ethiopia. Sustain. Water Resour. Manag. 2015, 1, 71–87. [Google Scholar] [CrossRef] [Green Version]
- IPCC. Climate Change 2007: Synthesis Report. Contribution of Working Groups I, II and III to the Fourth Assessment Report of the Intergovernmental Panel on Climate Change; Pachauri, R.K., Reisinger, A., Eds.; IPCC: Geneva, Switzerland, 2007. [Google Scholar]
- Bates, B.; Kundzewicz, Z.W. Climate Change and Water; IPCC Technical Paper; IPCC: Geneva, Switzerland, 2008; Volume 6, ISBN 978-92-9169-123-4. [Google Scholar]
- IPCC. Climate Change 2014: Synthesis Report. Contribution of Working Groups I, II and III to the Fifth Assessment Report of the Intergovernmental Panel on Climate Change; Pachauri, R.K., Meyer, L.A., Eds.; IPCC: Geneva, Switzerland, 2014. [Google Scholar]
- IPCC. Climate Change 2007: The Physical Science Basis. Contribution of Working Group I to the Fourth Assessment Report of the Intergovernmental Panel on Climate Change; Solomon, S., Qin, D., Manning, M., Chen, Z., Marquis, M., Averyt, K.B., Tignor, M., Miller, H.L., Eds.; Cambridge University Press: Cambridge, UK, 2007. [Google Scholar]
- Kennedy, C. Does “Global Warming” Mean It’s Warming Everywhere? Available online: https://www.climate.gov/news-features/climate-qa/does-global-warming-mean-it%E2%80%99s-warming-everywhere (accessed on 28 March 2019).
- Basistha, A.; Arya, D.S.; Goel, N.K. Analysis of historical changes in rainfall in the Indian Himalayas. Int. J. Climatol. 2009, 29, 555–572. [Google Scholar] [CrossRef]
- Tadege, A. Climate Change National Adaptation Programme of Action (NAPA) of Ethiopia; National Meteorological Services Agency, Ministry of Water Resources, Federal Democratic Republic of Ethiopia: Addis, Ababa, 2007; p. 96.
- Seleshi, Y.; Zanke, U. Recent changes in rainfall and rainy days in Ethiopia. Int. J. Climatol. 2004, 24, 973–983. [Google Scholar] [CrossRef]
- Viste, E.; Korecha, D.; Sorteberg, A. Recent drought and precipitation tendencies in Ethiopia. Theor. Appl. Climatol. 2013, 112, 535–551. [Google Scholar] [CrossRef]
- Teyso, T.; Anjulo, A. Spatio-temporal Variability and Trends of Rainfall and Temperature over Gamo Gofa Zone, Ethiopia. J. Sci. Res. Rep. 2016, 12, 1–11. [Google Scholar] [CrossRef]
- Alemayehu, A.; Bewket, W. Local spatiotemporal variability and trends in rainfall and temperature in the central highlands of Ethiopia. Geogr. Ann. Ser. A Phys. Geogr. 2017, 99, 85–101. [Google Scholar] [CrossRef]
- Bekele, D.; Alamirew, T.; Kebede, A.; Zeleke, G.; Melese, A.M. Analysis of rainfall trend and variability for agricultural water management in Awash River Basin, Ethiopia. J. Water Clim. Chang. 2017, 8, 127–141. [Google Scholar] [CrossRef]
- Mohammed, Y. Variability and trends of rainfall extreme events in north east highlands of Ethiopia. Int. J. Hydrol. 2018, 2, 594–605. [Google Scholar]
- Rosell, S. Regional perspective on rainfall change and variability in the central highlands of Ethiopia, 1978–2007. Appl. Geogr. 2011, 31, 329–338. [Google Scholar] [CrossRef]
- Asfaw, A.; Simane, B.; Hassen, A.; Bantider, A. Variability and time series trend analysis of rainfall and temperature in northcentral Ethiopia: A case study in Woleka sub-basin. Weather Clim. Extrem. 2018, 19, 29–41. [Google Scholar] [CrossRef]
- Chebana, F.; Ouarda, T.B.M.J.; Duong, T.C. Testing for multivariate trends in hydrologic frequency analysis. J. Hydrol. 2013, 486, 519–530. [Google Scholar] [CrossRef]
- Degefu, M.A.; Bewket, W. Variability and trends in rainfall amount and extreme event indices in the Omo-Ghibe River Basin, Ethiopia. Reg. Environ. Chang. 2014, 14, 799–810. [Google Scholar] [CrossRef]
- He, M.; Gautam, M. Variability and Trends in Precipitation, Temperature and Drought Indices in the State of California. Hydrology 2016, 3, 14. [Google Scholar] [CrossRef]
- Collins, J.M. Temperature Variability over Africa. J. Clim. 2011, 24, 3649–3666. [Google Scholar] [CrossRef] [Green Version]
- Jury, M.R.; Funk, C. Climatic trends over Ethiopia: Regional signals and drivers. Int. J. Climatol. 2013, 33, 1924–1935. [Google Scholar] [CrossRef]
- Marshall, M.; Funk, C.; Michaelsen, J. Examining evapotranspiration trends in Africa. Clim. Dyn. 2012, 38, 1849–1865. [Google Scholar] [CrossRef]
- Mengistu, D.; Bewket, W.; Lal, R. Recent spatiotemporal temperature and rainfall variability and trends over the Upper Blue Nile River Basin, Ethiopia. Int. J. Climatol. 2013, 34, 2278–2292. [Google Scholar] [CrossRef]
- Tesemma, Z.K.; Mohamed, Y.A.; Steenhuis, T.S. Trends in Rainfall and Runoff in the Blue Nile Basin: 1964–2003. Available online: https://onlinelibrary.wiley.com/doi/abs/10.1002/hyp.7893 (accessed on 5 March 2019).
- Ye, L.; Zhou, J.; Zeng, X.; Tayyab, M. Hydrological Mann-Kendal Multivariate Trends Analysis in the Upper Yangtze River Basin. J. Geosci. Environ. Prot. 2015, 3, 34–39. [Google Scholar] [CrossRef]
- Wagesho, N.; Goel, N.K.; Jain, M.K. Temporal and spatial variability of annual and seasonal rainfall over Ethiopia. Hydrol. Sci. J. 2013, 58, 354–373. [Google Scholar] [CrossRef]
- Rao, P.; Solomon, A. Trend analysis and adaptation strategies of climate change in north central Ethiopia. Int. J. Agric. Sci. Res. 2013, 3, 253–262. [Google Scholar]
- KHalili, K.; Ahmadi, F.; Dinpashoh, Y.; Fard, A.F. Determination of Climate Changes on Streamflow Process in the West of Lake Urmia with Used to Trend and Stationarity Analysis. Int. J. Adv. Biol. Biomed. Res. 2013, 1, 1220–1235. [Google Scholar]
- Mellander, P.-E.; Gebrehiwot, S.G.; Gärdenäs, A.I.; Bewket, W.; Bishop, K. Summer Rains and Dry Seasons in the Upper Blue Nile Basin: The Predictability of Half a Century of Past and Future Spatiotemporal Patterns. PLoS ONE 2013, 8, e68461. [Google Scholar] [CrossRef]
- Awulachew, S.B.; Yilma, A.D.; Loulseged, M.; Ayana, M.; Alamirew, T. Water Resources and Irrigation Development in Ethiopia; International Water Management Institute: Colombo, Sri Lanka, 2007; ISBN 978-92-9090-680-3. [Google Scholar]
- Dost, R.; Obando, E.B.; Bastiaanssen, W.; Hoogeveen, J. Coping with Water Scarcity—Developing National Water Audits Africa; Water Watch: Addis Ababa, Ethiopia, 2013; p. 56. [Google Scholar]
- Karimi, P.; Bastiaanssen, W.G.M.; Sood, A.; Hoogeveen, J.; Peiser, L.; Bastidas-Obando, E.; Dost, R.J. Spatial evapotranspiration, rainfall and land use data in water accounting—Part 2: Reliability of water acounting results for policy decisions in the Awash Basin. Hydrol. Earth Syst. Sci. 2015, 19, 533–550. [Google Scholar] [CrossRef]
- Addisu, S.; Selassie, Y.G.; Fissha, G.; Gedif, B. Time series trend analysis of temperature and rainfall in lake Tana Sub-basin, Ethiopia. Environ. Syst. Res. 2015, 4, 25. [Google Scholar] [CrossRef] [Green Version]
- Pingale, S.M.; Khare, D.; Jat, M.K.; Adamowski, J. Trend analysis of climatic variables in an arid and semi-arid region of the Ajmer District, Rajasthan, India. J. Water Land Dev. 2016, 28, 3–18. [Google Scholar] [CrossRef] [Green Version]
- Steffen, M. CRAN-Package imputeTS. R J. 2019, 1, 207–218. [Google Scholar]
- National Meteorological Agency National Meteorology Agency: Other Forecasts. Available online: http://www.ethiomet.gov.et/other_forecasts/seasonal_forecast (accessed on 3 March 2019).
- Seleshi, Y.; Camberlin, P. Recent changes in dry spell and extreme rainfall events in Ethiopia. Theor. Appl. Climatol. 2006, 83, 181–191. [Google Scholar] [CrossRef]
- Walker, B. Seasonal Weather Assessment for Ethiopia during March–July 2016—Ethiopia; Met office: Exeter, UK, 2016. [Google Scholar]
- Pohlert, T. Trend: Non-Parametric Trend Tests and Change-Point Detection 2018; The R Project for Statistical Computing: Vienna, Austria, 2018. [Google Scholar]
- Abeysingha, N.S.; Singh, M.; Sehgal, V.K.; Khanna, M.; Pathak, H. Analysis of trends in streamflow and its linkages with rainfall and anthropogenic factors in Gomti River basin of North India. Theor. Appl. Climatol. 2016, 123, 785–799. [Google Scholar] [CrossRef]
- Blain, G.C. The modified Mann-Kendall test: On the performance of three variance correction approaches. Bragantia 2013, 72, 416–425. [Google Scholar] [CrossRef]
- Patakamuri, S.K.; O’Brien, N. Modifiedmk: Modified Versions of Mann Kendall and Spearman’s Rho Trend Tests 2019; The R Project for Statistical Computing: Vienna, Austria, 2019. [Google Scholar]
- Khaliq, M.N.; Ouarda, T.B.M.J.; Gachon, P.; Sushama, L.; St-Hilaire, A. Identification of hydrological trends in the presence of serial and cross correlations: A review of selected methods and their application to annual flow regimes of Canadian rivers. J. Hydrol. 2009, 368, 117–130. [Google Scholar] [CrossRef]
- Hamed, K.H. Exact distribution of the Mann–Kendall trend test statistic for persistent data. J. Hydrol. 2009, 365, 86–94. [Google Scholar] [CrossRef]
- Dinku, T.; Connor, S.J.; Ceccato, P.; Ropelewski, C.F. Comparison of global gridded precipitation products over a mountainous region of Africa. Int. J. Climatol. 2008, 28, 1627–1638. [Google Scholar] [CrossRef]
- Ahmed, K.; Shahid, S.; Wang, X.; Nawaz, N.; Khan, N. Evaluation of Gridded Precipitation Datasets over Arid Regions of Pakistan. Water 2019, 11, 210. [Google Scholar] [CrossRef]
- Nashwan, M.S.; Shahid, S.; Wang, X. Uncertainty in Estimated Trends Using Gridded Rainfall Data: A Case Study of Bangladesh. Water 2019, 11, 349. [Google Scholar] [CrossRef]
- Tozer, C.R.; Kiem, A.S.; Verdon-Kidd, D.C. On the uncertainties associated with using gridded rainfall data as a proxy for observed. Hydrol. Earth Syst. Sci. 2012, 16, 1481–1499. [Google Scholar] [CrossRef] [Green Version]
- Urgessa, G. Spatial and Temporal Uncertainty of Rainfall in Arid and Semi-Arid Areas of Ethiopia. Sci. Technol. Arts Res. J. 2014, 2, 106–113. [Google Scholar] [CrossRef]
- Liebmann, B.; Hoerling, M.P.; Funk, C.; Bladé, I.; Dole, R.M.; Allured, D.; Quan, X.; Pegion, P.; Eischeid, J.K. Understanding Recent Eastern Horn of Africa Rainfall Variability and Change. J. Clim. 2014, 27, 8630–8645. [Google Scholar] [CrossRef]
Figure 1.
Major River Basins in Ethiopia and, more specifically, the Awash River Basin.

Figure 2.
Sub-basins and main streams of the Awash River Basin.

Figure 3.
Data points on the 0.5° by 0.5° grid (Renamed after nearby cities or serial number, SN).

Figure 4.
The scatter plots of observed versus CRU precipitation at two selected gauge stations: (a) Addis Ababa, and (b) Adama.
Figure 4.
The scatter plots of observed versus CRU precipitation at two selected gauge stations: (a) Addis Ababa, and (b) Adama.

Figure 5.
Box plot showing the variability of annual rainfall over the study areas for the period 1900–2016.
Figure 5.
Box plot showing the variability of annual rainfall over the study areas for the period 1900–2016.

Figure 6.
The ACF plots for annual (a) and seasonal rainfall (b–d) time series for the entire basin.
Figure 6.
The ACF plots for annual (a) and seasonal rainfall (b–d) time series for the entire basin.

Figure 7.
Annual rainfall time series for the sub-basins for the period 1900–2016.

Figure 8.
Annual and seasonal rainfall time series for the entire basin for the period 1900–2016.

Figure 9.
Box plot showing the variability of summer rainfall over the study areas for the period 1900–2016.
Figure 9.
Box plot showing the variability of summer rainfall over the study areas for the period 1900–2016.

Figure 10.
Summer rainfall time series showing significant decreasing trends for the period 1900–2016.
Figure 10.
Summer rainfall time series showing significant decreasing trends for the period 1900–2016.

Figure 11.
Box plot showing the variability of autumn rainfall over the study areas for the period 1900–2016.
Figure 11.
Box plot showing the variability of autumn rainfall over the study areas for the period 1900–2016.

Figure 12.
Autumn rainfall time series showing significant increasing trends for the period 1900–2016.
Figure 12.
Autumn rainfall time series showing significant increasing trends for the period 1900–2016.

Figure 13.
Box plot showing the variability of winter rainfall over the study areas for the period 1900–2016.
Figure 13.
Box plot showing the variability of winter rainfall over the study areas for the period 1900–2016.

Figure 14.
Winter rainfall time series showing significant increasing trends for the period 1900–2016.
Figure 14.
Winter rainfall time series showing significant increasing trends for the period 1900–2016.


Table 1.
Selected gauge stations and estimated percentage missing data.
| SN | Gauge Station | Latitude (N) | Longitude (E) | Data Period | % Missing Data |
|---|---|---|---|---|---|
| 1 | Addis Ababa | 9.0 | 38.5 | 1960–2015 | 2.6 |
| 2 | Debre Zeit | 10.4 | 38.9 | 1960–2013 | 13.1 |
| 3 | Dire Dawa | 9.6 | 41.9 | 1960–2015 | 2.1 |
| 4 | Mehal Meda | 10.2 | 39.7 | 1974–2015 | 13.1 |
| 5 | Melkasa | 8.4 | 39.3 | 1977–2013 | 0.67 |
| 6 | Metahara | 8.9 | 39.9 | 1994–2015 | 7.2 |
| 7 | Mezezo | 10.0 | 40.0 | 1986–2015 | 16.4 |
| 8 | Adama | 8.6 | 39.3 | 1980–2015 | 14.3 |
| 9 | Shola Gebeya | 9.2 | 39.4 | 2006–2015 | 4.1 |
Table 2.
Performance of CRU dataset over the gauge stations.
| SN | Gauge Stations | Pearson Correlation Coefficient | Kolmogorov-Smirnov Test Statistics | D Critical (Dc) | RMSE |
|---|---|---|---|---|---|
| 1. | Adama (1960–2015) | 0.733 | Dn = 0.151, p-value = 1.186 × 10⁻⁶ | 0.076 | 62.842 |
| 2. | Addis Ababa (1960–2015) | 0.935 | Dn = 0.137, p-value = 7.958 × 10⁻⁶ | 0.074 | 49.049 |
| 3. | Dire Dawa (1960–2015) | 0.871 | Dn = 0.147, p-value = 9.587 × 10⁻⁷ | 0.074 | 27.844 |
| 4. | Bishoftu (1960–2015) | 0.804 | Dn = 0.211, p-value = 2.078 × 10⁻¹² | 0.077 | 67.901 |
| 5. | Melkasa (1960–2015) | 0.864 | Dn = 0.128, p-value = 3.172 × 10⁻⁴ | 0.083 | 41.432 |
| 6. | Metahara (1960–2015) | 0.791 | Dn = 0.166, p-value = 4.516 × 10⁻⁶ | 0.089 | 39.466 |
| 7. | Mehal Meda (1960–2015) | 0.814 | Dn = 0.218, p-value = 1.399 × 10⁻¹¹ | 0.083 | 68.669 |
| 8. | Mezezo (1960–2015) | 0.824 | Dn = 0.124, p-value = 3.13 × 10⁻³ | 0.094 | 97.660 |
| 9. | Shola Gebeya (1960–2015) | 0.895 | Dn = 0.209, p-value = 3.238 × 10⁻⁴ | 0.136 | 56.124 |
Key: Dn is test statistic computed at a probability level of p.
Table 3.
Summary trend analysis for annual rainfall time series.
| Sub/Basin | Z | Two Tail p-Value | Trend (α = 0.05) | Sen Slope (mm/year) |
|---|---|---|---|---|
| Upland | −0.7 | 0.50 | No trend | −0.2679 |
| Upper Valley | 0.3 | 0.75 | No trend | 0.1420 |
| Western Highlands | 0.0 | 1.00 | No trend | 9 × 10⁻⁴ |
| Middle Valley | −0.1 | 0.93 | No trend | −0.0307 |
| Lower Valley | 0.9 | 0.37 | No trend | 0.2101 |
| Lower Plain | 0.5 | 0.59 | No trend | 0.1638 |
| Eastern Catchment | 0.5 | 0.65 | No trend | 0.1678 |
| Basin average | 0.0 | 0.99 | No trend | −7.00 × 10⁻⁴ |
Table 4.
Summary trend analysis for summer rainfall.
| Sub/Basin | Z | Two Tail p-Value | Trend (α = 0.05) | Sen Slope (mm/year) |
|---|---|---|---|---|
| Upland | −2.2 | 0.03 | Decreasing | −0.74 |
| Upper Valley | −1.9 | 0.06 | Decreasing | −0.48 |
| Western Highlands | −1.6 | 0.11 | No trend | −0.40 |
| Middle Valley | −1.9 | 0.05 | Decreasing | −0.41 |
| Lower Valley | −0.6 | 0.57 | No trend | −0.10 |
| Lower Plain | −0.7 | 0.47 | No trend | −0.16 |
| Eastern Catchment | −1.7 | 0.08 | No trend | −0.44 |
| Basin average | −2 | 0.05 | Decreasing | −0.46 |
Table 5.
Summary trend analysis for autumn season rainfall.
| Sub/Basin | Z | Two Tail p-Value | Trend (α = 0.05) | Sen Slope (mm/year) |
|---|---|---|---|---|
| Upland | 0 | 0.99 | No trend | 0.00 |
| Upper Valley | 0.3 | 0.75 | No trend | 0.11 |
| Western Highlands | 0.6 | 0.54 | No trend | 0.10 |
| Middle Valley | 1.1 | 0.28 | No trend | 0.19 |
| Lower Valley | 1.7 | 0.09 | No trend | 0.20 |
| Lower Plain | 2.1 | 0.03 | Increasing | 0.27 |
| Eastern Catchment | 2.3 | 0.02 | Increasing | 0.50 |
| Basin average | 1.1 | 0.26 | No trend | 0.21 |
Table 6.
Summary trend analysis for winter rainfall.
| Sub/Basin | Z | Two Tail p-Value | Trend (α = 0.05) | Sen Slope (mm/year) |
|---|---|---|---|---|
| Upland | 2.2 | 0.03 | Increasing | 0.27 |
| Upper Valley | 1.7 | 0.09 | No trend | 0.22 |
| Western Highlands | 2.1 | 0.04 | Increasing | 0.17 |
| Middle Valley | 1.4 | 0.18 | No trend | 0.10 |
| Lower Valley | 1.6 | 0.12 | No trend | 0.06 |
| Lower Plain | 0.9 | 0.35 | No trend | 0.06 |
| Eastern Catchment | 0.8 | 0.41 | No trend | 0.08 |
| Basin average | 1.5 | 0.12 | No trend | 0.12 |
© 2019 by the authors. Licensee MDPI, Basel, Switzerland. This article is an open access article distributed under the terms and conditions of the Creative Commons Attribution (CC BY) license (http://creativecommons.org/licenses/by/4.0/).
Share and Cite
MDPI and ACS Style
Mulugeta, S.; Fedler, C.; Ayana, M. Analysis of Long-Term Trends of Annual and Seasonal Rainfall in the Awash River Basin, Ethiopia. Water 2019, 11, 1498. https://doi.org/10.3390/w11071498
AMA Style
Mulugeta S, Fedler C, Ayana M. Analysis of Long-Term Trends of Annual and Seasonal Rainfall in the Awash River Basin, Ethiopia. Water. 2019; 11(7):1498. https://doi.org/10.3390/w11071498
Chicago/Turabian StyleMulugeta, Solomon, Clifford Fedler, and Mekonen Ayana. 2019. "Analysis of Long-Term Trends of Annual and Seasonal Rainfall in the Awash River Basin, Ethiopia" Water 11, no. 7: 1498. https://doi.org/10.3390/w11071498
Note that from the first issue of 2016, this journal uses article numbers instead of page numbers. See further details here.