Assessing the Influence of Environmental Factors on Groundwater Antibiotic Occurrence by Means of Variation Partitioning


1
Geocamb/GAiA—Departament de Ciències Ambientals, Universitat de Girona, 17003 Girona, Spain
2
Institut Català de Recerca de l’Aigua, c/Emili Grahit, 101, 17003 Girona, Spain
*
Author to whom correspondence should be addressed.
Water 2019, 11(7), 1495; https://doi.org/10.3390/w11071495
Submission received: 6 June 2019
/
Revised: 12 July 2019
/
Accepted: 13 July 2019
/
Published: 18 July 2019
(This article belongs to the Special Issue Pharmaceutic Compounds, as Emerging Organic Contaminants, and Their Occurrence and Transport in Groundwater: Sources, Reactions and Fate)
Abstract
:The spatial distribution of antibiotics in alluvial aquifers presents a large variability caused by the joint action of several factors including hydrology, land use, and groundwater properties. In this study, the influences of these factors on the spatial variability of antibiotics is evaluated based on an extensive database of 47 wells located in the Baix Fluvià alluvial aquifer (NE Catalonia). Statistical methods such as redundancy and variation partitioning (VP) analyses, which are not commonly used in hydrogeological studies, are herein tested and used to estimate the effects of environmental factors on the observed antibiotic occurrence. Using VP, the total explained variation of the antibiotic distribution only reaches 18% of the total variability, meaning that the whole set of explanatory parameters is insufficient or inadequate to describe the occurrence of antibiotics and their concentration. The results point out that groundwater properties are the most representative parameters, while those related to antibiotic sources and aquifer susceptibility have lower influences. Omitting solute transport parameters that actually govern antibiotic fate (i.e., sorption coefficients and degradation rates) from the statistical analysis limited the success of the VP results. VP thus highlights the importance of researching antibiotic transport in groundwater by determining the reactive properties of these pollutants above other hydrogeochemical variables. We conclude that the present capacity to predict antibiotic existence at a specific location—for instance, a supply well—based on field data is still poor and unrepresentative, being an impediment for groundwater pollution management.
1. Introduction
The occurrence and distribution of contaminants of emerging concern (CECs) at a regional scale presents a large spatial variability attributed to the joint action of several factors, including hydrology and land use as well as transport processes occurring in the soil zone and later in the aquifer [1,2,3,4,5]. Among them, antibiotics stand as contaminants of major concern due to their impact on the environment and human health [6], including the presence of antibiotic resistance genes in the groundwater microbiome [7,8]. Antibiotics are related to the urban water cycle as well as to fertilization practices using husbandry slurry and manure, and they are usually present in alluvial aquifers (e.g., reference [9]). Their main input sources are stream recharge, which carries the pollutant load from wastewater treatment plants, and direct infiltration from rainfall, which leachates veterinary pharmaceuticals associated with organic fertilizers. As aquifers are a frequent supply source for urban water demand, these pollutants are introduced back into the urban water cycle with an associated risk of containing unacceptable concentrations of CECs. Yet, some of them remain unregulated and, therefore, are somehow unattended to by water authorities. Thus, watch-lists are being issued as guidance to address this issue and prevent human health impacts [10]. Groundwater quality management needs to be acquainted with the main factors that govern the entrance and migration of CECs into the aquifer, so exposure to pollution hazard—given by the pollutant concentration at any point and time [11,12]—can be inferred. To date, few comprehensive regional scale studies of CEC occurrence have investigated the causes of their distribution in groundwater. Consequently, researchers and managers still lack a broad perspective to propose effective (in effort and cost) monitoring strategies to assess this type of pollution.
Among CECs, antibiotics represent a particular threat to human health and to the environment. As with most of emerging pollutants, their fate along subsurface pathways is controlled by complex geochemical reactive processes, which, when added to the inherent heterogeneity of aquifers, make it difficult to simulate their transport and, therefore, predict their occurrence within the aquifer system [1,2]. In this context, the use of integrated statistical approaches is suitable to set the overall features of such cases of pollution and ascertain the main factors that govern their transport.
In particular, variation partitioning (VP) was introduced by Borcard [13] and is growing in popularity for ecological analysis and modeling. The method attempts to “partition” or resolve the explanatory power of different explanatory matrices in relation to the same response matrix. A previously described use of redundancy analysis (RDA) determines the partial, linear effect of each explanatory matrix on the response data, which permits the most significate variables to be selected and considered in VP. Yet, in ecological research, VP has seldom been used in hydrogeological studies to date.
A regional study of antibiotic distribution in the Baix Fluvià alluvial aquifer (NE Catalonia, [4]) presented a database of 47 sampling points using existing private wells in an area of nearly 54 km2. This study pointed out the spatial variability of antibiotics using geostatistics, yet the relevance of the potential environmental factors in the overall variability was not investigated. Hence, this dataset, which includes a wide range of variables, as described below, permits the statistical analysis of the hydrological factors that contribute to antibiotic distribution in groundwater. Using variation partitioning, a novelty in hydrogeological studies, our objective is to estimate the weight of each of these environmental factors in the overall variability of antibiotic occurrence as a means of adequately focusing on monitoring and management practices.
Study Area and Case Description
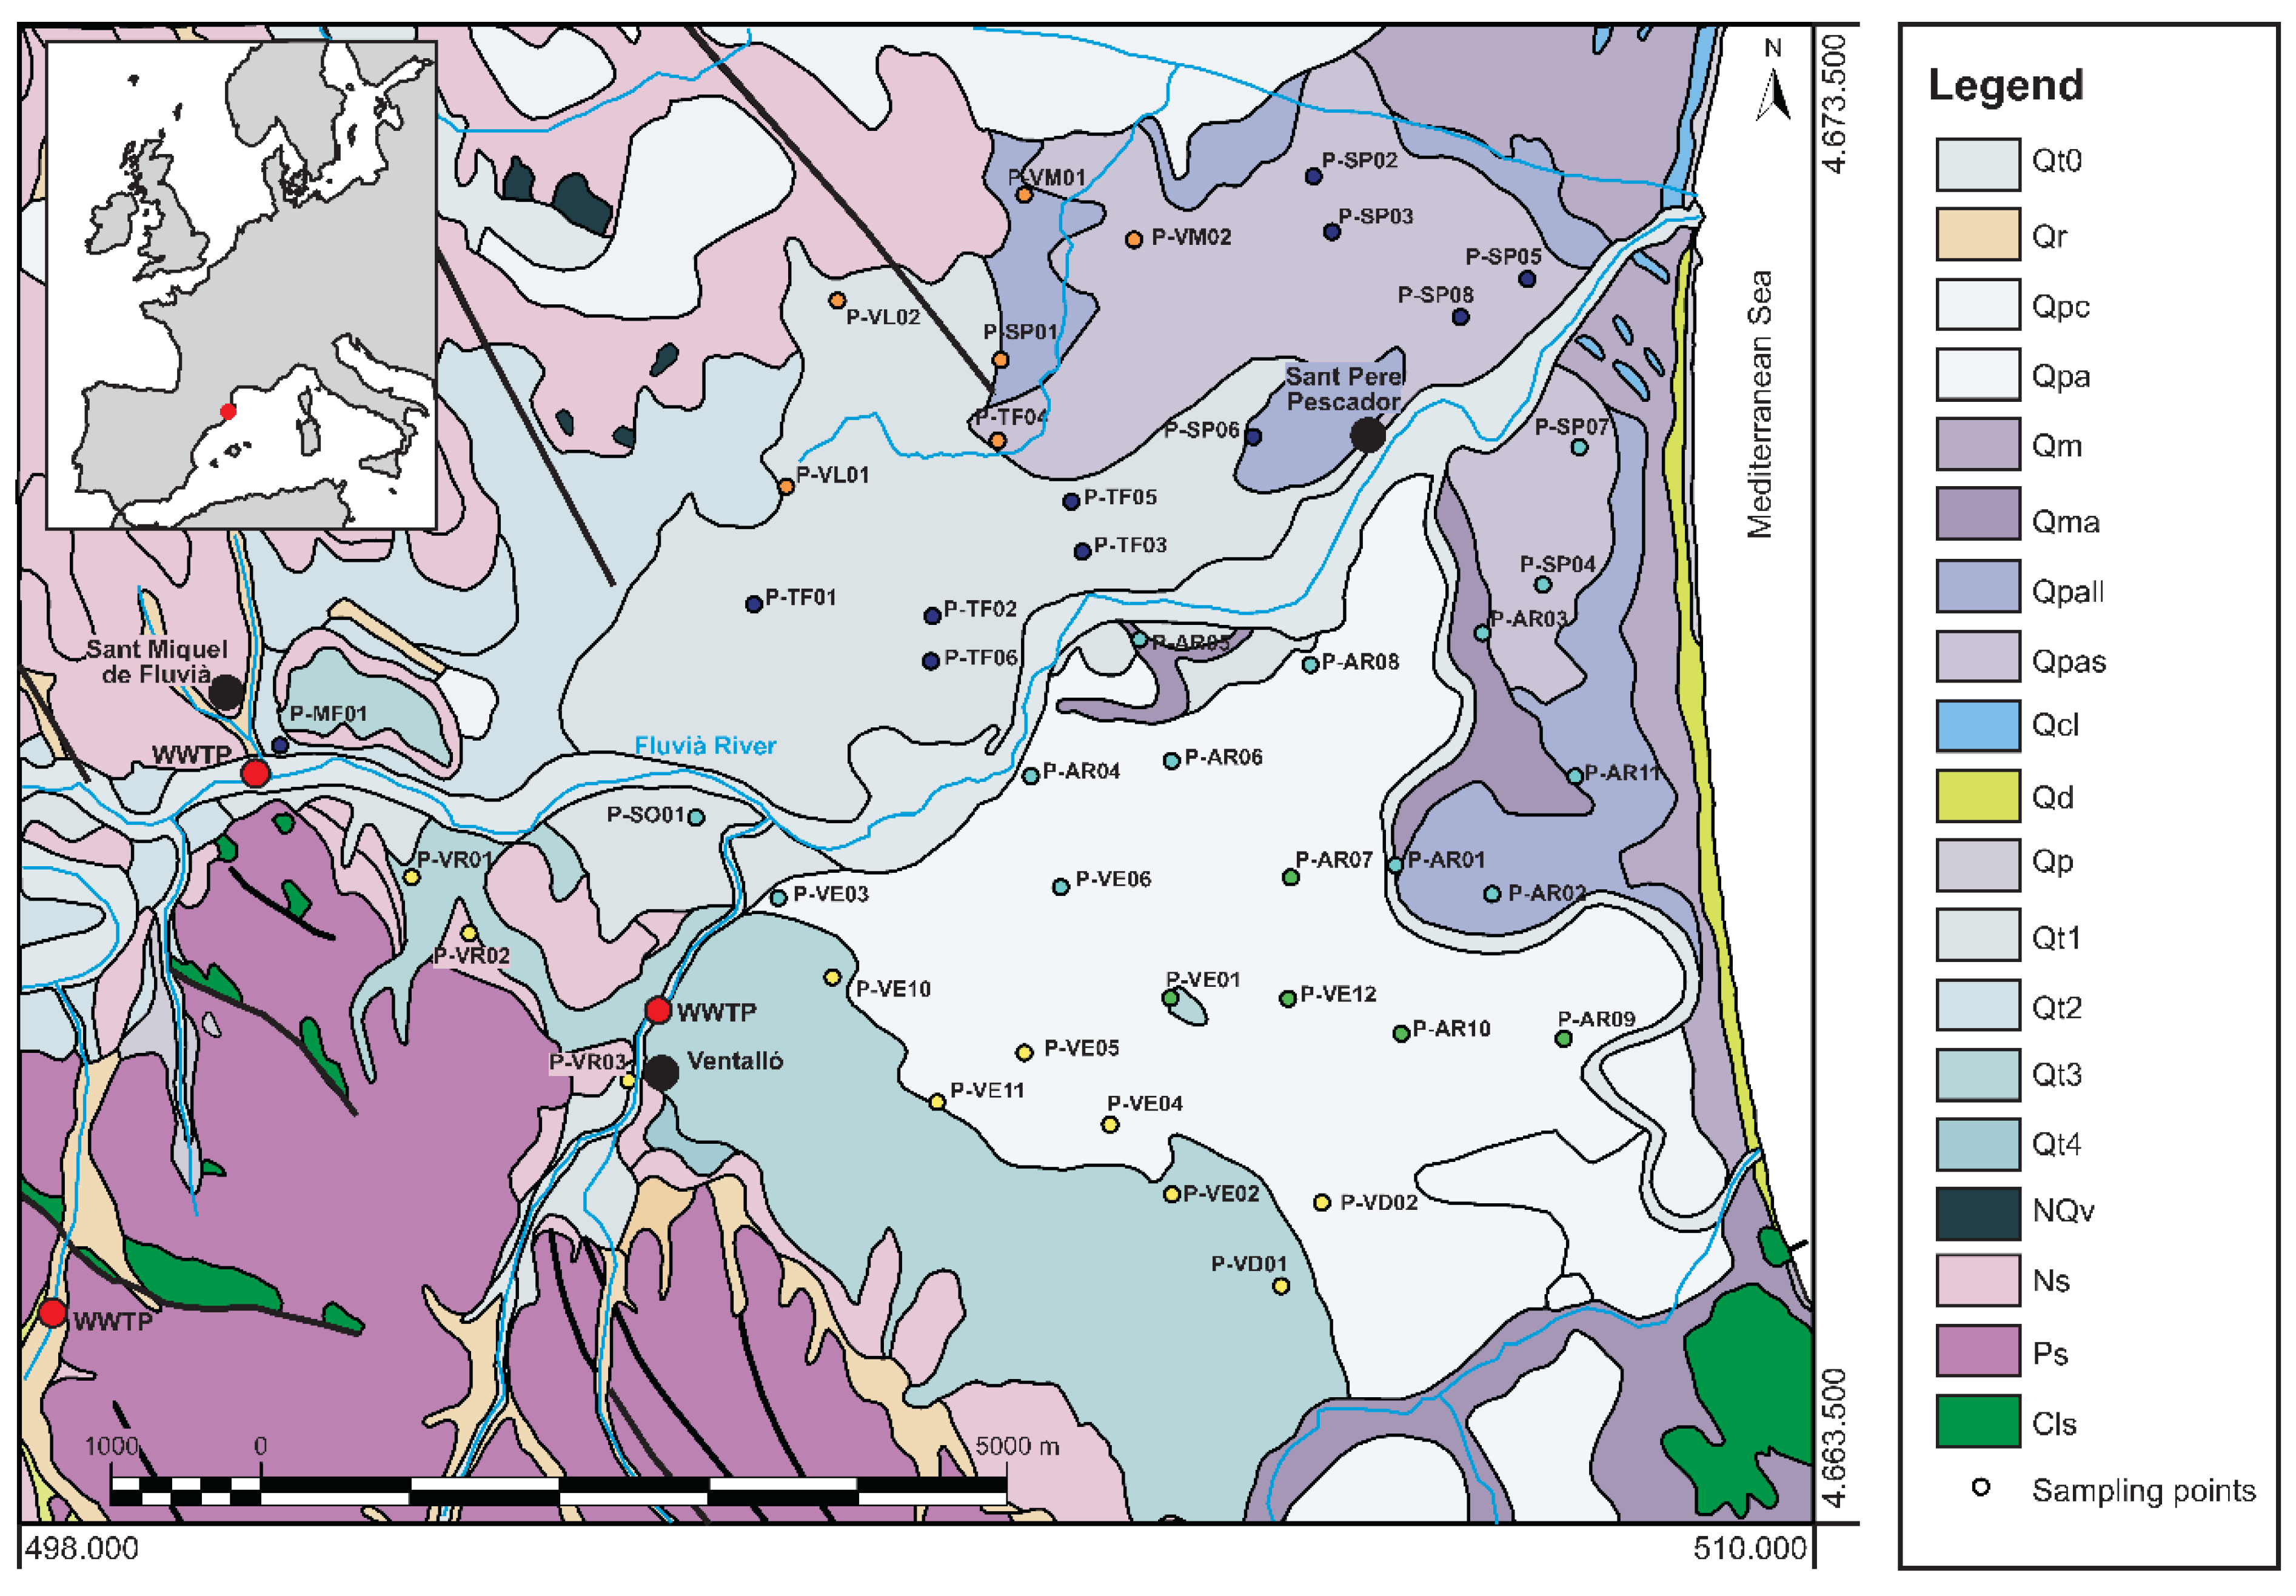
The Baix Fluvià alluvial aquifer (NE Catalonia) is located in the upper layer of the Quaternary Fluvià River fluvio-deltaic plain, measuring 12–18 m thick. It consists of gravel and sand, which is gradually replaced by sand and silt layers towards the Mediterranean coast [14] (Figure 1). The mean annual rainfall in Sant Pere Pescador is 566 mm (2007–2015). The Fluvià River drains a basin of 1125 km2 flowing into the Mediterranean Sea, and its average discharge is of 3.7 ± 0.2 m3/s in the study area [15]. Irrigation rates, estimated at 4.9 hm3/year, stand as the main use of water resources, since the dominant land use is agricultural; while minor volumes are devoted to urban supply for 6120 inhabitants. Up to 61.3% (3212 ha) of the agricultural land (5239 ha) is irrigated using groundwater supply, with apple orchards and corn being the largest water consumers [16]. Poultry and pig farming are the main livestock farming industries in the area, with 254,290 and 59,940 heads of livestock, respectively [17]. Pig slurry is thus the principal nitrogen input, with 412 tons of N/year, which is used for cereal (corn, barley, and wheat) fertilization. Wastewater from these municipalities is treated in two small wastewater treatment plants (WWTP) that represent 26.7% of the area’s population, while the rest is connected to a larger WWTP located outside the study area.
The Baix Fluvià alluvial aquifer was selected for this study about antibiotic pollution, as its hydrogeological setting is considered “simple”, since the two main input sources (i.e., recharge from the river and leaching of antibiotics found in slurries and manure by rainfall events) are evident [18]. Despite this evidence, a lack of spatial correlation of the most detected antibiotics in groundwater was found [4], pointing out a disagreement between observed data and the conceptual hydrogeological model. In agreement with previous groundwater pollution studies [19,20], the lack of spatial correlation was attributed to (1) the limited representativeness of the sampled wells, (2) the mosaic-like distribution of manure fertilized crops, (3) the large compositional variety of applied manure in terms of antibiotic load, and last but not least (4) the complexity of the adsorption and degradation processes (that determine the fate of pollutants controlled by the local flow field and geochemical conditions). However, such analyses of actual field datasets do not usually evaluate the relevance of the inferred governing factors on the final antibiotic distribution in aquifers, which is paramount for establishing appropriate groundwater quality management strategies.
2. Methods
2.1. Sampling and Water Analysis
The sampling campaign was conducted during May–July 2015 and consisted of the collection of 47 groundwater samples from private wells, mainly used for irrigation and farming (Figure 1). Seven samples were collected along the Fluvià River and two from the WWTP. Well depths were between 12 and 20 m.
The following physio-chemical parameters were measured in situ using a flow-through cell: electrical conductivity (EC), pH, redox potential (Eh), dissolved oxygen (DO), and temperature. Afterwards, samples were filtered, transported and stored under cooled conditions (4 °C) for immediate analysis. Hydrochemical analysis consisted of major hydrochemical components using standard methods. One liter groundwater samples were collected in PET bottles to determine the concentration of a selection of 53 human and veterinary antibiotics, including 10 chemical groups. Antibiotic concentrations were analyzed by automated offline solid phase extraction (SPE) followed by ultra-high-performance liquid chromatography coupled to quadrupole linear ion trap tandem mass spectrometry (UHPLC–QqLIT) [21]. Stable isotopes of water (δ2H, δ18O), nitrate (δ15N and δ18O of dissolved NO3−), and sulfate molecules (δ34S and δ18O of SO42−) were analyzed for hydrogeochemical completeness (see details in reference [4]).
2.2. Response and Explanatory Variables
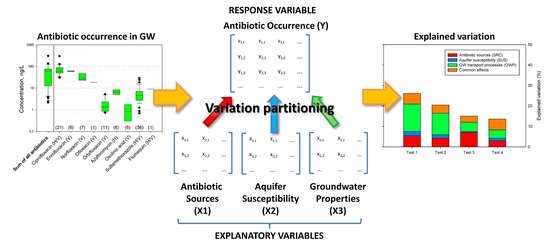
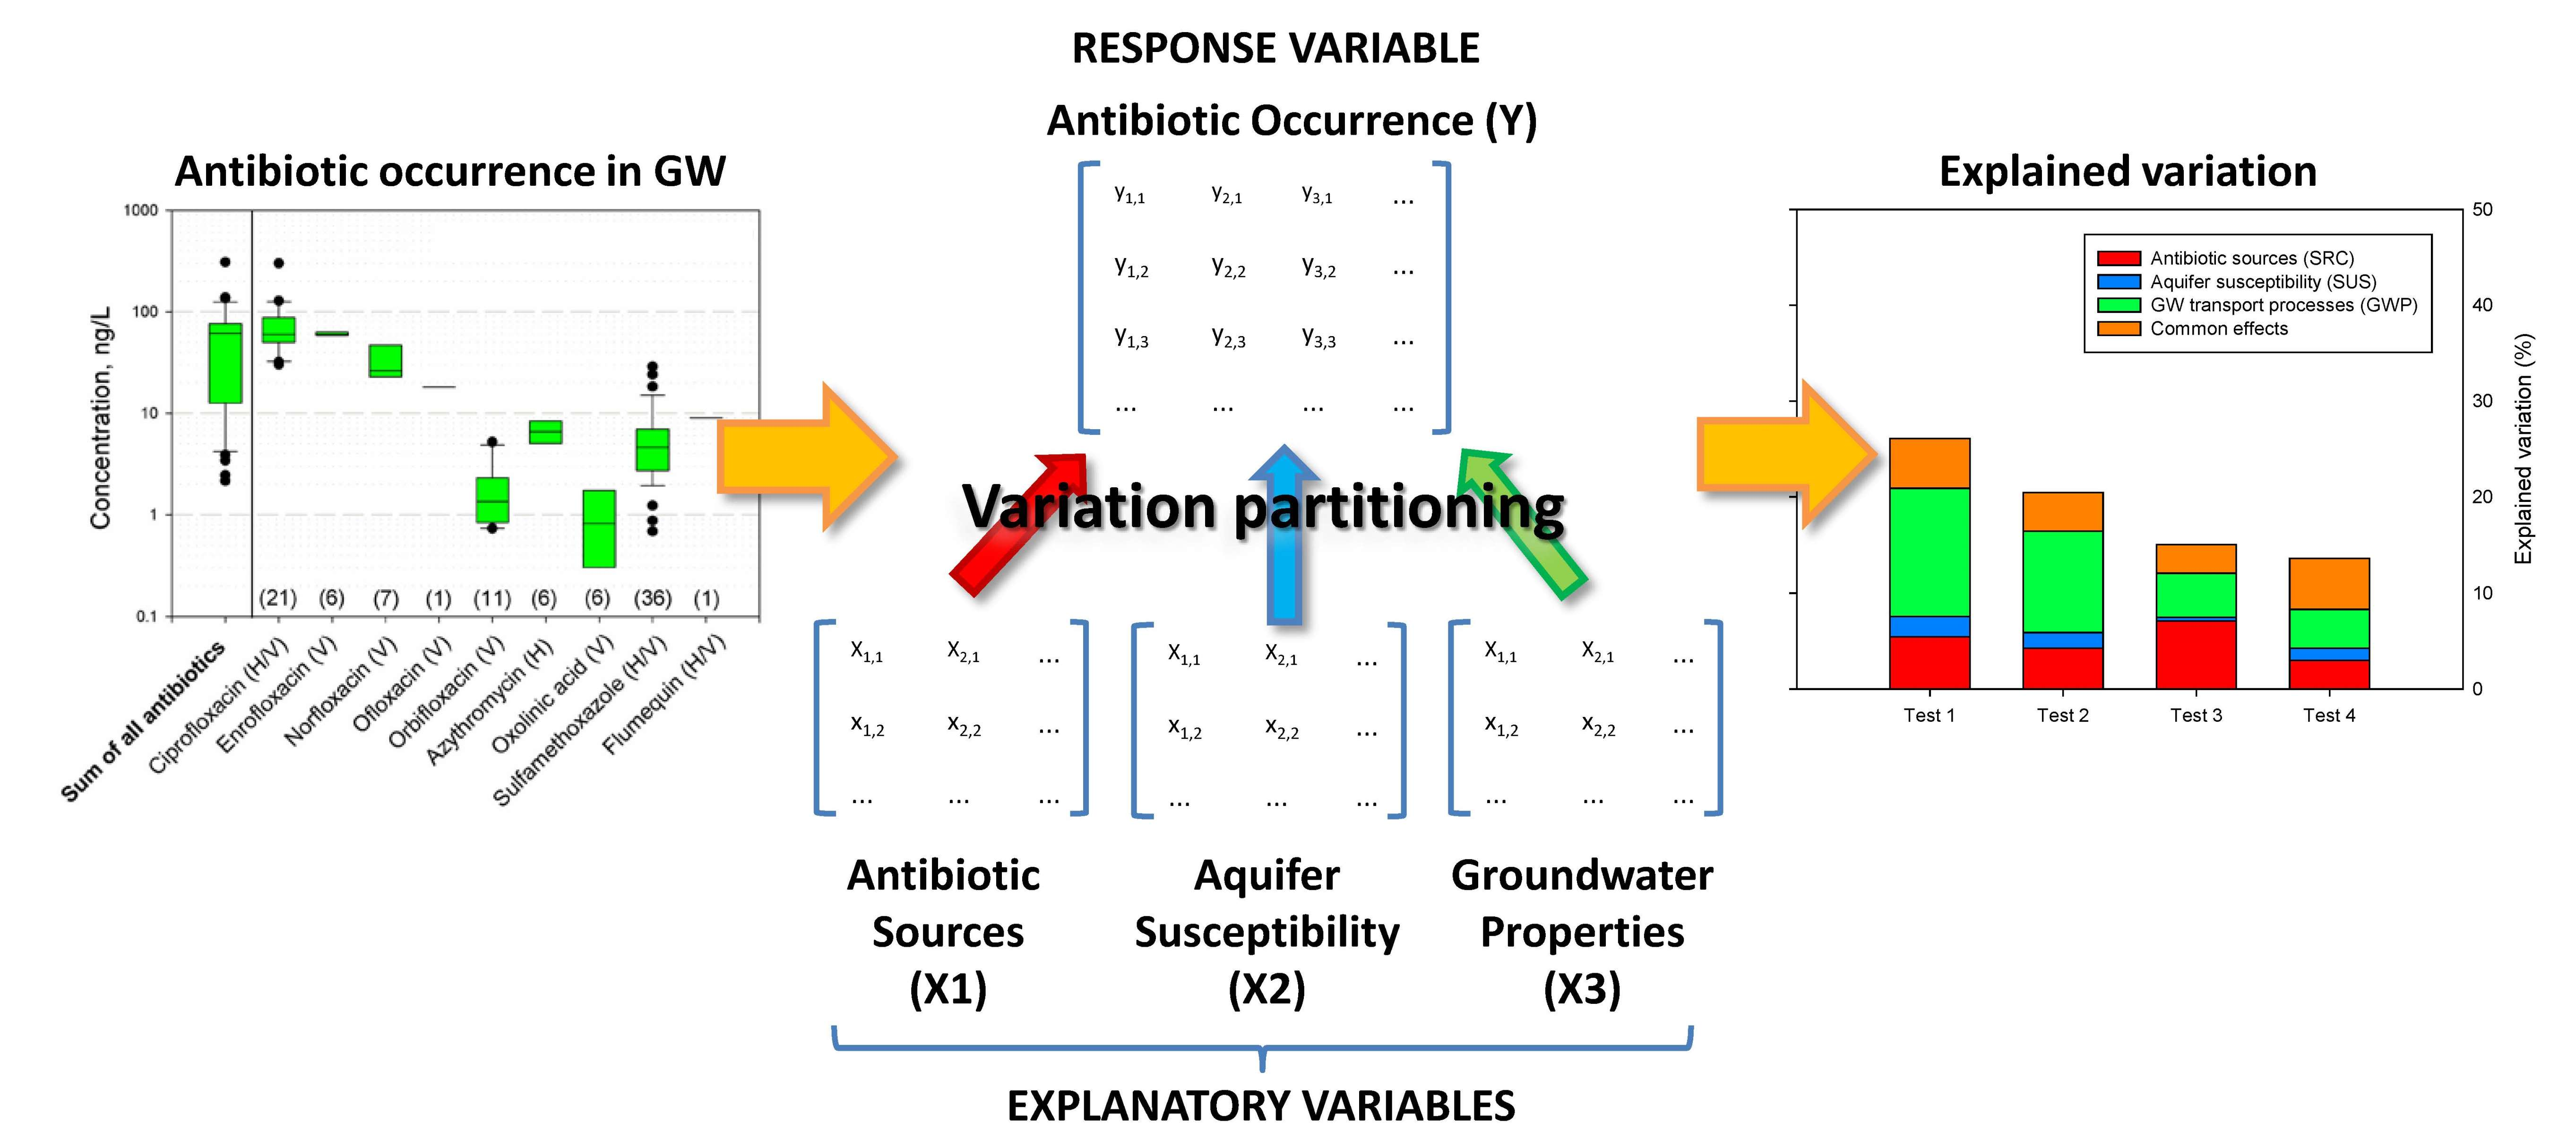
VP requires the explanatory variables that are used to solve the magnitude of a response variable to be defined. In this study, antibiotic occurrence in groundwater was the response variable (Y) of the statistical analysis. It was considered in two distinct ways: First, as a matrix of individual antibiotic concentrations (a total of 53 compounds), and later, as a matrix of the main antibiotic group concentrations: fluoroquinolones, quinolones, penicillins, cephalosporines, macrolides, tetracyclines, lincosamides, sulfonamides, dihydrofolate reductase inhibitors, and nitroimidazoles, given by the sum of the compound concentrations (for details and a full dataset, check reference [4], and Table 1). Given the fact that the occurrence of all detected antibiotic is sparse and most of them are found in just a few wells (Figure 2), assembling them by the main chemical groups is an attempt to reduce variability. Nevertheless, this option must be considered with caution, as the geochemical properties of antibiotics are not uniform within each antibiotic group.
In this study, three explanatory variables or predictors were considered in conformity with the hydrological and environmental factors that control the occurrence and fate of antibiotics in groundwater (Table 1; Figure 3):
- Antibiotic sources (SRC, explanatory variable X1) were used to set the pollutant origin in groundwater. In the study area, two antibiotic sources are distinguished: human (mainly supplied by urban wastewater and dumped to streams after treatment), and veterinary (introduced by leaking farm manure pits and, mostly, by slurry and manure used as crop fertilizers). The set of parameters that define the influences of these sources were estimated by means of the distances of sampled wells to the Fluvià River and to the WWTPs as well as by the percentage of land use estimated using GIS tools (differentiating up to 15 distinct land use types [22]) within two arbitrary radiuses of 100 and 500 m around the well.
- Groundwater properties (GWP, explanatory variable X3) given by the hydrochemical characteristics of the water samples were used as a surrogate for the existing geochemical conditions within the aquifer. They include physico-chemical parameters, major ion and nutrient concentrations, and the isotopic content. For the sake of simplification, a Principal Component Analysis (PCA) was conducted to identify associations among these variables. As varifactors assemble the effects of environmental factors on hydrochemical processes, PCA scores were also used as VP parameters for this explanatory variable [24,25].
2.3. Variation Partitioning Analysis
As a previous step to VP analysis, RDA was conducted to avoid collinearity among variables and to select the appropriate parameters for each predictor (Figure 3), since RDA allows the series of linear combinations of explanatory variables that best explain the variation of the response matrix to be sought, in successive order: [28]. All the parameters described in the previous section (variable description) were considered for RDA, with a previous transformation, i.e., the concentrations of the hydrochemical parameters (except for pH and pe) and distances were log10 transformed, whereas the percentage estimates were arcsine transformed [29]. Scores obtained from PCA remained untransformed.
VP was used to analyze the level of influence of the explanatory variables (i.e., antibiotic sources (SRC), aquifer susceptibility or vulnerability (SUS), and groundwater properties (GWP); Table 1) on the occurrence and distribution of antibiotics in groundwater. VP was used to decompose the variation of dependent (response) variables (i.e., antibiotic concentration) in pure and shared effects of a set of predictors (i.e., explanatory variables). This was achieved by partial regression and redundancy analysis for multiple dependent response variables (log10 transformed antibiotic concentrations, and log10 transformed concentrations of antibiotic groups). The R-language “vegan” package [30] primarily uses adjusted r-squared values to assess the partitions explained by the predictors and their combinations [31].
The variation was decomposed in the following components: pure antibiotic source effects (SRC|(SUS + GWP)), pure aquifer susceptibility effects (SUS|(SRC + GWP)), and pure groundwater transport process effects [GWP|(SRC + SUS)]. Since the predictors were generally not orthogonal to one another, some variation was jointly explained by the union of two variables: aquifer susceptibility and groundwater transport process effects without antibiotic source effects ((SUS∩GWP)|SRC), antibiotic source and groundwater transport process effects without the effects of aquifer susceptibility ((SRC∩GWP)|SUS), antibiotic source and aquifer susceptibility effects without the groundwater transport process effects ((SRC∩SUS)|GWP), and the shared effect of all three predictors (SRC∩SUS∩GWP). The overall effect (pure plus shared with other components) is also reported. Finally, the unexplained variation (1 (SRC + SUS + GWP)) completed the VP description.
3. Results
3.1. Antibiotic Distribution in Its Hydrogeological Context
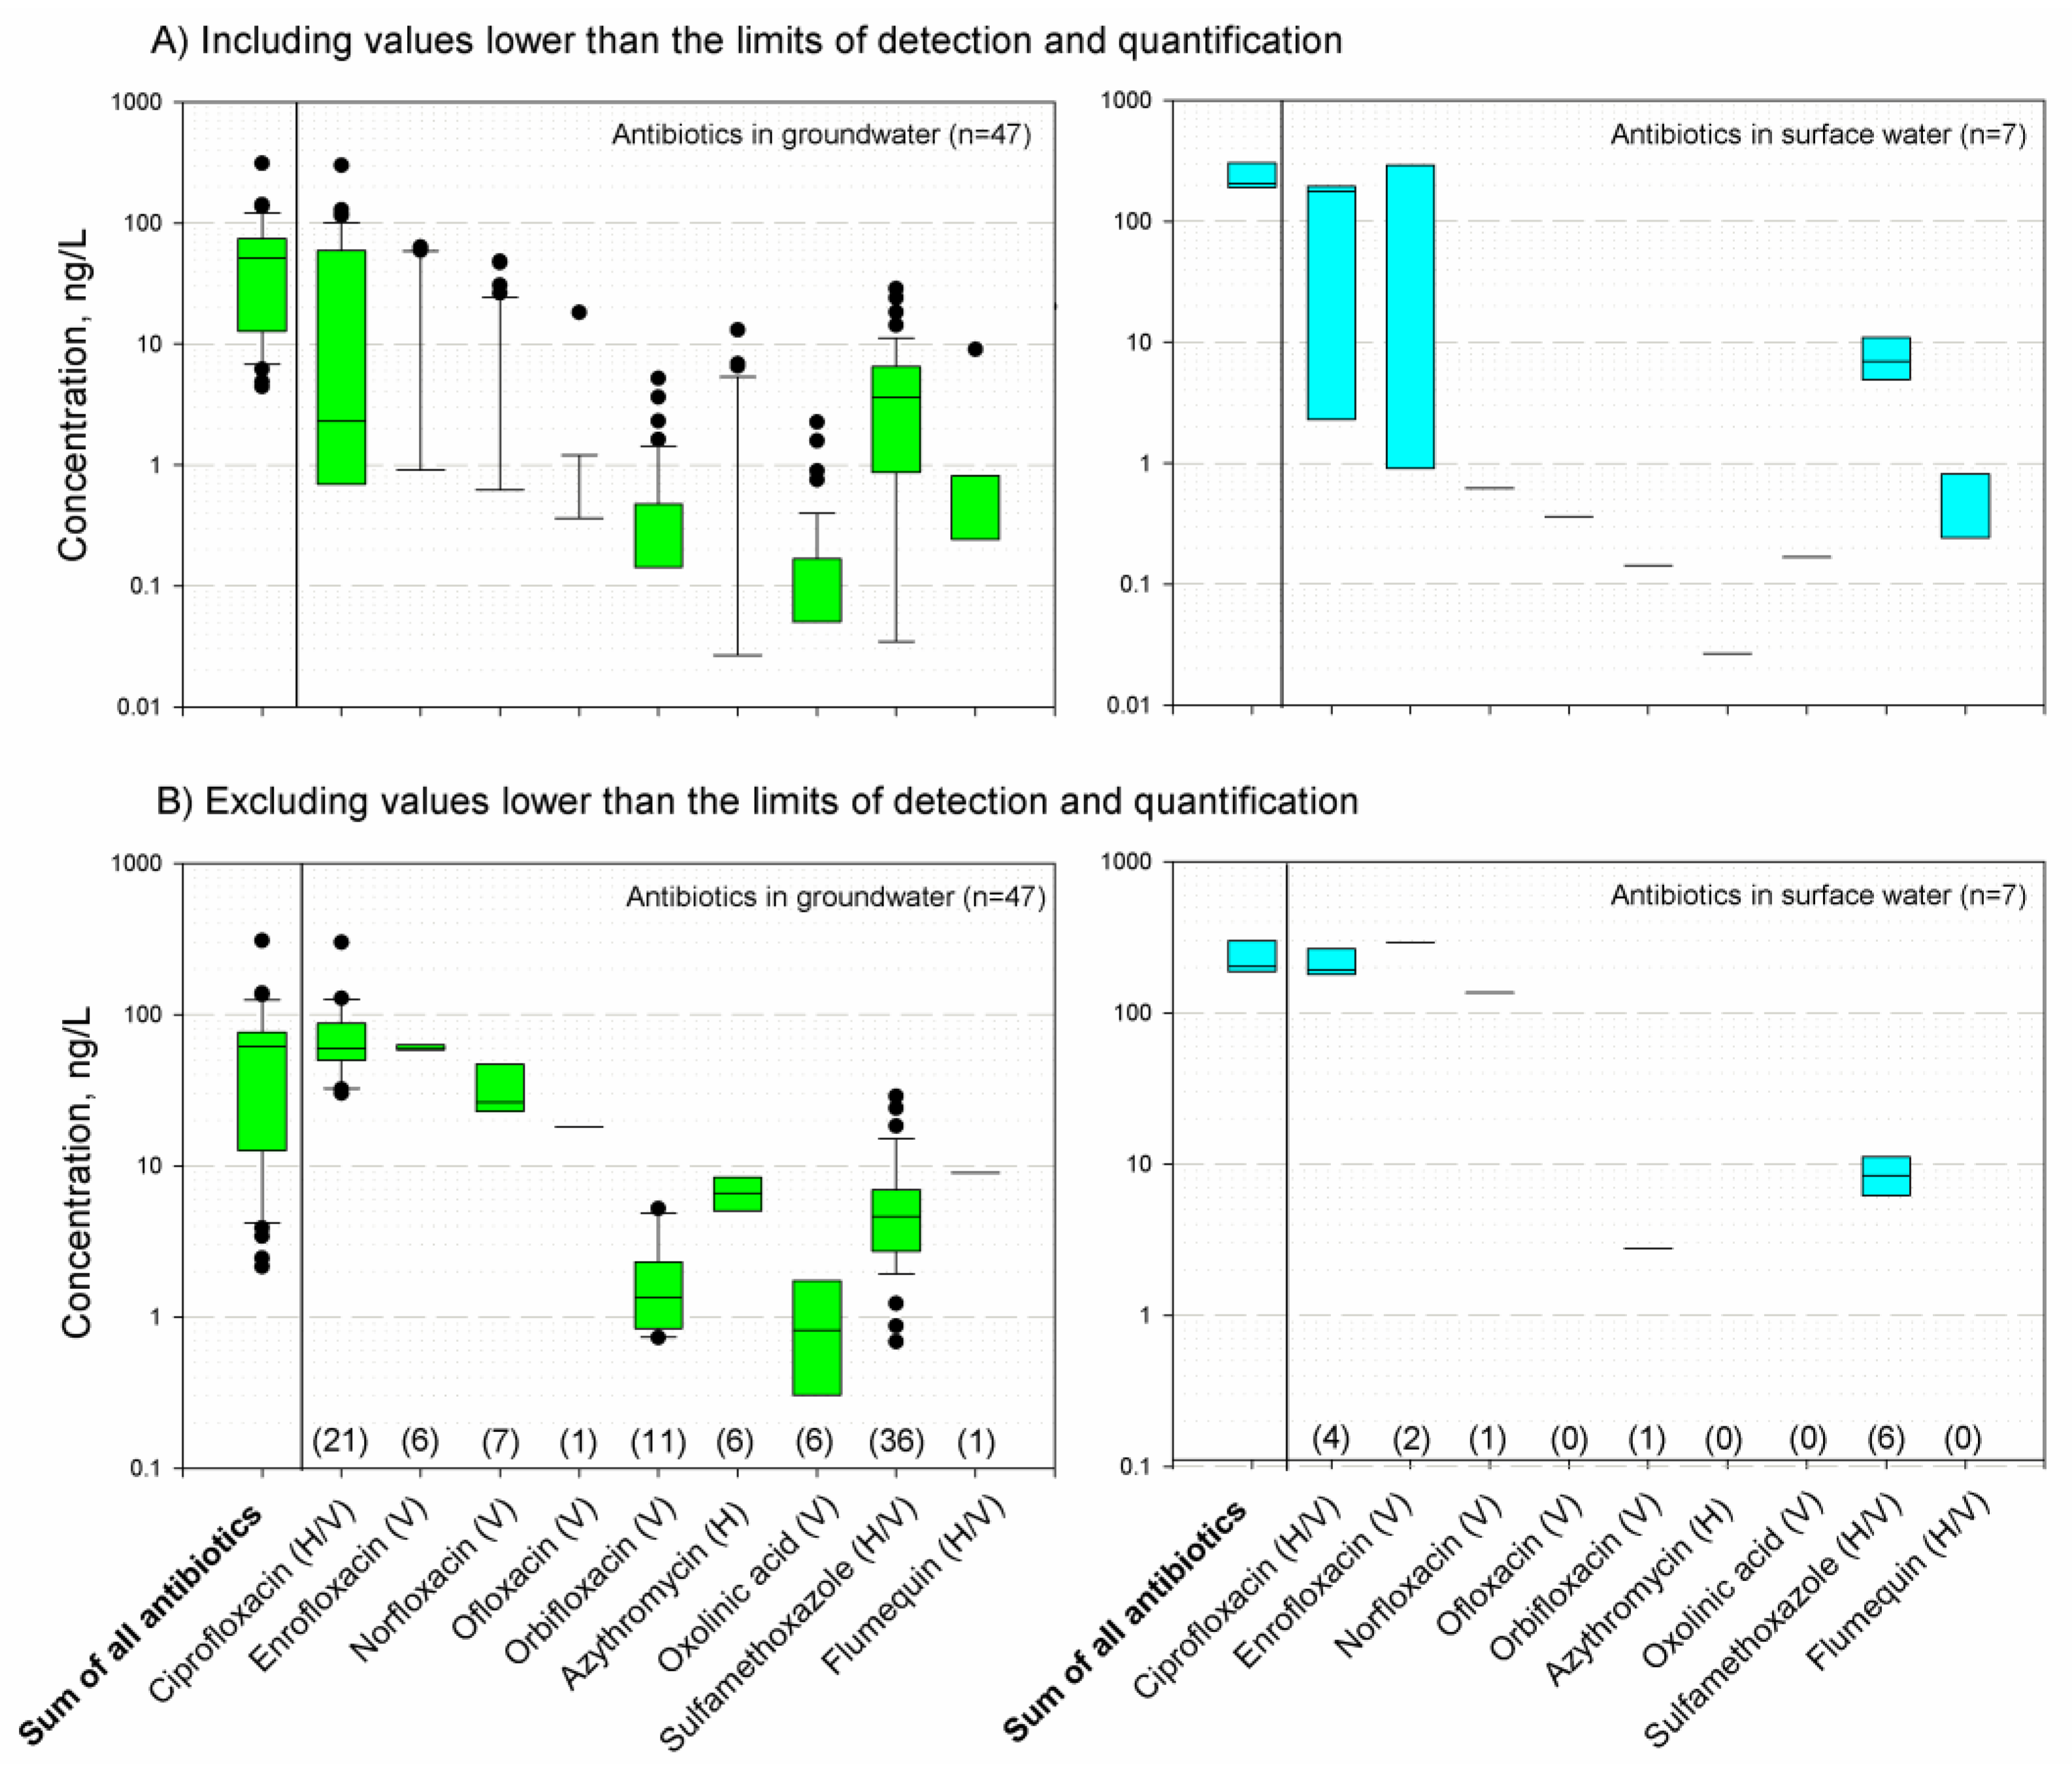
The antibiotic dataset indicates that just a few (11) of the 53 analyzed antibiotics were actually found in groundwater samples, with ciprofloxacin and sulfamethoxazole having larger detected concentrations (21 and 36 among the 47 sampled wells, respectively; Figure 2). Other antibiotics found in more than one sampling well were orbifloxacin, norfloxacin, enrofloxacin, azitromicin, and oxolinic acid, while the five remaining antibiotics were detected in just one well. Concentrations were counted by tens of ng/L (ciprofloxacin, enrofloxacin, norfloxacin) to less than 10 ng/L for the other compounds. Only ciprofloxacin, enrofloxacin, and sulfamethoxazole were widely identified in the Fluvià River samples, appearing at higher concentrations than those found in groundwater (Figure 2). Most of the antibiotics found in groundwater were of veterinary use, pointing out efficient leaching from organic fertilization. Ciprofloxacin and sulfomethoxazole, used in both human and veterinary medicine, were found in wells near the river; however, both were also present in sampling wells whose capture area did not entail stream recharge. This ubiquity of the two most common antibiotics in the Baix Fluvià aquifer confirms the main input recharge sources: stream recharge and rainfall leaching.
Groundwater flow paths within the aquifer must be considered to interpret antibiotic occurrence and spatial distribution: recharge from the river occurs in the easternmost reaches of its course, mainly during the humid season, while groundwater discharge to the stream occurs perennially in the westernmost low reaches of the Fluvià River [18]. Some lateral recharge also takes place from the Cretaceous and Neogene sedimentary formations located at the northwestern and southern boundaries of the alluvial aquifer. Moreover, rainfall recharge occurs on most of the aquifer surface, except in urbanized areas (<3% of the total surface). Groundwater flow takes place through a thick layer (15 m in average) of gravel and sand, even though distinct recent geological, morpho-sedimentary units can be mapped in the Fluvià River alluvial plain (Table 1). Although some of these units do not reach the entire thickness of the alluvial formation, they represent the diversity of the aquifer hydraulic properties in the immediacy of the well, and so they regulate the flow of pollutants (mainly those introduced by rainfall recharge) on their path to the sampling point. Soil types, mostly entisols and alfisols, have also been included in the analysis, as they constitute the first reactive layer that controls the fate of antibiotics released from organic fertilizers.
Hydrochemistry and isotopic information also determine the environmental characteristics of (1) the stream recharge area of influence, (2) the zones mainly fed by rainfall infiltration, and (3) the recharge from the underlying limestone aquifer in the southern area, named “Zone 3” wells (Figure 1 and Figure 4). This recharge is not expected to contribute to the antibiotic content, as it belongs to a large-scale regional flow system whose recharge occurs in forested areas.
3.2. PCA of Hydrochemical Data
PCA was conducted to depict relationships between hydrochemical parameters and groups of samples and to associate them with the hydrochemical processes already deduced from the dataset. The first four varifactors (VFs) represented 70.36% of the total variance, with a value of 0.623 for the Keiser–Meyer–Olkin (KMO) measure. Based on these four main VFs, the PCA provided the following information:
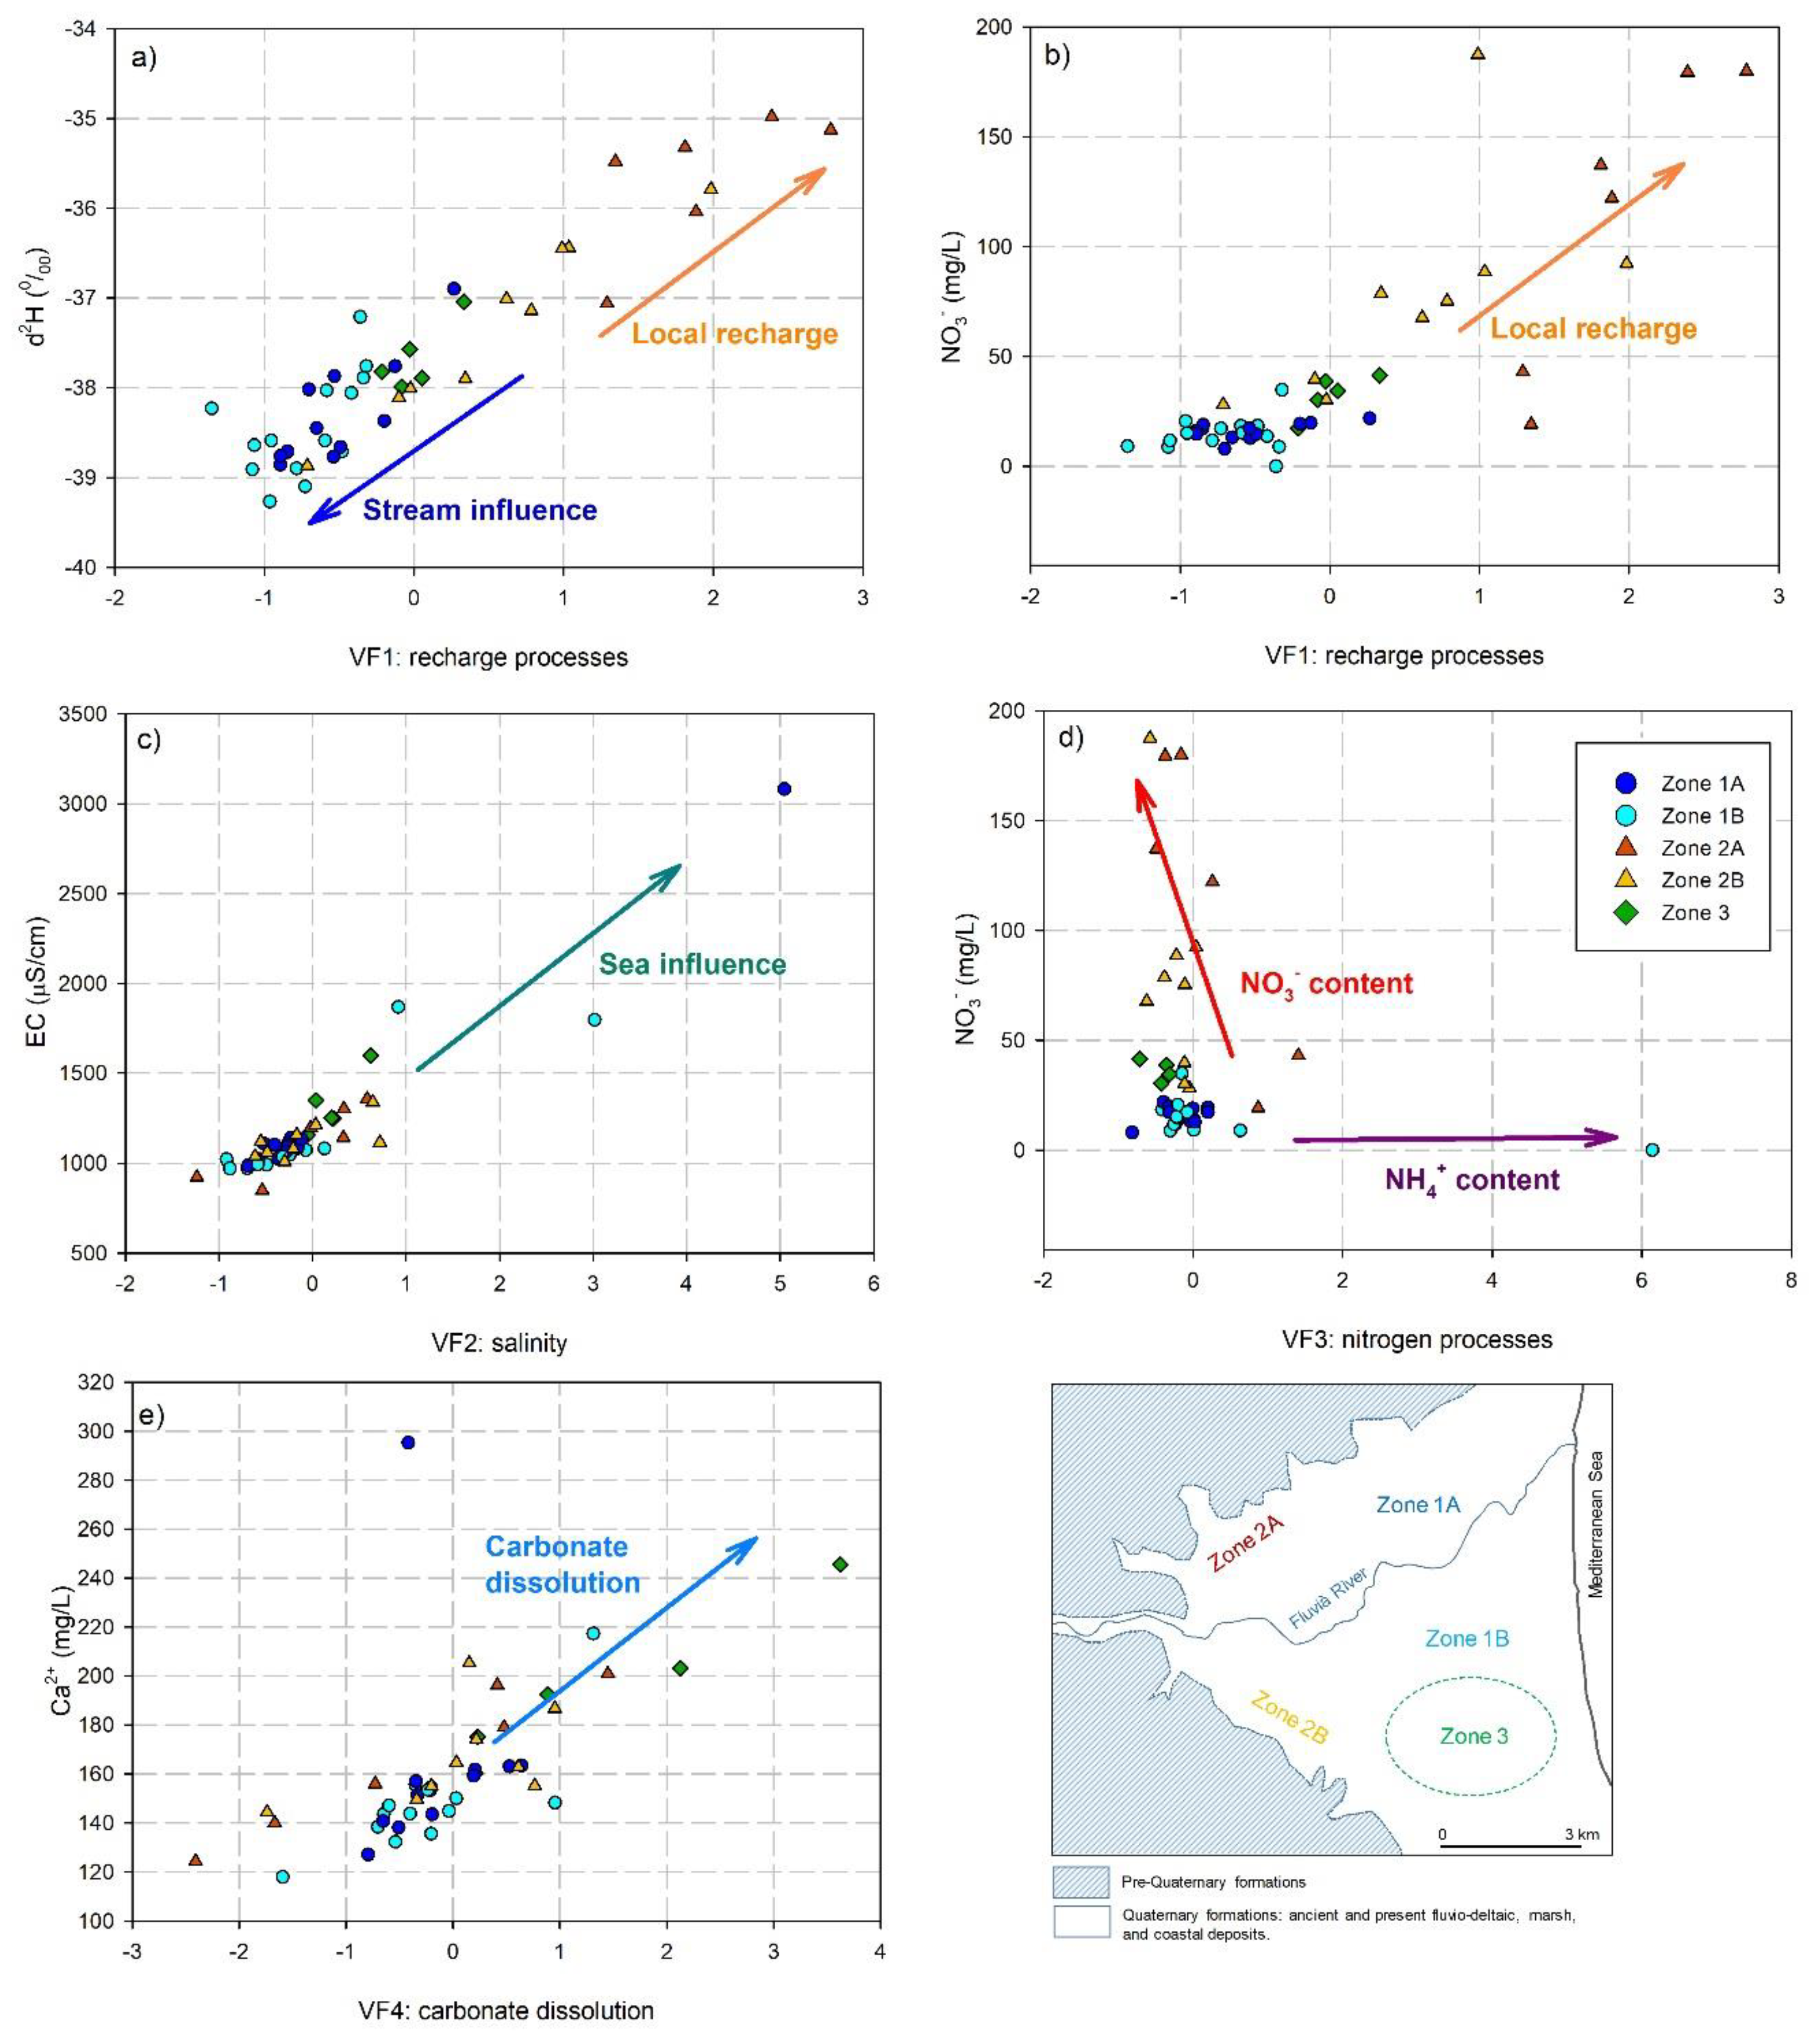
- VF1 assembled –δ2H, –δ18O, δ34SSO4, δ18OSO4, TOC, –SO42−, –K+, –F− and NO3− (24.78% of the variance) representing the distinct recharge processes in the study area. Wells with the highest values of VF1 were those affected by local rainfall recharge (δ2H = −34.7‰; [32]), and they also presented the highest nitrate concentrations (Figure 4a,b). In contrast, lower values of VF1 were shown by samples affected by stream recharge, which showed the lowest nitrate values, higher sulfate concentration, and a lighter water isotopic content (Fluvià River mean δ2H = −38.6 ± 0.12‰ [4]).
- VF2 represented Cl−, Br−, electric conductivity (EC), Na+, Mg2+, and Ca2+ together (19.27% of the variance), thus representing high salinity and mineralization processes. Samples with the highest values for VF2 were those affected by saltwater intrusion (Figure 4c), which originates from the coast as well as from the salinized lowest reaches of the Fluvià River [18].
- VF3 was associated with NH4+, –NO3−, δ15NNO3, –O2, pH, and –pE (16.97% of the variance), grouping parameters related to nitrogen pollution, including denitrification through δ15NNO3. Samples with the highest values of VF3 were those with high concentrations of NH4+ and low NO3− and O2 contents. In contrast, samples with NO3− concentrations higher than 100 mg/L showed the lowest values for VF3 (Figure 4d).
- VF4 included HCO3−, TOC, Ca2+, and Mg2+ (9.34% of the variance), representing the carbonate equilibria (Figure 4e). Samples with the highest values for this VF4 were mainly located in zone 3, where the alluvial aquifer overlays limestone aquifers that constitute the hills located in the southern limits of the study area (Figure 1).
PCA scores were used in the subsequent VP analysis as a way to simplify the set of predictors determined by the exploratory variable X3 (Table 1, Figure 3). This section may be divided by subheadings. It should provide a concise and precise description of the experimental results, their interpretation as well as the experimental conclusions that can be drawn.
3.3. Redundancy Analysis and Variation Partitioning Results
VP describes the variation of the antibiotic dataset as a function of the specific parameters included in each explanatory variable (Table 1). The selected parameters were those with the highest significance in the RDA, thus avoiding collinearity in VP. As mentioned, the main response variable (i.e., antibiotic concentration) was treated in two distinct ways: (1) as the antibiotic concentration, and (2) as the sum of concentrations of the compounds of each antibiotic group (Figure 3). In particular, RDA identified the following parameters for each explanatory variable (Table 2):
- Antibiotic sources (SRC): The parameter that better explains this variable was the distance to the WWTP (Wdis; p-values of 0.01–0.04) as it appears in all tested combinations. Results were more diverse when regarding the effect of land use. For instance, when antibiotic concentrations were taken as the response variable, the percentages of surface water bodies (SW), unproductive land (UL), forested area (FA), arable land (AL), and urban area (UA) were significant using a 100 m radius buffer zone (p-values of 0.040–0.100), whereas unproductive lands (UL) and grasslands (PR) were relevant when a 500 m radius was used (p-values of 0.045 and 0.090, respectively). In contrast, when antibiotic groups were considered, only the percentage of grasslands (PA) was significant using 100 m buffers (p-value of 0.085), and any land use appeared as relevant at the 500 m radius test.
- Aquifer susceptibility (SUS): When single antibiotic occurrence was analyzed using buffers of 100 m radiuses, the selected parameters were two types of alfisols (both of Ustalf suborder, AUTP6, AURD7; with p-values of 0.065 and 0.085). However, when 500 m radiuses were considered instead of soil types, two geological units appeared as significant in the RDA—those associated with the deltaic plain silts (Qpall) and to the alluvial plain (Qpa; with p-values of 0.025 and 0.030, respectively). In contrast, when the occurrence of chemical groups of antibiotics was analyzed, an entisol type (Acuent suborder; EAPS2) was significant for both the 100 and 500 m radius buffers (p-value of 0.085–0.090), but two types of aquifers related to current riverbeds (Qr) and to Neogene sandstones (Ns) were significant for 500 m radius buffers (p-values of 0.055 and 0.080).
- Groundwater properties (GWP): The most significant hydrochemical and isotopic parameters in RDA tests using antibiotic concentrations were those related to aquifer redox conditions (pE, O2), carbonate equilibria (Ca2+, HCO3−, alkalinity, TOC) or to groundwater origin and recharge (Br−, F−, δ18O, δD, δ34S, δ18OSO4). Conversely, significant VFs for antibiotic occurrence were VF1 (related to the recharge and groundwater origin) and VF3 (related to nitrate pollution) with p-values of 0.005–0.100. In contrast, when the antibiotic groups were taken as a response variable, the chemical parameters simplified, yet the hydrochemical meaning remained unaffected. However, VF4, associated with carbonate equilibria (p-values of 0.045–0.050) was the major replacement parameter for VF1 and VF3. No major differences appeared between tests conducted using 100 and 500 m radius buffer zones.
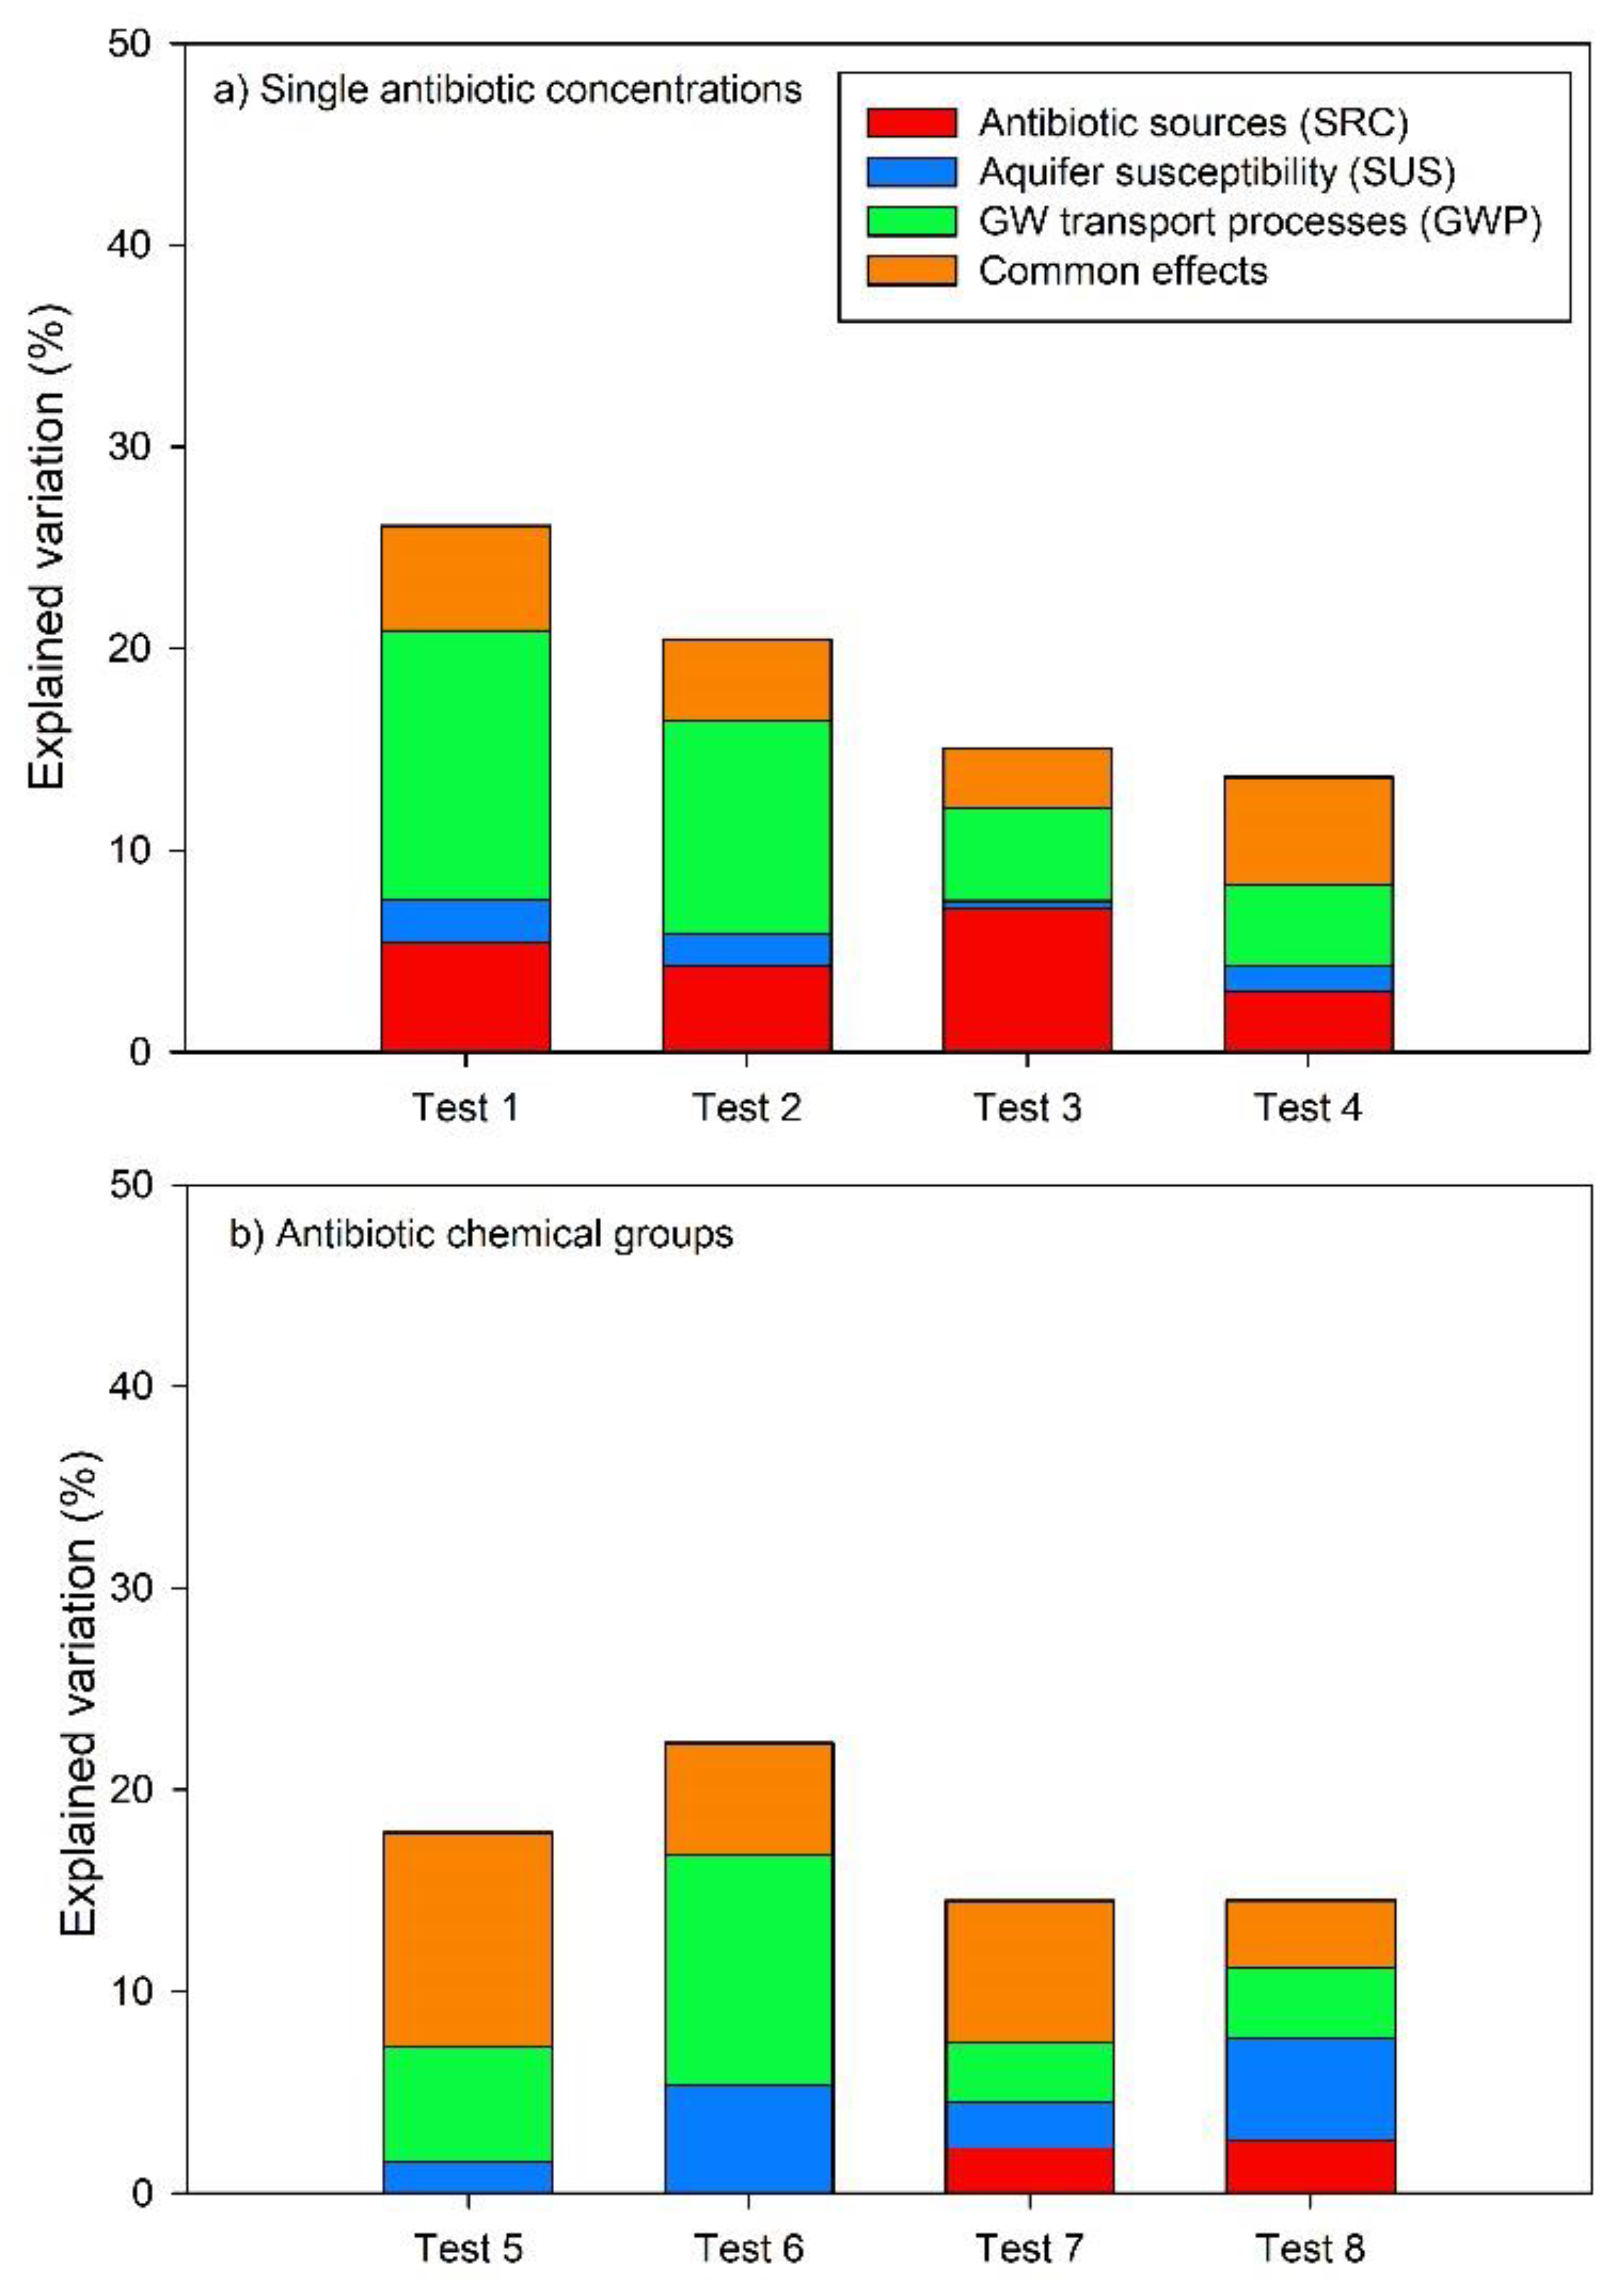
VP decomposed the variation of antibiotic and antibiotic chemical groups using pure and shared effects of the antibiotic sources (SRC), aquifer susceptibility (SUS), and groundwater properties (GWP) (Table 3; Figure 5). The first remarkable observation refers to the amount of unexplained variation (residual), which was between 73.9% (T1) and 86.4% (T4), with a mean value of 81.9 ± 1.6%, indicating that the considered predictors provide a weak explanation of the overall dataset variability. Considering the antibiotic concentration at each well (Figure 5a), VP explained between 26.1% (T1) and 13.6% (T4) of the total variation, which was mainly related to SCR and GWP for the overall effects (8.3%–10.6% and 5.5%–15.4%, respectively). When solely considering pure effects, GWP stood out as the leading predictor, especially when the raw chemical data of the hydrochemical parameters were used. Meanwhile, shared effects only justified a low percentage of the total variation.
In a broad sense, similar results were obtained by VP analysis based on antibiotic groups (Figure 5b). In this case, however, SUS increased its percentage of explanation as the overall effect, especially in the case of using PCA varifactors when it stood out as the predictor with the largest percentage. Nevertheless, when using raw data, GWP appeared again as the major predictor for both the overall and the pure effects. Finally, a low variation was also explained as share effects in this second database.
4. Discussion
The multivariate statistical analyses conducted in this study, RDA and VP, requires a detailed discussion of the hydrological meaning of the results. It is our starting observation that antibiotic distribution in the Baix Fluvià aquifer is spatially uncorrelated and that no clear relationships could be depicted between the antibiotic concentration and hydrogeological dynamics, despite the recharge sources and the flow net being well known [4]. RDA selected a few statistically significant parameters, which are expected to govern the fate of antibiotics in the subsurface (Table 2).
Among those parameters related to the antibiotic sources (SCR), distance to WWTP unexpectedly came out, despite only two small WWTPs existing in the area (Figure 1). This variable occurred instead of the distance to the river, which acts as a recharge source in most inland reaches of the stream. In fact, the river recharge, as a source, was identified when surface water—as a land use variable—was displayed as statistically significant in the tests using the 100 m buffer zone radius. Other land uses that had significant meaning included those related to fertilization practices (AL, PA) as well as those unrelated to them (FA, UL, UA). Both outcomes, although contradictory, mean that the mosaic-like type of land uses in the area (and therefore, that of the antibiotic input zones) is relevant for determining the absence or occurrence of antibiotics, and, in the case of the latter, whether a high or low concentration is present. This is consistent with the lack of spatial correlation observed by geostatistical analysis [4]. When antibiotic groups were considered, the distance to WWTP also stood out as a leading parameter as well as the use of wood-production plantations (PA) in non-fertilized areas.
Aquifer hydraulic properties (SUS), represented by soil types and geological units, were clearly discerned by the size of the buffer zone radius, as reported by RDA. Using antibiotic data, soil types were featured for the 100 m buffer zones radius, while geological formations appeared when a 500 m zone was used. When the antibiotic groups were considered, the Neogene formation (Ns, which outcrops in the limits of the alluvial plain) showed up, denoting the flow contribution from the boundaries.
Finally, hydrochemical parameters, as GWP explanatory variables, were shown to be related to aquifer recharge and nitrate pollution, and they stood out as the most significant parameters. Besides, they were found to be associated with VF1, VF3, and VF4, as outlined by RDA in the tests based on the PCA scores. The relationship with aquifer recharge is specifically relevant, since local recharge may be linked to the presence of antibiotics, while regional fluxes may not present antibiotic pollution. This result indicates that, in addition to the source types, the subsurface hydrochemical environment is also paramount in the control of antibiotic concentrations; in particular, the presence of antibiotics was found to be more related to VF1 or VF3, and their absence was found to be more related to VF4.
The VP results provided two meaningful contributions. First, the total amount of explained variation was rather small, with a mean value of 18%. This implies that, even though a large number of hydrogeological parameters were considered, these did not lead the prediction of antibiotic concentration variability, and they did not provide clues on which concentration to expect at a given well location based solely on hydrogeological information. Secondly, a matter to discuss is what parameters involved in non-conservative solute transport that might increase the percentage of explained variation were omitted, namely those involved in the groundwater flux and those depicting chemical reactions, such as sorption and degradation. The former ones, hydraulic gradient and transmissivity, can be assumed to lie within a narrow range of values, given the general uniformity of the alluvial formation across its entire depth. As mentioned, mapped geological units may have a surface effect in the immediacy of the sampling well, yet the overall flow field develops based on the underlying alluvial formation. Consequently, parameters associated with the groundwater flux are not expected to be relevant variability indicators. Indeed, parameters related to the aquifer susceptibility are not actually important, as already shown by VP (Table 3).
The later parameters, i.e., those related to chemical reactions, may be more relevant, as they define the local chemical environment that has herein been represented, as a surrogate, by the hydrochemical data (explanatory variable X3). Certainly, sorptive and degradability parameters for each compound are not explicitly considered to be exploratory parameters. Since attenuation processes are paramount for the fate of antibiotics in groundwater, their omission is responsible for the low amount of the total percentage explained by VP. In fact, reactive parameters are inherent to each antibiotic and, therefore, to the response variable itself and not to the well or to its nearby area characteristics represented by the exploratory variables. This is the reason why they could not be included as additional local explanatory variables.
Despite the small percentage of explained variation and the exclusion of the reactive transport parameters, the subsurface chemical environment represented by the GWP variables stood out as a key predictor for the antibiotic concentration variability, being significant for both overall and shared effects (Table 3; especially in these tests using raw chemical data). In particular, this group of predictors presented the highest explained variations for pure effects (with mean values of 8.14% and 5.87% for VP using antibiotics or antibiotic groups, respectively) as well as for overall effects (with mean values of 10.25% and 9.28%, as before), thus depicting the importance of the chemical parameters that set the antibiotic spatial distribution.
5. Conclusions
In summary, parameters mainly related to groundwater recharge areas (such as δ18O and δ2H) or the hydrochemical environment and processes (O2, pE, TOC, HCO3−, δ15NNO3, etc.) included in the GWP explanatory variable were able to describe the antibiotic spatial variability in the Baix Fluvià alluvial aquifer, despite omitting the reactive properties of antibiotics. All of the parameters representing groundwater properties in the statistical analysis (i.e., chemical data) are easy to measure, but the reactive properties are highly variable, as shown by many laboratory experiments and literature references (e.g., reference [33]). The VP points out that a larger explanation of their spatial variability can barely be obtained, reflecting the fact that reactive transport processes are paramount, and they can unlikely be surrogated by hydrochemical and isotopic data. Consequently, management approaches face the problem of determining how to address antibiotic pollution in groundwater as well as that of other contaminants of emerging concern at the view of the limited description achieved from an extensive dataset. Should managers undertake intense field work (costly in effort, time, and costs) for a detailed portray of the whole groundwater quality state, or just focus specifically on the most toxic substances in a few critical supply wells? Advanced fieldwork, clearer managing goals, and defined priorities for pollution prevention are still needed to answer such a consequential question.
Author Contributions
Conceptualization, A.M. and J.M.-P.; methodology, A.M.; investigation, J.M.-P.; data curation, A.M.; writing—original draft preparation, A.M. and J.M.-P.; writing—review and editing, A.M. and J.M.-P.; project administration, J.M.-P.; funding acquisition, J.M.-P.
Funding
This study was initiated during the PERSIST and REMEDIATION projects (JPIW2013-118; CGL2014-57215-C4-2-R), and its results are presently being developed under project PACE-IMPACT (FEDER-MCIU-AEI/CGL2017-87216-C4-4-R).
Conflicts of Interest
The authors declare no conflict of interest. The founding sponsors had no role in the design of the study; in the collection, analyses, or interpretation of data; in the writing of the manuscript, and in the decision to publish the results.
References
- Boxall, A.B.; Blackwell, P.; Cavallo, R.; Kay, P.; Tolls, J. The sorption and transport of a sulphonamide antibiotic in soil systems. Toxicol. Lett. 2002, 131, 19–28. [Google Scholar] [CrossRef]
- Schaffer, M.; Boxberger, N.; Börnick, H.; Licha, T.; Worch, E. Sorption influenced transport of ionizable pharmaceuticals onto a natural sandy aquifer sediment at different pH. Chemosphere 2012, 87, 513–520. [Google Scholar] [CrossRef] [PubMed]
- Geissen, V.; Mol, H.; Klumpp, E.; Umlauf, G.; Nadal, M.; Van Der Ploeg, M.; Van De Zee, S.E.; Ritsema, C.J. Emerging pollutants in the environment: A challenge for water resource management. Int. Soil Water Conserv. Res. 2015, 3, 57–65. [Google Scholar] [CrossRef]
- Boy-Roura, M.; Mas-Pla, J.; Petrovic, M.; Gros, M.; Soler, D.; Brusi, D.; Menció, A. Towards the understanding of antibiotic occurrence and transport in groundwater: Findings from the Baix Fluvià alluvial aquifer (NE Catalonia, Spain). Sci. Total Environ. 2018, 612, 1387–1406. [Google Scholar] [CrossRef] [PubMed]
- Gros, M.; Mas-Pla, J.; Boy-Roura, M.; Geli, I.; Domingo, F.; Petrovic, M. Veterinary pharmaceuticals and antibiotics in manure and slurry and their fate in amended agricultural soils: Findings from an experimental field site (Baix Empordà, NE Catalonia). Sci. Total Environ. 2019, 654, 1337–1349. [Google Scholar] [CrossRef] [PubMed]
- Lei, M.; Zhang, L.; Lei, J.; Zong, L.; Li, J.; Wu, Z.; Wang, Z. Overview of Emerging Contaminants and Associated Human Health Effects. BioMed Res. Int. 2015, 2015, 1–12. [Google Scholar] [CrossRef] [PubMed] [Green Version]
- Jechalke, S.; Heuer, H.; Siemens, J.; Amelung, W.; Smalla, K. Fate and effects of veterinary antibiotics in soil. Trends Microbiol. 2014, 22, 536–545. [Google Scholar] [CrossRef]
- Obimakinde, S.; Fatoki, O.; Opeolu, B.; Olatunji, O. Veterinary pharmaceuticals in aqueous systems and associated effects: An update. Environ. Sci. Pollut. Res. Int. 2017, 24, 3274–3297. [Google Scholar] [CrossRef]
- Lapworth, D.; Baran, N.; Stuart, M.; Ward, R. Emerging organic contaminants in groundwater: A review of sources, fate and occurrence. Environ. Pollut. 2012, 163, 287–303. [Google Scholar] [CrossRef] [Green Version]
- Lapworth, D.J.; Lopez, B.; Laabs, V.; Kozel, R.; Wolter, R.; Ward, R.; Vargas-Amelin, E.; Besien, T.; Claessens, J.; Delloye, F.; et al. Developing a groundwater watch list for substances of emerging concern: A European perspective. Environ. Res. Lett. 2018. [Google Scholar] [CrossRef]
- Baken, K.A.; Sjerps, R.M.; Schriks, M.; Van Wezel, A.P. Toxicological risk assessment and prioritization of drinking water relevant contaminants of emerging concern. Environ. Int. 2018, 118, 293–303. [Google Scholar] [CrossRef]
- Mas-Pla, J. Compuestos emergentes en las aguas subterráneas y su incidencia en la salud. In Agua Subterránea, Medio Ambiente, Salud y Patrimonio; Andreo Navarro, B., Giménez Forcada, E., Durán Valsero, J.J., Eds.; Pub. Asociación Internacional de Hidrogeólogos—Grupo Español: Madrid, Spain, 2018; pp. 77–88. [Google Scholar]
- Borcard, D.; Legendre, P.; Drapeau, P. Partialling out the spatial component of ecological variation. Ecology 1992, 73, 1045–1055. [Google Scholar] [CrossRef]
- ICGC. Cartografia Geològica E 1:50,000. Institut Cartogràfic i Geològic de Catalunya Website: Generalitat de Catalunya. Available online: http://www.icgc.cat/ (accessed on 1 May 2019).
- ACA. Consulta de Dades Hidrològiques. Agència Catalana de l’Aigua Website: Generalitat de Catalunya. Available online: http://aca.gencat.cat/ca/inici (accessed on 1 May 2019).
- DARP. Superfícies municipals dels conreus agrícoles, any 2014. Dep. d’Agricultura, Ramaderia, Pesca i Alimentació Website: Generalitat de Catalunya. Available online: http://agricultura.gencat.cat/ca/inici (accessed on 1 May 2019).
- SIR. Extraccions Explotacions Actives, 2014. Sistema d’Informació Ramadera. Dep. d’Agricultura, Ramaderia, Pesca i Alimentació Website: Generalitat de Catalunya, 2014. Available online: http://agricultura.gencat.cat/ca/inici (accessed on 1 May 2019).
- Mas-Pla, J.; Montaner, J.; Solá, J. Groundwater resources and quality variations caused by gravel mining in coastal streams. J. Hydrol. 1999, 216, 197–213. [Google Scholar] [CrossRef]
- Geisler, G.; Hellweg, S.; Liechti, S.; Hungerbüller, K. Variability Assessment of Groundwater Exposure to Pesticides and Its Consideration in Life-Cycle Assessment. Environ. Sci. Technol. 2004, 38, 4457–4464. [Google Scholar] [CrossRef] [PubMed]
- Kourakos, G.; Klein, F.; Cortis, A.; Harter, T. A groundwater nonpoint source pollution modeling framework to evaluate long-term dynamics of pollutant exceedance probabilities in wells and other discharge locations. Water Resour. Res. 2012, 48. [Google Scholar] [CrossRef]
- Gros, M.; Rodríguez-Mozaz, S.; Barceló, D. Rapid analysis of multiclass antibiotic residues and some of their metabolites in hospital, urban wastewater and river water by ultra-high-performance liquid chromatography coupled to quadrupole-linear ion trap tandem mass spectrometry. J. Chromatogr. A 2013, 1292, 173–188. [Google Scholar] [CrossRef] [Green Version]
- DAAM. SIGPAC-Sistema d’Informació Geogràfica de Parcel•les Agrícoles. Barcelona, Dep. d’Agricultura, Ramaderia, Pesca, Alimentació Website: Generalitat de Catalunya. Available online: http://agricultura.gencat.cat/ca/inici (accessed on 1 May 2019).
- INCISA. Estudio Previo Conjunto de los Planes de Riego del Fluvià (Plan General) y del Muga (Resto del Plan y Escorrentías). Estudio Agronómico, Clasificación de Suelos 7ª Aproximación (U.S.D.A 1960), Plano núm. A-2, Escala: 1:50,000; Dirección General de Obras Hidráulicas, Instituto Nacional de Colonización: Madrid, Spain, 1970. [Google Scholar]
- Helena, B. Temporal evolution of groundwater composition in an alluvial aquifer (Pisuerga River, Spain) by principal component analysis. Water Res. 2000, 34, 807–816. [Google Scholar] [CrossRef]
- Menció, A.; Folch, A.; Mas-Pla, J. Identifying key parameters to differentiate groundwater flow systems using multifactorial analysis. J. Hydrol. 2012, 472, 301–313. [Google Scholar] [CrossRef]
- Johnson, T.D.; Belitz, K. Assigning land use to supply wells for the statistical characterization of regional groundwater quality: Correlating urban land use and VOC occurrence. J. Hydrol. 2009, 370, 100–108. [Google Scholar] [CrossRef]
- Boy-Roura, M.; Nolan, B.T.; Menció, A.; Mas-Pla, J. Regression model for aquifer vulnerability assessment of nitrate pollution in the Osona region (NE Spain). J. Hydrol. 2013, 505, 150–162. [Google Scholar] [CrossRef]
- Bocard, D.; Gillet, F.; Legendre, P. Numerical Ecology with R; Springer: New York, NY USA, 2011. [Google Scholar]
- Legendre, P.; Legendre, L. Numerical Ecology; Elsevier: Amsterdam, The Netherlands, 1998. [Google Scholar]
- Oksanen, J.; Kindt, R.; Legendre, P.; O’Hara, B.; Simpson, G.L.; Solymos, P.; Stevens, M.H.H.; Wagner, H. Vegan: Community Ecology Package. R Foundation for Statistical Computing R Package Version 1.15-3. Available online: https://cran.r-project.org/web/packages/vegan/index.html (accessed on 15 July 2019).
- Peres-Neto, P.R.; Legendre, P.; Dray, S.; Borcard, D. Variation partitioning of species data matrices: Estimation and comparison of fractions. Ecology 2006, 87, 2614–2625. [Google Scholar] [CrossRef]
- Vilanova, E.; Menció, A.; Mas-Pla, J. Determinación de sistemas de flujo regionales y locales en las depresiones tectónicas del Baix Empordà y la Selva (NE de España) en base a datos hidroquímicos e isotópicos. Bol. Geol. Min. 2008, 119, 51–62. [Google Scholar]
- Kiecak, A.; Sassine, L.; Boy-Roura, M.; Elsner, M.; Mas-Pla, J.; Salle, C.L.G.L.; Stumpp, C. Sorption properties and behaviour at laboratory scale of selected pharmaceuticals using batch experiments. J. Contam. Hydrol. 2019, 225, 103500. [Google Scholar] [CrossRef] [PubMed]
Figure 1.
Geographical and geological scheme of the study area [14], and locations of groundwater sampling points. Legend: Qt0, current riverbed, floodplain, and fluvial terrace (0–2 m); Qr, current streambed deposits; Qpc, marsh silts and clays; Qpa, alluvial plain (gravels, sands, and clays); Qm, marsh areas (sands, silts, organic matter, and salts); Qma, abandoned meanders (gravels, sands, and silts); Qpall, deltaic plain (silts); Qpas, distributary channels in the deltaic plain (gravels and sands); Qcl, old coastal strip (sands with organic matter); Qd, coastal dunes; Qp, beach sediments; Qt1, Fluvià River terrace 1 (2–3 m above the stream level); Qt2, Fluvià river terrace 2 (10–15 m); Qt3, Fluvià River terrace 3; Qt4, Fluvià River terrace 4 (60–65 m); NQv, Neogene and Quaternary volcanic materials; Ns, Neogene sediments; Cls, Cretaceous limestones; blue lines represent rivers, red dots represent wastewater treatment plants, and black dots represent the main villages. Sampling points legend: zone 1A (alluvial plain left bank), dark blue; zone 1B (alluvial plain right bank), light blue; zone 2A (terraces 3 and 4 left bank), orange; zone 2B (terraces 3 and 4 right bank), yellow; zone 3 (points with a hydrochemical composition associated to the underlying Cretaceous limestone formations), green.

Figure 2.
Distribution of the most frequent antibiotics detected in groundwater and surface water in the Baix Fluvià aquifer. The upper plots (A) include those samples with analytical values lower than analytical limits, to which a value of two-thirds of the detection limit was assigned. The lower plots (B) exclude these samples, and the numbers in parenthesis indicate the numbers of samples with measurable concentrations. H and V indicate human and veterinary use.

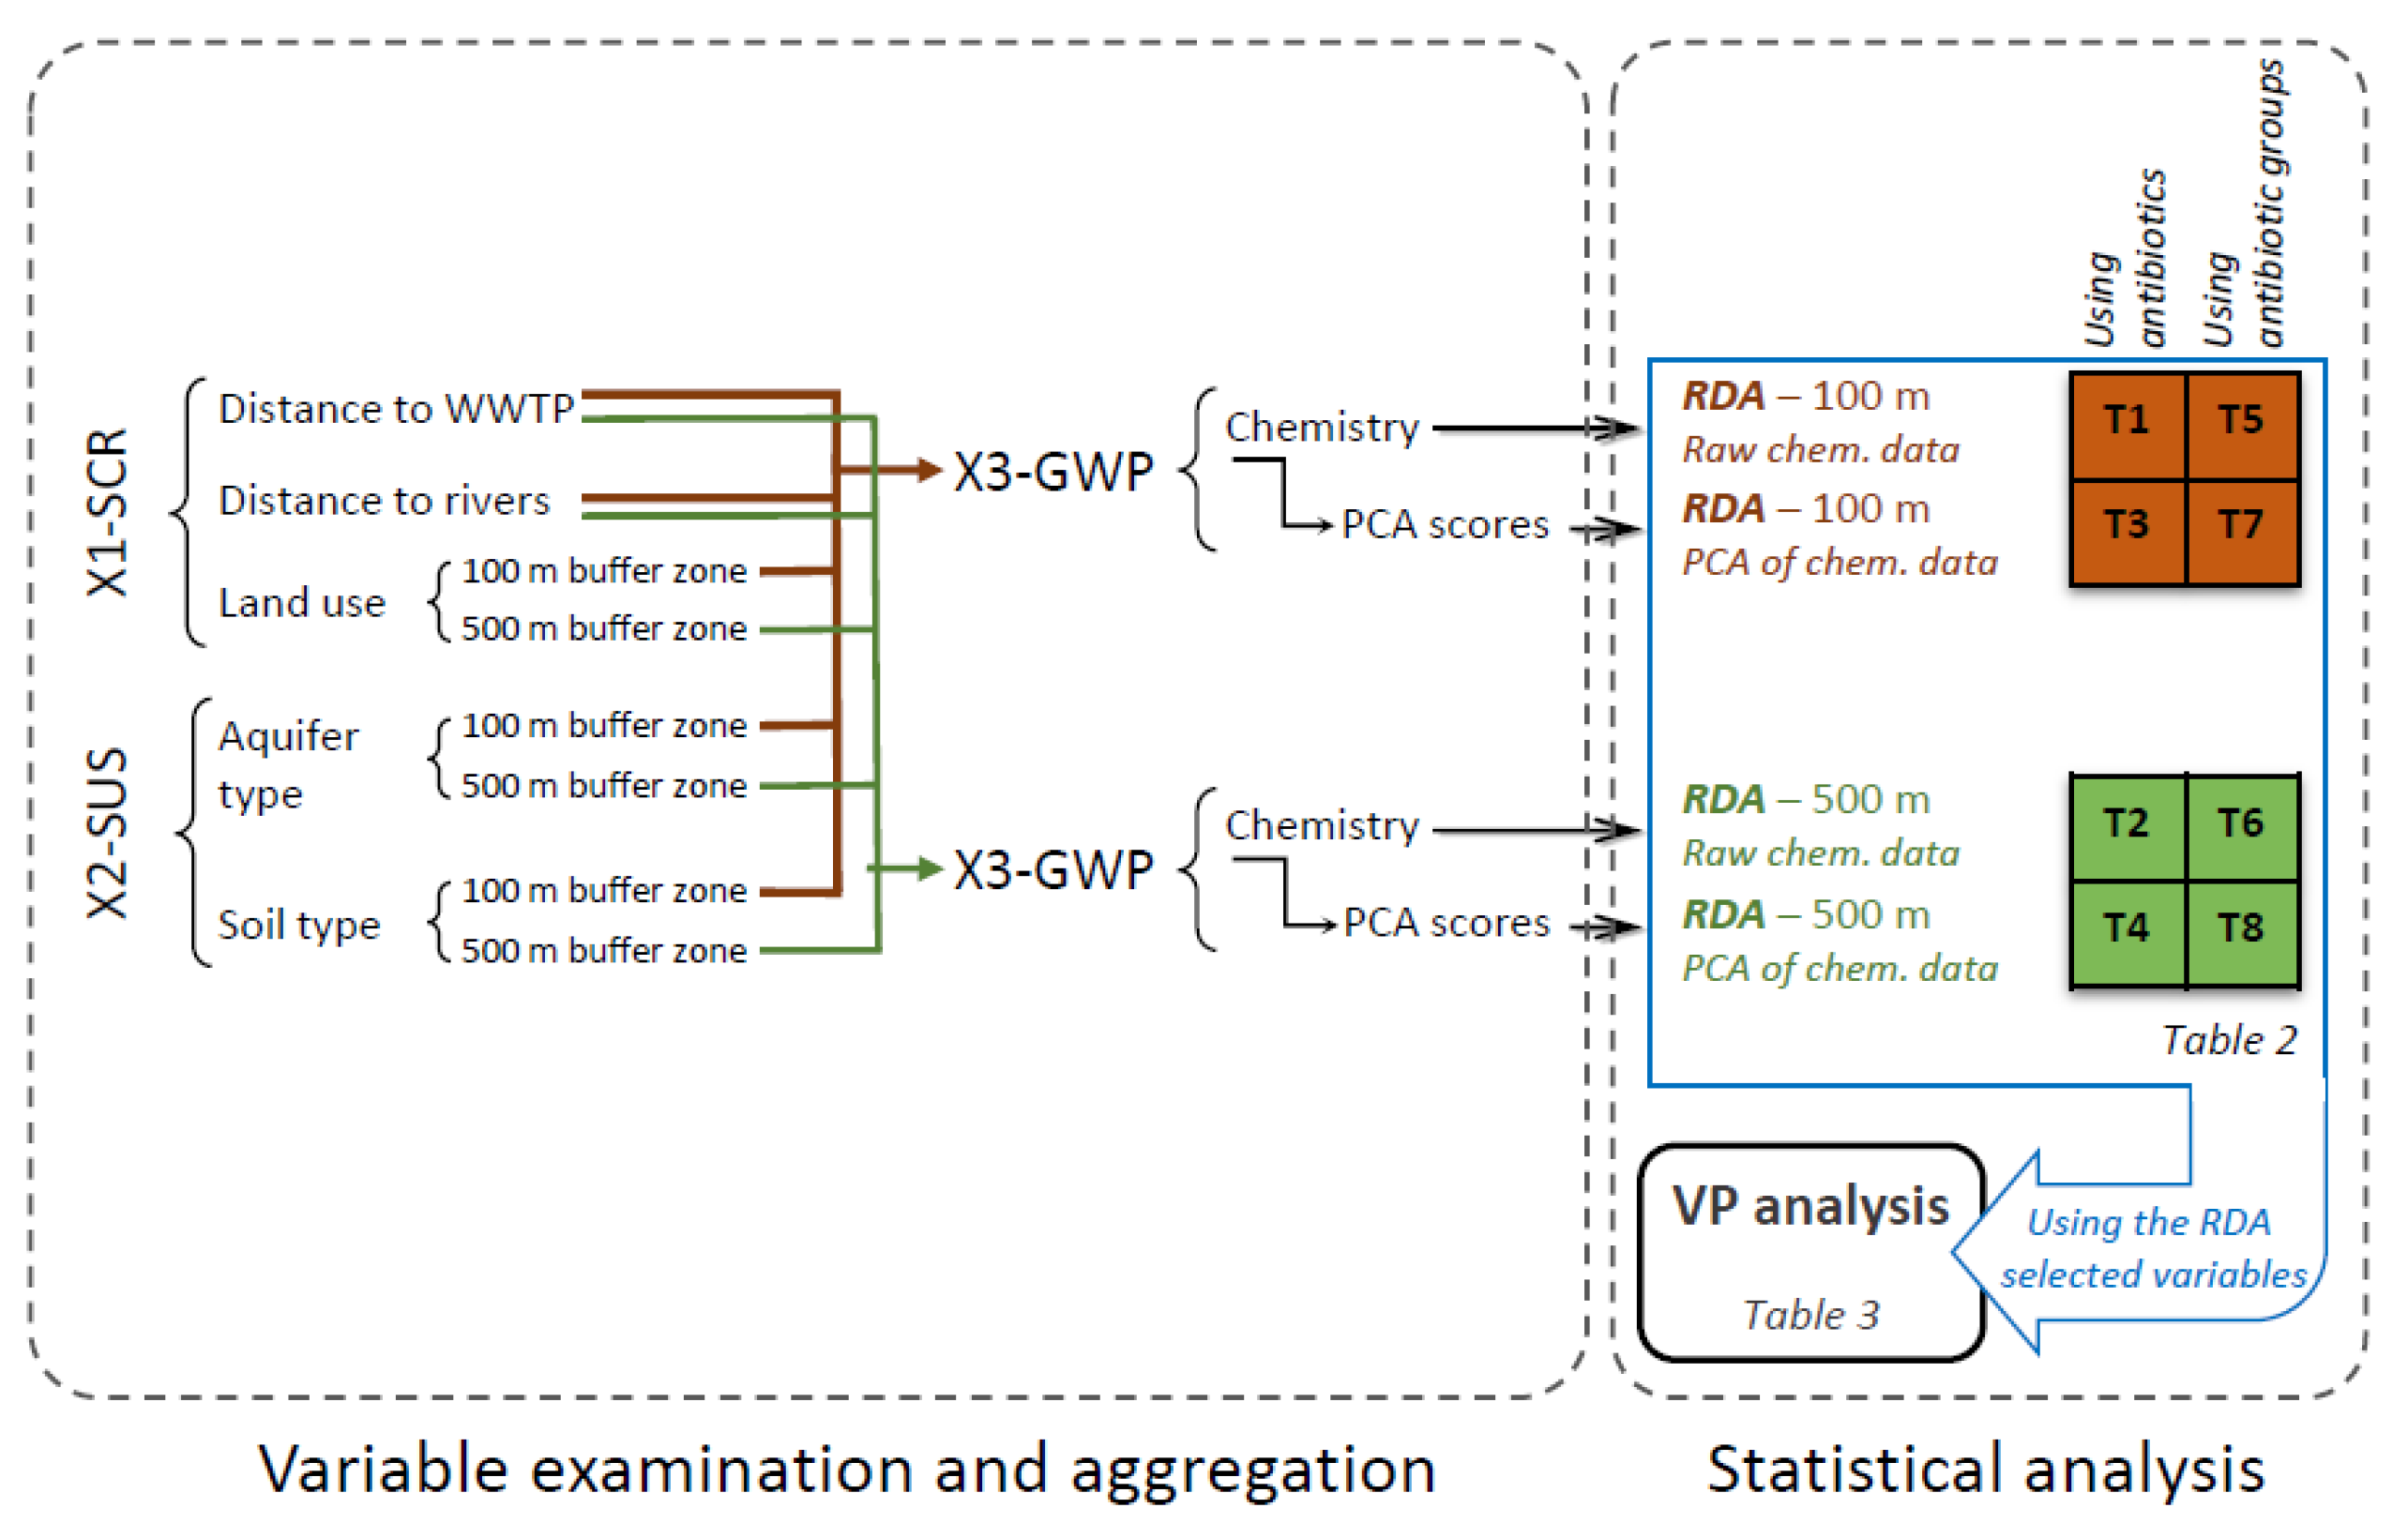
Figure 3.
Flow chart of the variable examination and aggregation processes and the distinct combination of variables used for the different tests (T#) conducted in redundancy analysis (RDA) and variation partitioning (VP) statistical analyses. Test numbers (T#) are later on used in Table 2 and Table 3 and Figure 5.

Figure 4.
Relationships between varifactors and the main hydrochemical and isotopic parameters: (a) VF1 vs. δ2H; (b) VF1 vs. NO3−; (c) VF2 vs. EC; (d) VF3 vs. NO3−; and (e) VF4 vs. Ca2+.
Figure 4.
Relationships between varifactors and the main hydrochemical and isotopic parameters: (a) VF1 vs. δ2H; (b) VF1 vs. NO3−; (c) VF2 vs. EC; (d) VF3 vs. NO3−; and (e) VF4 vs. Ca2+.

Figure 5.
Plot of the VP tests conducted under distinct approaches, combining how the antibiotic concentration is treated: (a) single antibiotic (tests# 1–4) vs. (b) antibiotic group (tests# 5–8), the radius of the buffer zone (tests# 1, 3, 5, 7: 100 m; tests# 2, 4, 6, 8: 500 m), and the use of raw hydrochemical data (tests# 1, 2, 5, 6) or PCA-VF (tests# 3, 4, 7, 8; see Figure 2 and Table 3 for details).


Table 1.
Explanatory variables screened in the statistical analysis.
| Variable | Parameter | Units | GIS Compilation | Data Source | Comments/Details |
|---|---|---|---|---|---|
| Antibiotics occurrence (Y) | Matrix of antibiotic log concentrations (53 variables) | Log10 (ng/L) | None | [4] | Logarithmic transformation of antibiotic concentrations as response variables of antibiotic pollution (ANTB) |
| Matrix of antibiotic groups log concentrations (10 variables) | Log10 (ng/L) | None | [4] | Logarithmic transformation of antibiotic chemical group concentrations, as response variables to antibiotic pollution (ANTB_G) | |
| Antibiotic sources (SRC, X1) | Distance to wastewater treatment plant (WWTP) | Log10 (m) | Distance | [14] | Distance of each well to the closest wastewater treatment plant (Wdis). It represents the shortest distance to potential human antibiotic sources. |
| Distance to rivers | Log10 (m) | Distance | [14] | Distance of each well to the closest river (Rdis). It may represent the shortest distance to potential human antibiotic sources. | |
| Land uses (17 variables) | Arcsin (%) | 100 and 500 m buffer zones | [22] | Percentage of land uses in the influence area of each well, including arable lands (AL), orchards (OR), greenhouses (GH), olive growing areas (OA), different types of fruit tree and bush areas (FY, CI, FS, VI), unproductive lands (UL), forested areas (FA), three types of grassland (PA, PR, PS), surface water bodies (SW), roads (RD), buildings and constructions (BC), and urban areas (UA). It represents the presence of different potential sources of antibiotic pollution. | |
| Aquifer susceptibility (SUS, X2) | Geological units (13 variables) | Arcsin (%) | 100 and 500 m buffer zones | [14] | Percentage of geological units present in the influence area of each well, distinguishing distributary channels (Qpas), deltaic plain silts (Qpall), cutoff meanders (Qma), current riverbeds (Qt0 and Qr), alluvial terraces (Qt1, Qt2, Qt3, Qt4), alluvial plain (Qpa), marshlands (Qm), conglomerates and sandstone (Ns), and clays (Ps). They control groundwater flow. |
| Soil types (7 variables) | Arcsin (%) | 100 and 500 m buffer zones | [23] | Percentage of entisols (Acuent suborder (with Haplacuent (EAHP1), Psammacuent (EAPS2) and hydracuent (EAHY3) groups) and Ustent suborder (with Ortusten group (EUOR4)) and alfisols (with two suborders, Acualf (Ocracualf group, AAOC5), and Ustalf (with Tipustalf (AUTP6) and Rodustalf (AURD7) groups)) in the influence area of each well. It represents soil antibiotic leaching potential. | |
| Groundwater properties (GWP, X3) | Chemistry (29 variables) | Several units | None | [4] | Raw chemical data: physico-chemical parameters, major ions, and isotope data, arcsine or log10 transformed, representing geochemical processes influencing groundwater quality. |
| Principal component analysis (PCA) factors (5 variables) | none | None | Own data | VFs representing aquifer recharge (VF1), mineralization/salinization processes (VF2), and nitrate pollution (VF3) and carbonate system (VF4). |
Table 2.
Results of the Redundancy Analysis (RDA). The “raw data” caption assumes that data has been transformed as mentioned in Section 2.3. Legend: See variable explanation in Table 1 and flow chart in Figure 3.
Table 2.
Results of the Redundancy Analysis (RDA). The “raw data” caption assumes that data has been transformed as mentioned in Section 2.3. Legend: See variable explanation in Table 1 and flow chart in Figure 3.
| Response Variable, Y | Using Antibiotics | Using Antibiotic Groups | |||||||
|---|---|---|---|---|---|---|---|---|---|
| For Variable X3 | Raw Data | PCA-VF | Raw Data | PCA-VF | |||||
| Buffer Zone r (m) | 100 | 500 | 100 | 500 | 100 | 500 | 100 | 500 | |
| Test # | T1 | T2 | T3 | T4 | T5 | T6 | T7 | T8 | |
| Explanatory variables | X1: SCR | Wdis, SW, FA, UL, AL, UA | Wdis, UL, PR | Wdis, SW, FA, UL, AL, UA | Wdis, UL, PR | Wdis, PA | Wdis, PA | Wdis, PA | Wdis |
| X2: SUS | AUTP6, AURD7 | Qpall, Qpa | AUTP6, AURD7 | Qpall, Qpa | EAPS2 | EAPS2, Qr, Ns | EAPS2 | EAPS2, Qr, Ns | |
| X3: GWP | pE, O2, HCO3−, Alk, NH4+, Br−, TOC, δ18O, δ2H, δ34S, δ18OSO4 | O2, HCO3−, Alk, NH4+, TOC, δ18O, δ2H | VF1, VF3 | VF1, VF3 | O2, Ca2+, F−, δ18O, δ2H | pe, O2, Ca2+, F−, δ18O, δ2H | VF4 | VF4 | |
Table 3.
Results of the variation partitioning analysis (VP). Legend: |, pure effects; ∩, shared effects; +, common effects. See variable explanations in Table 1; “Raw data’ caption assumes that data has been transformed as mentioned in Section 2.3. Highlighted values (bold and italic) indicate significant proportions of variance explained for overall effects or pure effects (permutation test, p < 0.05).
| Response Variable, Y | Using Antibiotics | Using Antibiotic Groups | |||||||
|---|---|---|---|---|---|---|---|---|---|
| For Variable X3 | Raw Data | PCA-VF | Raw Data | PCA-VF | |||||
| Buffer Zone r (m) | 100 | 500 | 100 | 500 | 100 | 500 | 100 | 500 | |
| Test # | T1 | T2 | T3 | T4 | T5 | T6 | T7 | T8 | |
| Overall effects (%) | SCR | 10.6 | 8.3 | 9.7 | 8.3 | 8.4 | 5.0 | 7.8 | 5.1 |
| SUS | 5.3 | 4.9 | 3.0 | 4.6 | 8.2 | 8.2 | 9.0 | 8.4 | |
| GWP | 15.4 | 13.6 | 5.5 | 6.6 | 12.1 | 15.8 | 4.8 | 4.4 | |
| Pure effects (%) | SRC|(SUS + GWP) | 5.4 | 4.3 | 7.1 | 3.0 | 0.0 | 0.0 | 2.3 | 2.7 |
| SUS|(SRC + GWP) | 2.1 | 1.6 | 0.4 | 1.3 | 1.6 | 5.4 | 2.3 | 5.0 | |
| GWP|(SRC + SUS) | 13.3 | 10.6 | 4.6 | 4.1 | 5.7 | 11.4 | 2.9 | 3.5 | |
| Shared effects (%) | (SRC∩SUS)|GWP | 3.1 | 1.0 | 2.2 | 2.8 | 4.2 | 1.1 | 5.2 | 2.4 |
| (SUS∩GWP)|SRC | 0.0 | 0.0 | 0.4 | 0.0 | 2.2 | 0.6 | 1.6 | 0.9 | |
| (SRC∩GWP)|SUS | 2.1 | 0.7 | 0.4 | 2.0 | 4.0 | 2.7 | 0.3 | 0.0 | |
| SRC∩SUS∩GWP | 0.0 | 2.3 | 0.0 | 0.5 | 0.2 | 1.2 | 0.0 | 0.0 | |
| Residuals (%) | 1 − (SRC + SUS + GWP) | 73.9 | 79.6 | 84.9 | 86.4 | 82.1 | 77.7 | 85.5 | 85.5 |
© 2019 by the authors. Licensee MDPI, Basel, Switzerland. This article is an open access article distributed under the terms and conditions of the Creative Commons Attribution (CC BY) license (http://creativecommons.org/licenses/by/4.0/).
Share and Cite
MDPI and ACS Style
Menció, A.; Mas-Pla, J. Assessing the Influence of Environmental Factors on Groundwater Antibiotic Occurrence by Means of Variation Partitioning. Water 2019, 11, 1495. https://doi.org/10.3390/w11071495
AMA Style
Menció A, Mas-Pla J. Assessing the Influence of Environmental Factors on Groundwater Antibiotic Occurrence by Means of Variation Partitioning. Water. 2019; 11(7):1495. https://doi.org/10.3390/w11071495
Chicago/Turabian StyleMenció, Anna, and Josep Mas-Pla. 2019. "Assessing the Influence of Environmental Factors on Groundwater Antibiotic Occurrence by Means of Variation Partitioning" Water 11, no. 7: 1495. https://doi.org/10.3390/w11071495
Note that from the first issue of 2016, this journal uses article numbers instead of page numbers. See further details here.