Evaluation of Root Water Uptake and Urea Fertigation Distribution under Subsurface Drip Irrigation


1
Kearney Agricultural Research and Extension Center, University of California, Parlier, CA 93648, USA
2
Civil Engineering Department, Faculty of Engineering, Port Said University, Port Said 42523, Egypt
3
Water and Water Structures Engineering Department, Faculty of Engineering, Zagazig University, Zagazig 44519, Egypt
4
Department of Civil and Environmental Engineering, Tokyo Institute of Technology, Ookayama, Meguro Ku, Tokyo 152-8550, Japan
*
Author to whom correspondence should be addressed.
Water 2019, 11(7), 1487; https://doi.org/10.3390/w11071487
Submission received: 14 June 2019
/
Revised: 13 July 2019
/
Accepted: 16 July 2019
/
Published: 17 July 2019
(This article belongs to the Section Hydrology)
Abstract
:Shallow groundwater contamination by nitrate is frequent in agricultural lands in Egypt because of the use of urea fertilizers. The urea transformation process in the vadose zone was simulated using a HYDRUS-2D model, Software package for simulations of 2D movement of water, heat, and multiple solutes in variably saturated media, for subsurface drip irrigation. The root water and nutrient uptake were assessed for three soil types (sandy loam, loam, and silty loam) with three emitter discharge levels (1.0 L h−1, 1.50 L h−1, and 2.0 L h−1), for a comparison of three fertigation strategies (A) at the beginning, (B) at the end, and (C) at the middle of the irrigation cycle. The extension of the wetted area mainly depends on soil hydraulic conductivity. The high emitter discharge with a short irrigation time is suitable for shallow-rooted crops. The cumulative flux was highest for silty loam soil and the lowest was for the sandy loam soil (1891, and 1824 cm3) for the 2 L h−1 emitter discharge within the 35 days simulation. The cumulative drainage significantly differs among soil types with little effect of emitter discharge. It recorded 1213, 295, 11.9 cm3 for sandy loam, loam, silty loam, respectively. Urea transformation is controlled by hydrolysis and nitrification as well as the adsorption coefficient of ammonium. Nitrate distribution is mainly governed by soil type rather than the emitter discharge where the sandy loam soil is more highly susceptible to nitrate leaching than to silty loam. Nitrate concentration has recorded the minimum possible level when applying the urea fertilizer at the beginning of the irrigation event for sandy loam and loam soil while for the silty loam soil, urea application at the middle of the irrigation event is more effective. Urea application at the end of the irrigation event gives the highest accumulated leached nitrate concentration below the root zone and should be avoided (the worst strategy).
1. Introduction
Agriculture in Egypt represents 80% of the total water budget while water resources are misused, and inefficient irrigation techniques are applied [1]. Subsurface drip irrigation, SDI can save 30% of the water resources and fertilizer usage [2]. Many government programs have been initiated and planned to rationalize water uses and obtain higher irrigation efficiency [3]. The optimum design and operation of the SDI system requires more understanding of water and nutrient root uptake and distribution [4]. In SDI, water discharge is controlled around the emitters and fertilizer is directed to the roots synchronizing with crop demands [5].
Urea is the most common nitrogen fertilizer used in agriculture in Egypt [6]. Nitrate (the most dominant contaminant) concentration in groundwater is directly related to these urea applications [7]. The management framework of nitrate contamination in groundwater aquifers integrates the unsaturated and saturated zones together [8]. This integration is achieved through the utilization of the output nitrate concentrations from the HYDRUS model (vadose zone simulation) as an input concentration for the MT3DMS model (saturated zone simulation) [9]. The leaching amount of nitrate to water table equals the applied urea dose at the ground surface minus crop uptakes, and the transformations of nutrients in the vadose zone [10]. HYDRUS 2D/3D has been used for evaluating the effects of soil hydraulic properties, soil layering, irrigation frequency, dripper discharge rates, the timing of nutrient applications on wetting patterns, and solute distribution [11,12,13].
The raised problem that motivates this work is the assumption of the leached amount of nitrate concentration to the water table in the previous groundwater studies in Nile Delta, which only focused on the saturated part of the aquifer [14,15,16], while no considerations were taken into account for the plant uptake and nutrient transformations in the vadose zone. Therefore, the objective of this study is to calculate nutrient distribution in the vadose zone under SDI. To obtain the minimum leached nitrate concentrations for the water table, the comparison between different urea fertigation strategies with different emitter discharges was performed. Using the HYDRUS-2D model, the effect of varying emitter discharges (Q) from 1.0 L h−1 to 1.50 L h−1 and 2.0 L h−1 for sandy loam, loam, and silt loam soil on soil-moisture content, and root water uptake was investigated. The impact of changing urea fertigation schedules at the beginning, end, and middle of the irrigation cycle on nutrient plant uptake and nutrient distribution below the root zone was studied. Finally, the assessment of simulation scenarios was performed for obtaining the sustainable management plan of using the subsurface drip irrigation system for the shallow-rooted crop.
2. Theoretical Background
HYDRUS-2D simulates the two-dimensional root water uptake and solute transport in unsaturated, partially saturated, and fully saturated porous media based on the solutions of Richard’s equation [11] as:
where θ is the volumetric soil water content (m3m−3), t is the simulating time (day), h is the soil water pressure head (m), x, and z are the horizontal and vertical space coordinate (m), K is the hydraulic conductivity function (m day−1). The two-dimensional root water uptake/sink term S(x, z, h) was determined by the equation developed by [17]:
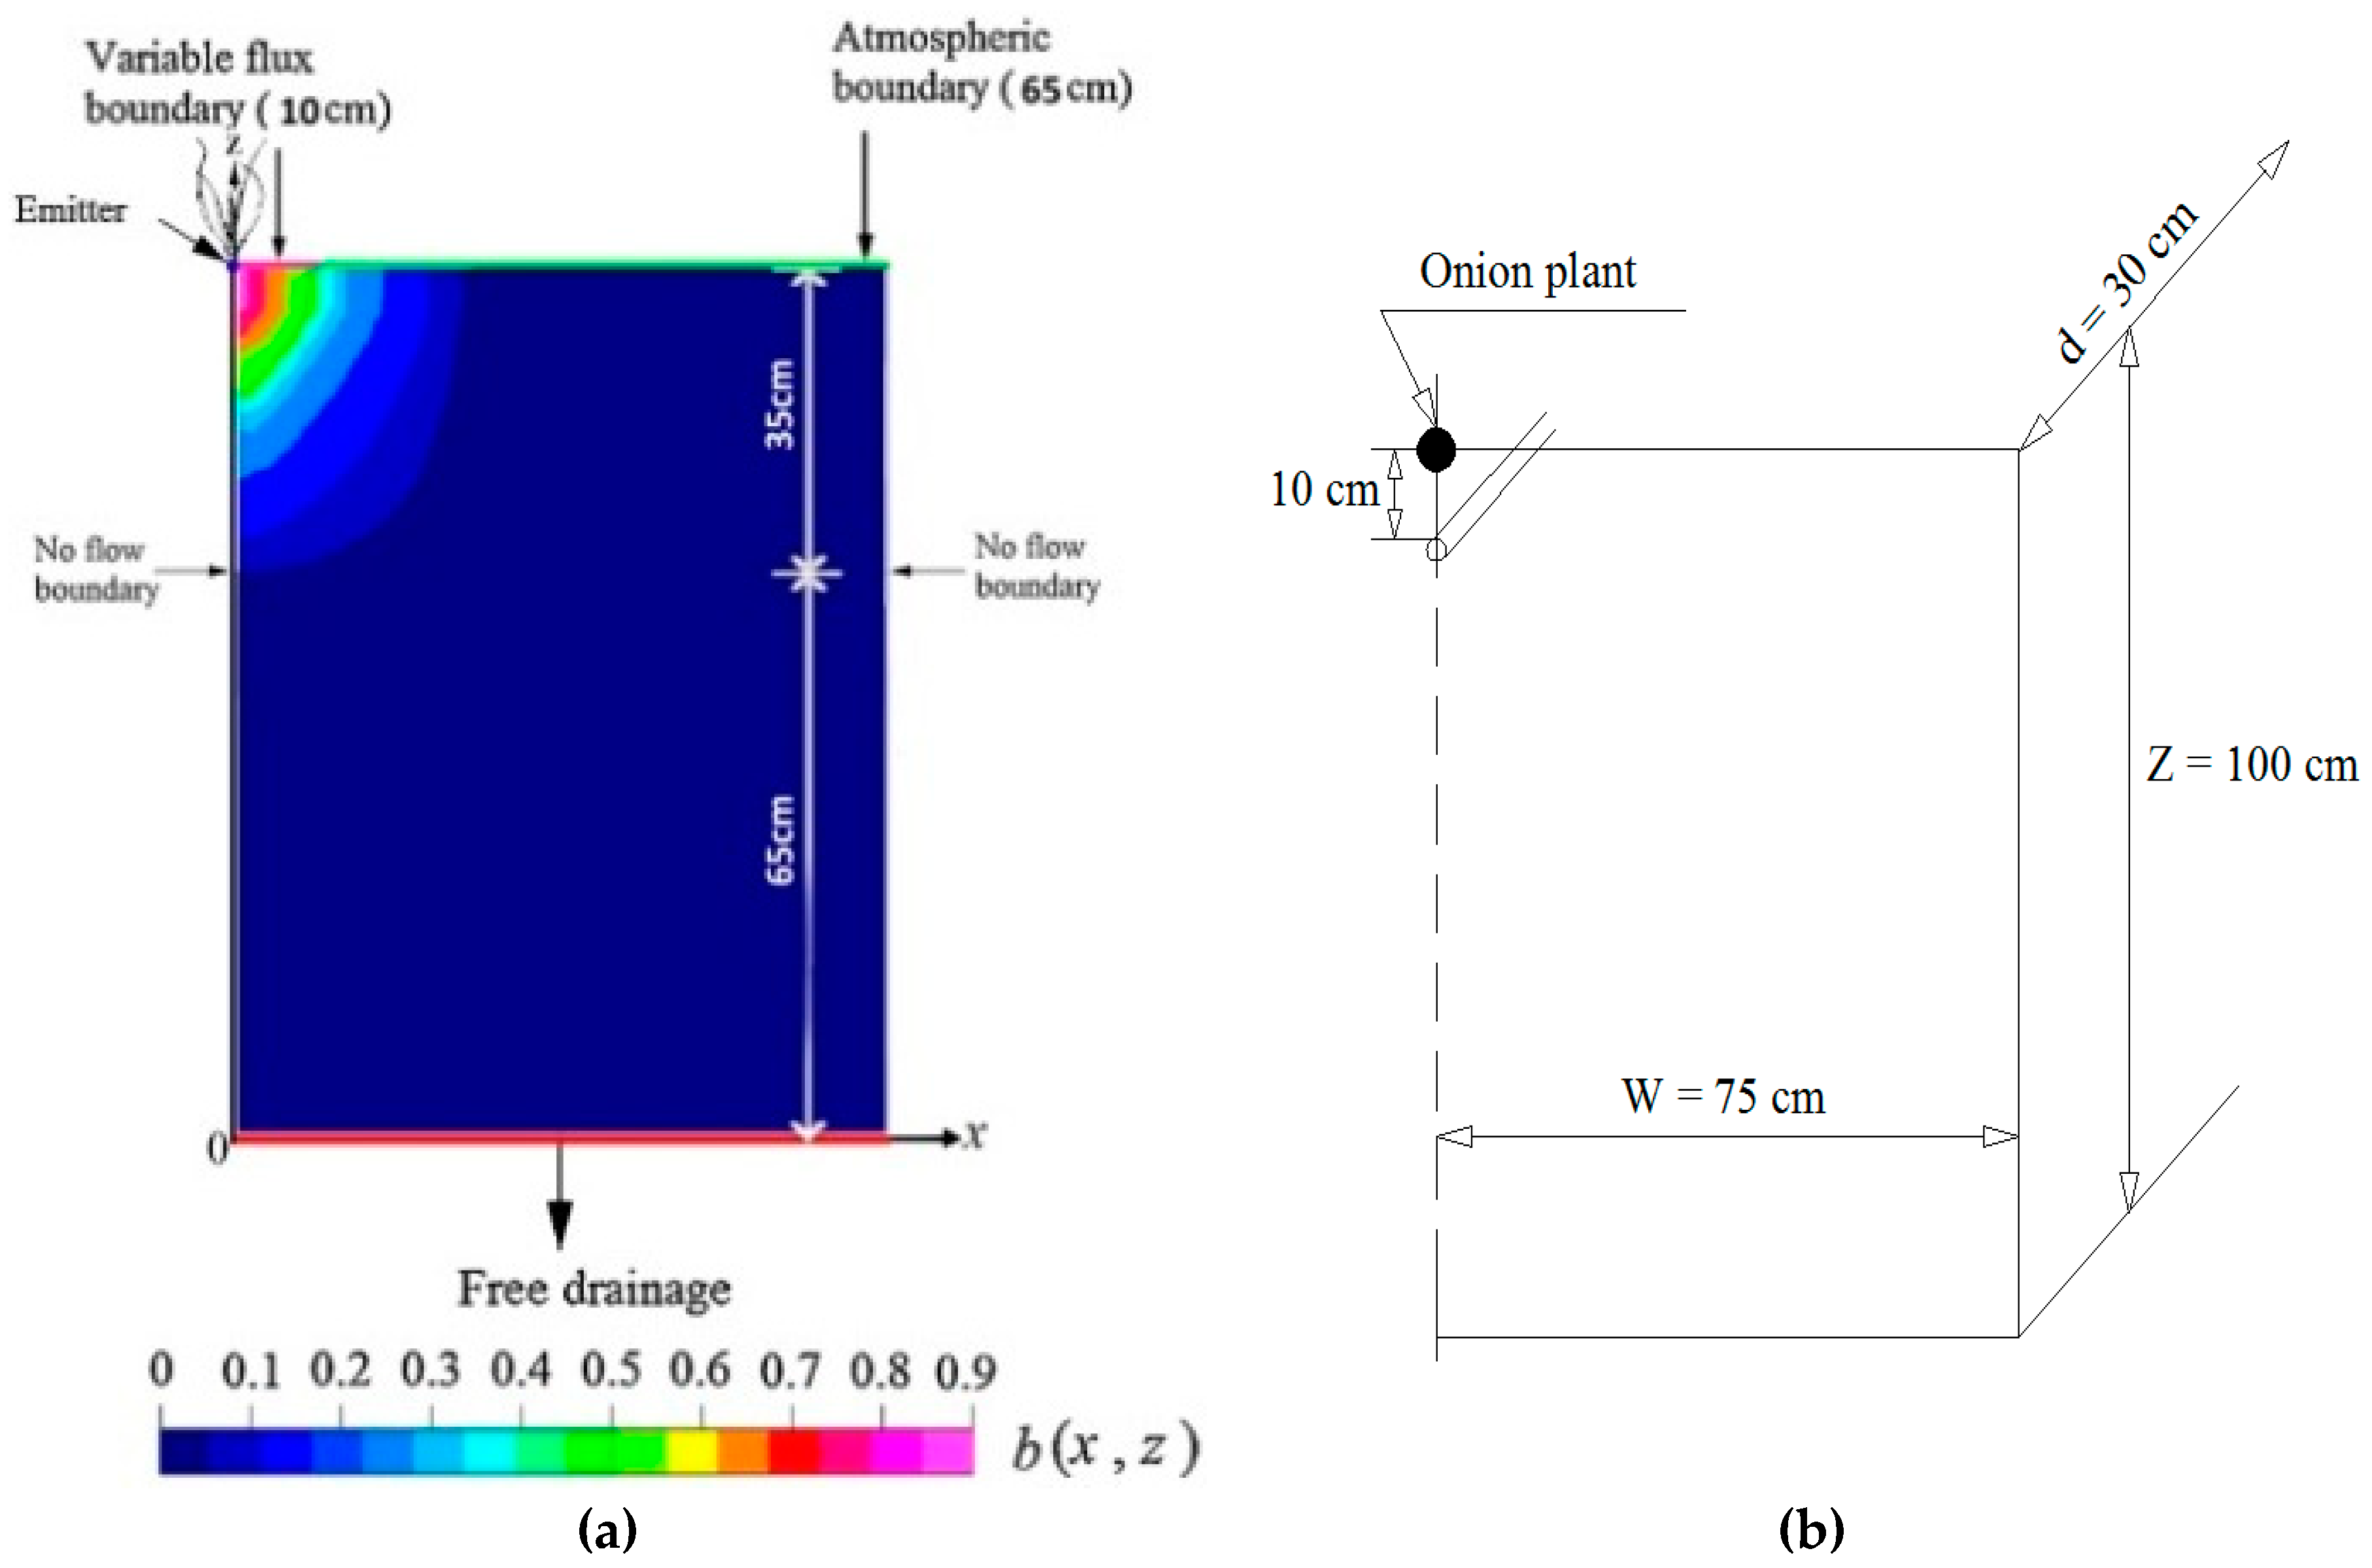
where is the soil water stress function (dimensionless), b(x, z) is the normalized root water uptake distribution (m−2) and its variation in the simulation domain is shown in Figure 1a, W is the width of the soil surface associated with the atmospheric boundary (m), and h is the pressure head (m). The evapotranspiration (ETc) is the resultant of the reference evapotranspiration (ET0) multiplied by the crop reference (KC) [18].
3. Materials and Methods
3.1. Study Area and Modeling Domain
The simulated domain represents the study area that was located in El-Amal village (30.85° N and 32.31° E) in El-Qantarah El-Sharqiyya, Ismailia, Egypt. The emitters was spaced 30 cm along the drip line while the distance between drip lines was 1.50 m (one drip line per plant row) and 10 cm below the ground surface. The simulated domain was 100 cm deep and 75 cm wide (from the emitter to the middle distance between rows (Figure 1b). Mesh refinement was carried out near the soil surface and the emitter, where the flux changes rapidly.
3.2. Urea Transformation
The partial differential equations governing two-dimensional advective-dispersive urea transport and transformations in variably saturated soils were determined by [19], applied for the one dimension by [20] are developed here for the two dimensions of the model as:
Urea, (NH2)2CO-N:
Ammonium, NH4-N:
Nitrate, NO3-N:
where subscript numbers 1, 2, and 3 represent urea, ammonium, and nitrate respectively while w and s is the liquid and solid phase of N. C is the concentration of N (M L−3) and ρ is soil bulk density (M L−3). Dx,x, Dz,z, and Dx,z are the components of the dispersion tensor (L2 T−1). qx and qz are the volumetric water flux components (L T−1) and µ represents the first-order transformation rate constant of N (T−1). µ’ is the first-order rate constant between urea and nitrate. is the zero order transformation rate constant of N (M L−3T−1). The dispersion coefficient in the liquid phase, D is given by , where is the molecular diffusion coefficient in free water (L2 T−1), is the tortuosity factor in the liquid phase and DL is the longitudinal dispersivity (L), and S(X, Z, T) is the passive root nutrient uptake.
The N transport parameter, longitudinal dispersivity (DL) as well as transformation parameters were assigned from the previous studies by [21,22,23,24,25] which is the first order rate constant of hydrolysis ranges between 0.30 and 0.80 day−1 was assigned 0.45 day−1. The volatilization process is neglected, therefore, the first-order decay coefficient assigned 0 day−1. The nitrification of ammonium to nitrate by the first order reactions was assigned 0.20 day−1 for both the liquid phase, and solid phase, . Mineralization which is presented by the zero order decay chain as and ranges from 0.001 to 0.04 g cm−3 day−1. While, the denitrification can be estimated by the first order decay chains as where are the rate constant of denitrification in the liquid and solid phases, the presented simulations did not account for any denitrification to occur because it was not measured either on the field or laboratory for the studied area. The adsorption process of ammonium was expressed by linear adsorption isotherm with a distribution coefficient, Kd that between the liquid and solid phase equals 3.5 cm3 g−1.
3.3. Model Setup and Parameters
Soil hydraulic parameters used in the model include θs, saturated volumetric water content, θr, residual volumetric moisture content, Ks, saturated hydraulic conductivity, and the parameters α (Alpha) (cm−1) and n, and l empirical fitting factors of the hydraulic function (Table 1).
Vrugt model [26] was used and parameters were assigned for onion crops as follows: z1m = 100 cm, x1m = 75 cm, = 0 cm and = 20 cm. Empirical coefficients pz and pr were assumed to be 1.0. The values of Feddes parameters were selected as follows: h1 = −10 cm, h2 = −25 cm, h3max = −450 cm, h3min = −550 cm and h4 = −8000 cm. Also, r2H and r2L were assigned to be 0.50, and 0.10 cm day−1.
The average annual precipitation is 37 mm while the average temperature equals 22.82 °C and the average annual relative humidity is 51.42 %. Other meteorological data for soil temperature, wind speed, and solar radiation were collected on April, 2016 from Ismailia station (30°36′0.00″ N, and 32°15′0.00″ E) [27]. The ETc was assigned constant during the simulation as 0.75 cm day−1 from the ET0 calculation by the Penman-Monteith equation (FAO-56 Method) and the crop coefficient Kc [18].
3.4. Irrigation and Fertigation Scenarios
Three emitter discharges 1.0 L h−1, 1.50 L h−1, and 2.0 L h−1 were assigned in the simulation while the drip tape with closely spaced emitters (30 cm) was assumed to be a uniform line source [28]. The daily flux [cm] is estimated by dividing the emitter discharges by the surface area of the drip tube (Q (L h−1) × 1000 × 24/10 × 30). Based on the recommendations of the local farmers’ practices, three fertigation strategies were considered as the following; strategy A with one-hour duration starts after the beginning of the irrigation cycle by 15 minutes, strategy B with one-hour duration ends 15 minutes before the end of the irrigation cycle and strategy C of one hour duration in the middle of the irrigation cycle. Simulations were conducted for 35 days, with a mid-growth stage of the green onion [29] while the efficiency of the drip system was 80%. Table 2 shows the irrigation system characteristics, while the 27th simulation scenarios are summarized in Table 3.
3.5. Initial and Boundary Conditions
The left vertical boundary was prescribed as having no flux because of the symmetry of the domain, and the free drainage boundary condition was assigned to the base of the soil domain because the 1.80 m depth of the groundwater is far from the root zone area. The atmospheric boundary condition was set at the top edge. The three emitter constant fluxes converted to no flux boundary when irrigation was terminated and the initial boundary condition is assigned in the form of water content that equals 0.25 cm3 cm−3. Longitudinal and transverse dispersivities were assigned to 5 cm and 0.5 cm, respectively, and the Cauchy boundary was used to prescribe the concentration flux at the top and bottom. Both right and left vertical sides of the domain were assigned with a no flux boundary condition. The applied urea concentration was 2 mg cm−3 and there is no initial concentration of urea, ammonium, and nitrate at the start of the simulation.
4. Results and Discussion
4.1. Soil Moisture Content Distribution
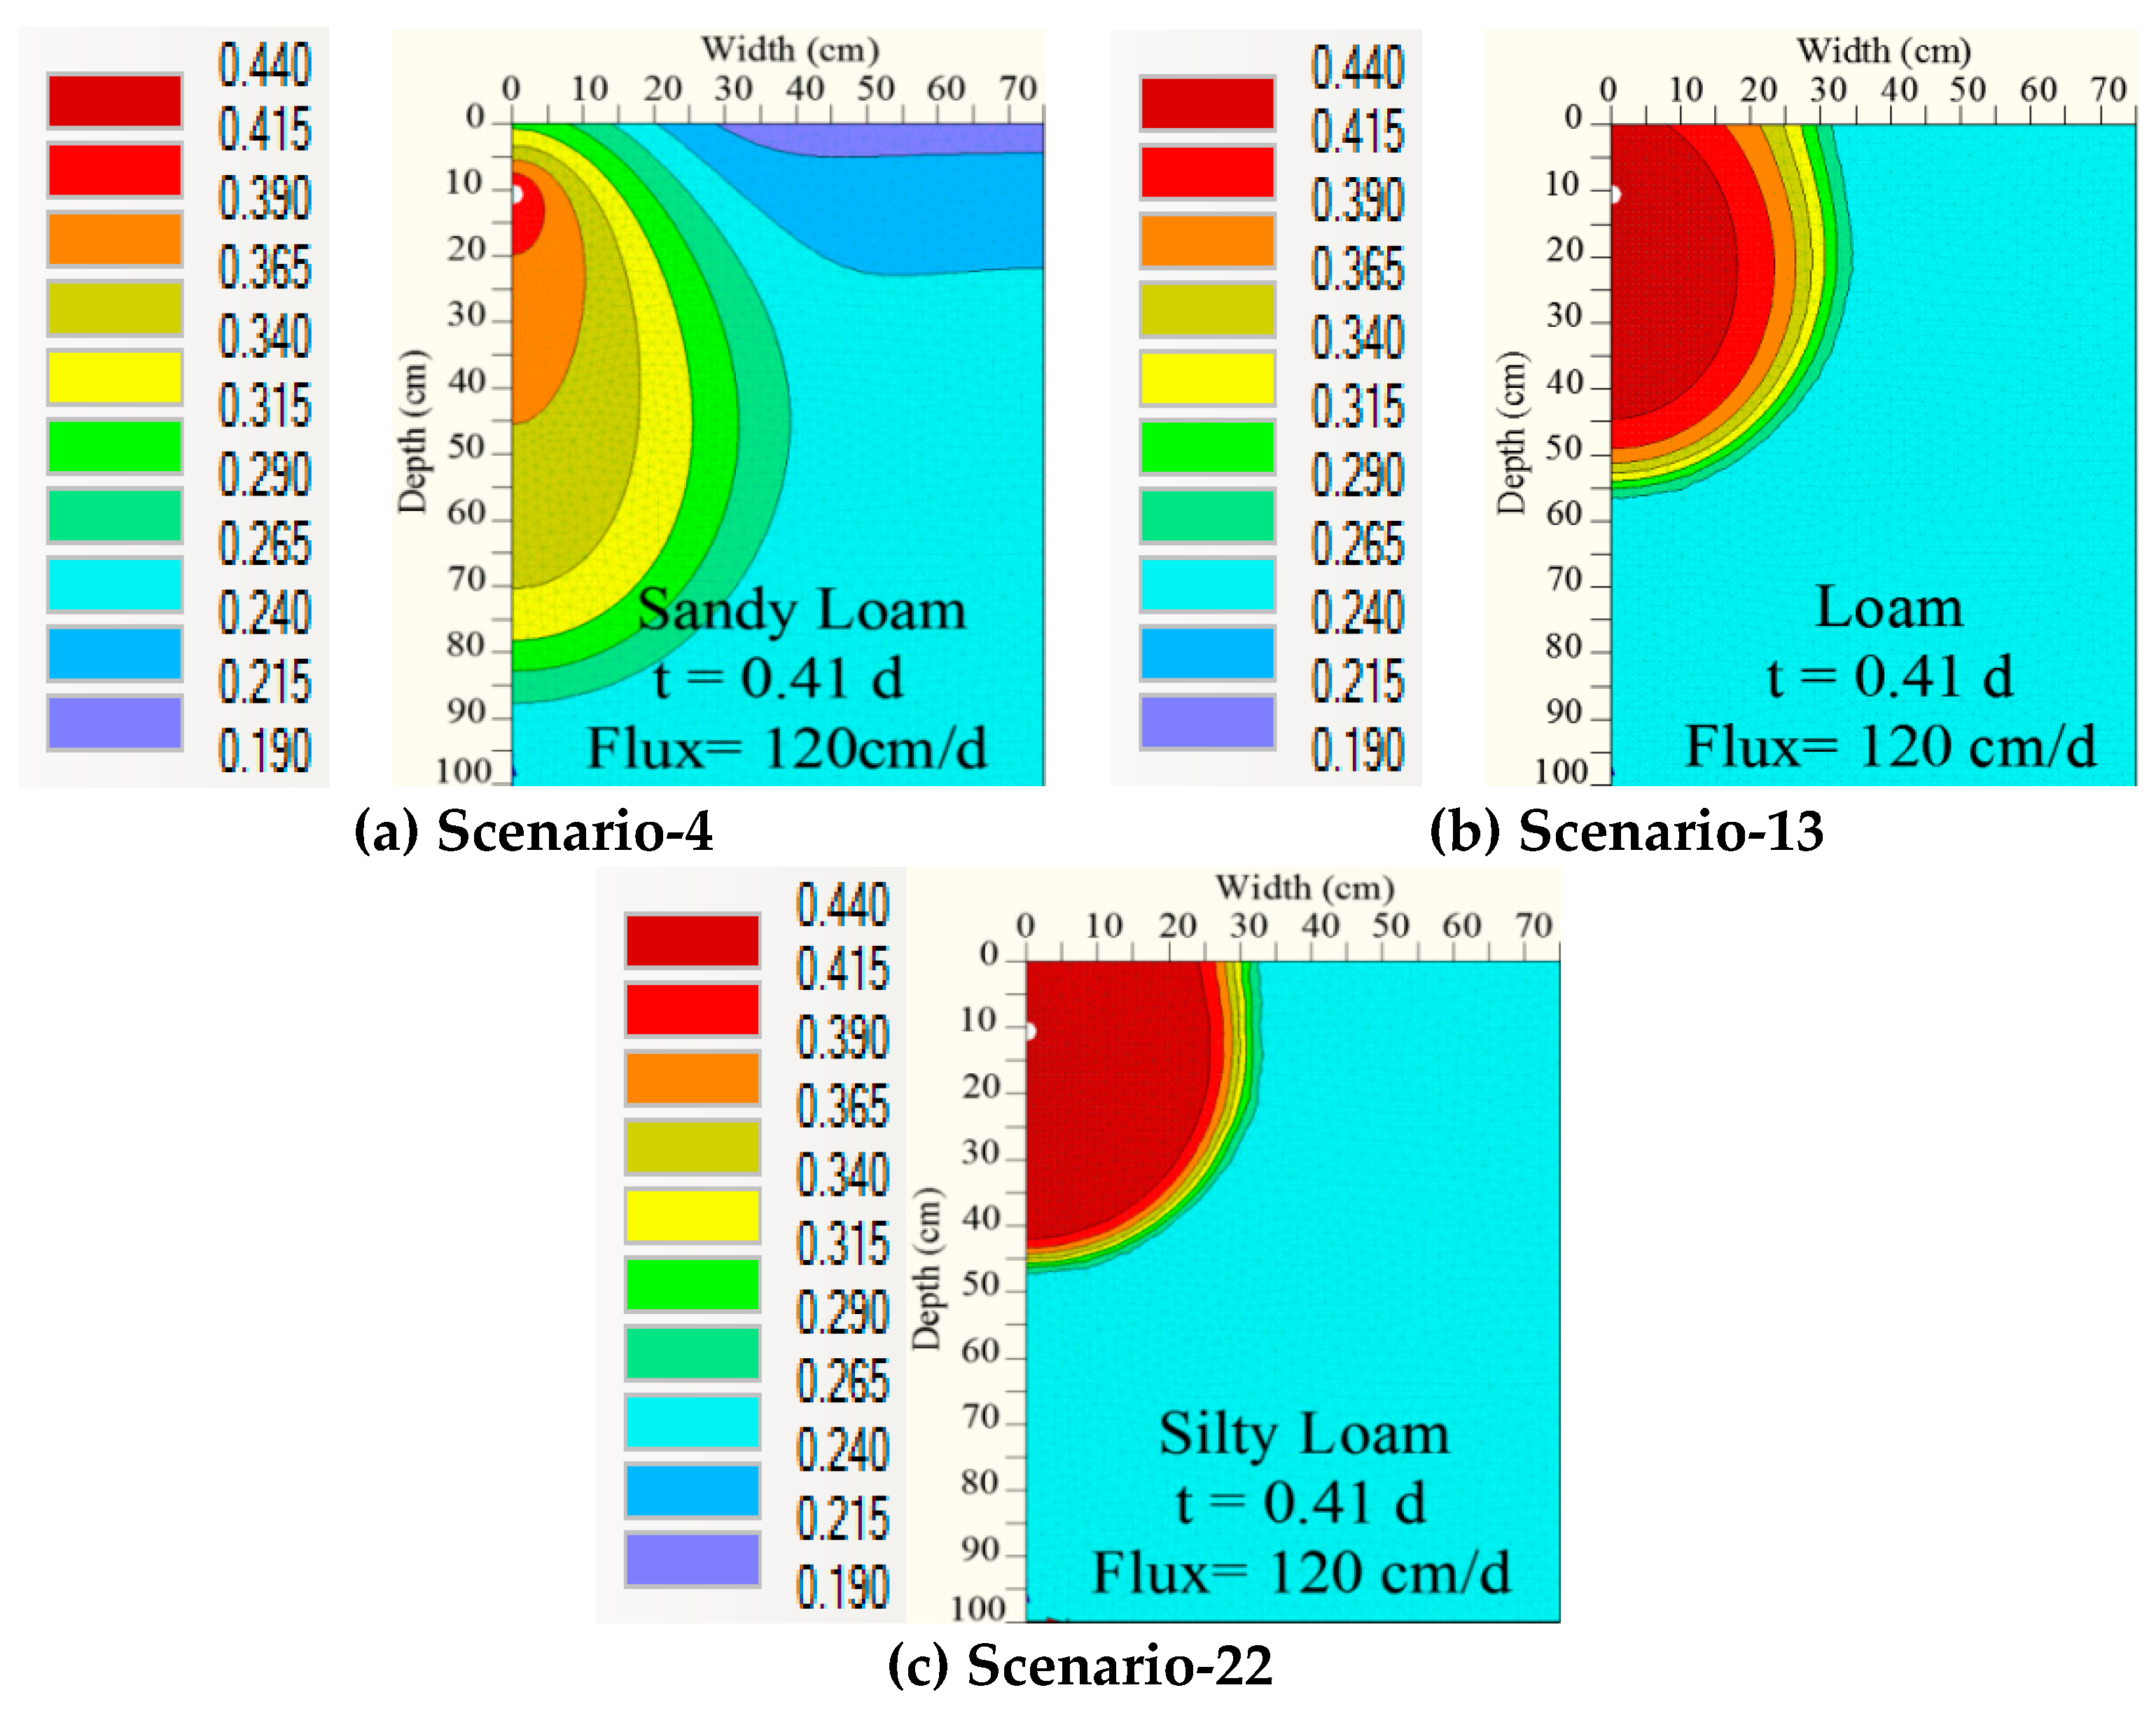
At the beginning of the irrigation each event, the soil moisture content started to increase close to the emitter until it reached the maximum by the end of the irrigation event, while the moisture content decreased as the distance from the emitter increased. After the termination of the irrigation cycle (redistribution stage), the flow of the water to the deeper depths depends on the soil hydraulic conductivity [30] and sequential wetting and drying cycles occurred during the irrigation, and recumbent time respectively. The wetted area almost reached the entire domain for the sandy soil when the emitter discharge equals 1.5 L h−1 and moisture content recorded 0.408 cm3 cm−3 around the emitter while the lateral and vertical components of the wetted area were 32 cm and 56 cm in loam soil and 27 and 44 cm in silty loam (Figure 2a–c). The wetted depth was larger in sandy loam soil than in loam and silty loam because sandy loam is characterized by a low water holding capacity compared to loam, and silty loam [31]. The wetted zone has a semi-ellipsoidal shape in sandy loam while it was almost hemispherical in loam (Figure 3). Although the θi is the same, moisture content was higher in silty loam close to the emitter than in loam or sandy loam. It was 0.450, 0.430, 0.398 cm3 cm−3 for silty loam, loam, and sandy loam at 0.65 days. The root distribution parameters are the same in the simulation, so the significant factor is the gravity and capillary force in coarse-textured soil, and fine textured soil, respectively [32].
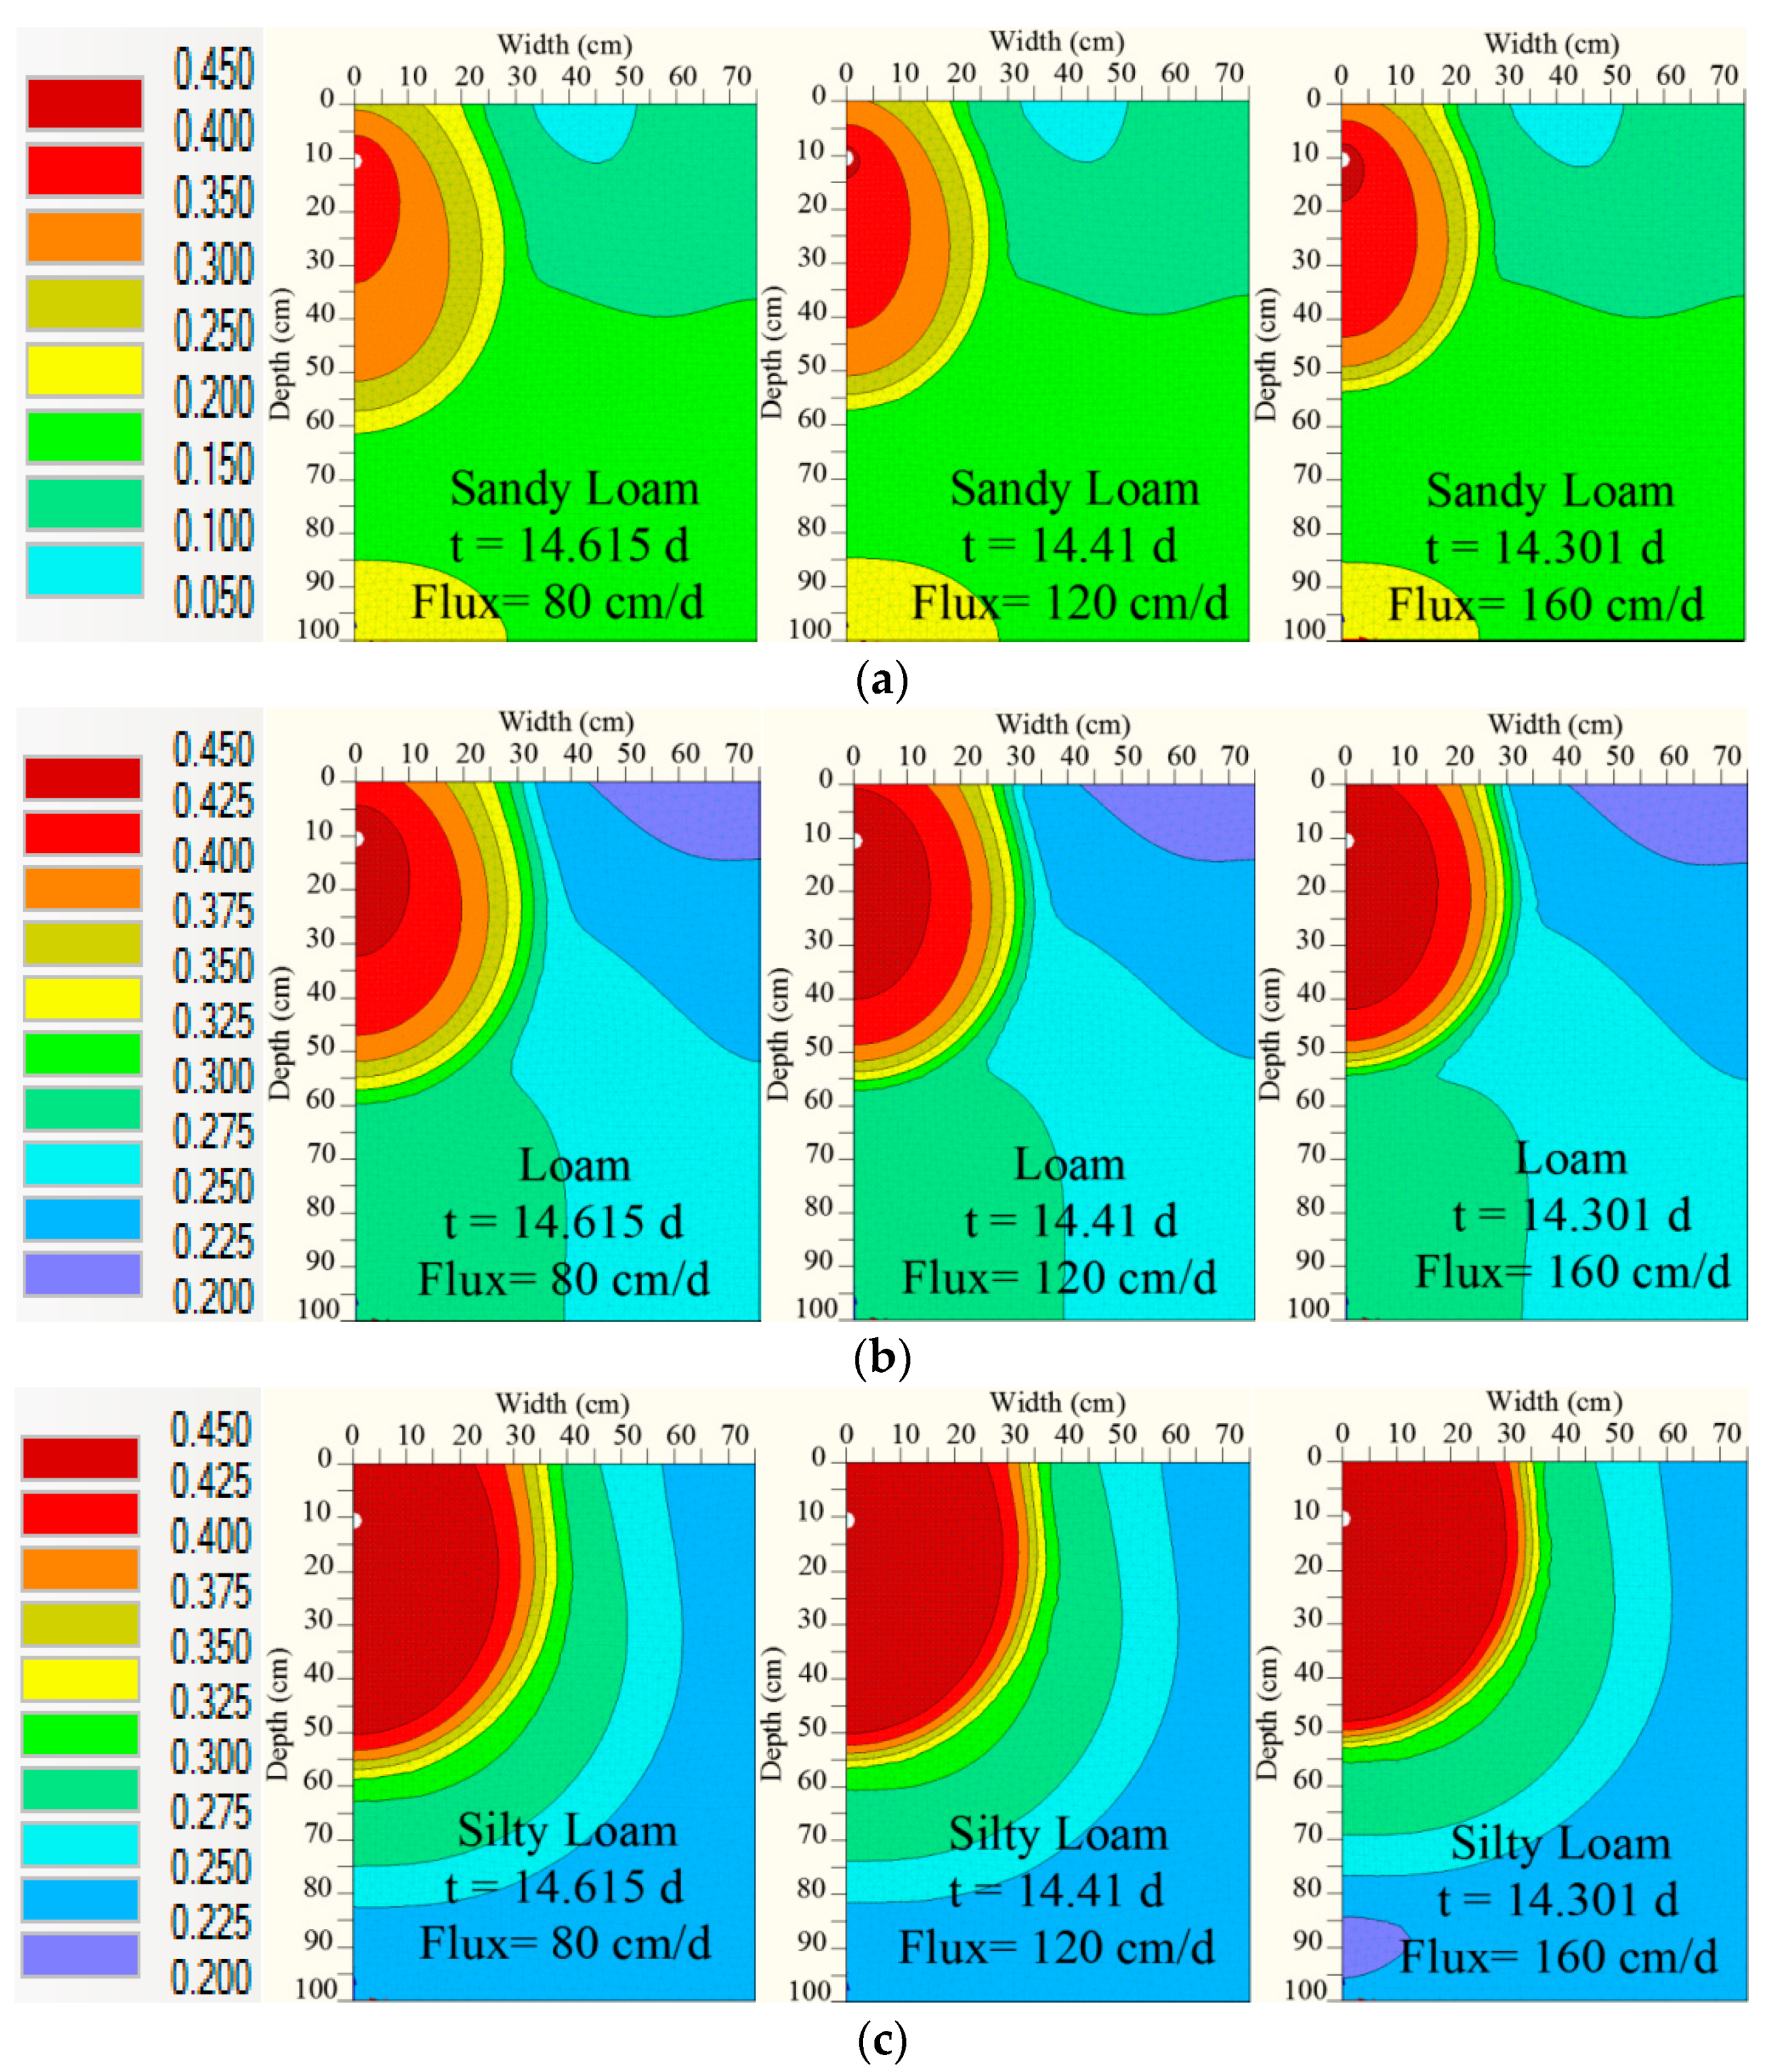
Where the 1.0 L h−1 emitter discharge has longer irrigation duration than 1.50 L h−1 and 2.0 L h−1, the wetted area was slightly larger for emitter discharge 1.0 L h−1 than for 1.50 L h−1 and 2.0 L h−1. For sandy loam soil, the maximum moisture content around the emitter increased from 0.398 cm3 cm−3 to 0.410 cm3 cm−3 with the increase of the emitted flux from 1.0 L h−1 to 2.0 L h−1 (Figure 3a). For loam and silty loam, the maximum moisture content remains constant at 0.430 cm3 cm−3, and 0.450 cm3 cm−3 respectively (Figure 3b,c). That means the emitter discharge effect is significant only for the coarse-textured soil [33] and the high discharge (2.0 L h−1) is more suitable for the shallow-rooted crops [34].
4.2. Root Water Uptake
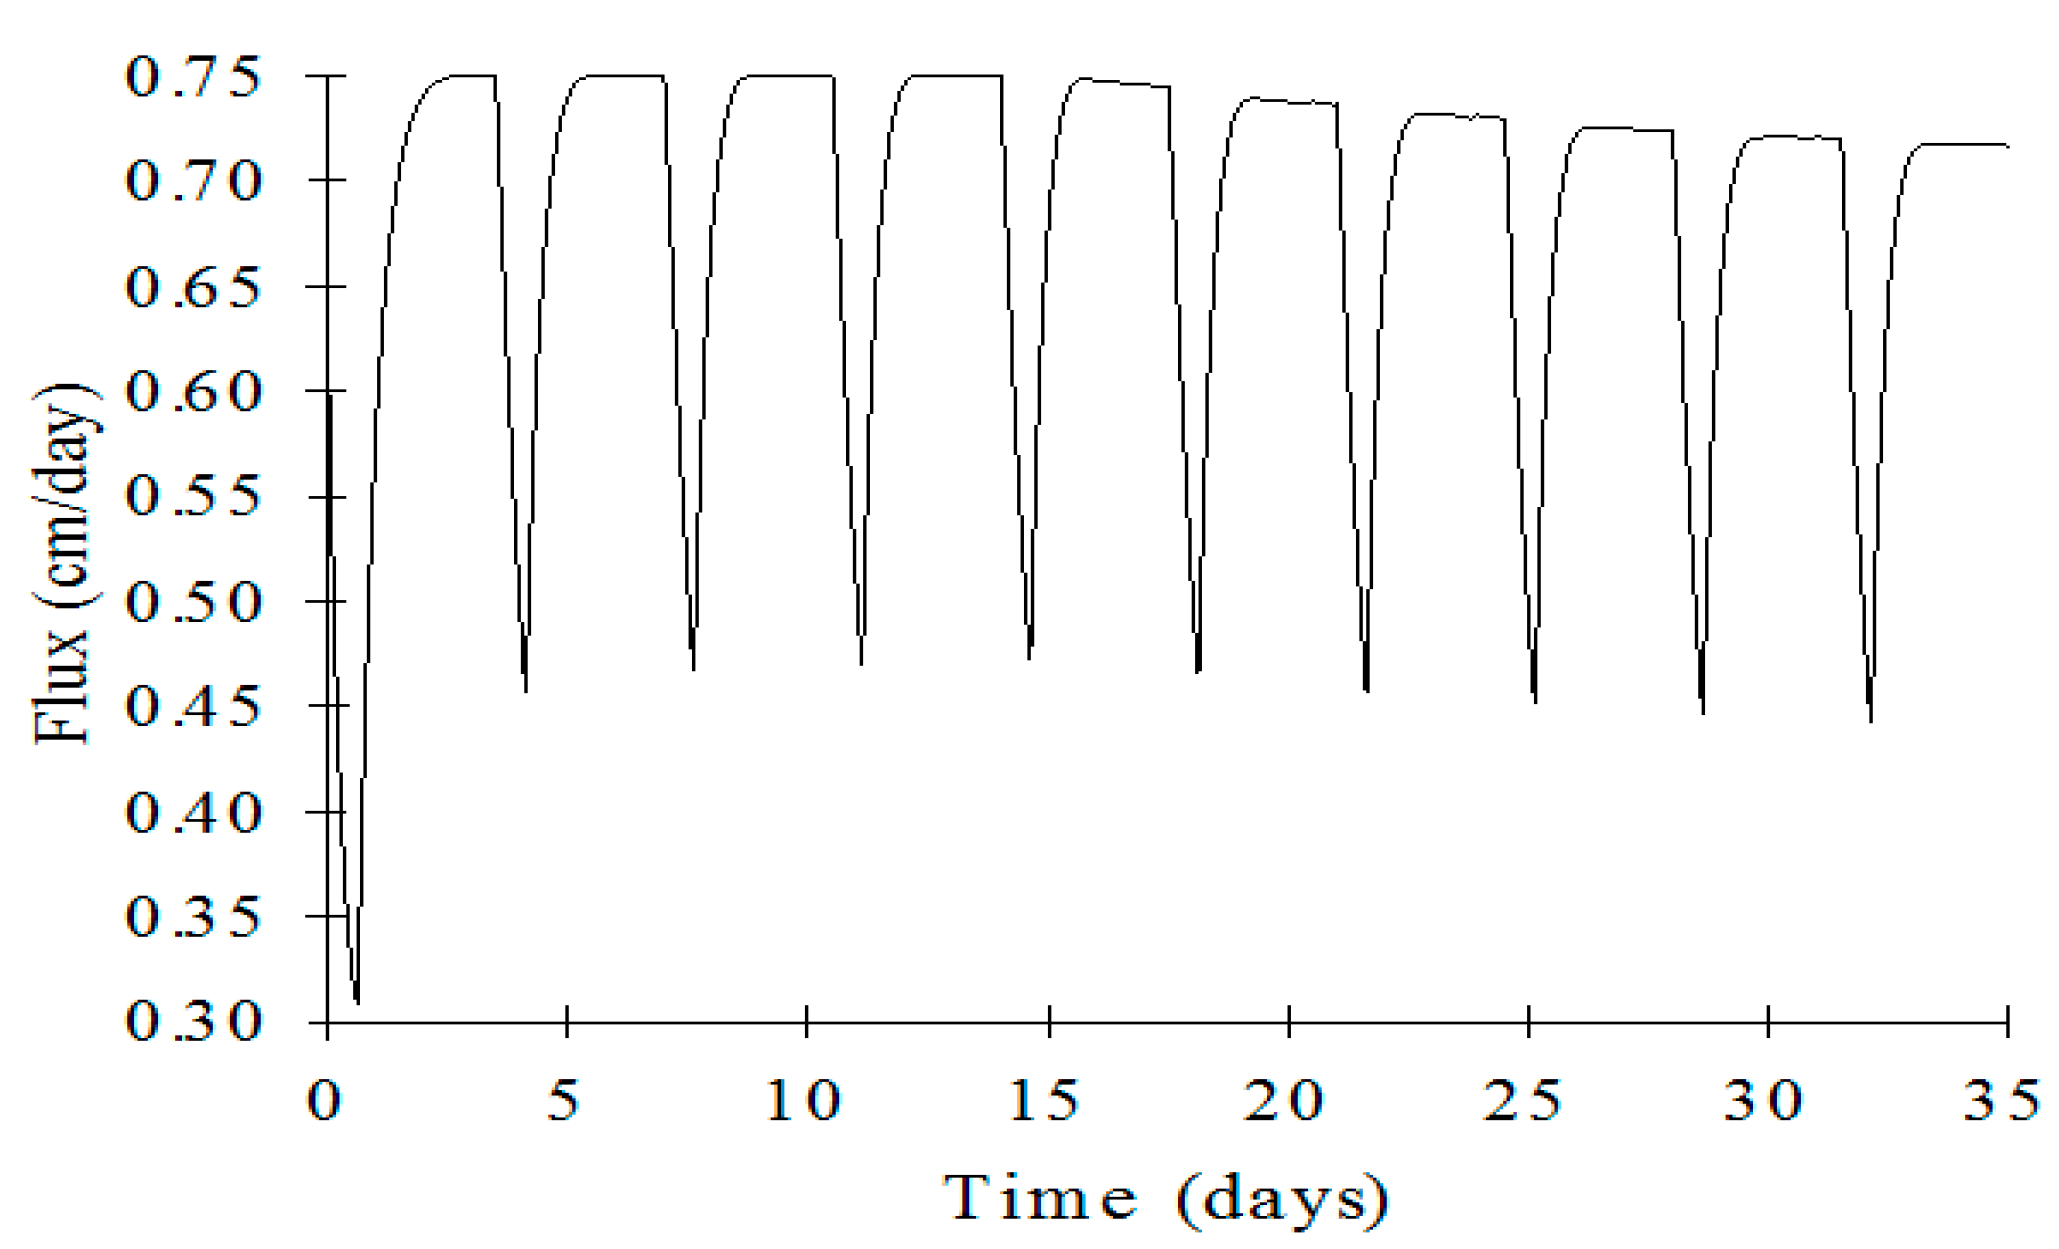
As far as extinct of the wetted zone in both lateral (particularly in silty loams oil) and vertical (particularly in sandy loam soil) directions, the spatial distribution of the pressure head is the same behavior of moisture content distribution. The available water for plant uptake is lower in sandy loam than in loam, and silty loam. This is attributed to the relatively low saturated hydraulic conductivity and capillary forces for the silty loam soil than the sandy loam where the lateral pressure head gradients are relatively high, in contrary of sandy loam soil with high saturated conductivity and small capillary forces, where gravity has a stronger effect [35]. Whilst the root water uptake is lower in sandy loam than in loam, and silty loam, the flux decreased from 0.75 cm day−1 to 0.71 cm day−1 between the first and final irrigation cycle for sandy loam soil and it remains constant for loam and silty loam soil. The sudden linear drop in the root water uptake fluxes has occurred between irrigation cycles, (when the emitters are off) (Figure 4) where this reduction factor ∝(h) recorded about 60% of the available water in case of sandy loam soil and 70%, and 82% for the loamy and silty loam soil, respectively. These stresses are due to the dry and wet conditions that reduce the water uptake, the more frequent drying and wetting cycles, and the extra added stress that is functionally proposed by [17]. Regardless of the soil type, the cumulative root water uptake linearly increased with the increase of emitter discharge (Table 4). This only occurred when the increase in discharge flow rate was higher than the drainage flux. This led to an increase in soil water storage which became available for the plant to uptake. The recorded increase of the cumulative emitter flux between 1 and 2 L h−1 are 41.4 cm3, 33.2 cm3, and 26 cm3 for silty loam, loam, and sandy loam respectively and the corresponding cumulative drainage fluxes are also shown in Table 4.
4.3. Effect of Fertigation Strategies on Nutrient Distribution
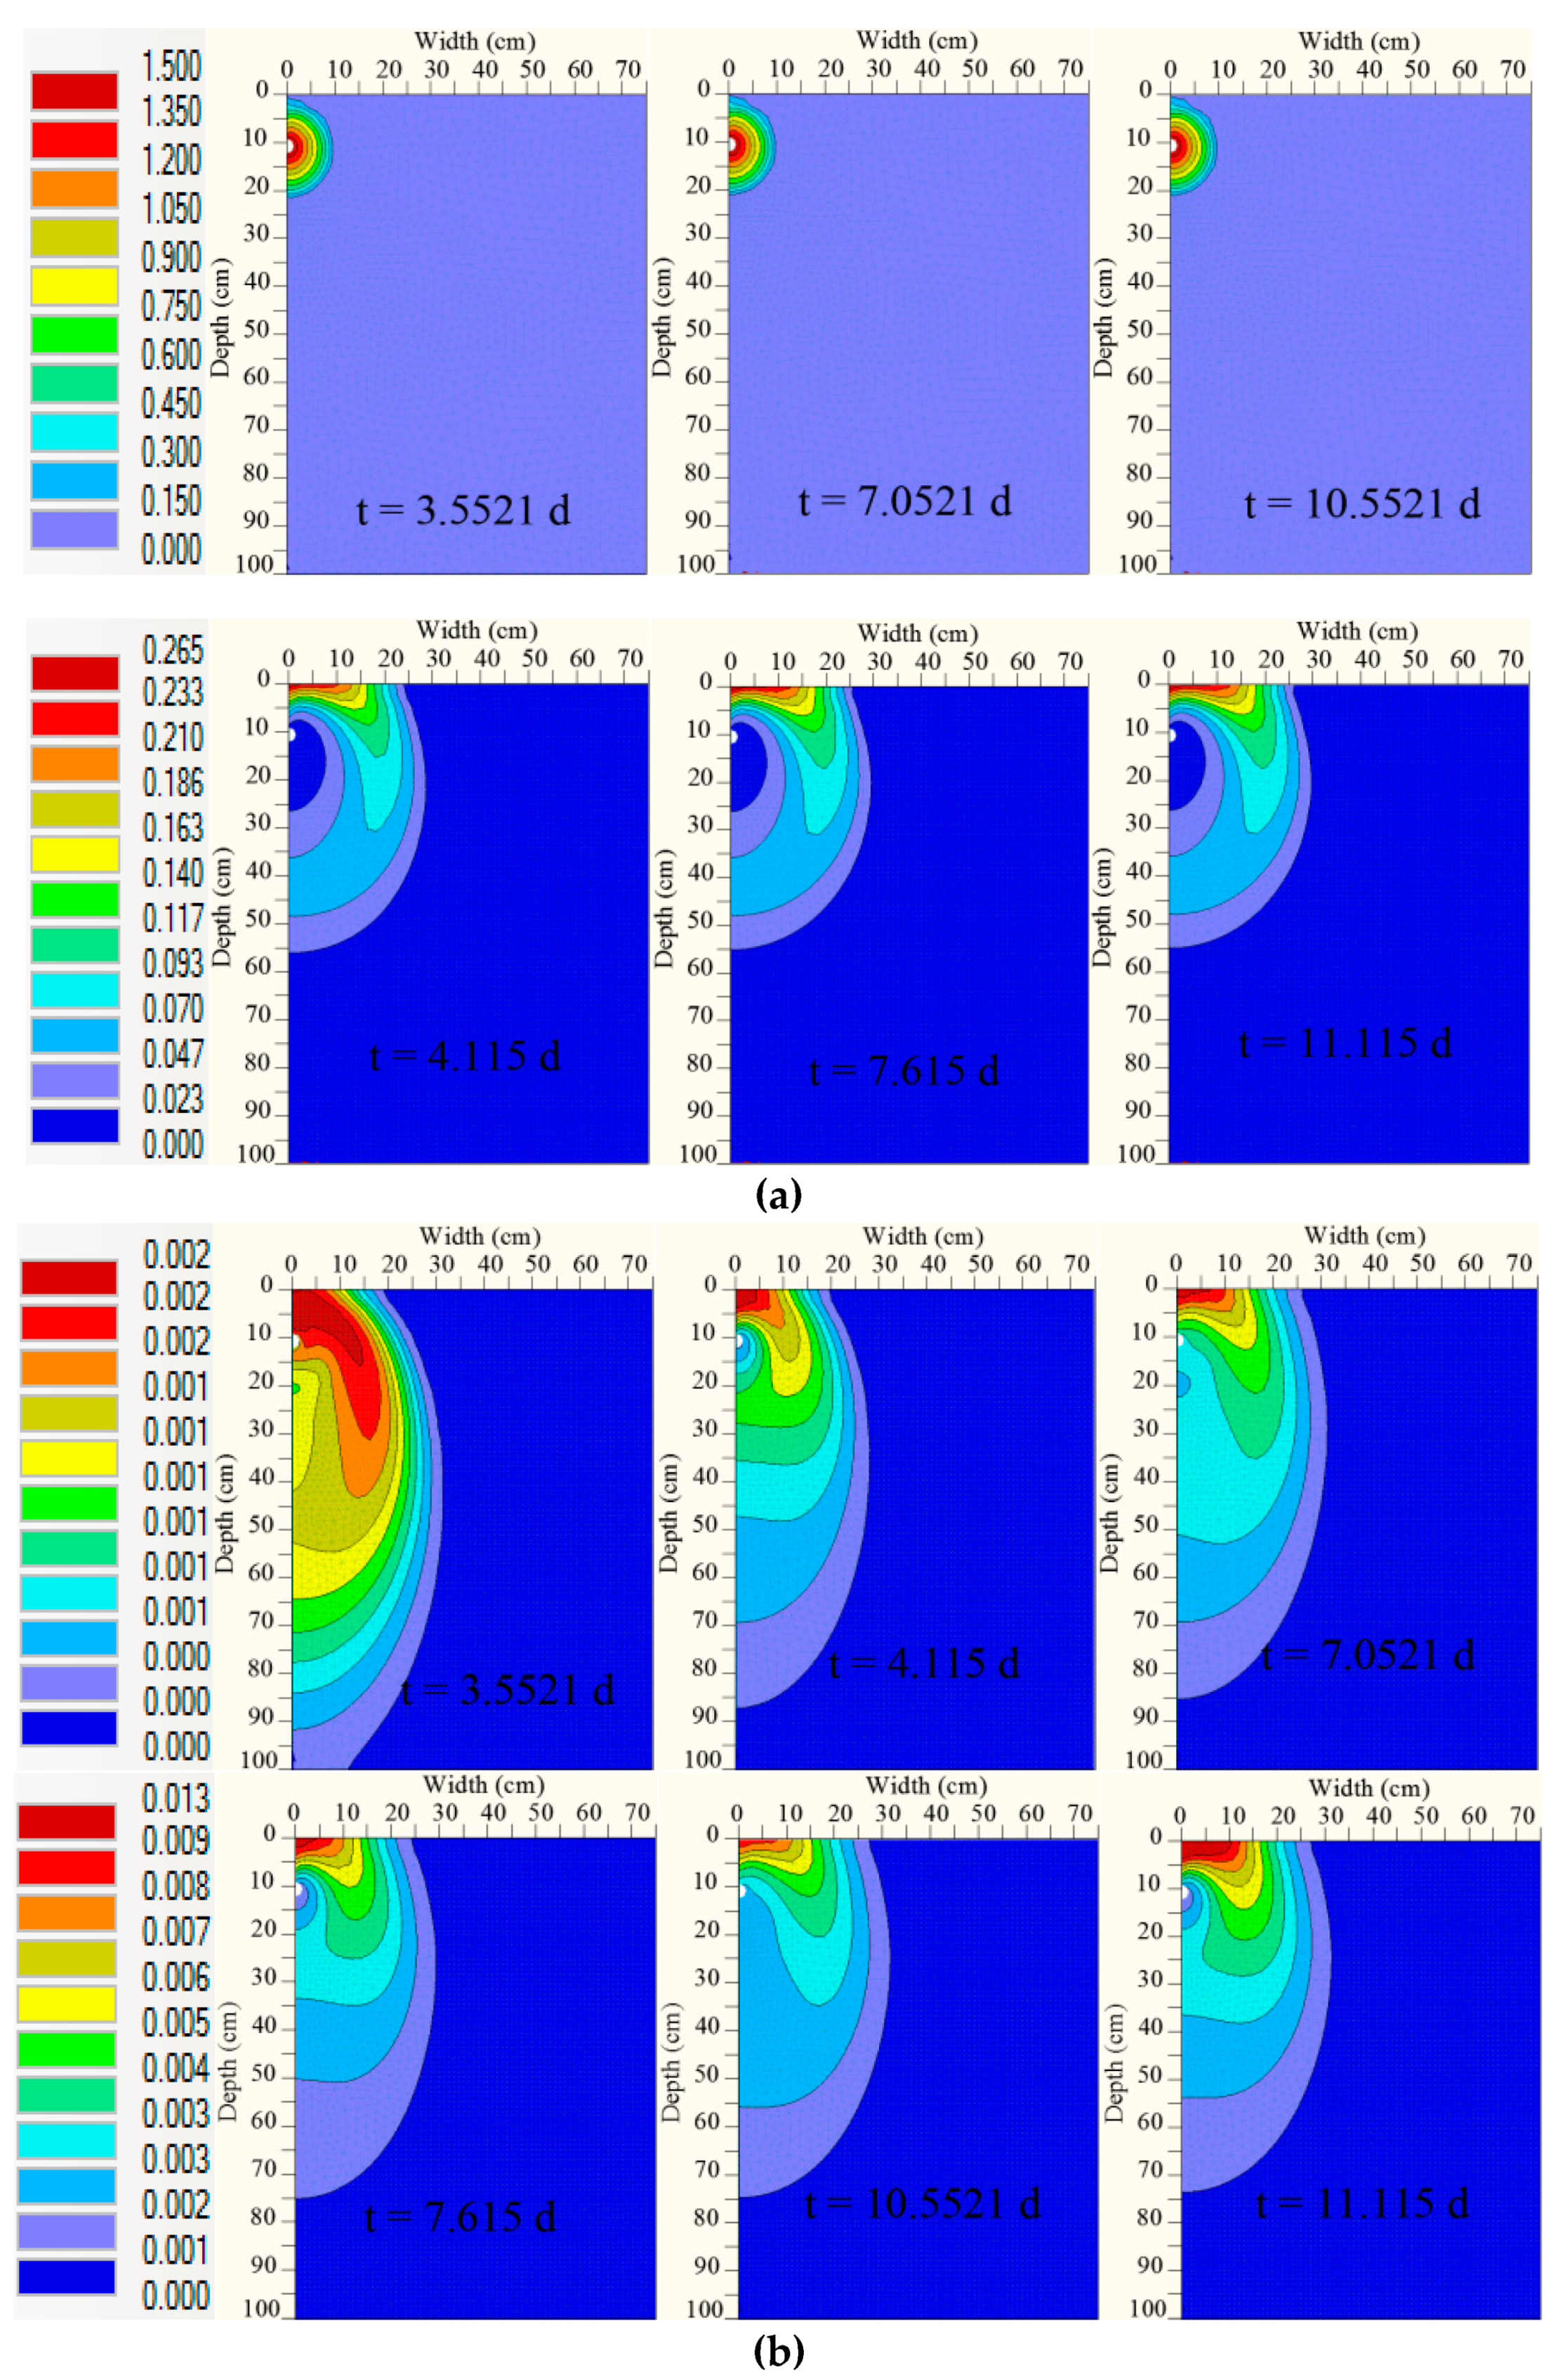
Fertigation strategy (A): Urea concentrations are observed along the periphery of the wetted area with little or no concentrations near the drip line except immediately at fertigation application (t = 0.05, 3.55, 7.05 days, etc.) (Figure 5a). There is no accumulation of urea concentrations in the soil profile and the concentrations are only decreased with the time between irrigations as a result of hydrolysis [22].
Ammonium was remained concentrated in the immediate vicinity of the drip line all times because of the root uptake that makes the maximum concentration to be at the top of the plume. A slight downward is obtained because of soil adsorption and the recorded ammonium concentrations were minimal because of the subsequent fast nitrification process (Figure 5b).
Nitrate moved continuously downwards as it is not absorbed, whereas denitrification was assumed to be negligible. By the start of the irrigation cycle, the nitrate concentration was increased, and this was a result of the nitrification of ammonium. For example, maximum nitrate concentrations increased from 0.002 mg cm−3 to 0.043 mg cm−3, from 0.023 mg cm−3 to 0.145 mg cm−3 and from 0.076 mg cm−3 to 0.223 mg cm−3 among the periods between 0.6 days and 3.5 days, between 4.1 days and 7.0 days, and between 7.6 days and 10.5 days respectively. Nitrate concentrations were decreased near the drip line among irrigation cycles due to the redistribution and root uptake [22,36]. For example, the maximum concentration decreased from 0.041 to 0.023 mg cm−3, from 0.145 to 0.076 mg cm−3 and from 0.222 to 0.138 mg cm−3 among the periods 3.5–4.1 days, 7–7.6 days, and 10.5–11.2 days. At the last irrigation cycle, nitrate concentration recorded 0.066 mg cm−3.
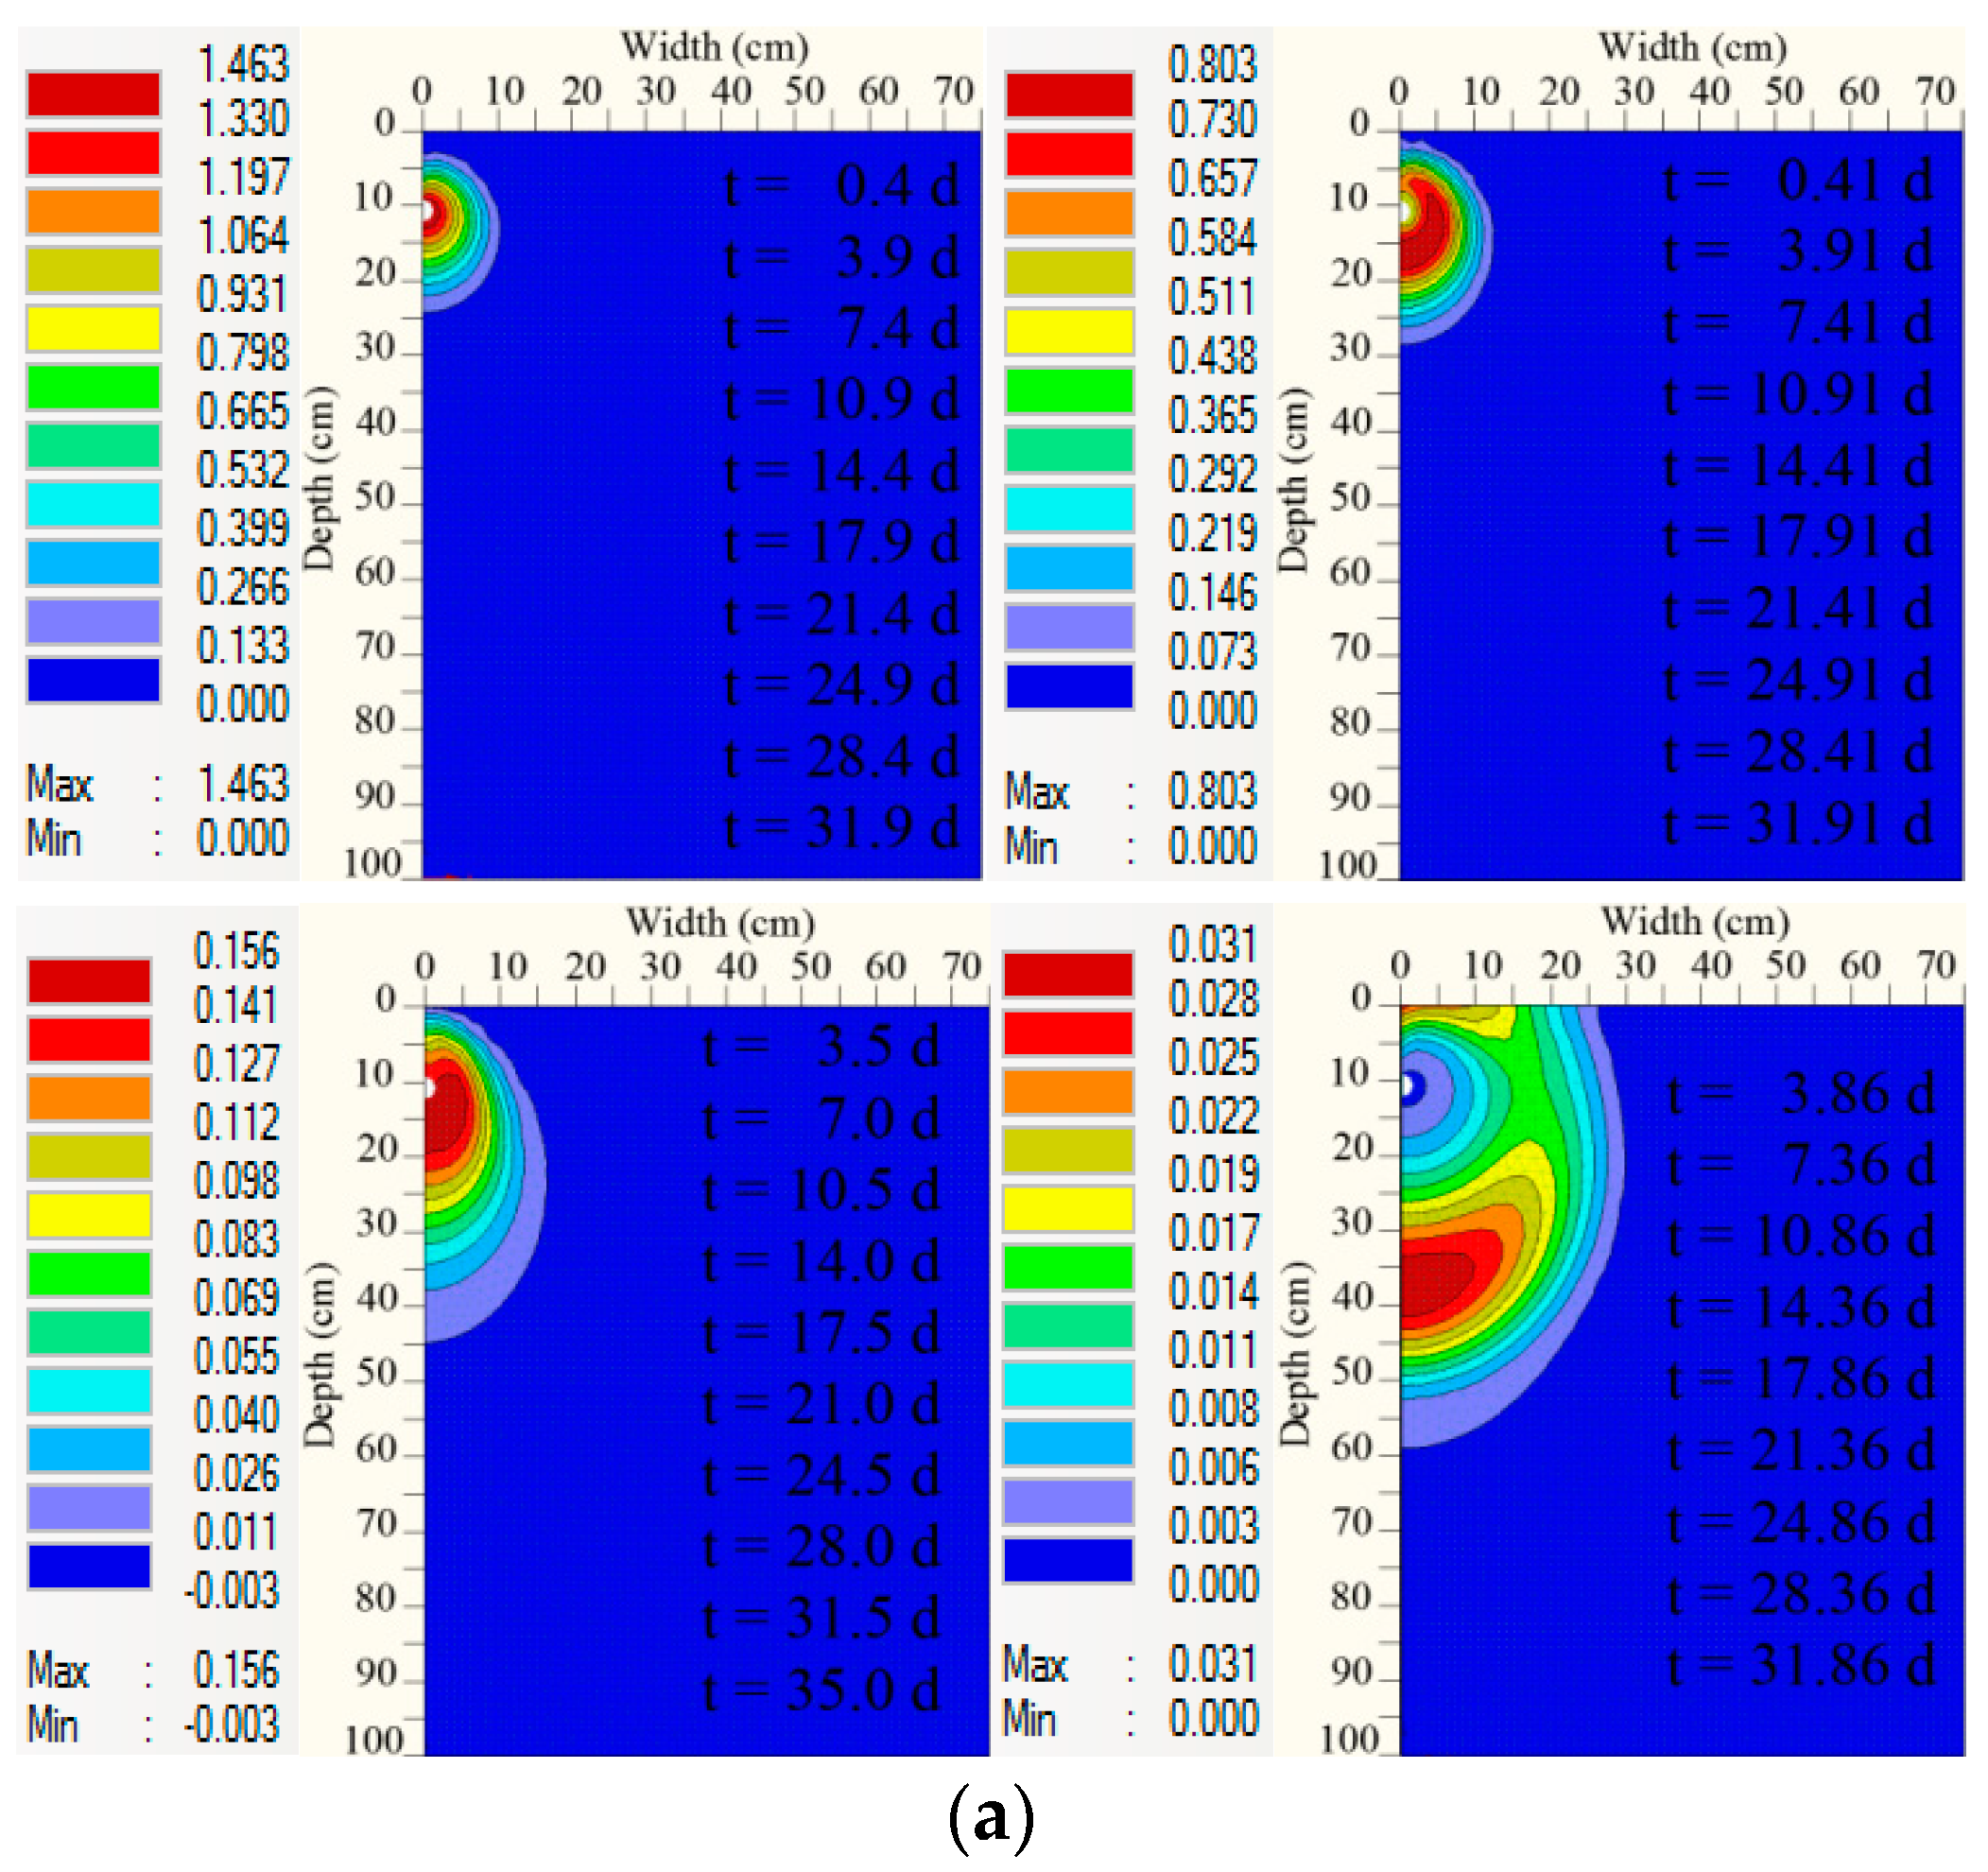
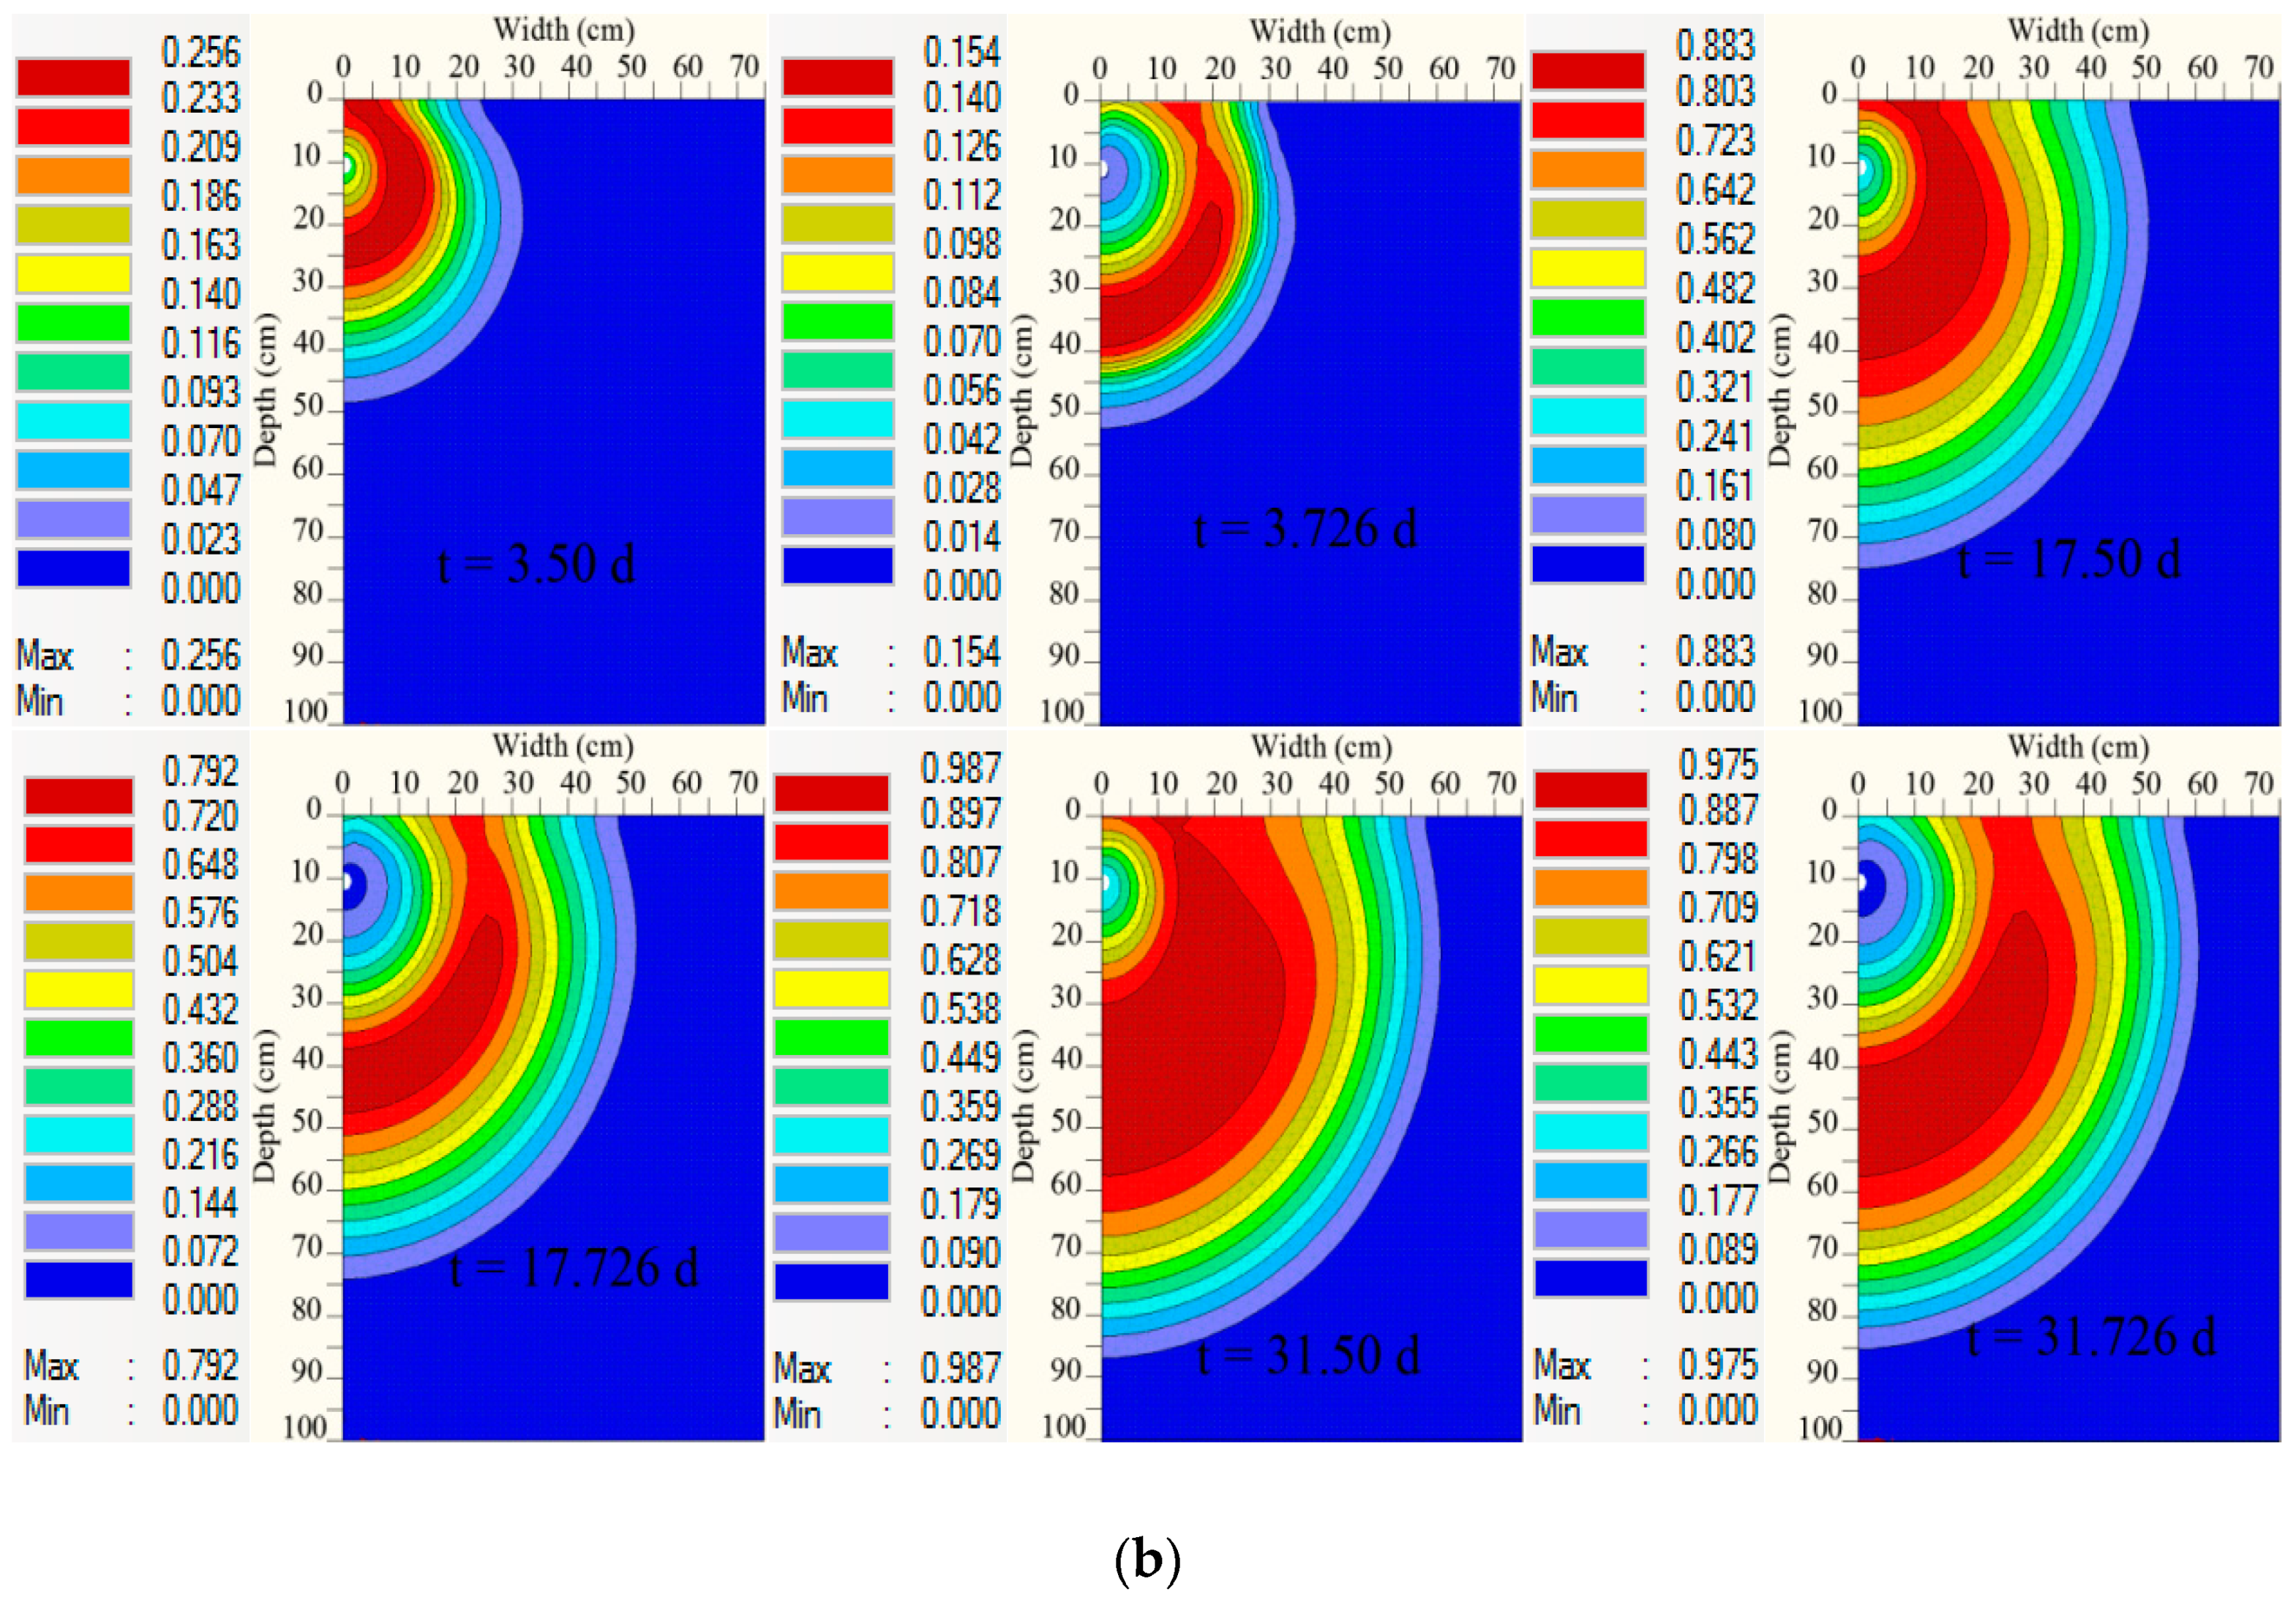
Fertigation strategy (B): The maximum urea concentration was near the drip line between the urea application and the next irrigation cycle. It moves downward far away from the drip line between the irrigation cycle and just before the start of the next fertigation (Figure 6). For nitrate, no observed concentrations are recorded during the first irrigation cycle, while a noticeable concentration was obtained after applying the second irrigation cycle while the nitrification process was still taking place. The maximum nitrate concentration was observed near the emitter before starting the next irrigation cycle. Nitrate concentrations of this strategy were higher than those of the (A) fertigation strategy for all time intervals of analysis.
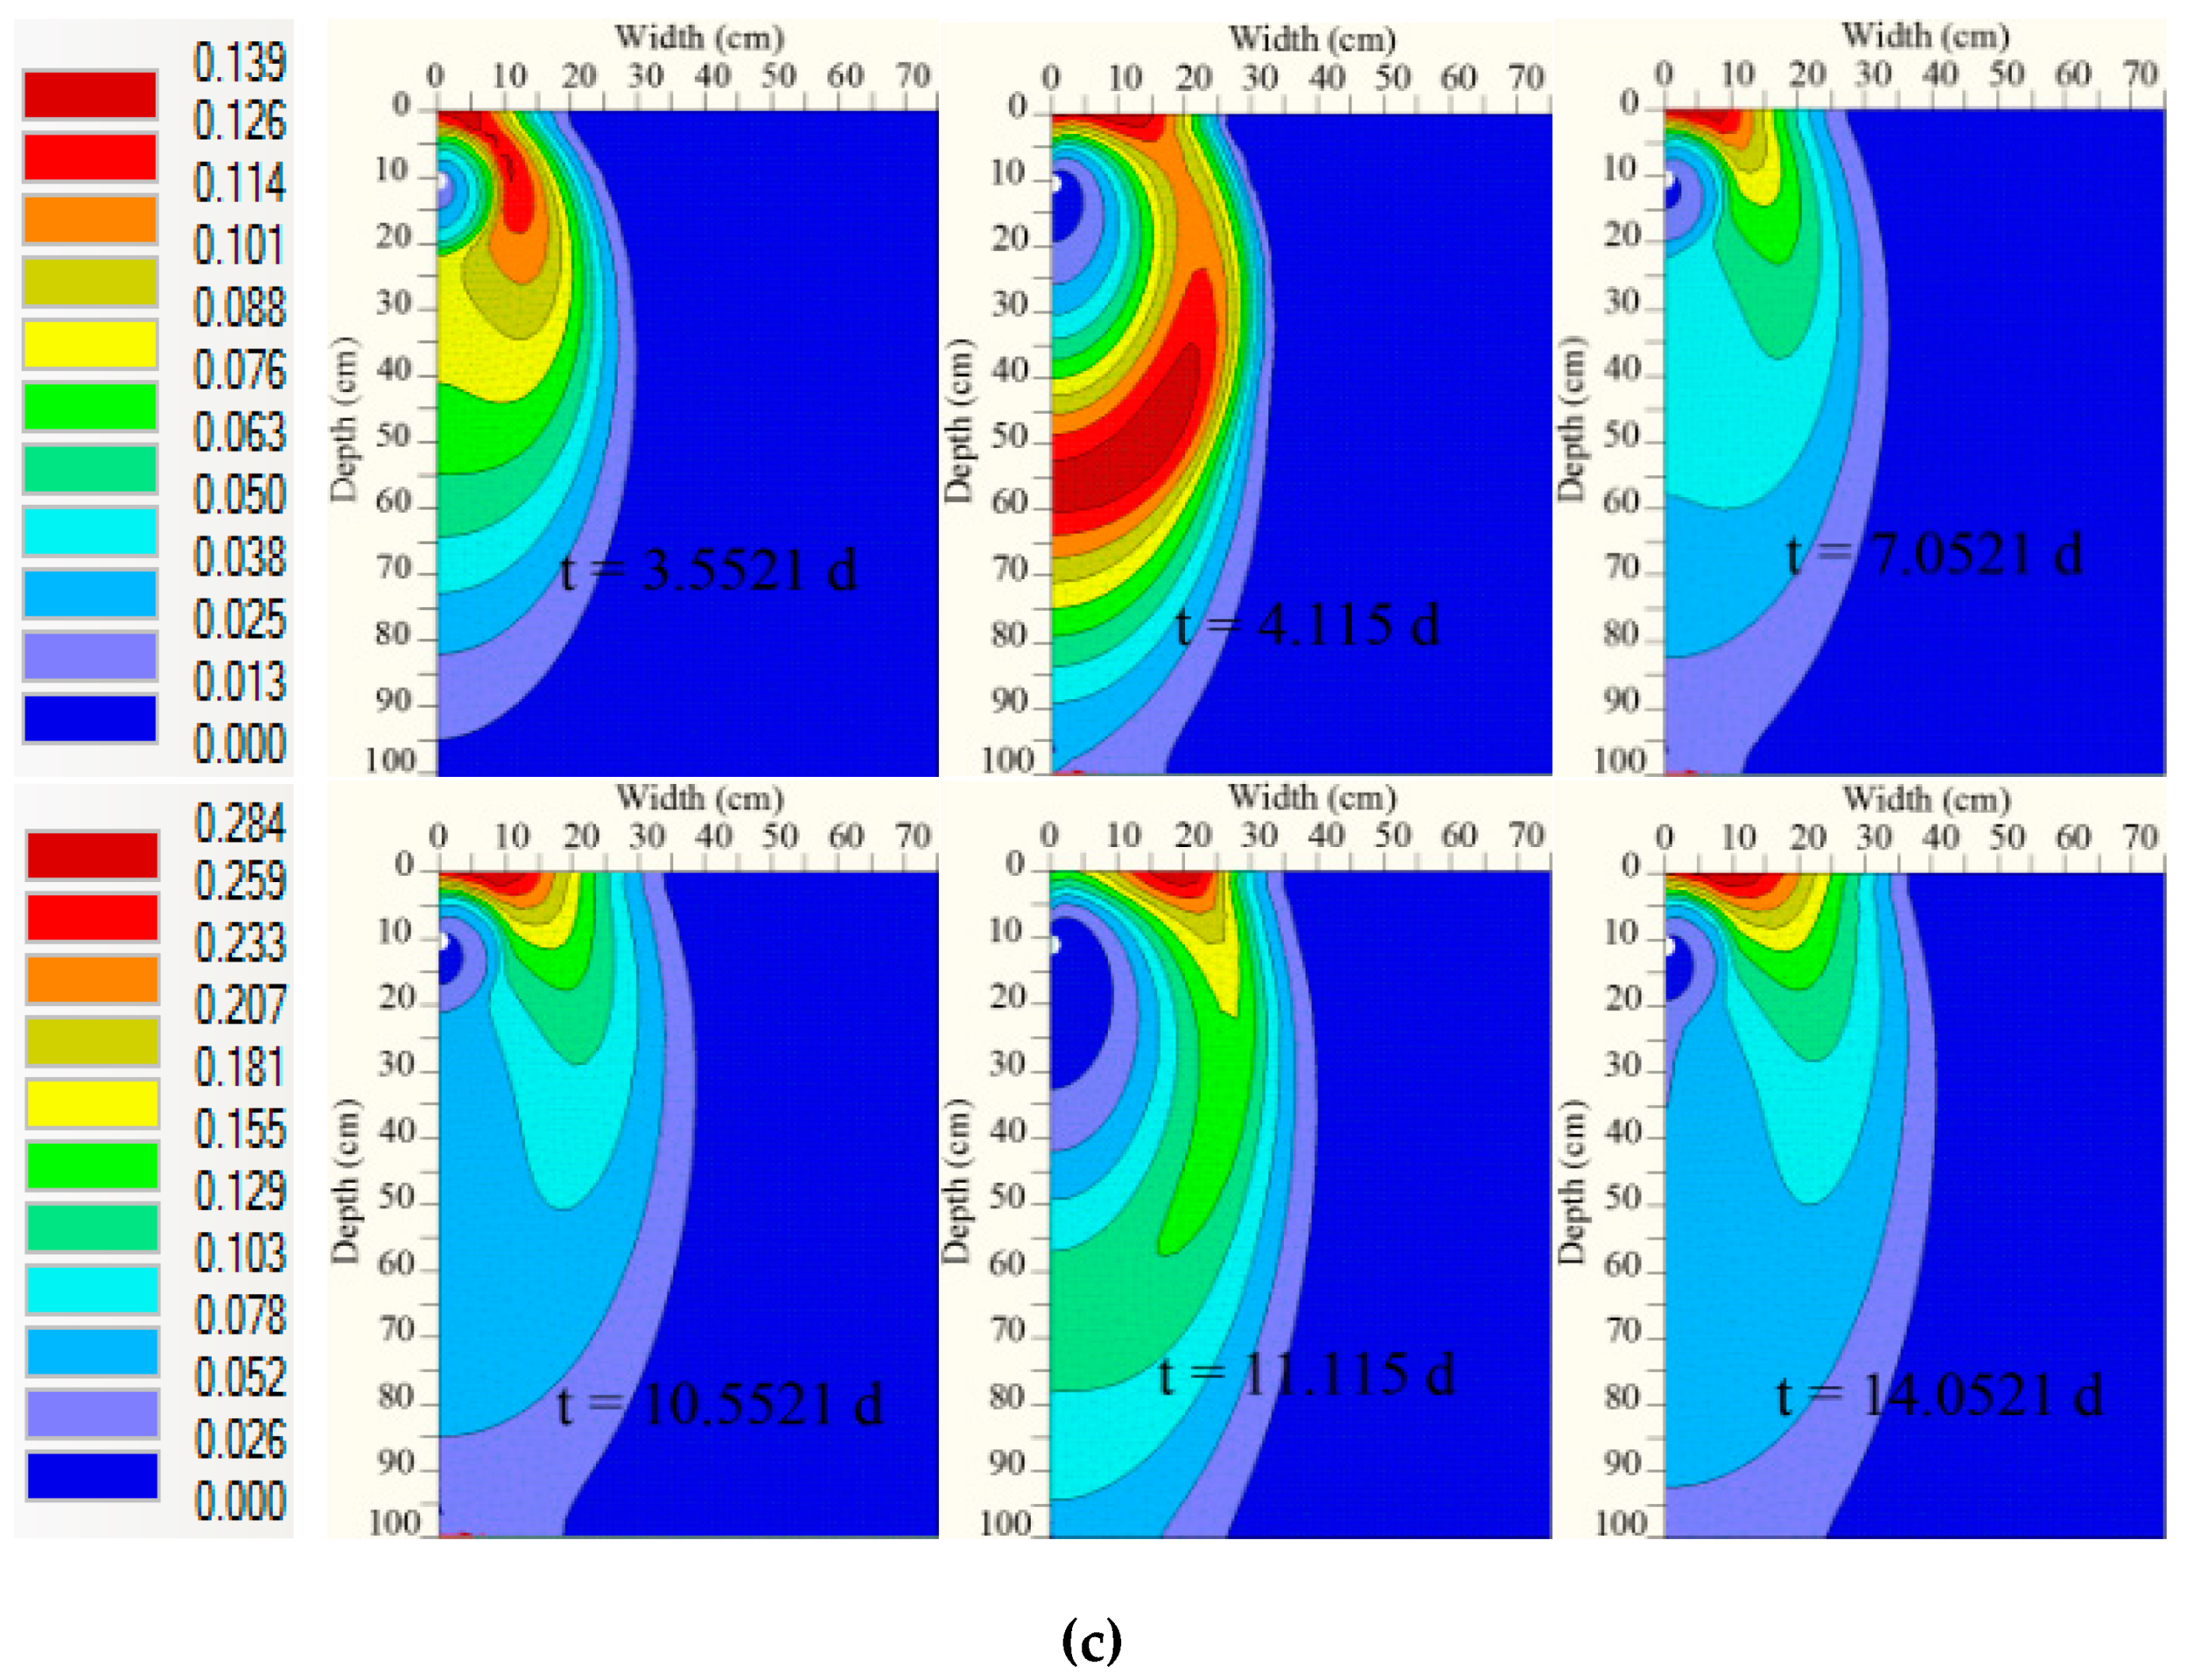
Fertigation strategy (C): Urea concentrations were uniformly distributed for fertigation strategy (c) more than the two other fertigation strategies (Figure 7). The maximum concentration is obtained around the emitter at the time of urea application. Nitrate concentrations were increased with the increase of time near the drip line. Because of hydrolysis and nitrification, nitrate accumulation in the soil profile increased with the time increase. The nitrate distribution area was extended vertically to about 86 cm and horizontally to about 60 cm at 35 days for silty loam soil with 2.0 L h−1 emitter discharge. The final leached nitrate concentrations for fertigation strategy A, B, and C are shown in Table 5.
5. Conclusions
The presented results in this study describe the effect of changing emitter discharge and the application of three fertigation strategies on urea transport and transformation and leached nitrate below the root zone of onion under subsurface drip irrigation for sandy loam, loamy, and silty loam soil. The HYDRUS 2/D model included the processes of hydrolysis, nitrification, mineralization, and ammonium adsorption. Emitter discharge rates significantly affect the soil moisture distribution and plant water uptake in sandy loam soil while it does not affect the moisture distribution in loam and silt loam soils. In silty loam soil, smaller numbers of emitters and larger spacing among them are recommended in the design of irrigation system for shallow-rooted crops. In coarse-textured soil, with the increase of emitter discharge, nutrient tends to move downwards especially for fertigation strategy (C) then (B), and (A). For fine-textured loam and silt loam soil, nutrient moved outwards (laterally) the soil domain. The application of urea fertigation strategy (A) increased nitrate concentration near the drip line and the plant uptake as well. There is no accumulation of urea among the three fertigation strategies for the three examined soil types. Urea concentrations decreased quickly with time increase due to hydrolysis and associated nitrification to ammonium. Most of the ammonium remained near the drip line around the emitter with low concentrations near the edge of the wetting zone. Urea fertigation at the middle of the irrigation event gives the highest nitrate concentrations that leached below the root zone, which should be avoided. The fertigation at the beginning of irrigation event is the best for the high nutrient plant uptake for sandy loam and loam soil while, for silty loam soil, the fertigation at the end of irrigation event is recommended.
Author Contributions
Conceptualization, M.G.E., A.M.N. and C.Y.; methodology, M.G.E., K.M.B. and A.M.N.; software, M.G.E., A.M.N., K.M.B. and C.Y.; validation, M.G.E., K.M.B., and A.M.N.; formal analysis, M.G.E. and A.M.N.; investigation, M.G.E. and K.M.B.; resources, M.G.E.; data curation, M.G.E., K.M.B., A.M.N. and C.Y.; writing—original draft preparation, M.G.E., A.M.N. and C.Y.; writing—review and editing, M.G.E., C.Y. and K.M.B.; visualization, M.G.E., K.M.B.; supervision, C.Y. and A.M.N; project administration, M.G.E, K.M.B. and A.M.N.; funding acquisition, M.G.E. and K.M.B.
Funding
This research received no external funding.
Acknowledgments
The authors would like to acknowledge the editor of the water journal and the reviewers as well for their time for reviewing this work. Also, many thanks go to Khaled M. Bali for his support and editing of the paper.
Conflicts of Interest
The authors declare no conflict of interest.
References
- Mahmoud, S.H. Investigation of rainfall-runoff modeling for Egypt by using remote sensing and GIS integration. Catena 2014, 120, 111–121. [Google Scholar] [CrossRef]
- Hamza, W.; Mason, S. Water Availability and Food Security Challenges in Egypt. Presented at International Forum on Food Security under Water Scarcity in the Middle East: Problems and Solutions, Como, Italy, 24–27 November 2004. [Google Scholar]
- Zalla, T.; Fawzy, M.A.; Saad, A.Y.; Ishak, Y.; Riad, M.; El Noubi, H.M. Availability and Quality of Agricultural Data for the New Lands in Egypt. Monitoring, Verification and Evaluation Unit Agricultural Policy Reform Program; Impact Assessment Report No. 12; Abt Associates Inc.: Cairo, Egypt, 2000; Available online: http://www.abtassociates.com/reports/lA12 (accessed on 1 January 2016).
- Diamantopoulos, E.; Elmaloglou, S. The effect of drip line placement on soil water dynamics in the case of surface and subsurface drip irrigation. Irrig. Drain. 2012, 61, 622–630. [Google Scholar] [CrossRef]
- Assouline, S.; Moller, M.; Cohen, S.; Ben-Hur, M.; Grava, A.; Narkis, K.; Silber, A. Soil-plant system response to pulsed drip irrigation and salinity: Bell pepper-Case study. Soil Sci. Soc. Am. J. 2006, 70, 1556–1568. [Google Scholar] [CrossRef]
- The Food and Agriculture Organization of the United Nations (FAO). AQUASTAT Database–Food and Agriculture Organization of the United Nations (FAO); FAO: Rome, Italy, 2013. [Google Scholar]
- Ismael, A.M.A. Application of Remote Sensing, GIS, and Groundwater Flow Modeling in Evaluating Groundwater resources: Two Case Studies–East Nile Delta, Egypt and Gold Valley, California. Ph.D. Thesis, University of Texas, Austin, TX, USA, 2007. [Google Scholar]
- Almasri, M.N. Nitrate contamination of groundwater: A conceptual management framework. Environ. Impact Assess. Rev. 2007, 27, 220–242. [Google Scholar] [CrossRef]
- Negm, A.M.; Eltarabily, M.G. Modeling of Fertilizer Transport through Soil, Case Study: Nile Delta. The Handbook of Environmental Chemistry; Springer: Berlin/Heidelberg, Germany, 2016. [Google Scholar] [CrossRef]
- Eltarabily, M.G.; Negm, A.M.; Yoshimura, C.; Saavedra, O.C. Modeling the impact of nitrate fertilizers on groundwater quality in the southern part of the Nile Delta, Egypt. Water Sci. Technol. Water Supply 2016, 17, 561–570. [Google Scholar] [CrossRef]
- Simunek, J.; Van Genuchten, M.T.H.; Sejna, M. The HYDRUS Software Package for Simulating Two and Three-Dimensional Movement of Water, Heat, and Multiple Solutes in Variably Saturated Media, Technical Manual, Version 2; PC Progress: Prague, Czech Republic, 2011; p. 258. [Google Scholar]
- Ramos, T.B.; Simunek, J.; Goncalves, M.C.; Martins, J.C.; Prazeres, A.; Pereira, L.S. Two-dimensional modeling of water and nitrogen fate from sweet sorghum irrigated with fresh and blended saline waters. Agric. Water Manag. 2012, 111, 87–104. [Google Scholar] [CrossRef]
- Phogat, V.; Mahadevan, M.; Skewes, M.; Cox, J.W. Modeling soil water and salt dynamics under pulsed and continuous surface drip irrigation of almond and implications of system design. Irrig. Sci. 2012, 30, 315–333. [Google Scholar] [CrossRef]
- Shamrukh, M.; Corapcioglu, M.Y.; Hassona, F.A.A. Modeling the effect of chemical fertilizers on groundwater quality in the Nile Valley aquifer, Egypt. Groundwater 2001, 39, 59–67. [Google Scholar] [CrossRef]
- Morsy, W.S. Environmental Management to Groundwater Resources for Nile Delta Region. Ph.D. Thesis, Faculty of Engineering, Cairo University, Giza, Egypt, 2009. [Google Scholar]
- Ghoraba, S.M.; Zyedan, B.A.; Rashwan, I.M.H. Solute transport modeling of the groundwater for quaternary aquifer quality management in Middle Delta, Egypt. Alex. Eng. J. 2013, 52, 197–207. [Google Scholar] [CrossRef] [Green Version]
- Feddes, R.A.; Kowalik, P.J.; Zaradny, H. Simulation of Field Water Use and Crop Yield; John Wiley & Sons: Hoboken, NJ, USA, 1978. [Google Scholar]
- Allen, R.G.; Pereira, L.S.; Raes, D.; Smith, M. Crop Evapotranspiration, Guidelines for Computing Crop Water Requirements FAO Irrigation and Drainage Paper 56; FAO (Food and Agriculture Organization of the United Nations): Rome, Italy, 1998. [Google Scholar]
- Simunek, J.; Sejna, M.; Van Genuchten, M.T. The HYDRUS-1D Software Package for Simulating the One-Dimensional Movement of Water, Heat, and Multiple Solutes in Variably-Saturated Media; Version 4.0; Department of Environmental Sciences, University of California Riverside: Riverside, CA, USA, 2008. [Google Scholar]
- Tan, X.; Shao, D.; Gu, W.; Liu, H. Field analysis of water and nitrogen fate in lowland paddy fields under different water management using HYDRUS-1D. Agric. Water Manag. 2015, 150, 67–80. [Google Scholar] [CrossRef]
- Antonopoulos, V.Z. Modeling of water and nitrogen balances in the ponded water and soil profile of rice fields in Northern Greece. Agric. Water Manag. 2010, 98, 321–330. [Google Scholar] [CrossRef]
- Hanson, B.R.; Simunek, J.; Hopmans, J.W. Evaluation of urea–ammonium–nitrate fertigation with drip irrigation using numerical modeling. Agric. Water Manag. 2006, 86, 102–113. [Google Scholar] [CrossRef]
- Jansson, P.-E.; Karlberg, L. Coupled Heat and Mass Transfer Model for Soil-Plant-Atmosphere Systems; Royal Institute of Technology, Department of Civil and Environmental Engineering: Stockholm, Sweden, 2001; p. 325. [Google Scholar]
- Ling, G.; El-Kadi, A.I. A lump bed parameter model for nitrogen transformation in the unsaturated zone. Water Resour. Res. 1998, 34, 203–212. [Google Scholar] [CrossRef]
- Lotse, E.G.; Jabro, J.D.; Simmons, K.E.; Baker, D.E. Simulation of nitrogen dynamics and leaching from arable soils. J. Contam. Hydrol. 1992, 10, 183–196. [Google Scholar] [CrossRef]
- Vrugt, J.A.; Van Wijk, M.T.; Hopmans, J.W.; Simunek, J. One-, two-, and three-dimensional root water uptake functions for transient modeling. Water Resour. Res. 2001, 37, 2457–2470. [Google Scholar] [CrossRef] [Green Version]
- Climate Charts Ismailia, Egypt. Available online: https://www.climate-charts.com/Locations/e/UB62440.html (accessed on 1 April 2016).
- Hanson, B.R.; Hopmans, J.W.; Simunek, J. Leaching with subsurface drip irrigation under saline shallow groundwater conditions. Vadose Zone J. 2008, 7, 810–818. [Google Scholar] [CrossRef]
- Smith, M. Manual of CROPWAT Computer Program; FAO Irrigation and Drainage Paper No. 52; FAO: Rome, Italy, 1999. [Google Scholar]
- Gil, M.; Rodrıguez-Sinobas, L.; Juana, L.; Sanchez, R.; Losada, A. Emitter discharge variability of subsurface drip irrigation in uniform soils: Effect on water application uniformity. Irrig. Sci. 2008, 26, 451–458. [Google Scholar] [CrossRef]
- Bilal, A.; Ramazan, T.; Fariz, M. Effect of applied water and discharge rate on wetted soil volume in loam or clay-loam soil from an irrigated trickle source. Afr. J. Agric. Res. 2009, 4, 49–54. [Google Scholar]
- Haman, D.Z.; Izuno, F.T. Principles of Micro Irrigation; Extension Act Sheet (AE-70); IFAS, University of Florida: Gainesville, FL, USA, 1989. [Google Scholar]
- Nafchi, R.F.; Mosavi, F.; Parvanak, K. Experimental study of shape and volume of wetted soil in trickle irrigation method. Afr. J. Agric. Res. 2011, 6, 458–466. [Google Scholar] [CrossRef]
- Ghumman, A.R.; Iqbal, M.; Ahmed, S.; Hashmi, H.N. Experimental and numerical investigations for optimal emitter spacing in drip irrigation. Irrig. Drain. 2018. [Google Scholar] [CrossRef]
- Russo, D.; Laufer, A.; Silber, A.; Assouline, S. Water uptake, active root volume, and solute leaching under drip irrigation: A numerical study. Water Resour. Res. 2009, 45, 12413. [Google Scholar] [CrossRef]
- Phogat, V.; Skewes, M.A.; Cox, J.W.; Sanderson, G.; Alam, J.; Simunek, J. Seasonal simulation of water, salinity and nitrate dynamics under drip irrigated mandarin (Citrus reticulata) and assessing management options for drainage and nitrate leaching. J. Hydrol. 2014, 513, 504–516. [Google Scholar] [CrossRef]
Figure 1.
(a) Conceptual geometry showing the boundary conditions and root distribution (b) simulation domain and location of the drip tape.
Figure 1.
(a) Conceptual geometry showing the boundary conditions and root distribution (b) simulation domain and location of the drip tape.

Figure 2.
Soil moisture distribution at the end of the first irrigation event for 1.50 L h−1 emitter discharge (a) for sandy loam (b) for loam soil (c) for silty loam.
Figure 2.
Soil moisture distribution at the end of the first irrigation event for 1.50 L h−1 emitter discharge (a) for sandy loam (b) for loam soil (c) for silty loam.

Figure 3.
Soil moisture distribution at the end of the fifth irrigation event for the three different irrigation fluxes (a) for sandy loam (b) for loam soil (c) for silty loam.
Figure 3.
Soil moisture distribution at the end of the fifth irrigation event for the three different irrigation fluxes (a) for sandy loam (b) for loam soil (c) for silty loam.

Figure 4.
Actual root water uptake for sandy loam for emitter discharge rate Q0 = 1 L h−1.

Figure 5.
Spatial distributions of (a) urea (b) ammonium (c) nitrate (mg cm−3) for fertigation (A) for various days at the time of urea application for the sandy loam soil with 1 L h−1 emitter discharge (scenario 1).
Figure 5.
Spatial distributions of (a) urea (b) ammonium (c) nitrate (mg cm−3) for fertigation (A) for various days at the time of urea application for the sandy loam soil with 1 L h−1 emitter discharge (scenario 1).


Figure 6.
Spatial distributions of (a) urea (b) nitrate (mg cm−3) for the B fertigation strategy for various days at the time of fertilizer application for loam soil with 1.50 L h−1 emitter discharge (scenario 14).
Figure 6.
Spatial distributions of (a) urea (b) nitrate (mg cm−3) for the B fertigation strategy for various days at the time of fertilizer application for loam soil with 1.50 L h−1 emitter discharge (scenario 14).


Figure 7.
Spatial distributions of (a) urea (b) nitrate (mg cm−3) for the C fertigation strategy for various days at the time of fertilizer application for silty loam soil with 2.0 L h−1 emitter discharge (scenario 27).
Figure 7.
Spatial distributions of (a) urea (b) nitrate (mg cm−3) for the C fertigation strategy for various days at the time of fertilizer application for silty loam soil with 2.0 L h−1 emitter discharge (scenario 27).


Table 1.
Soil hydraulic parameters.
| Texture Class | θr (cm3 cm−3) | θs (cm3 cm−3) | α | n | Ks (cm h−1) | l |
|---|---|---|---|---|---|---|
| Sandy loam | 0.065 | 0.41 | 0.075 | 1.89 | 4.42 | 0.5 |
| Loam | 0.078 | 0.43 | 0.036 | 1.56 | 1.04 | 0.5 |
| Silty loam | 0.067 | 0.45 | 0.02 | 1.41 | 0.45 | 0.5 |
Table 2.
Irrigation system characteristics.
| Irrigation: | |||
|---|---|---|---|
| Discharge rate, Q0 (L h−1) | 1.0 | 1.50 | 2.0 |
| Irrigation intensity, q0 | 5.33 | 8 | 10.67 |
| Irrigation interval, ∆p (days) | 3.5 | ||
| Irrigation duration, p (days) | 0.615 | 0.41 | 0.301 |
| Water Demand: | |||
| ET0 | 0.75 | ||
| Crop coefficient, Kc | 1.0 [18] | ||
Table 3.
Various simulation scenarios show the soil types and irrigation durations.
| Scenario No. | Soil Type | Irrigation Duration (days) | Irrigation Intensity (cm·day−1) | Daily Flux (cm) | Fertigation Strategy |
|---|---|---|---|---|---|
| 1 | Sandy loam | 0.615 | 5.33 | 80 | A |
| 2 | Sandy loam | 0.615 | 5.33 | 80 | B |
| 3 | Sandy loam | 0.615 | 5.33 | 80 | C |
| 4 | Sandy loam | 0.41 | 8.0 | 120 | A |
| 5 | Sandy loam | 0.41 | 8.0 | 120 | B |
| 6 | Sandy loam | 0.41 | 8.0 | 120 | C |
| 7 | Sandy loam | 0.301 | 10.67 | 160 | A |
| 8 | Sandy loam | 0.301 | 10.67 | 160 | B |
| 9 | Sandy loam | 0.301 | 10.67 | 160 | C |
| 10 | Loam | 0.615 | 5.33 | 80 | A |
| 11 | Loam | 0.615 | 5.33 | 80 | B |
| 12 | Loam | 0.615 | 5.33 | 80 | C |
| 13 | Loam | 0.41 | 8.0 | 120 | A |
| 14 | Loam | 0.41 | 8.0 | 120 | B |
| 15 | Loam | 0.41 | 8.0 | 120 | C |
| 16 | Loam | 0.301 | 10.67 | 160 | A |
| 17 | Loam | 0.301 | 10.67 | 160 | B |
| 18 | Loam | 0.301 | 10.67 | 160 | C |
| 19 | Silty loam | 0.615 | 5.33 | 80 | A |
| 20 | Silty loam | 0.615 | 5.33 | 80 | B |
| 21 | Silty loam | 0.615 | 5.33 | 80 | C |
| 22 | Silty loam | 0.41 | 8.0 | 120 | A |
| 23 | Silty loam | 0.41 | 8.0 | 120 | B |
| 24 | Silty loam | 0.41 | 8.0 | 120 | C |
| 25 | Silty loam | 0.301 | 10.67 | 160 | A |
| 26 | Silty loam | 0.301 | 10.67 | 160 | B |
| 27 | Silty loam | 0.301 | 10.67 | 160 | C |
Table 4.
Values of cumulative flux and drainage (cm3) after the 35 days of simulation for the three emitters discharges.
Table 4.
Values of cumulative flux and drainage (cm3) after the 35 days of simulation for the three emitters discharges.
| Emitter, Q0 (L h−1) | 1.0 | 1.50 | 2.0 | |||
|---|---|---|---|---|---|---|
| Flux (cm3) | Drainage (cm3) | Flux (cm3) | Drainage (cm3) | Flux (cm3) | Drainage (cm3) | |
| Sandy loam | 1797.9 | 1212.7 | 1813.5 | 1213.3 | 1823.9 | 1173.5 |
| Loam | 1849.6 | 296.76 | 1873.4 | 295.82 | 1886.6 | 260.54 |
| Silty loam | 1853.4 | 14.069 | 1872 | 11.934 | 1891 | 8.4726 |
Table 5.
Maximum nitrate concentration at the end of the simulation period (mg cm−3) for sandy loam, loam, and silty loam at different discharges for the three fertigation strategies.
Table 5.
Maximum nitrate concentration at the end of the simulation period (mg cm−3) for sandy loam, loam, and silty loam at different discharges for the three fertigation strategies.
| Fertigation Strategy | Soil Type | Emitter Discharge, Q0 (L h−1) | ||
|---|---|---|---|---|
| 1.0 | 1.50 | 2.0 | ||
| (A) | Sandy loam | 0.302 | 0.413 | 0.506 |
| (B) | 0.366 | 0.524 | 0.666 | |
| (C) | 1.029 | 1.028 | 1.022 | |
| (A) | Loam | 0.264 | 0.358 | 0.445 |
| (B) | 0.304 | 0.417 | 0.505 | |
| (C) | 0.999 | 1.014 | 1.010 | |
| (A) | Silty loam | 0.244 | 0.336 | 0.422 |
| (B) | 0.242 | 0.316 | 0.396 | |
| (C) | 0.996 | 0.985 | 0.975 | |
© 2019 by the authors. Licensee MDPI, Basel, Switzerland. This article is an open access article distributed under the terms and conditions of the Creative Commons Attribution (CC BY) license (http://creativecommons.org/licenses/by/4.0/).
Share and Cite
MDPI and ACS Style
Eltarabily, M.G.; Bali, K.M.; Negm, A.M.; Yoshimura, C. Evaluation of Root Water Uptake and Urea Fertigation Distribution under Subsurface Drip Irrigation. Water 2019, 11, 1487. https://doi.org/10.3390/w11071487
AMA Style
Eltarabily MG, Bali KM, Negm AM, Yoshimura C. Evaluation of Root Water Uptake and Urea Fertigation Distribution under Subsurface Drip Irrigation. Water. 2019; 11(7):1487. https://doi.org/10.3390/w11071487
Chicago/Turabian StyleEltarabily, Mohamed Galal, Khaled M. Bali, Abdelazim M. Negm, and Chihiro Yoshimura. 2019. "Evaluation of Root Water Uptake and Urea Fertigation Distribution under Subsurface Drip Irrigation" Water 11, no. 7: 1487. https://doi.org/10.3390/w11071487
Note that from the first issue of 2016, this journal uses article numbers instead of page numbers. See further details here.