A Framework to Evaluate Urban Flood Resilience of Design Alternatives for Flood Defence Considering Future Adverse Scenarios


1
Programa de Engenharia Ambiental—PEA-POLI-EQ/UFRJ, Rio de Janeiro 21941-909, Brazil
2
Escola Politécnica—POLI/UFRJ, Rio de Janeiro 21941-909, Brazil
3
Programa de Engenharia Urbana—PEU-POLI/UFRJ, Rio de Janeiro 21941-909, Brazil
4
Programa de Engenharia Civil—PEC-COPPE/UFRJ, Rio de Janeiro 21941-450, Brazil
*
Author to whom correspondence should be addressed.
Water 2019, 11(7), 1485; https://doi.org/10.3390/w11071485
Submission received: 30 April 2019
/
Revised: 5 June 2019
/
Accepted: 2 July 2019
/
Published: 17 July 2019
(This article belongs to the Special Issue Future Challenges in Flood Defence Design and Management)
Abstract
:In urbanized plains that are subject to flooding, the socioeconomic aspects, climate characteristics, built environment, and riverine processes exhibit bi-univocal relationships with the flood formation itself, creating a pattern of development without a predefined equilibrium state. The complexity of processes involved in flood management and the need for a comparative assessment method to hierarchise different design alternatives or planning scenarios requires practical and quantitative methods for urban diagnoses, including flood risk and resilience aspects. This paper proposes an alternative pathway to evaluate design alternatives for urban flood mitigation, assessing resilience in quantitative terms. In this way, a methodological framework is presented suppress to evaluate flood resilience in urban watersheds planning, through the application of the Urban Flood Resilience Index (UFRI) and Future Scenarios Criteria (FSC). A case study illustrates the method using an urban watershed in Rio de Janeiro/Brazil. This study considered two possible design alternatives for flood control, with concentrated and distributed measures. The resilience mapping using the UFRI showed that the adoption of distributed measures could increase the areas classified as showing very high resilience by 41%, while very low resilience areas would be reduced by 87%. The FSC is able to present the integrated results of resilience variation from present and future conditions, considering, for example, climate change effects or unplanned urbanisation scenarios. The framework is able to perform comparisons between alternatives, showing the advantages associated with adopting distributed measures over the watershed, which reflected in a resilience value that was 24% higher when compared to the results obtained for the concentrated solutions scenario.
1. Introduction
Although floods are natural phenomena responsible for several ecosystem processes, the increase of socioeconomic systems exposed to their impacts introduces a challenging issue to urban planners. The complex functions of urban areas need to be considered in the design process of urban stormwater systems, increasing resilience to climate change and enhancing attraction and social inclusion of urban environments [1] especially regarding flood management. Land use changes, urbanisation growth and climate change effects can potentialise the complexity of interactions between cities and urban floods [2].
Since the first industrial revolution, increasingly high density cities have to deal with public health problems related to water. After managing wastewater problems, public policies have been focused on stormwater control strategies to increase flood resistance, based on improvements to the hydraulic capacities of systems. This fact has enabled the rapid and efficient conveyance of stormwater out of cities, characterising the concept of the Drained City, as defined in a historical review made by Brown et al. [3]. However, in this context, the intense process of soil sealing inherent to urbanisation and the introduction of drainage networks tend to increase runoff downstream, magnifying damages in already flooded areas and exposing new areas to potential flooding.
Only from the 1970s, this Drained City model started to be criticised, providing the basis for the development of the Flood Risk Management (FRM) approach [4]. In a first attempt to better deal with increased flooding impacts on urban systems, the stakeholders started to encourage efforts to design flood control measures based on detention techniques as a compensatory solution [5]. However, the number of flood events and the resulting damages are still increasing, hitting 45% of disaster-affected people worldwide between 1998 and 2017 [6]. A more comprehensive vision of urban environments brought some new ideas to flood management, such as the Water Sensitive Urban Design approach [3] and the Sponge Cities concept [7]. Recently, built and natural environments have been considered together in flood mitigating measures; this approximation incorporates multiple benefits both to nature and urban health [8]. This approach tries to reduce the economic and social costs for communities which are identified by Barría et al. [9] as being consequences of deficient urban planning and the lack of integrated disaster risk management plans.
In this way, distributed intervention is prioritised, with spatialised benefits, mitigating the impact of soil sealing through facilitating infiltration and retention processes to recover hydrological conditions similar to those of pre-urbanisation. Several concepts have been incorporated into urban drainage discussion, assuming different terminologies, such as sustainable urban drainage systems (SUDS) in the United Kingdom, stormwater best management practices (BMPs) and low impact development (LID) in the USA [10], and more recently, as water sensitive urban design (WSUD) in Australia, or green infrastructure (GI) worldwide [11]. Fletcher et al. [8] present a detailed review of the history of how different concepts and related terms appeared and are being used in the management of urban stormwater. Mainly, the techniques involved in these concepts seek to minimise the effects of urbanisation growth. In summary, the sustainable drainage approach seeks to increase the infiltration of rainwaters into the soil by reducing and/or slowing runoff, and thus, decreasing the amount of water in storm drains and rivers during heavy rains [12]. Furthermore, it provides opportunities to recover stormwater retention capacity. These drainage techniques minimise the negative effects of urbanisation, and have proven to be more sustainable while working better in the long term [13,14,15].
While reducing the negative impacts of traditional flood control measures, treating the watershed in a systemic way is a choice which is still based on a control approach, as stated by Morita [16]. This situation maintains the pursuit of the stability of a system, since the concept of stability can be seen as the tendency of a system to return to an equilibrium position after a disturbance, approaching very closely the classic concept of resilience in engineering [17]. However, in urbanised plains which are subject to floods, socioeconomic aspects, climate characteristics, the built environment, and riverine processes affect the flood formation itself, in bi-univocal relations, thereby creating a pattern of development without a predefined equilibrium state. More than that, it is expected that improving knowledge about the problem will lead to a better new state. In this way, planning urban development based on the search for stability will be problematic when applied to large spatial and temporal scales, in which the systems are inherently dynamic [18].
Anthropic changes in natural systems aiming to adapt spaces to human interests have been deeply investigated in hydrological studies, aiming to understand the urbanisation impact on flood patterns [19,20,21,22]. The opposite situation has been gaining an increasing role in academic research, seeking to understand how flooding behaviour and the environment supporting capacity can define human settlement aspects [23]. However, the bi-univocal relationship between flood dynamics and human development is yet to be properly addressed. This lack of understanding has increased the risk of flooding even in situations where large investments have been made to protect human assets, since a false perception of safety can lead people to expose themselves even greater risks. To better address the dynamics of flood-human interactions and the associated feedback, some researchers are treating this relationship as a socio-hydrology concept [24].
Given the unpredictability associated with floods and the uncertainties of human behaviour in the face of extreme events, resilient strategies must be developed and implemented once resilience itself has been inherently designed to deal with uncertainty [25]. Since one of the goals of the resilience approach is to reduce the system vulnerabilities, and considering that “the way that society perceives risk is crucial to understanding the existing vulnerabilities” [26], risk perception becomes an important issue to be addressed in the FRM. The urban development boom in flood-prone areas occurs in response to historical flood control efforts, achieved by huge drainage works usually constructed after great disaster events [27]. As a consequence, flood risk increases as the exposure of goods and people intensifies. The resilience approach makes it possible to invert simple damage reduction reasoning, converging solutions capable of dealing with future uncertainties and adversities. [28].
The concept of resilience has been widely employed, mainly in the fields of materials science [29,30], ecology [31], urban engineering [32], sociology [33], psychology [34], geography [35] among others. Folke [36] presents an overview of the use of the concept of resilience in the field of ecology from the 1960s to the present day.
Many authors have been praising efforts to reduce misunderstandings and disagreements about the correct application of the resilience concept, as well to expand the discussion [37,38]. Keating et al. [39] defined disaster resilience as “the ability of a system, community, or society to pursue its social, ecological, and economic development and growth objectives while managing its disaster risk over time in a mutually reinforcing way”. Chen and Leandro [40] highlighted the fact that academic descriptions of the resilience concept applied to urban flood comprise at least two major elements: “1. The coping capacity when facing flooding, and 2. the recovery capacity after flooding”.
In the context of urban floods and urban engineering, resilience can be briefly defined as “the ability of an infrastructure asset to maintain its most important processes, characteristics and functions even under extreme events, as well as the ability to recover and reassume its normal functions right after the event” [28,41].
It is important here to clarify how the resilience concept will be considered in this paper. As mentioned, resilience is a multi-faceted concept, involving several different possibilities. The resilience concept has its origin in material science and, in this context, it responds to the capacity of absorbing energy and returning to the previous state. As a consequence, resilience in engineering is usually related to the capacity of a system to resist changes in state and continue functioning. However, the resilience concept can be found in many different subjects. A significant variation of this concept refers to ecological resilience, which is responsible for a great number of urban resilience solutions regarding development challenges. Ecological resilience responds to adaptive capacity and is related to the survival of the species. Joining these two concepts in the city environment leads to an interesting interpretation. Considering that cities are socioeconomic systems settled over a natural supporting system, we can join both definitions (engineering and ecological resilience) and define flood resilience in this work as the ability of the city to resist flooding over time, being able to adapt itself and continue functioning, even under stress conditions, and to recover rapidly from material losses.
More recently, frameworks and methodologies have been developed aiming to establish flood resilience [42,43]. Cutter et al. [44] stated that despite efforts to assess the dimensions of community resilience, the main challenge is to develop standard metrics to measure disaster resilience. Many factors, such as hydrological characteristics, population density, land use, and climate change can affect flood risk in urban catchment areas [16], which can be mitigated by structural and non-structural measures. Keating et al. [39] highlighted the urgent need for the development of disaster resilience measurement tools, giving rise to a better understanding of the resilience of key components, the improvement of resilience measuring skills and the comparison of resilience changes over time. The complexity of the processes involved in flood management and the need for a comparative assessment method to hierarchise different design alternatives or planning scenarios require practical and quantitative methods for urban diagnoses including flood risk aspects. Batica [45] suggests that indicator-based approaches can provide a comprehensive view of the vulnerability and resilience of a city or community. In turn, indicators can be defined as direct or indirect measures calculated from processed data to represent an attribute of a system of interest [46]. Therefore, flooding events can impact both natural and built environments, demanding an assessment method which is capable of identifying the particular consequences in each of these sub-systems, dealing with a social-ecological system (SES), which can be understood as the one defined by the interdependence between people and nature [47].
Composite indicators or indexes can offer a potential way of dealing with the multivariate and complex nature of interactions between flooding and SES [47]. An index “aggregates multiple individual indicators to provide a synthetic measure of a complex, multidimensional, and meaningful societal issue” [46].
The range of possible stormwater design alternatives, the different decisions concerning land use and urban development and the uncertainties about climate change scenarios require assessment tools which are capable of supporting both urban planning, providing better design choices, and governance strategies for improving flood resilience. As stated by Zhang [48], the approach to stormwater management must consider long-term impacts to guarantee urban sustainability. The resilience approach deals with future uncertainties and is directly related to looking for sustainable development. In this context, this study presents a framework to quantitatively measure flood resilience associated with different design alternatives, considering flood mitigation measures and future stressing scenarios, allowing stakeholders to make comparisons of design alternatives and to rank them according to flood resilience criteria.
To achieve this goal, this work draws upon a proposition from Miguez & Veról [28], where a framework for ranking flood mitigation alternatives was proposed, resulting in a multi-criteria index called Flood Resilience Index (FResI). This index was intended to give an integrated number in order to approach the flood resilience status of an urban watershed; its development was based upon a previously proposed index representing the flood risk assessment named Flood Risk Index—FRI [49].
In the present work, a new index, the Urban Flood Resilience Index (UFRI) [50,51], which is an evolution of the work of Bertilsson et al. [52], is used to substitute the FRI in the Adapted Flood Resilience Index (aFResI), in an integrated composition built to compare the resilience behaviour over time, from the current situation to future scenarios. The new adapted method also revises the mathematical formulation of the original proposition. This framework is applied in a highly urbanised watershed in Rio de Janeiro, Brazil, with huge flood problems. Therefore, the future scenario chosen to further stress the current situation considers possible climate change, increasing rainfall intensity and rising mean sea levels (since Rio de Janeiro is a coastal city).
The main novelty presented in this paper is the proposition to use a direct quantitative tool to measure urban flood resilience in an integrated framework to support decision making on flood control projects and urban development decisions. This proposed approach considers future scenarios of adversity, allowing stakeholders to evaluate the loss of efficiency of flood mitigation measurements in face of these stressors. It is important to note, however, that this is not intended to be an isolated decision tool. After ranking the alternatives, considering their resilience behaviour, the economic aspect still has to be considered, and a cost-benefit analysis (CBA) should be made over the lifetime of the considered project alternatives. As stated by Keating et al. [39] “there is no one-size-fits-all “resilience” measure, nor should there be”. Therefore, the framework proposed in this study is an ongoing research project, subject to improvements; nonetheless, it has provided suitable results for the present study case.
2. Material and Methods
The study was carried out using a computational modelling tool to support hydrological and hydrodynamics simulation scenarios, intending to give basic information about flood consequences over the urban systems. The result of the modelling process characterises the flood events, based on a design storm with a 25-year return period (RP). This RP was adopted due to the official Brazilian government requirements for flood control design. Departing from flood characterisation, and joining the socioeconomic information (obtained from the available census-2010), the UFRI can be built and used in the methodological framework proposed in this work. The detailed steps of this framework are described in the following sections.
2.1. Computational Modelling System
In order to obtain information on flood patterns for different scenarios, hydrologic and hydrodynamic modelling tools were used to support the simulation of a rainfall event with 25 years of RP. Flooding characteristics were obtained using the Urban Flow Cell Model—MODCEL [53,54]. This model is based on the original work by Zanobetti and Lorgeré [55]; it assumes that the watershed can be subdivided into various types of flow-cells which interact with each other through 1D flow Equations, representing the watershed surface and its flow pattern, including a set of varied hydraulic structures. MODCEL can be described as a quasi-2D cell model which integrates the hydrological processes observed in each cell into a looped hydrodynamic model, creating a spatial representation that interconnects surface flow, channel flows and storm drains. Therefore, a dual drainage approach supports this model, so that flow can occur simultaneously on both layers, i.e., surface and underground [56]. This feature makes it possible to assess both river flooding and the drainage network failures.
The resulting grid is irregular, in the sense that each cell may assume the proper form to represent a certain portion of the terrain. Different scales may co-exist in the representation of the cells grid. The cell limits can be defined by their topographic characteristics, using watershed reasoning, but they can also be defined by urban features, such as buildings contours. The representation of a schematic urban cell is shown in Figure 1. Different hydraulic relations may define the connection between cells. The most used is the Saint-Venant dynamic Equation, but local structures, like weirs, orifices, gates and pumps, may also be represented.
During a storm event, urban landscapes (as seen in Figure 2A) can flood in response to two different types of failure: channel overflows or storm drain overflows. The first occurs when rivers and channels cannot support the total flow resulting from storm waters drained from the watershed, as in case B of Figure 2. The second occurs when urban drainage systems, mainly composed of storm drains, are not able to deal with the runoff resulting from a storm event, drained by streets, lots, squares, etc., as in case C of Figure 2. When both systems fail, there is generalised urban flooding, represented in Figure 2 by case D.
2.2. Urban Flood Resilience Index—UFRI
To support the discussion about residual risk and compose the methodology proposed here, an index is developed to aid the planning and design of urban drainage solutions, adopting a methodology that departs from the basic concepts of risk management and evolves to consolidate a Resilience Index. At this point, it is important to highlight the understanding of resilience adopted in this study, broadly discussed in the introduction section.
The UFRI proposition makes it possible to build resilience maps and, consequently, to work to reduce risk consequences over time, especially regarding avoided losses. It is based on the index presented as S-FResI in Bertilsson et al. [52], and was expanded in this work. The UFRI combines three sub-indexes, representing the three properties of resilience cited by Proag [57]:
- (i)
- absorptive capacity—the ability of the system to absorb the disruptive event, represented by the Sub-index of Risk to Resistance Capacity ().
- (ii)
- adaptive capacity—the ability to adapt to the event, represented by the Sub-index of Risk to System Functional Capacity ().
- (iii)
- restorative capacity—the ability of the system to recover, represented by the Sub-index of Risk to Material Recovery Capacity ().
Each sub-index considers hazard-related indicators, covering maximum flood depths, water flow velocities and flood permanence times, combined with related vulnerability indicators. The calculation of UFRI uses Equation (1); the hierarchical arrangement of the indicators and sub-indexes that compose the UFRI is shown in Figure 3. The complete composition of the index is shown in Figure 4. Each of the indicator formulations is presented below.
Parameters a, b and c are the weights associated with each sub-index. In the present study, the weighting process assumes equal values for all of them, since it is not the aim of this study to state the relative importance of each term in the resilience composition. In fact, defining this relative importance is something that may vary from case to case, and which should be a prerogative of decision makers.
2.2.1. Sub-Index of Risk to Resistance Capacity ()
The represents resistance to damage, according to the degree of exposure of the population and the existing assets in the basin, i.e., the exposure of buildings and urban infrastructure to the potential damages of a given flood. Three indicators are used in its formulation: (i) the building exposure indicator; (ii) the urban infrastructure exposure; and (iii) the flood depth indicator. This sub-index is calculated using Equation (2).
—building exposure indicator.
The building exposure indirectly indicates the exposure of people. It is represented by built density area (BD), in m²/ha. The higher the density, the more vertical the buildings, indicating a greater occupation, either residential or commercial. The values are normalised in a range between 0 and 1, with the highest exposure value (equal to 1) being attributed from the third quartile of built density distribution in the basin (and upwards), in order to avoid non-representative values of isolated high densities, which could distort the scale. This method was applied to the Canal do Mangue catchment, used as a case study, resulting in Equation (3).
—urban infrastructure exposure indicator.
This indicator represents an indirect measure of urban infrastructure exposure by road density (RD), in m/ha. The greater the density of roads in a region, the greater the tendency for coverage of infrastructure services such as water supply, sanitation, public lighting, cable services, etc. The normalisation of the indicator was done similarly to , with the highest exposure value being attributed to the third quartile of the sample and above. Values also vary between 0 and 1. The construction of the to the Canal do Mangue catchment resulted in Equation (4).
—flood depth indicator.
This indicator computes the potential damage of the considered flood event, representing the potential hazard. The maximum flood depth gives the value of the indicator, that is, depending on the maximum depths and the expected damages caused by these depths, a normalised value between 0 and 1 is attributed to the indicator through an exponential function. Thus, the greater the depth of flooding, the greater the potential damage to structures, goods and people exposed. A water depth of 1.30 m, which was chosen to represent very high potential damage (this would be the value that could cause integral losses inside a household), represents the highest value, while water depths bellow 0.15 m nullify the indicator. The normalised formulation can be seen in Equation (5).
2.2.2. Sub-Index of Risk to Material Recovery Capacity ()
This represents the socioeconomic part of the flood risk, through a “relative value” indicator relating the flood depth to the potential damage according to the income range of the population which is directly exposed to flood. Its formulation is presented in the form of Equation (6).
—relative value indicator.
This represents the economic recovery capacity of a region against the damages of a given flood event. The indicator is calculated using the relationship between potential economic losses and the capacity to replace these losses, represented by the difference between the total income and the average expenditure of a family. In this way, is intended to represent a socioeconomic variable, equalised according to the relationship between the potential loss caused by the flooding event and the economic class of the exposed population, assessing not an absolute loss, but rather, the ability to recover from the damage suffered. is given by Equation (7).
where
- : Cost of damage to a building
- : Cost of damage to building contents
- : Total area built in the analysis unit
- : Building susceptibility indicator
- : Total Income of the population in the analysed region
- : Average replacement capacity of the population in the analysed region
The whole formulation of this indicator can be found in Rezende et al. (2018) [50] and is based in Salgado (1995) [58].
—building susceptibility sub-indicator.
The indicator of the susceptibility of buildings is represented by the average height of the buildings in the analysed region. Buildings with one floor are more susceptible to flooding damages than multi-floors buildings. This indicator is used as a correction factor to the , which is based on flood depth-damage curves.
—social vulnerability indicator.
This indicator represents the portion of a region’s social vulnerability related to the percentage of people who are potentially the most vulnerable to flood events, from a physical point of view. It is related with people vulnerability to the hazard, represented by the velocity factor indicator (the product of flow velocity and water depth) and how rapid velocities can drag a person with the flow [59]. is given by Equation (8).
where
- : indicator of vulnerable persons
- : indicator of non-vulnerable persons
- : velocity factor indicator for vulnerable people
- : velocity factor indicator for non-vulnerable people
The whole formulation of this indicator can be found in Rezende et al. (2018) [50].
and—vulnerability of people sub-indicators.
represents the direct proportion of the population that is younger than 15 and older 60 years of age, in relation to the total population. It represents people who are more prone to flooding consequences. is the complement of the .
—velocity factor sub-indicator.
The velocity factor (VF) directly indicates the potential to drag people away during a flood event. The normalisation of considers previous studies on the stability of people when exposed to water [60]. Based on this study, two risk classifications of the loss of stability were developed for vulnerable and non-vulnerable groups, as shown in Table 1.
The normalised formulations of and are given by Equations (9) and (10).
2.2.3. Sub-Index of Risk to System Functional Capacity ()
This represents the system’s ability to continue providing part of its services during a flood event. This subscript considers the mobility risk indicator, represented by the relationship between road hierarchy and non-attendance by rail transport with the flooding event. This sub-index indicates the impact of the flood on traffic and people. It also assesses the impact on rescue access through the analysis of flooding of fire department resources and their surroundings, indicating potential difficulties in carrying out emergency actions. The general formulation is given by Equation (11).
—aid access difficulty indicator.
This indirectly represents the difficulty of a given region to receive help from a specialised aid team. In the present study, due to ready access to data, the Fire Department of Rio de Janeiro in the Canal do Mangue catchment was used. Each facility was associated with an influence area, which can be penalised when the flood reaches the position where the Fire Department is installed. The penalisation considers the flood depth, representing the difficulty or even the impossibility of exiting the building.
—mobility risk indicator.
The mobility risk indicator represents how much the transportation system is affected by a flood event, assessing the potential impact on the traffic of cars and people mobility. For this, it uses a road hierarchy indicator and a non-compliance indicator for rail transport, relating them to a permanence factor of flooding, as a hazard indicator. is given by Equation (12).
—road hierarchy sub-indicator.
This indicator is given by the highest route hierarchy within the analysis area, according to the values presented in Table 2. The information of this hierarchy comes from CET-Rio, an organ of the Municipal Transport Department of Rio de Janeiro City.
—non-rail transport service sub-indicator.
This evaluates the lack of availability of subways or train stations in a radius of 1000 m and 500 m, indicating the places with the highest coverage of transport services, which would indirectly present better possibilities for mobility during flooding events. is given by the complement of the rail system offer indicator , ranked according to the classification presented in Table 3.
—permanence factor sub-indicator.
is the hazard indicator relative to the permanence of flooding. This indicator indirectly assesses the stormwater network’s ability to drain floods, evaluating the time that urban areas stay flooded. It considers three classes: (i) water depths between 10 cm and 25 cm (T1); (ii) between 25 cm and 50 cm (T2); and (iii) above 50 cm (T3). Each class is normalised according to a maximum time for which the maximum impact of flooding could be reached. The definition of the maximum hazard time for each class considers the relative impact for the urban system. Thus, for class T1, areas flooded for three hours would have a high impact on the mobility of people, restricting their movements and increasing the possibility of transmission of waterborne diseases. For class T2, with floods of up to 50 cm, sidewalks are surpassed and traffic can be affected, assuming that a 60-min period of flooding is sufficient to result in a high negative impact. For class T3, a period of 30 min could have a significant impact on traffic, with total disruption, in case of floods exceeding 50 cm in depth. is calculated by Equation (13).
Equations (14)–(16) show the normalisation of each term of the . The weights considered in this study aimed to prioritise the impact of higher water levels, considering the following values: a = 0.10; b = 0.22; and c = 0.68. These weights were originally proposed in the work of Zonensein [49].
with,
- : total duration of floods with water depths between 10 cm and 25 cm
- : total duration of floods with water depths between 25 cm and 50 cm
- : total duration of floods with water depths greater than 50 cm
2.3. A New Methodological Framework to Measure Urban Flood Resilience
This item presents in an organised and reproducible way for the logical sequence of the necessary procedures to apply the tools to evaluate urban flood resilience, considering the new framework proposed in this paper. It aims to provide a quick guide to facilitate the application of this methodology in other basins.
The existing tools already provide useful information for applications, for example, in mapping the results of specific sets of flood control interventions. However, a systemic overview and the proper organisation of these tools are essential to promote a systemic approach to the process of FRM. Therefore, the project should be oriented according to a risk logic, and not only “damages and losses reduction” internalising the residual risk from potential future uncertainties.
To provide a comprehensive view of the proposed framework, a flowchart of the necessary steps to assess the flood resilience in urban basins using the UFRI is presented in Figure 5. The following steps describe the development of the resilience assessment proposed in this paper, according to the criterion of future scenarios assessment, based on the use of a flood modelling process and UFRI mapping.
1. Watershed delimitation
Once the urban system to be evaluated has been established, the river basins that contribute to the system must be physically defined.
2. Delimitation of the modelling domain
In this phase, the areas that will be considered for the detailed hydrodynamic modelling process should be delimitated. If the modelling domain does not cover the whole basin, the boundary conditions must be defined.
3. Delimitation of the interest domain
The domain of interest must cover the entire threatened urban system. This step is very important and should be done with caution, since an incorrect definition of the limits of the domain of interest can exclude strategic or vulnerable areas from the analysis, thereby distorting the results.
4. Determination of the modelling system
The application of the method proposed in this paper allows a resilience evaluation to be performed in a concentrated way for the entire basin, providing a single value of resilience for the whole system. However, the use of UFRI necessitates defining the hydrodynamic modelling tool’s needs. It should be able to simulate flooding events considering the flow occurring both in the main channels and on the urban plains, providing results of flooding in the whole urban space. For a better evaluation of the system, the use of two-dimensional or quasi-2D modelling systems is recommended.
5. Definition of the modelling scenarios
The number of modelling scenarios will depend on the number of interventions sets to be evaluated. Each scenario should represent, in current and future situations, the drainage system conditions, the urban characteristics of the basin, and the hydrological events. The intersection of these conditions determines the final scenarios to be simulated.
6. Hydrological modelling
This step aims to estimate the design storms, as well as inflows to the modelling domain, which will be used in the hydrodynamic modelling phase. The scale of evaluation, concerning critical events to the urban watershed, should define the storm events.
7. Hydrodynamic modelling
Once the modelling tool and the simulation scenarios have been set, the database for hydrodynamic modelling is created, considering the boundary conditions imposed by possible downstream restrictions and flood hydrographs from upstream reaches. This step results in the responses of the hazard-related parcels of flood events (water depths, flow velocities and flooding permanence) for each of the simulation scenarios.
8. Socioeconomic and environmental information survey
This step can be carried out soon after the definition of the watershed area (step 1) or even after the delimitation of the domain of interest (step 3), in order to reduce the amount of information to be assessed, by limiting the survey area to that which will realistically be evaluated. Commonly, several government agencies provide necessary information for this study step, such as income distribution, population and built density, land use, road hierarchy, public services coverage, etc.
9. Constitution of independent indicators
Some of the proposed indicators that compose the UFRI depend only on social, economic and/or environmental information, and do not suffer from variations in flood dynamics. Such indicators are elaborated from the mapping of the socioeconomic and environmental information in the area of interest, comprising part of the vulnerability of the region. If future scenarios include land use changes or the implementation of adaptive measures in the urban system to increase resilience to floods, these indicators may also need to be revised.
10. Constitution of the dependent indicators
Beyond the flood hazard indicators themselves, which refer to the maximum flooding depth, maximum flow velocity and flooding permanence, there is also a series of socioeconomic indicators that vary according to the flooding response. Thus, these flood-dependent indicators, representing both the hazards and the associated vulnerability, are composed after running the simulation scenarios, which will provide the information necessary to complement the calculations.
11. Calculation of flood risk sub-indexes
After the construction of all the independent and dependent indicators, it is possible to calculate the subindexes of flood risk, which are divided into the three groups that relate to the resilience of a system: (i) capacity to resist; (ii) ability to recover; and (iii) ability to maintain operations, that is, the ability to remain functional.
12. Mapping the urban flood resilience index
From the flood risk sub-indexes, the Urban Flood Resilience Index can be mapped in the domain of interest for each simulation scenario, considering the return period of the storm and the conditions of the drainage system and the urban patterns. In this step, the partial UFRI maps, which represent resilience to floods, are drawn from a static point of view, as a direct response to a given set of hydrological events.
13. Evaluation of the urban resilience
Flood resilience must assume a multi-temporal characteristic, in which the response of the urban system involves the occurrence of several possible events, internalising the residual risk to the risk evaluation and management process, either by incorporating future scenarios with changes in the variables of hazard or vulnerability, or by the evaluation of hydrological events superior to the design storm. In this paper, one evaluation method is addressed, named here future scenarios criterion. In this evaluation approach, the occurrence of an intense hydrological event (with a pre-defined return period) in an adverse future scenario is considered, comparing the consequent UFRI results with the current scenario. From the mapping of the UFRI in each scenario (current and future) for the reference events, the average values of the UFRI in the urban system are calculated. The average UFRI results for each scenario are embedded in a resilience scale calculus, which will provide a numerical value to support the evaluation of the performance of urban interventions for flood mitigation, considering potential future stresses to the system. The next item provides more details about this proposed method.
2.4. Future Scenarios Criterion
Male [61] defines resilient infrastructures as “those systems of assets that will be able to survive and perform well in an increasingly uncertain future”. Considering this statement, the methodology proposed by Miguez & Vérol [28], which considers the analysis of future scenarios, is applied to assess the resilience of urban drainage systems to floods. In this method, the flood resilience of a basin is measured on a scale that evaluates the efficiency of a set of urban interventions to mitigate floods and the associated loss of efficiency when facing a future scenario of changes in land use patterns or climate conditions, based on the decrease of flood risk protection. To complete this analysis, the future risk of doing nothing is also estimated and compared with the behaviour of a set of future interventions. The method is better explained on the following.
In addition to the probability of occurrence of events of greater magnitude than that of the design event, when the actions to reduce flood risks are defined, there are uncertainties regarding the potential disturbance in the current hydrological patterns related to the climate change. Most studies comprising future assessments of the urban system operations consider the impacts of climate change using the Representative Concentration Pathway RCP-4.5 scenario, which represents a medium impact scenario, with a temperature increase between 0.9 and 2.0 °C for the year of 2040 [62]. When considering the end of the century, this increase may reach up to 6 °C [63].
Considering that the variation found in precipitation rates has an approximately linear behaviour in relation to the atmospheric temperature variation [64], estimates of the possible impacts of global climate change on intense rainfall regimes indicate a probability of increases of between 8% and 24% in precipitation volume.
In the case of coastal cities, there are also predictions of changes in mean sea levels (MSL), which could have significant impacts on the drainage systems of these regions. Global projections estimate potential increases of MSL of between 0.26 m and 0.55 m by the year 2100 in an optimistic scenario, and of between 0.45 m and 0.82 m in a more pessimistic one [65]. For Brazil, it is estimated that the MSL could behave similarly to these estimates [66], with a minimum increase of about 0.50 m [67]. Such changes will stress the operations of drainage networks based on the current criteria of hydrological and hydraulic standards, which do not consider the potential impacts of climate change.
The method to estimate flood resilience (FResI) proposed by Miguez [28] is here adapted for use with the UFRI as input, allowing assessments to be made of urban flood resilience considering the capacity to absorb potential future impacts. The original formulation used the FRI, that computes flood characteristics and possible consequences, using flood depths, flow velocities, flooding duration, affected dwellings, income, sanitation conditions and road hierarchies. The original FResI calculated a mean value of resilience to the entire watershed, comparing the variation of a flood risk index over time, assuming one current and one future condition [28], and considering that resilience was greater as the risk was lower—resilience was considered to work against risk materialisation.
The aFResI proposed in this paper is given directly by the resilience index and not with the application of a flood risk index, as proposed in the original paper. The adapted method uses the same mathematical construction, but it has incorporated a weight system to the two parcels that compose the aFResI, the loss of efficiency of the solution in a future situation (P1) and the efficiency of the solution in the future situation (P2), presented in the form of Equation (17).
aFResI = adapted resilience index, with values between 0 e 1
P1 = parcel 1, which measures the loss of efficiency of the solution proposed in a future situation when compared to the present.
P2 = parcel 2, which measures the efficiency of the solution in the future situation, relating the behaviour of the system with and without the proposed set of measures in the future, subjected to the stressing conditions considered.
e = parcels weights
The parcel 1 (P1) is calculated by the subtraction of value 1 (100% of efficiency maintained) from the project UFRI in the present situation minus the project UFRI in the future situation divided by project UFRI in the present situation. Equation (18) presents the components of P1.
Parcel 2 (P2) represents UFRI considering a future with the implementation of the proposed project compared with doing nothing. It is calculated by the relationship between UFRI with project minus UFRI for doing nothing (no actions), both in the future situation, divided by UFRI with the project implementation in the future situation. P2 is calculated by Equation (19).
The future scenario examined in this study considers a medium impact scenario of climate change, with an increase of 0.50m on MSL and a 16% increment in precipitation intensity.
2.5. Case Study: Canal Do Mangue Catchment
The Canal do Mangue catchment (Figure 6) was chosen as a case study to exemplify the discussions in this work. This catchment is located in the northern part of the city of Rio de Janeiro, covering parts of downtown and the traditional neighbourhoods of Tijuca, Vila Isabel, Maracanã, Rio Comprido, Andaraí and Grajaú. Important landmarks are located at Canal do Mangue catchment, as the Maracanã Stadium, the Imperium Museum and the old railway station of Leopoldina. It drains a total area of around 45 km², presenting very steep headwater hills and a large lowland limited by the Guanabara Bay. Part of the lowlands is the result of landfills over wetlands and seashore areas in the Guanabara Bay, which were installed during the Portuguese imperial period for sanitation purposes and urban growth. This geomorphological pattern favours flooding at downstream plains, where the major part of the population is settled.
The catchment covers a highly urbanised area with consolidated occupation, and is one of the areas which is most susceptible to flooding in Rio de Janeiro. Part of the urban occupation, however, refers to informal substandard occupations (the “favelas”). In this kind of situation (dense occupation, high runoff generation and uncontrolled flows), structural measures based on sustainable urban drainage techniques are required within the compensatory measures approach, in a concept expressed by Baptista et al. [68]. In recent decades, we have been noticing considerable evolution in urban stormwater management concepts, covering aspects from low impact development to water sensitive urban design (see Fletcher et al., 2015). All approaches converge upon a strategy for urban stormwater management that favours source control measures distributed over the watershed, minimising urbanisation impacts in water cycle, comprising integrated solutions within urban landscape [69] and recovering part of the original hydrological functions.
2.6. Simulation Scenarios
The use of simulation scenarios can provide useful responses to basin to pre-defined storm events, considering possible alternatives to flood risk control by introducing interventions in the drainage system or by adapting urban configuration.
In this way, the present research considers the hypothesis that an urban system supported by smaller stormwater detention measures, distributed on the watershed, could offer greater resilience to flooding than that presented by systems with large and concentrated flood control structures. The evaluation of this hypothesis was carried out with the use of the proposed method and the simulation of one baseline situation and two project alternatives, with both being supported by mathematical modelling. The proposed method aims to support decision-making process, providing a tool to evaluate and compare multiple design approaches and different sets of interventions. Therefore, the proposed index was constructed to incorporate not only drainage system aspects, but also socioeconomic variables. This characteristic allows evaluations to be carried out of both interventions directly in the drainage network (flood control measures) and adaptation strategies to the urban environment, attempting to identify for vulnerability reductions.
In this paper, due to the case study comprises an already highly urbanised area, only flood control measures were considered in FSC application. This is therefore not a limitation of the proposal. Data availability, characteristics of the study area and modeller decisions will define the analysis aspect. The case study is used as an example to confirm the usability of the tool and the proposed framework. Therefore, the proposed scenarios aim to analyse the response of the drainage system to hydrological events simulating present and future conditions, considering the “doing nothing” alternative and two different design alternatives to the drainage system: C0—without interventions; C1—with concentrated interventions; C2—with distributed interventions.
The first condition without interventions (C0) aims to provide a baseline, allowing later comparisons with the project alternatives. It considers the hydraulic conditions of the urban drainage system without any measures being taken.
Then, the mathematical model is adapted to introduce large stormwater detention tanks (C1) to store part of the discharge of the main channels, reducing the peak flow. This alternative aims to reduce the hydraulic overload in some channel reaches with low flow capacity.
Finally, the model is adapted to introduce smaller detention structures (C2), which are distributed throughout the basin. These structures are located at the bottom of hillsides and on urban occupied plains, prioritising public spaces such as squares, gardens and parking lots, integrating drainage solutions into the urban open space system.
The evaluation of a more distributed set of interventions assumes a global tendency of urban stormwater management which tries to deal with flood events in a more sustainable way. As concluded by Zhang et al. [48], “the combination of conventional and decentralised stormwater management systems, which not only protect environmental quality but also promote water and energy savings, will prove to be the most practical solution for most cities in the future”. Therefore, the case study contributes to reinforcing the advantages of adopting distributed measures to face stormwater issues.
The simulation scenarios include a combination of hydrological events with urban system conditions. The hydrological scenarios can represent probabilities of occurrence (return periods) or future changes in climate behaviour. The urban system conditions can represent land uses and adaptations measures in drainage networks.
A climate scenario with MSL elevation and an increase in the rainfall volume reproduces the potential adversity in the Future Scenarios Criterion (FSC), which was applied in this study. This configuration aims to test the behaviour of the drainage system with the two proposed alternatives of intervention in a possible scenario of climate change. Note that this choice reflects a possible future stressing factor to the watershed, considering that it already presents dense occupation and problems related with unplanned land use and uncontrolled urban growth, including the presence of slums in the hilly areas.
The application of the FSC for the analysis of the urban flood resilience in this study considers the rainfall event with a 25-year RP, regarding the Brazilian national standards used for major drainage network assessments [70]. This configuration produces six simulation scenarios, as shown in Figure 7.
3. Results and Discussion
The resilience, as addressed in the technical discussion of this paper, is part of the risk management acting as a counterpoint to the fragilities of the urban system in the face of potential flood impacts. An estimation of the final flood resilience of the watershed is then carried out using the future scenarios criterion, which allows assessments to be made of flood control scenarios from a future impact perspective. Flood resilience mapping using the UFRI and flood resilience estimated by aFResI considering two different flood control projects are presented in the following items.
This research explores an alternative path for the evaluation of flood risk reduction plans, assuming the inverse logic of the simple damage reduction objective objective and, consequently, creating an approach focused on increasing the resilience to floods of the urban system.
The planning of urban interventions for damage reduction based on traditional flood risk management leads to the proposition of “flood control” measures, usually with large structural solutions, which, initially provide feasible hydraulic results for the system, considering a hydrological event of reference. However, by internalising the residual risk, concentrating solutions in large structures can reduce the system’s resilience, putting it at risk of uncertainties that can stress defensive measures, such as the occurrence of larger events, the lack of drainage maintenance, variations in the pattern of urbanisation or future changes in climatic patterns.
On the other hand, the resilience-based approach prioritises adaptive measures that seek to harmonise the relationship between the city and the flood cycle, since the very concept of resilience relies not only on the system’s responsiveness, but also on its ability to absorb and coexist with the negative impacts of floods.
In this work, the applicability tests for the proposed framework were undertaken to evaluate the potential loss of efficiency considering two design solutions for drainage system, taking into account the impacts of climate changes. This choice was suited to the case studied, since the Canal do Mangue watershed is already a consolidated urban area and there are few possibilities for urban changes. In this case, climate change was assumed as a future stressing condition. The results showed the advantages of adopting distributed measures which could better deal with increments in the runoff. In this section, only the final results are presented and discussed, as the main goal of this research is not to discuss in detail the formulation of the particular terms of the index, but to validate the framework as a whole.
3.1. Application of the UFRI in the Present
The spatial results of the UFRI application show the great response of the system after the implementation of the flood control measures for both project scenarios, as shown in Figure 8. UFRI mapping for Scenario 0 (C0) shows the current situation of the basin, with extensive low resilience areas. The difference between project scenarios (C1 and C2) shows the positive effect of more distributed measures over the basin, proposed on Scenario 2 (C2), resulting in a more spatialised impact of flooding reduction and, as a consequence, of increased resilience.
The permanence of several areas with low and moderate resilience (UFRI < 0.5) indicates the high criticality of flood problems in the Canal do Mangue catchment. Indeed, the basin suffers from frequent flooding events that cause huge damage and losses to the city. Most of these recurrent problems occur as a result of urban drainage system inefficiency and, at a lower frequency, because of the hydraulic incapacity of the main channels.
Due to its location in a flat urban area, the drainage system already presents natural flow difficulties imposed by physiographic conditions. Therefore, action is necessary to organise the superficial water flows produced by urban areas. The use of permeable pavements and distributed stormwater reservoirs may offer a solution, prioritising rainwater storage which mimics the basin’s natural behaviour. The result of Scenario 2 (C2) shows the impact of the adoption of distributed measures, reducing shallower and persistent floods.
A comparative evaluation of mapping the final results of UFRI in Canal do Mangue catchment can be performed by analysing the potential of reducing areas with low resilience and increasing areas with high resilience. In order to illustrate this analysis, the areas in different resilience ranges were accounted by classes, as shown in the UFRI scale presented in Table 4.
From this classification, the areas mapped within each of the five resilience classes were counted for each simulation scenario, considering the UFRI mapping resulting from the occurrence of a storm event of 25-year RP. This evaluation makes it possible to observe an important impact of the project alternatives in the reduction of areas with very low resilience and in the increase of areas with high and very high resilience. The graphic in Figure 9 shows the distribution of the resilience classes in the percentage of the area, considering the domain of interest.
The adoption of distributed measures (C2) allowed us to increase in areas classified with very high resilience by 41%, while the very low resilient areas were reduced by 87%. When considering the concentrated measures (C1), the very high resilient areas increased by 33%, while those classified with very low resilience were reduced by 77%.
3.2. Application of the Future Scenarios Criterion—FSC
The evaluation of urban flood resilience based on the FSC considers the value of the UFRI integrated for the entire urban basin. This value is calculated through the aFResI Equations, adapted from Miguez & Veról [28]. The average values of UFRI are for each simulated scenario (C0, C1 and C2), in the present and in the future.
The integrated UFRI of the watershed is represented by its average value, calculated by the area-weighted average, applied to all cells of the domain of interest. Table 5 shows the average value of UFRI for each scenario, before and after the implementation of flood control measures, and considering the current climate conditions and potential climate change in a future scenario, reflected in the MSL rise and the increase of stormwater intensity.
These values are applied in the aFResI Equations to calculate the urban flood resilience, considering future changes in hazard behaviour (flooding characteristics, as water depth, flow velocity and flooding permanence). Once these characteristics result both from the storms, which cause superficial flows, and from the tide, which causes resistance to stormwater flows, the potential impacts of climate change can affect the whole drainage system.
The results of the application of aFResI are presented in Equations (20)–(22) for scenario C1 (concentrated interventions), and in Equations (23)–(25) for scenario C2 (distributed interventions).
- aFResI for Scenario C1—concentrated interventions:
- aFResI for Scenario C2—distributed interventions:
The results show an advantage to the second set of interventions, prioritising distributed measures. The C2 was 24% more resilient. The weights were chosen equally for both parcels of the aFResI equation, but this was just an arbitrary choice. In fact, the weights definition process should be determined by decision makers according to their perceptions of the watershed characteristics and the urban pattern occupation. For example, if the decision maker is mainly worried about future challenges, P2 may receive a higher weight. In contrast, if the main worry is the design of a system that is capable of retaining its efficiency, P1 will receive greater weight. In this case study, the bigger the weight of the P2 parcel (weight b), the higher the relative increment in resilience achieved by the implementation of designed measures in C2. This behaviour is visualised in Figure 10, which presents the difference in aFResI for both intervention alternatives, considering three different criteria for the weighting process. In these examples, aFResI is 35% greater when P2 has a higher weighted value (0.75), and only 11% greater in the case where the P2 weight is lower (0.25).
In this case study, the partial results were able to show the best option, but it is not expected that the results will always be so clear. Note that the case compared distributed measures against more concentrated measures. However, both solutions involved stormwater storage propositions. If the design scenario had also considered an increase in channels dimensions, this type of measure would probably lead to efficient results in the present, but to much less resilient results in the future, since overflows would occur almost freely due to greater future discharges. In this way, we could obtain good present results, albeit overshadowed by a greater loss in the functional capacity in the future, which could produce some variations in the parcel results.
4. Conclusions
In complex systems like cities interacting and being affected by water dynamics, several interventions in different combinations can be “good solutions” to reduce potential damages from flood events. However, what does a good solution mean? Is it the best option today? Or perhaps it can be not the best today, but the one that can better resist future challenges? Thus, it’s necessary to improve the available tools for supporting the design process, and it would be useful to have an assessing method which is capable of assisting decision makers to prioritise resilience actions, taking into account the fact that resilience is a key feature in a changing (and uncertain) future.
This paper aimed to propose an alternative pathway to evaluate design options for urban flood control, assessing resilience in quantitative terms. In this way, it presented a methodological framework to assess and consider flood resilience in urban watershed planning and design through the application of the Urban Flood Resilience Index (UFRI) and the Future Scenarios Criterion (FCS). The proposed method shifts the traditional approach of simply reducing floods or flood losses by creating a framework which is focused on assessing flood resilience in urban systems, considering the results over time.
The resilience-based approach is also capable of prioritising the use of adaptive measures in the design process, aiming to reconcile city functions and flood events. Therefore, the resilience concept motivates the search for solutions which make cities more prepared to live with floods, even in stressing conditions, as in scenarios of climate change. Although the UFRI is not capable of directly measuring human risk perception, the proposed framework can be used to evaluate potential urban development booms in flood-prone areas resulting from the reduction of flood frequency as a consequence of flood control investments. In this way, false risk perception can be properly addressed in urban planning when structural flood measures are being considered.
The UFRI allowed the resilience values on the watershed to be spatialised. On the other hand, the Future Scenarios Criteria were able to present integrated results on resilience variation, from present to future conditions, for different design alternatives, considering climate change effects or unplanned urbanisation scenarios, for example.
In particular, a case study was developed and presented to illustrate the methodology, using the Canal do Mangue watershed in Rio de Janeiro/Brazil, as an example. This study considered two possible design alternatives for flood control: one with concentrated and the other with distributed measures. The proposed framework worked as expected, allowing comparisons to be made between the various options, and showing the advantages of adopting distributed measures over the watershed, which was reflected in a resilience value that was 24% higher compared to the results obtained for the set of concentrated solutions. The specific result refers to a choice of equal weights in the formulation. This is just one of the possible results, and decision makers are free to revise the distribution of the weights from case to case, as necessary.
By providing one integrated resilience value to the entire basin, the FSC criterion allowed comparisons to be easily made between the proposed interventions, considering its adaptive capacity in the face of future uncertainties. However, this integrated result composes one of the main contributions of this research. The spatialised resilience maps can be used to improve each design alternative, identifying the critical areas. It can be also useful not only to assess flood control projects, but also actions in the urban landscape. If a set of urban design measures are adopted, including urban zoning, restricting or limiting occupation in fragile flood-prone areas, or defining minimum standards to flood-proof buildings, these actions can be evaluated within the proposed framework.
Despite its limitation, i.e., mainly in representing human behaviour aspects of resilience, the present study aims to contribute to a more robust flood resilience assessment in urban catchments. The indicator formulations and index methodological steps were proposed and explained in the present study, aiming to provide a replicable framework for tests, comparative studies and urban planning.
Therefore, the resilience approach can be used as a supporting tool for the hierarchising of a varied set of interventions and for defining the greatest positive impacts on complex city system behaviour. In a more comprehensive way, the proposed framework goes towards the ecosystem evaluation principle, in which the ability of a system to withstand the impacts of anthropic modifications is evaluated.
In future, the research will assess the applicability of the framework in non-occupied areas of growing cities, in order to provide an evaluation method for planning urban development. The application of the framework should be able to provide decision-making processes with predicted responses of the watershed to flooding events, given a set of potential land uses and urban patterns. The expected result is to prove the applicability of this framework in urban planning. The continued application of the framework, especially in regions that are suffering occupation pressure, will be fundamental in addressing the key challenge highlighted by Keating et al. [39]: “if resilience cannot be empirically verified, how can we know we are measuring actual resilience?”. We hope that the present findings will allow improvements to be made, both in sustainable urban planning and in the flood resilience measurement framework itself.
Author Contributions
Conceptualisation, O.M.R. and M.G.M.; Data curation, O.M.R.; Formal analysis, O.M.R. and F.M.M.; Investigation, O.M.R.; Methodology, O.M.R. and M.G.M.; Resources, A.N.H.; Supervision, A.N.H. and M.G.M.; Visualisation, F.M.M.; Writing—original draft, O.M.R.; Writing—review & editing, A.N.H. and M.G.M.
Funding
This research was funded by Coordenação de Aperfeiçoamento de Pessoal de Nível Superior-Brasil (CAPES) (Finance Code 001) and Conselho Nacional de Desenvolvimento Científico e Tecnológico (CNPq).
Acknowledgments
The authors wish to acknowledge the administrative support provided by the Programa de Engenharia Ambiental of UFRJ (PEA-POLI/EQ—UFRJ) and Programa de Engenharia Civil of UFRJ (PEC-COPPE/UFRJ) and the technical support provided by Aquafluxus Water Resources Environmental Consulting.
Conflicts of Interest
The authors declare no conflict of interest.
Abbreviations
| aFResI | Adapted Flood Resilience Index |
| BMPs | Best Management Practices |
| CBA | Cost-Benefit Analysis |
| FResI | Flood Resilience Index |
| FRI | Flood Risk Index |
| FRM | Flood Risk Management |
| FSC | Future Scenarios Criterion |
| GI | Green Infrastructure |
| LID | Low Impact Development (LID) |
| MODCEL | Urban Flow Cell Model, in Portuguese, Modelo de Células de Escoamento |
| MSL | Mean Sea Level |
| RP | Return Period |
| RCP | Representative Concentration Pathway |
| SES | Social-ecological system |
| SuDS | Sustainable Urban Drainage Systems |
| UFRI | Urban Flood Resilience Risk |
| WSUD | Water Sensitive Urban Design |
References
- Sörensen, J.; Persson, A.; Sternudd, C.; Aspegren, H.; Nilsson, J.; Nordström, J.; Jönsson, K.; Mottaghi, M.; Becker, P.; Pilesjö, P.; et al. Re-Thinking Urban Flood Management—Time for a Regime Shift. Water 2016, 8, 332. [Google Scholar] [CrossRef]
- Driessen, P.; Hegger, D.; Kundzewicz, Z.; van Rijswick, H.; Crabbé, A.; Larrue, C.; Matczak, P.; Pettersson, M.; Priest, S.; Suykens, C.; et al. Governance Strategies for Improving Flood Resilience in the Face of Climate Change. Water 2018, 10, 1595. [Google Scholar] [CrossRef]
- Brown, R.R.; Keath, N.; Wong, T.H.F. Urban water management in cities: historical, current and future regimes. Water Sci. Technol. 2009, 59, 847–855. [Google Scholar] [CrossRef] [PubMed]
- Sayers, P.; Yuanyuan, L.; Galloway, G.; Penning-Rowsell, E.; Fuxin, S.; Kang, W.; Yiwei, C.; Le Quesne, T. Flood Risk Management: A Strategic Approach; UNESCO: Pairs, France, 2013; ISBN 9789230011598. [Google Scholar]
- Nascimento, N.O.; Ellis, J.B.; Baptista, M.B.; Deutsch, J.-C. Using detention basins: operational experience and lessons. Urban Water 1999, 1, 113–124. [Google Scholar] [CrossRef]
- UNISDR. Economic Losses, Poverty & Disasters—1998–2017; Centre for Research on the Epidemiology of Disasters & UN Office for Disaster Risk Reduction: Genebra, Switzerland, 2017. [Google Scholar]
- Zevenbergen, C.; Fu, D.; Pathirana, A. Transitioning to Sponge Cities: Challenges and Opportunities to Address Urban Water Problems in China. Water 2018, 10, 1230. [Google Scholar] [CrossRef]
- Fletcher, T.D.; Shuster, W.; Hunt, W.F.; Ashley, R.; Butler, D.; Arthur, S.; Trowsdale, S.; Barraud, S.; Semadeni-Davies, A.; Bertrand-Krajewski, J.L.; et al. SUDS, LID, BMPs, WSUD and more—The evolution and application of terminology surrounding urban drainage. Urban Water J. 2015, 12, 525–542. [Google Scholar] [CrossRef]
- Barría, P.; Cruzat, M.L.; Cienfuegos, R.; Gironás, J.; Eucariaza, C.; Bonilla, C.; Moris, R.; Ledezma, C.; Guerra, M.; Rodríguez, R.; et al. From Multi-Risk Evaluation to Resilience Planning: The Case of Central Chilean Coastal Cities. Water 2019, 1–24. [Google Scholar] [CrossRef]
- Kaykhosravi, S.; Khan, U.; Jadidi, A. A Comprehensive Review of Low Impact Development Models for Research, Conceptual, Preliminary and Detailed Design Applications. Water 2018, 10, 1541. [Google Scholar] [CrossRef]
- Sharma, A.K.; Pezzaniti, D.; Myers, B.; Cook, S.; Tjandraatmadja, G.; Chacko, P.; Chavoshi, S.; Kemp, D.; Leonard, R.; Koth, B.; et al. Water sensitive urban design: An investigation of current systems, implementation drivers, community perceptions and potential to supplement urban water services. Water 2016, 8, 272. [Google Scholar] [CrossRef]
- Holman-Dodds, J.K.; Bradley, A.A.; Potter, K.W. Evaluation of hydrologic benefits of infiltration based urban storm water management. J. Am. Water Resour. Assoc. 2003, 39, 205–215. [Google Scholar] [CrossRef]
- Dierkes, C.; Göbel, P.; Benze, W.; Wells, J. Next Generation Water Sensitive Stormwater Management Techniques. In Proceedings of the Second national conference on water sensitive urban design, Brisbane, Australia, 2–4 September 2000. [Google Scholar]
- Swan, A.; Stovin, V.R.; Saul, A.J.; Walker, N. Modelling SUDS with deterministic urban drainage models. In Proceedings of the 1st National Conference on Sustainability Drainage, Coventry University, Coventry, UK, 18–19 June 2001. [Google Scholar]
- Swan, A. How increased urbanisation has induced flooding problems in the UK: A lesson for African cities? Phys. Chem. Earth 2010, 35, 643–647. [Google Scholar] [CrossRef]
- Morita, M. Flood risk impact factor for comparatively evaluating the main causes that contribute to flood risk in urban drainage areas. Water 2014, 6, 253–270. [Google Scholar] [CrossRef]
- Gunderson, L.; Holling, C.S. Panarchy: Understanding Transformations in Human and Natural Systems; Gunderson, L., Holling, C.S., Eds.; Island Press: Washington, DC, USA, 2002; ISBN 1559638567. [Google Scholar]
- Cumming, G.S.; Barnes, G.; Perz, S.; Schmink, M.; Sieving, K.E.; Southworth, J.; Binford, M.; Holt, R.D.; Stickler, C.; Van Holt, T. An exploratory framework for the empirical measurement of resilience. Ecosystems 2005, 8, 975–987. [Google Scholar] [CrossRef]
- Goonetilleke, A.; Thomas, E.; Ginn, S.; Gilbert, D. Understanding the role of land use in urban stormwater quality management. J. Environ. Manage. 2005, 74, 31–42. [Google Scholar] [CrossRef] [PubMed] [Green Version]
- Spence, K.; Bridge, J.; Mcluckie, D.; Kandasamy, J. Urban Stormwater and Flood Management. In Urban Stormwater and Flood Management. Applied Environmental Science and Engineering for a Sustainable Future; Jegatheesan, V., Goonetilleke, A., van Leeuwen, J., Kandasamy, J., Warner, D., Myers, B., Bhuiyan, M., Spence, K., Parker, G., Eds.; Applied Environmental Science and Engineering for a Sustainable Future; Springer International Publishing: Cham, Switzerland, 2019; pp. 139–157. ISBN 978-3-030-11817-4. [Google Scholar]
- Koutsoyiannis, D. Advances in Urban Flood Management; CRC Press: Boca Raton, FL, USA, 2007; ISBN 9788578110796. [Google Scholar]
- Pottier, N.; Penning-Rowsell, E.; Tunstall, S.; Hubert, G. Land use and flood protection: Contrasting approaches and outcomes in France and in England and Wales. Appl. Geogr. 2005, 25, 1–27. [Google Scholar] [CrossRef]
- Miguez, M.G.; Veról, A.P.; Rêgo, A.Q.d.S.F.; Lourenço, I.B. Urban Agglomeration and Supporting Capacity: The Role of Open Spaces within Urban Drainage Systems as a Structuring Condition for Urban Growth. In Urban Agglomeration; InTech: Vienna, Austria, 2018; Volume 2, pp. 137–164. ISBN 9789537619992. [Google Scholar]
- Di Baldassarre, G.; Viglione, A.; Carr, G.; Kuil, L.; Salinas, J.L.; Blöschl, G. Socio-hydrology: Conceptualising human-flood interactions. Hydrol. Earth Syst. Sci. 2013, 17, 3295–3303. [Google Scholar] [CrossRef]
- De Bruijn, K.M. Resilience and flood risk management. Water Policy 2004, 6, 53–66. [Google Scholar] [CrossRef]
- Withanachchi, S.S.; Kunchulia, I.; Ghambashidze, G.; Al Sidawi, R.; Urushadze, T.; Ploeger, A. Farmers’ perception of water quality and risks in the Mashavera River Basin, Georgia: Analyzing the vulnerability of the social-ecological system through community perceptions. Sustainability 2018, 10, 3062. [Google Scholar] [CrossRef]
- Barendrecht, M.H.; Viglione, A.; Blöschl, G. A dynamic framework for flood risk. Water Secur. 2017, 1, 3–11. [Google Scholar] [CrossRef]
- Miguez, M.G.; Veról, A.P. A catchment scale Integrated Flood Resilience Index to support decision making in urban flood control design. Environ. Plan. B Urban Anal. City Sci. 2017, 44, 925–946. [Google Scholar] [CrossRef]
- Han, N.-X.; Xing, F.; Han, N.-X.; Xing, F. A Comprehensive Review of the Study and Development of Microcapsule Based Self-Resilience Systems for Concrete Structures at Shenzhen University. Materials 2016, 10, 2. [Google Scholar] [CrossRef] [PubMed]
- Beer, F.; Johnston, E.R.; Eisenberg, E. Vector Mechanics for Engineers: Statics and Dynamics; McGraw-Hill Education: New York, NY, USA, 2009; ISBN 978-0-07-352940-0. [Google Scholar]
- Janssen, M.A.; Bodin, Ö.; Anderies, J.M.; Elmqvist, T.; Ernstson, H.; McAllister, R.R.J.; Olsson, P.; Ryan, P. Toward a network perspective of the study of resilience in social-ecological systems. Ecol. Soc. 2006, 11, 15. [Google Scholar] [CrossRef]
- Holling, C.S. Engineering Resilience versus Ecological Resilience. Eng. Ecol. Constraints 1996, 31–34. Available online: http://www.environmentalmanager.org/wp-content/uploads/2008/03/holling-eng-vs-eco-resilience.pdf (accessed on 17 July 2019).
- Adger, W.N. Social and ecological resilience: are they related? Prog. Hum. Geogr. 2000, 24, 347–364. [Google Scholar] [CrossRef]
- Mak, W.W.S.; Ng, I.S.W.; Wong, C.C.Y. Resilience: Enhancing well-being through the positive cognitive triad. J. Couns. Psychol. 2011, 58, 610–617. [Google Scholar] [CrossRef] [PubMed]
- Rivera, F.I.; Kapucu, N. Geography and Resilience; Springer International Publishing: Cham, Switzerland, 2015; ISBN 978-3-319-16452-6. [Google Scholar]
- Folke, C. Resilience: The emergence of a perspective for social-ecological systems analyses. Glob. Environ. Chang. 2006, 16, 253–267. [Google Scholar] [CrossRef]
- Weichselgartner, J.; Kelman, I. Geographies of resilience. Prog. Hum. Geogr. 2014, 39, 249–267. [Google Scholar] [CrossRef] [Green Version]
- Meerow, S.; Newell, J.P.; Stults, M. Defining urban resilience: A review. Landsc. Urban Plan. 2016, 147, 38–49. [Google Scholar] [CrossRef]
- Keating, A.; Campbell, K.; Szoenyi, M.; Mcquistan, C.; Nash, D.; Burer, M. Development and testing of a community flood resilience measurement tool. Nat. Hazards Earth Syst. Sci. 2017, 17, 77–101. [Google Scholar] [CrossRef] [Green Version]
- Chen, K.F.; Leandro, J. A Conceptual Time-Varying Flood Resilience Index for Urban Areas: Munich City. Water 2019, 11, 830. [Google Scholar] [CrossRef]
- McBain, W.; Wilkes, D.; Retter, M. Flood Resilience for Critical Infrastructure and Services; CIRIA: London, UK, 2010; ISBN 978-0-86017-688-6. [Google Scholar]
- Kötter, T.; Vafeidis, A.; Moghadas, M.; Asadzadeh, A.; Fekete, A. A multi-criteria approach for assessing urban flood resilience in Tehran, Iran. Int. J. Disaster Risk Reduct. 2019, 35, 101069. [Google Scholar]
- Murdock, H.; de Bruijn, K.; Gersonius, B.; Murdock, H.J.; De Bruijn, K.M.; Gersonius, B. Assessment of Critical Infrastructure Resilience to Flooding Using a Response Curve Approach. Sustainability 2018, 10, 3470. [Google Scholar] [CrossRef]
- Cutter, S.L.; Barnes, L.; Berry, M.; Burton, C.; Evans, E.; Tate, E.; Webb, J. A place-based model for understanding community resilience to natural disasters. Glob. Environ. Chang. 2008, 18, 598–606. [Google Scholar] [CrossRef]
- Batica, J. Methodology for Flood Resilience Assessment in Urban Environments and Mitigation Strategy Development. Ph.D. Thesis, Université Nice Sophia, Antipolis, France, 2015. [Google Scholar]
- Baptista, S.R. Design and Use of Composite Indices in Assessment of Climate Change Vulnerability and Resilience; The Earth Institute, Columbia University: New York, NY, USA, 2014. [Google Scholar]
- Kotzee, I.; Reyers, B. Piloting a social-ecological index for measuring flood resilience: A composite index approach. Ecol. Indic. 2016, 60, 45–53. [Google Scholar] [CrossRef]
- Zhang, D.; Gersberg, R.M.; Ng, W.J.; Tan, S.K. Conventional and decentralized urban stormwater management: A comparison through case studies of Singapore and Berlin, Germany. Urban Water J. 2017, 14, 113–124. [Google Scholar] [CrossRef]
- Zonensein, J.; Gomes Miguez, M.; Cesar, F.; Mascarenhas, B. Flood Risk Index as an Urban Management Tool. In Proceedings of the 11th International Conference on Urban Drainage, Palermo, Italy, 23–26 September 2008. [Google Scholar]
- Rezende, O.M.; Miguez, M.G.; Franco, A.B.R.d.C.; Oliveira, A.K.B.; Miranda, F.M.; Jacob, A.C.P.; Sousa, M.M. Index of risk to material recovery capacity. In Proceedings of the 13th Sustainable Development of Energy, Water and Environment Systems (SDEWES); Faculty of Mechanical Engineering and Naval Architecture, Zagreb: Palermo, Italy, 2018; pp. 1–16. [Google Scholar]
- Rezende, O.M.; de Franco, A.B.R.; Oliveira, A.K.B.; Jacob, A.C.P.; Miguez, M.G. A Framework to Assess Urban Floods Resilience. In New Trends in Urban Drainage Modelling. UDM 2018; Mannina, G., Ed.; Springer: Cham, Switzerland, 2018; pp. 533–538. ISBN 978-3-319-99867-1. [Google Scholar]
- Bertilsson, L.; Wiklund, K.; de Moura Tebaldi, I.; Rezende, O.M.; Veról, A.P.; Miguez, M.G. Urban flood resilience—A multi-criteria index to integrate flood resilience into urban planning. J. Hydrol. 2019, 573, 970–982. [Google Scholar] [CrossRef]
- Mascarenhas, F.C.B.; Miguez, M.G. Urban flood control through a mathematical cell model. Water Int. 2002, 27, 208–218. [Google Scholar] [CrossRef]
- Miguez, M.G.; Battemarco, B.P.; De Sousa, M.M.; Rezende, O.M.; Veról, A.P.; Gusmaroli, G. Urban flood simulation using MODCEL-an alternative quasi-2D conceptual model. Water 2017, 9, 445. [Google Scholar] [CrossRef]
- Zanobetti, D.; Lorgeré, H. Le modèle mathématique du Delta du Mékong. La Houille Blanche 1968, 17–30. [Google Scholar] [CrossRef]
- Miguez, M.G.; Radesca, F.D.; Veról, A.P.; de Sousa, M.M.; Oliveira, L.F.G.S. Multilayer Modelling as a Supporting Tool for Flood Diagnosis and Drainage System Design. In New Trends in Urban Drainage Modelling. UDM 2018; Mannina, G., Ed.; Springer: Cham, Switzerland, 2019; pp. 490–495. ISBN 978-3-319-99867-1. [Google Scholar]
- Proag, V. The Concept of Vulnerability and Resilience. Procedia Econ. Financ. 2014, 18, 369–376. [Google Scholar] [CrossRef] [Green Version]
- Salgado, J.C.M. Economic Assessment of Drainage and Flood Control Projects in Urban Basins. Ph.D. Thesis, Universidade Federal do Rio de Janeiro, Rio de Janeiro, RJ, Brazil, 1995. [Google Scholar]
- Escudero-Bueno, I.; Torres, A.M.; Rodríguez, J.T.C.; Momparler, S.P. SUFRI Methodology for Pluvial and River Flooding Risk Assessment in Urban Areas to Inform Decision-Making; WP3 Final Report, ERA-NET CRUE, SUFRI project—Sustainable Strategies of Urban Flood Risk Management with non-structural measures to cope with the residual risk, 2nd ERA-Net CRUE Funding Initiative; Graz University of Technology: Styria, Austria, 2011. [Google Scholar]
- RESCDAM. The Use of Physical Models in Dam-Break Flood Analysis; Final Report; Helsinki University of Technology: Helsinki, Finland, 2000. [Google Scholar]
- McBain, W.; Wilkes, D.; Retter, M. Flood Resilience and Resistance for Critical Infrastructure; Ciria, Classic House: London, UK, 2010. [Google Scholar]
- Zanetti, V.; De Sousa Junior, W.; De Freitas, D. A Climate Change Vulnerability Index and Case Study in a Brazilian Coastal City. Sustainability 2016, 8, 811. [Google Scholar] [CrossRef]
- Marengo, J.A. Mudanças Climáticas Globais e seus Efeitos Sobre a Biodiversidade: Caracterização do Clima Atual e Definição das Alterações Climáticas para o Território Brasileiro ao Longo do século XXI, 2nd ed.; MMA: Brasilia, Brazil, 2017; Volume 1, ISBN 85-7738-038-6. [Google Scholar]
- Collins, M.; Knutti, R.; Arblaster, J.; Dufresne, J.-L.; Fichefet, T. Long-term Climate Change: Projections, Commitments and Irreversibility. In Climate Change 2013: The Physical Science Basis. Contribution of Working Group I to the Fifth Assessment Report of the Intergovernmental Panel on Climate Change; Stocker, T.F., Qin, D., Plattner, G.-K., Tignor, M., Allen, S.K., Boschung, J., Nauels, A., Xia, Y., Bex, V., Midgley, P.M., Eds.; Cambridge University Press: Cambridge, UK, 2013; p. 107. [Google Scholar]
- Stocker, T.F.; Dahe, Q.; Plattner, G.-K.; Alexander, L.V.; Allen, S.K.; Bindoff, N.L.; Bréon, F.-M.; Church, J.A.; Cubash, U.; Emori, S.; et al. IPCC Technical Summary AR5. Available online: https://www.ipcc.ch/site/assets/uploads/2018/02/WG1AR5_TS_FINAL.pdf (accessed on 17 July 2019).
- Marengo, J.A.; Scarano, F.R.; Klein, A.F.; Souza, C.R.G.; Chou, S.C. Impacto, vulnerabilidade e adaptação das cidades costeiras brasileiras às mudanças climáticas; Marengo, J.A., Scarano, F.R., Eds.; PBMC, COPPE-UFRJ: Rio de Janeiro, Brazil, 2016; ISBN 9788528503456. [Google Scholar]
- Santos, R.T.F. Efeitos da subida do nível do mar na inundação costeira na costa leste do Brasil devido às mudanças climáticas. Ph.D. Thesis, Federal University of Rio de Janeiro, Rio de Janeiro, Brazil, 2017. [Google Scholar]
- Baptista, M.; Nascimento, N.; Barraud, S. Técnicas Compensatórias em Drenagem Urbana, 1st ed.; ABRH: Porto Alegre, Brazil, 2011; ISBN 9788588686311. [Google Scholar]
- Hoang, L.; Fenner, R.A. System interactions of stormwater management using sustainable urban drainage systems and green infrastructure. Urban Water J. 2016, 13, 739–758. [Google Scholar] [CrossRef]
- Manual for Proposals for Sustainable urban Drainage Systems and Stormwater Management (in Portuguese); Ministério das Cidades: Brasília, Brazil, 2012.
Figure 1.
Schematic representation of an urban cell and how it works in a model mesh.

Figure 2.
Urban landscape flooding possibilities. (A) urban landscapes; (B) channel overflows; (C) storm drain overflows; (D) urban flooding.
Figure 2.
Urban landscape flooding possibilities. (A) urban landscapes; (B) channel overflows; (C) storm drain overflows; (D) urban flooding.

Figure 3.
The hierarchical arrangement of Urban Flood Resilience Index—UFRI.

Figure 4.
Composition of the Urban Flood Resilience Index—UFRI.

Figure 5.
Flowchart of procedures for estimating flood resilience in urban basins using UFRI.

Figure 6.
Localisation of Canal do Mangue catchment.

Figure 7.
Representation scheme of the simulation scenarios.

Figure 8.
Spatialisation of the UFRI doing nothing (C0) and with concentrated (C1) and distributed (C2) interventions. Results from a 25-year RP event.
Figure 8.
Spatialisation of the UFRI doing nothing (C0) and with concentrated (C1) and distributed (C2) interventions. Results from a 25-year RP event.

Figure 9.
Distribution of resilience classes in the percentage of the area of the domain of interest.
Figure 9.
Distribution of resilience classes in the percentage of the area of the domain of interest.

Figure 10.
Adapted Flood Resilience Index (aFResI) of Canal do Mangue catchment, considering different weighting for the Equations parcels.
Figure 10.
Adapted Flood Resilience Index (aFResI) of Canal do Mangue catchment, considering different weighting for the Equations parcels.


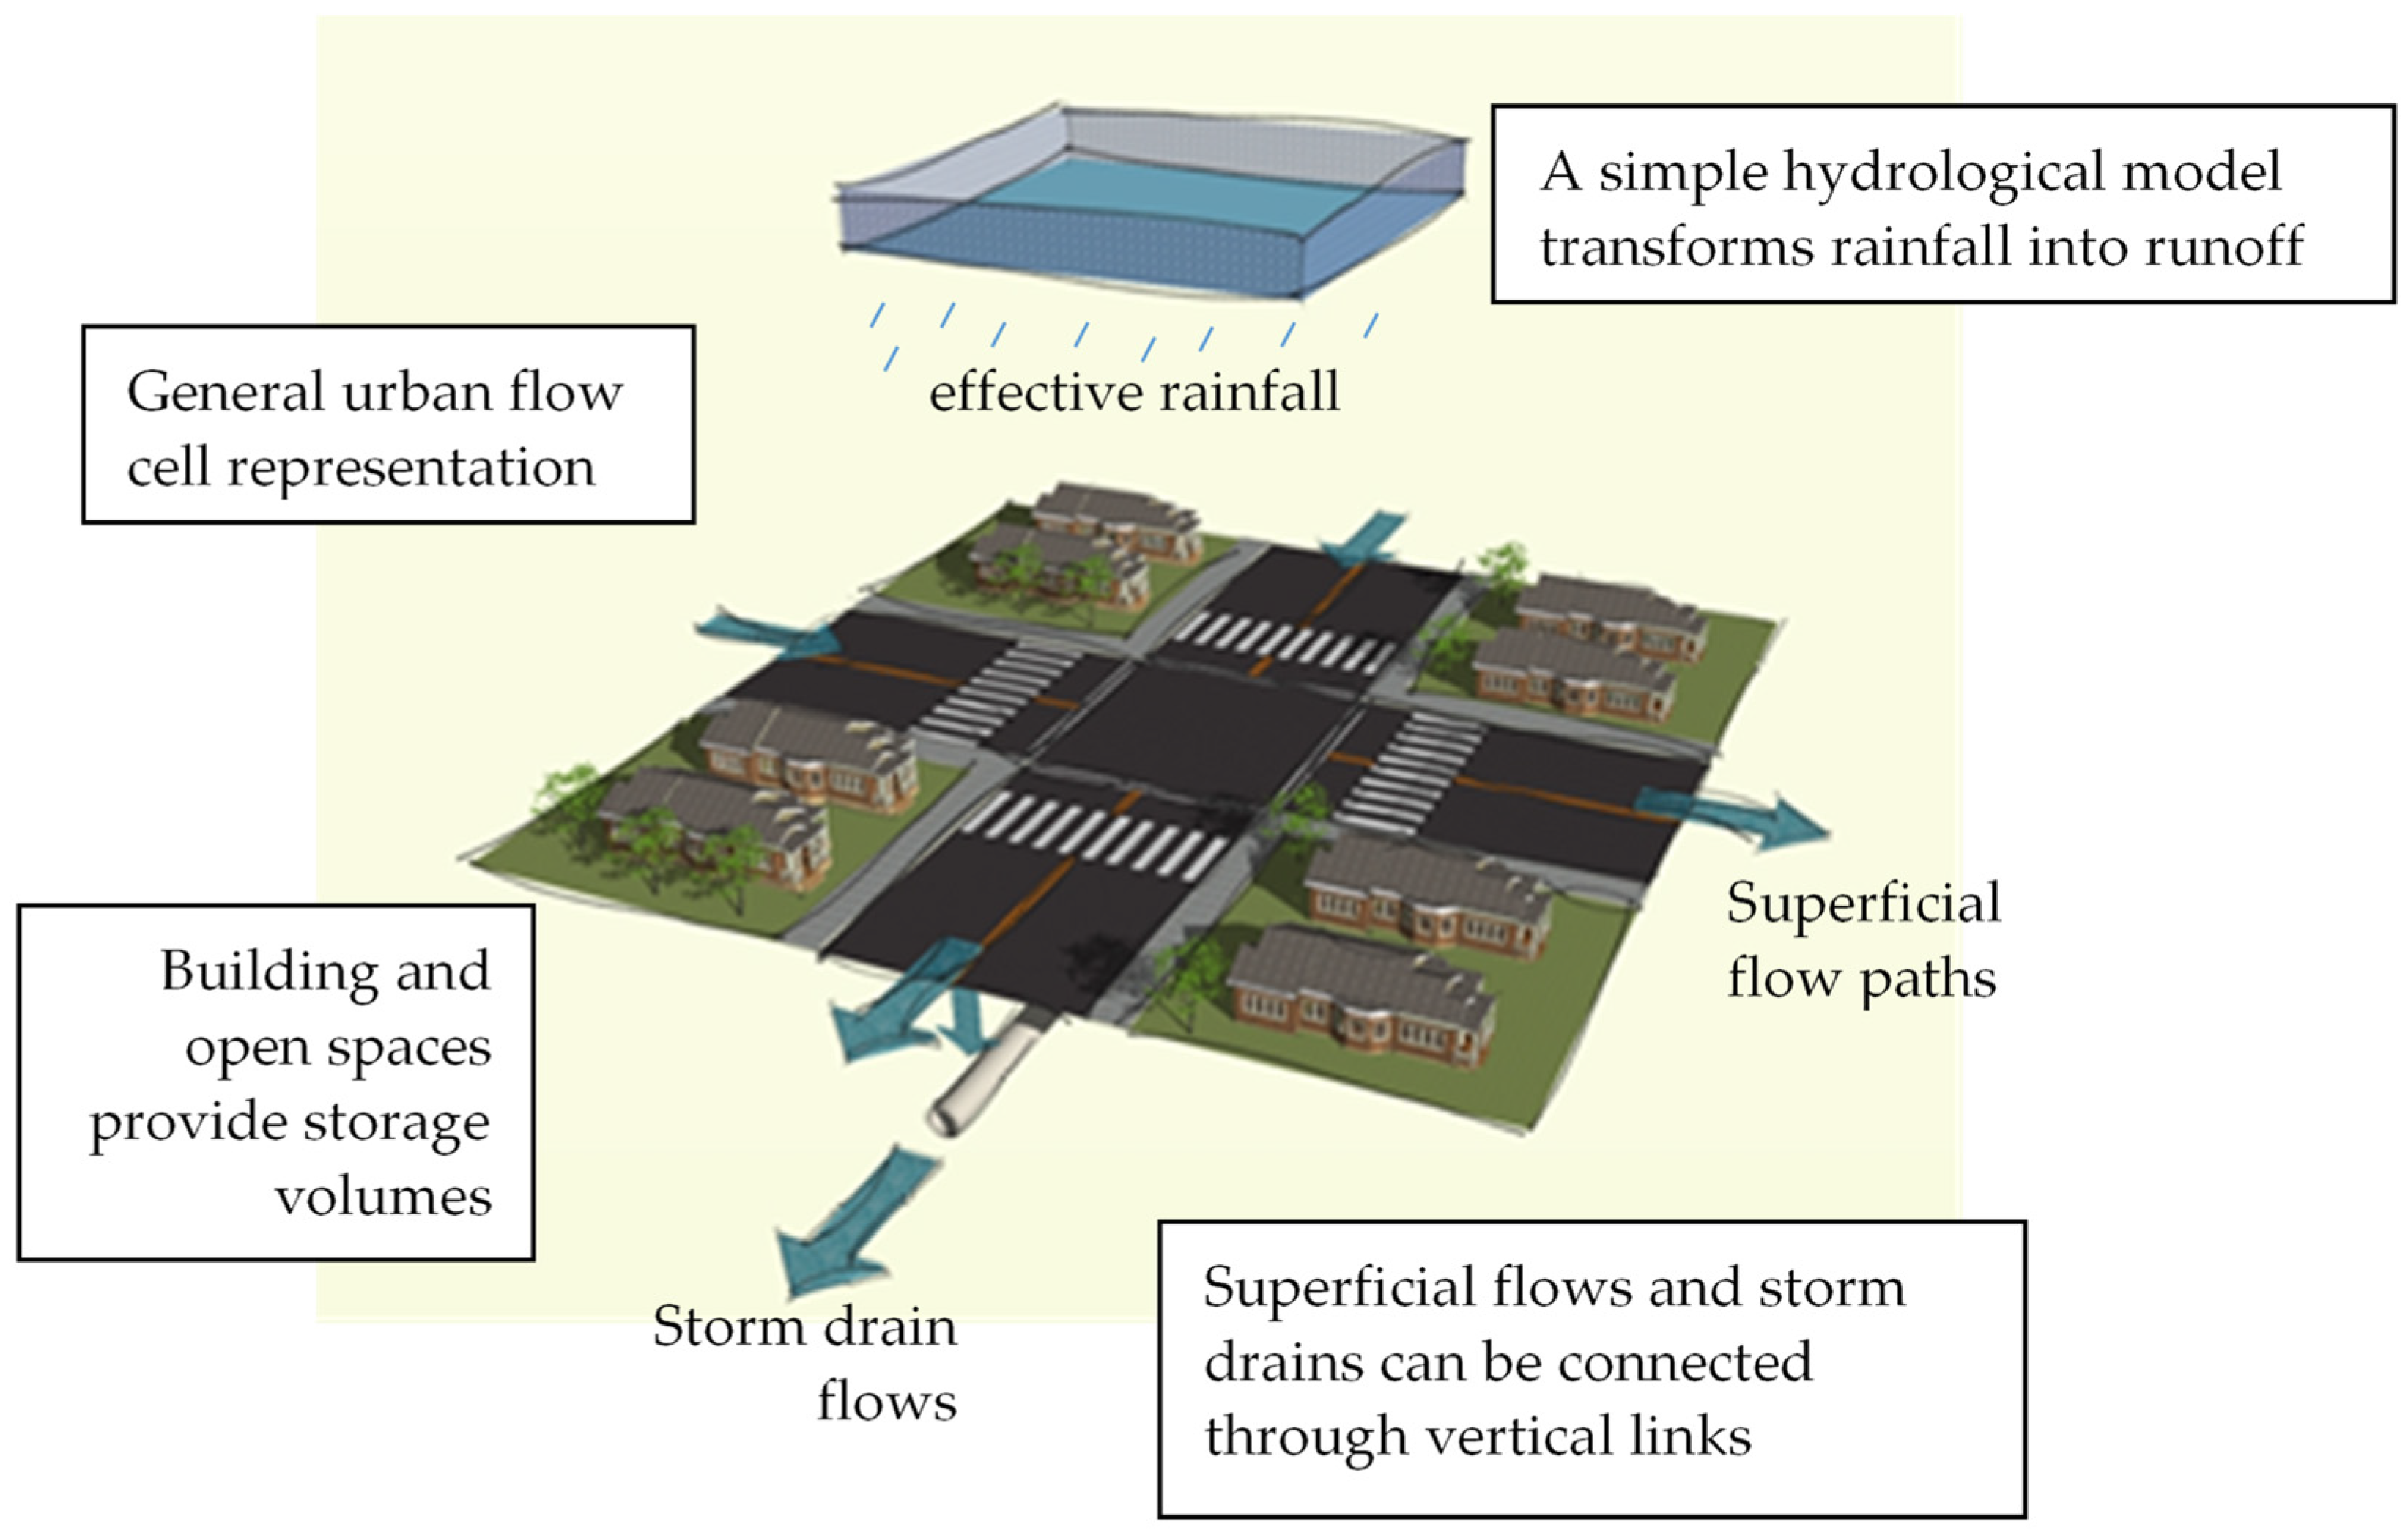
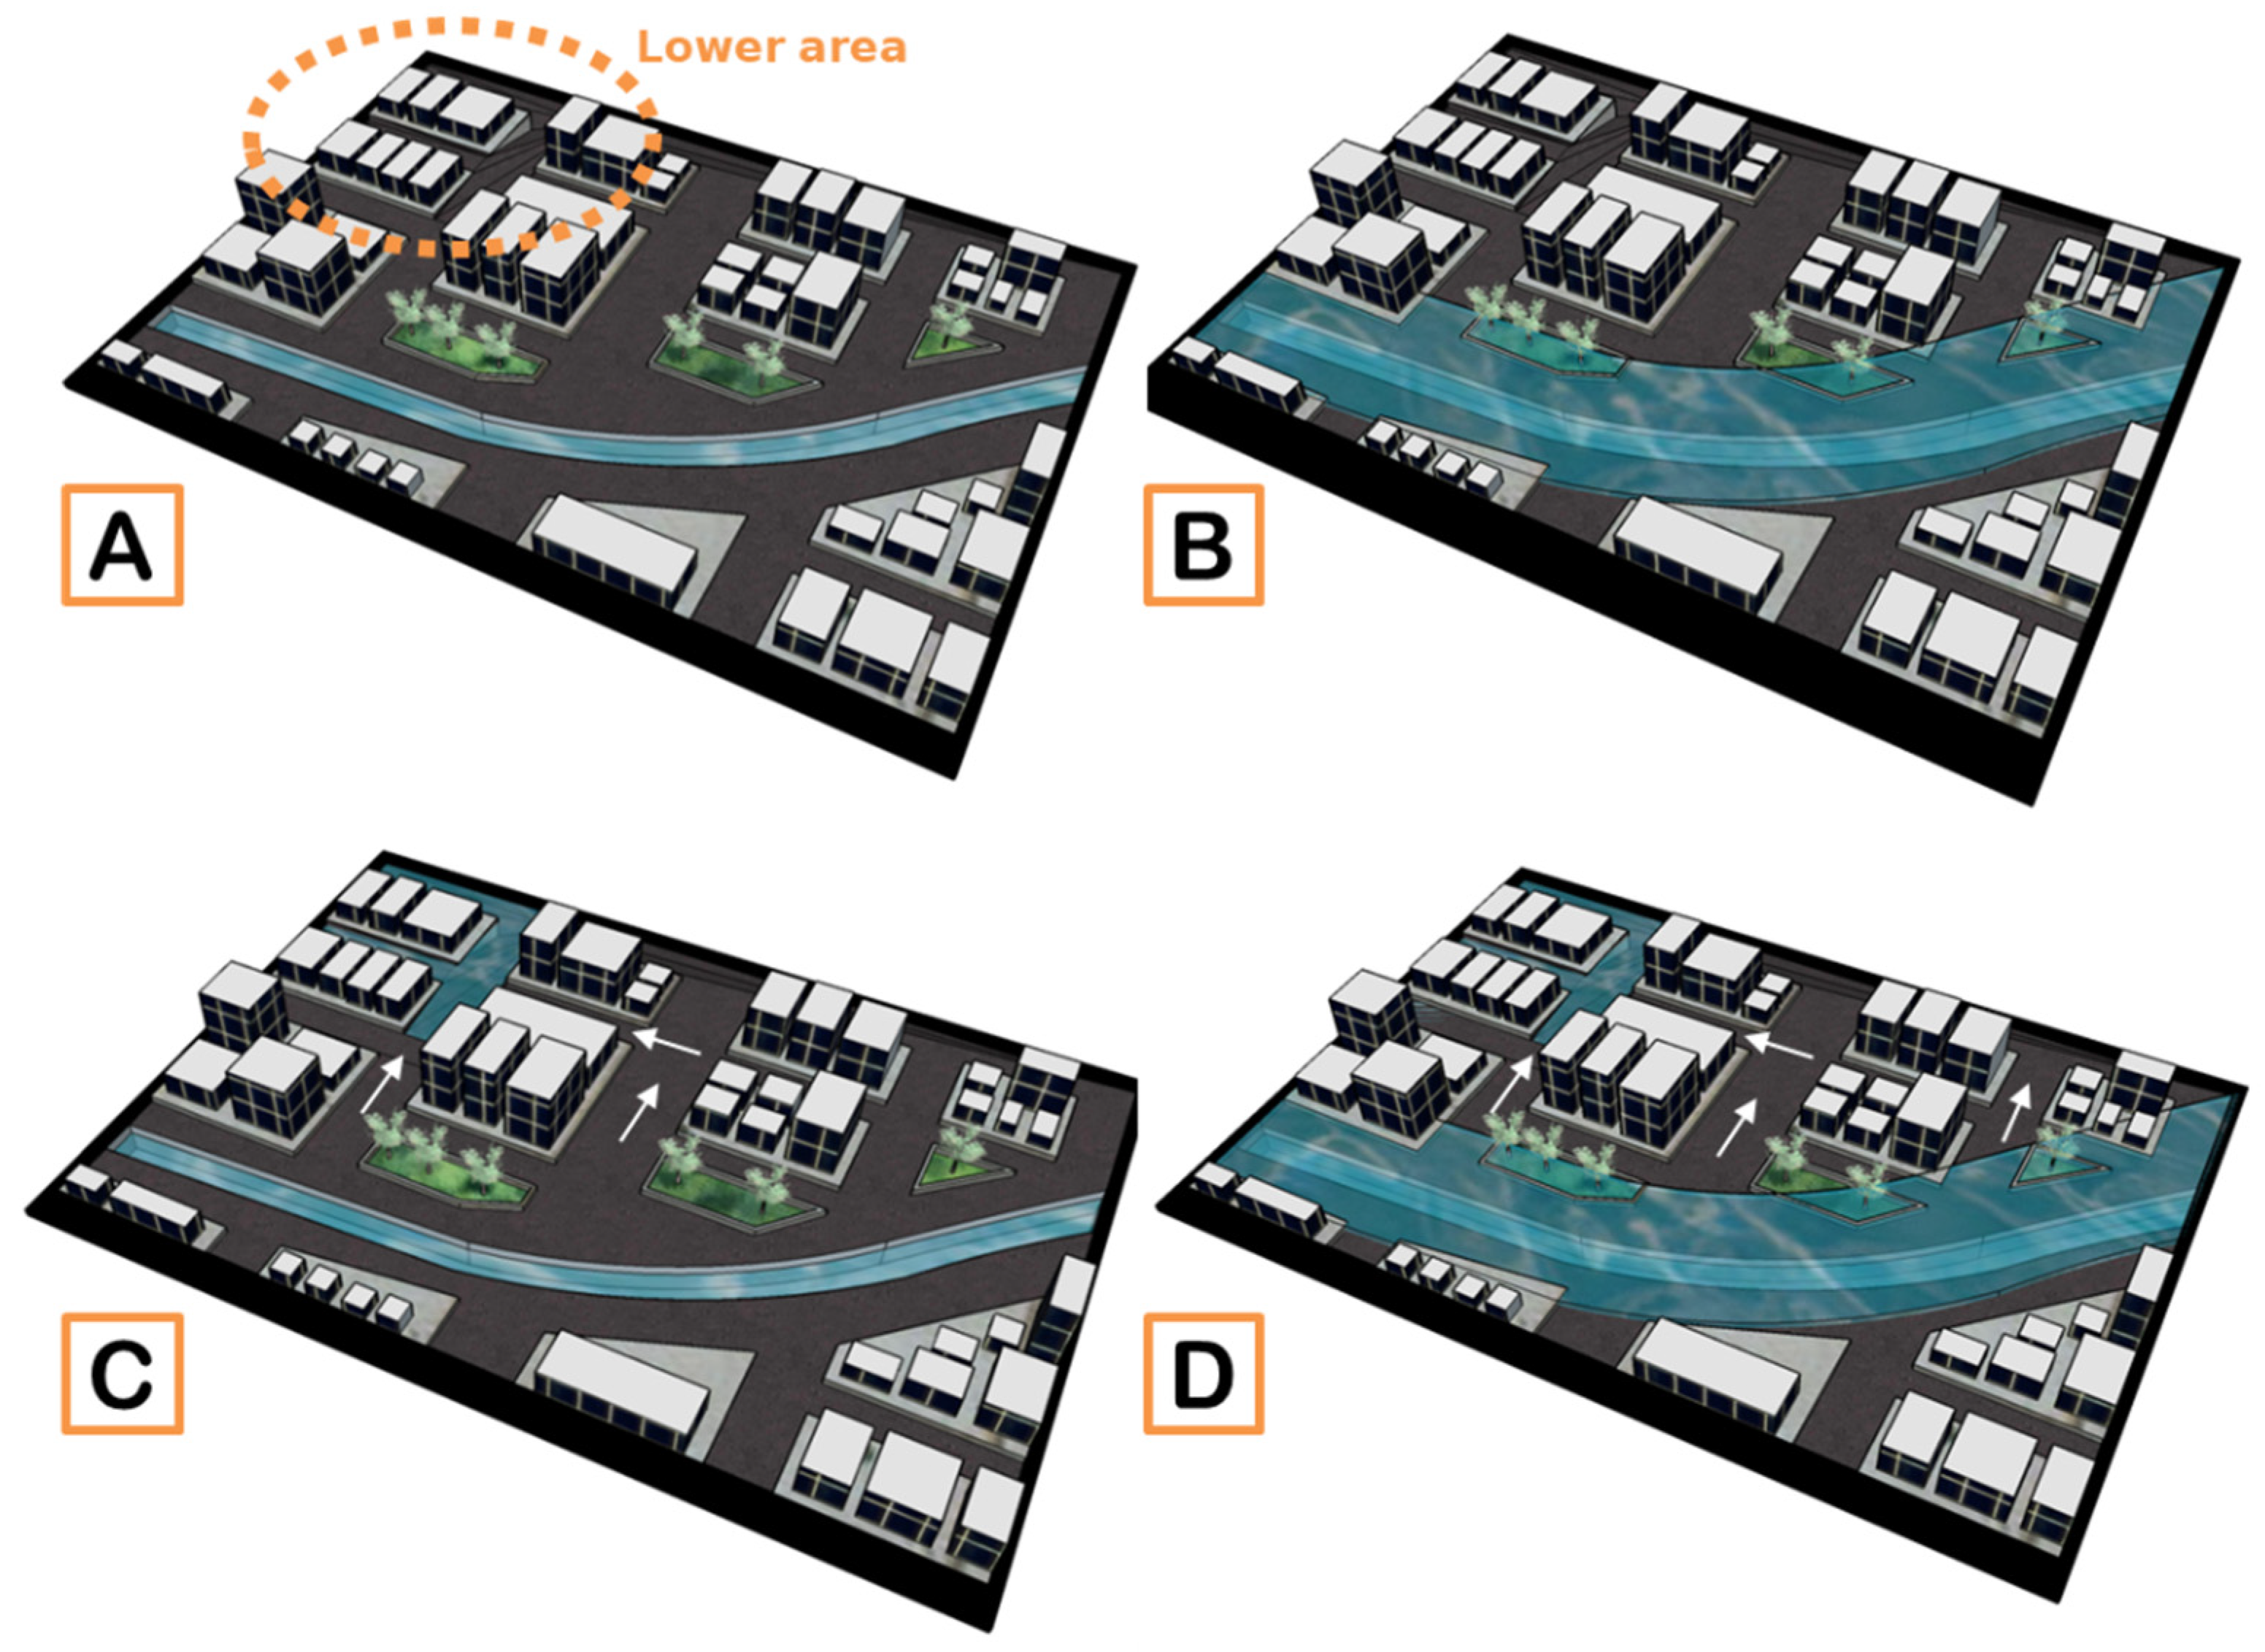
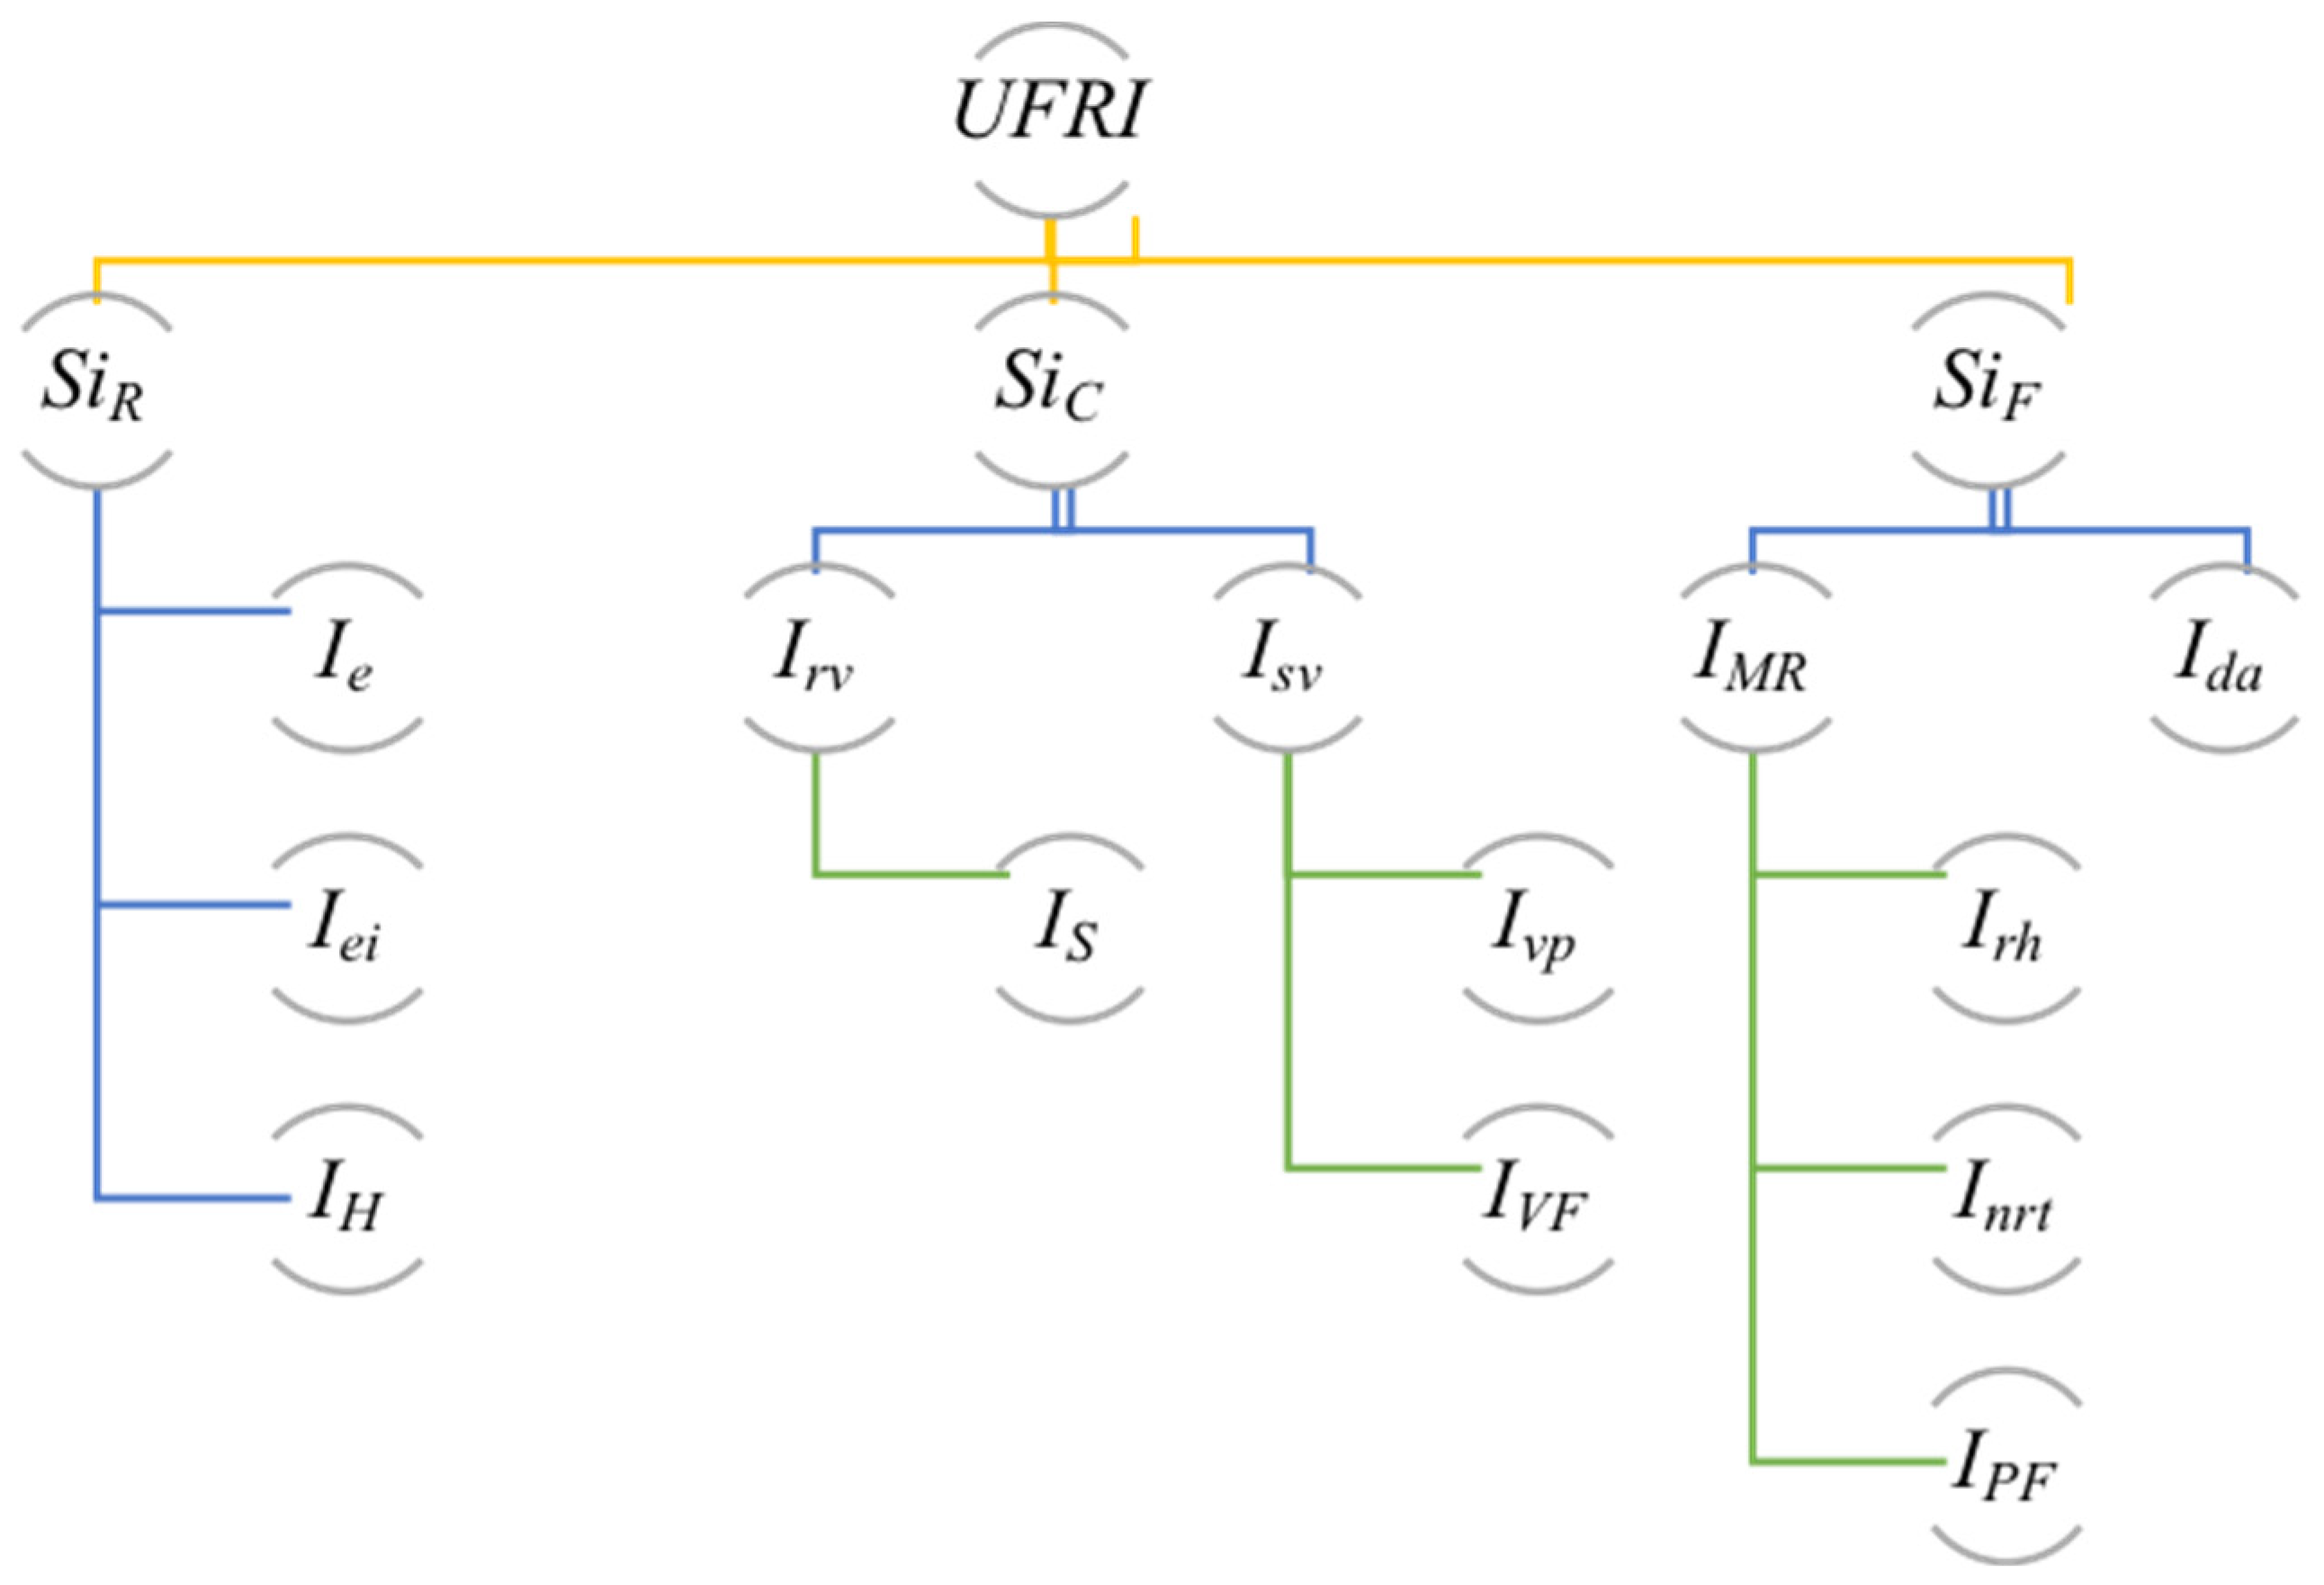
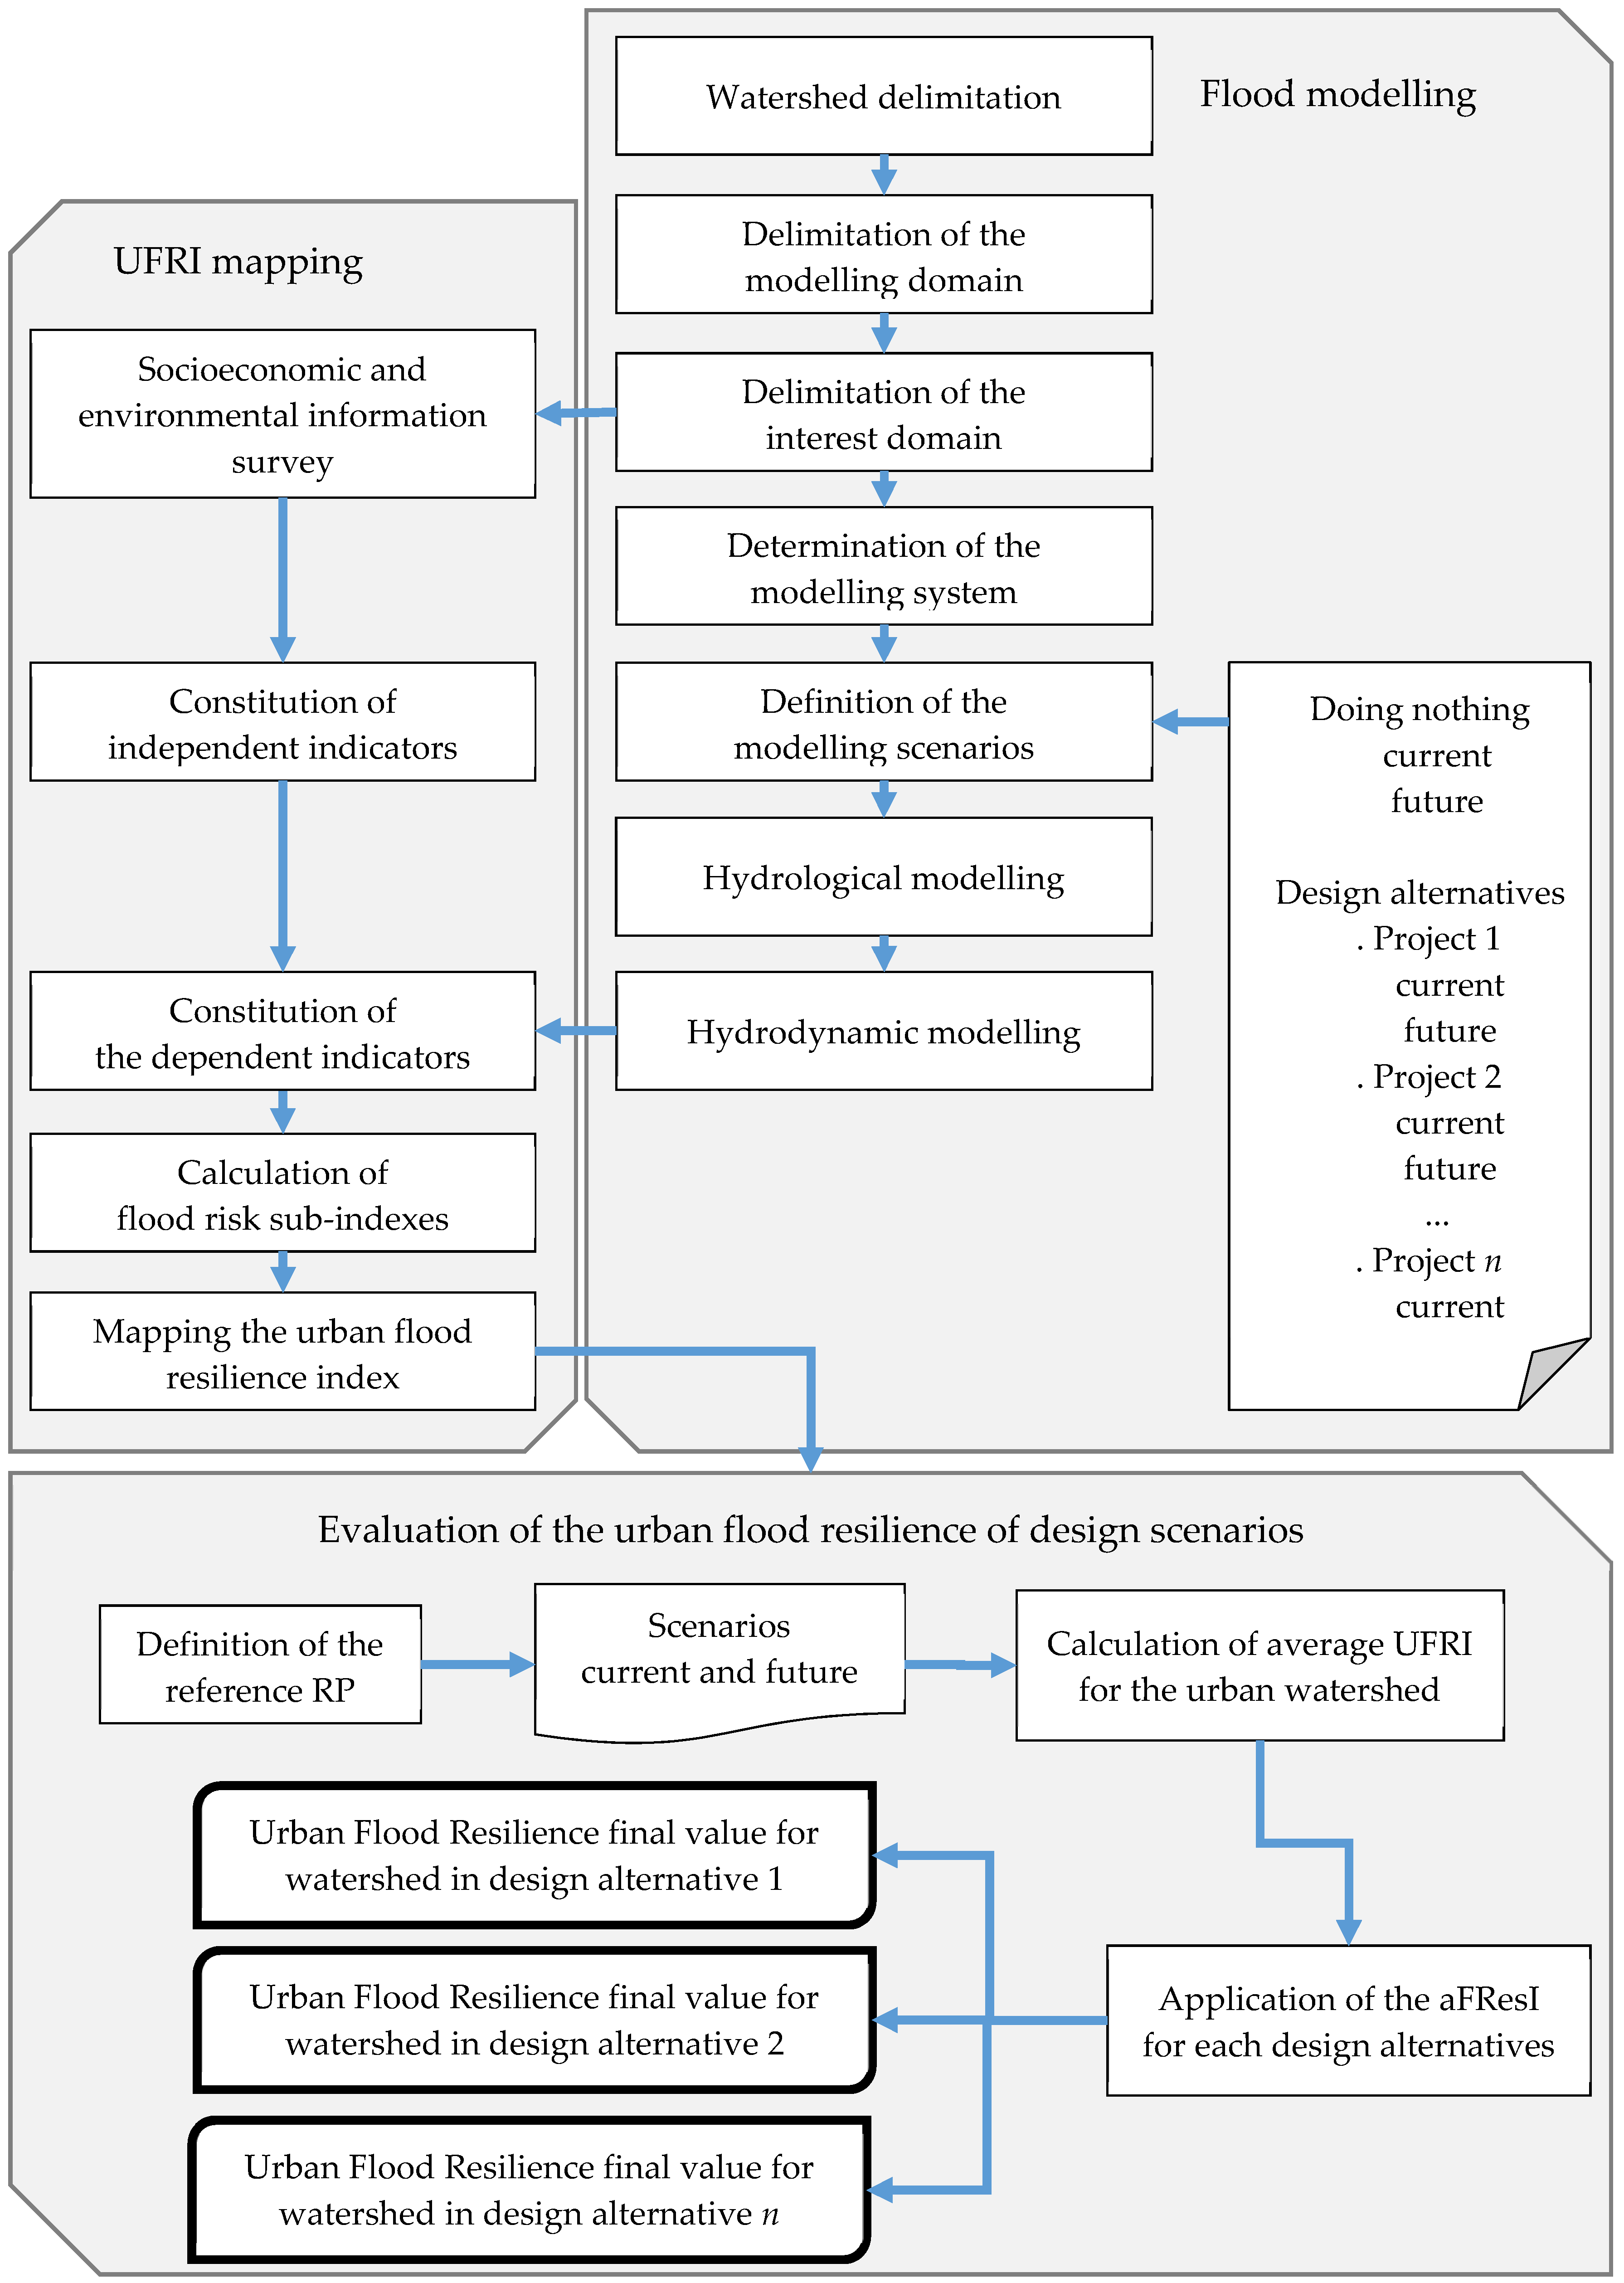
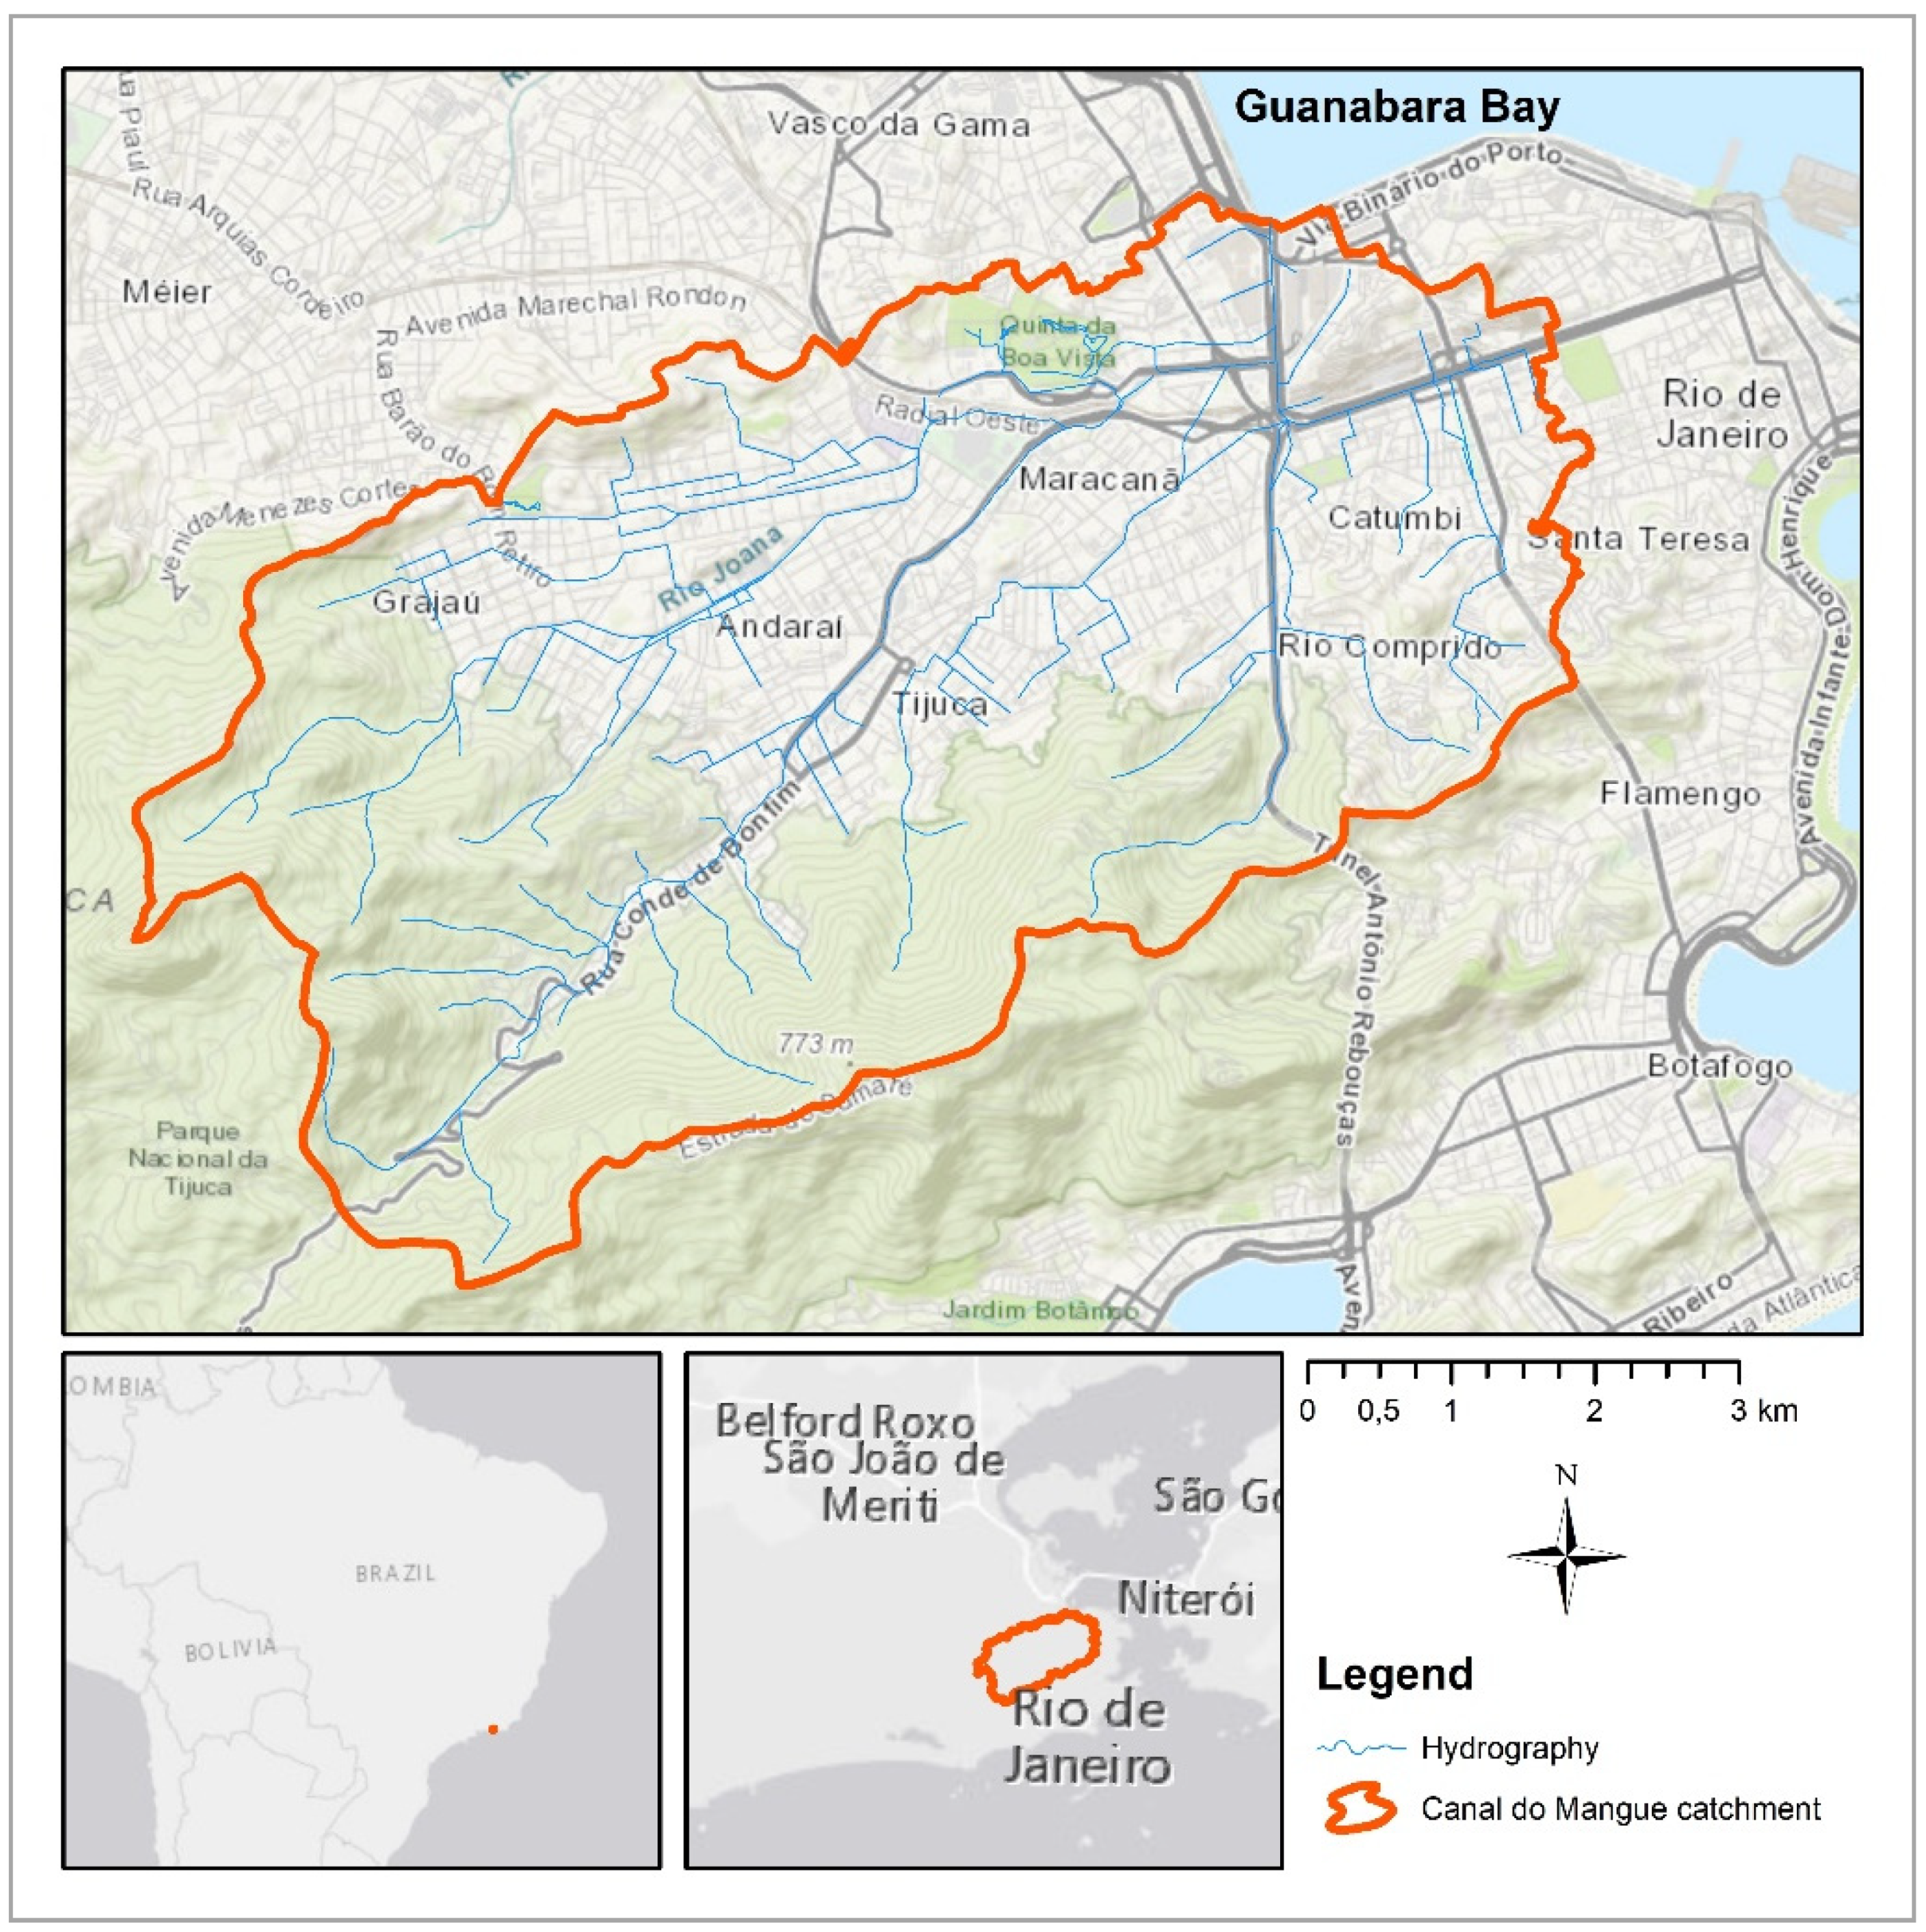
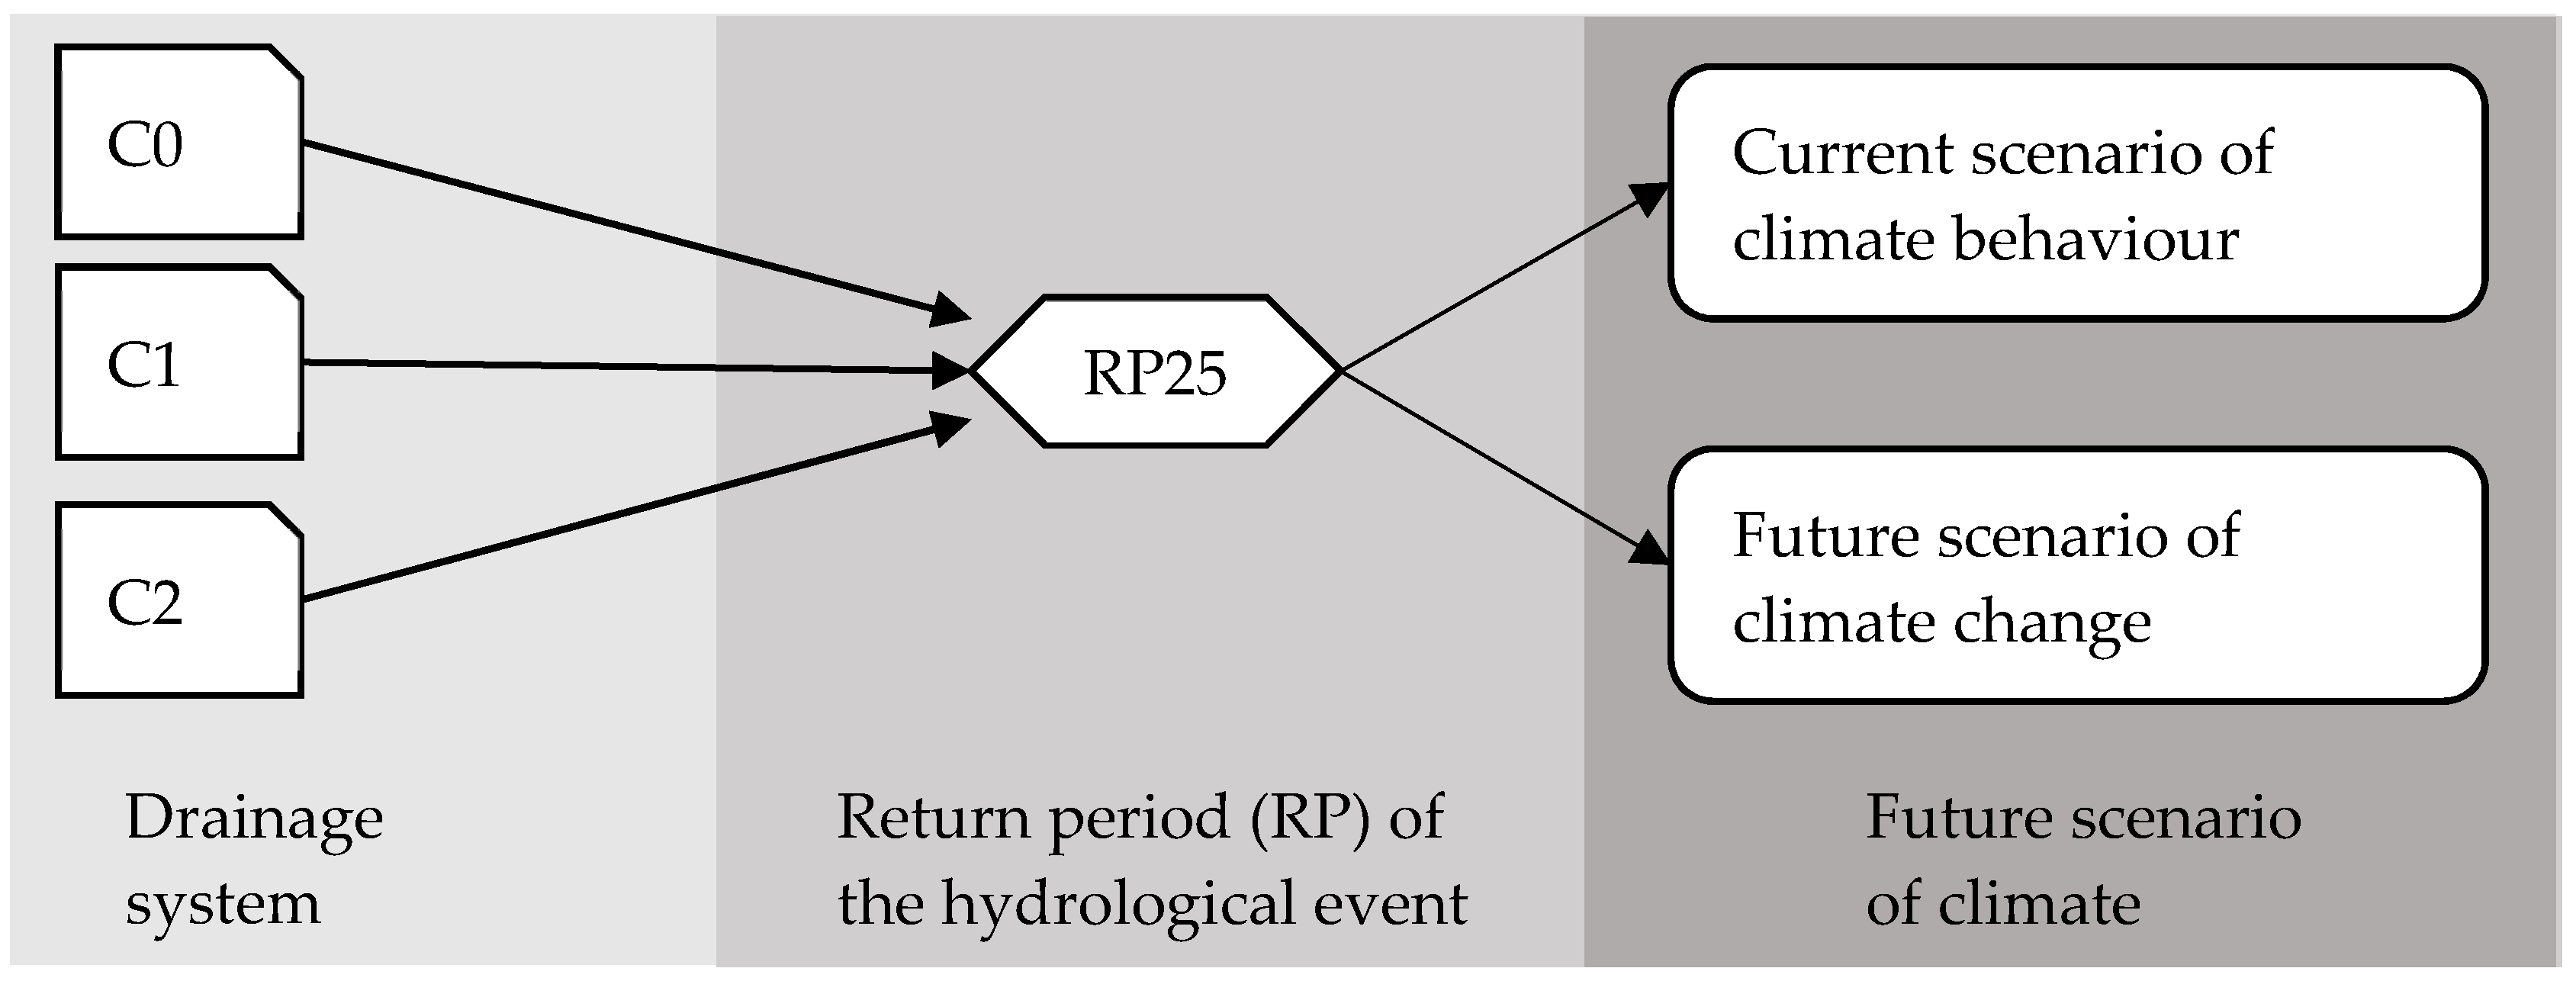
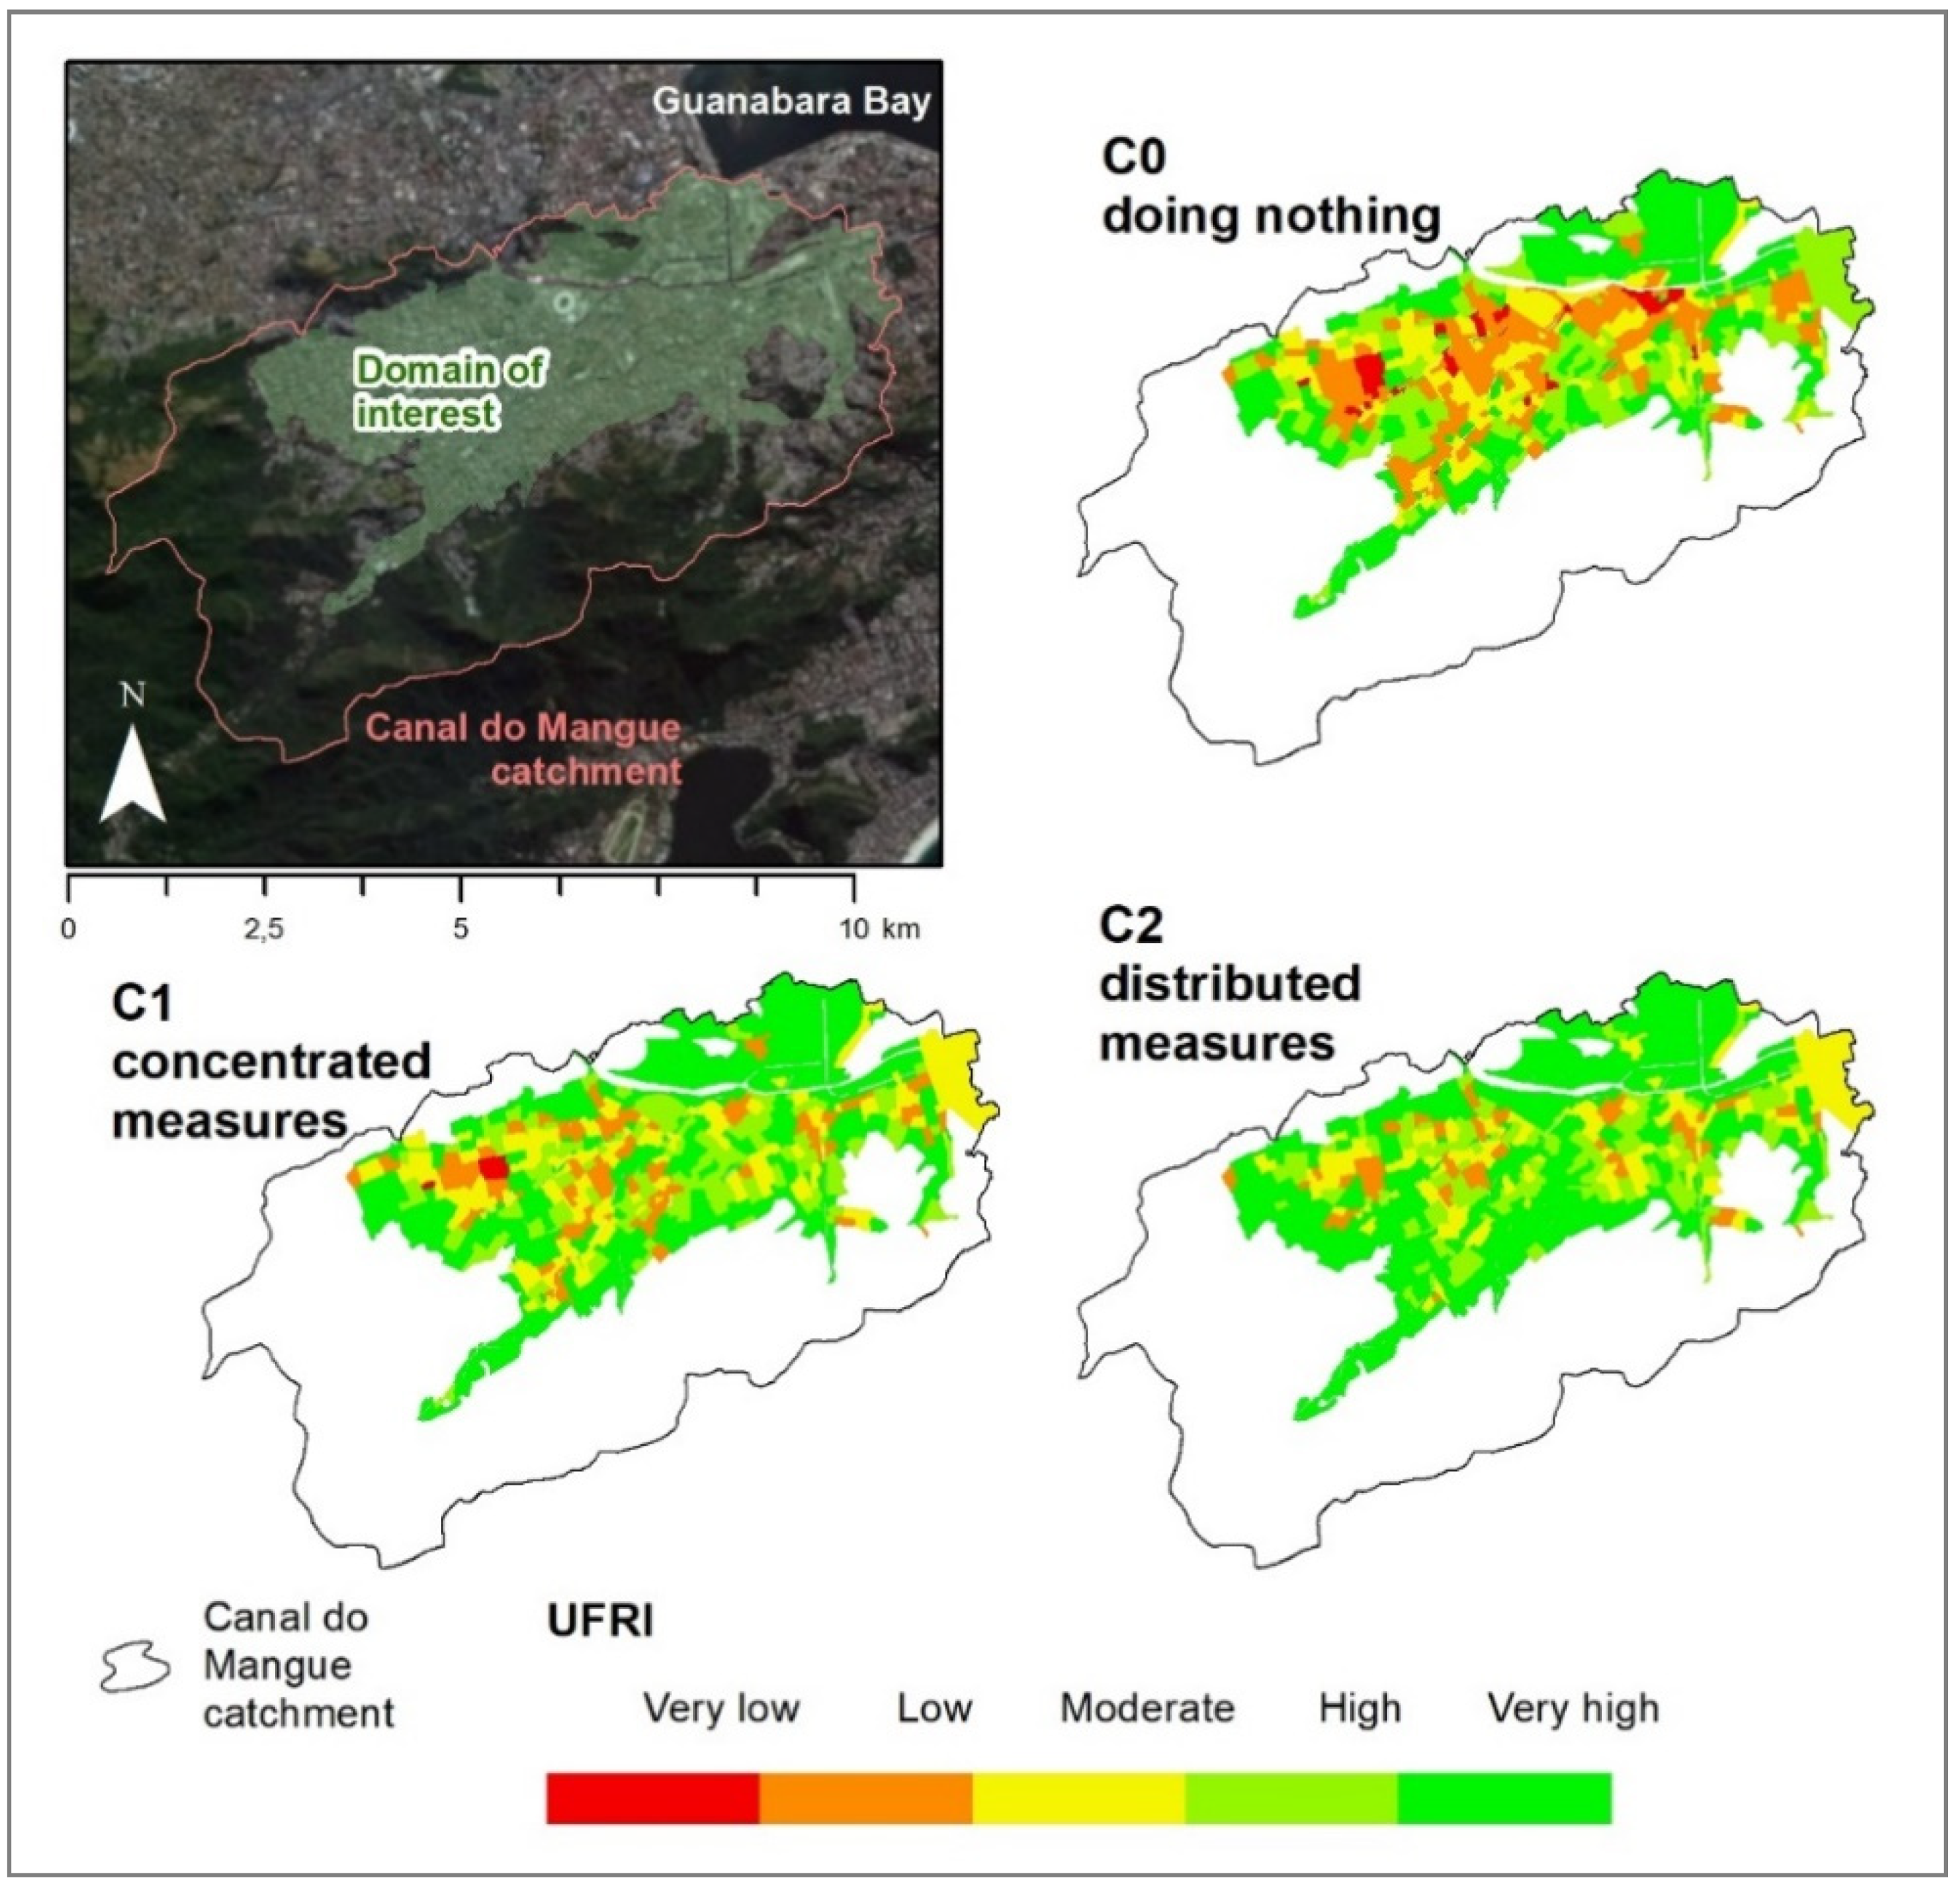
Table 1.
Classification of according to classes of drag risk and related to the Velocity Factor VF.
| Vulnerable People—V | Non-Vulnerable People—NV | ||||
|---|---|---|---|---|---|
| Risk | VF | Risk | VF | ||
| Null | 0.050 | 0.00 | Null | 0.000 | 0.00 |
| Low | 0.100 | 0.09 | Low | 0.300 | 0.09 |
| Moderate | 0.175 | 0.63 | Moderate | 0.500 | 0.63 |
| High | 0.250 | 1.00 | High | 0.700 | 1.00 |
Table 2.
Normalisation of the road hierarchy indicator .
| Hierarchy | |
|---|---|
| 1 | 1.00 |
| 2 | 0.94 |
| 3 | 0.77 |
| 4 | 0.50 |
| 5 | 0.11 |
Table 3.
Classification of the Rail system offer indicator .
| Class | Number of Rail Stations in a Radius of | Total Number of | Irt | |
|---|---|---|---|---|
| 500 m | 1000 m | Rail Stations | ||
| 1 | 0 | 0 | 0 | 0.00 |
| 2 | 0 | 1 | 1 | 0.21 |
| 3 | 1 | 0 | 1 | 0.34 |
| 4 | 0 | 2 | 2 | 0.44 |
| 5 | 1 | 1 | 2 | 0.51 |
| 6 | 2 | 0 | 2 | 0.57 |
| 7 | 0 | 3 | 3 | 0.62 |
| 8 | 1 | 2 | 3 | 0.66 |
| 9 | 2 | 1 | 3 | 0.70 |
| 10 | 3 | 0 | 3 | 0.74 |
| 11 | 0 | 4 | 4 | 0.77 |
| 12 | 1 | 3 | 4 | 0.80 |
| 13 | 2 | 2 | 4 | 0.82 |
| 14 | 3 | 1 | 4 | 0.85 |
| 15 | 0 | 5 | 5 | 0.87 |
| 16 | 1 | 4 | 5 | 0.89 |
| 17 | 2 | 3 | 5 | 0.91 |
| 18 | 3 | 2 | 5 | 0.93 |
| 19 | 0 | 6 | 6 | 0.95 |
| 20 | 1 | 5 | 6 | 0.96 |
| 21 | 2 | 4 | 6 | 0.98 |
| 22 | 3 | 3 | 6 | 1.00 |
Table 4.
Resilience classes.
| Resilience | UFRI Values |
|---|---|
| Very low | 0.00–0.25 |
| Low | 0.25–0.49 |
| Moderate | 0.50–0.69 |
| High | 0.70–0.89 |
| Very high | 0.90–1.00 |
Table 5.
Average values of UFRI for the Canal do Mangue catchment, under current and future climate conditions, for each simulated scenario (C0, C1 and C2).
Table 5.
Average values of UFRI for the Canal do Mangue catchment, under current and future climate conditions, for each simulated scenario (C0, C1 and C2).
| Alternatives | UFRI | |
|---|---|---|
| Current | Future | |
| C0—doing nothing | 0.65 | 0.60 |
| C1—concentrated interventions | 0.73 | 0.68 |
| C2—distributed interventions | 0.78 | 0.73 |
© 2019 by the authors. Licensee MDPI, Basel, Switzerland. This article is an open access article distributed under the terms and conditions of the Creative Commons Attribution (CC BY) license (http://creativecommons.org/licenses/by/4.0/).
Share and Cite
MDPI and ACS Style
Rezende, O.M.; Miranda, F.M.; Haddad, A.N.; Miguez, M.G. A Framework to Evaluate Urban Flood Resilience of Design Alternatives for Flood Defence Considering Future Adverse Scenarios. Water 2019, 11, 1485. https://doi.org/10.3390/w11071485
AMA Style
Rezende OM, Miranda FM, Haddad AN, Miguez MG. A Framework to Evaluate Urban Flood Resilience of Design Alternatives for Flood Defence Considering Future Adverse Scenarios. Water. 2019; 11(7):1485. https://doi.org/10.3390/w11071485
Chicago/Turabian StyleRezende, Osvaldo M., Francis M. Miranda, Assed N. Haddad, and Marcelo G. Miguez. 2019. "A Framework to Evaluate Urban Flood Resilience of Design Alternatives for Flood Defence Considering Future Adverse Scenarios" Water 11, no. 7: 1485. https://doi.org/10.3390/w11071485
Note that from the first issue of 2016, this journal uses article numbers instead of page numbers. See further details here.