Article

SPEI-Based Approach to Agricultural Drought Monitoring in Vojvodina Region

by
Jovana Bezdan
1,*,
Atila Bezdan
1,*,
Boško Blagojević
1,2,
Minučer Mesaroš
3,
Borivoj Pejić
1,
Milica Vranešević
1,
Dragoslav Pavić
3 and
Emilija Nikolić-Đorić
1
1
Faculty of Agriculture, University of Novi Sad, Trg D. Obradovića 8, 21000 Novi Sad, Serbia
2
Department of Forest Biomaterials and Technology, Swedish University of Agricultural Sciences, Skogsmarksgränd 17, 901 83 Umeå, Sweden
3
Department of Geography, Tourism and Hotel Management, Faculty of Sciences, University of Novi Sad, Trg D. Obradovića 3, 21000 Novi Sad, Serbia
*
Authors to whom correspondence should be addressed.
Water 2019, 11(7), 1481; https://doi.org/10.3390/w11071481
Submission received: 19 June 2019 / Revised: 7 July 2019 / Accepted: 9 July 2019 / Published: 17 July 2019
(This article belongs to the Section Hydrology)

Abstract

:
This paper presents the standardized precipitation evapotranspiration index (SPEI)-based approach to agricultural drought monitoring (ADM-SPEI approach) combining well-known methods, expert’ critical opinions, and local agro-climatic specificities. The proposed approach has been described in detail in three phases. This allows its application in any region and modification according to different agro-climatic conditions. The application of the ADM-SPEI approach has resulted in obtaining a modified SPEI for different crops (agricultural drought SPEI (AD-SPEIcrop)) in the Vojvodina region. In the first phase of the proposed approach, analytical hierarchy process (AHP) was used to obtain an experts’ group decision regarding the most suitable method for calculating evapotranspiration for a particular analyzed region. In the second phase, SPEI was modified and adjusted to the conditions in Vojvodina, where ET0 was replaced by ETc. In the validation phase, the results of the application of AD-SPEIcrop were compared to crop yields and well-known indices and evaluated by the experts’ feedback. The statistically significant correlations were achieved between AD-SPEIcrop and crop yields. The highest correlations were achieved in the months when the analyzed crops were in the developmental stages when they are most sensitive to drought. The AD-SPEIcrop better correlates to the crop yields compared to SPEI. The comparison of AD-SPEIcrop to the standardized precipitation index (SPI), SPEI, and self-calibrated Palmer drought severity index (SC-PDSI) shows that it can successfully detect dry and wet periods. The results have indicated that the proposed approach can be successfully applied, and AD-SPEIcrop has shown a good performance for agricultural drought monitoring.

1. Introduction

Drought is a normal feature of climate that occurs in different parts of the world [1] and it is considered to be the most intricate and insufficiently understood natural hazard [2]. The character of drought varies in different climates, and its impact depends on the local environmental and socio-economic characteristics [3]. There is neither a universal definition of drought nor a unique index or indicator that applies to all types of drought, climate regimes, or sectors [4]. Due to the complexity of defining drought objectively, a great number of indicators and indices for monitoring drought have been proposed in relevant literature [5]. Tian et al. [6] stress that because of the differences in physical characteristics of the environment and crops responding differently to drought conditions, the performance of drought indices varies regarding the application and specific region. Although a large number of indices has been introduced by numerous authors, many of them have limited applicability, as it is rather difficult to both calculate and interpret them, and they do not provide important local-specific drought information [7]. Yet, there is a possibility to further explore and improve drought indices in order to get more appropriate information [8].
The proposed ADM-SPEI approach is based on the standardized precipitation evapotranspiration index (SPEI) [9]. There has been an increase in the use of the SPEI index in climatology and hydrology studies [10]. Besides the standardized precipitation index (SPI) [11], the SPEI is one of the most commonly used drought indices in Europe [12]. The SPEI is based on the difference between precipitation (P) and reference evapotranspiration (ET0) accumulated in a certain period of time [13]. This difference between P and ET0, two crucial components in agricultural drought monitoring, represents irrigation requirements in arid and semi-arid regions where precipitation is insufficient in the growing season [14]. Liu et al. [15] state that the SPEI is an excellent tool for drought monitoring. They cite Vicente-Serrano et al. [16], who compared the performance of the SPI, SPEI, and PDSI (Palmer drought severity index [17]) indices in the context of global drought monitoring and concluded that for monitoring hydrological and agricultural drought, the SPI and SPEI were better than the PDSI, while the SPEI had a very good performance in monitoring summer drought. Bachmair et al. [18] analyzed the applicability of various meteorological indicators for the assessment of agricultural and silvicultural drought in Europe. Bachmair et al. [18] concluded that in southern and eastern Europe, the SPEI had a better performance in comparison to other drought indicators. The analysis of the SPI, SPEI, PDSI, Palmer Z [17], and self-calibrated PDSI (SC-PDSI [19]) indices in [20] shows the advantages of the SPEI in drought monitoring resulting from its multiscalar character and effectiveness in identification and classification of agricultural drought. Using the SPI and SPEI over different time scales, Bachmair et al. [21] explored the relationship between meteorological drought indicators and impacts of agricultural drought. The results of this study indicate that in climatically drier (water-limited) areas in Europe, there is a high correlation between the SPI/SPEI and vegetation stress, whereas it is not the case in the wettest parts (radiation limited regions). Based on the obtained results of the previous research [22] comparing the SPI, STI (standardized temperature index [23]), and SPEI with average yields of some of the main crops in the Vojvodina region, the authors suggest using the SPEI for monitoring agricultural drought.
For the calculation of the SPEI, [9] used the Thornthwaite (TH) [24] equation for estimating ET0. A couple of years later, Beguería et al. [10] found significant differences when the SPEI was calculated using different ET0 equations and emphasized that the differences were bigger in semi-arid and mesic areas. Also, Beguería et al. [10] recommend using FAO-56 Penman-Monteith (PM) [25], yet in the case of limited data availability, they suggest using the Hargreaves-Samani (HG) [26] method and the TH equation as the last choice. Literature review shows that in addition to the originally proposed TH method in the SPEI calculation, various other methods for the estimation of ET0 within the SPEI can be found in different papers (e.g., [10,14,27,28]). The introduction of ET0 within the SPEI, as Stagge et al. [28] highlight, requires rigorous testing in order to get a confirmation that the newly developed index significantly differs from the well-known SPI and to determine the sensitivity to the selected ET0 method. Having also investigated the effects of the chosen ET0 on the values of the SPEI, the authors of [28] recommend the use of the HG and PM method with the Hargreaves radiation term for the calculation of the SPEI. Based on the research over the Loess Plateau in China, Zhang et al. [29] recommend using the two-source potential evapotranspiration model (2S PET) [30] as the first choice, and the PM equation as the second choice for the calculation of the SPEI. The research conducted in China by Chen and Sun [31] shows that the SPEI based on the PM equation for calculating ET0 has a better performance than the SPEI based on the TH equation for drought monitoring. Potop et al. [32] state that one of the SPEI advantages is the independence when selecting the method for calculating ET0. They refer to the research by Potop and Možný [27] as an example where the ABMAV model [33] and the HG method were used to calculate ET0 within the SPEI. Draginčić et al. [34] compared the values of the SPEI based on the HG and TH method for the estimation of ET0 in the Vojvodina region and concluded that the values of the SPEI calculated by both ET0 methods generally provided similar results with significant differences in particular cases. This study further emphasizes that these results stress the need for an adequate selection of ET0 method when calculating the SPEI in order to get more accurate results. Frank [35] reveals that in the Vojvodina region, the accuracy of the SPEI largely depends on the selected ET0 method, which results in unreliability of the SPEI values, since a universally accepted method for calculating ET0 does not exist [36]. Moorhead et al. [14] emphasize the issue of using ET0 in the SPEI calculation when this index is applied to monitoring agricultural drought. These authors state that as ET0 differs from ETc (potential crop evapotranspiration), ET0 being typically larger than zero in a non-growing season, ET0 may not appropriately represent crop water demands [14]. Also, they replaced ET0 with ETc in calculation of the SPEI for agricultural drought monitoring in the Texas High Plains. Moorhead et al. [37] cite Moorhead [38], who demonstrated that using ETc instead of ET0 for the SPEI calculation is a better indicator of agricultural drought and irrigation demands. Pei et al. [39] explain that SPEI does not consider the effects of various types of vegetation cover on evapotranspiration. Pei et al. [39] replaced ET0 with ETc and proposed the standardized precipitation crop evapotranspiration index (SPCEI) and they applied it in semi-arid area of western Heilongjiang Province, China.
Among numerous methods for the estimation of ET0, the PM method is recommended by the Food and Agriculture Organization of the United Nations (FAO) and The International Commission for Irrigation and Drainage (ICID). PM is assumed to be the most reliable method because it considers the main meteorological factors and it is based on physical principles [40]. However, the PM method has high data demands, which often makes its calculation complicated in the case when the meteorological data are unavailable, missing, or inaccurate [41]. When selecting the method for calculating evapotranspiration the two goals that should be considered are accurate prediction and simplicity [42], while the availability of quality input data and sensitivity of ET to the climate factors prevailing in the study area should also be assessed [43]. Trajković [44] states that the regionally adjusted equations provide the best results and that each method can give good results in the conditions for which it is designed. Xystrakis and Matzarakis [45] note that there is no golden rule for selecting an adequate ET0 method in various climate conditions.
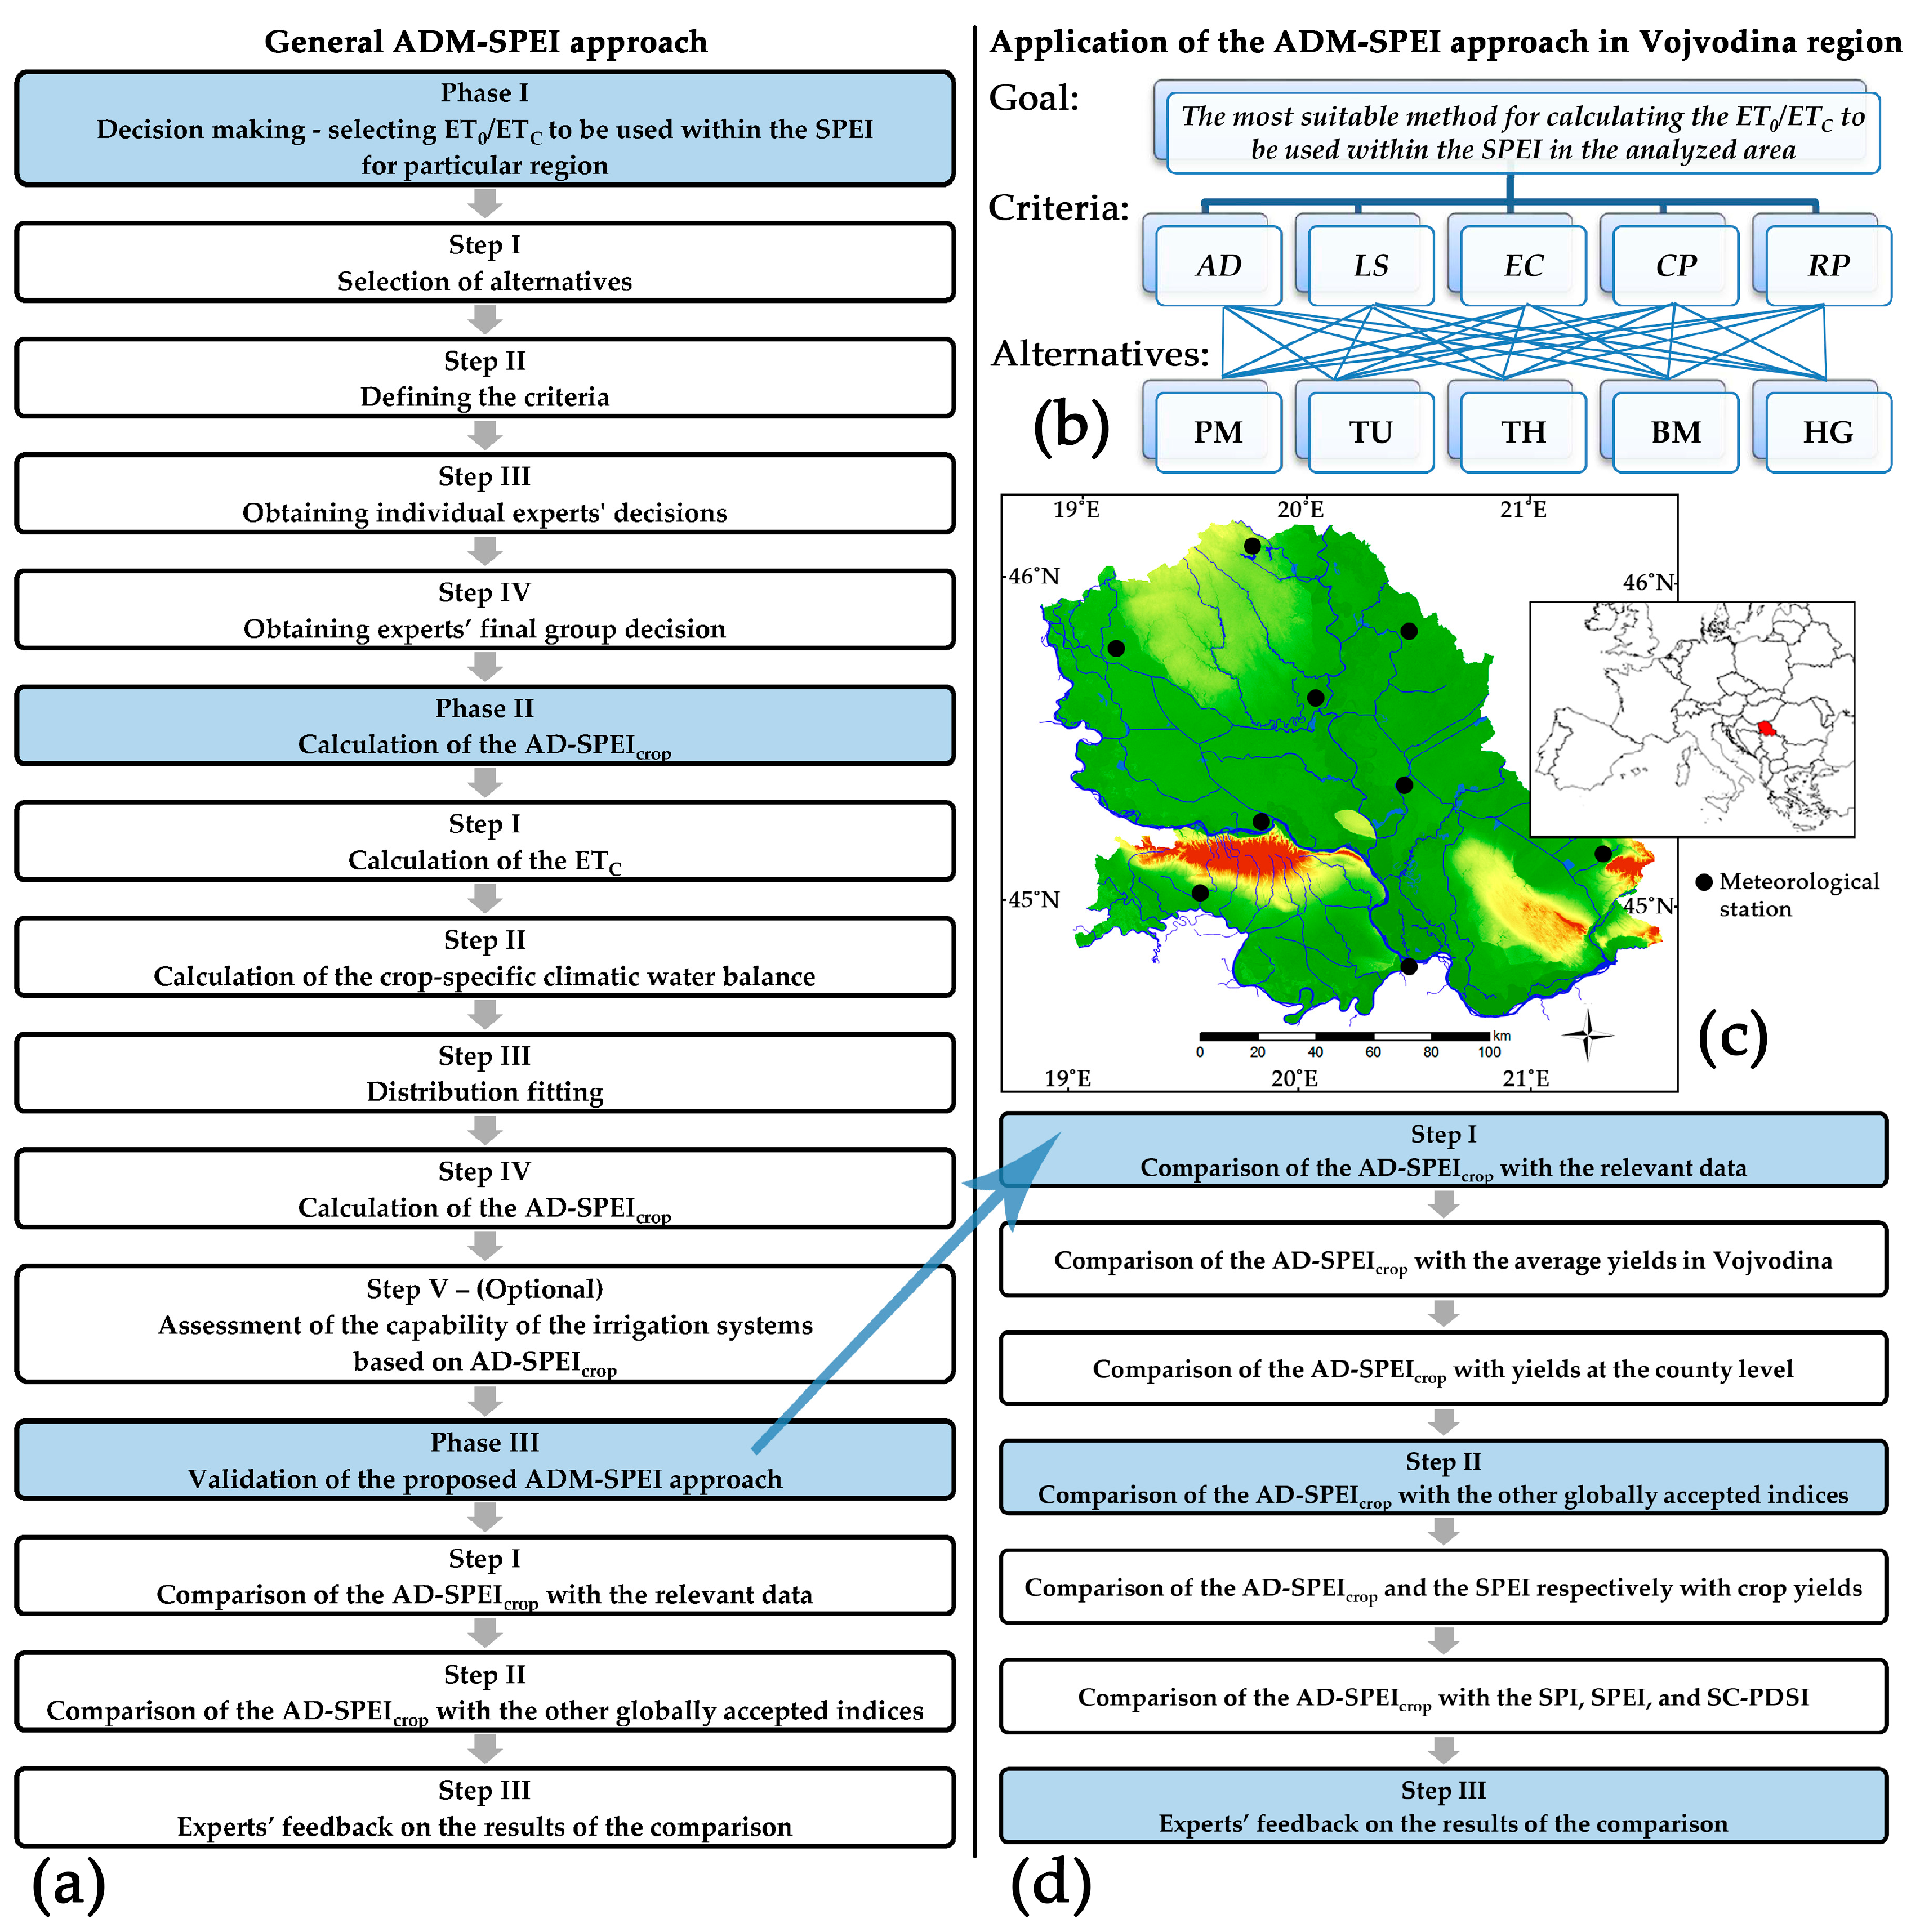
The purpose of this paper is to present the new approach to agricultural drought monitoring based on SPEI (ADM-SPEI approach), combining strengths of well-known and broadly accepted methods with critical thinking of experts based on their knowledge and experience, and also taking into account local specificities of agro-climatic conditions. By creating an approach to agricultural drought monitoring based on the standardized precipitation evapotranspiration index (SPEI) [9] in the Vojvodina region, the modified crop-related index has been obtained (agricultural drought SPEI (AD-SPEI
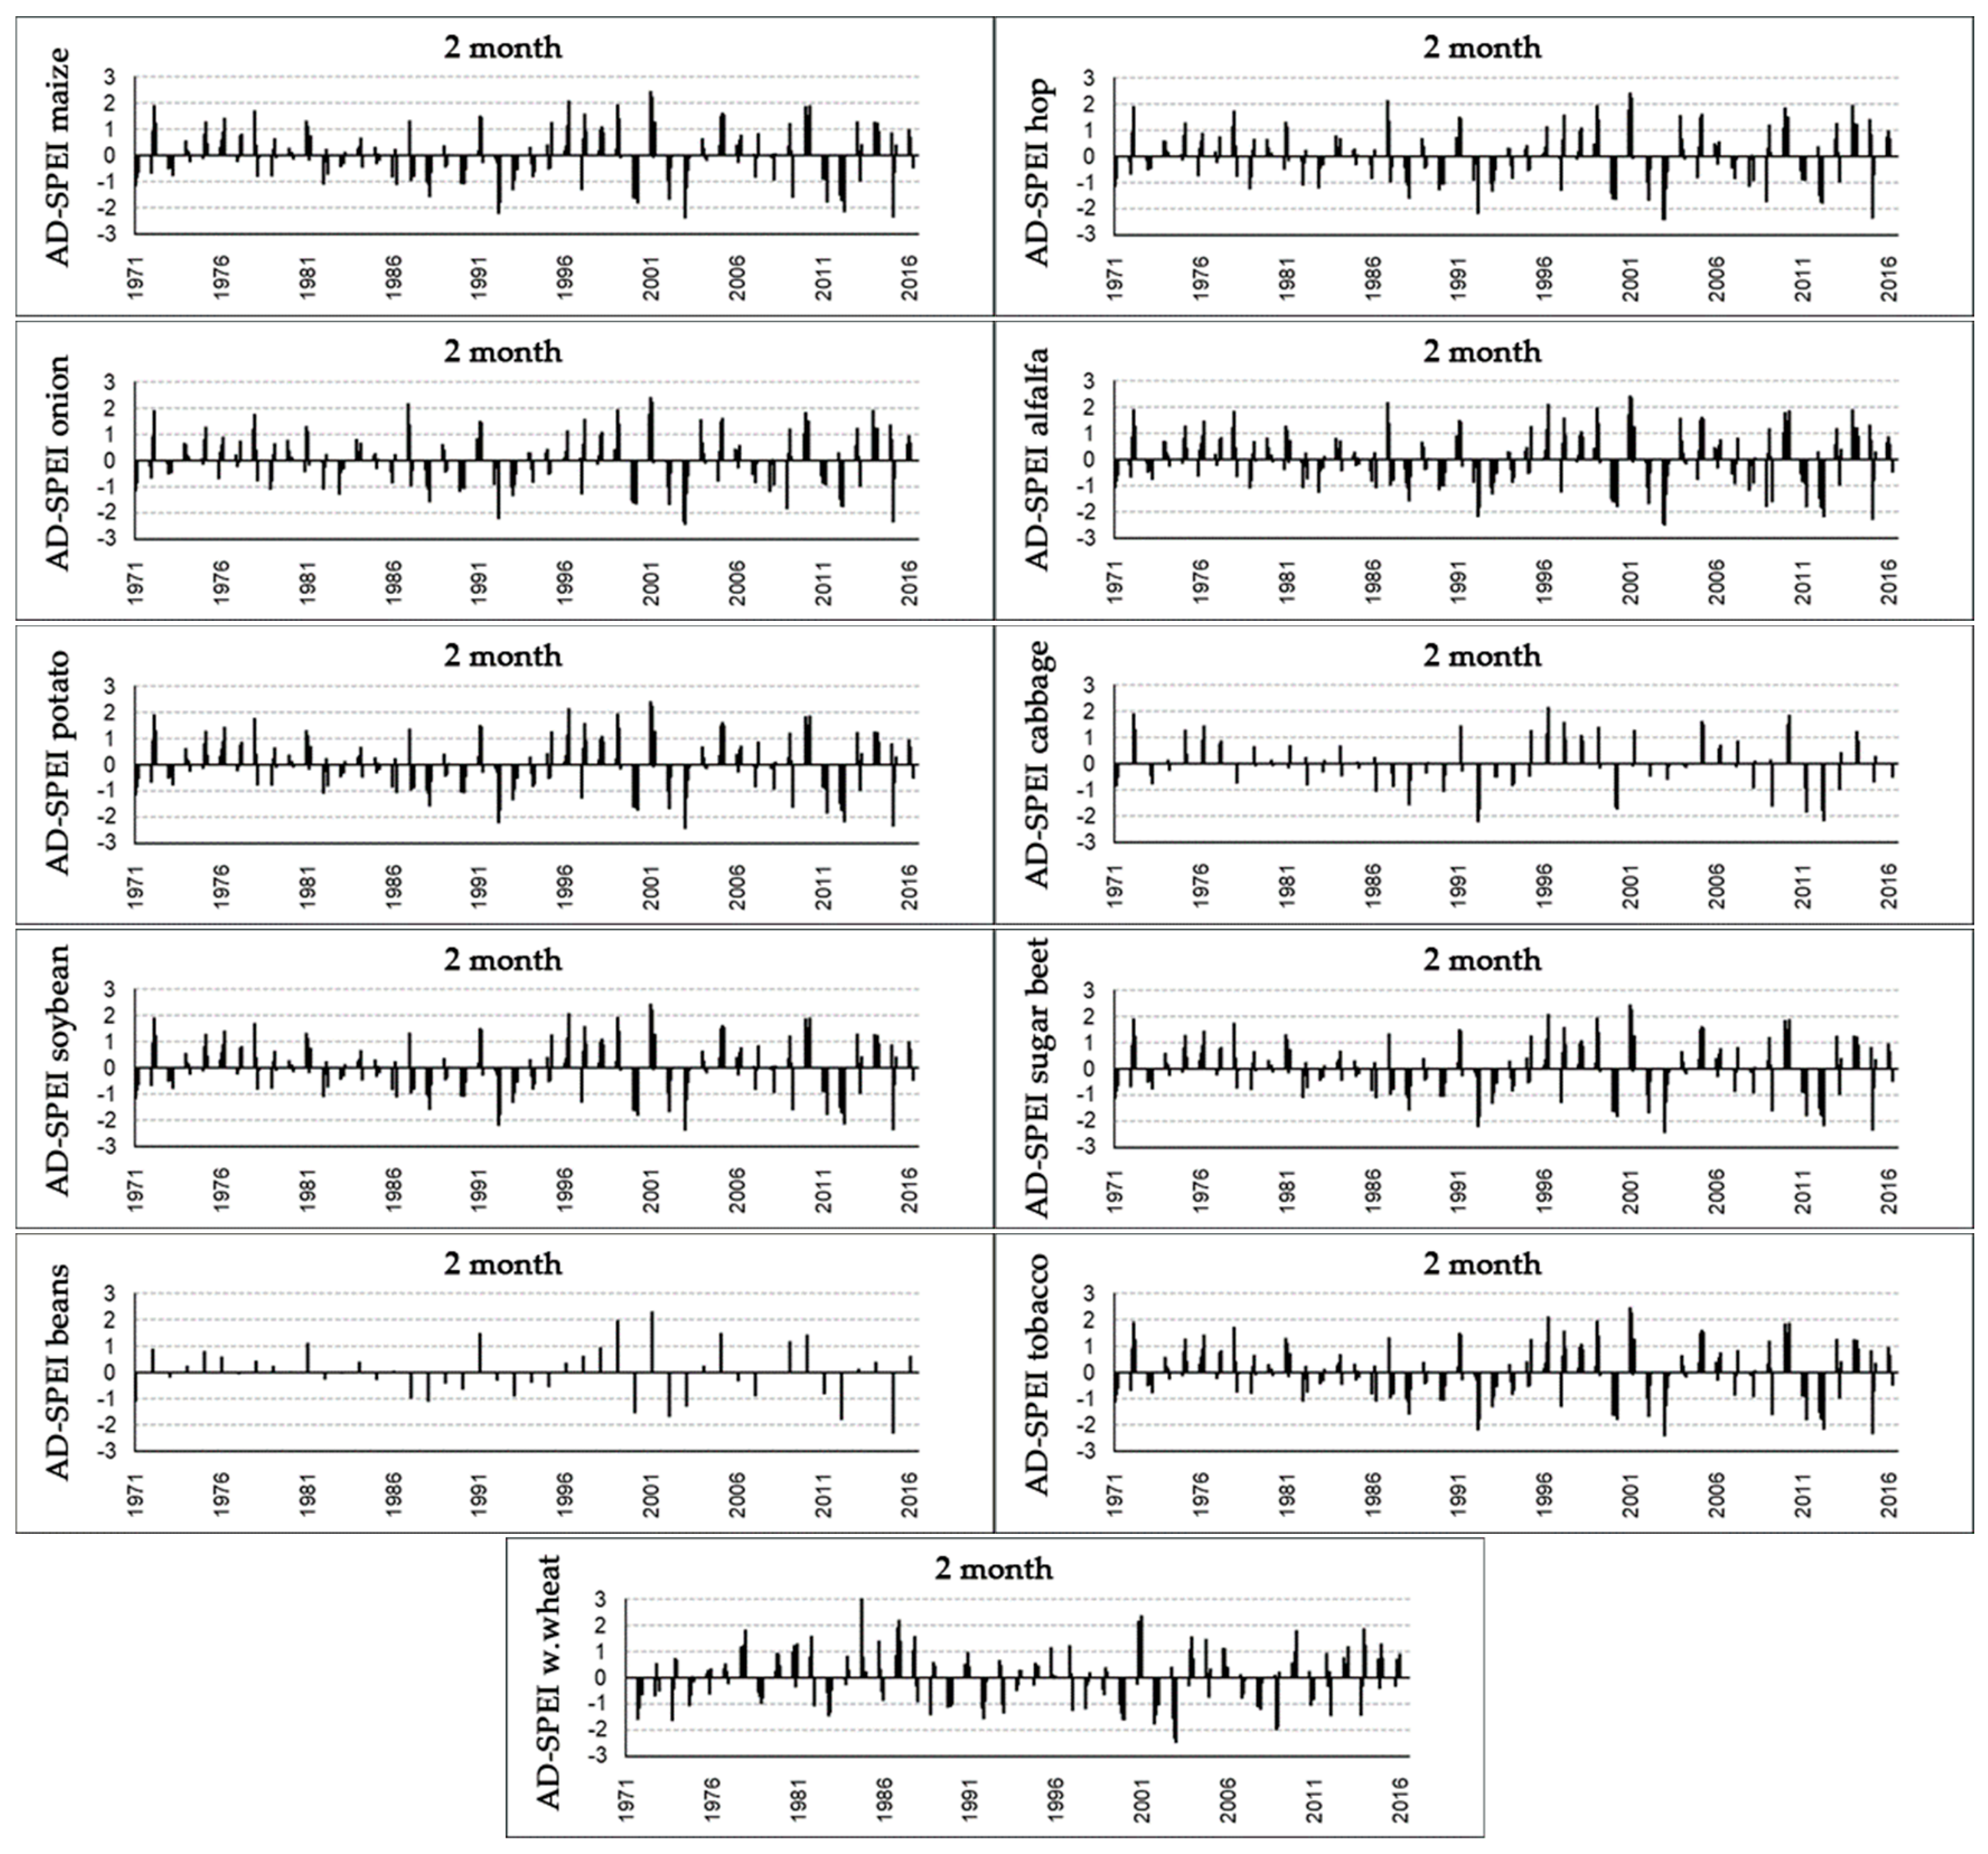
crop)), which reflects local agro-climatic conditions and is simple, precise, and practical to use. The proposed ADM-SPEI approach is primarily described in general through three phases and constitutive steps; it includes a description of the detailed methodological and mathematical basis, which allows for its application in any other part of the world and modifications in accordance with different agro-climatic conditions. This approach was applied in the Vojvodina region and analyzed in detail.
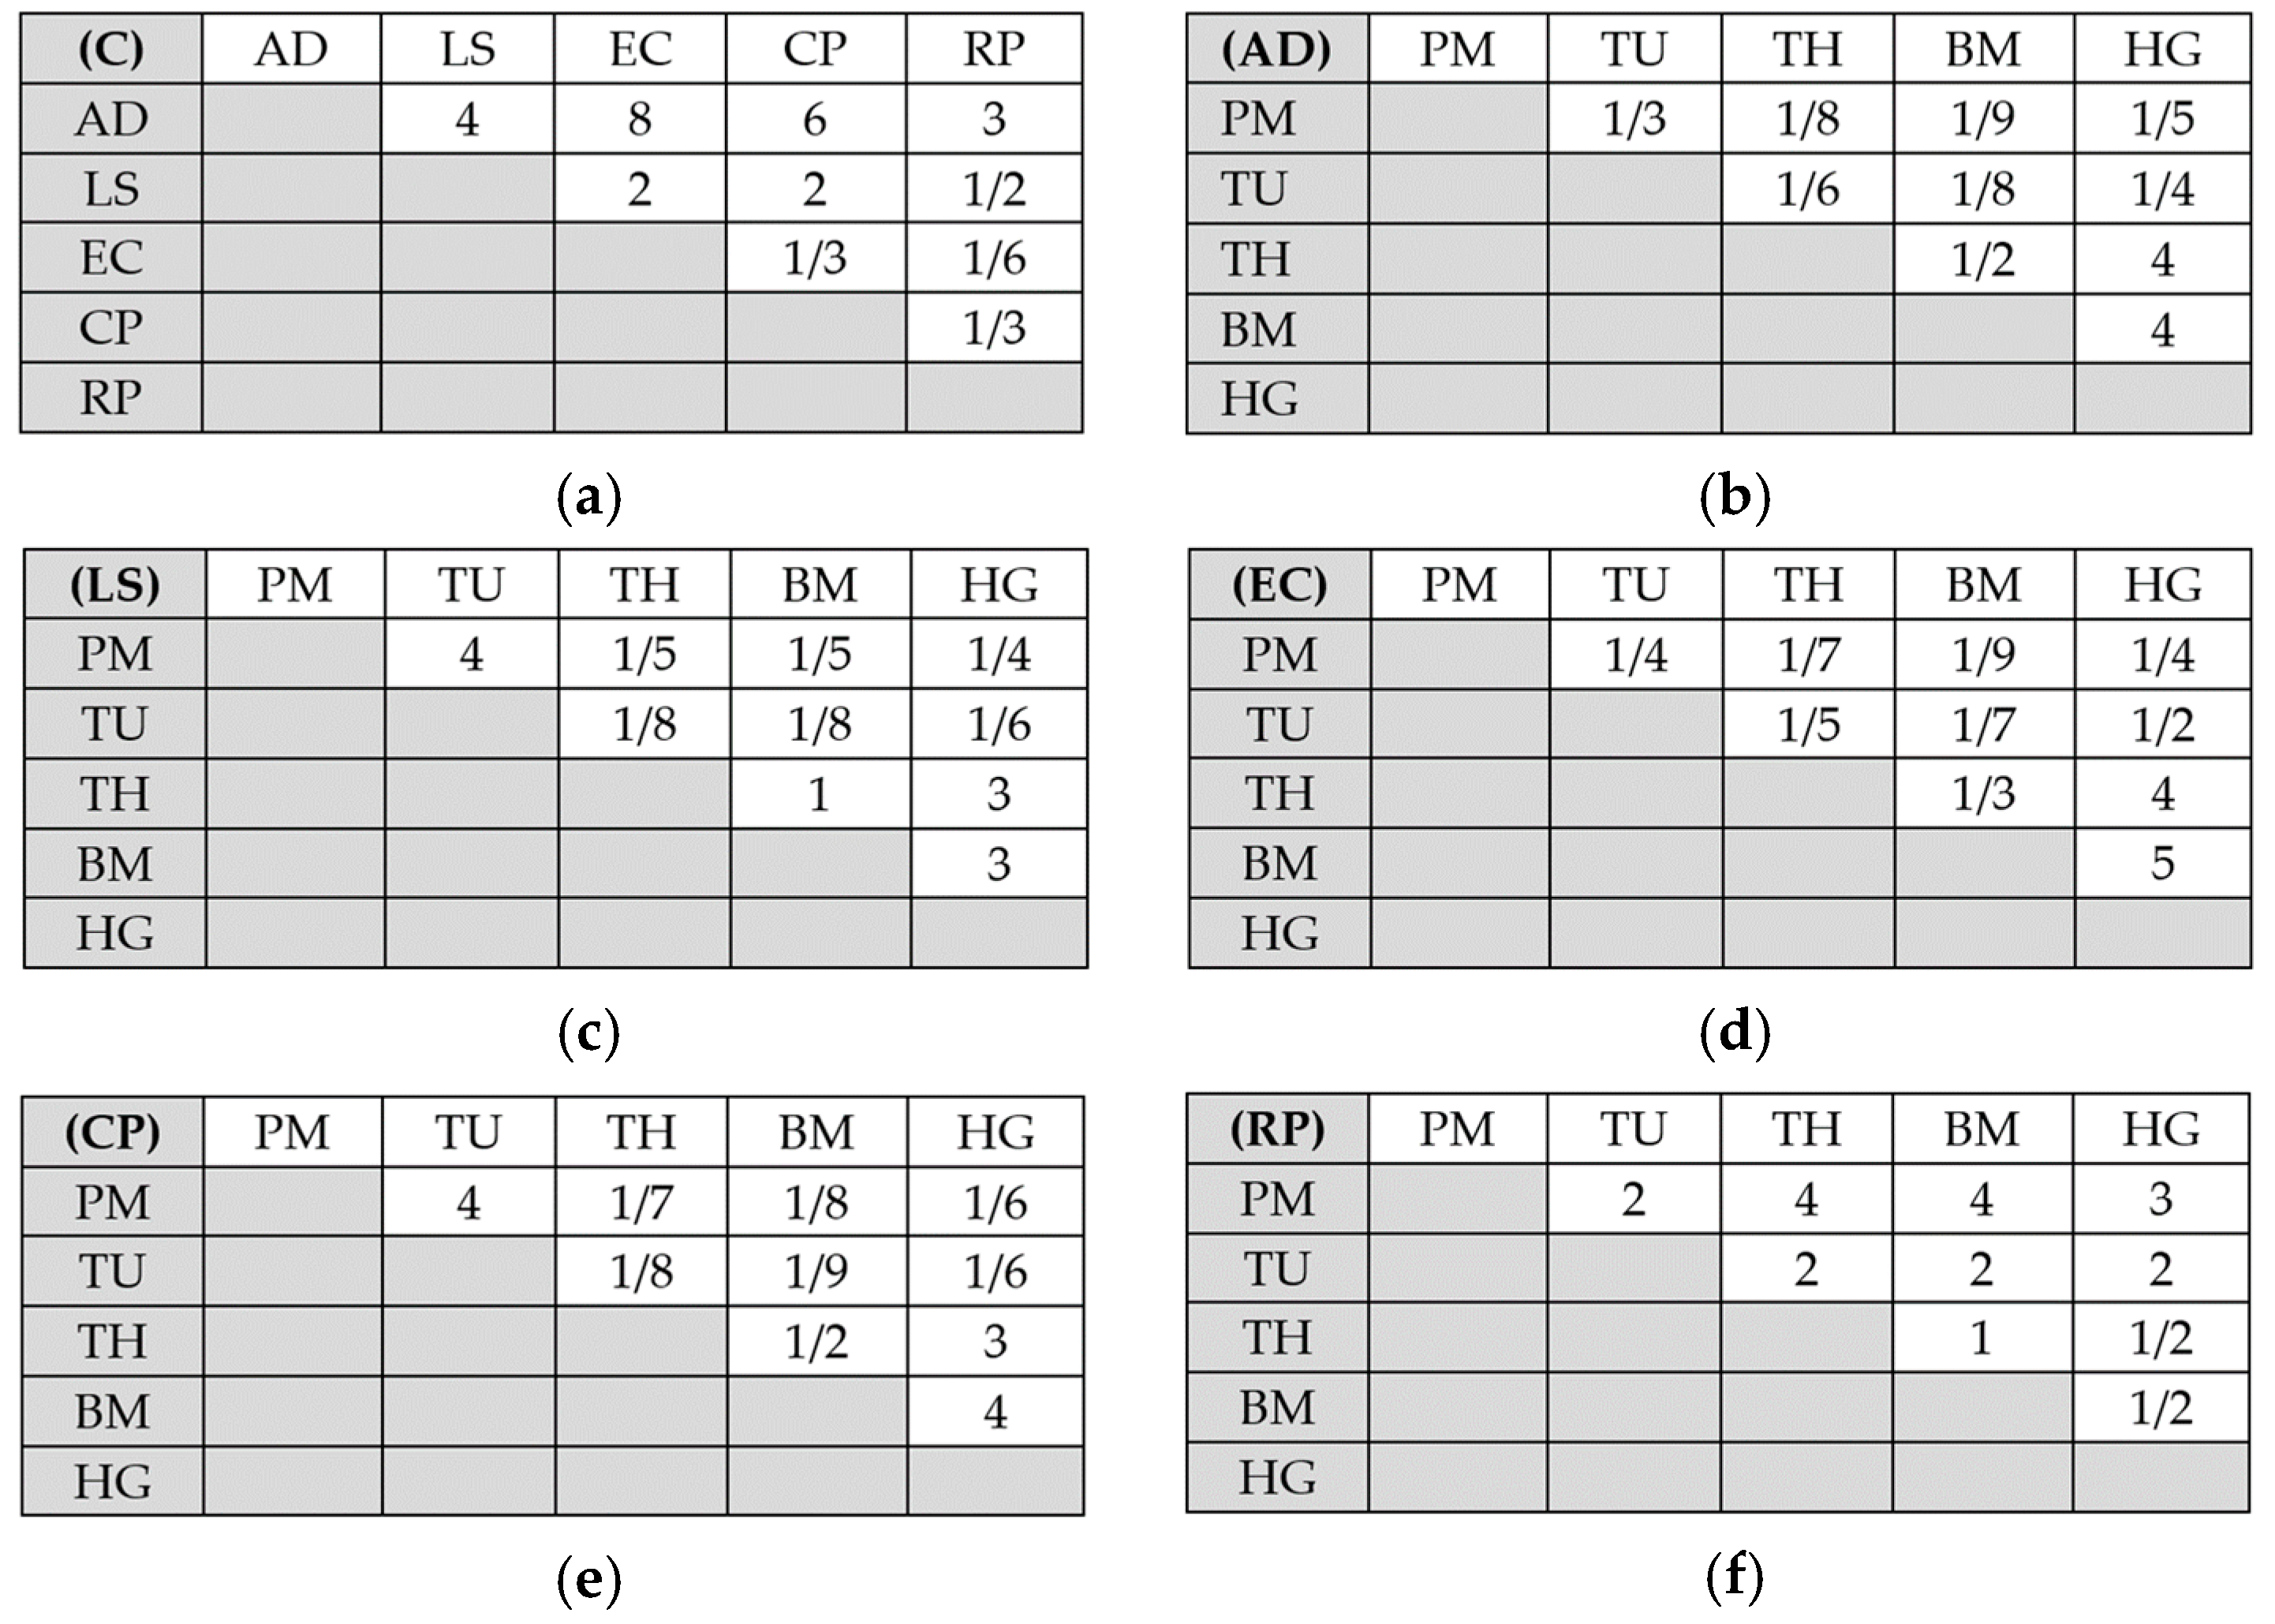
In this paper, the first phase of the proposed approach is choosing the appropriate method for calculating ET0/ETc. Bearing in mind the complexity of the decision problem, and in order to avoid bias and approach the problem objectively, the well-known multicriteria analysis method analytical hierarchy process (AHP) [46] in group decision making was used. Wide use of the AHP method in individual and group decision making in the field of agriculture, water management, and related fields can be seen in different approaches and applications that are based on this methodology.
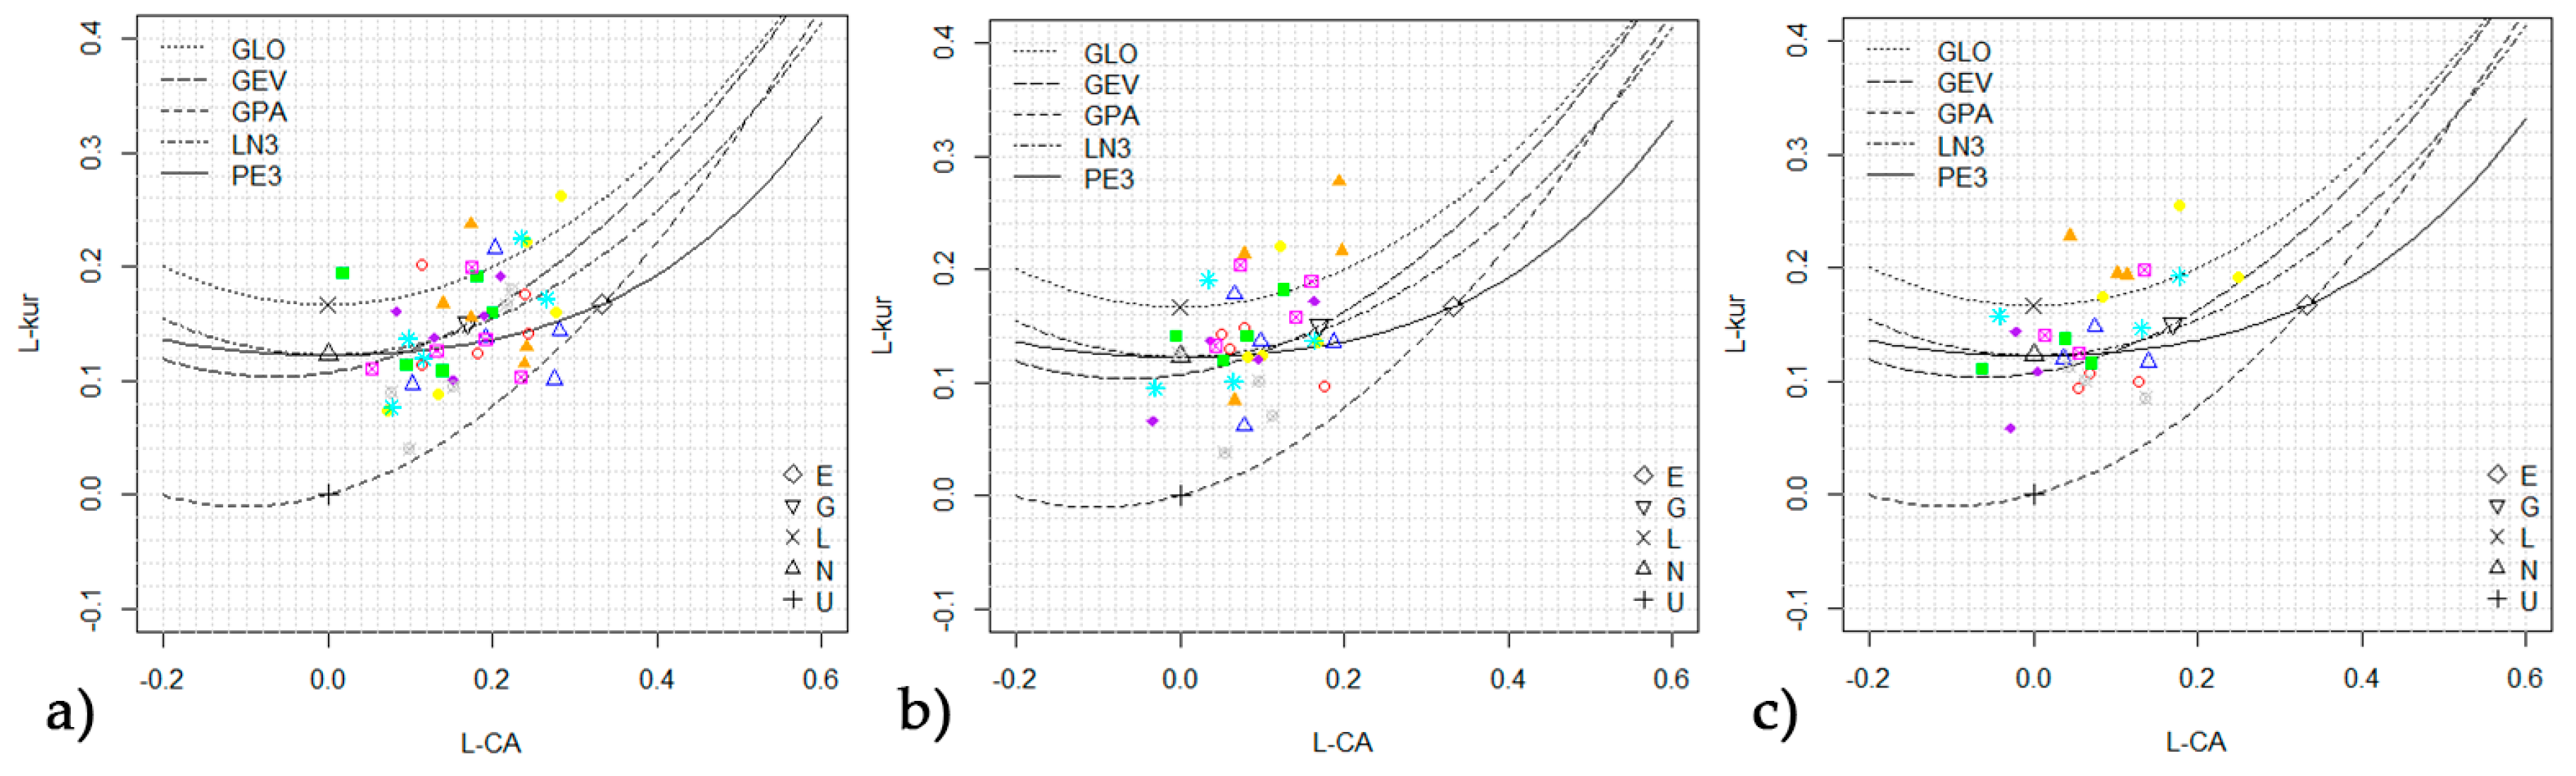
The novelty of this paper is the approach for agricultural drought monitoring, which combines standard statistical and mathematical procedures with experts’ opinions and judgment on different levels. This approach includes a detailed procedure for selecting the most adequate method for assessing ETc taking into account the local agro-climatic conditions. It also presents a detailed procedure for selecting an adequate theoretical distribution, which is the best fit to the empirical data of crop-specific climatic water balance in the calculation of the AD-SPEIcrop index. In addition, it integrates a comprehensive validation procedure. The validation and the performance assessment of the AD-SPEIcrop are based on experts’ feedback alongside the comparison of the index with crop yields and globally accepted drought indices. Also, the approach presents the procedure for a direct transformation of the AD-SPEIcrop values into the values of crop-specific climatic water balance, which enables the analysis of the performance of irrigation systems for drought mitigation.
This paper consists of the following sections: The introduction section offers a short overview of relevant literature. Section 2 provides short descriptions of the study area and the data used in this research. This section also presents the proposed ADM-SPEI approach with a brief description of the used methods. In Section 3, the application of the proposed ADM-SPEI approach in the Vojvodina region is shown along with explanations and discussions. It also demonstrates the performance of the presented approach and the validation of the obtained results. The last Section 4 offers conclusions of this research.

2. Materials and Methods

2.1. Study Area and Data

The study area is located in Republic of Serbia at the south-east part of the Carpathian (Pannonian) Basin in Central Europe and covers the area of about 21,500 km2. The region extends between 44.6° N and 46.2° N and 18.9° E and 21.5° E (Figure 1c). The relief of the area is mostly plain with an exception of two hilly regions with elevations mostly below 600 m.a.s.l. Vojvodina is rich in watercourses. Some of Europe’s large rivers flow through the area (the Danube, the Tisza (Tisa), the Sava), and there is dense canal network of the Danube-Tisza-Danube hydro-system. The Vojvodina region is predominantly agricultural with more than 17,500 km2 of arable land or about 75% of the total area. Chernozem and Phaeozem, deep and fertile soil types with good water retention characteristics, are prevalent in the Vojvodina region. Due to its geographical position, Vojvodina lies in the temperate continental climate zone [47], characterized by cold winters and warm and humid summers, large temperature ranges during the year, and unequal temporal distribution of precipitation [48]. According to the Köppen climate classification, the climatological formula for the Vojvodina region has the form “Cfwbx” [49]. The mean annual air temperature is 11.5 °C, 18.3 °C in a growing season, and 4.7 °C in a non-growing season. Precipitation over the territory of Vojvodina region has uneven distribution in space and time. The average annual precipitation is 615 mm, about 249 mm in the growing season, and 366 mm in the non-growing season.
In order to calculate ET0 and ETc and also drought indices (SC-PDSI, SPI, SPEI, AD-SPEIcrop) in this study, the monthly meteorological data from 1971 to 2016 are collected from 9 main meteorological stations (Rimski Šančevi, Palić, Sombor, Bečej, Kikinda, Zrenjanin, Vršac, Sremska Mitrovica, Belgrade) of the Republic Hydrometeorologic Service of Serbia (RHSS). The data includes: Precipitation, air temperature (minimum, maximum, and average), sunshine duration, wind speed, and relative humidity. The local available water-holding capacity is derived from the digital soil map of Vojvodina [50].
Vojvodina is the most important agricultural region in Serbia where drought often significantly affects crop yields. In this study, the following economically important agricultural crops were analyzed: Maize—M, soybean—S, sugar beet—SB, winter wheat—W, alfalfa—A, potato—P, onion—O, cabbage—C, hop—H, tobacco—T, beans—B. The annual series of average crop yields for the entire territory of Vojvodina were provided by the Statistical Office of the Republic of Serbia. This study uses the data collected during the period from 1971 to 2016 for all the analyzed crops with the exception of the hop yield data limited to the 1971–2004 period. Also, the study uses yield data at the county level for maize, winter wheat, sugar beet, alfalfa, potato, and beans, but only for the period from 1996 to 2013 because of data availability. In addition to previous crops, the yield data for soybean from the experimental fields of the Institute of Field and Vegetable Crops Novi Sad for the period from 1977 to 2004 were also considered in the analysis. Potopová et al. [51] emphasize that improvement in agricultural technologies including higher rates and frequency of fertilizing, the introduction of more productive crop varieties, enhanced weed control, and tillage practices lead to upward trends in agricultural production. In order to analyze only climate impacts on crop yields, it is important to eliminate trends in time series of yield. In this study, based on the previous research presented in [22,51,52,53], detrended yields were obtained by using linear regression. The residuals of these detrended yield values were further utilized in the analysis.

2.2. The Methodology of the Proposed SPEI-Based Approach to Monitoring Agricultural Drought (ADM-SPEI)

In this section, the SPEI-based approach to monitoring agricultural drought (ADM-SPEI approach) is presented in a general way, which is to be adapted further and applied to a specific area of interest. The aim was to define an approach and related AD-SPEIcrop index that is simple and convenient to use, reflects the local agro-climatic conditions, and takes opinions of experts from the region of interest into account. The proposed approach, which can be characterized as intuitive and comprehensive, follows a logical flow and uses well-known and recognized methods in order to define the efficient approach to agricultural drought monitoring. The general overview of the proposed approach to agricultural drought monitoring based on the SPEI index is shown in Figure 1a.

2.2.1. Phase I—Decision Making on the Most Suitable Method for Calculating the ET0 (or ETc) to Be Used within the SPEI in the Analyzed Area

Step I: The selection of alternatives—suitable methods for calculating ET0 (or ETc) within the SPEI for the particular region.
This step presents the selection of the alternatives, the methods for the calculation of ET0 (or ETc) suitable for using within the SPEI index in the particular region. Bearing in mind the complexity of the decision-making problem, and in order to avoid bias and ensure objectivity, the well-known multicriteria analysis method analytical hierarchy process (AHP) [46] is used in this proposed approach. In accordance with the AHP methodology, the alternatives (the chosen methods for calculating ET0 or ETc) are determined first. The most appropriate method for the specific agro-climatic conditions of the observed area is going to be selected from these alternative methods in the following steps. It is going to be further used within the SPEI index. The choice is based on the consultations with the experts from the specific area and on the relevant literature in order to obtain results that reflect agro-climatic conditions of the observed area as much as possible. When the proposed approach is applied to a particular region, it is necessary to consult both experts who are familiar with the agro-climatic conditions of the observed area and the relevant literature related to this particular area.
Step II: Defining the criteria relevant for the decision-making problem—the selection of the most suitable method for the calculation of ET0, and ETc to be used within the SPEI in the study area.
Following the selection of the alternatives, this step includes defining the relevant criteria for the decision-making problem—the selection of the most suitable method for the calculation of ET0 and ETc to be used within the SPEI in the particular area of interest. These criteria may vary depending on the area of application and the agro-climatic conditions where the proposed ADM-SPEI approach is applied. For that reason, it is important to redefine the criteria for a specific area of interest.
Step III: Obtaining individual experts’ decisions.
In order to get individual decisions, each expert is interviewed separately and the AHP is used in order to get individual decisions. The AHP [46] considers the decomposition of the decision-making problem into a hierarchy of different levels, where the goal is at the top, while the criteria and the alternatives are at lower levels. At all levels of the hierarchy, pairwise comparison of the elements at one level in relation to the element on a higher level of the hierarchy could be performed by using Saaty’s relative-importance scale [46]. In this procedure, the decision maker provides linguistic pairwise comparisons and related numerical expressions in order to quantify it. First, the criteria are compared in relation to the goal of decision-making (selecting the most appropriate method for calculating ET0 or ETc). After that, the alternatives are compared in relation to each criterion separately. Numerical judgments are placed in a specific comparison matrix: A:
A = [ a 11 . . . a 1 m . . . . . . . . . . . . . . . a m 1 . . . a m m ]
where m is the number of rows or columns of the matrix A. For the elements of the matrix, the following rules apply:
a i i = 1 ,   i { 1 , , m } ;   a i j = 1 a j i ,   i j ,   i , j { 1 , , m } .
After that, the local priorities (local weights) of the hierarchy elements are calculated from the related pairwise comparison matrices. This procedure is called prioritization, and numerous prioritization methods can be found in the relevant literature (see [54,55,56]). Saaty [46] introduced principal eigenvector (EV) of the matrix A as the desired priority vector w that can be obtained by solving:
A w = λ w ,   e T w = 1
where λ is eigenvector of the matrix A and e is the unit vector [57].
When all the priority vectors are determined (priority vectors of the criteria and priority vectors of the alternatives), synthesis can be performed. In the standard AHP procedure, partial vectors are multiplied by the weighting coefficients of the corresponding criteria and the results are summed up at the end. The final results are global weights of the alternatives in relation to the goal.
The AHP does not force one to be perfectly consistent when comparing the elements in the decision matrix [58]. However, it is important to bear in mind that consistency must be checked, because priorities make sense only when the comparison matrix is consistent or near consistent [59]. As a consistency check, when EV method is used, Saaty [46] proposed CR (consistency ratio). CR values that are less than 0.1 are considered adequate, which means that inconsistency of the decision makers’ judgments is at an acceptable level [46].
Step IV: Obtaining experts’ final group decision.
In the last step of the first phase, one group decision is obtained from experts’ individual decisions. The first-ranked method obtained by the group of experts is considered to be the most suitable method for calculating evapotranspiration within the SPEI index that will be used in the specific area of interest and related to particular crops in order to monitor agricultural drought. In this proposed approach, aggregation of individual decisions into a group one is carried out deploying aggregation of individual priorities (AIP) [60,61] for which weighted arithmetic mean method (WAMM) [60] is used in this paper. The final group priority for any alternative A j can be calculated using [60]:
P g ( A j ) = i = 1 n w i P i ( A j )
where P g ( A j ) refers to group priority of the alternative A j ; P i ( A j ) refers to the priority of A j given by the expert Ei; w i is the weight to be attached to the preferences of the expert Ei; n is the number of experts in the group. This method is chosen because it is simple and one of the most commonly used mathematical procedures for aggregation of individual priority vectors into a group one. Although different methods for assigning the weights to decision makers can be found in the literature, in the present study, we used equal weights for all decision makers in order to simplify the procedure. This ADM-SPEI approach does not exclude the possibility of using other aggregation procedures and consensus models presented in the literature. The recommendation for using WAMM can be found in numerous papers (e.g., [59,62]).

2.2.2. Phase II—The Calculation of the Modified SPEI Adjusted to the Area of Interest and Related to the Crops

Step I: The calculation of the ETc.
The calculation of the ETC follows the selection of the most adequate method for the specific location (region of interest) based on the expert group decision. In the original SPEI [9], ET0 is used, while in this ADM-SPEI approach, it is replaced by ETc for the purpose of better monitoring of agricultural drought. Bearing in mind that ETc is the amount of water needed by the crops to grow optimally [63], it is assumed that the use of ETc instead of ET0 can serve as a better indicator of agricultural drought, as it is recommended in the previous research of other authors [37,38,39]. Further elaboration on this step depends on the selected method for calculating ETc in the specific case of application.
Step II: The Calculation of the crop-specific climatic water balance.
In this step, the crop-specific climatic water balance (D) is calculated as a difference between precipitation (P) and ET0, which is the same as in the original SPEI. However, in the ADM-SPEI approach, ET0 is replaced by ETc. The crop-specific water balance is calculated as:
D i = P i E T c i
where i is the observed month to which D, P and ETc are related.
The values of Di can be aggregated for certain periods of time, thereby taking into account the accumulation of the water balance in that period. For the purpose of the agricultural drought monitoring, it is considered that the adequate periods of aggregation (accumulation periods) are 1, 2, and 3 months. The aggregated values of water balance can be calculated as:
D i k = j = 0 k 1 D i j
where k is the period of aggregation (accumulation period), and i is the observed month.
Step III: The selection of the most adequate theoretical distribution.
In the next step of the procedure for the calculation of the AD-SPEIcrop, the theoretical distribution, which best fits to the empirical data of crop-specific climatic water balance, should be selected. Goodness of fit test based on graphical or analytical methods [64] is used for the selection of the most adequate distribution. In the proposed ADM-SPEI approach and according to [9,65,66,67], the following goodness of fit tests are recommended: L-moment ratio diagrams, Anderson-Darling (A-D) test, and Akaike Information Criterion (AIC). In the original formulation of the SPEI index, log-logistic probability distribution is used. As the selection of the adequate distribution can greatly affect the accuracy of the obtained results, it is necessary to re-examine which distribution best fits to the observed empirical data of the crop-specific climatic water balance.
For determining the probability distribution of hydrologic data, Hosking [68] proposed the use of L-moments. The L-moment diagram shows the visual comparison of the sample L-moment ratios and theoretical L-moment ratio curves of the candidate distributions [69]. The details about the construction of the L-moment ratio diagrams can be found in the literature [70].
The Anderson-Darling [71] goodness-of-fit test has been widely used since it was introduced [72]. The Anderson-Darling statistic is based on the comparison of the empirical distribution function of sample data with the tested theoretical distribution, and it gives more weight to the tails of the tested distribution [73]. Its application has demonstrated good performance in hydrological studies.
The Akaike’s information criterion (AIC) [74] is based on maximized likelihood indicating the relative quality of the model and it includes an additional penalty proportional to the number of model parameters [75]. The selection of a good model is based on the lowest AIC value. AIC is one of the most popular methods for model selection.
Step IV: The calculation of the AD-SPEIcrop.
Following is the estimation of the distribution parameters and the calculation of the cumulative distribution function (CDF) of the crop-specific climatic water balance F(D) based on the distribution selected in the previous step. According to the proposed ADM-SPEI approach, this step depends on the chosen theoretical distribution for the particular data analyzed.
The final values of the AD-SPEIcrop are obtained in the same way as the values of the original SPEI [9]. This means transforming the CDF of the climatic water balance (in this case, the crop-specific climatic water balance) into the standard normal distribution, which is symmetrical, with a mean of 0 and a standard deviation of 1. As stated in [9], the transformation is based on the approximation of Abramowitz and Stegun [76], with SPEI being replaced by AD-SPEIcrop:
A D S P E I c r o p = W C 0 + C 1 W + C 2 W 2 1 + d 1 W + d 2 W 2 + d 3 W 3
W = 2 ln ( P )   for   P     0.5
where P is the probability of exceeding the crop-specific climatic water balance D, P = 1 − F(D). If P > 0.5, P is replaced by 1 − P, and the sign of the resultant value of the index is changing. The values of the constants are: C0 = 2.515517; C1 = 0.802853; C2 = 0.010328; d1 = 1.432788; d2 = 0.189269, and d3 = 0.001308.
Negative values indicate deficit in the water balance, i.e., drought conditions, and positive values indicate wet conditions. The obtained index is a standardized variable enabling spatial and temporal comparisons. The detailed description of this step will be presented in the application of the proposed ADM-SPEI approach, where the AD-SPEIcrop will be calculated from real datasets.
Step V: (Optional) The assessment of the capability of the irrigation systems depending on the degree of drought severity based on the AD-SPEIcrop.
The irrigation requirements are obtained by calculating the crop water balance. As the AD-SPEIcrop is based on the crop water balance (the difference between precipitation and ETc), this index can also be used for the estimation of the crop irrigation requirements. This index can be applied to simultaneous monitoring of drought conditions and crop irrigation requirements, as well as showing the links between drought conditions and irrigation needs of specific crops. The AD-SPEIcrop can be used for determining the required characteristics of irrigation systems in order to prevent negative effects of drought, and for analyzing capabilities of existing irrigation systems to cope with drought. In other words, the proposed AD-SPEIcrop is useful to estimate whether the existing irrigation system could successfully protect the specific crop from certain degrees of drought severity. The transformation of the AD-SPEIcrop values into the values of the crop water balance is performed as follows. First, the CDF of the standard normal distribution should be calculated using [77]:
F ( x ) = x e x 2 2 2 π d x
where x represents the values of AD-SPEIcrop. Then, the inverse value of the theoretical distribution is calculated, thereby obtaining the values of crop climatic water balance. The irrigation hydromodule can be determined using these values, since they represent the estimated crop irrigation requirements. It is used for defining the required ability of the irrigation system to compensate for the water deficit. Also, dimensioning of all the system elements is based on the irrigation hydromodule. It is expressed as the required amount of water in a unit of time per hectare (l/s/ha or mm/day):
q ( m m / d a y ) = H ( m m ) T ( d a y )   or   q ( l / s / h a ) = H ( m m )   ×   10,000 T ( d a y )   ×   n ( h )   ×   3600
where q is the irrigation hydromodule, H is the required amount of water, T is number of days, and n is the duration of irrigation in a day.

2.2.3. Phase III—The Validation of the Proposed ADM-SPEI Approach

Step I: The comparison of the AD-SPEIcrop with the relevant data for the purpose of validation.
The proposed ADM-SPEI approach also defines the validation phase in which the first step is the comparison of the AD-SPEIcrop with the relevant data. The aim of this step is to provide a clear indication of the extent to which the index values reflect the drought conditions, thereby confirming both the practical application of the index and the application of the proposed ADM-SPEI approach.
In order to validate the AD-SPEIcrop, it is necessary to compare the index values with the relevant data indicating the effects of different intensity drought occurrences in the observed area. When it comes to the types of data to be compared, it is important to consider the fact that the data should be relevant, good quality, and that sufficiently long data series are available for the statistical analysis. Hao and Singh [78] state that for the validation of drought indices, temporal and spatial comparison techniques are generally used with globally accepted indices such as the SPI or the PDSI, as well as comparisons with recorded drought events and feedback from experts.
After obtaining the AD-SPEIcrop index that is adapted for a specific area of interest and related to a specific crop, it is necessary to compare index values with the available relevant data, such as: Crop yields, crop irrigation requirements, historical recorded droughts, etc. Likewise, experts’ feedback could be used for the purpose of index validation. Bearing in mind that different types of data are available in different areas and that all the databases might not be available in all the cases, this step is flexible in terms of selecting relevant data for the comparison with the modified index.
Step II: The comparison of the AD-SPEIcrop with the other globally accepted indices.
This step suggests that the obtained values of the AD-SPEIcrop should be compared with the values of other indices that have previously been successfully used in the area under consideration, and whose application has been confirmed. The aim of this comparison is to see the similarities and differences in the detection of drought events and drought intensities, and thus to validate the modified index and confirm its performance in the detection of drought events. The literature suggests using spatial and temporal comparisons with the widely known and globally accepted indices, such as PDSI, SPI, SPEI, etc. The comparison can be made visually by using appropriate diagrams, graphs, and maps, or by using appropriate mathematical and statistical methods. In this step, different mathematical and statistical methods for index comparison can be used.
Step III: Experts’ feedback on the results of the comparison.
In addition to mathematical and statistical tests, experts’ feedback based on their knowledge and experience in the observed area is also of great importance. Given that the proposed ADM-SPEI approach refers to agricultural drought, it is recommended that experts with different agricultural expertise be included in this phase of validation in order to critically evaluate the results of the comparisons (previous two steps). The aim of this step is viewing at the results of the comparison from multiple perspectives and by experts who are familiar with the local conditions. Therefore, feedback is needed from the experts in the field of plant production (crop and vegetable production), irrigation of agricultural crops, and experts in the field of drought management in agriculture. Feedback regarding the final assessment of the performance of the modified index obtained within the application of the proposed ADM-SPEI approach to agricultural drought monitoring is significant, since it includes experts’ opinions in addition to mathematical and statistical tests.

3. Results

This section presents the application of the proposed ADM-SPEI approach to agricultural drought monitoring in the Vojvodina region. The detailed description is given through the three phases and the corresponding steps (Figure 1). Monthly data sets from 1971 to 2016 from nine meteorological stations were used, 11 agricultural crops were taken into the account, and indices for three periods of accumulation (one, two, and three months) were calculated.

3.1. Phase I—Decision Making on the Most Suitable Method for Calculating the ET0 (or ETc) to Be Used within the SPEI in the Analyzed Area

3.1.1. Step I: The Selection of Alternatives—Suitable Methods for Calculating ET0 (or ETc) within the SPEI

Based on the experts’ recommendation, among the numerous methods, five were selected that have been often used in scientific research and practical applications in the Vojvodina region. The five following methods that have been selected as alternatives are: FAO-56 PM (PM), Turc (TU) [79], Thornthwaite (TH), bioclimatic method (BM) based on hydrophytothermic indices, and Hargreaves (HG). The most suitable one for use within SPEI index on this particular region was going to be chosen among these methods. More information about the selected methods can be found in numerous relevant literature. If the proposed ADM-SPEI approach is applied in some other region, it is necessary to reselect the suitable methods by consulting relevant literature and local experts.

3.1.2. Step II: Defining the Criteria Relevant for the Decision-Making Problem—the Selection of the Most Suitable Method for the Calculation of ET0, and ETc to Be Used within the SPEI in the Study Area

Following the selection of the alternatives, this step includes defining the relevant criteria (C) for the decision-making problem—the selection of the most suitable method for the calculation of evapotranspiration to be used within the SPEI in the study area. The following five criteria have been defined by taking into account the relevant literature and experts’ opinions. They are considered to be significant for the particular decision-making problem in the Vojvodina region.

Availability of Reliable Input Data (AD)

The methods for the calculation of evapotranspiration are based on various parameters and, therefore, require different input data. Many meteorological stations worldwide measure a limited number of meteorological data. Their public availability is often limited. Furthermore, the quality of the measured data is frequently disputable. Hence, it is important that the meteorological data be reliable. This criterion is an important prerequisite for the accuracy of the final results obtained within the application of this method.

Literature-Based Suggestions (LS)

Literature offers numerous methods for the estimation of evapotranspiration based on different principles. Likewise, a lot of analysis and research conducted in diverse climatic conditions examine the possibilities of the application of these methods. Authors’ approaches to recommended methods for the particular regions vary. Being familiar with relevant literature and research about the particular region can have a huge impact on the appropriate selection of the most suitable method for the calculation of evapotranspiration.

Ease of Calculation (EC)/the Simplicity of Method

A wide range of methods for the calculation of evapotranspiration vary from empirical to combined ones. In addition to the methods that are easy to use for the calculation, there is a large number of those that demand complex calculations. Oftentimes, the methods that enable simple and fast calculations are preferred. The complexity of the method does not guarantee its quality.

Common Practice (CP)

Many authors recommend comparing the results obtained using different methods with the results calculated by some of the sophisticated methods in the investigated area, such as lysimeters. Since the aforementioned research are demanding and expensive, this type of data is often not available in many locations. For that reason, it is presumed that years-long application of the method for the calculation of evapotranspiration and experts’ practical experience have ensured the selection of the most suitable method for the agroclimatic conditions of the particular region. For the abovementioned reasons, the common practice or positive experience in local specific conditions was taken into consideration as an appropriate criterion.

The Relevance of the Input Parameters for the Local Climatic Conditions (RP)

Evapotranspiration is conditioned by numerous climatic parameters. However, on the particular location, certain parameters can have a more dominant impact than the others. Therefore, it is important to know climatic conditions in the region of interest in order to select the adequate method for the calculation of evapotranspiration. The method that contains the most relevant climatic parameters of the particular region that affect the intensity of evapotranspiration probably produces the most reliable results.

3.1.3. Step III—Obtaining the Experts’ Individual Decisions

In defining this approach, in addition to the specificity of the agro-climatic conditions, the opinions of experts of various expertise in the field of agriculture and water management were also taken into account. Nine decision makers (DM) from the Vojvodina region participated in this research with the goal to select the most suitable method for the calculation of evapotranspiration within the SPEI in this particular region. Experts are from the Faculty of Agriculture—The University of Novi Sad, The Institute of Field and Vegetable Crops, Public Water Management Company Vode Vojvodine, as well as experts in the design and management of irrigation systems employed in the leading agricultural companies in this region. The hierarchy of the decision-making problem is graphically presented in Figure 1b. Each decision maker (expert) individually made a pairwise comparison of the criteria in relation to the goal (the selection of the most suitable method for calculating ET0 (or ETc) within the SPEI index) in the AHP decision matrices. Also, each decision maker compared the alternatives in relation to each criterion separately and their judgments were placed in the AHP decision matrices. An example of decision matrices for one decision maker is presented in Figure 2. For each expert separately, a total number of six matrices were obtained (one for the comparison of the criteria with respect to the goal and five for the comparison of the alternatives with respect to each criterion).
Then, following the AHP procedure, the final priority vector of each expert separately was obtained. The final priority vectors for each of nine decision makers are presented in the Table 1. The consistency check was performed for each expert. If it was determined that inconsistent judgments appeared, the procedure was repeated. At the end, for each expert, the calculated CR values were less than 0.10. Based on that, it was concluded that the inconsistency of decision makers’ judgments was at an acceptable level.

3.1.4. Step IV—Obtaining Experts’ Final Group Decision

In this step, from individual decisions of the experts, one final group decision (rank of alternatives) was obtained using AIP [60,61] and WAMM [60]. In the calculations, it has been assigned equal weight for all the nine experts. The obtained group decision is shown in the Table 1 where the following rank of methods could be seen: The first ranked is Bioclimatic method (BM), then Thornthwaite (TH), Hargreaves (HG), FAO-56 PM (PM), and the last-ranked Turc (TU). The BM based on hydrophytothermic indices, as the first-ranked method obtained by the experts’ group decision, is taken as the most suitable method for calculating evapotranspiration within the SPEI index for the Vojvodina region.

3.2. Phase II—The Calculation of the Modified SPEI Adjusted to the Area of Interest and Related to the Crops

3.2.1. Step I—The Calculation of the ETc

In this step, the ETC is calculated. The following crops are analyzed: Maize, soybean, sugar beet, alfalfa, potato, onion, cabbage, beans, hop, tobacco, and winter wheat. The selection of crops is based on their sensitivity to drought and availability of yield related data in statistical publications.
The following is a brief description of the bioclimatic method, since it is not well known and widely used, whereas in the Vojvodina region and surrounding areas, it is frequently applied. The bioclimatic method has been developed, studied in detail, and its accuracy and reliability have been experimentally verified in various studies of the irrigation regime based on soil moisture in the agro-ecological conditions in the Vojvodina region [80]. The method is described in literature. (e.g., [81,82,83,84,85,86,87]). The bioclimatic method in the Vojvodina region was developed by [88] and it is based on the correlation between crop evapotranspiration and physical factors of evapotranspiration (temperature, humidity, solar radiation, vapor pressure, etc.). If the mean daily air temperature is used for the calculation of the ETC, the bioclimatic coefficient is called hydrophytothermic index (K). The hydrophytothermic index represents the amount of water (mm) consumed through the evapotranspiration for every degree of the mean daily air temperature. Based on experimental field research implying perennial investigations and evaluations in irrigation practice, numerous authors have determined hydrophytothermic indices for various fields, vegetable, and fruit crops. When the hydrophytothermic indices are determined for the particular crop in the analyzed area, they have a high practical value, and by using them, the ETc can be calculated quickly and easily [80]. The ETc can be calculated on a monthly basis by multiplying the corresponding hydrophytothermic index by the sum of the mean daily air temperature in the month observed:
E T C = K × i = 1 n T i
where n is the number of days in a month and T is the mean daily air temperature in the observed month. The values of the hydrophytothermic indices used for the calculation of the ETc presented in the Table 2 have been collected from literature [80,86,89,90]. The hydrophytothermic indices for beans were not found in literature. However, based on the experts’ advice, the hydrophytothermic indices for green beans were adopted as valid for beans as well. For winter wheat, the hydrophytothermic indices were obtained by the conversion of the FAO crop coefficients [25], which were experimentally determined in the Vojvodina region by [91]. Determining the hydrophytothermic indices for the particular area enables the use of the bioclimatic method in any other region since the area of their application is specific for the region for which they have been experimentally verified.

3.2.2. Step II—The Calculation of the Crop-Specific Climatic Water Balance

In the previous step, the ETc was calculated using the bioclimatic method. Then, the crop-specific water balance was calculated using the procedure described in the Section 2.2.

3.2.3. Step III—The Selection of the Most Adequate Theoretical Distribution

The most suitable distribution functions for modeling time series of water balance calculated for different accumulation periods (time scales) were tested in this study. The selection of the most suitable distribution functions was performed using the L-moment ratio diagrams, since these diagrams enable comparing empirical distributions with a number of theoretical distributions as it was shown in [9,68,70]. The L-moment ratio diagrams were constructed for the time series of water balance for the accumulation periods of one, two, and three months while using the data from 9 meteorological stations in Vojvodina, and for 11 agricultural crops. The number of the points representing the empirical frequency distribution of the crop water balance time series shown in the diagrams depends on the duration of the crop growing season and on the period of accumulation. The diagrams indicate that the empirical series of the crop water balance can be modeled with several different theoretical distributions (generalized extreme value—GEV, generalized logistic—GLO, Pearson type III—P3, and normal—N) because empirical statistics oscillate around the curves related to the mentioned theoretical distributions. Therefore, the selected distributions to be potentially used within the calculation of the AD-SPEIcrop are: GEV, GLO, P3, and N. Stagge et al. [65] also considered these four distributions for the calculation of the SPEI. As an illustration, the L-moment ratio diagrams for the time series of water balance of maize for the accumulation periods of one, two, and three months are shown in Figure 3.
The selected distributions are further tested using the Anderson-Darling (A-D) test according to the significance level of α = 5%. The distributions were fit to empirical data by maximum likelihood estimation using the “fitdistrplus” R package [92]. Critical values for the A-D test were calculated by Monte Carlo bootstrap simulations using “nsRFA” R package [93]. Also, the distributions were ranked using Akaike information criterion (AIC), and all the comparisons were made taking into account the accumulation periods, location, and agricultural crops.
The results of goodness of fit tests indicate that the GEV distribution, in most cases, fits best to the empirical data of climatic water balance. The selection of the GEV distribution as the preferred one when calculating the AD-SPEIcrop is in accordance with the results in [65] concluding that the GEV distribution is recommended for the use in calculating the SPEI in Europe. This differs from the research by [9] as well as [39], who recommended the use of the log-logistic distribution in the calculation of the SPEI and the SPCEI, respectively. The A-D tests produced rejection frequency of the GEV distribution (when goodness of fit indicates that distribution cannot be accepted) in the range from 0 to 6.7% for all of the three accumulation periods and for all crops with the exception of tobacco for a two-month accumulation period when it is 8.3%, and for beans for the accumulation period of two months (Table 3). The next one is the P3 distribution with rejection frequency between 0 and 13.3%, GLO with rejection frequency in the range from 0 to 13.9%, and finally the N distribution with rejection frequency between 3.7% and 57.8%. In most cases, rejection frequency of the GEV distribution produced by the A-D tests was below 5%. Rejection frequency of all the four distributions by the A-D tests for beans for a two-month accumulation period was 22.2%.
The selected distributions were further compared by AIC. Except for the normal distribution, all the other three considered distributions have the same numbers of parameters (three); therefore, the AIC is reduced to a measure of log likelihood as in [65]. The best ranked distribution based on the log likelihood for the accumulation period of one month and for all crops is the P3, and then the GEV, GLO, and N, respectively (Table 4). For longer accumulation periods (two and three months), the best ranked distribution is the GEV, and then the GLO, P3, and N, respectively.
Taking into account all the performed tests, confirming the best agreement with the empirical data series of crop-specific climatic water balance, the use of the GEV theoretical distribution can be recommended for the calculation of the AD-SPEIcrop in the Vojvodina region.

3.2.4. Step IV—The Calculation of the AD-SPEIcrop

In the previous section, it was determined that the values of the crop-specific water balance (D) in the Vojvodina region followed the three-parameter GEV distribution. The CDF of the GEV distribution is [69]:
F ( D ) = e x p { [ 1 k ( D ξ ) α ] 1 / k }
where ξ, α, and k are the location, scale, and shape parameters, respectively, estimated from the series of D values using L-moments. The details about their calculation can be found in [69].
After calculating the F(D), the AD-SPEIcrop is obtained by transforming the CDF into the standard normal distribution described in Section 2.2. In the following text, some of the ways of a possible presentation of the obtained AD-SPEIcrop values are shown. Considering that the aim of this paper is not the analysis of drought in the Vojvodina region, but the demonstration of the proposed ADM-SPEI approach, while bearing in mind a large amount of analyzed data and the scope of the obtained results, several representative examples have been shown for the purpose of illustration. In Figure 4, values of the AD-SPEIcrop for the two-month accumulation period (AD-SPEI2crop) are shown for the meteorological station Rimski Šančevi from 1971 to 2016. It can be observed that the extreme drought events (AD-SPEI2crop < −2) occurred in 1992, 2003, 2012, and 2015. The extreme wet conditions (AD-SPEI2crop > 2) occurred in 1987, 1996, and 2001.
The spatial and temporal distribution of moisture conditions in Vojvodina from the perspective of agricultural crops is shown in more detail and illustrated in the maps (Figure 5, Figure 6, Figure 7, Figure 8 and Figure 9) for the part of the vegetation season in 2003. The map legend used is adopted from the [94] (Table 5).
The maps (Figure 5) of the SPEI1wheat mostly show minor drought in March and April of 2003, and extreme and exceptional drought in May and June.
The maps (Figure 6, Figure 7, Figure 8 and Figure 9) show drought conditions according to the AD-SPEI1crop for maize, sugar beet, alfalfa, and onion. Generally, with local differences and variations depending on the crops, extreme drought began to appear in May 2003 in parts of eastern and central Vojvodina, and extreme drought spread to almost entire territory in June. Due to increased amount of precipitation in July, most of the territory was under normal moisture conditions, while the northeastern and southern parts were under wet and moderately humid conditions. In August, most of the territory was under severe and moderate drought, and extreme drought occurred in the southeast of Vojvodina.
In addition to diagrams and maps, the AD-SPEIcrop values are also visually presented using heat maps where the index categories are presented by colors (legend in Table 5), thus enabling easier visual detection of changes and differences in index values in time and related to crops. Due to the high volume of results, in Figure 10, heat maps are illustrated only for one meteorological station (Vršac) for 1992, 1993, 2004, 2004, 2011, and 2012. In the heat map, the AD-SPEI1crop indices for all the analyzed crops are shown.
It can be noticed that the AD-SPEI1crop values by months at the observed locations mostly fall into the same drought category, but in certain cases, there are differences in drought categories depending on the crops. Although the index values for different crops are generally similar, the values of the crop-specific climate water balance, on which the index is based, are different. The crop-specific climate water balance is a very important parameter because it indicates the crops irrigation requirements, enables the planning of the irrigation regime, and is a required element in the design of hydromelioration systems. Therefore, it would be useful that the AD-SPEIcrop be presented in parallel with the water balance values. This would allow for a more detailed insight into the link between drought and the crop irrigation requirements.

3.2.5. Step V—(Optional) The Assessment of the Capability of the Irrigation Systems Depending on the Degree of Drought Severity Based on the AD-SPEIcrop

In the previous steps, it was determined that the GEV distribution fits best to the empirical data of the crop-specific climatic water balance in the Vojvodina region. The values of the AD-SPEIcrop have been obtained by transforming the CDF of the GEV distribution into the standard normal distribution (see Section 2.2). In order to transform the index values back into the corresponding values of the crop-specific climatic water balance, it is first necessary to calculate the CDF of the standard normal distribution, and then to calculate the inverse value of the GEV distribution as [95]:
D ( F ) = ξ + α k { 1 ( l n F ) k }
where D(F) is the inverse value of the GEV distribution and it represents the value of the crop-specific climatic water balance, F is the probability of the occurrence of the water balance according to the GEV distribution, and ξ, α, and k are the parameters of the location, scale, and shape.
The usual values of water balance—those that normally occur in a particular location for the observed crop—can be significantly different in a location with different climatic conditions. For example, the value of the climatic water balance of maize with the probability of occurrence of 50% in June in Rimski Šančevi is −27 mm, and the same value in Kikinda is −42 mm. Also, for instance, the value of the climatic water balance of alfalfa with the probability of occurrence of 50% in June in Rimski Šančevi is −68 mm, and the same value in Kikinda is −84 mm. Although these water balance values differ significantly, drought intensities are the same (index values are 0, which, according to categorization, indicates normal conditions) because all these phenomena have the same probability of occurrence, and differences in water balance values are caused by different climatic conditions in these locations, as well as by the differences between crops. In comparison to other indices, such as the original SPEI or SPI, the advantage of the AD-SPEIcrop is that the index value can be directly transformed back into the value of the crop-specific climatic water balance, which is of practical importance in the field of agricultural water management. To illustrate this, the spatial and temporal distribution of the values of climatic water balance of maize and alfalfa from June to August 2012 in the Vojvodina region are shown in Figure 11 and Figure 12.
The maps (Figure 13) show the differences in values of the climatic water balance illustrated both in spatial terms and by crop (maize and alfalfa) if the values of the AD-SPEIcrop were the same on the entire territory. Hypothetically, when the value of the AD-SPEI1maize is −2 in June on the entire territory of Vojvodina, the values of the maize climatic water balances range from −95 mm to −115 mm. Likewise, the value of the AD-SPEI1alfalfa of −2 in June on the entire territory of Vojvodina would entail the alfalfa climatic water balances ranging from −141 mm to −165 mm.
The following is an example of the use of the AD-SPEIcrop in the analysis of the capabilities of irrigation systems to protect crops from drought. Based on the values of the crop-specific water balance, the irrigation hydromodule can be determined (Equation (10)), which is necessary for the dimensioning of the irrigation system elements. Irrigation systems are designed according to the crops water requirements in critical months, and in the Vojvodina region, these are July and August. In contemporary irrigation systems, the maximum effective working hours are approximately 22 h a day. In the Vojvodina region, the usual values of irrigation hydromodules are around 0.5–0.6 L/s/ha [90]. Assuming that the irrigation system is designed based on the value of the hydromodule of 0.6 L/s/ha, and that the effective irrigation time is 22 h a day, the monthly amount of water that the system can deliver is 147 mm (derived from Equation (10)). This value represents the gross amount of water. However, it is necessary to account for the efficiency of the irrigation system, which for the contemporary sprinkler irrigation systems (center pivots and linears), is about 90%. If the system efficiency of 90% is used, the net monthly amount of water is 133 mm. This value corresponds to the monthly water deficit in the crop water balance for which the system can compensate and for which the AD-SPEIcrop can be determined with respect to each crop in a given area. For example, the value of the monthly water balance deficit of 133 mm in August corresponds to the value of the AD-SPEI1crop for maize in Rimski Šančevi of −1.77 (extreme drought). In July, the same value of water balance deficit (133 mm) for the same crop and for the same location, the index value is −2.41 (exceptional drought). These results show that irrigation systems could protect maize from extreme drought in August and from exceptional drought in July in the observed location. The maps (Figure 14) show the drought categories in August representing the limits of the capability of the irrigation systems designed using the hydromodule of 0.6 l/s/ha to successfully protect agricultural crops.

3.3. Phase III—The Validation of the Proposed ADM-SPEI Approach

3.3.1. Step I—The Comparison of the AD-SPEIcrop with Relevant Parameters

In order to avoid bias and objectively review the proposed ADM-SPEI approach, a validation analysis was performed from several different perspectives (Figure 1d). In this paper, within the validation of the proposed approach in the Vojvodina region, it was determined that the selection of the relevant parameters for the comparison was based on the availability of quality data in the area of interest. Therefore, publicly available important crop yields data in Vojvodina that can be found in statistical yearbooks and similar publications were selected.
After obtaining the AD-SPEIcrop values, a comparison was made with available crop yields data. First, a comparison of the AD-SPEIcrop with the average yields in Vojvodina was made, and then a comparison with the average yields at the municipal level in Vojvodina was made in order to obtain more detailed results on the local level. The comparison of the indices with the crop yields can be found in the studies of numerous other authors (e.g., [6,51,96,97,98]).

The Comparison of the AD-SPEIcrop with the Average Yields in Vojvodina

The correlation between the AD-SPEIcrop and the yields of the analyzed crops was estimated based on Pearson’s correlation coefficient r at significance levels of α = 0.05 and α = 0.10. The aggregated index values (average values) and average crop yields for the region were used according to the [51,52,53,97,98]. The values of Pearson’s correlation coefficient between the AD-SPEIcrop and the detrended yields of the analyzed crops are presented in the Table 6.
The results have shown that there is a statistically significant correlation between the AD-SPEIcrop and the yields of the observed crops in Vojvodina. The highest correlations were achieved in the months when the analyzed crops are in the developmental stages, during which water demands are high and when they are most sensitive to drought.

The Comparison of the AD-SPEIcrop with Yields at the County Level

The correlation of the AD-SPEIcrop with the detrended crop yields has also been analyzed at the local-county level. Nine counties were taken into consideration where meteorological stations of the Republic Hydrometeorological Service of Serbia are located, from which the data for calculating the AD-SPEIcrop have been collected. The average annual yields were collected at the county level for the following crops: Maize, sugar beets, alfalfa, potatoes, beans, and winter wheat. The yield data for soybean from the experimental fields of the Institute of Field and Vegetable Crops (IFVC) Novi Sad were also considered in the analysis. The correlations between the AD-SPEIcrop and the crop yields were estimated using the Pearson’s coefficient of the correlation r at significance levels of α = 0.05 and α = 0.10. The correlations are presented in Figure 15, Figure 16, Figure 17, Figure 18, Figure 19, Figure 20 and Figure 21. They show the months and accumulation periods when the degrees of the correlation between the index and the detrended crop yields by county are highest. The obtained results indicate that these indices can be successfully used for monitoring agricultural drought and for monitoring the impact of drought on crop yields in the Vojvodina region.

3.3.2. Step II—The Comparison of the AD-SPEIcrop with the Other Globally Accepted Indices

The Comparison of the AD-SPEIcrop and the SPEI Respectively with Crop Yields

In order to gain a better insight into the performance of the AD-SPEIcrop as a reliable indicator of agricultural drought, a comparison of this index with the original SPEI index has been made. The correlation between the AD-SPEIcrop and the detrended crop yields has been compared to the correlation between the original SPEI and the detrended crop yields. The rejection frequencies—when the correlations are not statistically significant at the significance level α = 0.05—have been calculated. By this criterion, an index with lower rejection frequency can be characterized as more reliable. The results are shown in Table 7. Based on the obtained results, it can be concluded that the AD-SPEIcrop has a better performance as a drought indicator because the AD-SPEIcrop has lower rejection frequencies of the correlation coefficient r than the original SPEI.

The Comparison of the AD-SPEIcrop with the SPI, SPEI, and SC-PDSI

For the purpose of the validation of the AD-SPEIcrop, the comparison with the globally accepted indices (SPI, SPEI, SC-PDSI) has been made. The comparison was based on Pearson’s correlation coefficient r and on the mean absolute difference (MAD). Similar comparisons can be found in the literature (e.g., [10,99,100]). The comparison has been made with regard to the particular crop, and r and the MADs have been grouped according to the AD-SPEIcrop values calculated for the nine meteorological stations in the region. The correlation has been calculated between the AD-SPEIcrop and the SPI, SPEI, and SC-PDSI indices, respectively. The MADs have been calculated only between the AD-SPEIcrop and the SPI and SPEI, since these indices use the same scale and their values are in the same ranges. The periods of accumulation of the AD-SPEIcrop from one to three months have been taken into the consideration. The diagrams (Figure 22, Figure 23, Figure 24 and Figure 25) show that the values of the correlation coefficient r between the AD-SPEIcrop and the SPEI and SPI indices, respectively, for all the three accumulation periods are high, generally over 0.8, and the values of the MADs generally range from 0.2 to 0.5.
These results indicate that the AD-SPEIcrop registers drought/wet conditions in approximately the same periods as the SPEI and the SPI indices, but that the categories of drought/wet conditions may vary.
The diagrams (Figure 26) show the values of the correlation coefficient r between the AD-SPEIcrop for the accumulation periods from one to three months and the SC-PDSI index. The r values between the AD-SPEIcrop for all the crops and the SC-PDSI index are mostly in the range from 0.28 to 0.48 for the one-month time scale, from 0.41 to 0.68 for the two-month scale, and from 0.46 to 0.75 for the three-month scale. The results show that the level of agreement increases with the increase in the AD-SPEIcrop accumulation period. This might be due to the SC-PDSI being calculated for a fixed time interval which is usually no less than 12 months. The longer period of time for which the SC-PDSI is calculated is probably the reason for a lower degree of agreement with the AD-SPEIcrop.
The results of the comparison between the AD-SPEIcrop and the globally accepted and well-known indices (SPI, SPEI, SC-PDSI) indicate that, like these indices, the AD-SPEIcrop can successfully detect dry and wet periods. Given that it is based on the crop-specific water balance, the index values more adequately characterize agricultural drought.

3.3.3. Step III—Experts’ Feedback on the Results of the Comparison

In addition to statistical tests within the validation of the approach, feedback from experts based on their knowledge and experience is also very important. For that purpose, in this step of the validation phase, bearing in mind that the results are compared to the crop yields and the globally accepted and well-known drought indices, experts of different agricultural expertise have been selected. It was presumed that the feedback from local experts in the field of plant production (crop and vegetable production) and irrigation of agricultural crops, as well as those in the field of drought management in agriculture, would be valuable for the final assessment of the performance of the AD-SPEIcrop obtained within the proposed approach to agricultural drought monitoring. Depending on their expertise, each expert has individually inspected the results of the comparison in the validation phase and confirmed the consistency of the AD-SPEIcrop with the compared drought indices. In other words, they have confirmed the performance of the AD-SPEIcrop for agricultural drought monitoring.

4. Conclusions

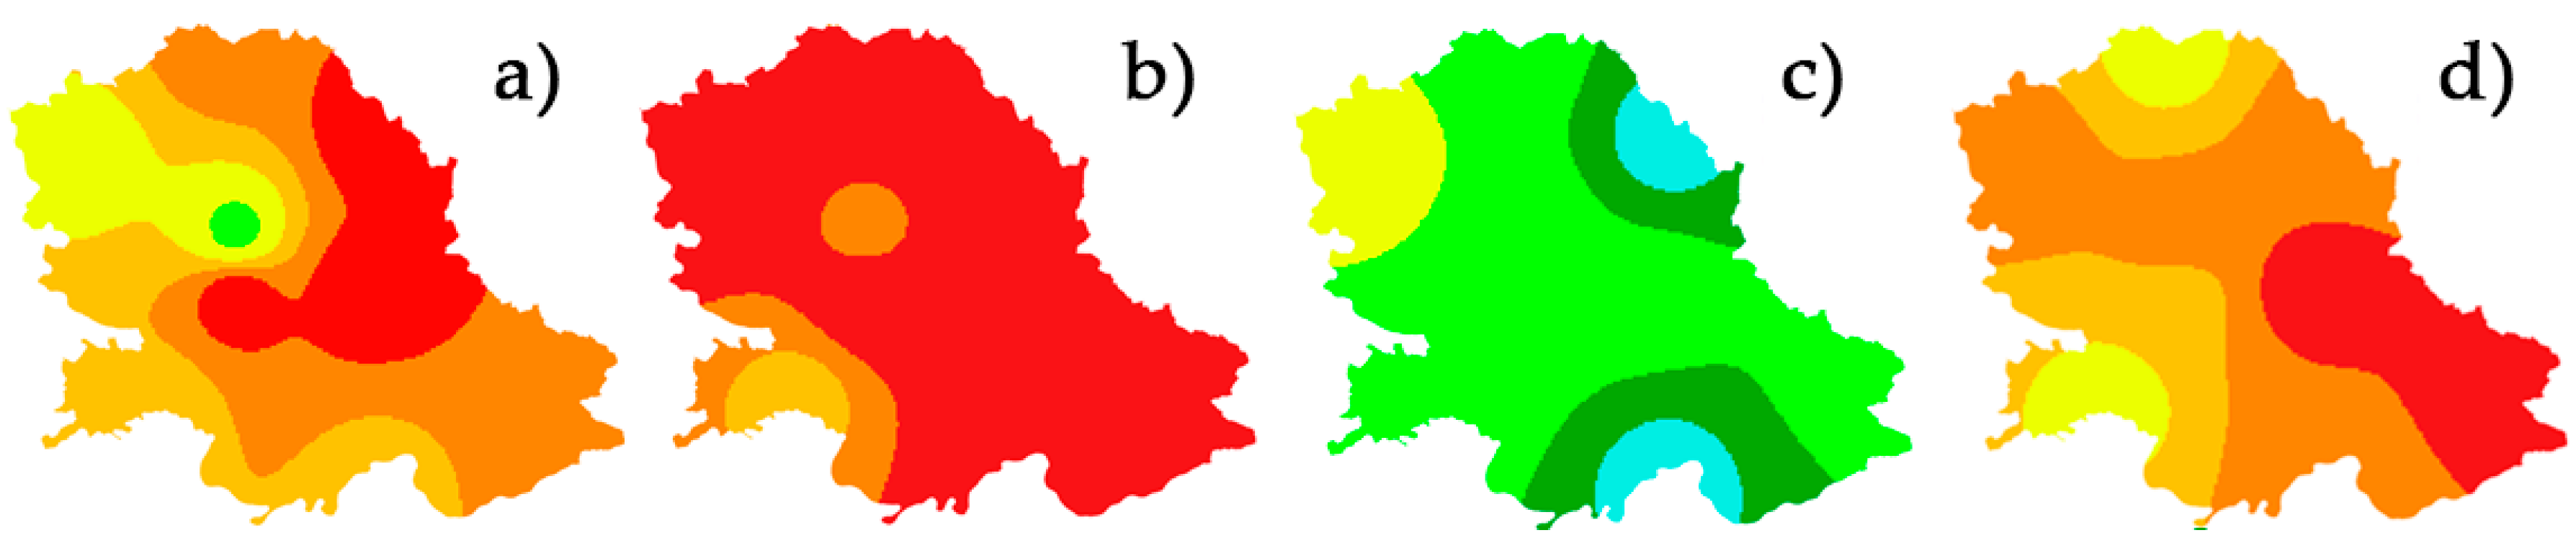
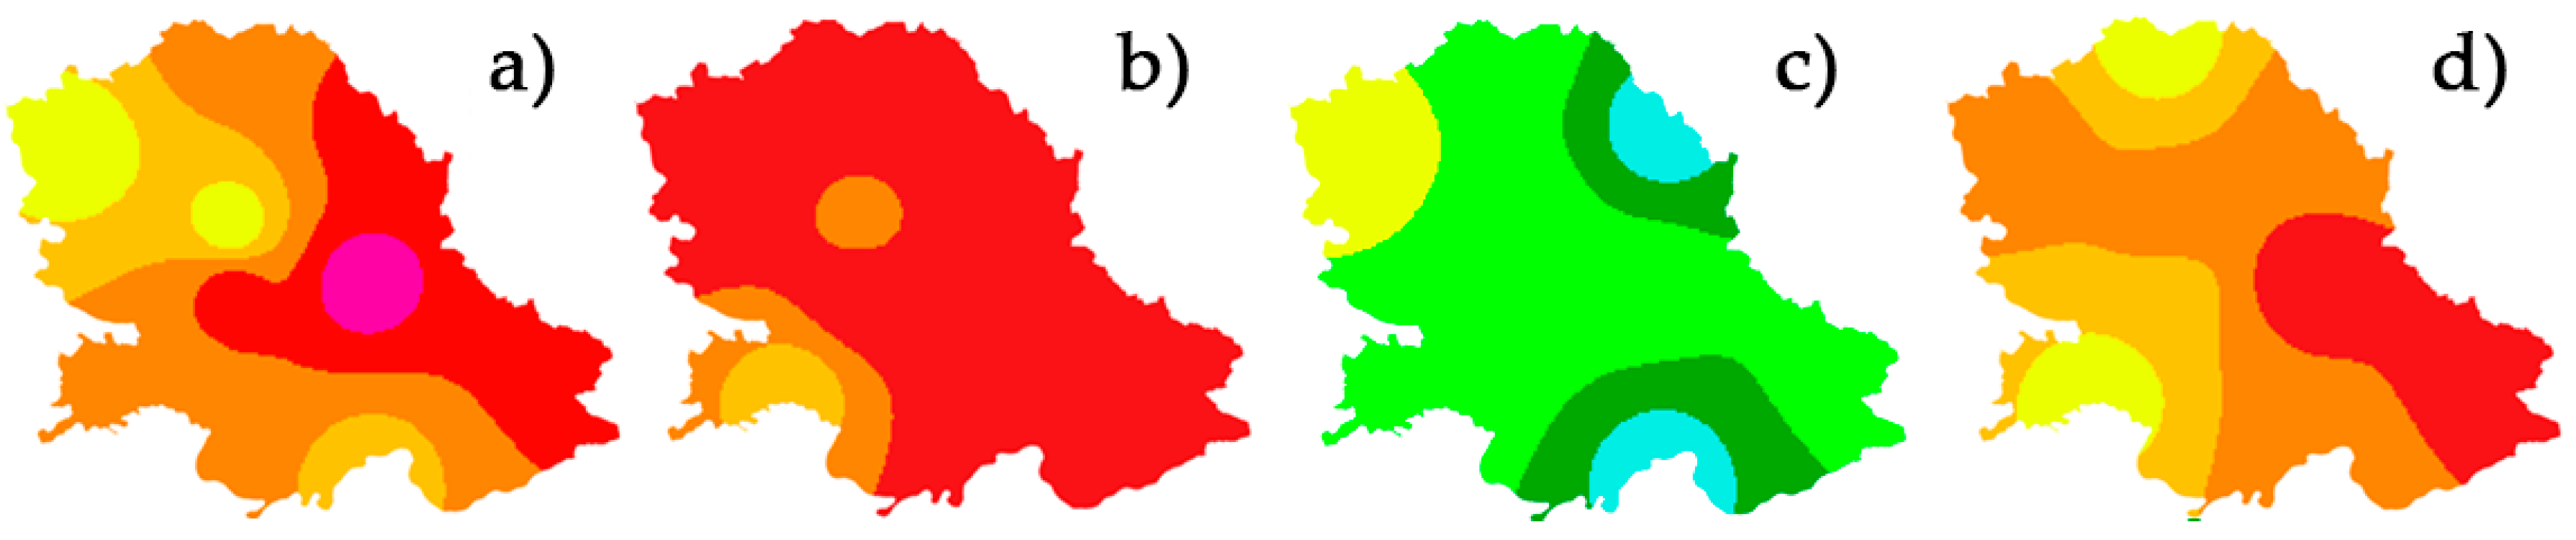
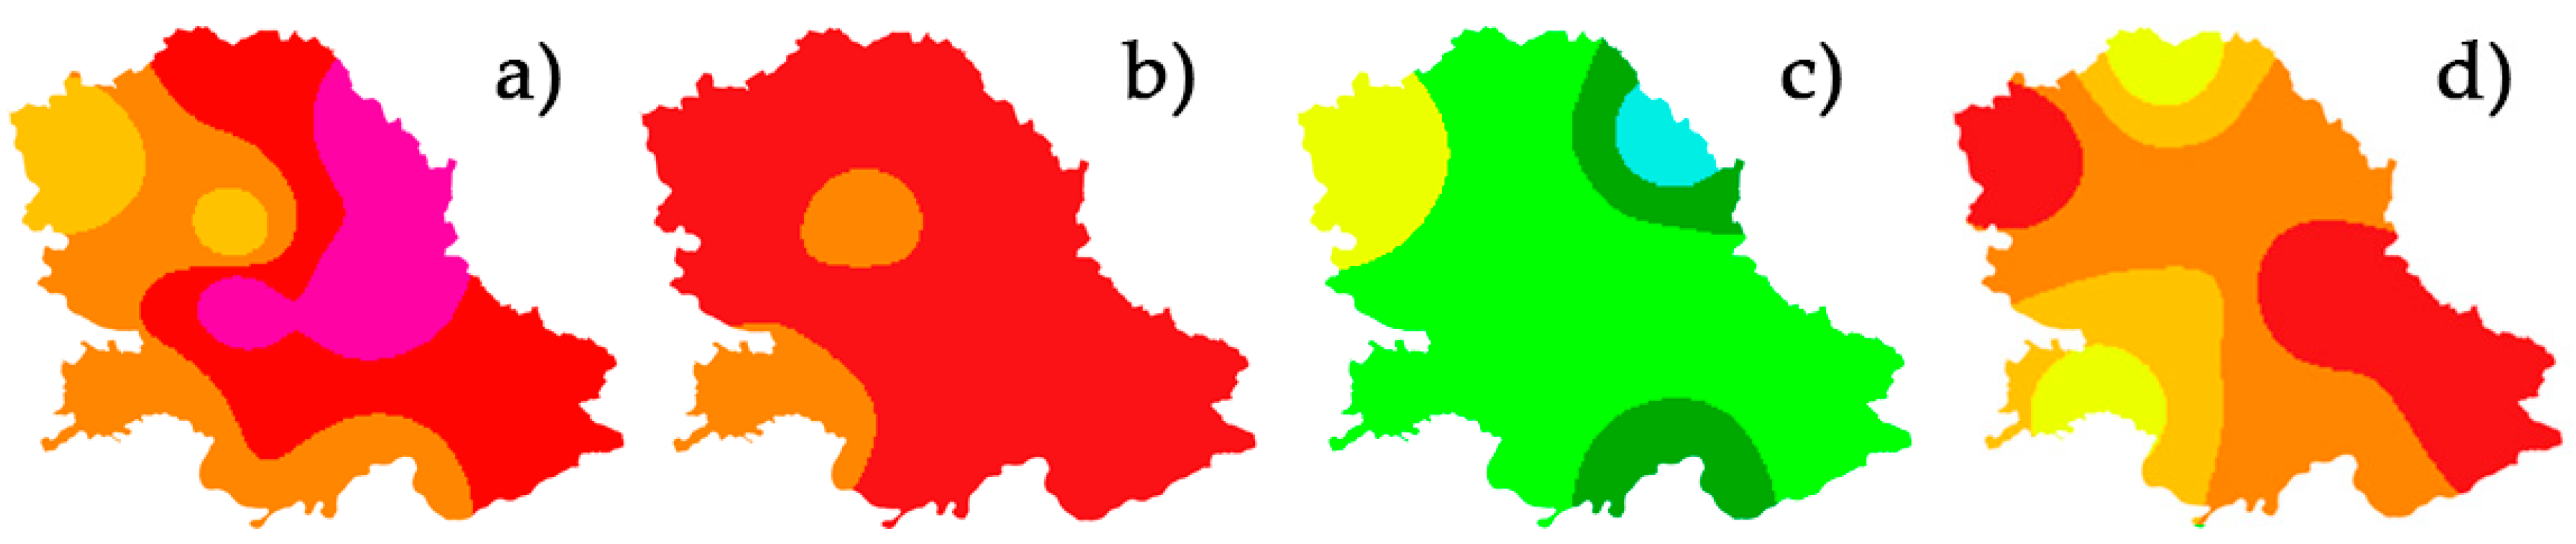
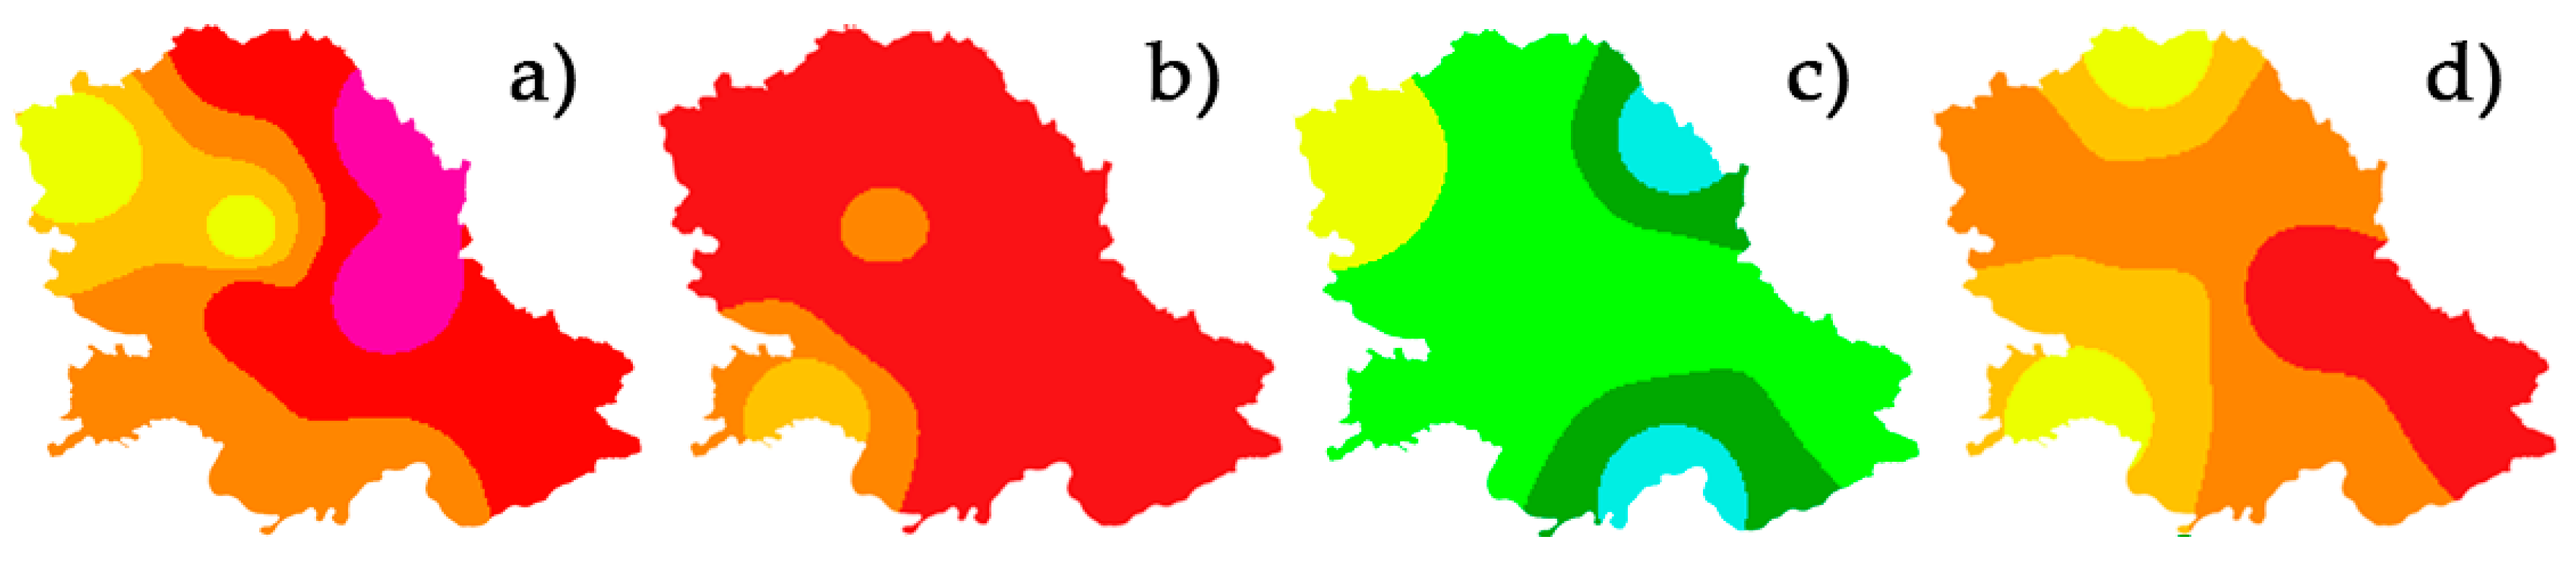
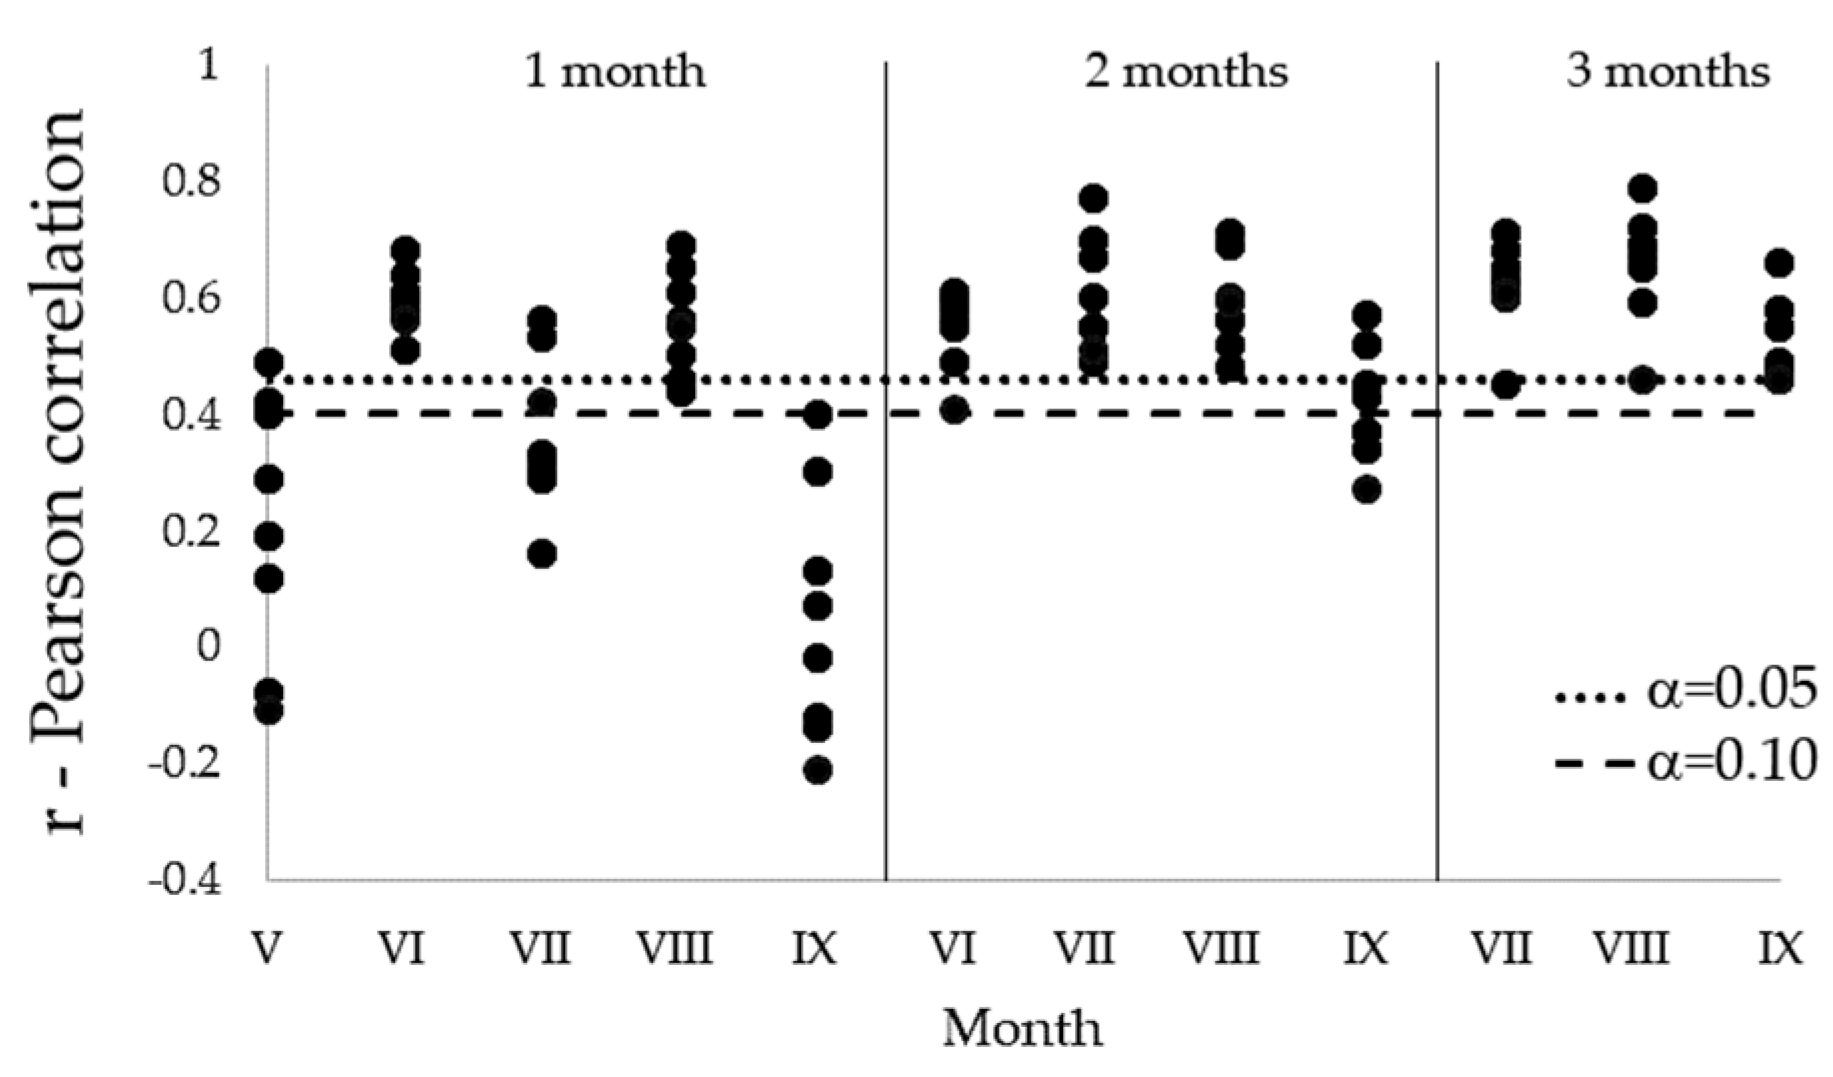
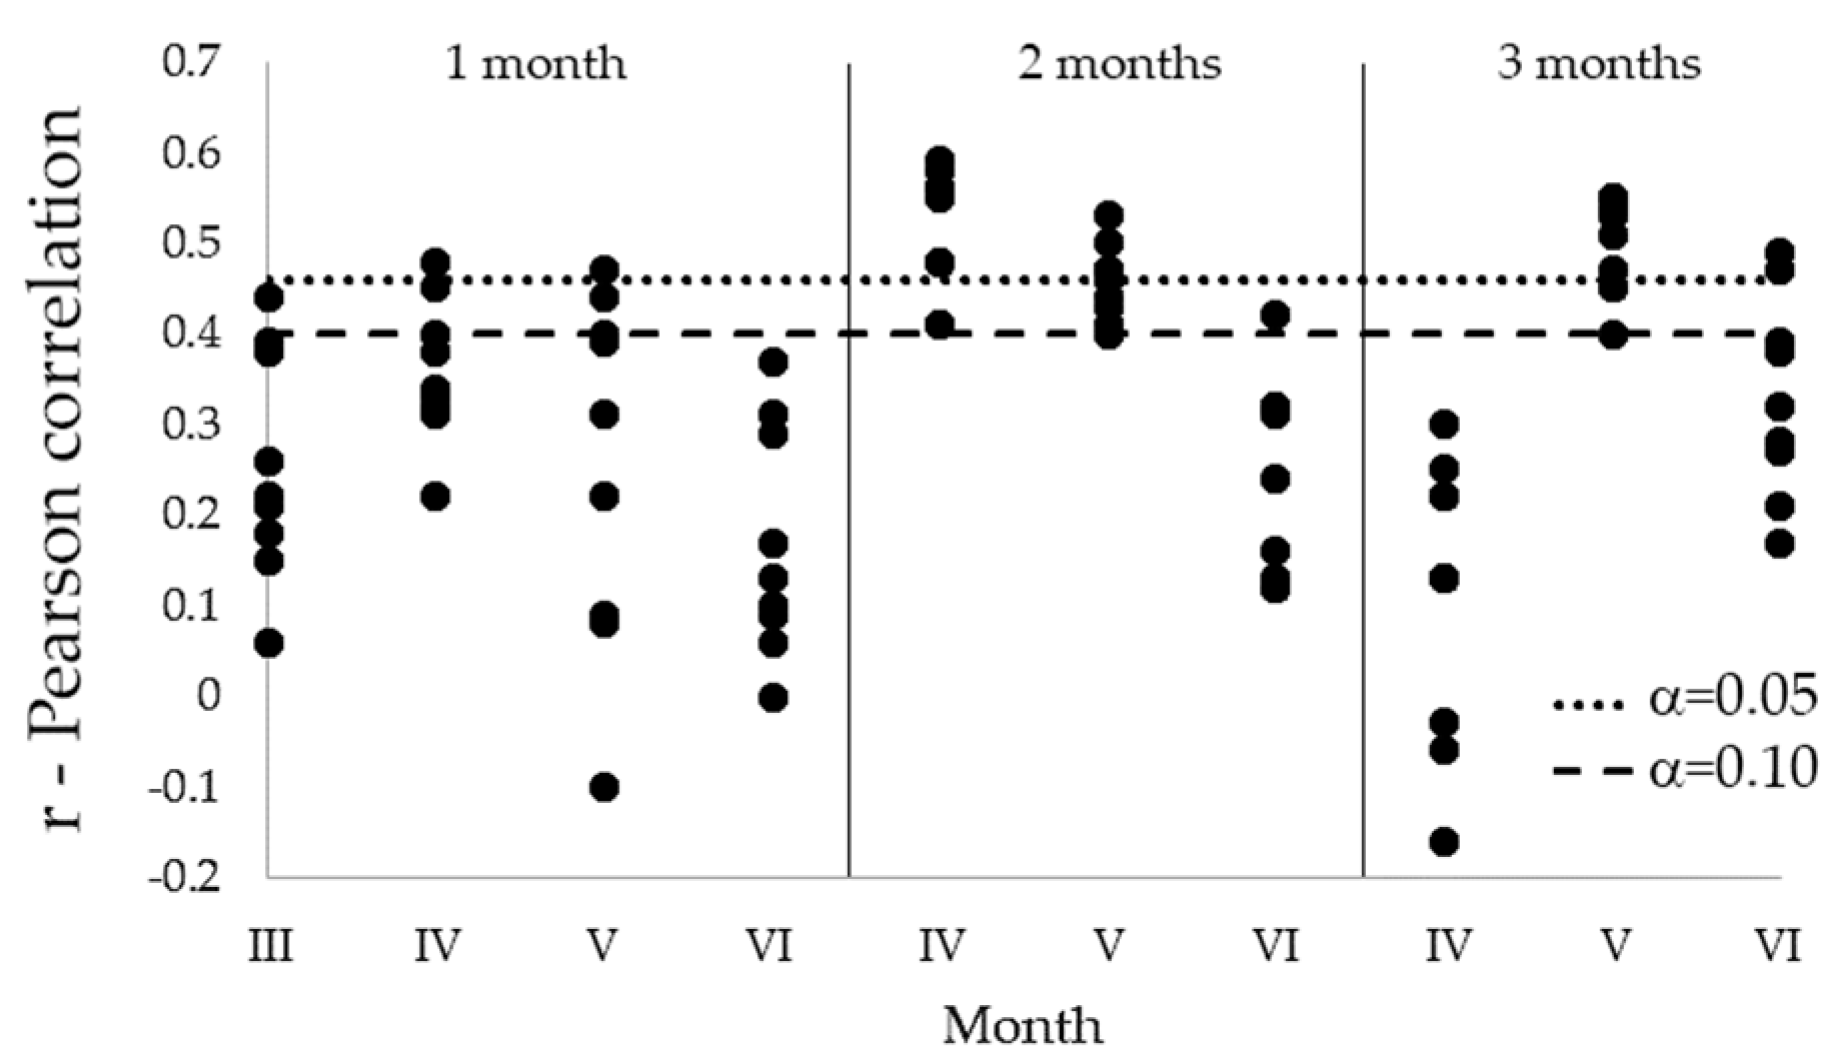
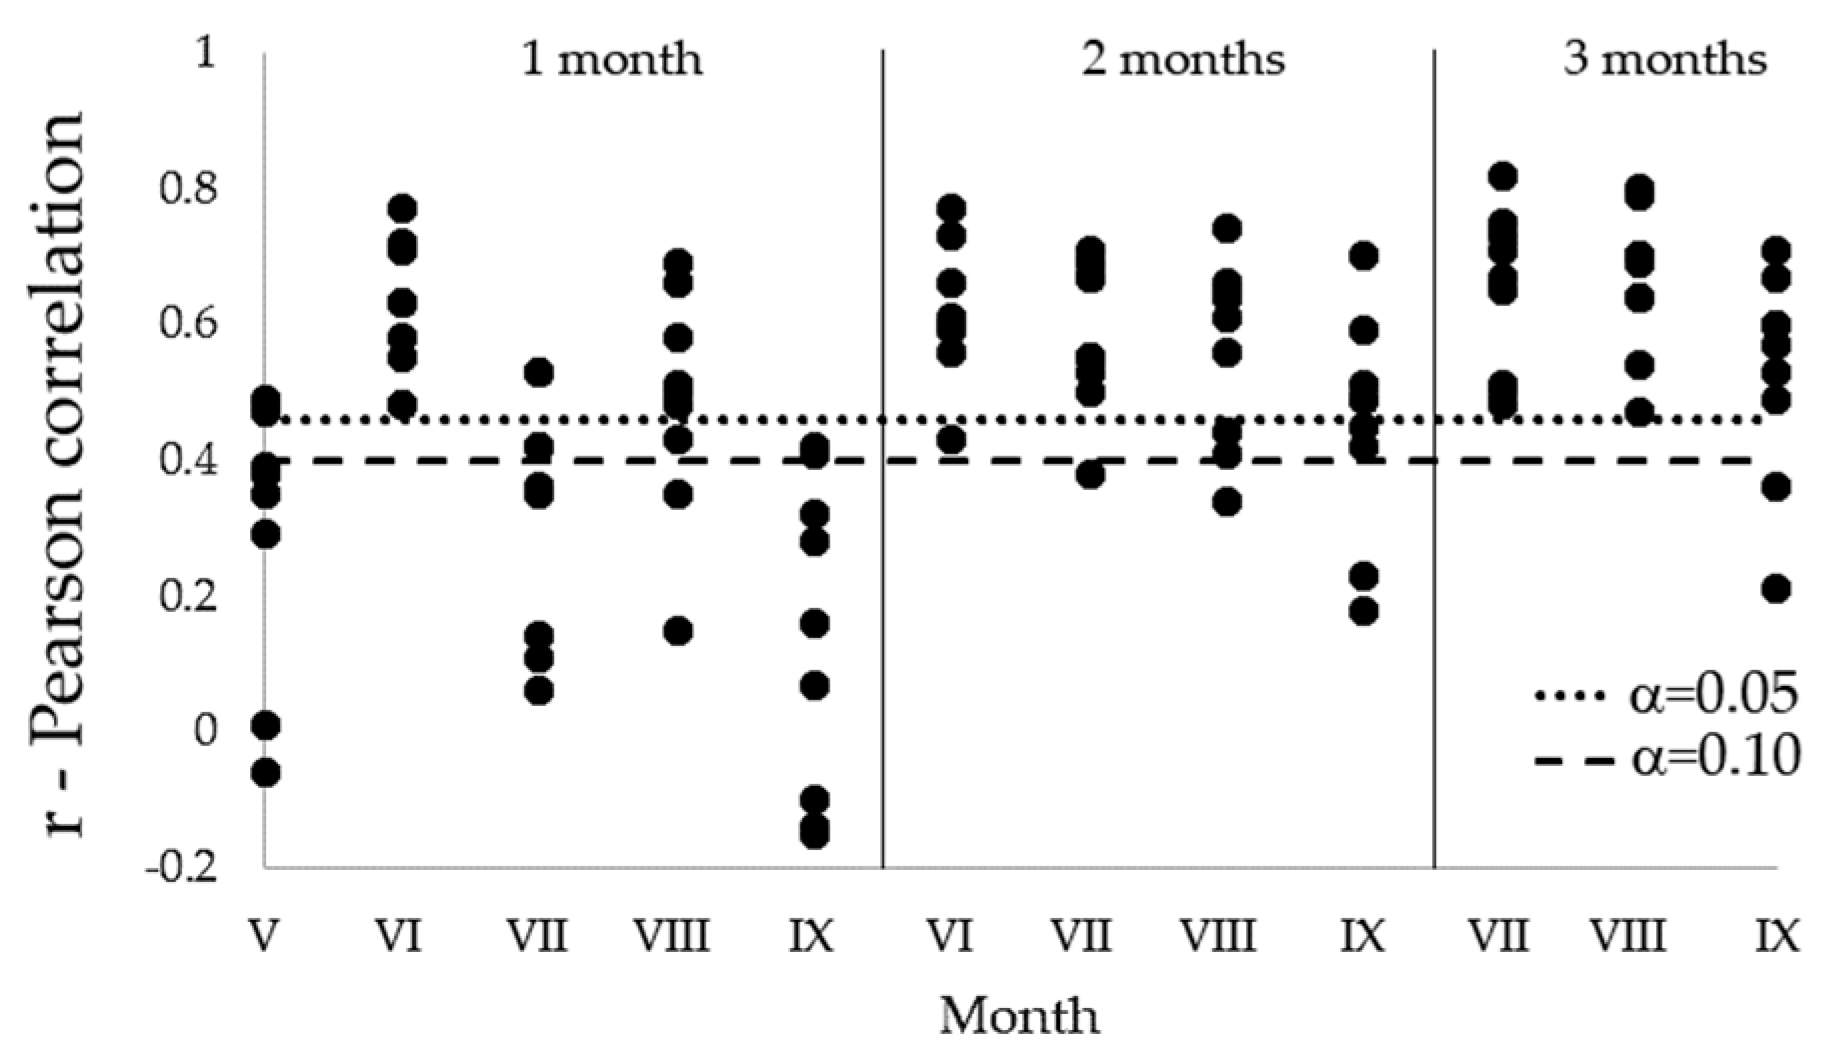
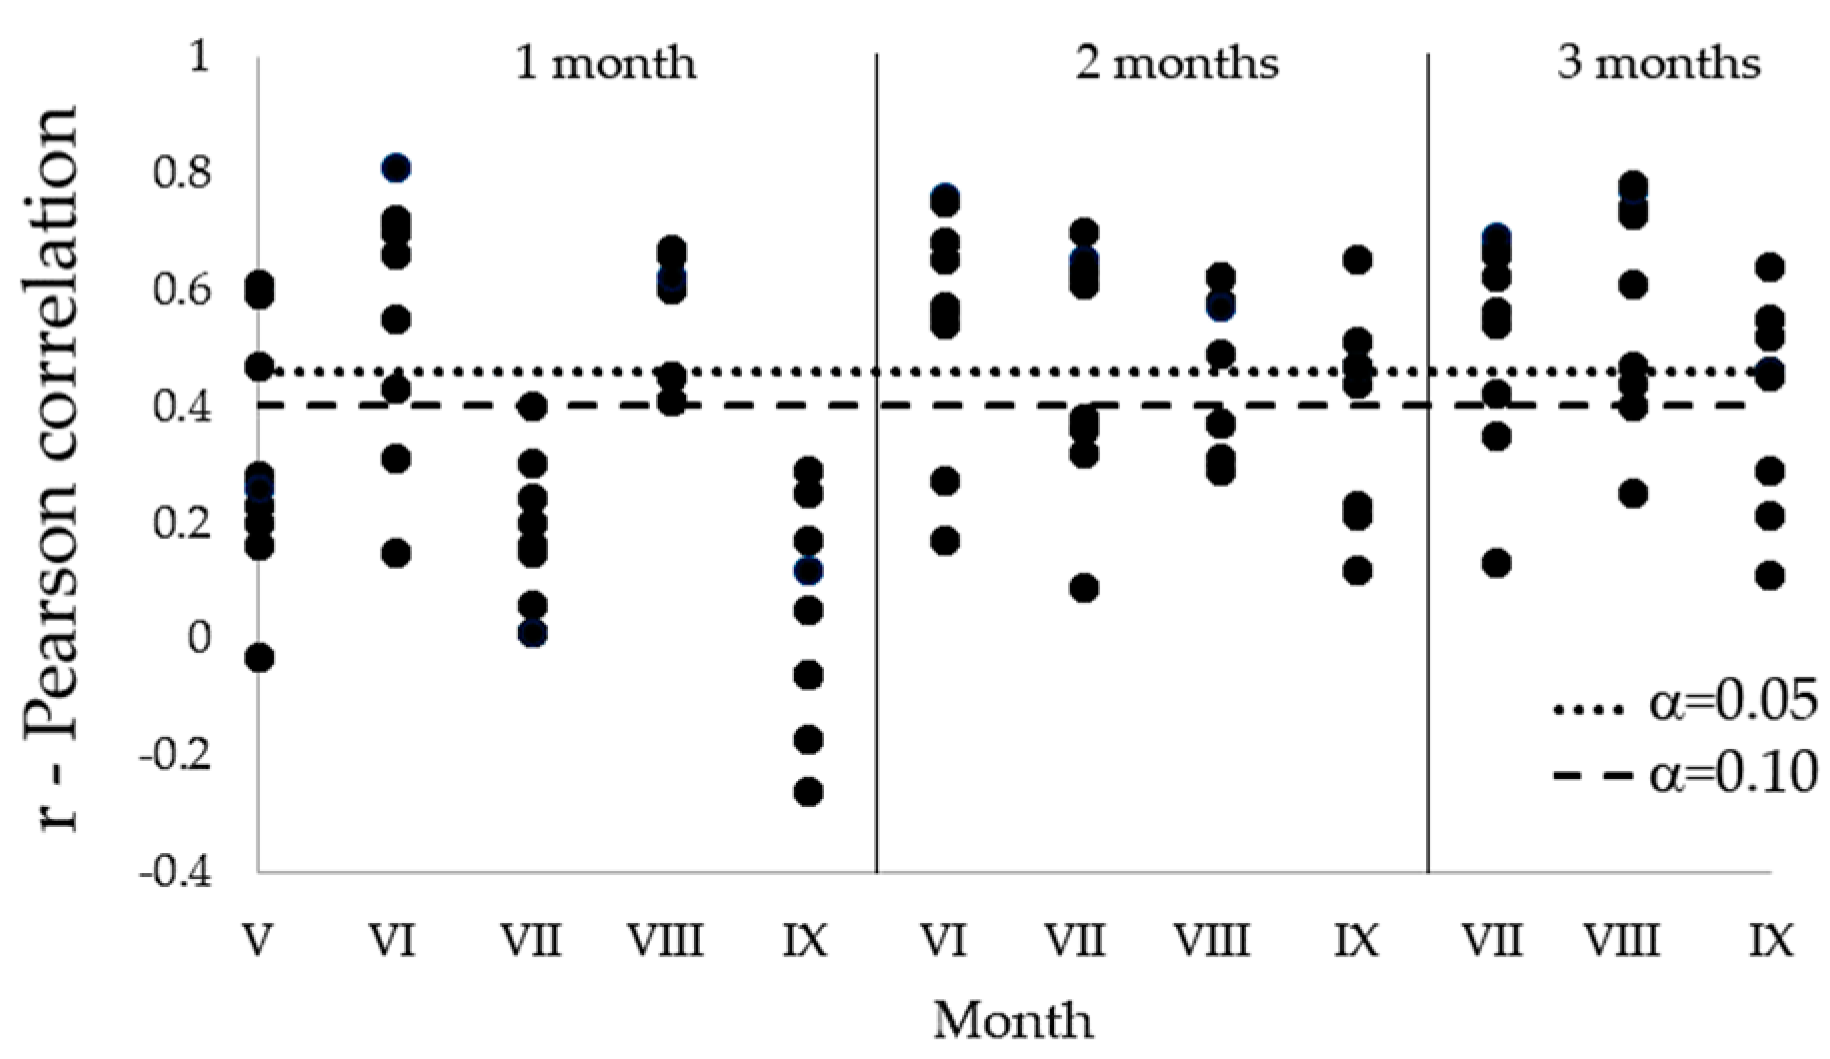
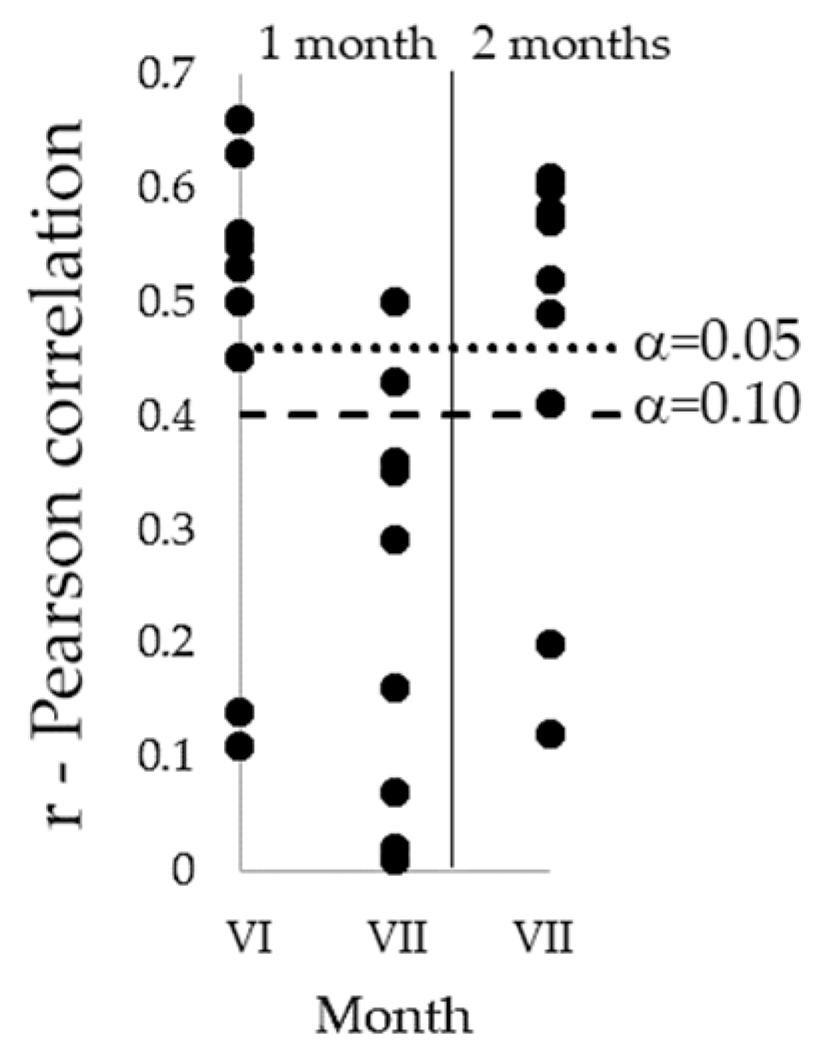
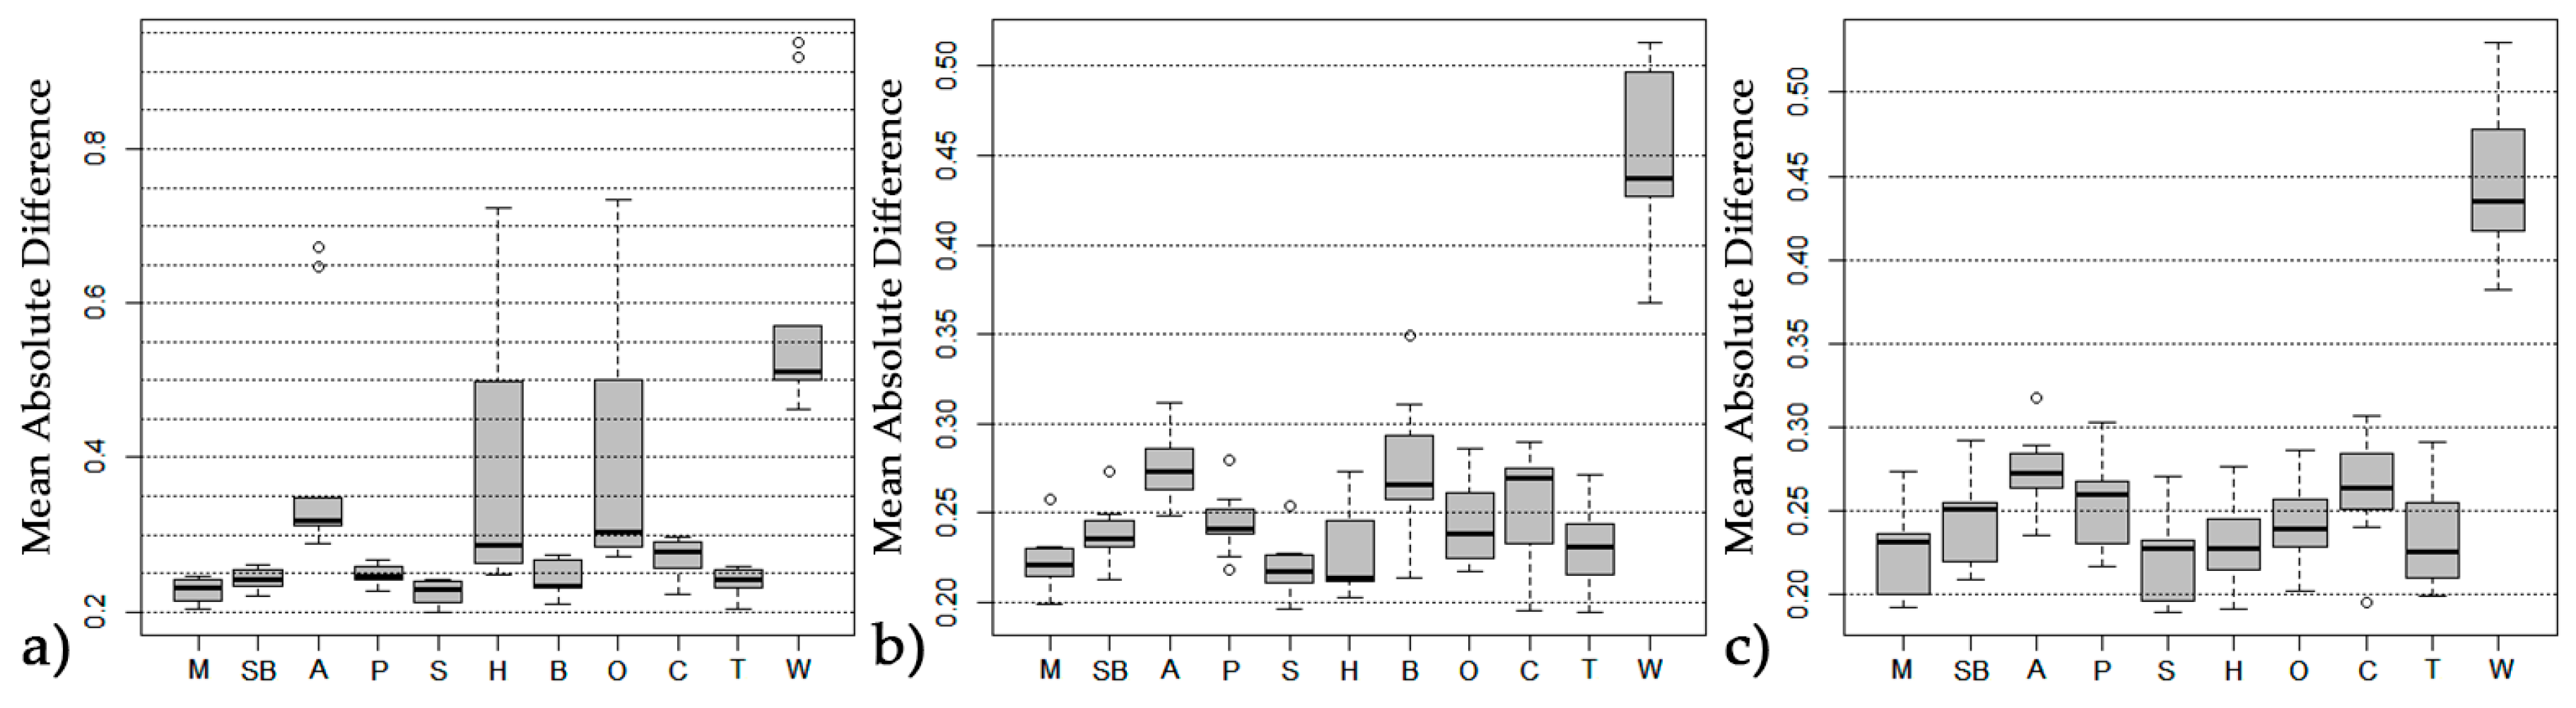
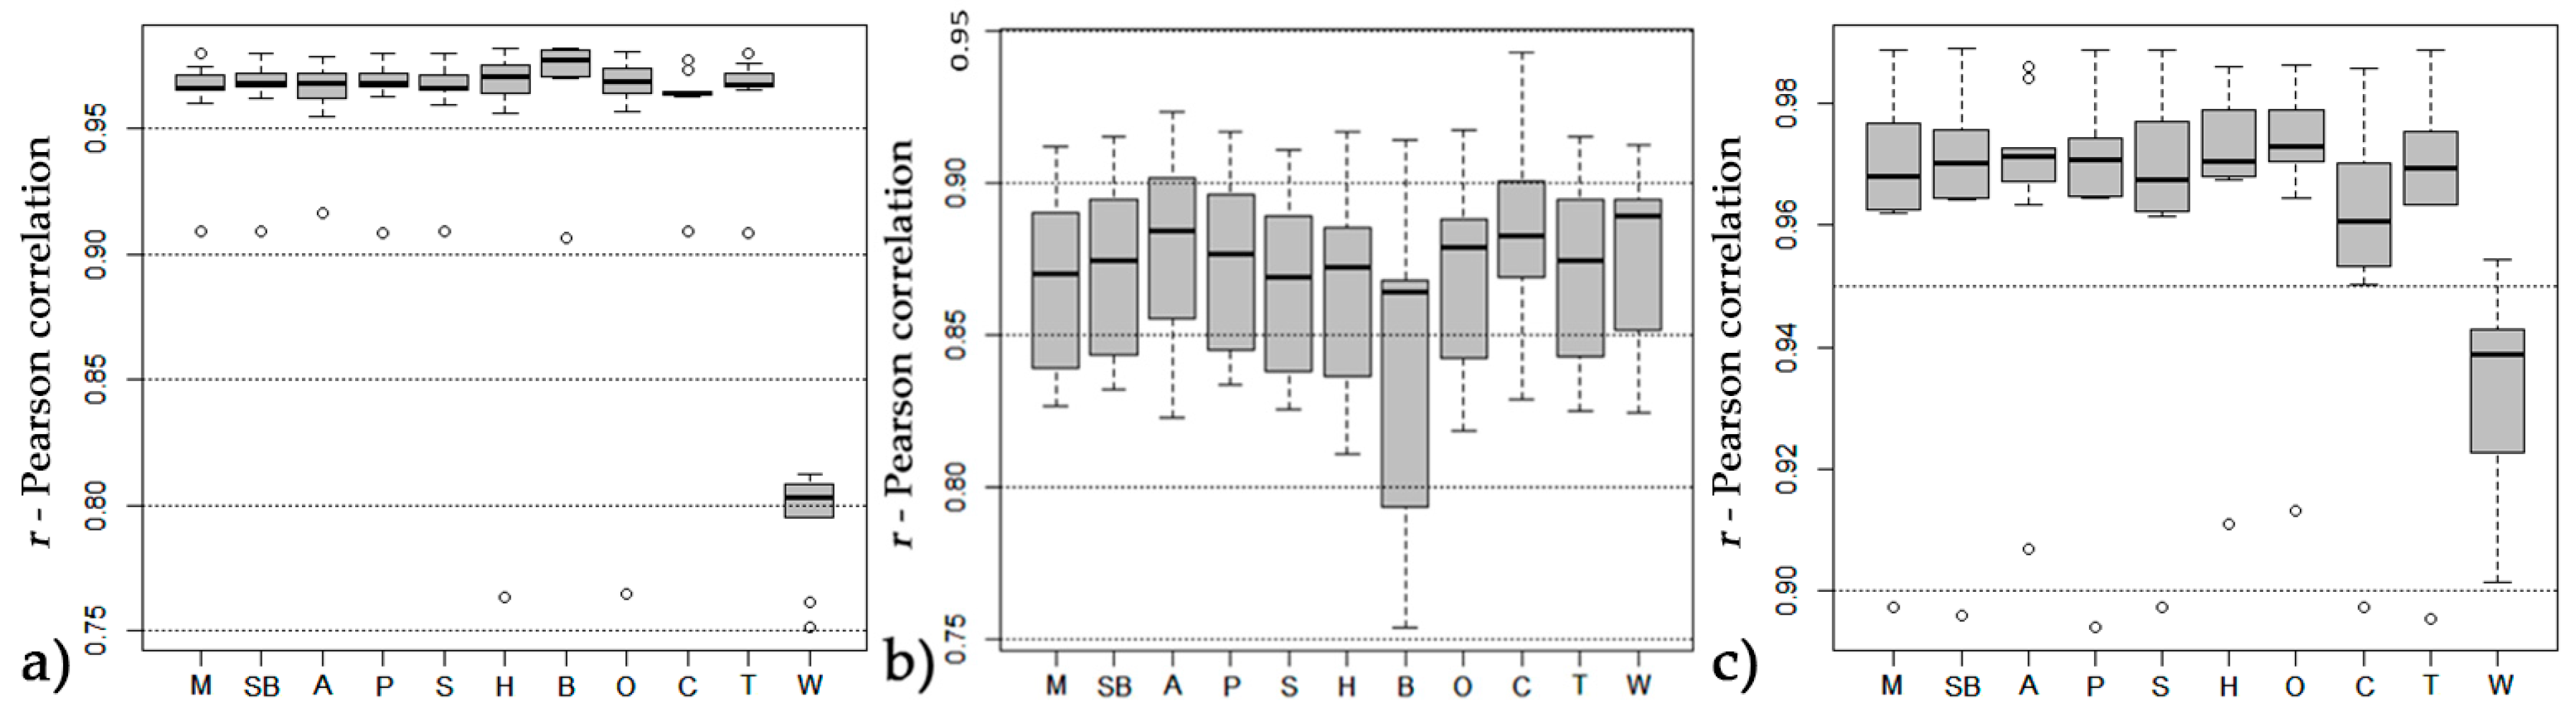
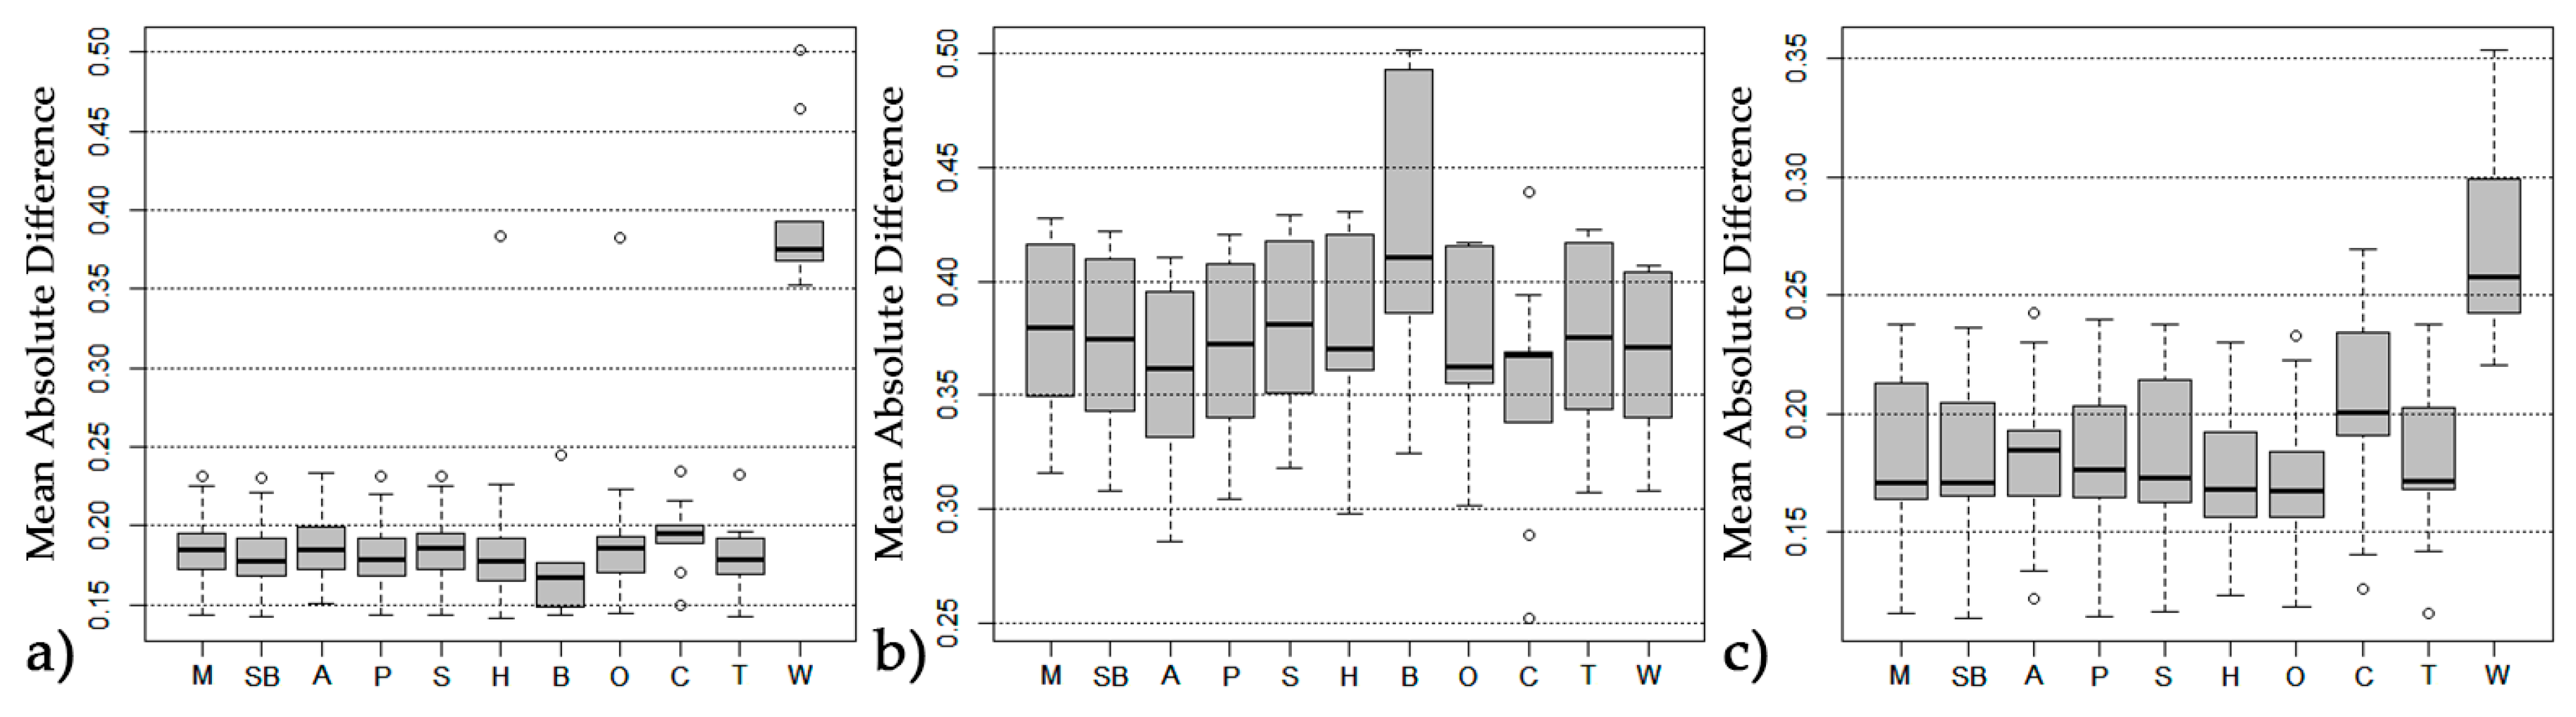
This paper presents the approach to agricultural drought monitoring based on the SPEI (ADM-SPEI) that combines well-known methods and experts’ critical opinions ensured by their knowledge and experience, while taking into account the local agro-climatic specificities. The widely used and accepted SPEI has been related to the particular crops by replacing ET0 with ETc, thereby enabling the analyses of the drought conditions for each crop separately. The proposed ADM-SPEI approach was described in three phases and the constitutive steps. The detailed description of the methodological basis allows for its application in any other region. It can be adapted to different agro-climatic conditions and applied in the particular area of interest. The ADM-SPEI approach has been applied in the Vojvodina region and analyzed in detail. The application of this approach has resulted in obtaining the modified SPEI for different crops (AD-SPEIcrop) in the Vojvodina region. The AD-SPEIcrop index reflects the local agro-climatic conditions, and it is simple and convenient to use. In order to validate the proposed ADM-SPEI approach and the obtained AD-SPEIcrop, the following analysis was carried out: The correlation between the AD-SPEIcrop and the yields of the 11 significant crops in the region (both at the local-county level and at the level of the entire Vojvodina region); the comparison of the AD-SPEIcrop and the SPEI, respectively, with the crop yields in order to test and compare their performances; and finally, the comparison of the AD-SPEIcrop to the well-known and globally accepted drought indices (SPI, SPEI, and SC-PDSI).
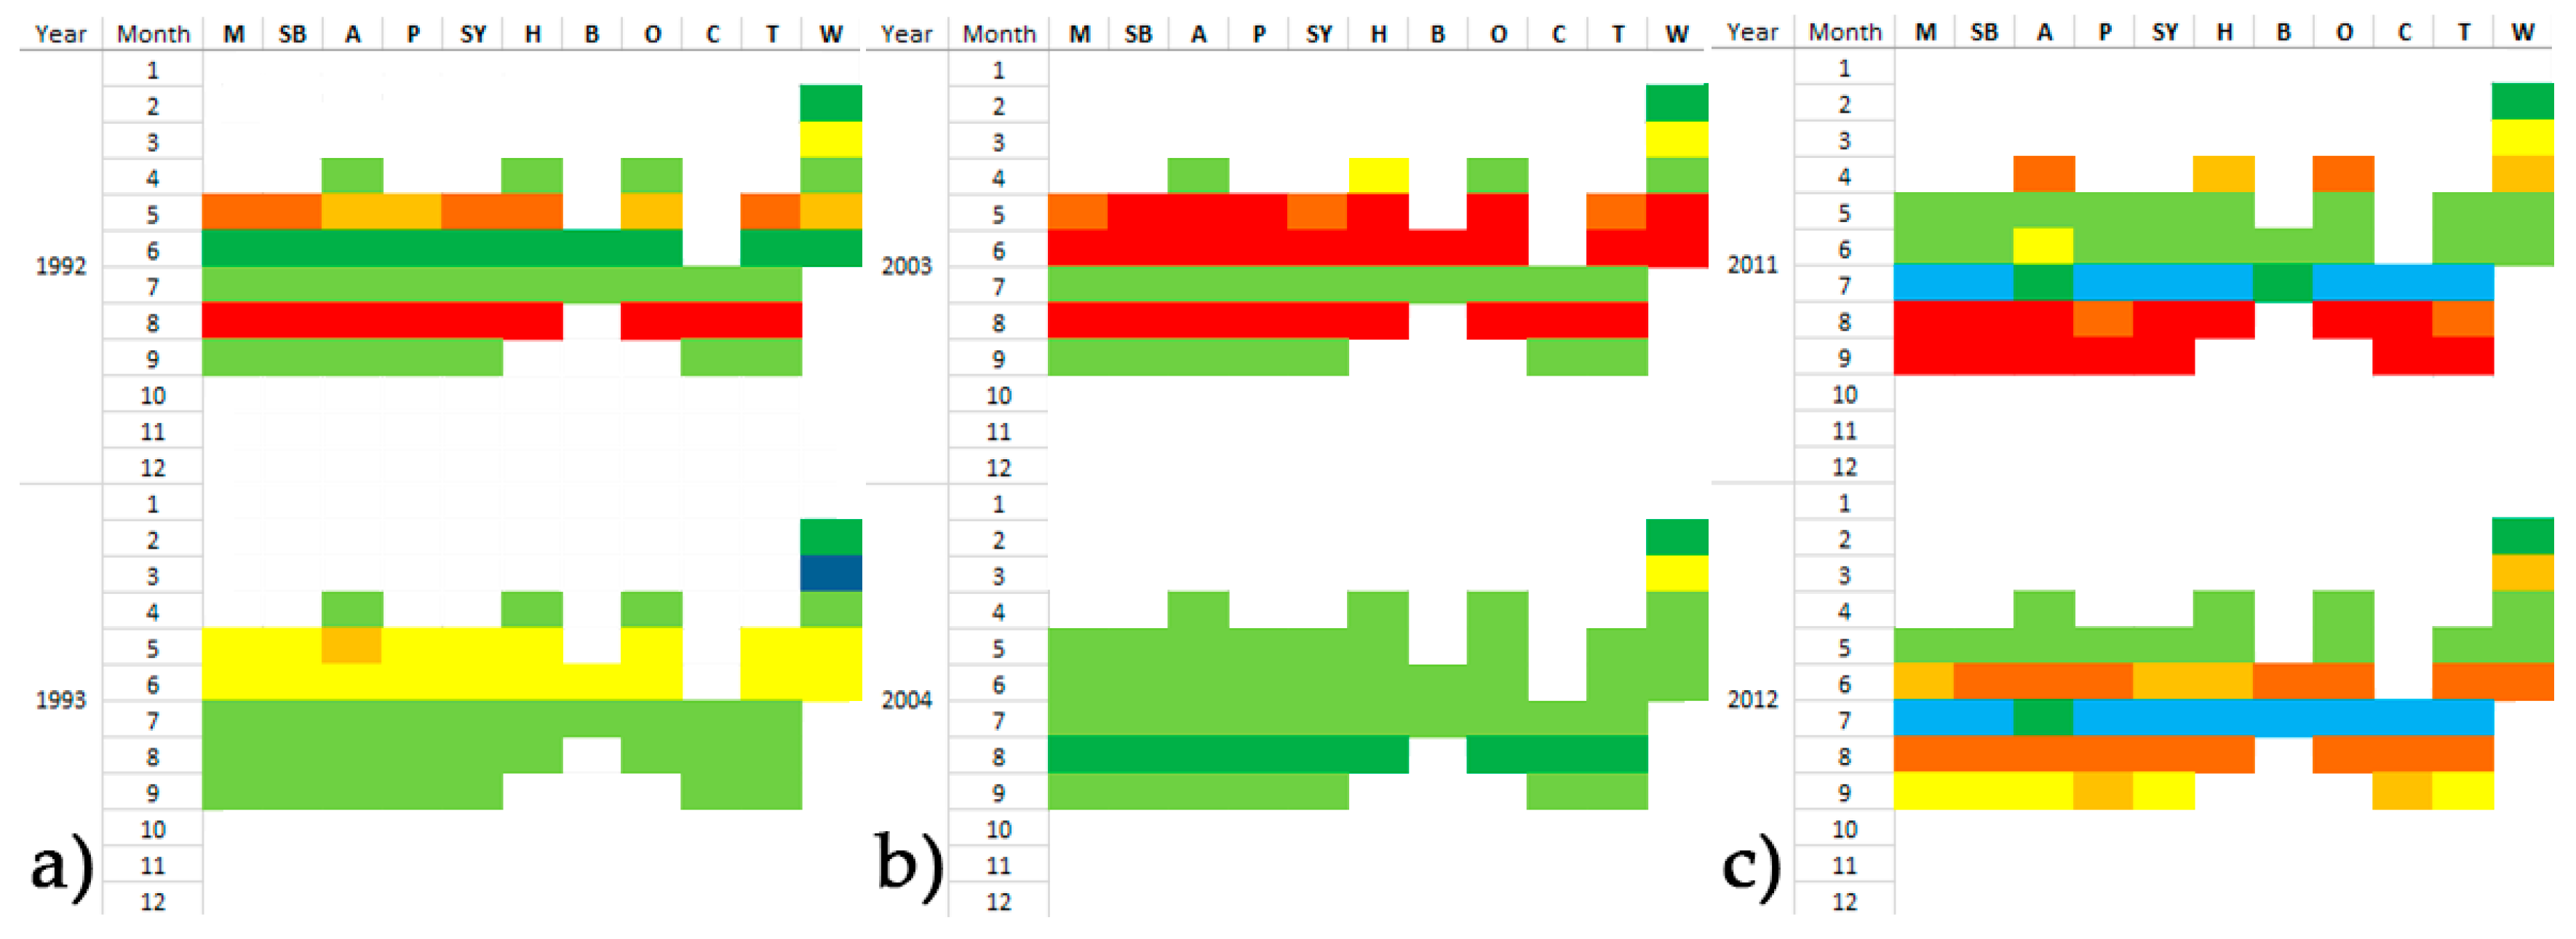
According to the obtained results, there is a significant link between the occurrence of drought detected by the AD-SPEIcrop and the observed crop yields. Also, in comparison to the original SPEI index, a higher degree of agreement was reached between the AD-SPEIcrop and the yields of the observed crops. The comparison of the AD-SPEIcrop with the well-known drought indices (SPI, SPEI, and SC-PDSI) has shown that, like the previously mentioned indices, the AD-SPEIcrop index can successfully detect dry and wet periods. Since it is based on the water balance of agricultural crops, the index is more adequate for the characterization of agricultural drought. In addition to the statistical and calculation procedures, the proposed approach to agricultural drought monitoring includes experts’ feedback on the performance of the AD-SPEIcrop based on their knowledge and experience in the specific area. Taking into account the results in the validation phase, it can be concluded that the proposed approach to the monitoring of agricultural drought based on the SPEI index can be successfully applied. The results have also indicated that the AD-SPEIcrop obtained by its application has shown a good performance in agricultural drought monitoring. In order to illustrate the flexibility of the proposed ADM-SPEI approach, some of the possible ways of presenting and interpreting the obtained results of the application of the AD-SPEIcrop are shown in this paper.
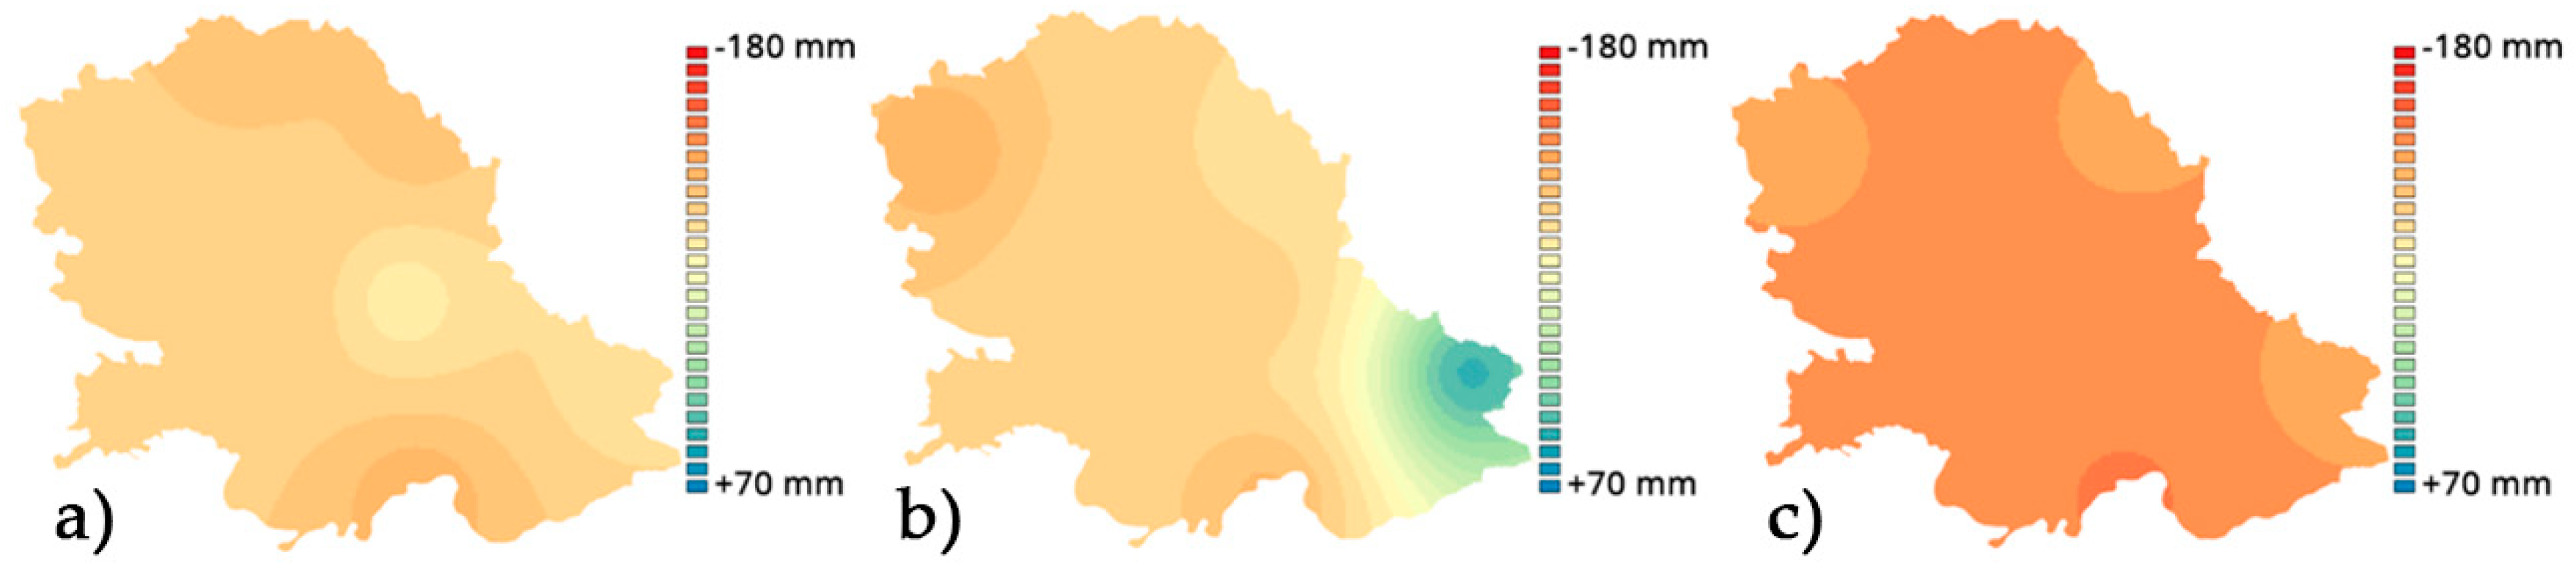
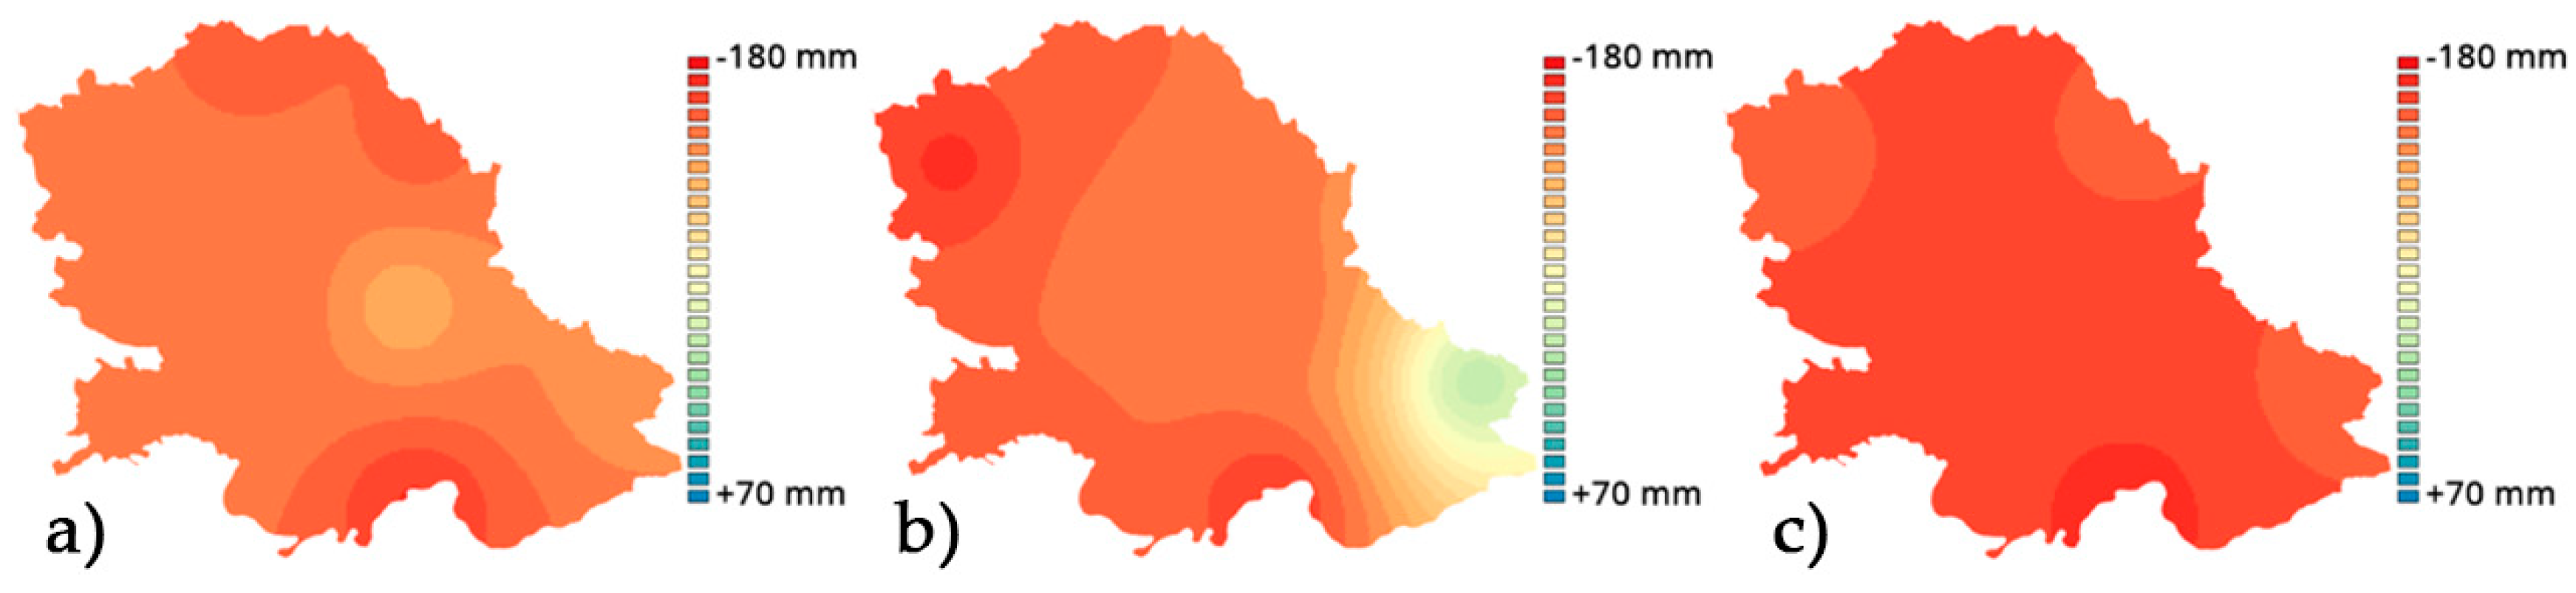
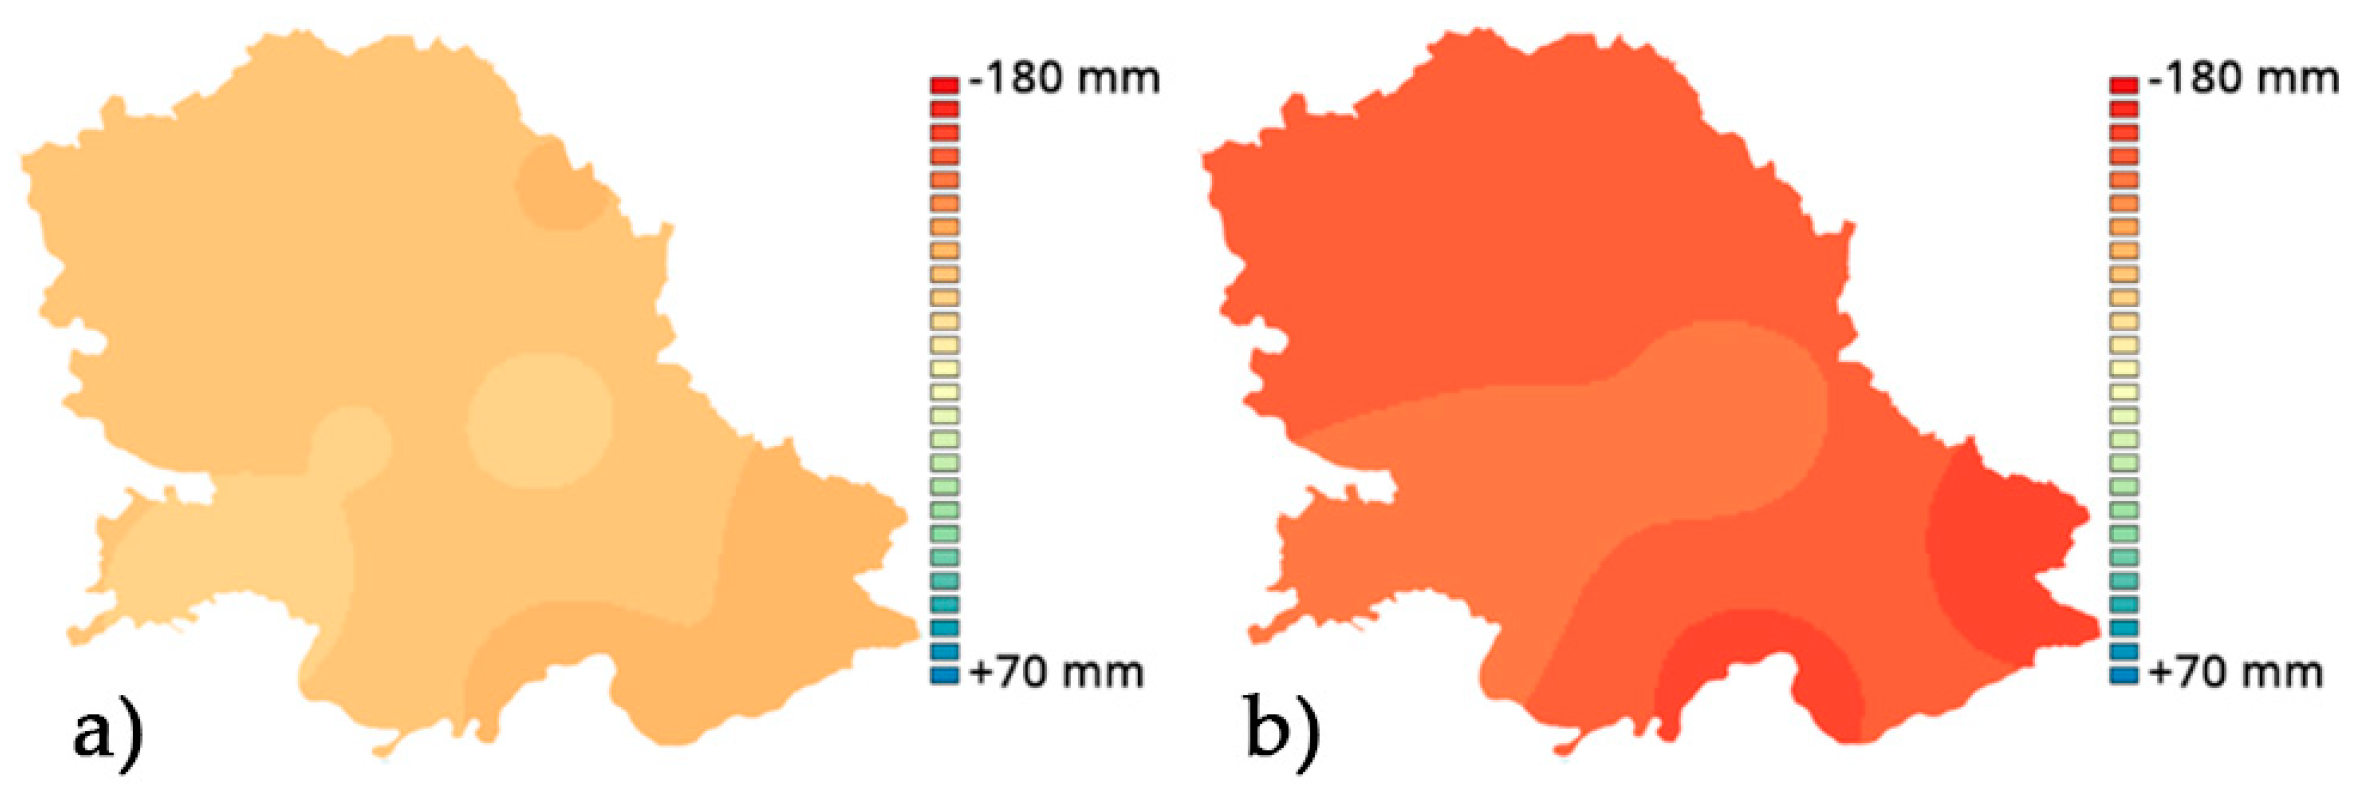
In contrast to the original SPEI index, the proposed approach allows a direct transformation of the AD-SPEIcrop back into the values of the crop specific climatic water balance. The index, thus, reflects the crop water requirements. Therefore, it can be used in water resources planning and management in agriculture. The examination of drought from that perspective allows for analyzing the capability of the irrigation systems to protect crops from drought events. Practical applications of the AD-SPEIcrop can include determining the required properties of irrigation systems in order to prevent negative effects of drought. Likewise, it could be applied to the analysis of the capabilities of existing irrigation systems to cope with drought. It means that the proposed AD-SPEIcrop can be used to estimate whether the existing irrigation system could successfully protect the particular crop from certain degrees of drought severity.
The information that can be obtained using the proposed ADM-SPEI approach based on local specific agro-climatic data and experts’ assessment can be valuable for decision makers at the national and regional levels, experts in various fields, agricultural producers, different agricultural and commercial companies, insurance companies, etc. Also, a practical advantage of this approach is reflected in the fact that its results can be useful in the field of agricultural water management and planning of drought mitigation and adaptation strategies.

Author Contributions

Conceptualization, J.B.; methodology, J.B.; formal analysis, J.B. and A.B.; investigation, J.B. and A.B.; data curation, J.B., A.B., B.P., B.B., M.V., M.M., and D.P.; writing—original draft preparation, J.B.; visualization, J.B. and A.B.; supervision regarding multicriteria analysis, B.B.; supervision regarding drought analysis, A.B., M.M., and D.P.; supervision regarding evapotranspiration and irrigation, A.B., B.P., and M.V.; supervision regarding statistical analysis, E.N.-Đ.

Funding

This research received no external funding.

Acknowledgments

This research represents a result of the research activity carried out within the project: Interreg-IPA CBC Hungary-Serbia (HUSRB/1602/11/0057): WATERatRISK—Improvement of drought and excess water monitoring for supporting water management and mitigation of risks related to extreme weather conditions, co-financed by the European Union (IPA).

Conflicts of Interest

The authors declare no conflict of Interest.

References

  1. Wilhite, D.A.; Svoboda, M.D. Drought early warning systems in the context of drought preparedness and mitigation. In Early Warning Systems for Drought Preparedness and Drought Management, Proceedings of the Expert Group Meeting, Lisbon, Portugal, 5–7 September 2000; World Meteorological Organization: Geneva, Switzerland, 2000. [Google Scholar]
  2. Mishra, A.K.; Desai, V.R. Spatial and temporal drought analysis in the kansabati river basin, india. Int. J. River Basin Manag. 2005, 3, 31–41. [Google Scholar] [CrossRef]
  3. Wilhite, D.A.; Hayes, J.M.; Knutson, L.C.; Hayes, M.; Knutson, C. Drought Preparedness Planning: Building Institutional Capacity. In Drought and Water Crises: Science, Technology, and Managment Issues, 1st ed.; CRC Press: Boca Raton, FL, USA, 2005; pp. 93–135. [Google Scholar]
  4. Svoboda, M.; Fuchs, B. Handbook of Drought Indicators and Indices; World Meteorological Organization (WMO): Geneva, Switzerland; Global Water Partnership (GWP): Geneva, Switzerland, 2016; pp. 1–45. [Google Scholar]
  5. Lloyd-Hughes, B. The impracticality of a universal drought definition. Theor. Appl. Climatol. 2014, 117, 607–611. [Google Scholar] [CrossRef]
  6. Tian, L.; Yuan, S.; Quiring, S.M. Evaluation of six indices for monitoring agricultural drought in the south-central United States. Agric. For. Meteorol. 2018, 249, 107–119. [Google Scholar] [CrossRef]
  7. Quiring, S.M. Monitoring Drought: An Evaluation of Meteorological Drought Indices. Geogr. Compass 2009, 3, 64–88. [Google Scholar] [CrossRef]
  8. Mishra, A.K.; Singh, V.P. A review of drought concepts. J. Hydrol. 2010, 391, 202–216. [Google Scholar] [CrossRef]
  9. Vicente-Serrano, S.M.; Beguería, S.; López-Moreno, J.I. A Multiscalar Drought Index Sensitive to Global Warming: The Standardized Precipitation Evapotranspiration Index. J. Clim. 2010, 23, 1696–1718. [Google Scholar] [CrossRef] [Green Version]
  10. Beguería, S.; Vicente-Serrano, S.M.; Reig, F.; Latorre, B. Standardized precipitation evapotranspiration index (SPEI) revisited: Parameter fitting, evapotranspiration models, tools, datasets and drought monitoring. Int. J. Climatol. 2014, 34, 3001–3023. [Google Scholar] [CrossRef]
  11. Mckee, T.B.; Doesken, N.; Kleist, J. The relationship of drought frequency and duration to time scales. In Proceedings of the Eighth Conference on Applied Climatology, Anaheim, CA, USA, 17–22 January 1993; pp. 179–184. [Google Scholar]
  12. Spinoni, J.; Naumann, G.; Vogt, J.V.; Barbosa, P. The biggest drought events in Europe from 1950 to 2012. J. Hydrol. Reg. Stud. 2015, 3, 509–524. [Google Scholar] [CrossRef]
  13. Zhang, Q.; Qi, T.; Singh, V.P.; Chen, Y.D.; Xiao, M. Regional Frequency Analysis of Droughts in China: A Multivariate Perspective. Water Resour. Manag. 2015, 29, 1767–1787. [Google Scholar] [CrossRef]
  14. Moorhead, J.E.; Gowda, P.H.; Singh, V.P.; Porter, D.O.; Marek, T.H.; Howell, T.A.; Stewart, B. Identifying and Evaluating a Suitable Index for Agricultural Drought Monitoring in the Texas High Plains. JAWRA J. Am. Water Resour. Assoc. 2015, 51, 807–820. [Google Scholar] [CrossRef] [Green Version]
  15. Liu, X.; Zhu, X.; Pan, Y.; Li, S.; Liu, Y.; Ma, Y. Agricultural drought monitoring: Progress, challenges, and prospects. J. Geogr. Sci. 2016, 26, 750–767. [Google Scholar] [CrossRef] [Green Version]
  16. Vicente-Serrano, S.M.; Beguería, S.; Lorenzo-Lacruz, J.; Camarero, J.J.; López-Moreno, J.I.; Azorin-Molina, C.; Revuelto, J.; Morán-Tejeda, E.; Sanchez-Lorenzo, A. Performance of Drought Indices for Ecological, Agricultural, and Hydrological Applications. Earth Interact. 2012, 16, 1–27. [Google Scholar] [CrossRef] [Green Version]
  17. Palmer, W.C. Meteorological Drought, Research Paper No. 45; U.S. Weather Bureau: Washington, DC, USA, 1965; pp. 1–58.
  18. Bachmair, S.; Tanguy, M.; Hannaford, J.; Stahl, K. How well do meteorological indicators represent agricultural and forest drought across Europe? Environ. Res. Lett. 2018, 13, 034042. [Google Scholar] [CrossRef]
  19. Wells, N.; Goddard, S.; Hayes, M.J. A Self-Calibrating Palmer Drought Severity Index. J. Clim. 2004, 17, 2335–2351. [Google Scholar] [CrossRef]
  20. Wang, H.; Vicente-serrano, S.M.; Tao, F.; Zhang, X.; Wang, P.; Zhang, C.; Chen, Y.; Zhu, D.; Kenawy, A.E. Monitoring winter wheat drought threat in Northern China using multiple climate-based drought indices and soil moisture during 2000–2013. Agric. For. Meteorol. 2016, 228, 1–12. [Google Scholar] [CrossRef]
  21. Bachmair, S.; Tanguy, M.; Hannaford, J.; Stahl, K. How useful are meteorological drought indicators to assess agricultural drought impacts across Europe? In Proceedings of the Geophysical Research Abstracts, EGU General Assembly 2016, Vienna, Austria, 17–22 April, 2016; p. 8085. [Google Scholar]
  22. Bezdan, A.; Bezdan, J. Comparison of the performance of SPI, STI and SPEI for agricultural drought monitoring in Vojvodina region. In Proceedings of the Geophysical Research Abstracts, EGU General Assembly 2019, Vienna, Austria, 7–12 April 2019; p. 8516. [Google Scholar]
  23. Zscheischler, J.; Michalak, A.M.; Schwalm, C.; Mahecha, M.D.; Huntzinger, D.N.; Reichstein, M.; Berthier, G.; Ciais, P.; Cook, R.B.; El-Masri, B.; et al. Impact of large-scale climate extremes on biospheric carbon fluxes: An intercomparison based on MsTMIP data. Glob. Biogeochem. Cycles 2014, 28, 585–600. [Google Scholar] [CrossRef]
  24. Thornthwaite, C.W. An Approach toward a Rational Classification of Climate. Geogr. Rev. 1948, 38, 55. [Google Scholar] [CrossRef]
  25. Allen, R.G.; Pereira, L.S.; Raes, D.; Smith, M. Crop Evapotranspiration: Guidelines for Computing Crop Requirements, FAO Irrigation and Drainage Paper No. 56; FAO: Rome, Italy, 1998; pp. 1–300. [Google Scholar]
  26. Hargreaves, G.H.; Samani, Z.A. Reference Crop Evapotranspiration from Temperature. Appl. Eng. Agric. 1985, 1, 96–99. [Google Scholar] [CrossRef]
  27. Potop, V.; Možný, M. Examination of the effect of evapotranspiration as an output parameter in SPEI drought index in Central Bohemian region. In Proceedings of the Bioclimate: Source and Limit of Social Development, International Scientific Conference, Topoľčianky, Slovakia, 6–9 September 2011; pp. 1–3. [Google Scholar]
  28. Stagge, J.H.; Tallaksen, L.M.; Xu, C.-Y.; Van Lanen, H.A.J. Standardized precipitation-evapotranspiration index (SPEI): Sensitivity to potential evapotranspiration model and parameters. In Hydrology in a Changing World: Environmental and Human Dimensions, Proceedings of the FRIEND-Water 2014, Montpellier, France, 7–10 October 2014; IAHS Publ: Montpellier, France, 2014; pp. 367–374. [Google Scholar]
  29. Zhang, B.; Wang, Z.; Chen, G. A Sensitivity Study of Applying a Two-Source Potential Evapotranspiration Model in the Standardized Precipitation Evapotranspiration Index for Drought Monitoring. L. Degrad. Dev. 2017, 28, 783–793. [Google Scholar] [CrossRef]
  30. Shuttleworth, W.J.; Wallace, J. Evaporation from sparse crops-an energy combination theory. Q. J. R. Meteorol. Soc. 1985, 111, 839–855. [Google Scholar] [CrossRef]
  31. Chen, H.; Sun, J. Changes in Drought Characteristics over China Using the Standardized Precipitation Evapotranspiration Index. J. Clim. 2015, 28, 5430–5447. [Google Scholar] [CrossRef]
  32. Potop, V.; Boroneanţ, C.; Možný, M.; Štěpánek, P.; Skalák, P. Observed spatiotemporal characteristics of drought on various time scales over the Czech Republic. Theor. Appl. Climatol. 2014, 115, 563–581. [Google Scholar] [CrossRef]
  33. Loepmeier, F.J. The calculation of soil moisture and evapotranspiration with agrometeorological models. Zeitschrift fuer Bewaesserungswirtschaft 1994, 29, 157–167. [Google Scholar]
  34. Draginčić, J.; Bezdan, A.; Pejić, B. Comparison of SPEI indices calculated using the different evapotranspiration equations. In Proceedings of the 7th International Symposium on Agricultural Sciences “AgroReS 2018”, Banja Luka, Bosnia and Herzegovina, 28 February–2 March 2018. [Google Scholar]
  35. Frank, A. Development of Methodology for Indicator Assessment in Aim to Improveforecast of Climatological Drought. Ph.D. Thesis, University of Novi Sad, Faculty of Technical Science, Novi Sad, Serbia, 2016. [Google Scholar]
  36. Frank, A.; Armenski, T.; Gocic, M.; Popov, S.; Popovic, L.; Trajkovic, S. Influence of mathematical and physical background of drought indices on their complementarity and drought recognition ability. Atmos. Res. 2017, 194, 268–280. [Google Scholar] [CrossRef]
  37. Moorhead, J.E.; Gowda, P.H.; Marek, T.H.; Porter, D.O.; Howell, T.A.; Singh, V.P.; Stewart, B.A. Use of crop-specific drought indices for determining irrigation demand in the Texas high plains. Appl. Eng. Agric. 2013, 29, 905–916. [Google Scholar]
  38. Moorhead, J.E. Crop-Specific Drought Indices for Groundwater Management in the Texas High Plains. Ph.D. Thesis, West Texas A&M University, Canyon, TX, USA, 2012. [Google Scholar]
  39. Pei, W.; Fu, Q.; Liu, D.; Li, T. A drought index for Rainfed agriculture: The Standardized Precipitation Crop Evapotranspiration Index (SPCEI). Hydrol. Process. 2019, 33, 803–815. [Google Scholar] [CrossRef]
  40. Shahidian, S.; Serralheiro, R.; Serrano, J.; Teixeira, J.; Haie, N.; Santos, F.L. Hargreaves and Other Reduced-Set Methods for Calculating Evapotranspiration. In Evapotranspiration-Remote Sensing and Modeling; IntechOpen: London, UK, 2012; pp. 59–80. [Google Scholar]
  41. Cruz-Blanco, M.; Lorite, I.; Santos, C. An innovative remote sensing based reference evapotranspiration method to support irrigation water management under semi-arid conditions. Agric. Water Manag. 2014, 131, 135–145. [Google Scholar] [CrossRef]
  42. Raupach, M.; Finnigan, J. ’Single-Layer Models of Evaporation From Plant Canopies Are Incorrect but Useful, Whereas Multilayer Models Are Correct but Useless’: Discuss. Funct. Plant Boil. 1988, 15, 705–716. [Google Scholar] [CrossRef]
  43. Fisher, J.B.; Whittaker, R.J.; Malhi, Y. ET come home: Potential evapotranspiration in geographical ecology. Glob. Ecol. Biogeogr. 2011, 20, 1–18. [Google Scholar] [CrossRef]
  44. Trajković, S. Metode Proračuna Potrebe za Vodom u Navodnjavanju; Univerzitet u Nišu, Građevinsko-Arhitektonski Fakultet: Niš, Srbija, 2009; pp. 1–100. [Google Scholar]
  45. Xystrakis, F.; Matzarakis, A. Evaluation of 13 Empirical Reference Potential Evapotranspiration Equations on the Island of Crete in Southern Greece. J. Irrig. Drain. Eng. 2010, 137, 211–222. [Google Scholar] [CrossRef]
  46. Saaty, T.L. The Analytical Hierarchy Process; McGraw-Hill: New York, NY, USA, 1980. [Google Scholar]
  47. Lalić, B.; Mihailović, D.; Podrascanin, Z.; Branislava, L.; Dragutin, M.T.; Zorica, P. Future state of climate in Vojvodina and expected effects on crop production. Ratar. i Povrt. 2011, 48, 403–418. [Google Scholar] [CrossRef]
  48. Hrnjak, I.; Lukić, T.; Gavrilov, M.B.; Marković, S.B.; Unkašević, M.; Tošić, I. Aridity in Vojvodina, Serbia. Theor. Appl. Climatol. 2014, 115, 323–332. [Google Scholar] [CrossRef]
  49. Mihailović, D.T.; Lalić, B.; Drešković, N.; Mimić, G.; Djurdjević, V.; Jančić, M. Climate change effects on crop yields in Serbia and related shifts of Köppen climate zones under the SRES-A1B and SRES-A2. Int. J. Climatol. 2015, 35, 3320–3334. [Google Scholar] [CrossRef]
  50. Bezdan, A. Water Excess and Water Deficit Risk Assessment in Landreclamation Area. Ph.D. Thesis, University of Novi Sad, Faculty of Agriculture, Novi Sad, Serbia, 2014. [Google Scholar]
  51. Potopová, V.; Štěpánek, P.; Možný, M.; Türkott, L.; Soukup, J. Performance of the standardised precipitation evapotranspiration index at various lags for agricultural drought risk assessment in the Czech Republic. Agric. For. Meteorol. 2015, 202, 26–38. [Google Scholar] [CrossRef]
  52. Sun, L.; Mitchell, S.W.; Davidson, A. Multiple drought indices for agricultural drought risk assessment on the Canadian prairies. Int. J. Climatol. 2012, 32, 1628–1639. [Google Scholar] [CrossRef]
  53. Wu, H.; Hubbard, K.G.; Wilhite, D.A. An agricultural drought risk-assessment model for corn and soybeans. Int. J. Clim. 2004, 24, 723–741. [Google Scholar] [CrossRef] [Green Version]
  54. Yuen, K.K.F. Analytic hierarchy prioritization process in the AHP application development: A prioritization operator selection approach. Appl. Soft Comput. J. 2010, 10, 975–989. [Google Scholar] [CrossRef]
  55. Gao, S.; Zhang, Z.; Cao, C. Calculating Weights Methods in Complete Matrices and Incomplete Matrices. J. Softw. 2010, 5, 304–311. [Google Scholar] [CrossRef]
  56. Srdjevic, B. Combining different prioritization methods in the analytic hierarchy process synthesis. Comput. Oper. Res. 2005, 32, 1897–1919. [Google Scholar] [CrossRef]
  57. Blagojevic, B.; Srdjevic, Z.; Bezdan, A.; Srdjevic, B. Group decision-making in land evaluation for irrigation: A case study from Serbia. J. Hydroinf. 2016, 18, 579–598. [Google Scholar] [CrossRef]
  58. Harker, P. Incomplete pairwise comparisons in the analytic hierarchy process. Math. Model. 1987, 9, 837–848. [Google Scholar] [CrossRef] [Green Version]
  59. Ishizaka, A.; Labib, A. Review of the main developments in the analytic hierarchy process. Expert Syst. Appl. 2011, 38, 14336–14354. [Google Scholar] [CrossRef]
  60. Ramanathan, R.; Ganesh, L. Group preference aggregation methods employed in AHP: An evaluation and an intrinsic process for deriving members’ weightages. Eur. J. Oper. Res. 1994, 79, 249–265. [Google Scholar] [CrossRef]
  61. Forman, E.; Peniwati, K. Aggregating individual judgments and priorities with the analytic hierarchy process. Eur. J. Oper. Res. 1998, 108, 165–169. [Google Scholar] [CrossRef]
  62. Condon, E.; Golden, B.; Wasil, E. Visualizing group decisions in the analytic hierarchy process. Comput. Oper. Res. 2003, 30, 1435–1445. [Google Scholar] [CrossRef]
  63. Brouwer, C.; Heibloem, M. Irrigation Water Management: Irrigation Water Needs, Training Manual No. 3; FAO: Rome, Italy, 1986. [Google Scholar]
  64. Heo, J.-H.; Shin, H.; Nam, W.; Om, J.; Jeong, C. Approximation of modified Anderson–Darling test statistics for extreme value distributions with unknown shape parameter. J. Hydrol. 2013, 499, 41–49. [Google Scholar] [CrossRef]
  65. Stagge, J.H.; Tallaksen, L.M.; Gudmundsson, L.; Van Loon, A.F.; Stahl, K. Candidate Distributions for Climatological Drought Indices (SPI and SPEI). Int. J. Clim. 2015, 35, 4027–4040. [Google Scholar] [CrossRef]
  66. Vicente-Serrano, S.M.; Beguería, S. Comment on “Candidate distributions for climatological drought indices (SPI and SPEI)” by James H. Stagge et al. Int. J. Climatol. 2016, 36, 2120–2131. [Google Scholar] [CrossRef]
  67. Stagge, J.H.; Tallaksen, L.M.; Gudmundsson, L.; Van Loon, A.F.; Stahl, K. Response to comment on “Candidate Distributions for Climatological Drought Indices (SPI and SPEI). ” Int. J. Climatol. 2016, 36, 2132–2138. [Google Scholar] [CrossRef]
  68. Hosking, J.R.M. L-Moments: Analysis and Estimation of Distributions Using Linear Combinations of Order Statistics. J. R. Stat. Soc. Ser. B 1990, 52, 105–124. [Google Scholar] [CrossRef]
  69. Stedinger, J.; Vogel, R.; Foufoula, G. Frequency analysis of extreme events. In Handbook of Hydrology; Maidment, D.R., Ed.; McGraw-Hill: New York, NY, USA, 1993. [Google Scholar]
  70. Hosking, J.R.M.; Wallis, J.R. A Comparison of Unbiased and Plotting-Position Estimators of L Moments. Water Resour. Res. 1995, 31, 2019–2025. [Google Scholar] [CrossRef]
  71. Anderson, T.W.; Darling, D.A. Asymptotic Theory of Certain “Goodness of Fit” Criteria Based on Stochastic Processes. Ann. Math. Stat. 1952, 23, 193–212. [Google Scholar] [CrossRef]
  72. Giles, D. A saddlepoint approximation to the distribution function of the Anderson-Darling test statistic. Commun. Stat. Simul. Comput. 2001, 30, 899–905. [Google Scholar] [CrossRef]
  73. Stephens, M.A. The Anderson-Darling Statistic, Technical Report No. 39; Department of Statistics, Stanford University: Stanford, CA, USA, 1979. [Google Scholar]
  74. Akaike, H. A New Look at the Statistical Model Identification. IEEE Trans. Autom. Control 1974, 19, 716–723. [Google Scholar] [CrossRef]
  75. Ammann, C.M.; Naveau, P. Statistical analysis of tropical explosive volcanism occurrences over the last 6 centuries. Geophys. Res. Lett. 2003, 30. [Google Scholar] [CrossRef]
  76. Abramowitz, M.; Stegun, I.A. Handbook of Mathematical Functions With Formulas, Graphs and Mathematical Tables (National Bureau of Standards Applied Mathematics Series No. 55); Dover Publications: Mineola, NY, USA, 1965; pp. 1–1046. [Google Scholar]
  77. NIST/SEMATECH e-Handbook of Statistical Methods. Available online: http://www.itl.nist.gov/div898/handbook/ (accessed on 20 February 2019).
  78. Hao, Z.; Singh, V.P. Drought characterization from a multivariate perspective: A review. J. Hydrol. 2015, 527, 668–678. [Google Scholar] [CrossRef]
  79. Turc, L. Estimation of Irrigation Water Requirements, Potential Evapotranspiration: A Simple Climatic Formula Evolved Up to Date. Ann. Agron. 1961, 12, 13–49. [Google Scholar]
  80. Bošnjak, Đ. Navodnjavanje Poljoprivrednih Useva; Univerzitet u Novom Sadu, Poljoprivredni Fakultet: Novi Sad, Srbija, 1999; pp. 1–340. [Google Scholar]
  81. Pejić, B.; Gajić, B. Water balancing-bioclimatic method as a functional approach to precise irrigation. J. Rom. Natl. Soc. Soil Sci. 2006, 40, 45–50. [Google Scholar]
  82. Marinković, B.; Crbobarac, J.; Brdar, S.; Antić, B.; Jaćimović, G.; Crnojević, V. Data mining approach for predictive modeling of agricultural yield data. In Proceedings of the First Int Workshop on Sensing Technologies in Agriculture, Forestry and Environment (BioSense09), Novi Sad, Serbia, 14–15 October 2009; pp. 1–5. [Google Scholar]
  83. Pejić, B.; Maheshwari, B.; Šeremešić, S.; Stričević, R.; Pacureanu-Joita, M.; Rajić, M.; Ćupina, B. Water-yield relations of maize (Zea mays L) in temperate climatic conditions. Maydica 2011, 56, 315–321. [Google Scholar]
  84. Pejić, B.; Ćupina, B.; Dimitrijević, M.; Petrović, S.; Milić, S.; Krstić, Đ.; Jaćimović, G. Response of sugar beet to soil water deficit. Rom. Agric. Res. 2011, 28, 151–155. [Google Scholar]
  85. Pejić, B.; Maksimović, L.; Cimpeanu, S.; Bucur, D.; Milić, S.; Ćupina, B. Response of soybean to water stress at specific growth stages. J. Food, Agric. Environ. 2011, 9, 280–284. [Google Scholar]
  86. Maksimović, L.; Karagić, Đ.; Bošnjak, Đ. Determining the bioclimatic coefficient of cabbage. Zb. Rad. Inst. Ratar. Povrt. 2006, 42, 99–108. [Google Scholar]
  87. Aksić, M.; Deletić, N.; Gudžić, N.; Gudžić, S.; Stojković, S. Hydrophytometeorological indexes of Virginia type tobacco. J. Agric. Sci. 2008, 53, 91–97. [Google Scholar] [CrossRef]
  88. Vučić, N. Bioklimatski koeficijenti i zalivni režim biljaka-teorija i praktična primena. Vodoprivreda 1971, 439–467. [Google Scholar]
  89. Pejić, B.; Gvozdanović-Varga, J.; Vasić, M.; Milić, S. Water balance, bioclimatic method as a base of rational irrigation regime of onion. Acta Hortic. 2009, 830, 355–362. [Google Scholar] [CrossRef]
  90. Kolaković, S. Sistemi za Navodnjavanje; Univerzitet u Novom Sadu: Novi Sad, Srbija, 2006. [Google Scholar]
  91. Jaćimović, G. Optimiranje mineralne ishrane pšenice u zavisnosti od vremenskih uslova godine. Ph.D. Thesis, University of Novi Sad, Faculty of Agriculture, Novi Sad, Serbia, 2012. [Google Scholar]
  92. Delignette-Muller, M.L.; Dutang, C. fitdistrplus: An R Package for Fitting Distributions. J. Stat. Softw. 2015, 64, 1–34. [Google Scholar] [CrossRef]
  93. Viglione, A.; Hosking, J.R.M.; Laio, F.; Miller, A.; Gaume, E.; Payrastre, O.; Salinas, J.L.; N’guyen, C.C.; Halbert, K. R Package ‘nsRFA’: Non-supervised Regional Frequency Analysis. Available online: https://cran.r-project.org/web/packages/nsRFA/ (accessed on 11 February 2019).
  94. Republic Hydrometeorological Service of Serbia. Available online: http://www.hidmet.gov.rs. (accessed on 20 February 2019).
  95. Hosking, J.R.M.; Wallis, J.R.; Wood, E.F. Estimation of the generalized extreme-value distribution by the method of probability-weighted moments. Technometrics 1985, 27, 251–261. [Google Scholar] [CrossRef]
  96. Labudová, L.; Labuda, M.; Takáč, J. Comparison of SPI and SPEI applicability for drought impact assessment on crop production in the Danubian Lowland and the East Slovakian Lowland. Theor. Appl. Climatol. 2017, 128, 491–506. [Google Scholar] [CrossRef]
  97. Chen, T.; Xia, G.; Liu, T.; Chen, W.; Chi, D. Assessment of drought impact on main cereal crops using a standardized precipitation evapotranspiration index in Liaoning Province, China. Sustainability 2016, 8, 1069. [Google Scholar] [CrossRef]
  98. Potopová, V.; Boroneanţ, C.; Boincean, B.; Soukup, J. Impact of agricultural drought on main crop yields in the Republic of Moldova. Int. J. Climatol. 2016, 36, 2063–2082. [Google Scholar] [CrossRef]
  99. Naumann, G.; Dutra, E.; Barbosa, P.; Pappenberger, F.; Wetterhall, F.; Vogt, J.V. Comparison of drought indicators derived from multiple data sets over Africa. Hydrol. Earth Syst. Sci. 2014, 18, 1625–1640. [Google Scholar] [CrossRef] [Green Version]
  100. Tadesse, T.; Champagne, C.; Wardlow, B.D.; Hadwen, T.A.; Brown, J.F.; Demisse, G.B.; Bayissa, Y.A.; Davidson, A.M. Building the vegetation drought response index for Canada (VegDRI-Canada) to monitor agricultural drought: First results. GISci. Remote Sens. 2017, 54, 230–257. [Google Scholar] [CrossRef]
Figure 1. General standardized precipitation evapotranspiration index-based approach to agricultural drought monitoring (ADM-SPEI) approach (a) and the application of the ADM-SPEI approach in the Vojvodina region: (b) hierarchy, (c) study area, and (d) the validation steps in the Vojvodina Region.
Water 11 01481 g001
Figure 2. An example of decision matrices for one decision maker. (a) criteria (C), (b) availability of reliable input data (AD), (c) literature-based suggestions (LS), (d) ease of calculation (EC)/the simplicity of method, (e) common practice (CP), (f) the relevance of the input parameters for the local climatic conditions (RP).
Water 11 01481 g002
Figure 3. The L-moment ratio diagrams for the time series of water balance of maize for the accumulation periods of (a) one, (b) two, and (c) three months.
Water 11 01481 g003
Figure 4. The AD-SPEI2crop for the Rimski Šančevi from 1971 to 2016; or “Evolution of the AD-SPEI2crop at the Rimski Šančevi between 1971 and 2016.
Water 11 01481 g004
Figure 5. AD-SPEI1wheat in (a) March, (b) April, (c) May, and (d) June 2003.
Water 11 01481 g005
Figure 6. The AD-SPEI1maize in (a) May, (b) June, (c) July, and (d) August 2003
Water 11 01481 g006
Figure 7. The AD-SPEI1sugar beet in (a) May, (b) June, (c) July, and (d) August 2003.
Water 11 01481 g007
Figure 8. The AD-SPEI1alfalfa in (a) May, (b) June, (c) July, and (d) August 2003.
Water 11 01481 g008
Figure 9. The AD-SPEI1onion in (a) May, (b) June, (c) July, and (d) August 2003.
Water 11 01481 g009
Figure 10. Heat map of the AD-SPEI1crop calculated at the meteorological stations Vršac for (a) 1992 and 1993, (b) 2003 and 2004, and (c) 2011 and 2012.
Water 11 01481 g010
Figure 11. Climatic water balance of maize in (a) June, (b) July, and (c) August 2012.
Water 11 01481 g011
Figure 12. Climatic water balance of alfalfa in (a) June, (b) July, and (c) August 2012.
Water 11 01481 g012
Figure 13. The values of the climatic water balance of (a) maize and (b) alfalfa when the value of the AD-SPEI1crop is −2 in June on the entire territory of Vojvodina.
Water 11 01481 g013
Figure 14. The drought categories in August representing the limits of the capability of irrigation systems designed using the hydromodule of 0.6 l/s/ha to successfully protect the following crops: (a) Soybeans; (b) maize and hops; (c) potato, onion, and tobacco; (d) sugar beet and cabbage; (e) alfalfa.
Water 11 01481 g014
Figure 15. The correlation between the AD-SPEIcrop and detrended yields of maize by county, 1996–2013.
Water 11 01481 g015
Figure 16. The correlation between the AD-SPEIcrop and detrended yields of W. wheat by county, 1996–2013.
Water 11 01481 g016
Figure 17. The correlation between the AD-SPEIcrop and detrended yields of sugar beet by county, 1996–2013.
Water 11 01481 g017
Figure 18. The correlation between the AD-SPEIcrop and detrended yields of alfalfa by county, 1996–2013.
Water 11 01481 g018
Figure 19. The correlation between the AD-SPEIcrop and detrended yields of potato by county, 1996–2013.
Water 11 01481 g019
Figure 20. The correlation between the AD-SPEIcrop and detrended yields of soybean from the Institute of Field and Vegetable Crops (IFVC) Novi Sad, 1977–2004.
Water 11 01481 g020
Figure 21. The correlation between the AD-SPEIcrop and detrended yields of beans by county, 1996–2013.
Water 11 01481 g021
Figure 22. The correlation between the (a) AD-SPEI1crop and SPI1, between the (b) AD-SPEI2crop and SPI2, and between the (c) AD-SPEI3crop and SPI3.
Water 11 01481 g022
Figure 23. The mean absolute difference (MAD) between the (a) AD-SPEI1crop and SPI1, between the (b) AD-SPEI2crop and SPI2, and between the (c) AD-SPEI3crop and SPI3.
Water 11 01481 g023
Figure 24. The correlation between the (a) AD-SPEI1crop and SPEI1, between the (b) AD-SPEI2crop and SPEI2, and between the (c) AD-SPEI3crop and SPEI3.
Water 11 01481 g024
Figure 25. The MAD between the (a) AD-SPEI1crop and SPEI1, between the (b) AD-SPEI2crop and SPEI2, and between the (c) AD-SPEI3crop and SPEI3.
Water 11 01481 g025
Figure 26. The correlation between the (a) AD-SPEI1crop and self-calibrated Palmer drought severity index (SC-PDSI), between the (b) AD-SPEI2crop and SC-PDSI, and between the (c) AD-SPEI3crop and SC-PDSI.
Water 11 01481 g026
Table 1. Individual and group decisions.
Decision Makers (Experts) Individual Decisions
PMTUTHBMHG
DM10.1340.0920.2700.3560.148
DM20.1030.0730.2900.4290.105
DM30.1310.1640.2880.2500.167
DM40.1300.0750.2110.3820.202
DM50.0750.0940.2420.4940.096
DM60.1820.0630.2110.3590.185
DM70.0740.0620.4090.3860.069
DM80.1690.0820.2100.3540.185
DM90.0820.1060.3270.3370.147
Group Decision0.1200.0900.2730.3720.145
Table 2. The hydrophytothermic indices (K).
MonthMaizeSugar b.AlfalfaSoybeanPotatoBeansCabbageHopOnionTobaccoW. Wheat
Mar. 0.22
Apr. 0.17 0.120.19 0.24
May.0.110.150.250.110.19 0.150.190.130.26
Jun.0.180.200.250.170.190.22 0.180.190.200.21
Jul.0.180.210.250.180.190.240.200.210.190.21
Aug.0.180.200.220.170.19 0.200.180.190.19
Sep.0.110.120.150.110.19 0.20 0.14
Table 3. Anderson-Darling (A-D) rejection frequency (%).
Crop1 Month2 Months3 Months
NGLOP3GEVNGLOP3GEVNGLOP3GEV
Maize57.84.48.92.225.05.65.65.611.13.73.73.7
Soya57.84.411.12.225.05.65.65.611.13.73.73.7
Sug. beet57.86.711.12.219.45.68.35.611.13.73.73.7
Alfalfa42.63.79.33.717.86.78.96.78.32.82.82.8
Potato53.38.98.90.019.48.311.15.622.23.77.43.7
Hop51.18.98.96.730.65.68.32.87.40.03.73.7
Beans50.05.611.15.622.222.222.222.2----
W.Wheat20.06.78.96.78.38.35.65.67.422.218.511.1
Tobacco51.10.013.30.019.411.111.18.311.13.73.73.7
Onion51.16.713.36.722.213.911.15.63.73.73.73.7
Cabbage48.17.47.40.022.25.65.65.622.20.00.00.0
Table 4. Relative distribution ranking by log likelihood.
Crop1 Month2 Months3 Months
NGLOP3GEVNGLOP3GEVNGLOP3GEV
Maize431242314221
Soya431242314221
Sug. beet431242314231
Alfalfa431243214231
Potato431242214321
Hop431242124231
Beans43124132----
W.Wheat431243214321
Tobacco431242314321
Onion421243214231
Cabbage431243214321
Table 5. The map legend of moisture conditions [94].
ColorCategoriesIndex ValuesColorCategoriesIndex Values
Exceptional drought≤2.326 Slightly increased moisture+0.524 to +0.935
Extreme drought–1.645 to –2.326 Moderately increased moisture+0.935 to +1.282
Severe drought–1.282 to –1.645 Considerably increased moisture+1.282 to +1.645
Moderate drought–0.935 to –1.282 Extreme wet+1.645 to +2.326
Minor drought–0.524 to –0.935 Exceptionally wet≥2.326
Near normal+0.524 to –0.524
Each color refers to the corresponding category of moisture conditions.
Table 6. Coefficients of the correlation r between the AD-SPEIcrop and detrended yields of maize, soybean, sugar beet, alfalfa, potato, onion, cabbage, beans, tobacco, and winter wheat in Vojvodina from 1971 to 2016, and Hop from 1971 to 2004.
AD-SPEIcropMaizeSoybeanSugar BeetAlfalfaPotatoOnionCabbageBeansHopWinter WheatTobacco
Accumulation PeriodMonth
1III---------0.27-
IV-----0.05--0.490.14-
V0.420.480.510.440.310.45--0.290.450.46
VI0.360.360.340.450.310.31-0.450.350.370.16
VII0.390.550.220.290.01−0.04−0.020.16−0.03-0.49
VIII0.490.630.460.450.350.240.32-0.36-0.57
IX−0.100.02−0.01−0.03−0.12-−0.08----0.10
2IV---------0.29-
V-----0.38--0.490.42-
VI0.510.550.540.550.370.48--0.400.510.40
VII0.510.650.390.470.200.18-0.400.24-0.49
VIII0.540.740.430.450.220.130.18-0.20-0.67
IX0.300.470.310.300.16-0.16---0.34
3V---------0.49-
VI-----0.43--0.490.49-
VII0.620.750.560.580.300.36--0.34-0.60
VIII0.570.740.480.530.300.21--0.31-0.60
IX0.430.670.370.380.12-0.12---0.55
Significance levels:α = 0.05 α = 0.10
Yellow refers to significant at the 0.10 level, green refers to significant at the 0.05 level.
Table 7. Pearson correlation rejection frequencies for the AD-SPEIcrop and the SPEI for all accumulation periods.
Rejection Frequency (%)
MaizeSugar BeetAlfalfaWinter WheatPotatoBeans
AD-SPEIcrop7.817.225.940.740.233.3
SPEI10.923.429.655.541.738.9

