Article

Taxonomic and Functional Responses of Benthic Macroinvertebrate Communities to Hydrological and Water Quality Variations in a Heavily Regulated River

1
Department of Chemistry, Life Sciences and Environmental Sustainability, University of Parma, Parco Area delle Scienze 11/A, 43124 Parma, Italy
2
Institute for Electromagnetic Sensing of the Environment, National Research Council, Via Bassini 15, 20133 Milan, Italy
3
Biodiversity Data Analytics and Environmental Quality Group, Department of Environmental Biology, University of Navarra, Irunlarrea 1, E-31080 Pamplona, Spain
4
Department of Ecology and Hydrology, Regional Campus of International Importance ‘‘Campus Mare Nostrum’’, University of Murcia, Espinardo Campus, 30100 Murcia, Spain
5
Geography and Environment, Centre for Hydrological and Ecosystem Science, Loughborough University, Loughborough, Leicestershire LE11 3TU, UK
*
Authors to whom correspondence should be addressed.
Water 2019, 11(7), 1478; https://doi.org/10.3390/w11071478
Submission received: 17 May 2019 / Revised: 19 June 2019 / Accepted: 12 July 2019 / Published: 16 July 2019

Abstract

:
Aquatic macroinvertebrates are frequently used to evaluate river system conditions and restoration project performance. A better understanding of macroinvertebrate community responses to multiple stressors is a primary challenge for river science. In this paper, macroinvertebrate responses to hydrological and water quality variability were studied in the regulated Oglio River (northern Italy). We hypothesized that in regulated rivers the hydrological, rather than the physico-chemical conditions, would affect macroinvertebrate communities and biomonitoring tools (taxonomic metrics and functional indices). Repeated sampling (six times a year) was performed at four sites downstream of four dams in a 30 km river stretch during 2014 and 2015. Data were analysed using a linear mixed effect framework, to take into account random variation due to site and sampling date, and with multivariate analysis to track changes in community structure. A total of 69 families and 134,693 organisms were identified. The investigated metrics were mainly affected by the coefficient of variation of discharge, minimum discharge, ammonium, and temperature. The short-term dynamics of hydrological and physico-chemical variables were generally less important than the overall random effects as drivers of macroinvertebrate-based metrics. However, the relevance of a random effect (site, time, their interaction) differed depending on the biological metrics analysed. Understanding potential differences in response to short term and short stretch conditions would benefit biomonitoring and restoration procedures in both regulated and natural rivers.

1. Introduction

The hydrological alteration of river systems through impoundments and diversions represent one of the most important impacts on fluvial ecosystems [1] and a better understanding of the ecological responses is a primary challenge for river science [2]. More than 50% of large rivers worldwide are flow-regulated or dammed [1], and thousands of major dams are planned or under construction [3]. Projects on environmental flows, riverine restoration and those focussed on improving hydrographic connection, habitat heterogeneity and ecological integrity often centre on river hydrology and flow management [4,5,6]. However, possible relationships among hydrological, physico-chemical variables, and the community responses of river biota are yet to be fully understood [5,7,8].
Aquatic macroinvertebrates are model organisms for evaluating the ecological status of river ecosystems, as well as for detecting anthropogenic impacts of very different origin, spanning organic matter and nutrient contamination, deoxygenation and alteration of the flow regime [9,10,11,12,13]. Wide variations in river discharge and water velocity have been shown to alter the physical structure of the riverbed through either sediment clogging or flushing and to affect macroinvertebrate community structure [14,15]. Wide and sudden changes in river flow can dislodge benthic organisms thus triggering their drift and resulting in a local reduction of species richness and abundance [16]. Hydraulic force can also cause changes in food availability for benthic fauna which indirectly shapes community structure (e.g., abundance of benthic algae and fine particulate organic matter selecting different trophic functional groups) [17]. Together with the alteration of hydraulic features of watercourses, flow alteration may also affect the physico-chemical characteristics of water. For instance, changes in oxygen content and thermal regime have been reported by many authors [18,19,20] with the magnitude of change depending on basin size and dam typology (e.g., water released from the bottom or top of the dam).
In this work, we aimed to assess the effect of hydrology and water quality on macroinvertebrate community and biomonitoring tools along a regulated river system. In order to have a complete overview of the macroinvertebrate community, the taxonomic and functional community characteristics were considered. Numerous taxonomic metrics widely used in biomonitoring programmes and functional indices (functional richness and redundancy) were explored allowing us to go beyond a traditional taxonomic approach. Functional measures at the community level are related to ecosystem functioning and stability [21] and can reveal community responses to a variety of stressors [22,23]. Specifically, we aimed to study and test the different relevance of multiple stressors (hydrological, chemical, physical variability) on (i) community metrics and indices and (ii) community structure. We hypothesise that the flow/hydrological variables were the major drivers affecting metrics used to describe the macroinvertebrate community compared to physico-chemical characteristics of water. We expected the functional richness response to be concordant with the other taxonomic metrics (at least in relation to taxonomic richness following [24]). In addition, we postulated that functional redundancy can provide complementary information, and anticipate that it will increase with discharge, likely due to habitat homogenization. Moreover, as the sites are subject to similar hydro-morphological alterations and are located along the same river stretch within the same hydro-ecoregion for biomonitoring purpose, they would be expected to have similar macroinvertebrate communities. Indeed, disentangling the effect of multiple stressors on a macroinvertebrate community is crucial to provide water managers and river basin authorities with reliable information for conserving the integrity of watercourses and to plan long term ecological restoration. Understanding potential differences in responses to short-term and short-stretch conditions would also benefit biomonitoring approaches in both regulated and natural rivers.

2. Materials and Methods
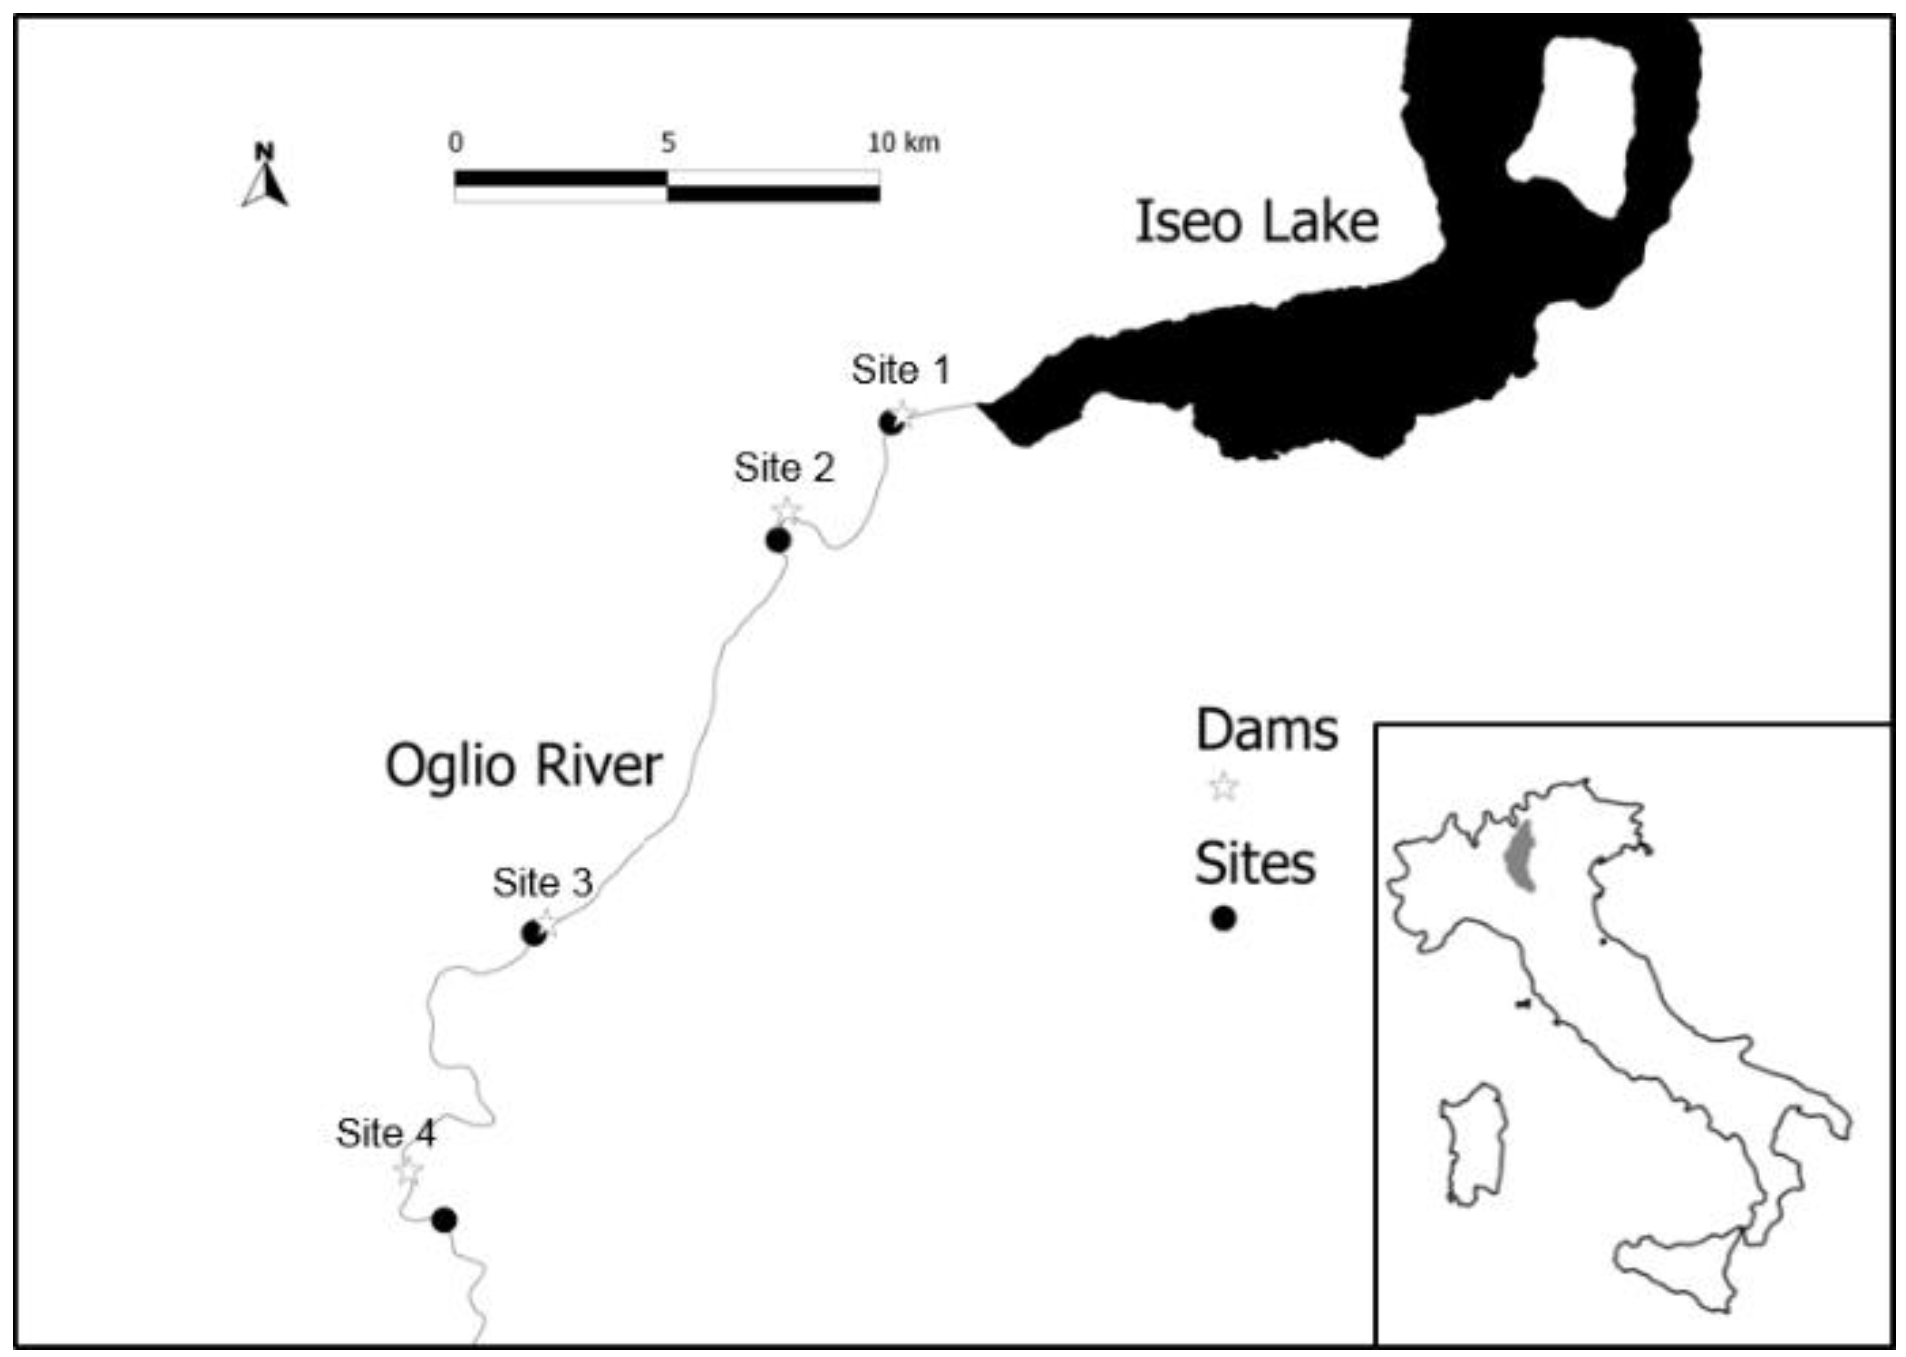
2.1. Study Area

The study was performed along the Oglio River (Lombardy region, Northern Italy), a 280 km long tributary of the Po River. Along its course Lake Iseo originates, the sixth Italian lake in size (65.3 km2, 25 km long). This study was carried out downstream of the lake outlet that hosts six hydroelectric generation plants. The average annual production of these plants sums to 14.5 GWh. The oldest hydroelectric generation plant was built in 1933, while the most recent dates to 1984. More details on the entire Oglio river basin and on the stretches downstream to the lake outlet are available in Guareschi et al. 2014 [24].
The study was performed at four sites each located downstream of different hydroelectric generation plants (Figure 1). These sites were located in the hydro-ecoregion called “Po Plain” following the Italian government designation (Italian Ministry Decree 260/2010), at an altitude ranging from 181 m (site 1) to 128 m (site 4). The wet riverbed in each site resembles that of the active river channel at the same site with a wide range of discharges due to morphological constraints, e.g., riverbed deepening and the river flowing through a single channel. The width of the riverbed was nearly 30 m at all investigated. The riverbed grain/clast size has been reported according to the Italian standard for biomonitoring, using the intermediate axis length–L [25]. Three sites were composed of coarse-grained materials classified as megalithal (L > 40 cm), macrolithal (20 cm < L < 40 cm) and mesolithal (6 cm < L < 20 cm), while the substrate of the fourth site was mainly mesolithal, microlithal (2 cm < L < 6 cm) and cobble (0.2 cm < L < 2 cm). The percentage of other mineral (e.g., sand, silt) or biotic (e.g., macrophytes, CPOM) substrates were less than 5%, thus limiting the substrate patchiness and its potential effect on macroinvertebrate community composition. Riparian vegetation was present at both side of the riverbed at each site, with the exception of site 1 that had riparian vegetation only on the left side. Considering the width of the active channel, the riparian vegetation cover was less than 10% at each site. The stream slope in the studied reaches was in all case <2.5% and all the sites were located within the first 1.5 km downstream of infrastructure. Agriculture is the main land use in the area and agricultural land represents about 60% of the basin area downstream of Iseo Lake [26] with higher values at the last three studied sites.

2.2. Sampling Activity: Biological, Hydrological and Water Quality Data

To fulfil the objectives of the research we planned an intensive biological sampling design that involved collecting 480 macroinvertebrate samples in 12 sampling campaigns. Macroinvertebrates were collected at investigated sites on an approximately monthly basis, on six dates from April to September during 2014 and 2015 (n = 12). A Surber net with a 0.05-m2 area was used to collect macroinvertebrate samples. Ten replicates were randomly collected per site during each sampling date at least 2 m apart to minimise spatial autocorrelation [27]. Each replicate was stored separate from one another, and macroinvertebrate samples and associated material were preserved in 70% ethanol to be examined under a stereoscope in the laboratory. All the macroinvertebrate individuals were identified to the family level, except for Hydracarina, following the taxonomic classification proposed by Tachet [28]. This taxonomic level is the official prerequisite for riverine biomonitoring purposes in Italy and is commonly used in Europe and elsewhere (see [25,29]). Moreover, a good relationship of higher taxonomic levels (e.g., family) with environmental variables has been observed in ecohydrological and ecological studies of river ecosystems [11,30,31].
All data related to discharges were provided by the Consorzio dell’Oglio, the official Basin authority that regulates discharges from Lake Iseo. Data and details on water regulation can be observed in Figure S1, where the natural and regulated water levels at the Sarnico dam (Lake Iseo outlet), together with the water inflow and outflow from the lake, are reported for hydrological years 2013–2014 and 2014–2015. The discharge descriptors used were (i) mean (Qmean) (ii) maximum (Qmax) (iii) minimum (Qmin) and (iv) coefficient of variation (Qcv).
Dissolved oxygen (% O2), pH, temperature, and electrical conductivity were determined in situ using a multiparameter probe (YSI 556 MPS, Yellow Springs, OH, USA). Four replicate water samples were collected concurrently with macroinvertebrate sample collection. Water samples were filtered in situ (glass fiber filters GF/F Whatman, Maidstone, England, porosity 0.7 µm), stored refrigerated and processed within 6–8 h after sampling. Ammonium (NH4+) and nitrate (NO3) were subsequently determined on filtered water while total phosphorus (TP) was determined on unfiltered water samples [32,33].

2.3. Macroinvertebrate Metrics and Indices: Taxonomic and Functional Approaches

Total family richness, abundance, ASPT (Average Score Per Taxon) and EPT family richness (Ephemeroptera, Plecoptera, Trichoptera family richness) were calculated. All these metrics represent single tools that frequently compose more complex multi-metric indices used in freshwater biomonitoring to fulfil the European Water Framework Directive 2000/60/EC (e.g., [34,35,36]). The ASPT represents a sensitive taxa index that is calculated for each sample based on the BMWP (Biological Monitoring Working Party) divided by the number of scoring families [37], it is a core metric for the Italian multimetric STAR_ICMi index [36] but also represent an independent index in Spain [38] and UK [39] and it is frequently used to indicate organic pollution.
Functional responses were also investigated through functional richness (FRich) and functional redundancy (FRed) indices. FRich is defined as the amount of functional space filled by the community [40], while FRed as the difference between taxonomic diversity and functional diversity [41] and it is related to ecosystem stability, resistance and resilience [42]. FRich and FRed were characterized using traits proposed by Tachet et al. [28]. However, to calculate FRed we selected five “effect traits” (size, dispersal, locomotion, food and feeding habits) based on Schmera et al. and Hevia et al. [43,44]. Functional indices calculation was based on the community-level weighted means of trait values (CWM). CWM matrix with the proportion of each trait character in each sampling site was obtained by crossing the “Taxon × traits” and “taxon × site” matrices. The relevance of the functional approach has been already stressed in some biomonitoring indices (e.g., France, [35]) in which macroinvertebrate trait metrics are directly integrated. Moreover, functional redundancy has recently been proposed as a biomonitoring tool to monitor responses in the riparian vegetation [22] and tested on macroinvertebrate communities in a highly regulated Mediterranean basin [45].

2.4. Statistical Analysis

All the taxonomic metrics and functional indices considered were analysed as a function of discharge and physico-chemical predictors within a linear mixed model framework to avoid pseudoreplication issues (LMM; [46]). By taking into account the characteristics of the experimental design, sampling date, site and their interaction were considered random effects, while predictors were considered as fixed. Prior to the analyses, collinear covariates were removed by stepwise selection based on the variance inflation factor (VIF). Abundance was log-transformed and fixed effects were scaled prior to analysis. Bayesian inference based on Markov chain Monte Carlo (MCMC) was used to carry out the analysis because it (i) allows an easier handling of random effects components, and (ii) provides full uncertainty propagation. Normal priors where used for the fixed effect and the inverse Wishart for random effect. A single chain was used and 1 × 10⁸ iterations were carried out, with a burn in of 5000 and a thinning interval of 500. Such and high number of iterations was used to assure convergence of random effects. The convergence of the chain was assessed by visually inspecting the traceplot, using the Heidelberger and Welch’s convergence diagnostic and by examining to the effective sample size estimates. Results are expressed as 95% credible intervals that represent the interval where there is a 95% chance that the true value of the parameter will be within it [47]. In our work credible intervals that not overlap 0 were considered significant.
Conditional and marginal coefficients of determination (pseudo R2) were calculated according to Nakagawa and Schielzeth [48] with the aim to partition the variance explained by environmental (fixed) and latent (random) variables. Briefly, marginal R2 represents the variance explained by fixed effects, while conditional R2 represents the variance explained by both fixed and random effects. The variance explained by random effects was further partitioned into components related to site, time and the time/site interaction.
A PERMANOVA using Bray–Curtis dissimilarities was performed to test if the site, time, and their interaction significantly affect macroinvertebrate community structure. Non-metric multidimensional scaling (NMDS) was performed to identify patterns in community composition. Vectors of the covariates were fitted to the NMDS and performed separately for each site by using the function envfit in the vegan package with the aim of assessing the importance of each covariate in structuring macroinvertebrate community at the local scale. The contribution of each covariate was assessed using the square correlation coefficient (r2).
Finally, an indicator value analysis (IndVal) was carried out to identify indicator families of the investigated sites [49]. The indicator value for abundance data is the product between two quantities, where the first is the mean abundance of the families at the target site group divided by the sum of the mean abundance values from all the groups, and the second is the relative frequency of occurrence of the family at the target site [50]. The IndVal analysis was run with the data aggregated per time and site. However, the presence of an indicator family at a site does not necessarily mean that this family is absent from the other sites, but that its abundance and detection frequency at that identified site are higher.
All the statistical analyses were performed using the statistical computing software R [51]. VIF selection were performed with the package “usdm” [52]. Bayesian LMMs were performed with the package “MCMCglmm” [53] and the package “coda” was used to assess models convergence [54]. Package “vegan” [55] was used for PERMANOVA, nMDS and vector fitting while “indicspecies” [50] was used for the IndVal analysis. Package “ggplot2” was used to plot the results [56]. R scripts used to calculate EPT, ASPT, FRic and FRed are available at https://github.com/alexology/biomonitoR.

3. Results

3.1. Hydrology and Water Quality Data

The hydrological years 2014 and 2015 can be considered different in terms of mean annual discharge with 24.1 ± 26.1 m3 s−1 in 2014 and 12.7 ± 25.2 m3 s−1 in 2015. The mean values and variation of discharge at the investigated sites for both study years are presented in Table 1. Water was well oxygenated with an alkaline pH and low conductivity (Table 2). According to the Italian index for water quality, NO3 and TP for these sites can be classified as high/good status (LIMeco index, Ministerial Decree 260/2010). In contrast, 31% of the time NH4+ concentrations were below to the good status boundary.
Qmax, Qmean and electrical conductivity were excluded from the statistical analysis following the results of the stepwise selection based on VIF. After excluding these descriptors VIF results were lower than 2 and the maximum and minimum correlations among predictors were −0.43 (T-NO3) and 0.003 (pH-NO3).

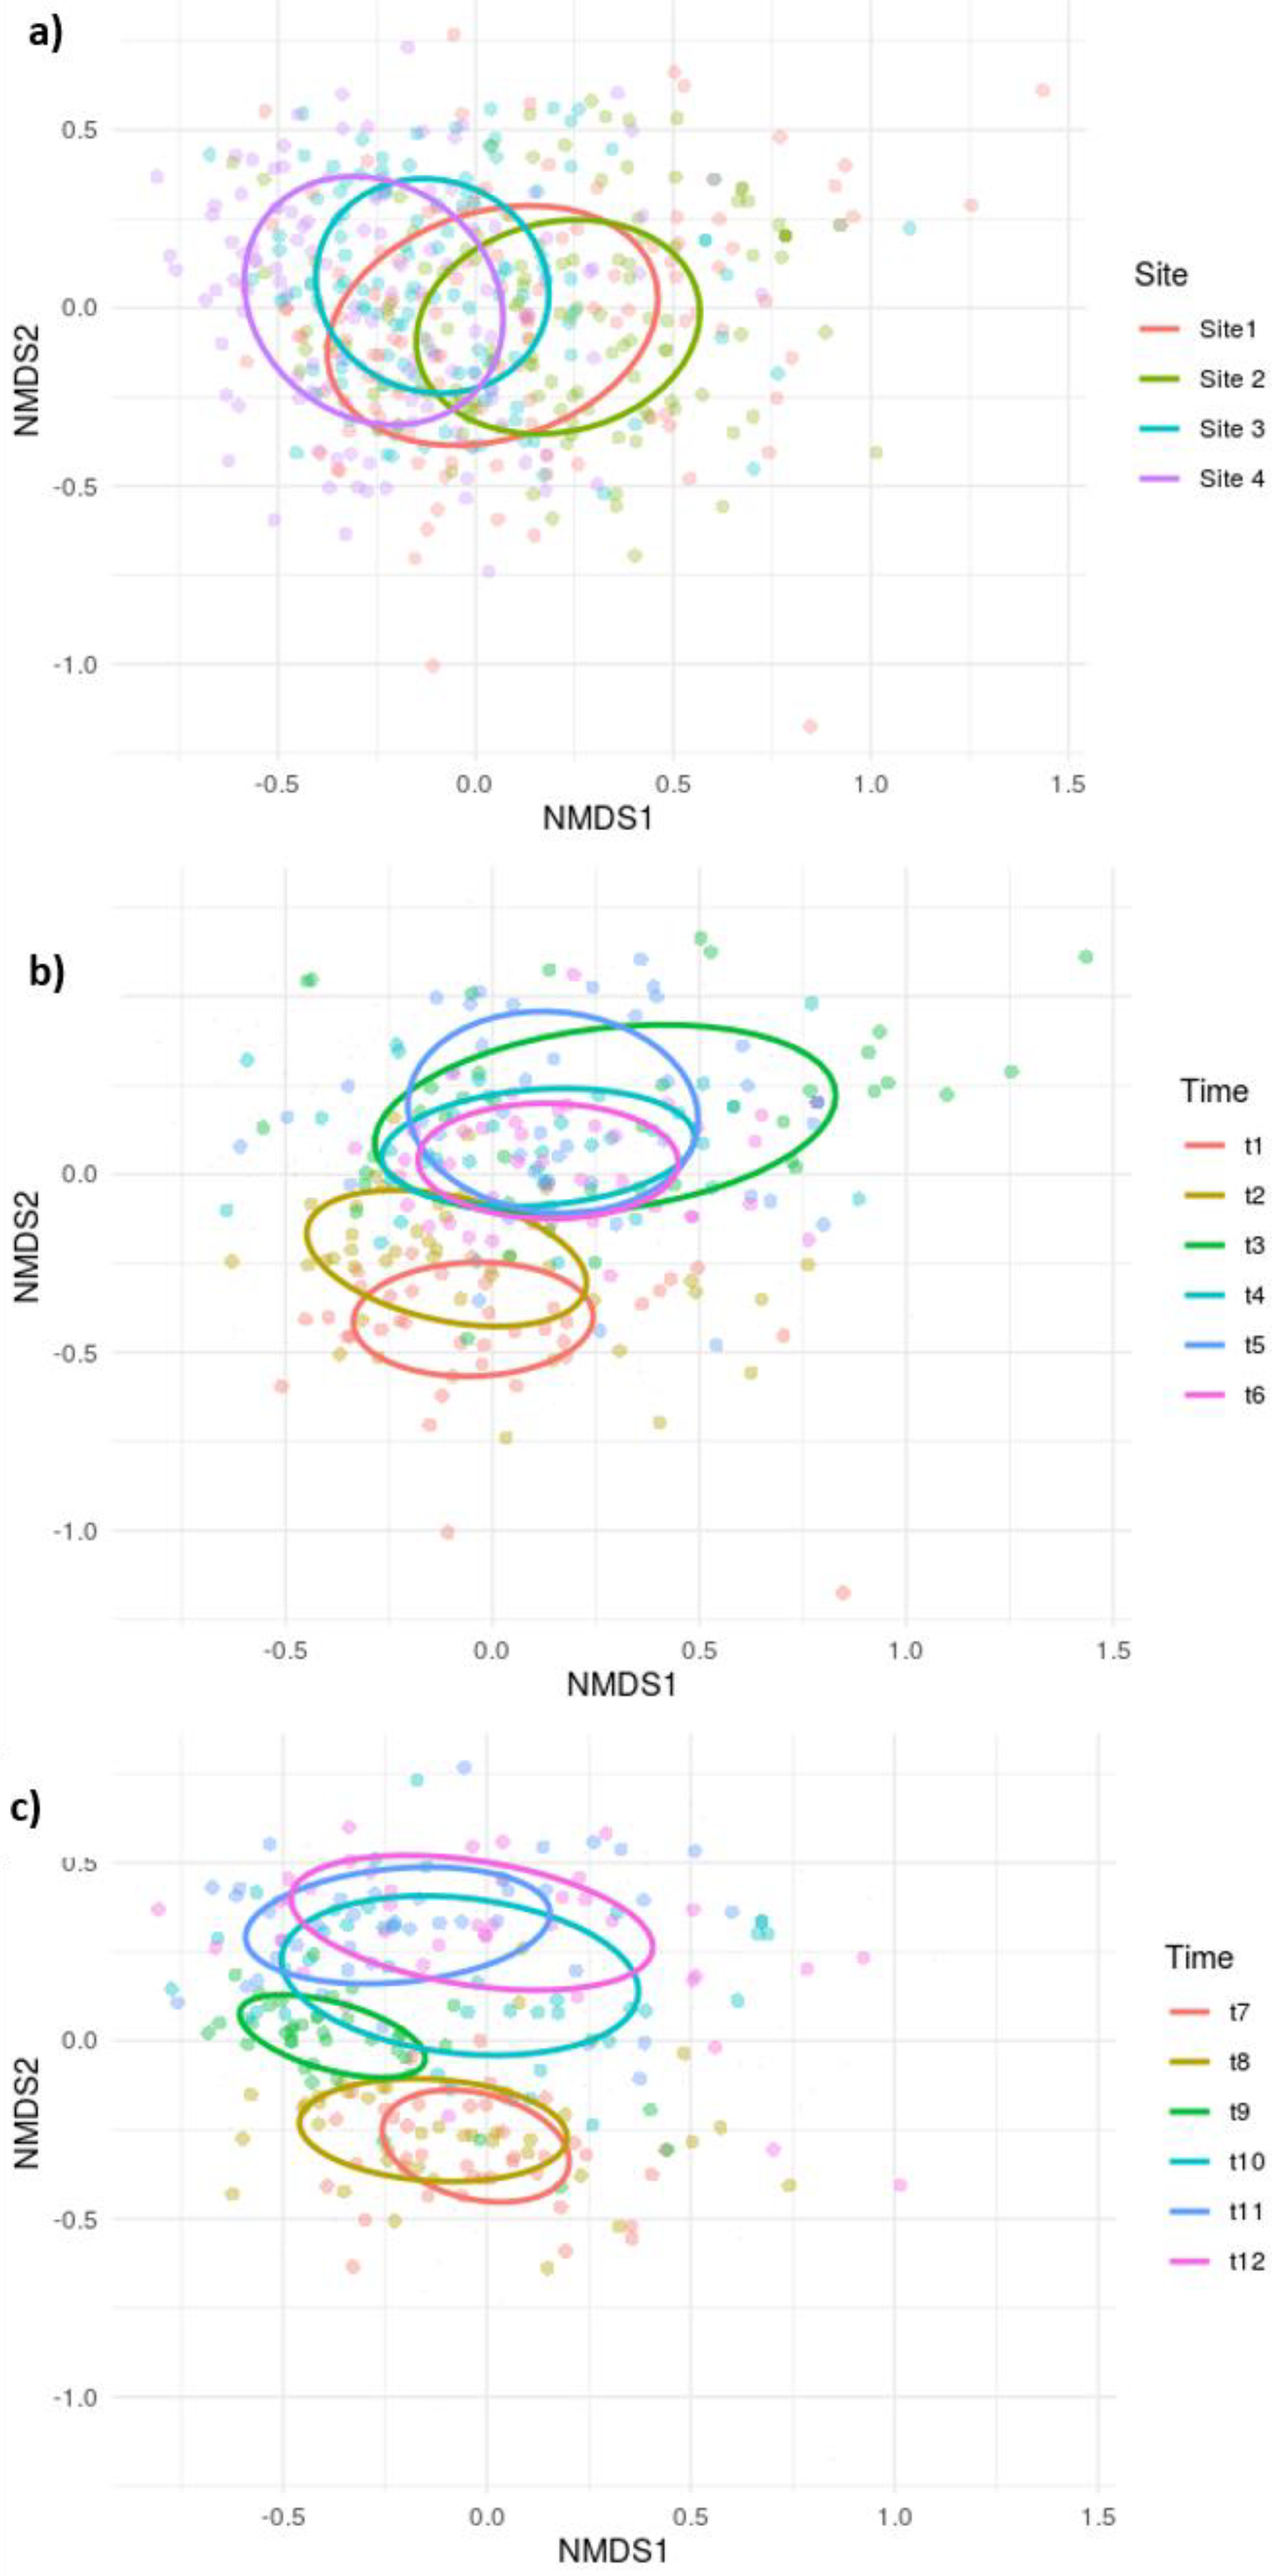
3.2. Macroinvertebrate Community: Responses, Ordinations and Indicator Taxa

A total of 69 families and 134,693 organisms were identified in 480 samples. The most abundant families were Chironomidae (Diptera, 35,515 individuals), Baetidae (Ephemeroptera, 22,561 individuals) and Hydropsychidae (Trichoptera, 18,203 individuals). Overall, 17 EPT families were recorded with a total abundance of 55,709 individuals. The most common EPT families and the percentage of samples in which they were collected were: Leuctridae (100%), Baetidae (100%), Caenidae (100%), Ephemerellidae (92%), Heptageniidae (60%), Hydropsychidae (100%), Leptoceridae (98%), Psychomyiidae (98%), Rhyacophilidae (94%), Hydroptilidae (92%), and Lepidostomatidae (58%). The EPT percentage values were calculated after aggregating data at the site and time levels, which resulted in 48 aggregated samples. The full list of taxa, together with the percentage of samples in which they were collected for each site, are reported in Table S1. Among the EPT taxa, Plecoptera were only represented by the family Leuctridae, which consists of species characterised by very different ecological requirements mostly not particularly pollution-sensitive [57]. Heptageniidae, Leptophlebiidae and Potamanthidae were the Ephemeroptera families that exhibited high sensitivity to anthropogenic disturbance based on BMWP scores. However, the last two families were present at very low abundances (<15 individuals) and only on a few sampling occasions.
LMM results are reported in Figure 2. Credible intervals of hydrological covariates were differed from 0 for all the metrics and indices tested (Qcv and Qmin). Among water quality variables, credible intervals differed from 0 for NH4+ (all the metrics and indices except FRich and FRed) and T (only for abundance and FRed). Metrics and indices were in general negatively related to covariates, despite this was not true for FRed. For example, a negative relationship with the hydrological variable Qmin means that an increase in minimum discharge causes a decrease of the target metric or index. The R2 values, reported in Table 3, show the importance of the random effects (site, time and the time/site interaction) compared to the fixed effects (discharge, physico-chemical predictors) to explain the variation among the dependent variables. Moreover, the relevance of a random effect depends on the biological metrics analysed (Table 3).
Site, time and their interaction explained 9%, 23% and 18% of the total variance in the PERMANOVA analysis, respectively. Community structure at the investigated sites differs in their temporal trajectories despite having similar environmental characteristics. NMDS was fitted on 3 axes with a stress value of 19%. The relevance of site and time on community structures can be also observed in Figure 3 with a remarkable vertical shift along the time gradient being observed from time 1 to 6 and from time 7 to 12 (Figure 3b,c). Vector fitting performed separately for each site highlighted the importance of site-specific characteristics in structuring the macroinvertebrate community (Table 4). NO3, NH4+ and temperature strongly affected macroinvertebrate community structure at all the investigated sites while hydrology was important for Site 1 (Table 4), the closest to the outlet of Lake Iseo.
The IndVal analysis selected a total of 23 taxa with significant indicator value (IV) > 0.5, from just one (at site 2) to ten (at site 4) (complete details in Table 5). The indicator family group highlighted for site 1 was characterised by the presence of lentic families (e.g., Dreissenidae, Planorbidae, Acroloxidae, Hydridae), while site four taxa were largely associated with lotic (e.g., Leuctridae, Heptageniidae) (Table 5). At site 2, one indicator taxon was identified (Psychomyiidae) while site 3 presented a heterogeneous list of five indicator families, in both cases with lower IV in most of the cases.

4. Discussion

4.1. Macroinvertebrate Responses: The Importance of Fixed and Random Effects

Many factors act on different spatial and temporal scales to shape macroinvertebrate communities in running waters. Within this framework, our research has demonstrated that the short-term dynamics of hydrological and physico-chemical variables seem to be rarely the most important drivers of the macroinvertebrate community. In contrast, we found that site, time, and site/time interactions (the so-called random effects) explained a relevant proportion of variance especially for biomonitoring tools. However, the relevance of a random effect (site, time, their interaction) differed depending on the biological metrics analysed (Table 3). For example, ASPT and EPT richness, the metrics most influenced by random effects, are predominately affected by the “site” (and poorly related to “time”) while its effect seems extremely weak for abundance values and FRich (Table 3). This may suggest that metrics characterise spatial or temporal pattern of macroinvertebrate community differently and they need to be carefully chosen based on biomonitoring procedures and restoration targets (see below).
However, based on all the predictors tested (fixed effects), the role of selected hydrological variables on biomonitoring tools can be highlighted. We found partial agreement with our initial hypothesis, the coefficient of variation (Qcv) and the minimum values of discharge (Qmin) were negatively related to all metrics and indices considered, except for FRed that displayed a contrasting pattern.
Responses of macroinvertebrate communities to hydrological factors is reported to be highly variable, spanning either increases or decreases in both abundance and diversity [58]. In our research on regulated river reaches, the negative effect of hydrological variables could be partially ascribed to periods of high flow that occurred mainly in the very wet year 2014. The detrimental effect of floods was better represented by Qcv and elevated Qmin values, according to Konrad et al. [59]. The increase in shear stress during a flood is expected to cause macroinvertebrates to drift from the benthic zone into to the water column [60]. Dislodged organisms may be transported downstream, with a reduction in their abundance at a given site, and with potential effects on taxa richness in some instances (e.g., [61]). The sudden increase in near-bed velocity increases both the probability of dislodging some lentic macroinvertebrates from the substrate [62] and the abundance of filter-feeders adapted to high water velocity [63]. Changes in discharge (probably related with high values of Qcv) may modify the availability of oviposition sites for aquatic insects (e.g., emergent rocks) altering egg supply and subsequently the biological communities [64]. Qcv could be related to improvements in habitat heterogeneity and formation (due to dynamic and variable discharges), although it could also reflect the dramatic changes in discharges that negatively affect the invertebrate communities in heavily regulated rivers. In this context, defining and characterizing this ‘natural dynamic flow regime’, which is crucial for maintaining biodiversity and ecological processes, into quantitative flow descriptors remains a challenge for river science (see [5] and reference inside).
The reduced abundance following the flood was not surprising, and has been reported by other authors [65,66]. In our study area sensitive taxa (EPT richness and ASPT) decreased with increasing Qcv and Qmin. However, Suren and Jowett [67] found EPT metrics to be resilient to flood alterations in a New Zealand river. The decrease we observed could be partially affected by our experimental design, in which we considered the mean response of the dependent variable related to an area of 0.05 m2. A rarefaction of sensitive taxa at 0.05 m2 might not match a decrease in sensitive taxa at a larger scale. However, similar patterns between both metrics were expected as EPT taxa can affect ASPT scores as most have higher BMWP scores. As expected, the response of FRich was largely concordant with taxonomic metrics, while in general, a contrasting pattern was observed for FRed. Community functional redundancy quantifies the degree of niche overlap in functional space and reductions have been highlighted along stress gradients (e.g., [68]). In the Oglio River, increased values of Qcv and Qmin appeared to produce a net increase in niche overlap among taxa. In response to our hypothesis, increasing levels of Qmin in regulated rivers could be related to habitat homogenization or stabilization with few possibilities for new and complementary taxa with different functional features to enter sites with consequent effects on FRed. In contrast to FRich, Qcv had a positive effect on FRed. This may be related to abrupt changes that select and filter specific and resistant taxa progressively. Concordance between FRich and FRed in aquatic communities have been observed when responding to different stresses [68] while in our research these functional indices behaved differently depending on the variables tested.
In agreement with our findings, Bruno et al. [69] also found different responses of FRich and FRed when dealing with flow regulation in riparian vegetation communities. Furthermore, in our study FRed was affected more by random effects than functional richness, the “site” being particularly important. The negative relationship between temperature and aquatic faunal abundance is probably due to the emergence of insects from April to September in both years. The positive relationship between temperature and FRed could be explained by the distribution of common and stress-resistant taxa. Possible effects of seasonal habitat variability on both taxonomic and biological trait composition have been already stressed by other authors in other systems, especially for abundance [70].
For taxonomic metrics, hydrological variables and NH4+ provided similar significant patterns. NH4+ significantly reduced abundance, family richness, EPT richness and ASPT while no relationships were observed for functional indices. A reduction in macroinvertebrate richness and sensitive taxa could be attributed to the toxicity exerted by NH4+ on aquatic organisms [71,72]. However, this is unlike in the Oglio River where NH4+ concentrations were much lower than those reported in literature [73,74]. The river reach studied in this research was fed by the surface waters of Lake Iseo, in which NH4+ is often undetectable [75]. Despite a toxic effect not being excluded, the relationship between NH4+ and the macroinvertebrate metrics studied probably reflects a latent ongoing process that is strictly related to NH4+, as suggested by Friberg et al. [10] and Beketov and Liess [76] for other rivers. Such ongoing processes are probably related to the influence of minor polluted tributaries, draining heavily exploited farmland [26], and partially untreated sewage from overflows during heavy rain events [77].

4.2. Differences in the Similarity: Cross-Site Comparison

Our results highlighted that even in short river stretches (~30 km) of heavily regulated rivers, the benthic macroinvertebrate community responded differently depending on local characteristics, time, and the interaction of these factors. The importance of covariates depends on site-specific characteristics as demonstrated by the envfit analysis. Numerous findings emphasized these differences among sites. Community composition showed spatial and temporal trends, mainly related to NO3- concentration and temperature, which can be proxies of both river-groundwater interactions and the time of the year (e.g., the lower the base flow, the higher the input of groundwater). As for NH4+, a direct effect of NO3 on macroinvertebrates should be excluded given the low concentrations recorded at the investigated sites. However, the influence of NO3 on macroinvertebrate community composition is especially evident at sites further away from Lake Iseo (e.g., site 3, Table 4) as previously demonstrated by Laini et al. [36]. Groundwater inputs have been reported to support macrophyte assemblages in the same system by providing habitat heterogeneity [8,78], these may in turn indirectly affect macroinvertebrate community structure [79].
According to Bonada et al. [80], following Dufrêne and Legendre [49], IV ≥ 0.5 (in case of “indicespecies” package approach) can be considered as a threshold to judge adequate an indicator taxon. Most of them come from site 1 (seven taxa) and site 4 (10 taxa) testifying their differences in community composition. These results, along with PERMANOVA outputs (significant difference among sites communities) and NMDS ordinations (Figure 3, Table 4 and Table 5), support the conclusion that there are differences among sites subject to similar pressures in the same river stretch. The drift of the organisms from Lake Iseo affected the community structure at site 1, as clearly stressed by the IndVal analysis, due to the presence of taxa characteristic of lentic water, such as Dreissenidae, Planorbidae and Acroloxidae (and even Hydra). This pattern can be interpreted as a mass effect [81], and similar findings for Dreissena polymorpha have been recorded downstream dams in some Croatian rivers related to the reproduction stage of planktonic larvae in reservoirs [82].
The presence of Lake Iseo, moreover, prevents the drift of lotic taxa from the upstream rivers to the investigated sites and indirectly provides the river with lentic taxa. Numerous lotic taxa appeared at just site 4 alone, the farthest from the lake, similar to the pattern reported by Holt et al. [83] in the Chattahoochee River (Georgia, USA) where no EPT indicator taxa existed directly below the dam but increased with the distance downstream.
These results, together with the importance of the site/time interaction in LMM, generally suggested that local dynamics play a primary role in shaping macroinvertebrate communities, even at sites with similar hydrological and physico-chemical features as well as near-uniform substrate conditions, climate and altitude. Macroinvertebrate taxa richness and density have been recognised to be highly influenced by local and small scale spatial features in different systems and geographical areas [84,85,86,87].

4.3. Remarks and Implications for River Monitoring and Management

To contrast anthropogenic pressures on freshwater ecosystems, biomonitoring and ecological restoration are essential tasks for sustainable water resource management, aquatic biodiversity conservation and environmental legislation. Multiple natural and anthropogenic factors shape the structure of macroinvertebrate community in the flow regulated Oglio River. Despite the contribution of hydrological and physico-chemical variables cannot be easily disentangled the outcomes of this study stress the significance of hydrological variables for all biomonitoring metrics, both taxonomic and functional.
Among the studied metrics, Family richness, EPT richness and ASPT displayed complete concordance to all stressors tested in the study, illustrating how hydrological variables and NH4+ as important predictors of macroinvertebrate community. The response of FRed stands out as it displayed the opposite trend compared to all other metrics and indices analysed. This lack of concordance indicates that caution is required when using it as a surrogate for other parameters, when assessing river quality or restoration project outcomes.
It must be acknowledged that our research was performed at a high taxonomic resolution (family level). When available, species information should be used, however our findings at family level for both taxonomic and functional measures indicate common patterns and reliable results have been achieved, at least in the context of rapid bioassessment.
Improved understanding of spatial variability is a scientific challenge in environmental flows and water resource management [88]. Even in a short river section with near-uniform substrate conditions, climate and altitude, the macroinvertebrate community responds differently to environmental factors depending on very local river characteristics. So called random effects (site and time, here) exerted strong effects despite with some difference depending on the metrics considered. The results indicate that in biomonitoring procedures and environmental impact assessment, local conditions (e.g., small scale variability) should be considered given the difficulty of generalizing univocal responses, at least, along the Oglio River. Further research is required to disentangle the effect of multiple stressors on macroinvertebrate community and to provide reliable information and tools for preserving the integrity of running water ecosystems. Therefore, local characteristics and small-scale variables should be integrated in basin scale approaches when undertaking restoration projects, flow managements and when setting the bases for the longitudinal delimitation of heavily modified water bodies (HMWB, sensu WFD 2000/60/CE) downstream of reservoirs.

Supplementary Materials

The following are available online at https://www.mdpi.com/2073-4441/11/7/1478/s1, Figure S1: Water influx to and water outflow from the lake Iseo and regulated and natural water levels at Sarnico dam, Table S1: Taxa collected at the investigated sites.

Author Contributions

Conceptualization, A.L. and P.V.; Formal analysis, A.L.; Project administration, P.V.; Writing—original draft, A.L. and S.G.; Writing—review & editing, A.L., P.V., R.B., T.C., E.R. and S.G.

Funding

This research was funded by the Consorzio dell’Oglio (Lombardy Region) as part of the Project ‘Evaluation of the Vital Minimum Flow of the Oglio River (2012–2015)’.

Acknowledgments

We gratefully acknowledge the technical and field support provided by Ing. M. Buizza and his staff (Consorzio dell’Oglio). We also thank P.J. Wood (Loughborough University) for useful comments on a preliminary version. We thank the editors and the anonymous reviewers for their careful reading of our manuscript and their many insightful comments and suggestions. R. Bolpagni and A. Laini were partially funded by the University of Parma (Italy). S. Guareschi was partially supported by a Royal Society-Newton International Fellowship 2018 at Loughborough University, UK (NIF\R1\180346).

Conflicts of Interest

The authors declare no conflict of interest.

References

  1. Nilsson, C.; Reidy, C.A.; Dynesius, M.; Revenga, C. Fragmentation and Flow Regulation of the World’s Large River Systems. Science 2005, 308, 405–408. [Google Scholar] [CrossRef] [PubMed]
  2. Vaughan, I.P.; Diamond, M.; Gurnell, A.M.; Hall, K.A.; Jenkins, A.; Milner, N.J.; Naylor, L.A.; Sear, D.A.; Woodward, G.; Ormerod, S.J. Integrating ecology with hydromorphology: A priority for river science and management. Aquat. Conserv. Mar. Freshw. Ecosyst. 2009, 19, 113–125. [Google Scholar] [CrossRef]
  3. Zarfl, C.; Lumsdon, A.E.; Berlekamp, J.; Tydecks, L.; Tockner, K. A global boom in hydropower dam construction. Aquat. Sci. 2015, 77, 161–170. [Google Scholar] [CrossRef]
  4. Richter, B.D.; Mathews, R.; Harrison, D.L.; Wigington, R. Ecologically Sustainable Water Management: Managing River Flows for Ecological Integrity. Ecol. Appl. 2003, 13, 206–224. [Google Scholar] [CrossRef]
  5. Arthington, A.H.; Naiman, R.J.; Mcclain, M.E.; Nilsson, C. Preserving the biodiversity and ecological services of rivers: New challenges and research opportunities. Freshw. Biol. 2010, 55, 1–16. [Google Scholar]
  6. Schlatter, K.J.; Grabau, M.R.; Shafroth, P.B.; Zamora-Arroyo, F. Integrating active restoration with environmental flows to improve native riparian tree establishment in the Colorado River Delta. Ecol. Eng. 2017, 106, 661–674. [Google Scholar] [CrossRef]
  7. Davies, P.M.; Naiman, R.J.; Warfe, D.M.; Pettit, N.E.; Arthington, A.H.; Bunn, S.E. Flow–ecology relationships: Closing the loop on effective environmental flows. Mar. Freshw. Res. 2014, 65, 133–141. [Google Scholar] [CrossRef]
  8. Bolpagni, R.; Racchetti, E.; Laini, A. Fragmentation and groundwater supply as major drivers of algal and plant diversity and relative cover dynamics along a highly modified lowland river. Sci. Total Environ. 2016, 568, 875–884. [Google Scholar] [CrossRef] [PubMed]
  9. Bonada, N.; Prat, N.; Resh, V.H.; Statzner, B. Developments in aquatic insects biomonitoring: A Comparative Analysis of Recent Approaches. Annu. Rev. Entomol. 2006, 51, 495–523. [Google Scholar] [CrossRef]
  10. Friberg, N.; Skriver, J.; Larsen, S.E.; Pedersen, M.L.; Buffagni, A. Stream macroinvertebrate occurrence along gradients in organic pollution and eutrophication. Freshw. Biol. 2010, 55, 1405–1419. [Google Scholar] [CrossRef]
  11. Bruno, D.; Belmar, O.; Sánchez-Fernández, D.; Guareschi, S.; Millán, A.; Velasco, J. Responses of Mediterranean aquatic and riparian communities to human pressures at different spatial scales. Ecol. Indic. 2014, 45, 456–464. [Google Scholar] [CrossRef]
  12. Buss, D.F.; Carlisle, D.M.; Chon, T.-S.; Culp, J.; Harding, J.S.; Keizer-Vlek, H.E.; Robinson, W.A.; Strachan, S.; Thirion, C.; Hughes, R.M. Stream biomonitoring using macroinvertebrates around the globe: A comparison of large-scale programs. Environ. Monit. Assess. 2015, 187, 4132. [Google Scholar] [CrossRef] [PubMed]
  13. Salmaso, F.; Crosa, G.; Espa, P.; Gentili, G.; Quadroni, S.; Zaccara, S. Benthic macroinvertebrates response to water management in a lowland river: Effects of hydro-power vs irrigation off-stream diversions. Environ. Monit. Assess. 2017, 190, 33. [Google Scholar] [CrossRef] [PubMed]
  14. Céréghino, R.; Lavandier, P. Influence of hydropeaking on the distribution and larval development of the Plecoptera from a mountain stream. Regul. Rivers Res. Manag. 1998, 14, 297–309. [Google Scholar] [CrossRef]
  15. Stubbington, R.; Wood, P.J.; Boulton, A.J. Low flow controls on benthic and hyporheic macroinvertebrate assemblages during supra-seasonal drought. Hydrol. Process. 2009, 23, 2252–2263. [Google Scholar] [CrossRef] [Green Version]
  16. Dolédec, S.; Lamouroux, N.; Fuchs, U.; Mérigoux, S. Modelling the hydraulic preferences of benthic macroinvertebrates in small European streams. Freshw. Biol. 2007, 52, 145–164. [Google Scholar] [CrossRef]
  17. Brooks, A.J.; Haeusler, T.; Reinfelds, I.; Williams, S. Hydraulic microhabitats and the distribution of macroinvertebrate assemblages in riffles. Freshw. Biol. 2005, 50, 331–344. [Google Scholar] [CrossRef]
  18. Camargo, J.A.; Voelz, N.J. Biotic and Abiotic Changes along the Recovery Gradient of Two Impounded Rivers with Different Impoundment Use. Environ. Monit. Assess. 1998, 50, 143–158. [Google Scholar] [CrossRef]
  19. Olden, J.D.; Naiman, R.J. Incorporating thermal regimes into environmental flows assessments: Modifying dam operations to restore freshwater ecosystem integrity. Freshw. Biol. 2010, 55, 86–107. [Google Scholar] [CrossRef]
  20. Nilsson, C.; Renöfält, B. Linking Flow Regime and Water Quality in Rivers: A Challenge to Adaptive Catchment Management. Ecol. Soc. 2008, 13, 18. [Google Scholar] [CrossRef]
  21. Mouillot, D.; Graham, N.A.J.; Villéger, S.; Mason, N.W.H.; Bellwood, D.R. A functional approach reveals community responses to disturbances. Trends Ecol. Evol. 2013, 28, 167–177. [Google Scholar] [CrossRef]
  22. Bruno, D.; Gutiérrez-Cánovas, C.; Velasco, J.; Sánchez-Fernández, D. Functional redundancy as a tool for bioassessment: A test using riparian vegetation. Sci. Total Environ. 2016, 566–567, 1268–1276. [Google Scholar] [CrossRef] [PubMed]
  23. Ruhi, A.; Dong, X.; McDaniel, C.H.; Batzer, D.P.; Sabo, J.L. Detrimental effects of a novel flow regime on the functional trajectory of an aquatic invertebrate metacommunity. Glob. Chang. Biol. 2018, 24, 3749–3765. [Google Scholar] [CrossRef] [Green Version]
  24. Guareschi, S.; Laini, A.; Racchetti, E.; Bo, T.; Fenoglio, S.; Bartoli, M. How do hydromorphological constraints and regulated flows govern macroinvertebrate communities along an entire lowland river? Ecohydrology 2014, 7, 366–377. [Google Scholar] [CrossRef]
  25. Buffagni, A.; Erba, S. Parte A—Metodo di campionamento per i fiumi guadabili. In Notiziario dei Metodi Analitici; Istituto di Ricerca Sulle Acque del Consiglio Nazionale Delle Ricerche: Roma, Italy, 2007. [Google Scholar]
  26. Bartoli, M.; Racchetti, E.; Delconte, C.A.; Sacchi, E.; Soana, E.; Laini, A.; Longhi, D.; Viaroli, P. Nitrogen balance and fate in a heavily impacted watershed (Oglio River, Northern Italy): In quest of the missing sources and sinks. Biogeosciences 2012, 9, 361–373. [Google Scholar] [CrossRef]
  27. Lancaster, J.; Belyea, L.R. Defining the limits to local density: Alternative views of abundance–environment relationships. Freshw. Biol. 2006, 51, 783–796. [Google Scholar] [CrossRef]
  28. Tachet, H. Invertébrés d’eau Douce: Systématique, Biologie, Écologie; édition Revue et Augmentée Edizione; CNRS EDITIONS: Paris, France, 2010; ISBN 978-2-271-06945-0. [Google Scholar]
  29. Guareschi, S.; Laini, A.; Sánchez-Montoya, M.M. How do low-abundance taxa affect river biomonitoring? Exploring the response of different macroinvertebrate-based indices. J. Limnol. 2017, 76, 9–20. [Google Scholar] [CrossRef]
  30. Heino, J.; Soininen, J. Are higher taxa adequate surrogates for species-level assemblage patterns and species richness in stream organisms? Biol. Conserv. 2007, 137, 78–89. [Google Scholar] [CrossRef]
  31. Belmar, O.; Velasco, J.; Gutiérrez-Cánovas, C.; Mellado-Díaz, A.; Millán, A.; Wood, P.J. The influence of natural flow regimes on macroinvertebrate assemblages in a semiarid Mediterranean basin. Ecohydrology 2013, 6, 363–379. [Google Scholar] [CrossRef]
  32. American Public Health Association; American Water Works Association; Water Environment Federation. Standard Methods for the Examination of Water and Wastewater, 23th ed.; Water Environment Federation: Washington, DC, USA, 2017; ISBN 978-0-87553-287-5. [Google Scholar]
  33. APAT-CNR-IRSA. Manuale Linee Guida-Metodi Analitici per le Acque; APAT: Roma, Italy, 2003; ISBN 88-448-0083-7. [Google Scholar]
  34. Birk, S.; Bonne, W.; Borja, A.; Brucet, S.; Courrat, A.; Poikane, S.; Solimini, A.; van de Bund, W.; Zampoukas, N.; Hering, D. Three hundred ways to assess Europe’s surface waters: An almost complete overview of biological methods to implement the Water Framework Directive. Ecol. Indic. 2012, 18, 31–41. [Google Scholar] [CrossRef]
  35. Mondy, C.P.; Villeneuve, B.; Archaimbault, V.; Usseglio-Polatera, P. A new macroinvertebrate-based multimetric index (I2M2) to evaluate ecological quality of French wadeable streams fulfilling the WFD demands: A taxonomical and trait approach. Ecol. Indic. 2012, 18, 452–467. [Google Scholar] [CrossRef]
  36. Laini, A.; Bolpagni, R.; Cancellario, T.; Guareschi, S.; Racchetti, E.; Viaroli, P. Testing the response of macroinvertebrate communities and biomonitoring indices under multiple stressors in a lowland regulated river. Ecol. Indic. 2018, 90, 47–53. [Google Scholar] [CrossRef]
  37. Hawkes, H.A. Origin and development of the biological monitoring working party score system. Water Res. 1998, 32, 964–968. [Google Scholar] [CrossRef]
  38. Ministry of Agriculture, Fisheries and Food (MAGRAMA). Criterios de Seguimiento Y Evaluación del Estado de Las Aguas Superficiales Y Las Normas de Calidad Ambiental. Boletín Oficial del Estado-BOE, 219: 80582–80677; Ministerio de Agricultura, Alimentación y Medio Ambiente: Madrid, Spain, 2015. [Google Scholar]
  39. The UK Technical Advisory Group (UKTAG). UKTAG river assessment method, benthic invertebrate fauna. In Invertebrates (General Degradation): Whalley, Hawkes, Paisley & Trigg (WHPT). Metric in River Invertebrate Classification Tool (RICT); WFD-UKTAG: Scotland, UK, 2014. [Google Scholar]
  40. Villéger, S.; Mason, N.W.H.; Mouillot, D. New Multidimensional Functional Diversity Indices for a Multifaceted Framework in Functional Ecology. Ecology 2008, 89, 2290–2301. [Google Scholar] [CrossRef] [PubMed]
  41. Pillar, V.D.; Blanco, C.C.; Müller, S.C.; Sosinski, E.E.; Joner, F.; Duarte, L.D.S. Functional redundancy and stability in plant communities. J. Veg. Sci. 2013, 24, 963–974. [Google Scholar] [CrossRef]
  42. Hooper, D.U.; Chapin, F.S.; Ewel, J.J.; Hector, A.; Inchausti, P.; Lavorel, S.; Lawton, J.H.; Lodge, D.M.; Loreau, M.; Naeem, S.; et al. Effects of Biodiversity on Ecosystem Functioning: A Consensus of Current Knowledge. Ecol. Monogr. 2005, 75, 3–35. [Google Scholar] [CrossRef]
  43. Schmera, D.; Heino, J.; Podani, J.; Erős, T.; Dolédec, S. Functional diversity: A review of methodology and current knowledge in freshwater macroinvertebrate research. Hydrobiologia 2017, 787, 27–44. [Google Scholar] [CrossRef]
  44. Hevia, V.; Martín-López, B.; Palomo, S.; García-Llorente, M.; de Bello, F.; González, J.A. Trait-based approaches to analyze links between the drivers of change and ecosystem services: Synthesizing existing evidence and future challenges. Ecol. Evol. 2017, 7, 831–844. [Google Scholar] [CrossRef] [PubMed]
  45. Belmar, O.; Bruno, D.; Guareschi, S.; Mellado-Díaz, A.; Millán, A.; Velasco, J. Functional responses of aquatic macroinvertebrates to flow regulation are shaped by natural flow intermittence in Mediterranean streams. Freshw. Biol. 2019, 64, 1064–1077. [Google Scholar] [CrossRef]
  46. Zuur, A.; Ieno, E.N.; Walker, N.; Saveliev, A.A.; Smith, G.M. Mixed Effects Models and Extensions in Ecology with R; Statistics for Biology and Health; Springer: New York, NY, USA, 2009; ISBN 978-0-387-87457-9. [Google Scholar]
  47. Mccarthy, M.A. Bayesian Methods for Ecology, 1st ed.; Cambridge University Press: Cambridge, UK, 2007; ISBN 978-0-521-61559-4. [Google Scholar]
  48. Nakagawa, S.; Schielzeth, H. A general and simple method for obtaining R2 from generalized linear mixed-effects models. Methods Ecol. Evol. 2013, 4, 133–142. [Google Scholar] [CrossRef]
  49. Dufrêne, M.; Legendre, P. Species Assemblages and Indicator Species: The Need for a Flexible Asymmetrical Approach. Ecol. Monogr. 1997, 67, 345–366. [Google Scholar] [CrossRef]
  50. De Cáceres, M.D.; Legendre, P. Associations between species and groups of sites: Indices and statistical inference. Ecology 2009, 90, 3566–3574. [Google Scholar] [CrossRef] [PubMed]
  51. R Core Team. A Language and Environment for Statistical Computing; R Foundation for Statistical Computing: Vienna, Austria, 2017. [Google Scholar]
  52. Naimi, B.; Hamm, N.A.S.; Groen, T.A.; Skidmore, A.K.; Toxopeus, A.G. Where is positional uncertainty a problem for species distribution modelling? Ecography 2014, 37, 191–203. [Google Scholar] [CrossRef]
  53. Hadfield, J.D. MCMC Methods for Multi-Response Generalized Linear Mixed Models: The MCMCglmm R Package. J. Stat. Softw. 2010, 33, 1–22. [Google Scholar] [CrossRef]
  54. Plummer, M.; Best, N.; Cowles, K.; Vines, K. CODA: Convergence diagnosis and output analysis for MCMC. R News 2006, 6, 7–11. [Google Scholar]
  55. Oksanen, J.; Blanchet, F.G.; Friendly, M.; Kindt, R.; Legendre, P.; McGlinn, D.; Minchin, P.R.; O’Hara, R.B.; Simpson, G.L.; Solymos, P.; et al. Vegan: Community Ecology Package. Version. 2.5-5. CRAN, GitHub, US, 2019. Available online: https://cran.r-project.org/web/packages/vegan/index.html (accessed on 12 May 2019).
  56. Wickham, H. Ggplot2: Elegant Graphics for Data Analysis; Use R! Springer: New York, NY, USA, 2009; ISBN 978-0-387-98141-3. [Google Scholar]
  57. Fochetti, R.; Tierno De Figueroa, J.M. Plecoptera; Calderini: Milano, Italy, 2008; ISBN 978-88-506-5307-2. [Google Scholar]
  58. Poff, N.L.; Zimmerman, J.K.H. Ecological responses to altered flow regimes: A literature review to inform the science and management of environmental flows. Freshw. Biol. 2010, 55, 194–205. [Google Scholar] [CrossRef]
  59. Konrad, C.P.; Brasher, A.M.D.; May, J.T. Assessing streamflow characteristics as limiting factors on benthic invertebrate assemblages in streams across the western United States. Freshw. Biol. 2008, 53, 1983–1998. [Google Scholar] [CrossRef]
  60. Brittain, J.E.; Eikeland, T.J. Invertebrate drift—A review. Hydrobiologia 1988, 166, 77–93. [Google Scholar] [CrossRef]
  61. Fritz, K.M.; Dodds, W.K. Resistance and Resilience of Macroinvertebrate Assemblages to Drying and Flood in a Tallgrass Prairie Stream System. Hydrobiologia 2004, 527, 99–112. [Google Scholar] [CrossRef]
  62. Rice, S.P.; Buffin-Bélanger, T.; Lancaster, J.; Reid, I. 24 Movements of a macroinvertebrate (Potamophylax latipennis) across a gravel-bed substrate: Effects of local hydraulics and micro-topography under increasing discharge. Dev. Earth Surf. Process. 2007, 11, 637–659. [Google Scholar]
  63. Hart, D.D.; Clark, B.D.; Jasentuliyana, A. Fine-scale field measurement of benthic flow environments inhabited by stream invertebrates. Limnol. Oceanogr. 1996, 41, 297–308. [Google Scholar] [CrossRef]
  64. Lancaster, J.; Downes, B.J. Linking the hydraulic world of individual organisms to ecological processes: Putting ecology into ecohydraulics. River Res. Appl. 2010, 26, 385–403. [Google Scholar] [CrossRef]
  65. Bond, N.R.; Downes, B.J. The independent and interactive effects of fine sediment and flow on benthic invertebrate communities characteristic of small upland streams. Freshw. Biol. 2003, 48, 455–465. [Google Scholar] [CrossRef]
  66. Mesa, L.M. Effect of spates and land use on macroinvertebrate community in Neotropical Andean streams. Hydrobiologia 2010, 641, 85–95. [Google Scholar] [CrossRef]
  67. Suren, A.M.; Jowett, I.G. Effects of floods versus low flows on invertebrates in a New Zealand gravel-bed river. Freshw. Biol. 2006, 51, 2207–2227. [Google Scholar] [CrossRef]
  68. Gutiérrez-Cánovas, C.; Sánchez-Fernández, D.; Velasco, J.; Millán, A.; Bonada, N. Similarity in the difference: Changes in community functional features along natural and anthropogenic stress gradients. Ecology 2015, 96, 2458–2466. [Google Scholar] [CrossRef] [PubMed]
  69. Bruno, D.; Gutiérrez-Cánovas, C.; Sánchez-Fernández, D.; Velasco, J.; Nilsson, C. Impacts of environmental filters on functional redundancy in riparian vegetation. J. Appl. Ecol. 2016, 53, 846–855. [Google Scholar] [CrossRef]
  70. Bêche, L.A.; Mcelravy, E.P.; Resh, V.H. Long-term seasonal variation in the biological traits of benthic-macroinvertebrates in two Mediterranean-climate streams in California, USA. Freshw. Biol. 2006, 51, 56–75. [Google Scholar] [CrossRef]
  71. Munné, A.; Prat, N. Use of macroinvertebrate-based multimetric indices for water quality evaluation in Spanish Mediterranean rivers: An intercalibration approach with the IBMWP index. Hydrobiologia 2009, 628, 203. [Google Scholar] [CrossRef]
  72. Lecerf, A.; Usseglio-Polatera, P.; Charcosset, J.-Y.L.; Bracht, B.; Chauvet, E. Assessment of functional integrity of eutrophic streams using litter breakdown and benthic macroinvertebrates. Arch. Für Hydrobiol. 2006, 165, 105–126. [Google Scholar] [CrossRef]
  73. Berenzen, N.; Schulz, R.; Liess, M. Effects of chronic ammonium and nitrite contamination on the macroinvertebrate community in running water microcosms. Water Res. 2001, 35, 3478–3482. [Google Scholar] [CrossRef]
  74. Beketov, M. Different sensitivity of mayflies (Insecta, Ephemeroptera) to ammonia, nitrite and nitrate: Linkage between experimental and observational data. Hydrobiologia 2004, 528, 209–216. [Google Scholar] [CrossRef]
  75. Salmaso, N.; Morabito, G.; Garibaldi, L.; Mosello, R. Trophic Development of the Deep Lakes South of the Alps: A Comparative Analysis. Fundam. Appl. Limnol./Archiv Hydrobiol. 2007, 170, 177–196. [Google Scholar] [CrossRef]
  76. Beketov, M.A.; Liess, M. An indicator for effects of organic toxicants on lotic invertebrate communities: Independence of confounding environmental factors over an extensive river continuum. Environ. Pollut. 2008, 156, 980–987. [Google Scholar] [CrossRef] [PubMed]
  77. Canobbio, S.; Mezzanotte, V.; Sanfilippo, U.; Benvenuto, F. Effect of Multiple Stressors on Water Quality and Macroinvertebrate Assemblages in an Effluent-Dominated Stream. Water Air Soil Pollut. 2009, 198, 359–371. [Google Scholar] [CrossRef]
  78. Bolpagni, R.; Laini, A. Microhabitat patterns of soft-bodied benthic algae in a lowland river largely fed by groundwater. Fottea 2016, 16, 244–254. [Google Scholar] [CrossRef] [Green Version]
  79. Boulton, A.J.; Hancock, P.J. Rivers as groundwater-dependent ecosystems: A review of degrees of dependency, riverine processes and management implications. Aust. J. Bot. 2006, 54, 133–144. [Google Scholar] [CrossRef]
  80. Bonada, N.; Rieradevall, M.; Dallas, H.; Davis, J.; Day, J.; Figueroa, R.; Resh, V.H.; Prat, N. Multi-scale assessment of macroinvertebrate richness and composition in Mediterranean-climate rivers. Freshw. Biol. 2008, 53, 772–788. [Google Scholar] [CrossRef]
  81. Shmida, A.; Wilson, M.V. Biological Determinants of Species Diversity. J. Biogeogr. 1985, 12, 1–20. [Google Scholar] [CrossRef]
  82. Ćuk, R.; Miliša, M.; Atanacković, A.; Dekić, S.; Blažeković, L.; Žganec, K. Biocontamination of benthic macroinvertebrate assemblages in Croatian major rivers and effects on ecological quality assessment. Knowl. Manag. Aquat. Ecosyst. 2019, 420, 11. [Google Scholar] [CrossRef]
  83. Holt, C.R.; Pfitzer, D.; Scalley, C.; Caldwell, B.A.; Batzer, D.P. Macroinvertebrate Community Responses to Annual Flow Variation from River Regulation: An 11-Year Study. River Res. Appl. 2015, 31, 798–807. [Google Scholar] [CrossRef]
  84. Downes, B.J.; Hindell, J.S. What’s in a site? Variation in lotic macroinvertebrate density and diversity in a spatially replicated experiment. Austral Ecol. 2000, 25, 128–139. [Google Scholar] [CrossRef]
  85. Laini, A.; Vorti, A.; Bolpagni, R.; Viaroli, P. Small-scale variability of benthic macroinvertebrates distribution and its effects on biological monitoring. Ann. Limnol. Int. J. Limnol. 2014, 50, 211–216. [Google Scholar] [CrossRef] [Green Version]
  86. Burgazzi, G.; Guareschi, S.; Laini, A. The role of small-scale spatial location on macroinvertebrate community in an intermittent stream. Limnetica 2018, 37, 319–340. [Google Scholar]
  87. White, J.C.; Krajenbrink, H.J.; Hill, M.J.; Hannah, D.M.; House, A.; Wood, P.J. Habitat-specific invertebrate responses to hydrological variability, anthropogenic flow alterations, and hydraulic conditions. Freshw. Biol. 2019, 64, 555–576. [Google Scholar] [CrossRef]
  88. Arthington, A.H.; Kennen, J.G.; Stein, E.D.; Webb, J.A. Recent advances in environmental flows science and water management—Innovation in the Anthropocene. Freshw. Biol. 2018, 63, 1022–1034. [Google Scholar] [CrossRef]
Figure 1. Oglio River basin and its position in northern Italy. Lake Iseo, dams of hydroelectric generation plants (white stars) and sites (black dots) are displayed.
Water 11 01478 g001
Figure 2. Credible intervals of fixed effects (on Y-axis) for all the investigated biomonitoring metrics and indices. Significant predictors, those that don’t overlap 0, are labelled in red (details in the Methods section).
Water 11 01478 g002
Figure 3. Results of non-metric multidimensional scaling (NMDS) ordination: ellipsoid hulls were drawn for sites (a) and the sampling campaigns of 2014 (b) and 2015 (c). A confidence level of 0.5 was adopted for the ellipsoid to increase the readability of the plot and to better assess spatial and temporal trends.
Water 11 01478 g003
Table 1. Mean values of discharge (m3 s−1) together with ranges of variability in both study years (2014–2015) are reported for each site.
SITE20142015
QmeanRangeQmeanRange
130.1(3.0–163.5)6.4(3–9.3)
250.3(17–161.3)19.1(6.2–58.1)
341(7.1–166.8)10(4–27.5)
451.6(10.2–178.4)12.5(6.9–34.5)
Table 2. Mean ± standard deviation of the main physico-chemical water parameters studied in the Oglio River (2014 and 2015).
PARAMETER20142015
O2 (%)105 ± 5.43105 ± 8.10
NH4+ (mg N L−1)0.06 ± 0.040.06 ± 0.04
NO3 (mg N L−1)0.65 ± 0.270.54 ± 0.27
TP (µg P L−1)16.3 ± 9.8434.8 ± 21.0
COD (mg O2 L−1)3.81 ± 5.314.00 ± 3.45
T (°C)20.5 ± 2.1021.6 ± 4.02
pH8.20 ± 0.347.87 ± 0.38
Electrical conductivity (µS cm−1)222 ± 24.0230 ± 24.3
Table 3. Marginal (R2m) and conditional (R2c) R2 for all the models performed in this work. R2 partition for random effect (Site, Time and Site/Time interaction) is also reported. R2m represents the variance explained by fixed effects, while R2c represents the variance explained by both fixed and random effects.
VARIABLER2mR2cSiteTimeSite:Time
Family Richness0.150.400.020.100.13
Abundance0.290.530.010.050.19
EPT Richness0.180.600.240.040.14
ASPT0.110.670.500.000.06
Functional richness0.090.230.000.110.02
Functional redundancy0.130.540.170.040.21
Table 4. Results of vector fitting performed on non-metric multidimensional scaling (NMDS) ordination independently for each site. *** p < 0.001; ** p < 0.01; * p < 0.05.
COVARIATESITE1SITE2SITE3SITE4
Qcv0.17 ***0.030.050.06 *
Qmin0.25 ***0.09 **0.07 **0.14 ***
% O20.17 ***0.08 **0.19 ***0.19 ***
NH4+0.12 **0.36 ***0.32 ***0.07 *
NO30.20 ***0.50 ***0.73 ***0.22 ***
TP0.030.020.040.05 *
Temperature0.29 ***0.45 ***0.52 ***0.39 ***
pH0.12 ***0.020.010.02
Table 5. The indicator value analysis (IndVal) results. “Stat” represents the IV (Indicator value). Orders, families and p-values are also displayed. *** p < 0.001; ** p < 0.01; * p < 0.05.
Site 1
OrderFamilystatp Value
VeneroidaDreissenidae0.8700.0001***
BasommatophoraPlanorbidae0.7670.0036**
DipteraSimuliidae0.7440.0277*
BasommatophoraAcroloxidae0.7380.0002***
AnthoathecataHydridae0.7370.0446*
AmphipodaGammaridae0.6820.0115*
DipteraPsychodidae0.6240.0154*
Site 2
OrderFamilystatp Value
TrichopteraPsychomyiidae0.6460.0396*
Site 3
OrderFamilystatp Value
TrombidiformesHydracarina0.6970.0001***
DipteraLimoniidae0.6940.0206*
IsopodaAsellidae0.6610.0206*
DipteraChironomidae0.6450.0226*
TrichopteraHydropsychidae0.6220.048*
Site 4
OrderFamilystatp Value
PlecopteraLeuctridae0.8710.0001***
EphemeropteraEphemerellidae0.7630.0057**
EphemeropteraHeptageniidae0.7460.0025**
VeneroidaCorbiculidae0.7150.0013**
ArhynchobdellidaErpobdellidae0.6840.0036**
LittorinimorphaHydrobiidae0.6710.0052**
EphemeropteraCaenidae0.6650.0055**
HemipteraAphelocheiridae0.6620.0063**
ColeopteraElmidae0.6490.0178*
VeneroidaSphaeriidae0.6480.0241*

