Modelling the Impacts of Bathymetric Changes on Water Level in China’s Largest Freshwater Lake


1
School of Geography and Tourism, Anhui Normal University, Wuhu 241003, China
2
Engineering Technology Research Center of Resources Environment and GIS, Wuhu 241003, China
3
Key Laboratory of Watershed Geographic Sciences, Nanjing Institute of Geography and Limnology, Chinese Academy of Sciences, Nanjing 210008, China
*
Authors to whom correspondence should be addressed.
Water 2019, 11(7), 1469; https://doi.org/10.3390/w11071469
Submission received: 2 June 2019
/
Revised: 12 July 2019
/
Accepted: 12 July 2019
/
Published: 16 July 2019
(This article belongs to the Special Issue Wetland Ecohydrology and Water Resource Management)
Abstract
:A recent dramatic decline in water level during the dry season in China’s largest freshwater lake (Lake Poyang) significantly influenced water availability and biogeochemical processes. To learn the potential causes of water level decline, this study investigated the hydrodynamic response to bathymetric changes during three typical hydrological years by scenario simulation using Environmental Fluid Dynamics Code (EFDC). The simulation results indicated that bathymetric changes resulted in a water level decrease during a low water level period. Inter-annual variation in the decrease rate implied that water level in typical dry and wet years were influenced more significantly than that in moderate hydrological years. A spatial gradient in the distribution of water level changes was also observed, which was mainly concentrated in the main channel. Water velocities also slowed down, weakly corresponding to the decrease in water level during the low water level period. Overall, bathymetric changes caused by sand mining contributed to water level and velocity variations, influencing the stability and sustainability of the lake ecosystem. This study can potentially enhance our understanding of the hydrodynamic processes in Lake Poyang and support water resource management.
1. Introduction
Lake Poyang, the largest freshwater lake in China, plays an important role in water storage, transportation, and ecological maintenance [1,2]. Hydrodynamic conditions in Lake Poyang are associated with the ecological evolution of and biogeochemical processes in aquatic ecosystems. Influenced by a combination of climate, the Yangtze River, sub-tributaries, and man-made projects, the water level variations differ from other enclosed lakes or semi-closed lakes [3]. The water level fluctuation is closely related to drought and flood occurrence and frequency [4], water quality deterioration [5], phytoplankton biomass and distribution [6,7], wetland exploitation and conservancy [8].
The water level of Lake Poyang has a large seasonal fluctuation of around 10 m. During the wet season, the associated water surface area creates extensive wetland ecosystems across an ephemeral region of approximately 3000 km2 [9]. Until the dry season, the lake recedes into shallow depressions and channels, turning into a river-like lake. There is also a large fluctuation in the inter-annual water level, and the probability of having a year with a low water level is higher than a year with a high water level [10]. Owing to the inter-annual fluctuation, Lake Poyang Basin frequently faces extremely high and low water level events, especially in recent decades. Devastating floods occurred in 1954, 1983, 1995, 1998, 1999, and 2010 [11,12], and extreme drought in 1963, 1978, 2006, 2007, 2009, and 2011 [13]. These severe water events raised concerns for hydrodynamic researchers, especially the continually decreasing water level during the dry season in recent years, threating water storage and depuration, and habitat stability [14,15].
Previous studies have explored the reasons for the extremely low water level during the dry season in Lake Poyang. Ye et al. [16] found that, in the context of global climate change and local anthropogenic stresses, many regions of the world, including Lake Poyang, have suffered from frequent droughts in recent decades. Zhang et al. [9] demonstrated that changes caused by the Three Gorges Dam had a significantly greater impact on the seasonal (September to October) dryness of Lake Poyang than the impacts of climate variability on the lake catchment [17,18,19]. However, these studies have not demonstrated that these changes are the primary causes for the extremely low lake level in recent years [1]. Lai et al. [1] proposed that the dramatic decline of the water level during the dry season coincided with the decline of the outflow channel caused by sand mining, particularly after sand mining was banned on the main stream of the Yangtze River in 2001. Jiang et al. [20] showed that sand mining affected the hydrologic regimes and increased the areas of water discharge. Mei et al. [21] also showed that human activities, including local sand mining, aggravated the lake recession crisis. However, quantitative analysis of the spatial and temporal responses of hydrodynamic conditions to the bathymetric changes is still insufficient.
The physics-based models are quantitative and scientific methods of analyzing the hydrodynamic processes in water bodies, including lakes, rivers, and reservoirs. Environmental Fluid Dynamics Code (EFDC) has been widely applied, with study areas including Lake Poyang [5,13,22,23], Lake Tai [24], Lake Chaohu [25,26], Lake Dianchi [27], Lake Fuxian [28], Lake Daoxiang [29], the Changtan Reservoir [30], the Shenzhen Reservoir [31], Morro Bay [32], Kwang-Yang Bay [32], Blackstone River [33], and the St. Lucie Estuary [34]. MIKE SHE is another physically distributed modelling system that has been adopted in many water bodies, including Lake Poyang [35,36,37], Lake Yangchen [38], Lake Trichonis [39], the Karup catchment [40], the Florida Everglades [41,42], the Faroe–Shetland Channel [43], and the Senegal River Basin [44]. In addition, a 2D lake hydrodynamic model developed by Huang et al. [45], has been successfully applied in Lake Poyang and Lake Tai for short-time forecasting. These studies have proved that hydrodynamic mechanistic models are efficient and practical tools for simulating and investigating hydrodynamic processes. EFDC and MIKE SHE are both widely used models for lakes, and EFDC has been repeatedly used in Lake Poyang [5,23,46]. Thus, the hydrodynamic parameters of Lake Poyang have been calibrated repeatedly, providing valuable reference for hydrodynamic modelling in the present study. Furthermore, considering the existing data sources and the convenience of combining the model with self-developed modules, EFDC was utilized to model the impacts of bathymetric changes on water level in Lake Poyang.
In this paper, we investigated the effects of bathymetric changes caused by sand mining on the hydrodynamic conditions in the typical wet, dry, and moderate hydrological years in Lake Poyang. We specifically (1) described how the EFDC model simulated the hydrodynamic conditions in different typical hydrological years, (2) identified the bathymetric change scenarios that were suitable and reasonable for abstraction in modelling, and (3) determined the probable impacts of bathymetric changes on the hydrodynamic conditions.
2. Data and Methods
2.1. Study Area
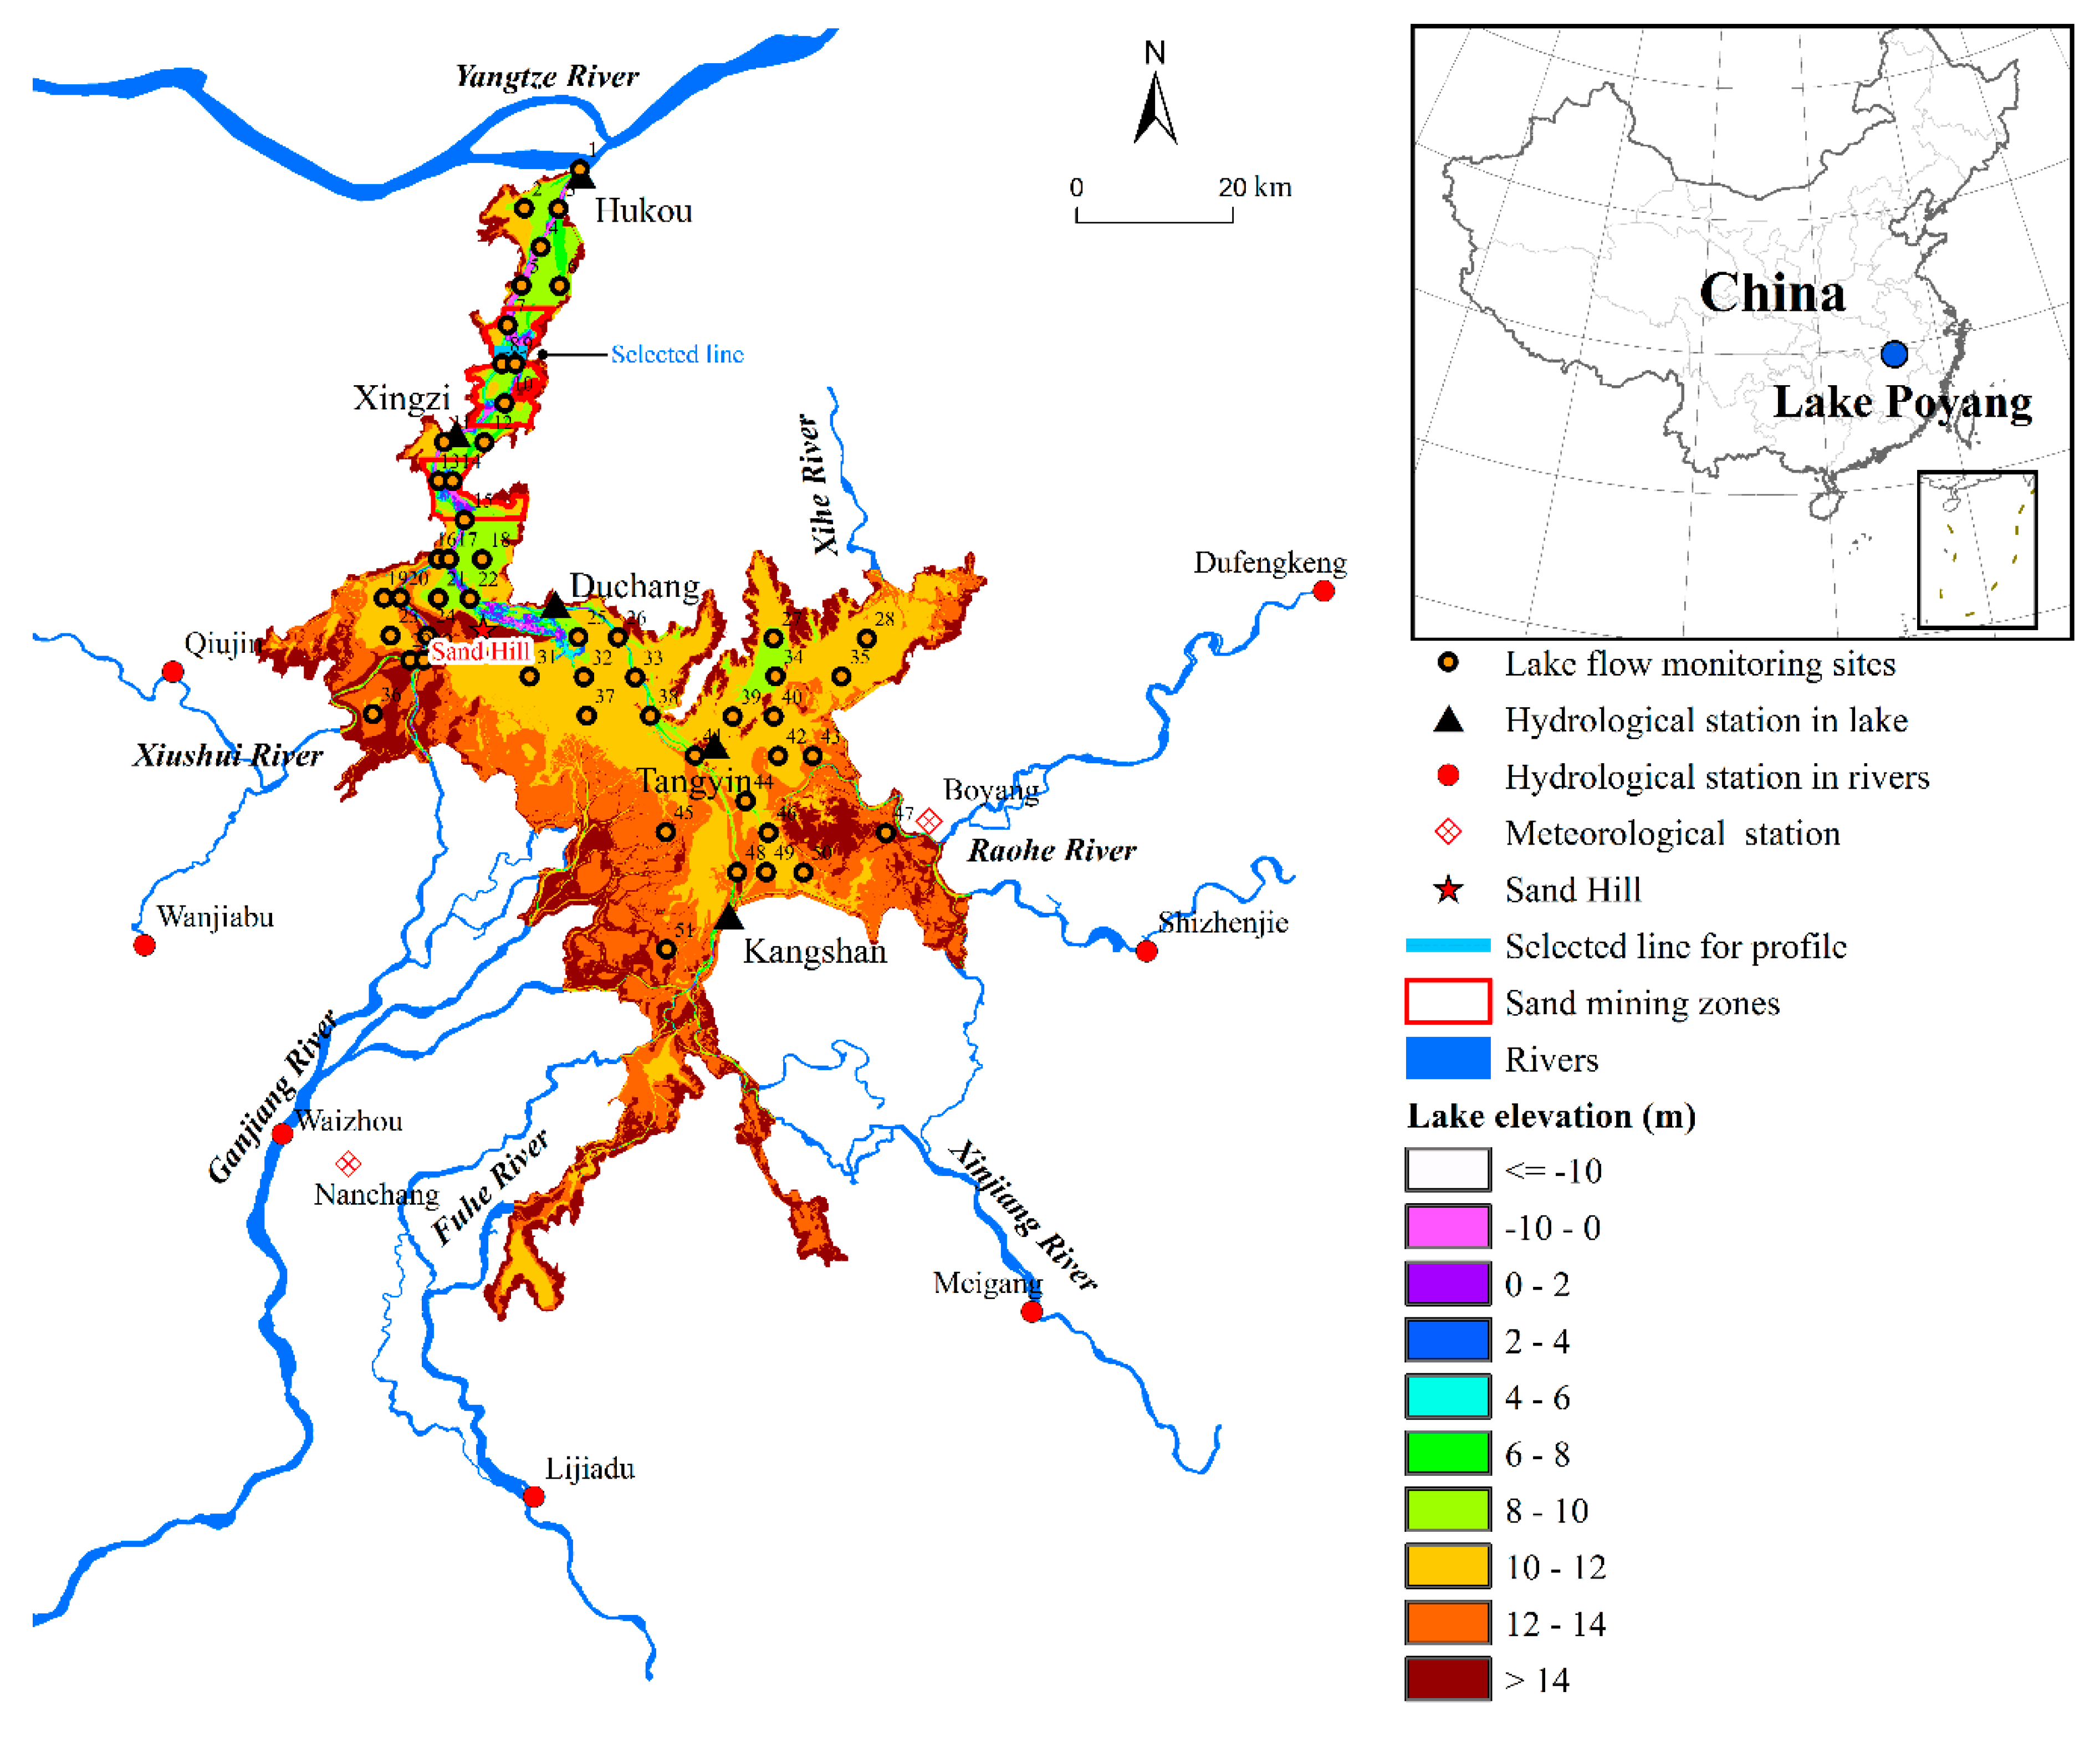
Lake Poyang (28°24′ N–29°46′ N, 115°49′ E–116°46′ E) is located at the north end of Jiangxi Province and on the south bank of the Yangtze River. It spans 170 km from north to south and as much as 74 km from east to west [15]. The lake receives five major inflows, namely, the Xiushui, Ganjiang, Fuhe, Xinjiang, and Raohe Rivers, and one outflow connected to Yangtze River through a narrow channel (Figure 1). The annual inflow entering the Yangtze River from Lake Poyang is 1.4 × 10¹¹ m3, accounting for 15.6% of the total annual discharge of the main stream of Yangtze River [15]. The lake has a mean hydraulic retention time of 20.9 days [47]. Its water level fluctuates dramatically throughout the year, and the average, maximum, and minimum values of water level monitored at hydrological stations range between 13.27 and 15.27, 20.43 and 20.59, and 5.90 and 11.97 m above sea level, respectively (Wusong datum) from 1956 to 2005. The water level generally rises from January until its peak at around July and then declines gradually [48,49]. Lake Poyang Basin has a subtropical monsoon climate with a mean annual precipitation of 1542 mm and evaporation of 1170 mm. Approximately 69.4% of the annual rainfall occurs between April and September [50].
2.2. Data Collection
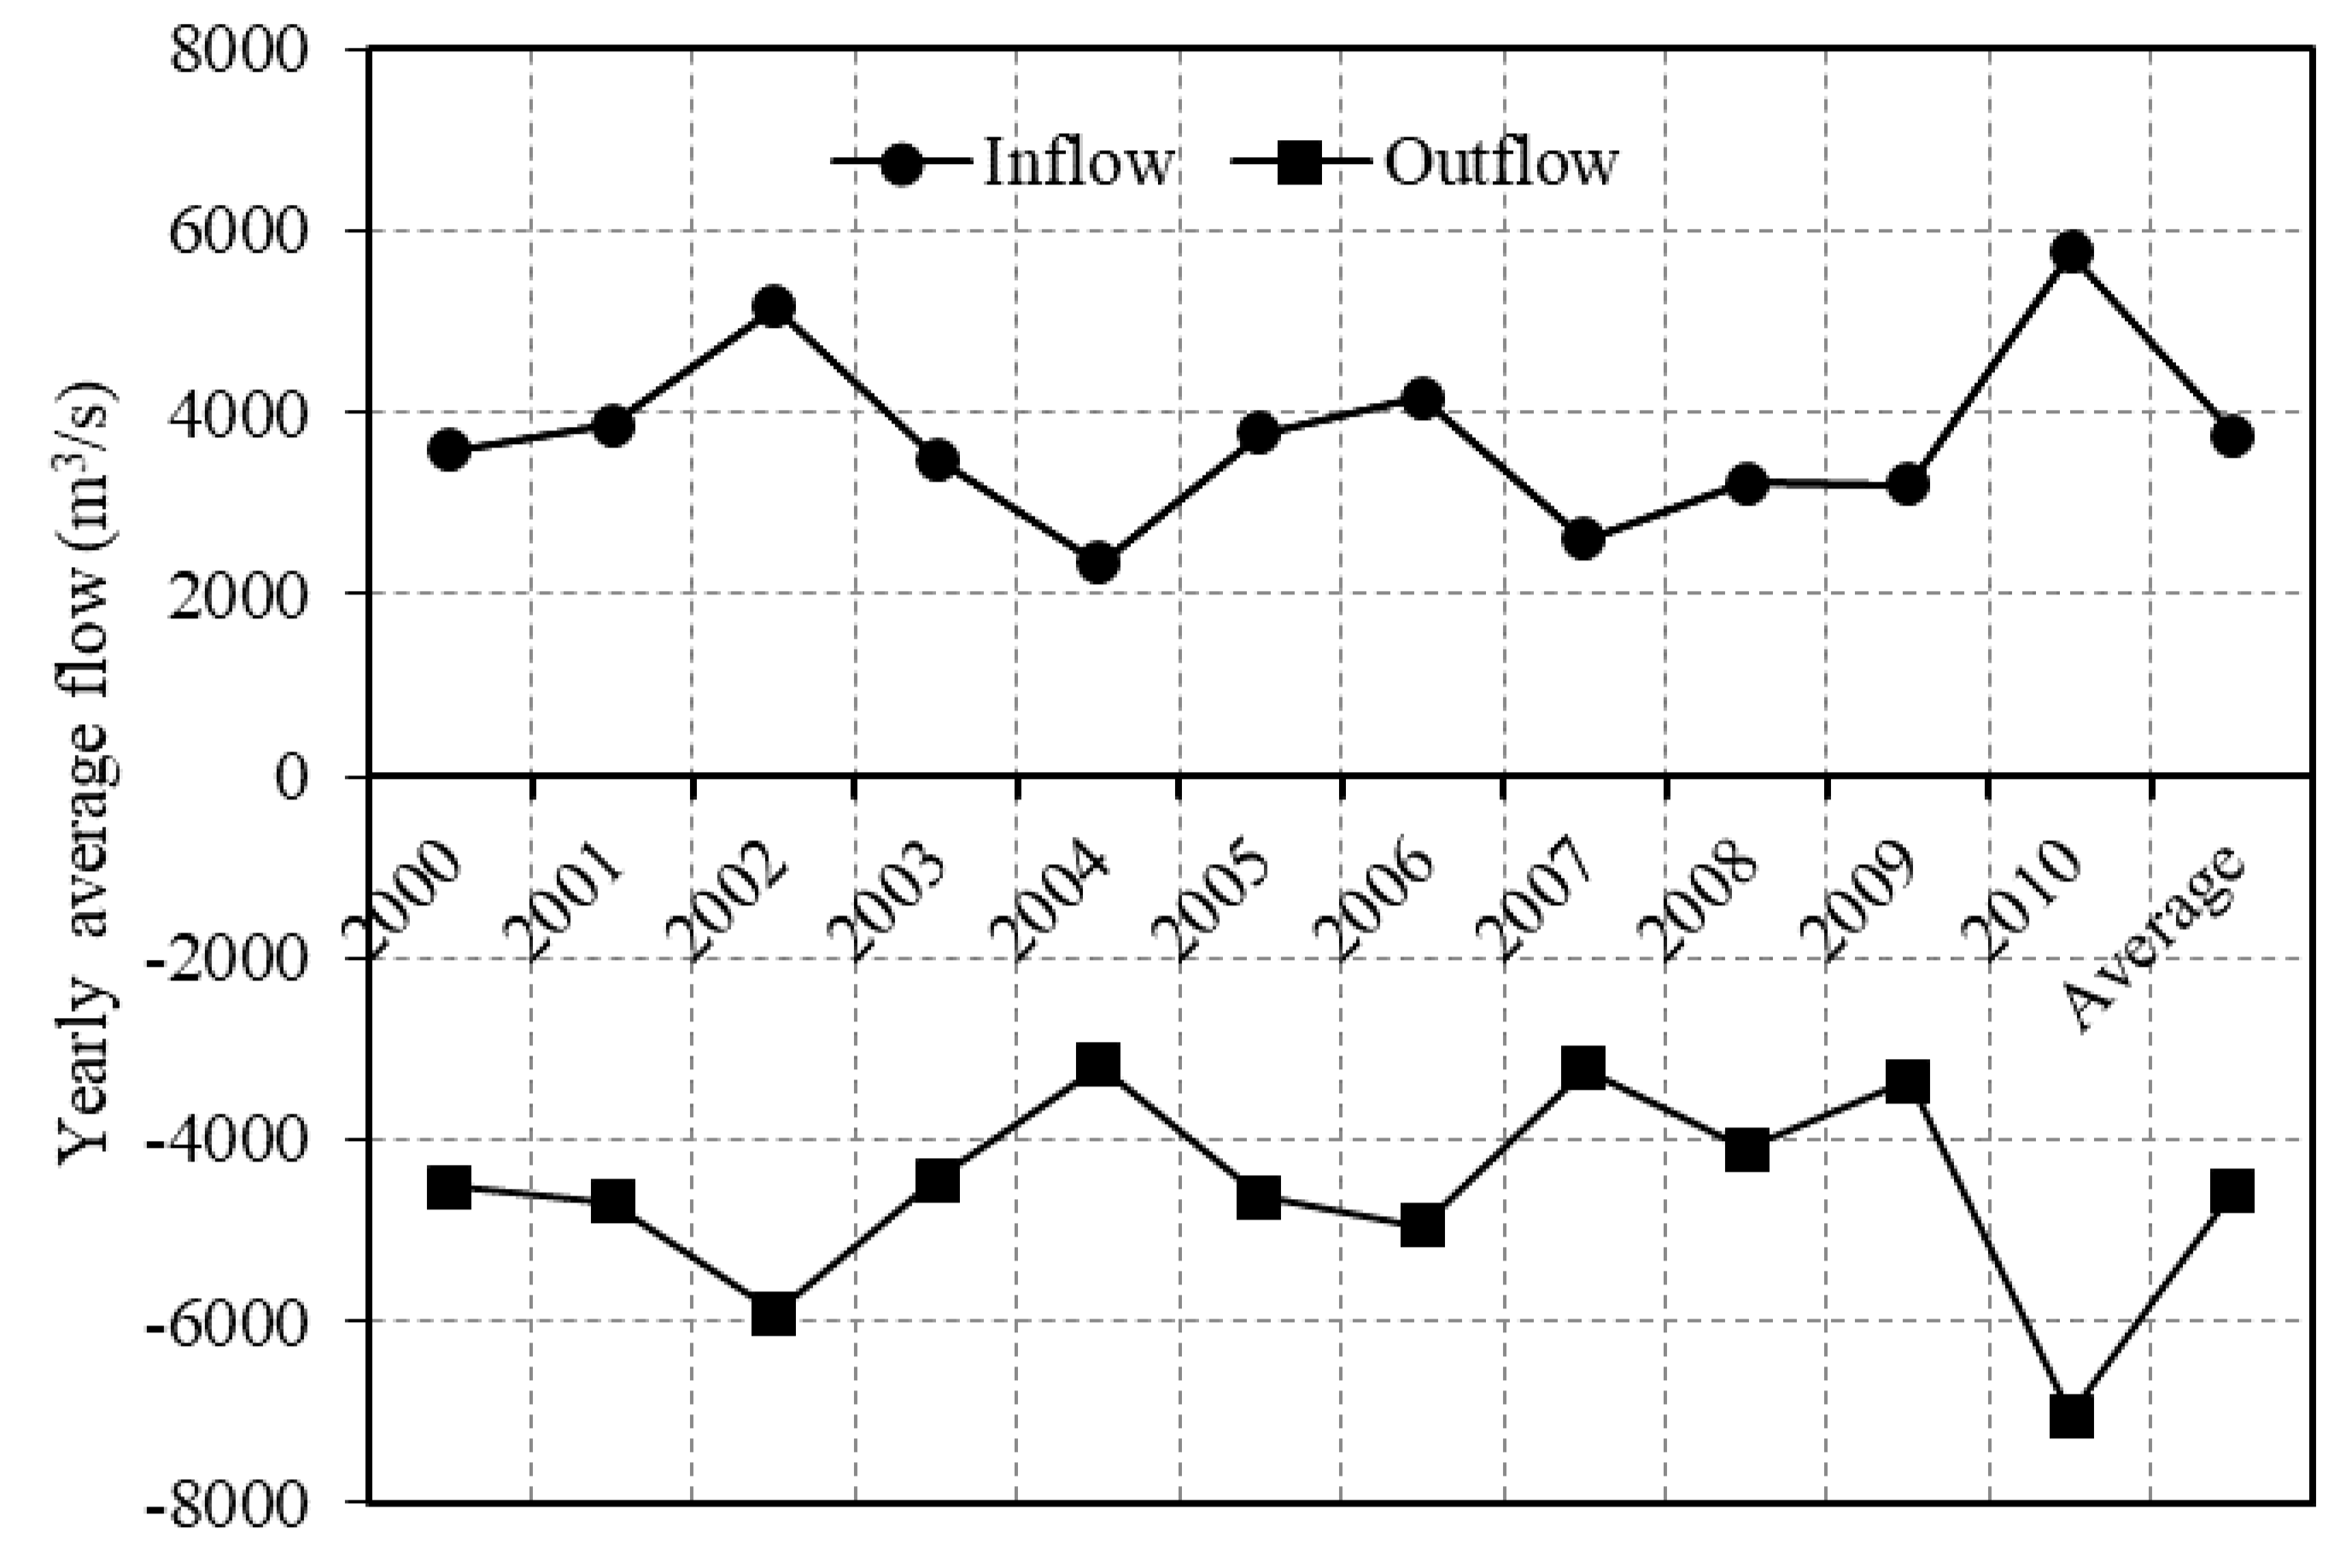
The yearly average inflow in the past decade (2000–2010) varied from 2347 to 5759 m3/s with an average of 3743 m3/s. The tendency of outflow discharge monitored at Hukou station was consistent with the inflow and varied from −3176 to −7031 m3/s with an average of −4546 m3/s (Figure 2). The year 2010 was proposed as a typical wet hydrological year because of the obvious large inflow and outflow. By contrast, the inflow and outflow in 2004 were considerably smaller than in the other years. Thus, 2004 was identified as a typical dry hydrological year. The outflow discharge was moderate and close to the average value during that decade; thus, 2000 was selected as the baseline hydrological year. The Changjiang Water Resources Commission has also defined the above three years as typical dry, wet, and moderate hydrological years [22].
The hydrodynamic model of Lake Poyang was constructed based on EFDC to simulate the hydrodynamic conditions of three typical hydrological years. Meteorological, hydrological, and bathymetric data were applied in the hydrodynamic model, and the explicit items are listed in Table 1.
Meteorological data were collected from the national meteorological stations of Boyang (No. 58519) and Nanchang (No. 58606). Eight meteorological parameters were included, i.e., precipitation (PR, mm), evaporation (EVP, mm), atmospheric pressure (PATM, hPa), dry bulb temperature (T, °C), relative humidity (RH, %), incident solar short-wave radiation (SOLSWR, MJ/m2), wind speed (WS, m/s), and wind direction (WD, °). Precipitation data were also used to calculate the amount of interval runoff. This runoff should be considered because the hydrological stations of inflows were not located exactly on the estuaries and the ratio was up to 12%. The interval runoff was calculated as follows [51]:
where Qi is the interval runoff of the hydrological station i, Ac and Ad are the respective sub-basin catchment and drainage areas of hydrological station i, r is the runoff coefficient calculated through the water balance of inflow and outflow from 2000 to 2010, and p is the precipitation of Boyang or Nanchang station determined by the distance between the hydrological and meteorological stations.
Qi = (Ac − Ad) × r × p
Hydrological data included the discharge (Q, m3/s) of the five main inflows (i.e., Xiushui River, Ganjiang River, Fuhe River, Xinjiang River, and Raohe River) and the two small inflows (i.e., Xihe River and Boyanghe River). Discharge data of inflows were recorded at various hydrological gauging stations, as listed in Figure 1. Given the relatively small discharge and proximity of Boyanghe River to Xiushui River, the discharge from this river was incorporated into the runoff of Xiushui River. Water level (WL, m) was obtained at the Hukou hydrological gauging stations in Lake Poyang (Figure 1).
The bathymetry of Lake Poyang was a digital elevation model (DEM) acquired by the Water Resources Department of Jiangxi Province in 2010. High spatial resolution was required to discrete real terrain because of the complex bathymetry and significant elevation variability. However, redundant grids can increase the instability and running cost of the model. Thus, this DEM was finally resampled from its initial 5 × 5 m resolution to 250 × 250 m for modelling. Based on the software of Delft3D, a square grid with 250 × 250 m resolution was used to discretize the lake area, thereby producing 47,575 cells.
2.3. Model Description
EFDC was originally developed at the Virginia Institute of Marine Science (VIMS) and the School of Marine Science of the College of William and Mary, by Dr. John M. Hamrick, beginning in 1988. The EFDC is a public-domain, open-source, surface water modelling system that includes hydrodynamics, sediment, contaminant, and water quality modules fully integrated in a single source-code implementation [51]. EFDC has been applied to more than 100 water bodies including rivers, lakes, reservoirs, wetlands, estuaries, and coastal ocean regions and satisfies environmental assessment, management, and regulatory requirements. Hydrodynamic formulas for vertically hydrostatic momentum and continuity of EFDC are solved in a coordinate system that is curvilinear and orthogonal in the horizontal direction and a stretched or topography-free surface in the vertical direction. The momentum and continuity equations of the EFDC model are provided in published studies [51].
2.4. Hydrodynamic Modelling
The simulation periods ranged from 1 January to 31 December in 2000, 2004, and 2010. Due to the spatial distribution of water level during the dry season and the improving stability and accuracy of EFDC, the hydrodynamic model of Lake Poyang was initialized with a uniform high water level. Specifically, the model ran earlier than January 1 of each hydrological year for initialization and pre-heating. The boundary data were completed as the driving forces. The atmospheric boundary conditions of Lake Poyang include the daily data on precipitation, evaporation, atmospheric pressure, air temperature, relative humidity, solar radiation, wind speed, wind direction, and cloud cover (Table 1). The hydrodynamic boundary conditions comprise the upstream and downstream hydrodynamic boundaries. The daily discharge and supplied interval runoff were configured as the upstream hydrodynamic boundary conditions, whereas the daily lake level collected at Hukou hydrological station was configured as the downstream hydrodynamic boundary condition, functioning continuously throughout the simulation period.
A 2D hydrodynamic model was used to simulate the vertically averaged water velocity of Lake Poyang, and the vertical stratification was disregarded. Water mixes well in Lake Poyang because of its shallow depth, extensive area, and frequent river–lake exchange. Inflow/outflow is the primary water current category in Lake Poyang, which is a river-dominated lake. Thus, more substantial variations in hydrodynamic parameters can be observed in the horizontal scale than in the vertical scale. Parameter KC, which represents the number of layers, was consequently set to one [51].
The water level of Lake Poyang fluctuates significantly, resulting in frequent alternation of wet/dry in the majority of the lake area. Hence, a dry/wet facility was established to deal with the moving boundaries, and ISDRY was active. Two parameters, HDRY and HWET, were set to 0.05 and 0.1 m respectively to manage the reactivation of cells during the dry and wet cycles. To ensure stability and improve computational efficiency, the dynamic time step was set from 7 s to 100 s. The period when water level was low or declined rapidly required a long simulation time and time step. The simulation results were visualized based on a spatiotemporal visualization component of iLake [45,52].
2.5. Estimate of the Lake’s Bathymetric Changes
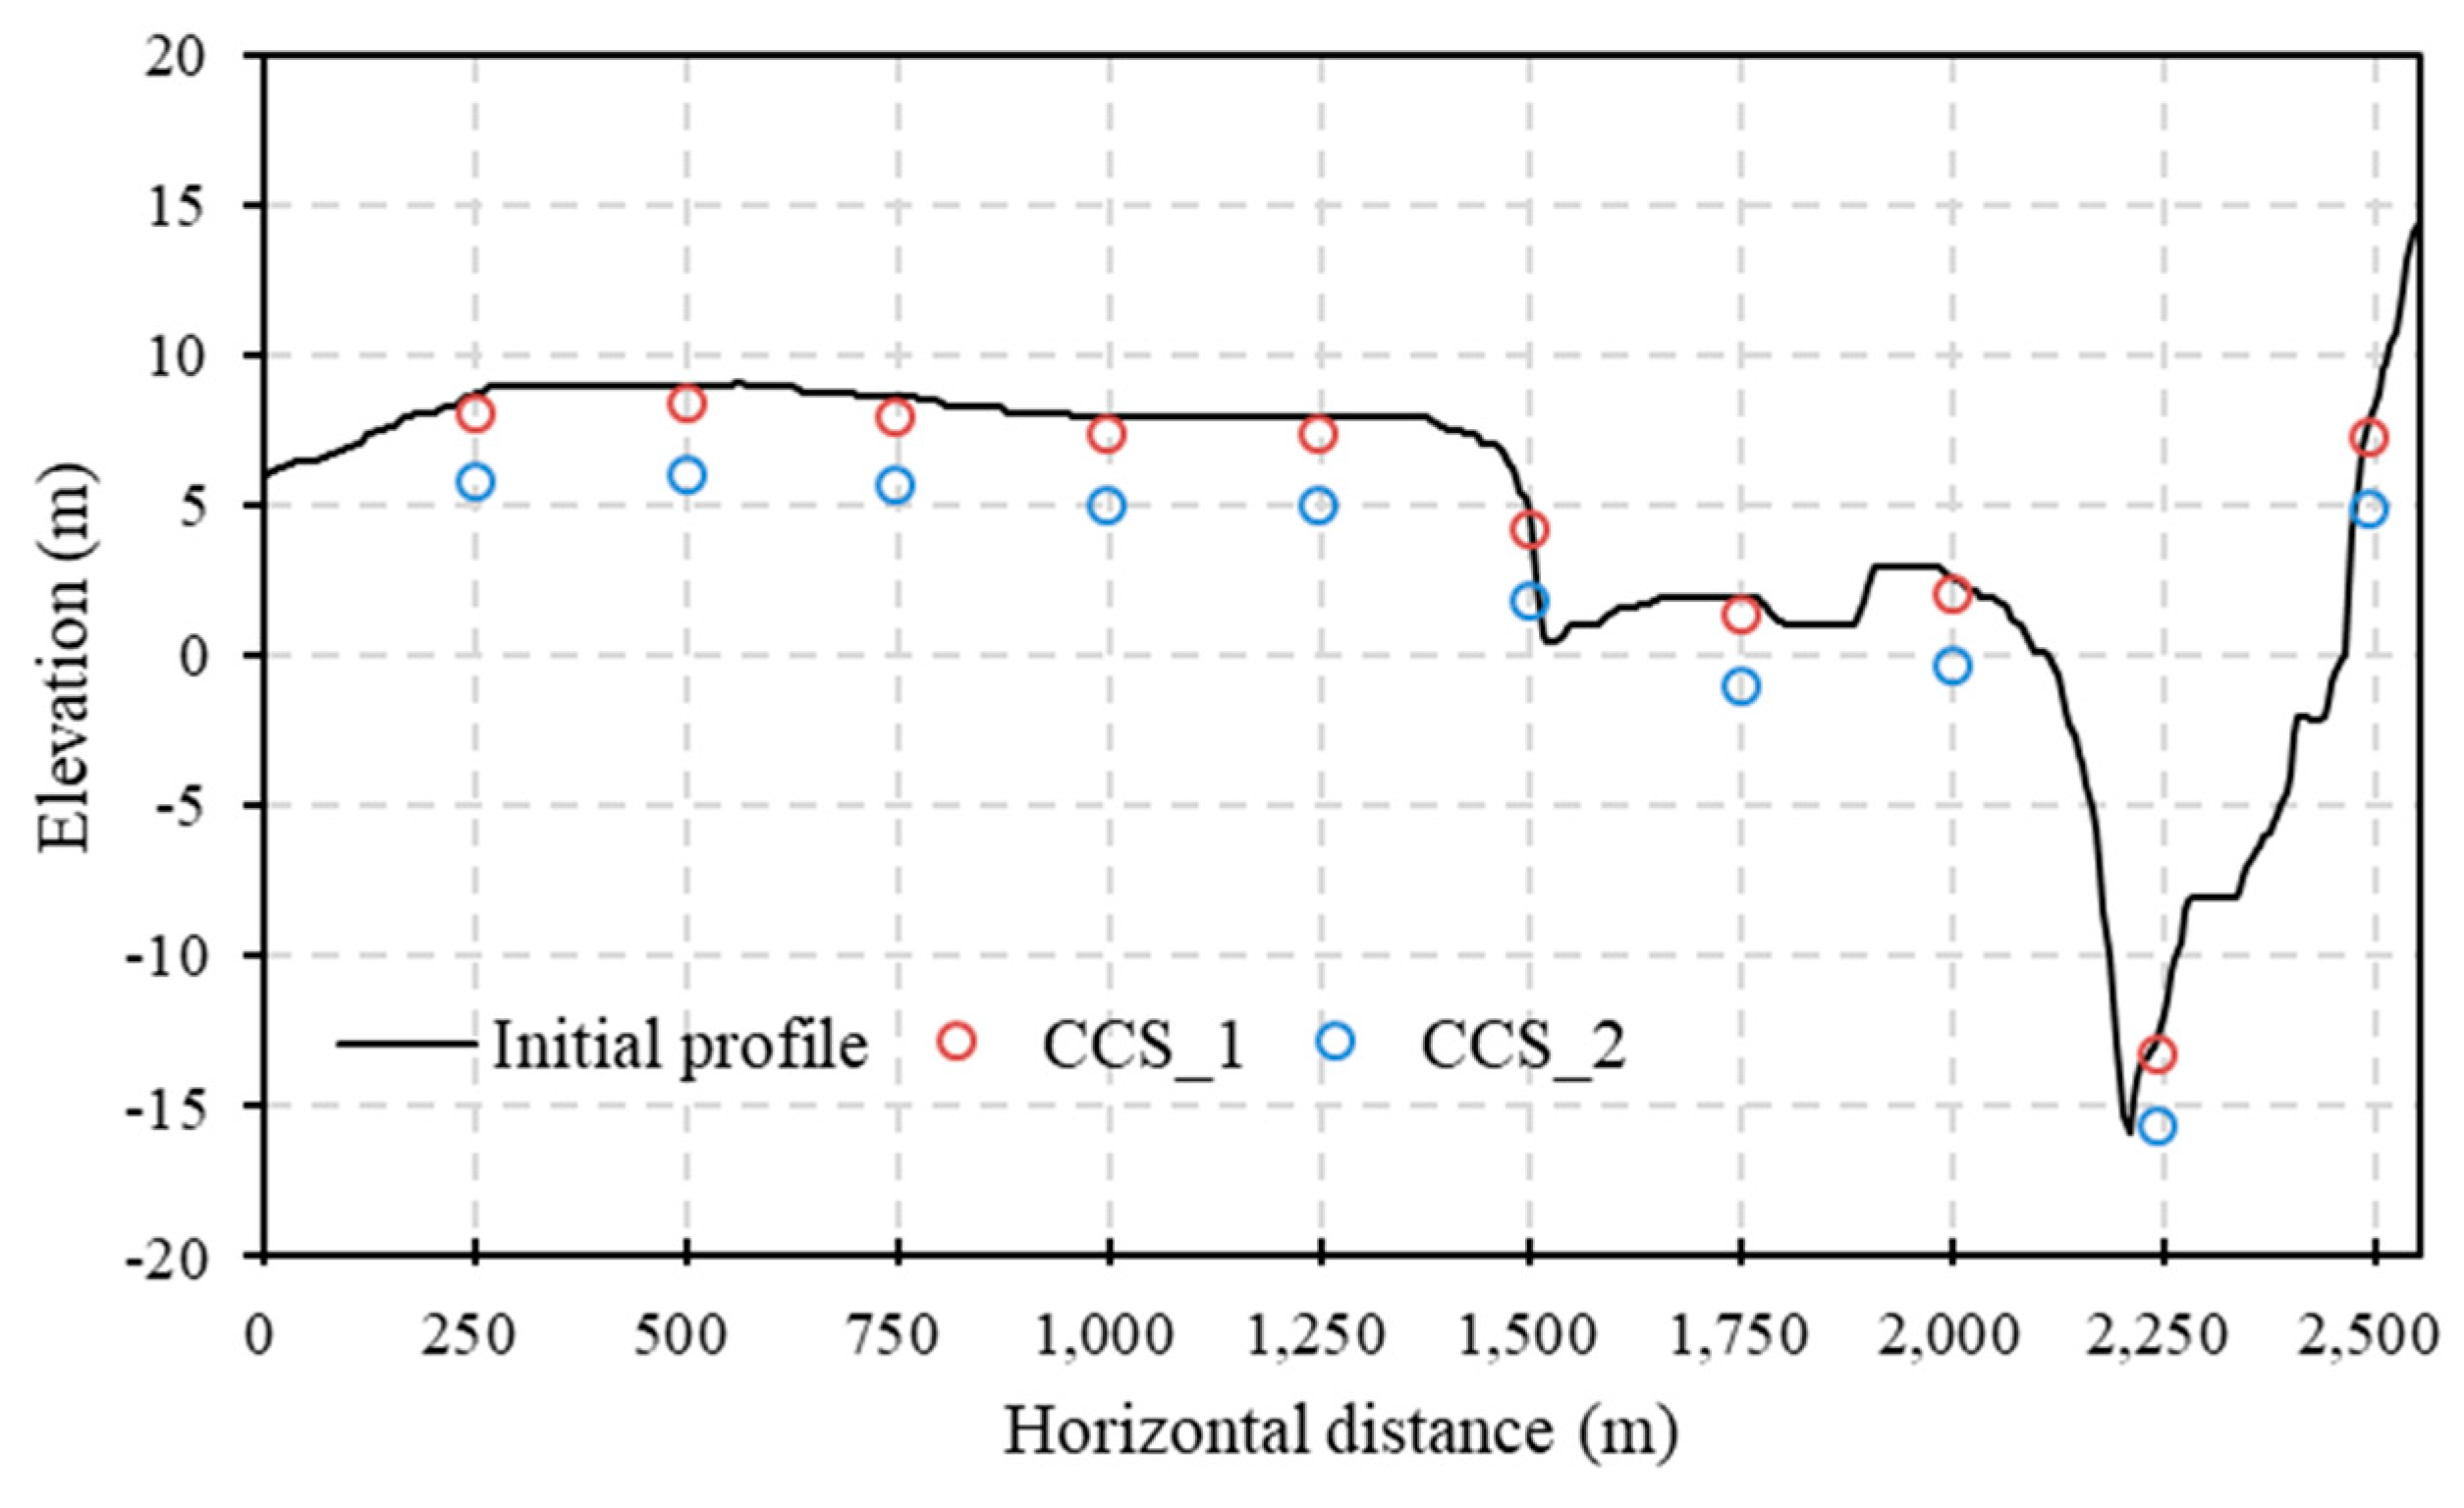
The dramatic change of the Lake Poyang channel coincides with the initiation of widespread sand mining. Sand mining generally occurred in the area around Sand Hill and within the Hukou Waterway immediately to the north [1]. Based on the remote sensing data, with the corresponding Lake Poyang water level and channel surface area from 2002 to 2014, channel change, since the initiation of extensive sand mining, was concentrated in two quarries around the south and north of Xingzi along the Hukou Waterway [1]. In this study, because of the limited resolution of the grid and the time cost of model running, the range of channel change was further generalized to the two red areas along the waterway, with an area of 93.15 km2 (about 1490 grids) and 51.02 km2 (about 816 grids), respectively (Figure 1). In addition, Leeuw et al. [53] had estimated that the volume of sand mining since 2001 lowered the channel bed of the Hukou Waterway by an average of 59 cm/year. Therefore, two bathymetric change scenarios, labelled as CCS_1 (average annual channel change scenario) and CCS_2 (high channel change scenario), were proposed for three typical hydrological years to study the response of the hydrodynamic process. The vertical bed declination in the two sand mining zones was expected to reach 59 and 295 cm (59 cm/year × 5 year), which respectively represent the average annual change speed (about 0.85 km3) and probable change after five years (about 4.25 km3). The vertical profile of a selected line in Figure 1 had been displayed to show the bathymetric change (Figure 3). Based on the two scenarios of the three typical hydrological years, nine simulations were built and compared with three baseline hydrodynamic models of typical years to illustrate the responses of hydrodynamic conditions of the different typical years to bathymetric changes (Table 2).
3. Results
3.1. Calibration of the Hydrodynamic Model
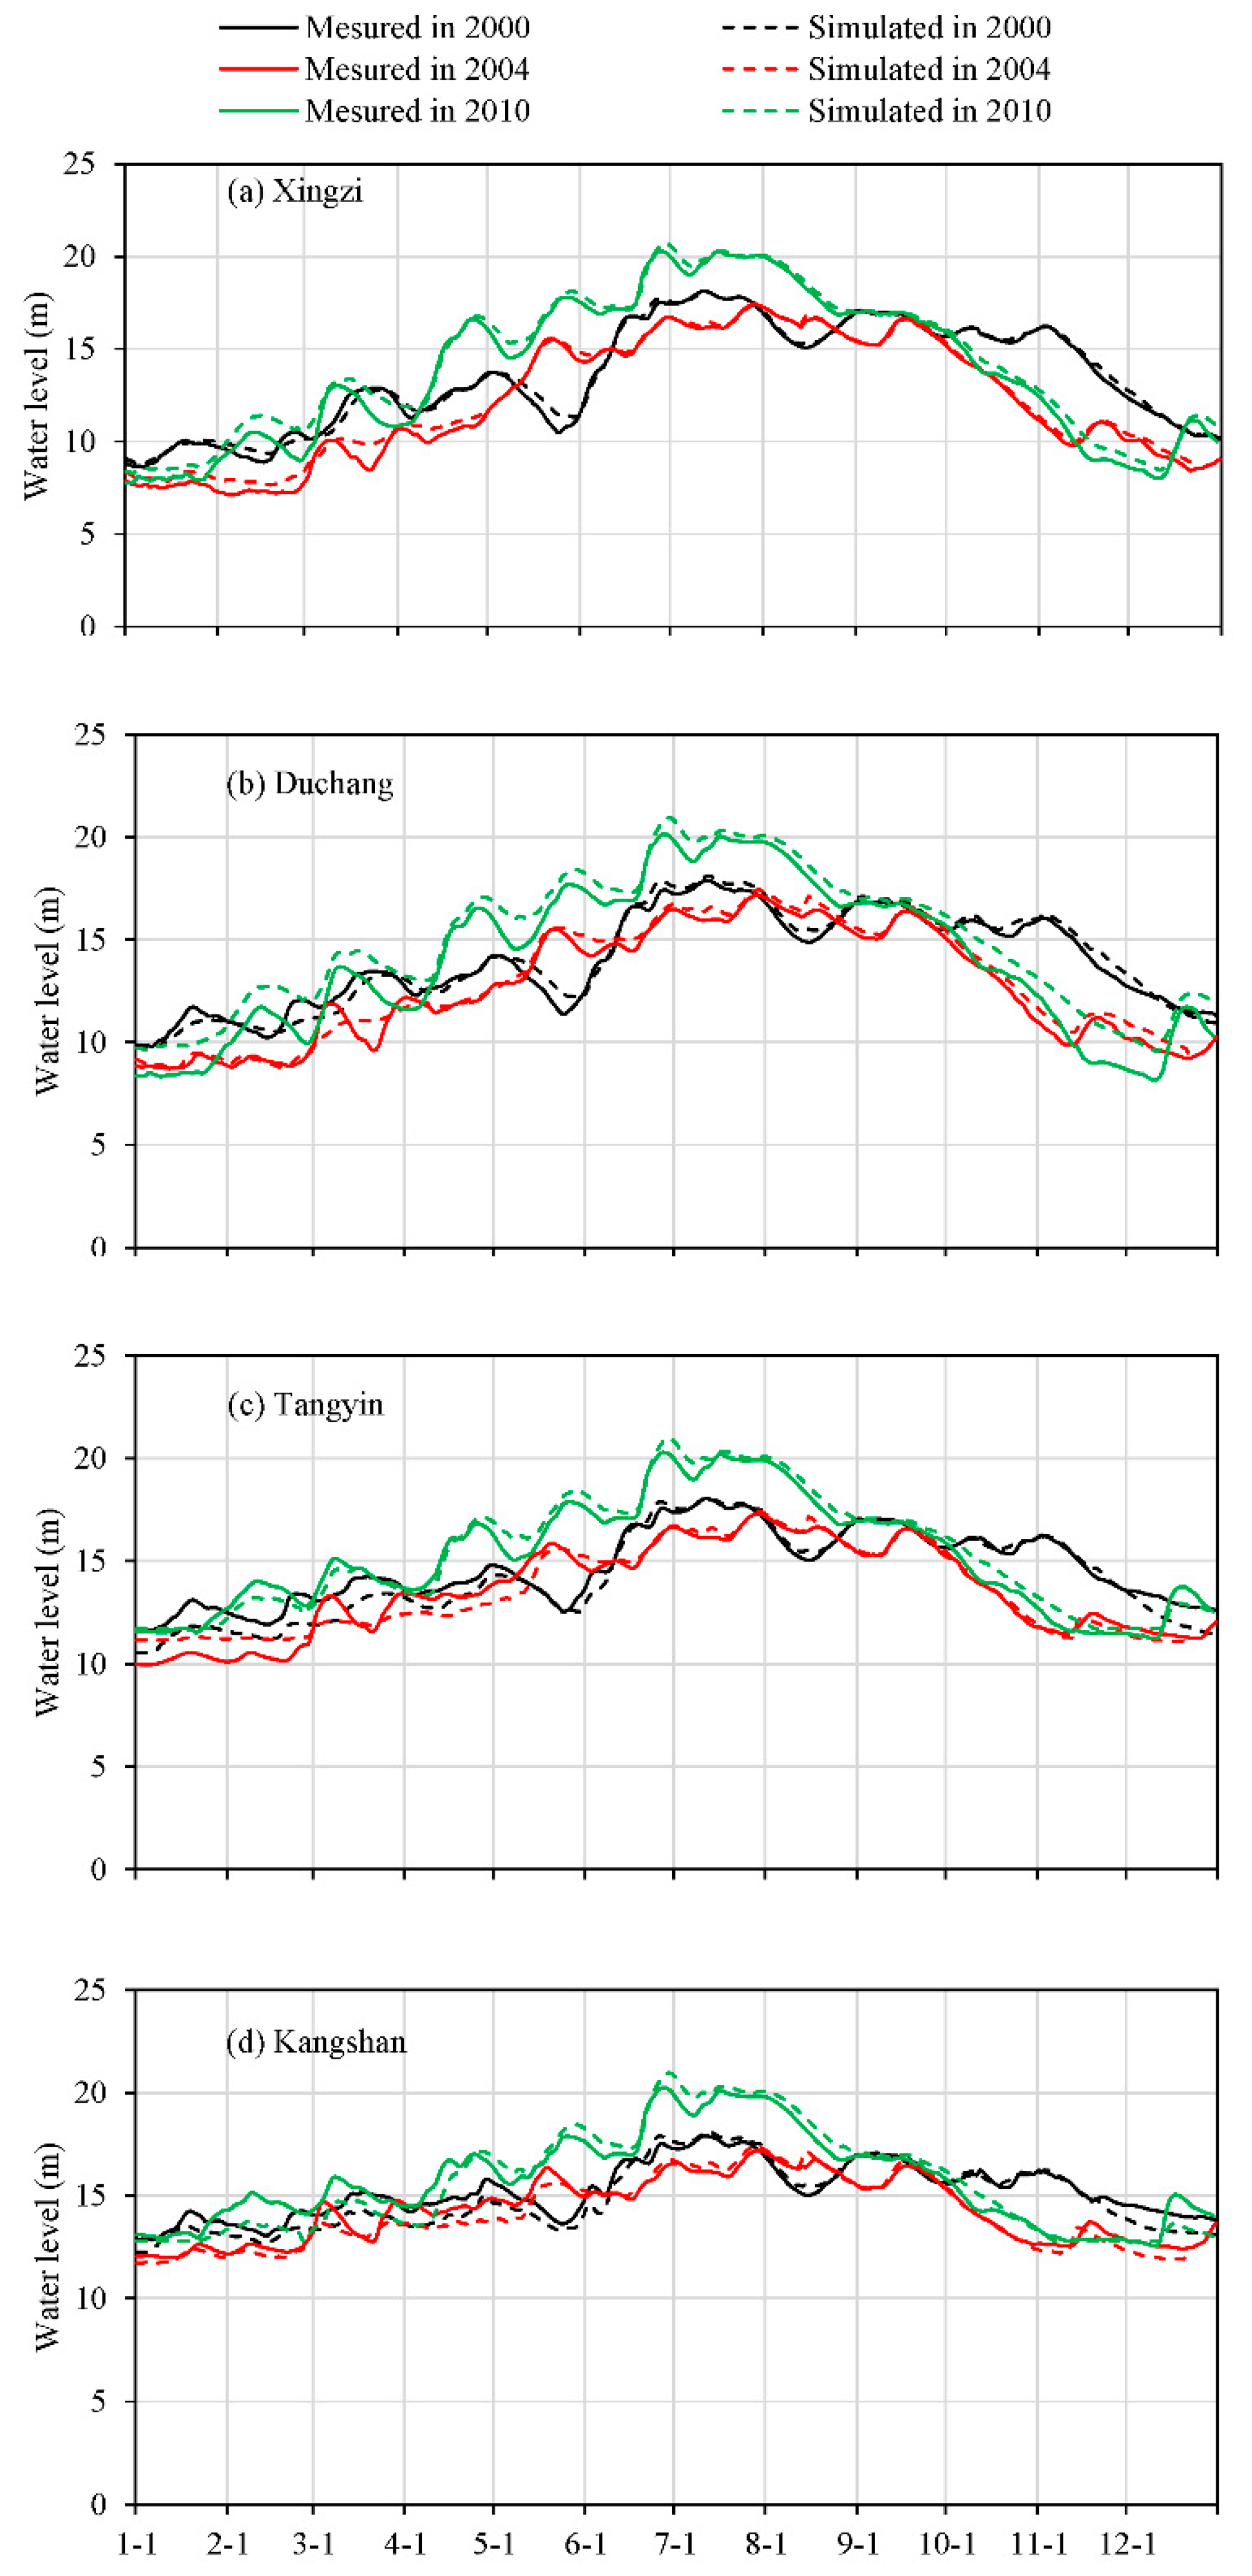
A comparison between simulations and observations were conducted to show that the adopted hydrodynamic model reasonably reflected the changes in water level variations in Lake Poyang (Figure 4). In addition, error indicators were calculated to test if the simulations suggested good agreement. Table 3 shows the error indicators and definition, including mean absolute error (MAE), root mean square error (RMSE), determination coefficient (R2), and mean relative error (MRE) for the three hydrological years throughout the calibration periods. These indicator values ranged between 0.19 and 0.92, 0.27 and 1.00, 0.94, and 0.99, 0.02 and 0.07, respectively, indicating a reasonable accuracy. These results proved that the model was able to capture the variation in the water level of Lake Poyang.
3.2. Contributions of Bathymetric Changes to Water Level
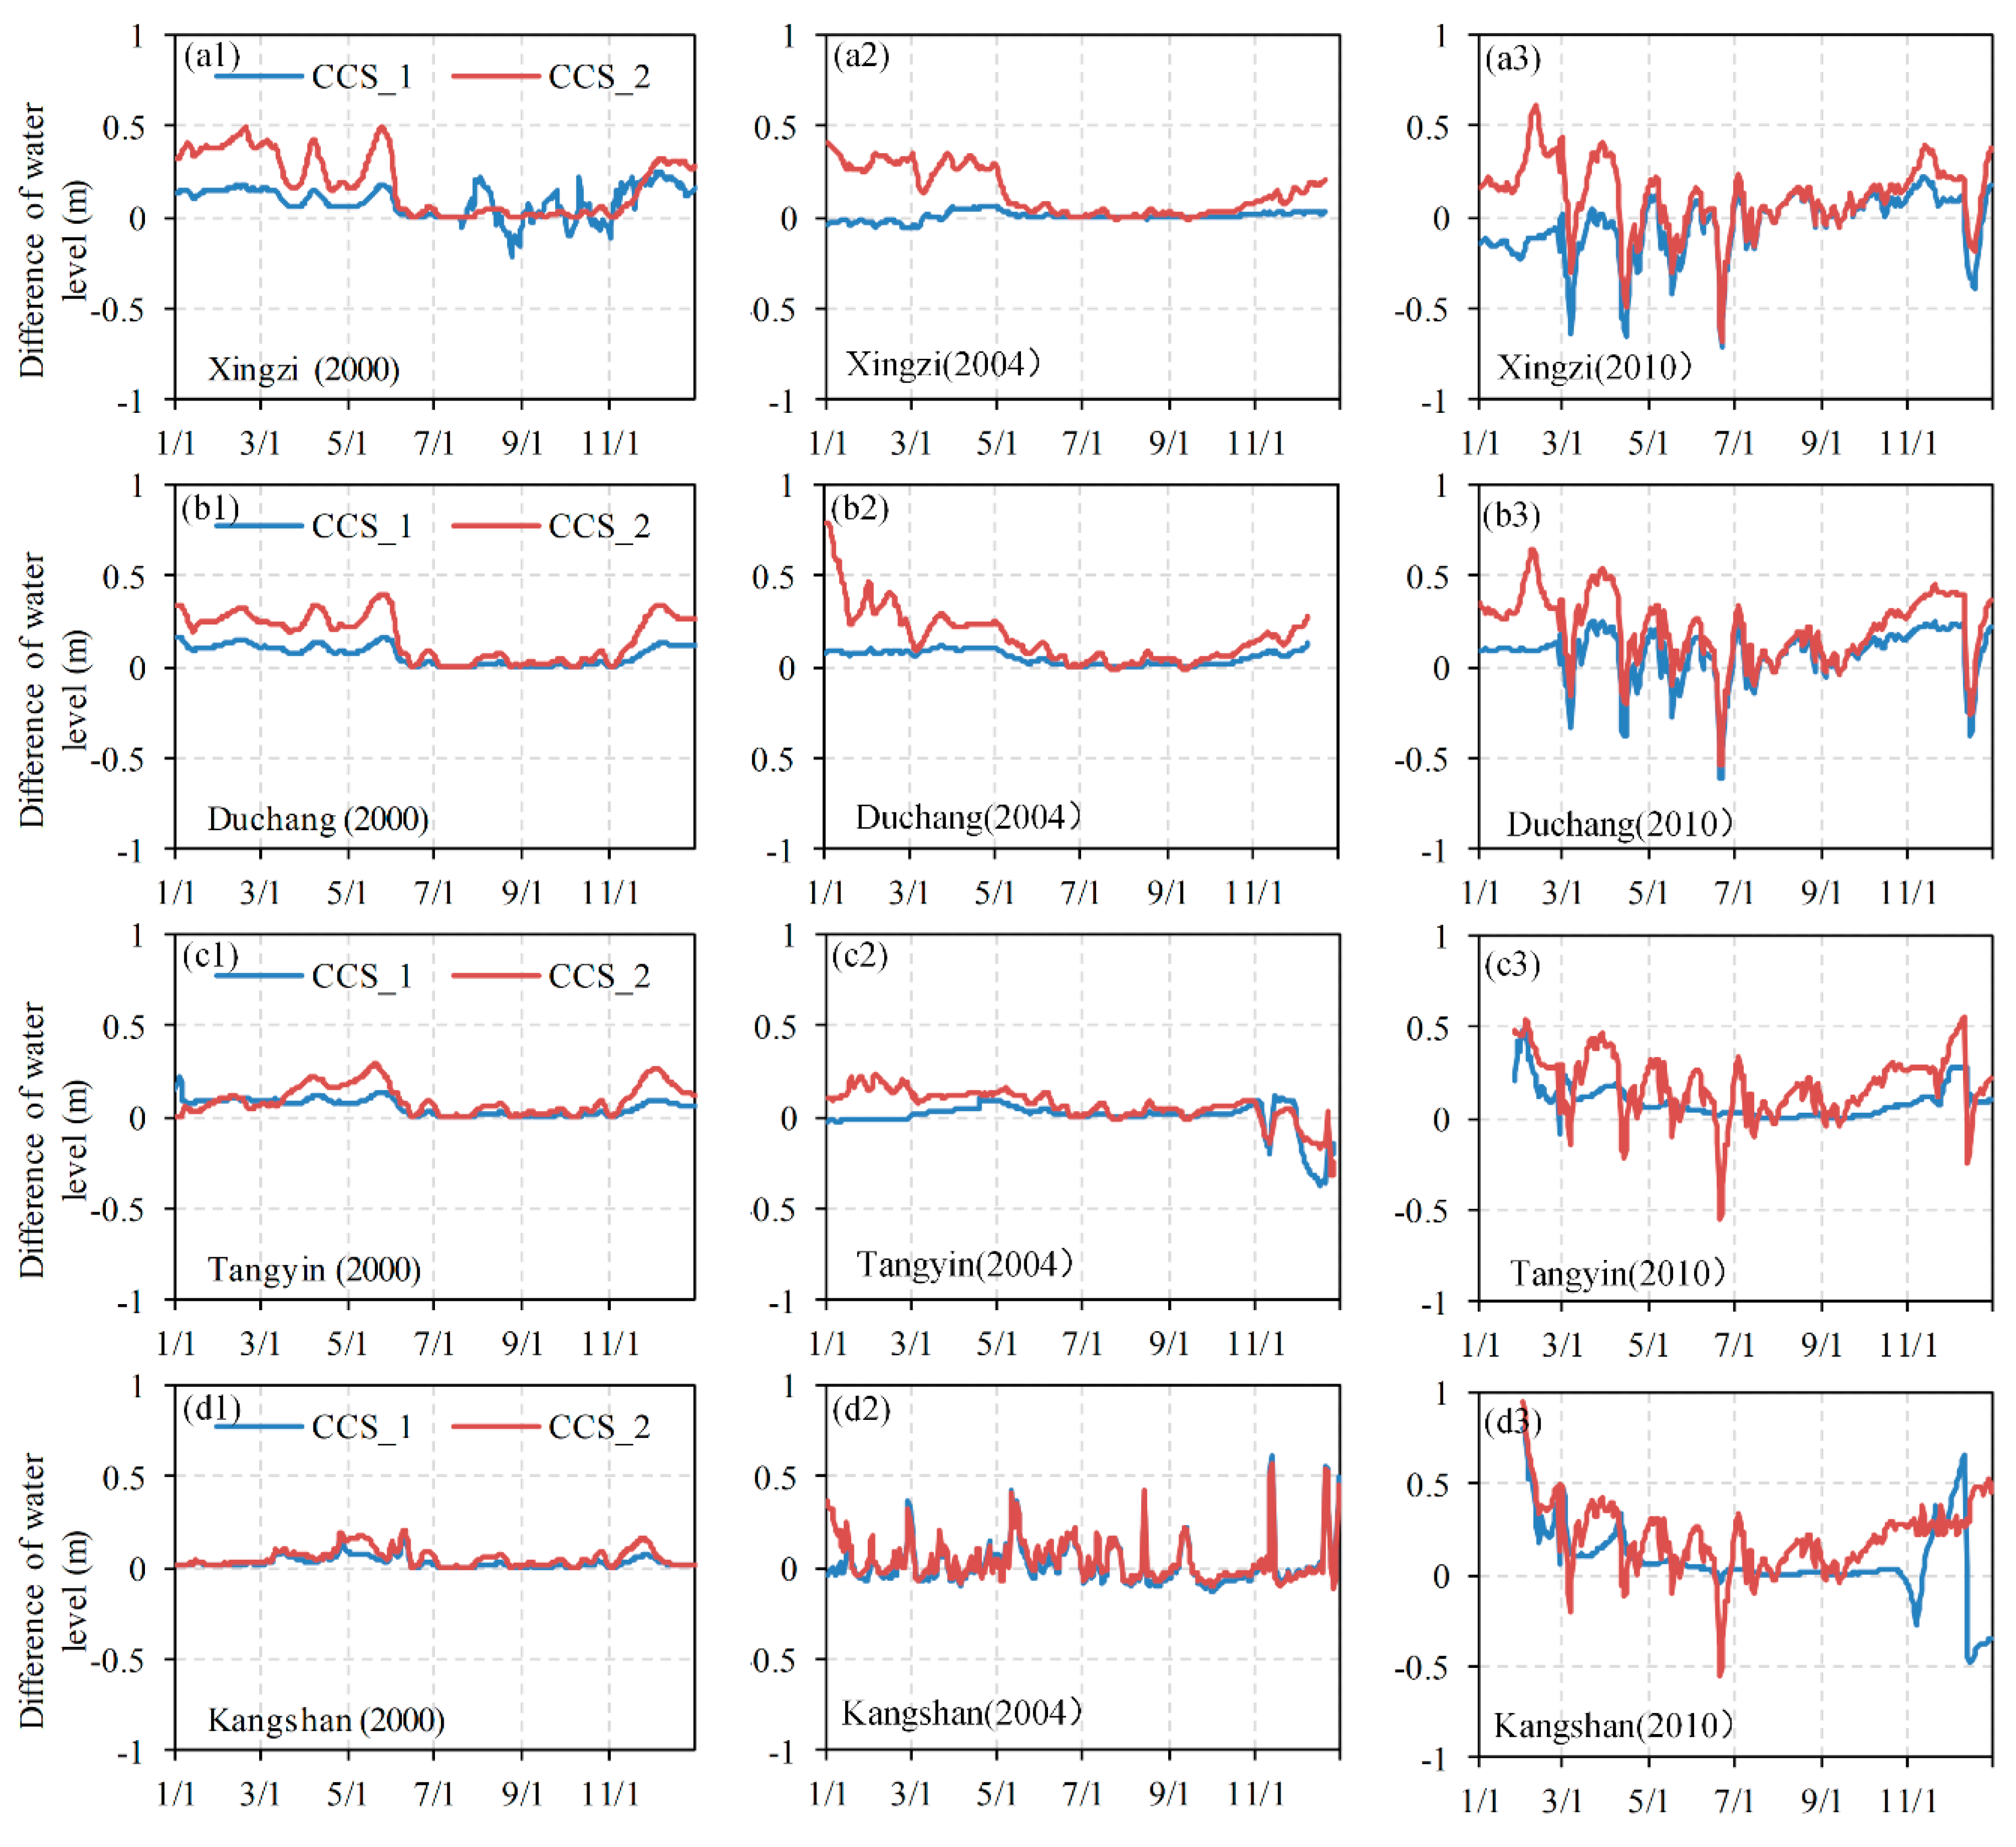
Figure 5 shows the change in daily water level under the CCS_1 and CCS_2 from the corresponding values under the baseline condition (positive numbers indicate falling water levels). This shows that bathymetric changes affected water level, especially during the lower water level period. A substantial decrease could not be observed in the simulated water level throughout the high water level season, especially during July to September. For example, the decreased rates of the simulated daily water level in 2000 varied from 0.3% to 5.2% during December to the next June when the level was lower than 14 m, often defined as the “high” water level limit, and from 0.1% to 0.8% for the period higher than 14 m under the CCS_2 condition. The inter-annual variation of the decrease rate implied that water level in the typical dry and wet years were influenced more than that in the moderate hydrological year. Distinguished by the decreased water level in 2000 and 2004, the water level of 2010 could be increased or decreased randomly by bathymetric change, which implies that the bathymetric change would bring more complex hydrodynamic process change in the wet years.
The result also shows that the change in daily water level under the CCS_1 is smaller than that under the CCS_2, which shows that rapid and constant sand mining could aggravate the decrease in water level. Some differences in the water level are also observed between the hydrological gauging stations, even under the same bathymetric change scenario. For instance, under the CCS_1 condition in 2000, the decline rate of the daily water level for Kangshan was 28% of that for Xingzi. Under the CCS_2 condition, the decline rate of daily water level for Kangshan was 23% of that for Xingzi. These results indicate that, with the same bathymetric change, the stations far from the deep channel were only affected slightly. Only the water level change at Kangshan station in 2004 and 2010 varied intensely, mainly because the complexity of elevation and the large water volume in the wet hydrological year resulted in uncertainties and irregular fluctuation.
3.3. Areal Influences of Bathymetric Changes on Water Level
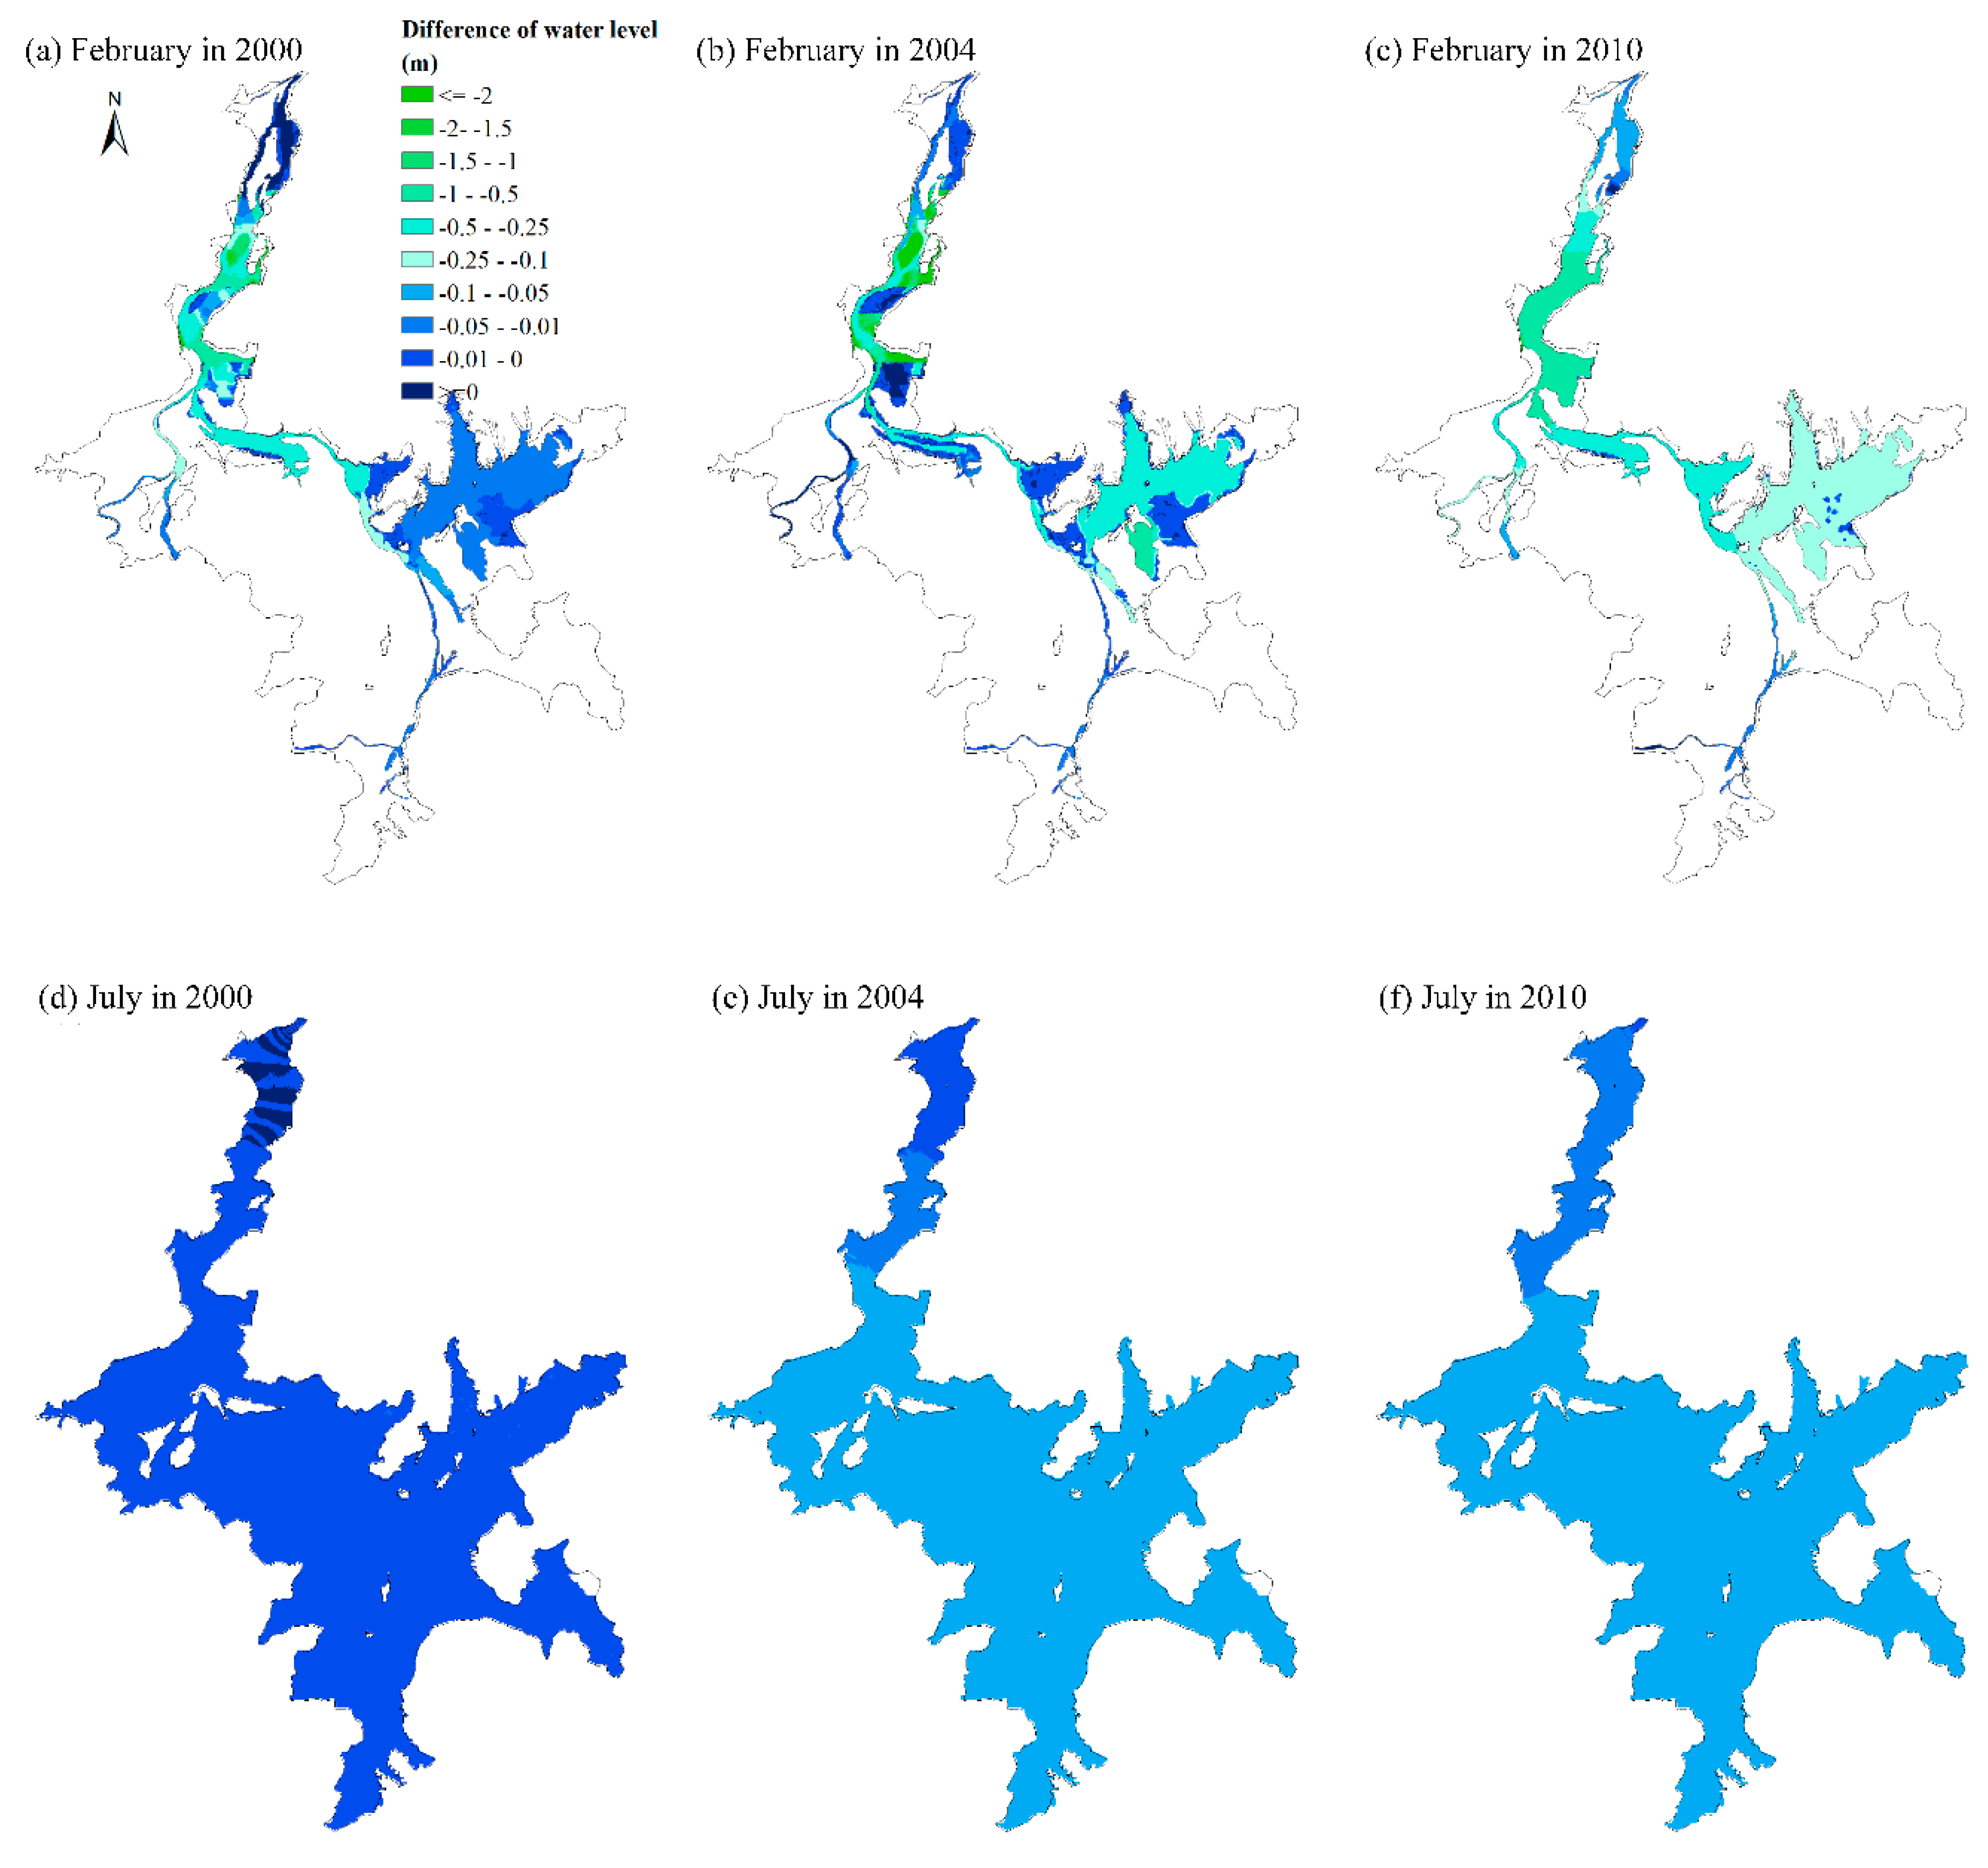
Figure 6 shows the distribution of water level change forced by bathymetric change drivers under CCS_2 during low (15 February) and high (15 July) water level periods in 2000, 2004, and 2010, suggesting significant spatial and temporal variations. During the low water level period, an evident spatial gradient was observed and mainly exhibited different degrees of reduction. In February 2000, the water level difference in the outflow channel was generally lower than 0.5 m. In the east lake bay, the declined water levels mainly ranged from 0.05 m to 0.01 m. In February 2004, the water change in the east lake bay decreased more than in 2000, and the majority of changes were close to or larger than 0.5 m. In February 2010, the water level of the northern channel connected to the Yangtze River significantly decreased as much as 2 m, and the level decreased by 0.1–0.25 m in the east.
With the water level rising, the lake area enlarged and the influence weakened significantly (Figure 6d–f). The water level decreased by 0.01–0.05 m in July 2000, spanning from the lake center to the Hukou outlet. In July 2004, the water levels of the whole lake exhibited three degrees of reduction, and the change gradually increased from Hukou to the main lake zone. In July 2010, the lake level throughout the whole lake decreased by around 0.05 m. Overall, the effect of bathymetric change was mainly concentrated in the main channels rather than in the marshland.
3.4. Response of Water Velocity in Low Water Level Periods to Bathymetric Changes
Figure 7 shows the speed change distribution forced by bathymetric change (CCS_2) forcing, corresponding to the water level variations, during low (15 February) water level periods in 2000, 2004, and 2010. In 2000, the majority of water velocity decreased by 0–10 cm/s, and water velocity around sand mining zones slowed down by more than −20 cm/s. Tan et al. [13] and Qi et al. [54] proved that water velocity is positively correlated with water-level variation during low water level periods. Water level under the CCS_2 condition was lower than under the baseline; thus, the majority of velocity values were slower than the latter one. In 2004, the water velocity distribution exhibited a similar variation trend with that in 2000, but the area (0–10 cm/s) enlarged further. In 2010, the decelerated area in the outflow channel was growing. In addition, water velocity in the eastern bay was slightly faster (0–5 cm/s) than the baseline condition, mainly because the slow downstream velocity caused flow circulation in the region, which resulted in regional and random increases.
4. Discussion
4.1. Comparison with the Effects of Bathymetric Changes in Previous Studies
Research on in-channel sand mining is imperative as it may have a significant impact on channel morphology [55] and mining in a channel bed causes disturbance to the flow characteristics, such as dropped flow velocity [56] and water level [57]. This paper shows that bathymetric change influenced water level significantly during a low water level period in Lake Poyang, which was consistent with the conclusions drawn from previous studies [17,18,19]. The higher rate of descent of the simulated daily water level when the level was lower than 14 m could be acquired (Figure 5). However, in a typical wet year, the bathymetric change would bring more complex hydrodynamic process change and the variation curve had frequent fluctuations, which was rarely done in previous studies. It might enrich and provide reference for water resources management in different hydrological years. Our findings also show distributions of water level changes caused by the bathymetric changes, with the effects mainly concentrated in the main channels rather than in the marshland, in agreement with Lai et al. (2014c). In this paper, distributions of water velocity changes for Lake Poyang caused by the bathymetric changes, seldom explored before, demonstrated that decreased water velocity would occur and showed different characteristics in different years, which enhances our understanding of the effects of bathymetric changes.
4.2. Potential Influence of Water Level and Velocitiy Variations to Lake Poyang Ecosystem
Dramatic water level and velocity changes are a threat to ecosystem stability [58] and water resource management, including irrigation and farming [59]. Previous investigations focused on the cause of the lower water level during the dry seasons of Lake Poyang and proved that the declining lake levels can be caused by changes in climate, increased water use or changed regulation patterns [60,61]. However, the spatial and temporal variations of water levels and velocity caused by bathymetric changes during typical dry, wet, and moderate hydrological years were rarely revealed. In the present study, the fact that water level decreased during dry seasons was also proved. At the same time, it was also illustrated that the hydrodynamic condition in a typical wet year could be more easily influenced by the bathymetric changes, where even an increased water level could occur (Figure 4). However, the data clearly demonstrated that even the water level at Kangshan, which is far from the sand mining zones, sometimes increased in the typical wet year. A water level that is too low or high results in severe ecological problems, such as the growth and structure of wetland plants, leading to difficulties in feeding for migratory birds and spawning for fish.
Rather than overruling the reasons for the decreased water level, our results can help to further explain how the hydrodynamic condition would respond to sand mining, which was not fully resolved in previous results. In addition, the spatial variations in water level and velocity could also be addressed in this study, particularly the slower water velocity, and help to enhance our understanding of the lower water quality seen in Lake Poyang recently. Decreasing lake velocity caused by sand mining reduces self-purification capacity, particularly in the eastern bay region, regarded as the origin of blue-green algae in Lake Poyang. Fortunately, the Jiangxi Province Government has recognized the dangers of sand mining and the latest five-year sand mining plan was officially implemented at the end of 2018, banning sand mining in the main channel, and thereby benefiting the ecological environment in order to maintain its stability and sustainability effectively.
4.3. Uncertainty in Hydrodynamic Modelling
The hydrodynamic conditions of lakes are driven by meteorological conditions, including precipitation, evaporation, and wind. Meteorological data with improved resolution will result in accurate hydrodynamic models. In particular, spatial differences among meteorological conditions should be taken into account in the lake being studied. Thus, daily data at two national meteorological stations (Boyang and Nanchang) were used to represent meteorological conditions in the western and eastern lake zones. However, the generalizations drawn from the results cannot be used to describe the situation of the entire Lake Poyang, a limitation that might decrease modelling accuracy. In this case, the meteorological data, including precipitation at five hydrodynamic stations (i.e., Xingzi, Duchang) provided by Poyang Lake Hydrology Bureau of Jiangxi Province, were also used to complement the insufficient data and improve the reliability of the modelling results. Increasing the accuracy of the hydrodynamic model requires grids with high resolution. In the current research, a square grid with a spatial resolution of 250 m was used to discretize the model domain, which might cause deviations in the complexity of the lake bathymetry. Therefore, the elevation of grids in the complex region was refined and revised based on the comprehensive and detailed maps of lake-floor topography using a geography information system. The model in the study can obtain reasonable results by calculating interval runoff, configuring roughness coefficients, and using the water level collected from Hukou station as a downstream hydrodynamic boundary condition.
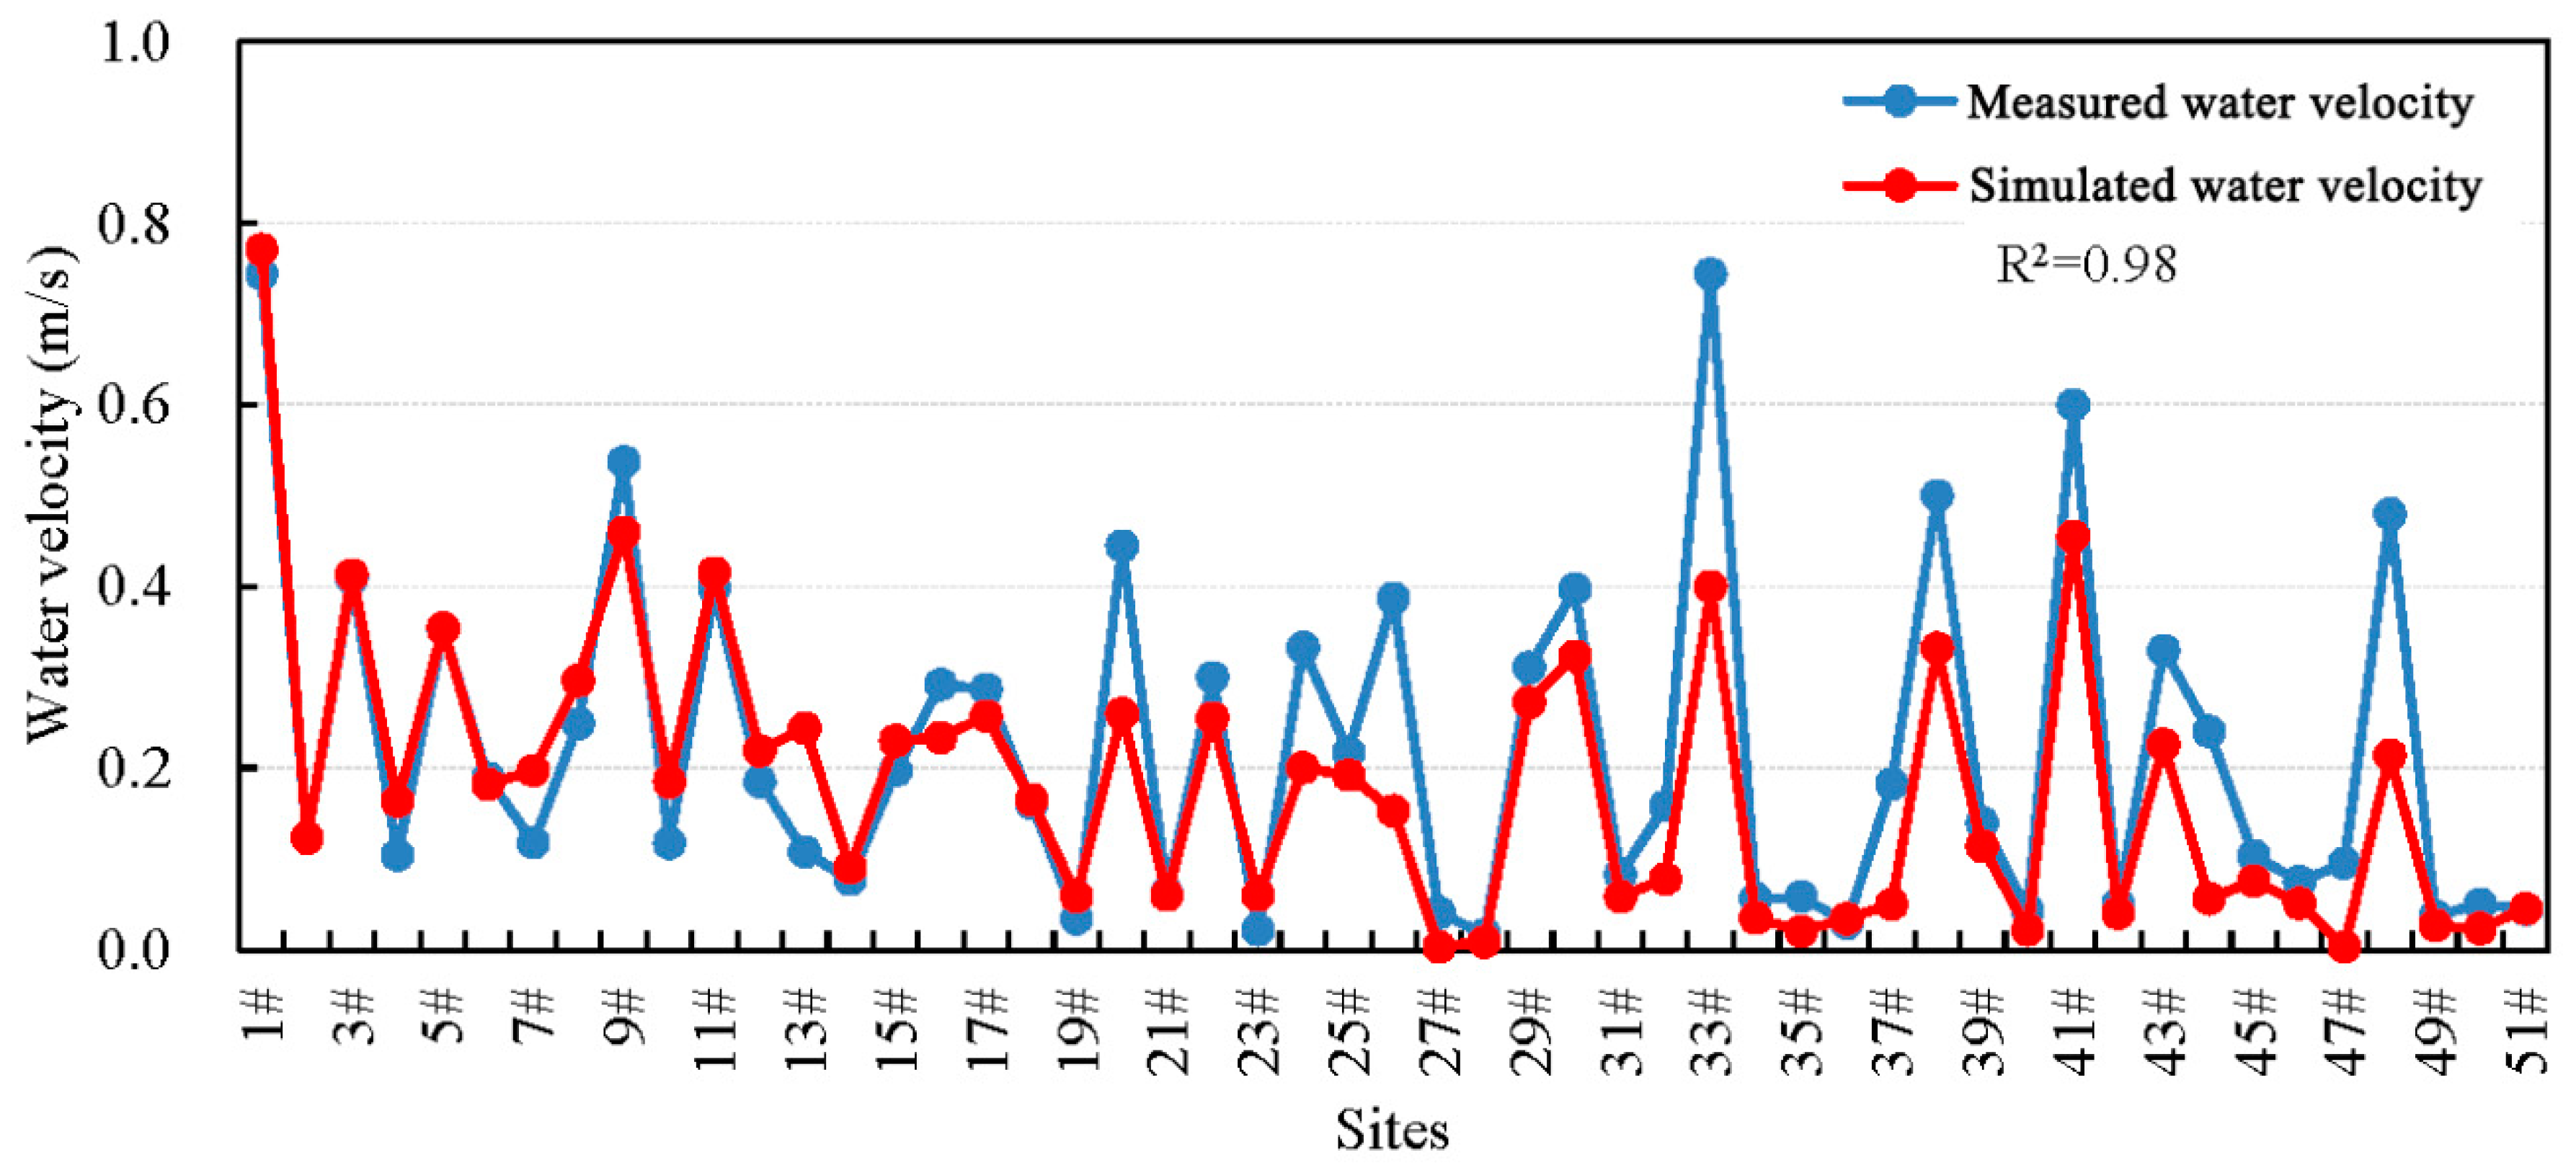
Water velocity should be calibrated because various velocities were compared to illustrate the hydrodynamic effects. However, flow velocity data were not available in 2000 and 2004. The Hydrology Bureau of Jiangxi Province provided a velocity dataset (1–51 in Figure 1) for 9–12 October 2010 for flow velocity validation. Given the shape of the lake, channel directions, and features of lake flow, 51 sites were evenly distributed in the horizontal monitoring sections (Figure 1). When the water depth was shallower than 5 m, the two-point method was used. Hence, water velocity and direction at 20% and 60% depth in the site were measured. If the water was deeper than 5 m, then the three-point method was used instead, and the flow rates at 20%, 60%, and 80% depth in the site were monitored. The average values of the observed water velocities were compared with the simulated values. The results showed that the magnitudes and fluctuations of the simulated values closely tracked the observed values, with a R2 as high as 0.98 (Figure 8). These findings indicated that the hydrodynamic model accurately captured water velocity in Lake Poyang.
5. Conclusions
This study explored the low water level caused by bathymetric changes, and investigated the response of hydrodynamic conditions to the bathymetric changes. EFDC was applied to run the annual and inter-annual water level and velocity variations under baseline, CCS_1 and CCS_2 scenarios. The simulation results demonstrated that bathymetric changes affected water level, especially in the low water level period. Substantial decrease in the simulated water level from the CCS_1 and CCS_2 scenarios was observed throughout the low water level period. The inter-annual variation of the decrease rate implied that the typical dry and wet year water levels declined more intensively than that in the moderate hydrological year. In the spatial scale, an evident spatial gradient in the distribution of water level changes was observed from February to July. The influence of bathymetric changes was mainly concentrated in the main channels. The water velocities mainly decelerated in the three years due to the decrease of the water level during the dry seasons. This study can potentially enhance our understanding of spatial and temporal variations of hydrodynamic variables influenced by sand mining. Meanwhile, the inter-annual hydrodynamic responses can support different management strategies, such as whether dry or wet years warrant a greater concern.
Author Contributions
L.Q., J.H. and J.G. conceived and designed the research; L.Q. and J.H. performed the experiments and analyzed the data; J.G. and Z.C. collected hydrological data; All authors contributed to writing the manuscript; L.Q., J.H. revised the manuscript.
Funding
This research was jointly funded by the Major Science and Technology Program for Water Pollution Control and Treatment of China (2017ZX07301-001-02), Youth Innovation Promotion Association CAS (Grant No. 2019313), Youth Natural Scientific Foundation of Anhui Province (Grant No. 1908085QD151), and the Foundation of Anhui Normal University (Grant No. 751847).
Acknowledgments
We acknowledge the Jiangxi Province Lake Poyang Hydrology Bureau for providing the hydrological data. The original meteorological data were collected by China Meteorological Data Sharing Service System. The bathymetric data were provided by the Water Resources Department of Jiangxi Province.
Conflicts of Interest
The authors declare no conflict of interest.
References
- Lai, X.J.; Shankman, D.; Huber, C.; Yesou, H.; Huang, Q.; Jiang, J.H. Sand mining and increasing Poyang Lake’s discharge ability: A reassessment of causes for lake decline in China. J. Hydrol. 2014, 519, 1698–1706. [Google Scholar] [CrossRef]
- Shankman, D.; Liang, Q.L. Landscape Changes and Increasing Flood Frequency in China’s Poyang Lake Region. Prof. Geogr. 2003, 55, 434–445. [Google Scholar] [CrossRef]
- Hu, Q.; Feng, S.; Guo, H.; Chen, G.Y.; Jiang, T. Interactions of the Yangtze river flow and hydrologic processes of the Poyang Lake, China. J. Hydrol. 2007, 347, 90–100. [Google Scholar] [CrossRef]
- Shankman, D.; Keim, B.D.; Song, J. Flood frequency in China’s Poyang Lake region: Trends and teleconnections. Int. J. Climatol. 2006, 26, 1255–1266. [Google Scholar] [CrossRef]
- Du, Y.L.; Zhou, H.D.; Peng, W.Q.; Liu, X.B.; Wang, S.Y.; Yin, S.H. Modeling the impacts of the change of river-lake relationship on the hydrodynamic and water quailty revolution in Poyang Lake. Acta Sci. Circumstantiae 2015, 35, 1274–1284. [Google Scholar]
- Wu, Z.S.; Cai, Y.J.; Liu, X.; Xu, C.P.; Chen, Y.W.; Zhang, L. Temporal and spatial variability of phytoplankton in Lake Poyang: The largest freshwater lake in China. J. Great Lakes Res. 2013, 39, 476–483. [Google Scholar] [CrossRef]
- Cao, J.; Chu, Z.; Du, Y.L.; Hou, Z.Y.; Wang, S.R. Phytoplankton dynamics and their relationship with environmental variables of Lake Poyang. Hydrol. Res. 2016, 47, 249–260. [Google Scholar] [CrossRef] [Green Version]
- Li, Y.L.; Yao, J.; Zhao, G.Z.; Zhang, Q. Evidences of hydraulic relationships between groundwater and lake water across the large floodplain wetland of Poyang Lake, China. Water Sci. Technol. 2018, 18, 698–712. [Google Scholar] [CrossRef]
- Zhang, Q.; Ye, X.C.; Werner, A.D.; Li, Y.L.; Yao, J.; Li, X.H.; Xu, C.Y. An investigation of enhanced recessions in Poyang Lake: Comparison of Yangtze River and local catchment impacts. J. Hydrol. 2014, 517, 425–434. [Google Scholar] [CrossRef] [Green Version]
- Cui, T.; Xu, X.F.; Liu, L.; Fu, S.S. Variation characteristics of annual average runoff and evolution law of high and low in Poyang Lake Basin. Water Resour. Power 2014, 32, 22–25. [Google Scholar]
- Sun, X.S.; Tan, G.L.; Chen, F.C. Encyclopedia of Rivers and Lakes in Jiangxi; Changjiang Press: Hubei, China, 2009. [Google Scholar]
- Ye, X.C.; Zhang, Q.; Bai, L.; Hu, Q. A modeling study of catchment discharge to Poyang Lake under future climate in China. Quat. Int. 2011, 244, 221–229. [Google Scholar] [CrossRef]
- Tan, G.L.; Guo, S.L.; Wang, J.; Lv, S.Y. Hydrology and Water Resources Research Evolution in Poyang Lake Ecological Economic Zone; China Water and Power Press: Beijing, China, 2012. [Google Scholar]
- Min, Q.; Zhan, L.S. Characteristics of low-water level changes in Lake Poyang during 1952–2011. J. Lake Sci. 2012, 24, 675–678. [Google Scholar]
- Lai, X.J.; Huang, Q.; Zhang, Y.H.; Jiang, J.H. Impact of lake inflow and the Yangtze River flow alterations on water levels in Poyang Lake, China. Lake Reserv. Manag. 2014, 30, 321–330. [Google Scholar] [CrossRef]
- Ye, X.C.; Zhang, Q.; Liu, J.; Li, X.H.; Xu, C.Y. Distinguishing the relative impacts of climate change and human activities on variation of streamflow in the Poyang Lake catchment, China. J. Hydrol. 2013, 494, 83–95. [Google Scholar] [CrossRef]
- Guo, H.; Hu, Q.; Hang, Q. Changes in Hydrological Interactions of the Yangtze River and the Poyang Lake in China during 1957–2008. Acta Geogr. Sin. 2011, 66, 609–618. [Google Scholar]
- Zhang, Z.X.; Chen, X.; Xu, C.Y.; Hong, Y.; Hardy, J.; Sun, Z.H. Examining the influence of river–lake interaction on the drought and water resources in the Poyang Lake basin. J. Hydrol. 2015, 522, 510–521. [Google Scholar] [CrossRef]
- Guo, H.; Hu, Q.; Zhang, Q. Effects of the three gorges dam on Yangtze river flow and river interaction with Poyang Lake, China: 2003–2008. J. Hydrol. 2012, 416, 19–27. [Google Scholar] [CrossRef]
- Jiang, F.; Qi, S.H.; Liao, F.Q.; Zhang, X.X.; Wang, D.; Zhu, J.X.; Xiong, M.Y. Hydrological and sediment effects from sand mining in Poyang Lake during. 2001–2010. Acta Geogr. Sin. 2015, 70, 837–845. [Google Scholar]
- Mei, X.; Dai, Z.; Du, J.; Chen, J. Linkage between Three Gorges Dam impacts and the dramatic recessions in China’s largest freshwater lake, Poyang Lake. Sci. Rep. 2015, 5, 18197. [Google Scholar] [CrossRef]
- Lai, G.Y.; Wang, P.; Huang, X.L.; Xiong, J.Q.; Liu, Y.; Zeng, F.H. A simulation research of impacts of the Lake Poyang hydraulic project on hydrology and hydrodynamics. J. Lake Sci. 2015, 27, 128–140. [Google Scholar] [Green Version]
- Wang, P.; Lai, G.Y.; Huang, X.L. Simulation of the impact of Lake Poyang Project on the dynamic of lake water level. J. Lake Sci. 2014, 26, 29–36. [Google Scholar]
- Lu, C.; Zhang, F.; Liu, Z.; Hao, S.; Wu, Z. Three-dimensional numerical simulation of sediment transport in Lake Tai based on EFDC model. J. Food Agric. Environ. 2013, 11, 1343–1348. [Google Scholar]
- Huang, J.C.; Zhang, Y.J.; Huang, Q.; Gao, J.F. When and where to reduce nutrient for controlling harmful algal blooms in large eutrophic lake Chaohu, China? Ecol. Indic. 2018, 89, 808–817. [Google Scholar] [CrossRef]
- Huang, J.C.; Qi, L.Y.; Gao, J.F.; Kim, D.K. Risk assessment of hazardous materials loading into four large lakes in China: A new hydrodynamic indicator based on EFDC. Ecol. Indic. 2017, 80, 23–30. [Google Scholar] [CrossRef]
- Zhao, L.; Li, Y.Z.; Zou, R.; He, B.; Zhu, X.; Liu, Y.; Wang, J.S.; Zhu, Y.G. A three-dimensional water quality modeling approach for exploring the eutrophication responses to load reduction scenarios in Lake Yilong (China). Environ. Pollut. 2013, 177, 13–21. [Google Scholar] [CrossRef]
- Zou, R.; Zhang, X.L.; Liu, Y.; Zhao, L.; Zhu, X.; Yan, X.P.; Yang, P.J. A Linked EFDC-NN model for risk-based load reduction analysis of Lake Fuxian watershed. China Environ. Sci. 2013, 33, 1721–1727. [Google Scholar]
- Wu, G.; Xu, Z. Prediction of algal blooming using EFDC model: Case study in the Daoxiang Lake. Ecol. Model. 2011, 222, 1245–1252. [Google Scholar] [CrossRef]
- Li, Y.P.; Wang, J.Y.; Hua, L. Response of algae growth to pollution reduction of drainage basin based on EFDC model for channel reservoirs: A case of Changtan Reservior, Guangdong Province. J. Lake Sci. 2015, 27, 811–818. [Google Scholar]
- Tang, T.J.; Yang, S.; Yin, K.H.; Zou, R. Simulation of eutrophication in Shenzhen Reservior based on EFDC model. J. Lake Sci. 2014, 26, 393–400. [Google Scholar]
- Ji, Z.J.; Morton, M.R.; Hamrick, J.M. Wetting and Drying Simulation of Estuarine Processes. Estuar. Coast. Shelf Sci. 2001, 53, 683–700. [Google Scholar] [CrossRef]
- Ji, Z.G.; Hamrick, J.H.; Pagenkopf, J. Sediment and Metals Modeling in Shallow River. J. Environ. Eng. 2002, 2, 105–119. [Google Scholar] [CrossRef]
- Ji, Z.G.; Hu, G.D.; Shen, J.; Wang, Y.S. Three-dimensional modeling of hydrodynamic processes in the St. Lucie Estuary. Estuar. Coast. Shelf Sci. 2007, 73, 188–200. [Google Scholar] [CrossRef]
- Li, Y.L.; Zhang, Q.; Werner, A.D.; Yao, J. Investigation of Residence and Travel Times in a Large Floodplain Lake with Complex Lake–River Interactions: Poyang Lake (China). Water 2015, 7, 1991–2012. [Google Scholar] [CrossRef]
- Li, Y.L.; Zhang, Q.; Werner, A.D.; Yao, J. Investigating a complex lake-catchment-river system using artificial neural networks: Poyang Lake (China). Hydrol. Res. 2015, 46, 912–928. [Google Scholar] [CrossRef]
- Zhang, Q.; Werner, A.D. Hysteretic relationships in inundation dynamics for a large lake–floodplain system. J. Hydrol. 2015, 527, 160–171. [Google Scholar] [CrossRef]
- Zhu, Y.; Yang, J.; Hao, J. Numerical Simulation of Hydrodynamic Characteristics and Water Quality in Yangchenghu Lake. In Advances in Water Resources and Hydraulic Engineering; Springer: Berlin/Heidelberg, Germany, 2009; pp. 710–715. [Google Scholar]
- Zacharias, I.; Dimitriou, E.; Koussouris, T. Integrated water management scenarios for wetland protection: Application in Trichonis Lake. Environ. Model. Softw. 2005, 20, 177–185. [Google Scholar] [CrossRef]
- Madsen, H. Parameter estimation in distributed hydrological catchment modelling using automatic calibration with multiple objectives. Adv. Water Resour. 2003, 26, 205–216. [Google Scholar] [CrossRef]
- Chen, C.F.; Meselhe, E.; Waldon, M. Assessment of mineral concentration impacts from pumped stormwater on an Everglades Wetland, Florida, USA—Using a spatially-explicit model. J. Hydrol. 2012, 452, 25–39. [Google Scholar] [CrossRef]
- Long, S.A.; Tachiev, G.I.; Fennema, A. Modeling the impact of restoration efforts on phosphorus loading and transport through Everglades National Park, FL, USA. Sci. Total Environ. 2015, 520, 81–95. [Google Scholar] [CrossRef]
- Rullyanto, A.; Jonasdottir, S.H.; Visser, A.W. Advective loss of overwintering Calanus finmarchicus from the Faroe–Shetland Channel. Deep-Sea Res. I 2015, 98, 76–82. [Google Scholar] [CrossRef]
- Andersen, J.; Refsgaard, J.C.; Jensen, K.H. Distributed hydrological modelling of the Senegal River Basin-model construction and validation. J. Hydrol. 2001, 247, 200–214. [Google Scholar] [CrossRef]
- Huang, J.C.; Gao, J.F.; Mooij, W.M.; Hörmann, G.; Fohrer, N. A Comparison of Three Approaches to Predict Phytoplankton Biomass in Gonghu Bay of Lake Taihu. J. Environ. Inform. 2014, 24, 39–51. [Google Scholar] [CrossRef] [Green Version]
- Lai, X.J.; Jiang, J.H.; Huang, Q.; Xu, L.G. Two-dimensional numerical simulation of hydrodynamic and pollutant transport for Lake Poyang. J. Lake Sci. 2011, 23, 893–902. [Google Scholar] [Green Version]
- Lai, X.J.; Liang, Q.H.; Jiang, J.H. Impoundment Effects of the Three-Gorges-Dam on Flow Regimes in Two China’s Largest Freshwater Lakes. Water Resour. Manag. 2014, 28, 5111–5124. [Google Scholar] [CrossRef]
- Yao, J.; Zhang, Q.; Li, Y.; Li, M. Hydrological evidence and causes of seasonal low water levels in a large river-lake system: Poyang Lake, China. Hydrol. Res. 2016, 47, 24–39. [Google Scholar] [CrossRef] [Green Version]
- Dai, X.; Wan, R.R.; Yang, G.S.; Wang, X.L. Temporal variation of hydrological rhythm in Poyang Lake and the associated water exchange with the Changjiang River. Sci. Geogr. Sin. 2014, 34, 1488–1496. [Google Scholar]
- Gao, J.F. Conservation and Development of China’s Five Largest Freshwater Lakes; Science Press: Beijing, China, 2012. (In Chinese) [Google Scholar]
- Qi, L.Y.; Huang, J.C.; Yan, R.H.; Gao, J.F.; Wang, S.G.; Guo, Y.Y. Modeling the effects of the streamflow changes of Xinjiang Basin in future climate scenarios on the hydrodynamic conditions in Lake Poyang, China. Limnology 2016, 18, 175–194. [Google Scholar] [CrossRef]
- Huang, J.C.; Gao, J.F.; Xu, Y.; Liu, J. Towards better environmental software for spatio-temporal ecological models: Lessons from developing an intelligent system supporting phytoplankton prediction in lakes. Ecol. Inform. 2015, 25, 49–56. [Google Scholar] [CrossRef]
- Leeuw, J.D.; Shankman, D.; Wu, G.F.; de Boer, W.F.; Burnham, J.; He, Q.; Yesou, H.; Xiao, J. Strategic assessment of the magnitude and impacts of sand mining in Poyang Lake, China. Reg. Environ. Chang. 2009, 10, 95–102. [Google Scholar] [CrossRef]
- Qi, L.Y.; Huang, J.C.; Gao, J.F.; Guo, Y.Y. Temporal and spatial simulation of water level and velocity during low water level statistical year in Lake Poyang. Resour. Environ. Yangtze Basin 2017, 26, 572–584. [Google Scholar]
- Barman, B.; Kumar, B.; Sarma, A.K. Dynamic characterization of the migration of a mining pit in an alluvial channel. Int. J. Sediment Res. 2019, 34, 155–165. [Google Scholar] [CrossRef]
- Barman, B.; Kumar, B.; Sarma, A.K. Impact of sand mining on alluvial channel flow characteristics. Ecol. Eng. 2019, 135, 36–44. [Google Scholar] [CrossRef]
- Tang, M.Q.; Zhang, Z.Q.; Xing, Y.Q. Environment monitoring of offshore sand mining in Peral River Estuary. Procedia Environ. Sci. 2011, 10, 1410–1415. [Google Scholar] [CrossRef]
- Qi, L.Y.; Huang, J.C.; Huang, Q.; Gao, J.F.; Wang, S.G.; Guo, Y.Y. Assessing aquatic ecological integrity for Lake Poyang, China: Part I Index development. Water 2018, 10, 943. [Google Scholar] [CrossRef]
- Haghighi, A.T.; Fazel, N.; Hekmatzadeh, A.A.; Kløve, B. Analysis of Effective Environmental Flow Release Strategies for Lake Urmia Restoration. Water Resour. Manag. 2018, 32, 3595–3609. [Google Scholar] [CrossRef] [Green Version]
- Haghighi, A.T.; Kløve, B. A sensitivity analysis of lake water level response to changes in climate and river regimes. Limnologica 2015, 51, 118–130. [Google Scholar] [CrossRef]
- Haghighi, A.T.; Menberu, M.W.; Aminnezhad, M.; Marttila, H.; Kløve, B. Can lake sensitivity to desiccation be predicted from lake geometry? J. Hydrol. 2016, 539, 599–610. [Google Scholar] [CrossRef] [Green Version]
Figure 1.
Locations of Lake Poyang, elevation above sea level (Wusong datum), river network, sand mining zones, selected line for profile, Sand Hill, meteorological station, hydrological stations in lake and rivers, lake flow monitoring sites.
Figure 1.
Locations of Lake Poyang, elevation above sea level (Wusong datum), river network, sand mining zones, selected line for profile, Sand Hill, meteorological station, hydrological stations in lake and rivers, lake flow monitoring sites.

Figure 2.
Yearly average discharge of inflow and outflow for Lake Poyang during 2000–2010.

Figure 3.
Vertical profile elevation of initial, CCS_1, and CCS_2.

Figure 4.
Comparison of simulated and measured water level (Wusong datum) at four hydrological stations: Xingzi (a), Duchang (b), Tangyin (c), Kangshan (d).
Figure 4.
Comparison of simulated and measured water level (Wusong datum) at four hydrological stations: Xingzi (a), Duchang (b), Tangyin (c), Kangshan (d).

Figure 5.
Variations of water level at four hydrological stations in 2000 (a1–d1), 2004 (a2–d2), and 2010 (a3–d3) caused by the bathymetric changes.
Figure 5.
Variations of water level at four hydrological stations in 2000 (a1–d1), 2004 (a2–d2), and 2010 (a3–d3) caused by the bathymetric changes.

Figure 6.
Distributions of water level changes for Lake Poyang caused by the bathymetric changes in 15 February and July (CCS_2 minus baseline) 2000 (a,d), 2004 (b,e), and 2010 (c,f).
Figure 6.
Distributions of water level changes for Lake Poyang caused by the bathymetric changes in 15 February and July (CCS_2 minus baseline) 2000 (a,d), 2004 (b,e), and 2010 (c,f).

Figure 7.
Distributions of water velocity changes for Lake Poyang caused by the bathymetric changes in February (CCS_2 minus Baseline) 2000 (a), 2004 (b), and 2010 (c).
Figure 7.
Distributions of water velocity changes for Lake Poyang caused by the bathymetric changes in February (CCS_2 minus Baseline) 2000 (a), 2004 (b), and 2010 (c).

Figure 8.
Comparison of simulated and measured water velocities in Lake Poyang.


Table 1.
Data used in hydrodynamic modelling.
| Item. | Data Source | Spatial Resolution | Temporal Resolution | Variable | Unit |
|---|---|---|---|---|---|
| Meteorological Data | China Meteorological Data Sharing Service System | Boyang and Nanchang meteorological stations | Daily (2000, 2004, 2010) | PR | mm |
| EVP | mm | ||||
| PATM | hPa | ||||
| T | °C | ||||
| HR | % | ||||
| SOLSWR | MJ/m2 | ||||
| WS | m/s | ||||
| WD | ° | ||||
| Hydrological Data | Poyang Lake Hydrology Bureau of Jiangxi Province | Hydrological stations in inflows | Daily (2000, 2004, 2010) | Q | m3/s |
| Hukou hydrological station | WL | m | |||
| Bathymetry | Water Resources Department of Jiangxi Province | 5 × 5 m | 2010 | DEM | m |
Table 2.
Description of bathymetry and model scenarios.
| Typical Moderate Hydrological Year (2000) | Typical Dry Hydrological Year (2004) | Typical Wet Hydrological Year (2010) | |
|---|---|---|---|
| No bathymetric change | Baseline 1: present hydrodynamic process in typical moderate hydrological year | Baseline 2: present hydrodynamic process in typical dry hydrological year | Baseline 3: present hydrodynamic process in typical wet hydrological year |
| CCS_1: channel change by 59 cm | Scenario 1–1: responses of hydrodynamics during typical moderate hydrological year to average annual channel change | Scenario 2–1: responses of hydrodynamics during typical dry hydrological year to average annual channel change | Scenario 3–1: responses of hydrodynamics during typical wet hydrological year to average annual channel change |
| CCS_2: channel change by 295 cm | Scenario 1–2: responses of hydrodynamics during typical moderate hydrological year to probable high channel change after five years | Scenario 2–2: responses of hydrodynamics during typical dry hydrological year to probable high channel change after five years | Scenario 3–2: responses of hydrodynamics during typical wet hydrological year to probable high channel change after five years |
Table 3.
Indicators to evaluate model fits.
| Error Indicator | Description | Unit | Equation | Range | Year | Xingzi | Duchang | Tangyin | Kangshan |
|---|---|---|---|---|---|---|---|---|---|
| MAE ↓ | Mean Absole Error | m | [0, +∞) | 2000 | 0.19 | 0.33 | 0.46 | 0.46 | |
| 2004 | 0.26 | 0.35 | 0.42 | 0.33 | |||||
| 2010 | 0.44 | 0.92 | 0.40 | 0.53 | |||||
| RMSE ↓ | Root Mean Square Error | m | [0, +∞) | 2000 | 0.27 | 0.41 | 0.61 | 0.55 | |
| 2004 | 0.36 | 0.44 | 0.56 | 0.44 | |||||
| 2010 | 0.57 | 1.00 | 0.48 | 0.66 | |||||
| R² ↑ | Coefficient of determination | / | [0.0, 1.0] | 2000 | 0.99 | 0.98 | 0.94 | 0.96 | |
| 2004 | 0.99 | 0.98 | 0.95 | 0.96 | |||||
| 2010 | 0.99 | 0.96 | 0.99 | 0.97 | |||||
| MRE ↓ | Mean Relative Error | % | [0, +∞) | 2000 | 0.02 | 0.03 | 0.04 | 0.04 | |
| 2004 | 0.02 | 0.03 | 0.03 | 0.03 | |||||
| 2010 | 0.03 | 0.07 | 0.03 | 0.04 |
↑/↓: The indicator has positive/negative relationship with model fits. and represented computed and measured water level in day i in Lake Poyang; and were average value of computed and measured water level in day i in Lake Poyang (, ); n was the number of effective days.
© 2019 by the authors. Licensee MDPI, Basel, Switzerland. This article is an open access article distributed under the terms and conditions of the Creative Commons Attribution (CC BY) license (http://creativecommons.org/licenses/by/4.0/).
Share and Cite
MDPI and ACS Style
Qi, L.; Huang, J.; Gao, J.; Cui, Z. Modelling the Impacts of Bathymetric Changes on Water Level in China’s Largest Freshwater Lake. Water 2019, 11, 1469. https://doi.org/10.3390/w11071469
AMA Style
Qi L, Huang J, Gao J, Cui Z. Modelling the Impacts of Bathymetric Changes on Water Level in China’s Largest Freshwater Lake. Water. 2019; 11(7):1469. https://doi.org/10.3390/w11071469
Chicago/Turabian StyleQi, Lingyan, Jiacong Huang, Junfeng Gao, and Zhen Cui. 2019. "Modelling the Impacts of Bathymetric Changes on Water Level in China’s Largest Freshwater Lake" Water 11, no. 7: 1469. https://doi.org/10.3390/w11071469
Note that from the first issue of 2016, this journal uses article numbers instead of page numbers. See further details here.