Evaluation of the GPM IMERG v5 and TRMM 3B42 v7 Precipitation Products in the Yangtze River Basin, China


1
Joint Innovation Center for Modern Forestry Studies, College of Biology and the Environment, Nanjing Forestry University, Nanjing 210037, China
2
State Key Laboratory of Hydrology-Water Resources and Hydraulics Engineering, Hohai University, Nanjing 210098, China
*
Author to whom correspondence should be addressed.
Water 2019, 11(7), 1459; https://doi.org/10.3390/w11071459
Submission received: 25 May 2019
/
Revised: 10 July 2019
/
Accepted: 11 July 2019
/
Published: 14 July 2019
(This article belongs to the Section Hydrology)
Abstract
:The purpose of this study is to quantitatively evaluate the accuracy of the GPM IMERG v5 and the TRMM 3B42 v7, with the reference of 224 rain gauge stations over the Yangtze River basin in China from April 2014 to December 2017. The results showed that: (1) The changing pattern of IMERG v5 was similar to the 3B42 v7, and higher correlations can be found between the satellite-based precipitation products (SPPs) and observed precipitation for the monthly and annual time scale; (2) the IMERG v5 tended to overestimate the distribution range of the main rain band while the 3B42 v7 underestimated the precipitation in Sichuan basin, and the largest differences were found for the precipitation less than 1 mm/d for two SPPs; (3) both of the IMERG v5 and 3B42 v7 overestimated the precipitation in the lower elevation areas (<3000 m), while the opposite was true for areas ≥ 3000 m (RBIMERG v5 = −5.42%, RB3B42 v7 = −1.87%), and the retrieved results of PPDFc index and average precipitation at different altitudes for IMERG v5 were better than 3B42 v7. This study highlighted that IMERG v5 performed generally better than 3B42 v7 in detecting precipitation, especially light precipitation in the Yangtze River basin, indicating the great potential utility in hydrological applications. However, its poor skills when retrieving data for high precipitation events and for detecting complex terrain environments remains, leaving room for IMERG v5 to improve its inversion algorithm.
1. Introduction
Precipitation is one of the most important parts of the terrestrial ecosystem [1,2]. The accurate and high-resolution precipitation observation has great potential utilities in the fields of hydrology, meteorology and agriculture [3]. Conventionally, ground gauge networks are considered as the most reliable and directive methods to observe rainfall and are used in most studies as a reference to compare and validate satellite-based precipitation products [4]. However, rain gauge stations are usually sparse over the continent and expensive in relatively poor areas. Therefore, rain gauge observations have many limitations of their spatiotemporal resolution to be able to provide a perfect picture of precipitation. The weather radar, which can provide real-time rainfall amounts at high spatiotemporal resolutions to some degree, suffers from some types of errors, such as random errors, systematic errors and lack of radar signals at some global scales, which can affect the accuracy of their products [5,6].
In recent years, with the rapid development of remote sensing techniques, more quasi-global satellite precipitation products have been produced and released to the public, such as Tropical Rainfall Measuring Mission (TRMM), Climate Prediction Center morphing technique (CMORPH), Precipitation Estimation from Remotely Sensed Information using Artificial Neural Networks (PERSIANN), Climate Hazards Group Infrared Precipitation with Station data (CHIRPS) and the Global Precipitation Measurement (GPM), etc. [7,8,9,10,11]. Compared to ground rain gauges and weather radar, satellite-based precipitation products overcome their limitations by generally having a wider quasi-global coverage and higher spatial-temporal resolution, which makes it possible to detect sparse and uneven distribution on the land surface [12]. Therefore, the satellite-based precipitation products have been studied and applied widely in many fields, such as flood and drought forecast, water resource management and so forth.
The TRMM satellite, with a designed orbit height of 350 km and inclination of 35°, was launched by a joint space mission conducted by the National Aeronautics and Space Administration (NASA) and the National Space Development Agency of Japan on 27 November 1997. Its temporal (3-hourly) and spatial (25 km × 25 km) resolution is much higher than the previous satellite-based precipitation products, and aims at measuring tropical and subtropical rainfall using a multi-frequency microwave, a visible far-infrared and space precipitation radar (PR) [13]. There are two kinds of products which are near-real-time (3B42RT) and research-grade (3B42) in the TRMM multi-satellite precipitation analysis (TMPA) products. The first one generally provides quick but less accurate estimates which are suitable for monitoring activities, while the latter one combines precipitation measurements from different satellite sensor systems and ground precipitation gauge stations which provide more accurate estimates and is more appropriate for research use [14]. Despite the spatial resolution and temporal resolution of the TRMM satellite being higher than the previous satellite products, it is still difficult to measure precipitation accurately on a smaller scale. On 27 February 2014, NASA and the Japan Aerospace Exploration Agency (JAXA) jointly launched the GPM satellite in Tizishima, Japan. This offers a finer and more accurate precipitation estimation than previous series, marking an era of transition from the TRMM’s to the GPM’s. The GPM satellite precipitation products, as a successor of the TRMM satellite, builds on the heritage of TRMM by improving the calibration algorithm and detection technology. Many advanced instruments are also equipped with GPM, such as the dual-frequency precipitation radar (DPR). The DPR is composed of Ku at 13.6 GHz and Ka bands at 35.5 GHz and is mounted on the core observation platform and GPM microwave imager (GMI), and has a range between 10 and 183 GHz, etc. Compared with the TRMM satellite data products, the integrated multi-satellitE retrievals for GPM (IMERG) satellite data has a relatively finer spatial resolution (0.1° × 0.1°), temporal resolution (half-hourly) and spatial coverage (from 60° S to 60° N). However, the precipitation radar and the channels of the passive microwave (PMW) imager have been upgraded and expanded, which has enhanced the detection capability of weak and solid precipitation [15]. Further, it makes it possible to detect rainfall both in arid and cold regions. At present, the GPM satellite can provide three levels of data. Level 1 data includes DPR radar power, GMI brightness temperature and so forth. Level 2 data consists of geo-geophysical data (i.e., precipitation) and an instantaneous field of view (IFOV) DPR reflectivity. Level 3 data comes from microwave-calibrated infrared (IR) satellite estimates, and merged interpolated satellite microwave precipitation estimates, which contain remote sensing and model fusion data [16]. There are three distinct kinds of products that GPM can provide. They are the near-real time version (early and late runs) and the post-real time version (final run). The first two versions of the products are produced by running the algorithm approximately 5~15 h after each observation time, while the final run version is approximately 3–4 months [17]. Although the first two products are generally designed to predict large event impacts, however, the last one is the longest daily precipitation product among all of the IMERG products. It also goes through three consecutive monthly ground validations, which includes direct statistical check (at the surface), precipitation physics validation (in a vertical columns), and an integrated science check (4-dimensional) [18], and is more compatible for research use.
Over the past decades, the evaluation of different kinds of SPPs in various regions has been studied. For example, Tang et al. [19] found the accuracy of GPM was better than TRMM in six selected typical regions of China from April to December 2014. Guo et al. [20] concluded that the calibrated GPM data had higher correlation coefficients and relative lower errors than uncelebrated GPM data over the whole China from March 2014 to February 2015. Xu et al. [21] pointed out that the GPM product tended to underestimate the number of light rain events, while the TRMM overestimated the light rain events in the rainy season of 2014 in the southern Qinghai-Xizang Plateau. Shen et al. [22] found that TRMM, PERSIANN and CMORPH can accurately reflect the temporal and spatial differences of precipitation in China.
The Yangtze River basin, which spans from the west to the east of China’s mainland, has a dense population, rapidly developing economy, and complicated climate. Under the background of climate change, this basin has suffered extreme climate events many times, thus the accurate assessment of the spatiotemporal distribution of precipitation in this area is of great significance [23,24,25]. Remote sensing data has provided a source of information for precipitation. However, its accuracy still needs to be validated before use in some areas. Although there have been many studies mostly focusing on evaluating the applicability of TRMM products [26,27,28], a small number of studies have been performed about the assessment of the accuracy of GPM products in this region. The purpose of this study is twofold: (1) To evaluate the performance of GPM IMERG v5 and TRMM 3B42 v7 precipitation products spatiotemporally; and (2) to investigate the precipitation detection capability of two kinds of satellite-based precipitation data at different rainfall thresholds. This study makes a quantitative assessment of the accuracy of the GPM and TRMM satellite precipitation products in contribution to hydrological predictions, extreme disaster prevention and subsequent studies in this region. This work might be of benefit for the improvement of hydrological predictions, extreme disaster prevention and subsequent studies by using satellite precipitation products.
2. Materials and Methods
2.1. Study Area
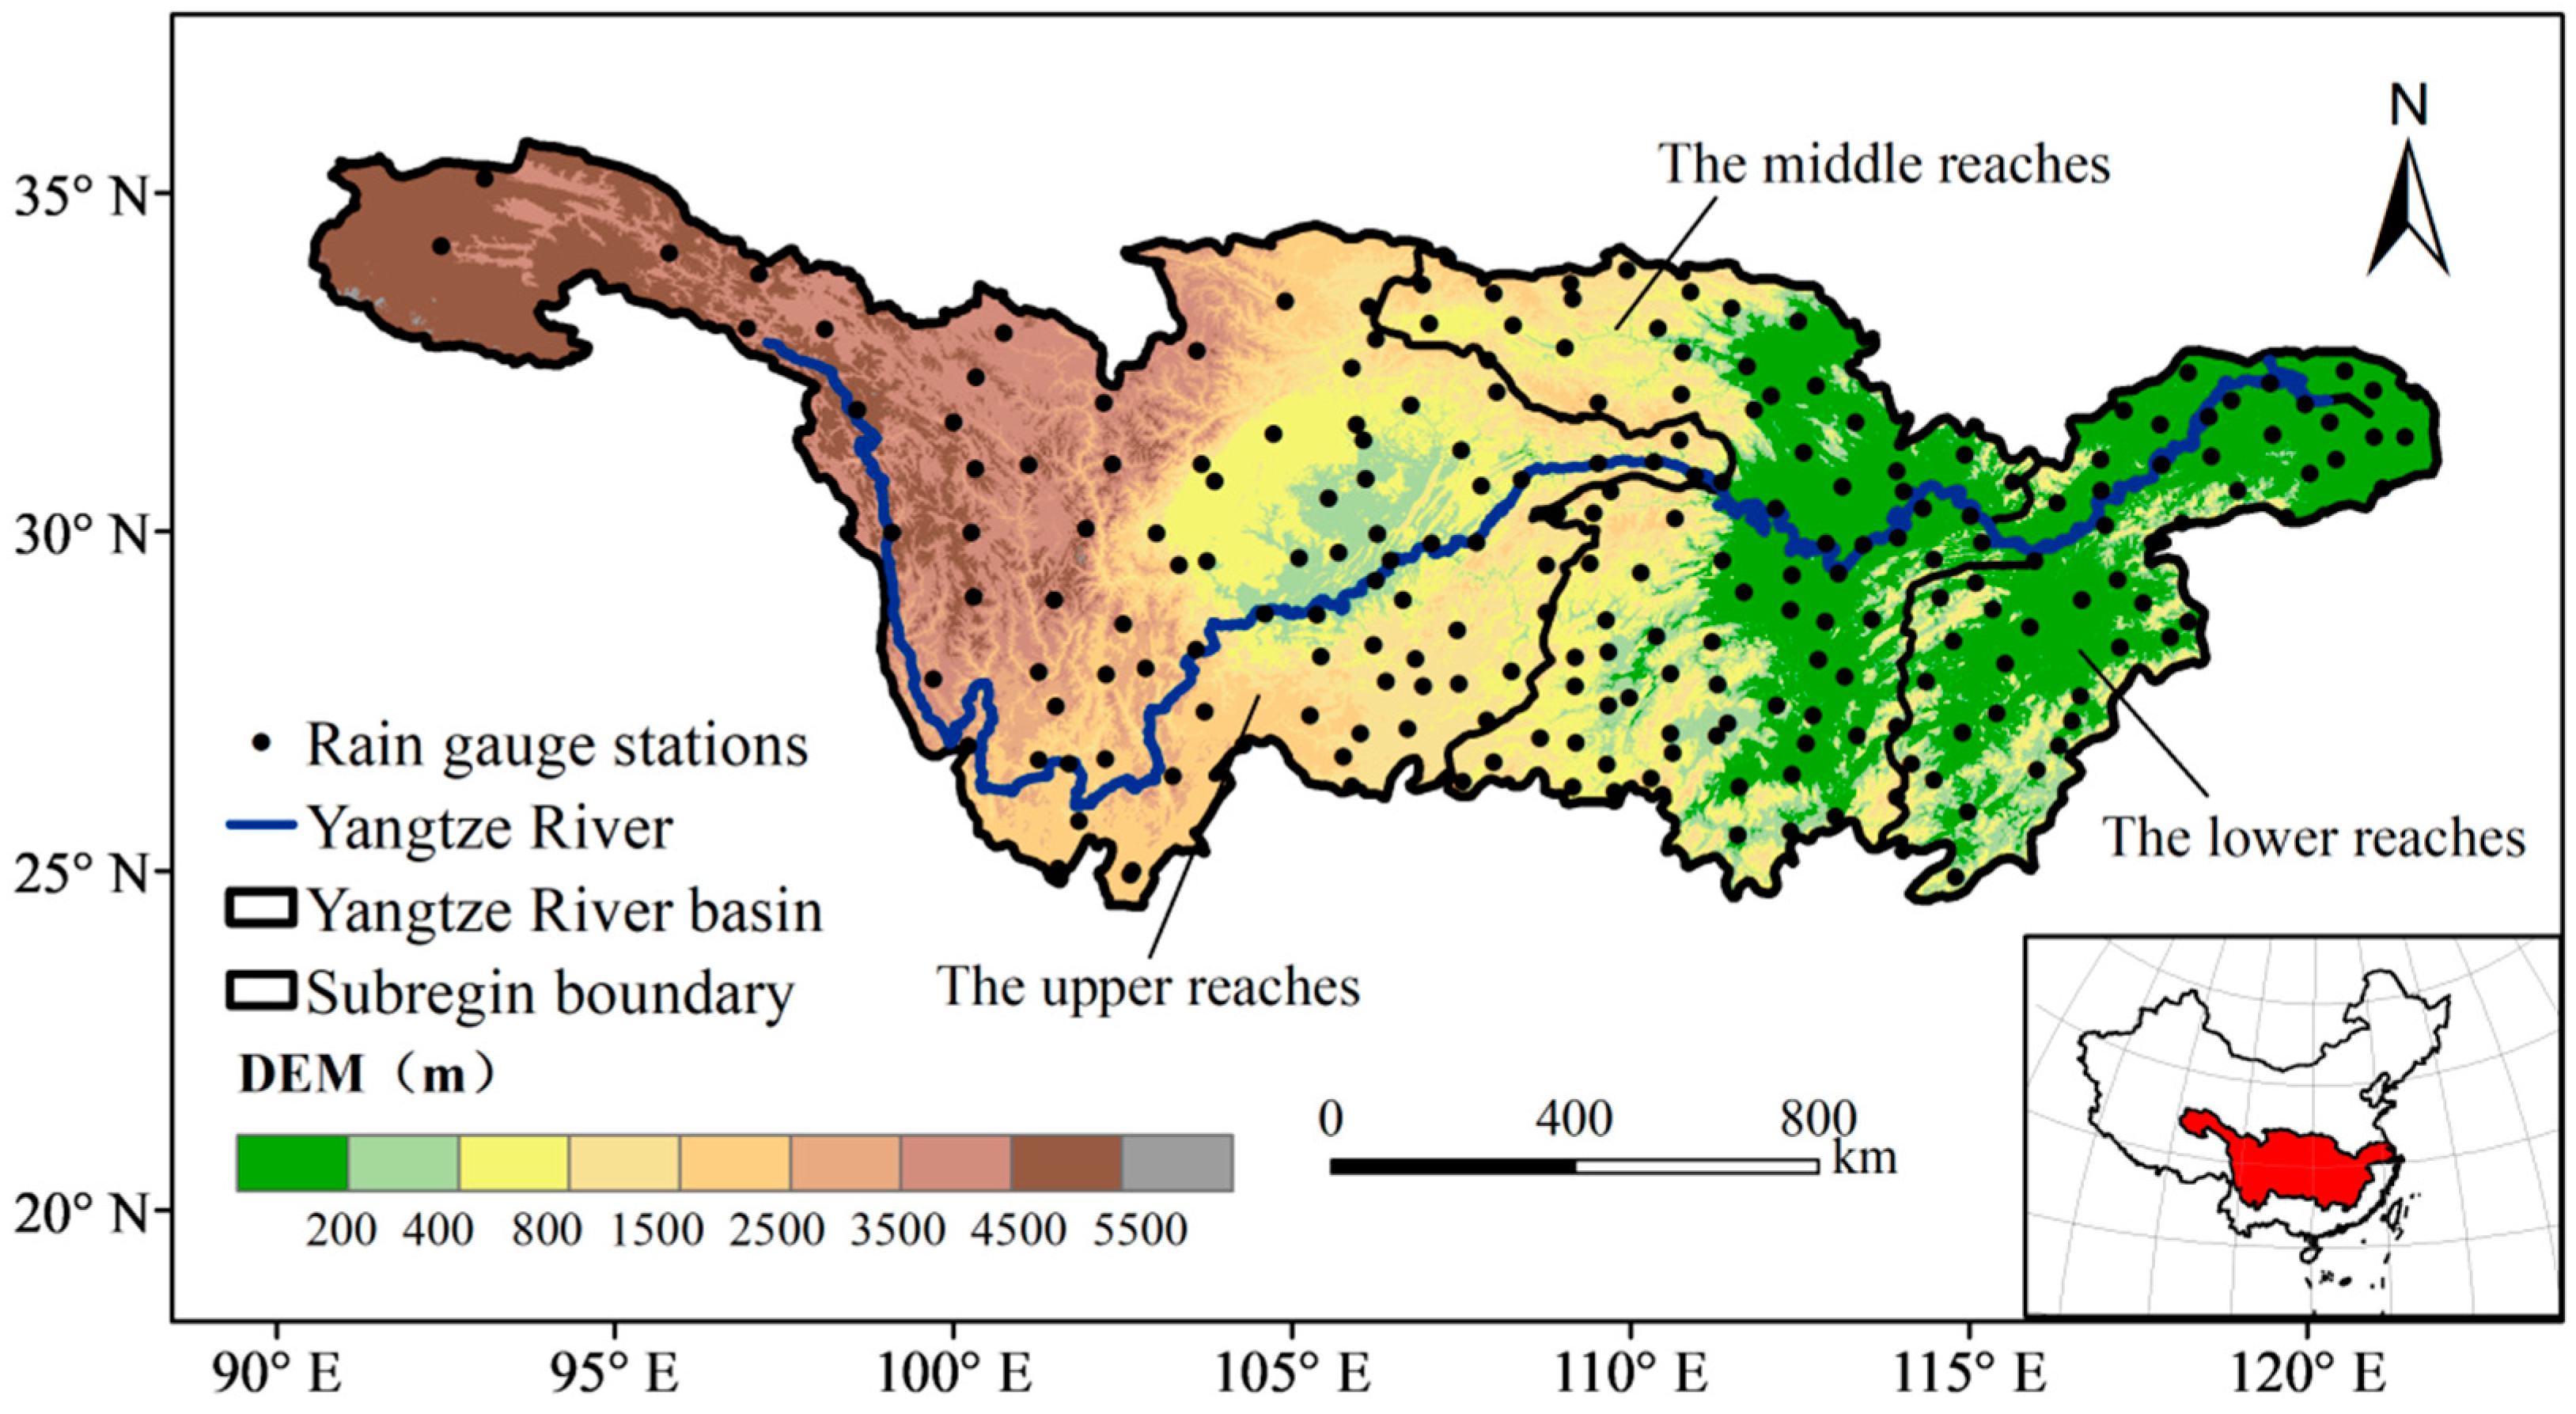
The study area is the entire Yangtze River basin which is located within 90°33′ E~122°25′ E and 24°30′ N~35°45′ N, with a total watershed area of approximately 1.8 million square kilometers and regional differences in topography [29]. As Figure 1 shows, the terrain of the whole basin is high in the west and low in the east, and the plain area mainly distributes in the east of the watershed, while many star-studded mountains and glaciers stand in the west. The Tibetan Plateau, known as “the third pole of the world” [30], with average altitudes above 4500 m, is the origin of the Yangtze River. Based on the average annual precipitation and the effects of complex terrains, the whole basin can be classified into three different climate zones of a semi-arid climate district, semi-humid climate district and humid climate district [31].
According to the location of key hydrological stations of Yichang and Hukou in the main Yangtze River, the whole basin can be divided into three parts (Figure 1). The upper reaches, which has characteristics of higher elevation and complex terrain, is easily effected by air masses that originated from Siberia, and thus has cold and dry winters and warm summers [32]. The middle and lower reaches, which are mainly controlled by the monsoon climate, always has a hot and rainy summer and a mild and wet winter.
2.2. Data and Processing
The daily rain gauge measurements from 224 rain gauge stations over the Yangtze River basin from April 2014 to December 2017 were derived from the China Meteorological Data Network of the National Meteorological Information Center (http://data.cma.cn). For strict quality control, an examination of erroneous values and discarded questionable data, amongst others, has been applied for ensuring the high quality of the rain gauge data [22]. The locations of the rain gauge stations have been shown in Figure 1.
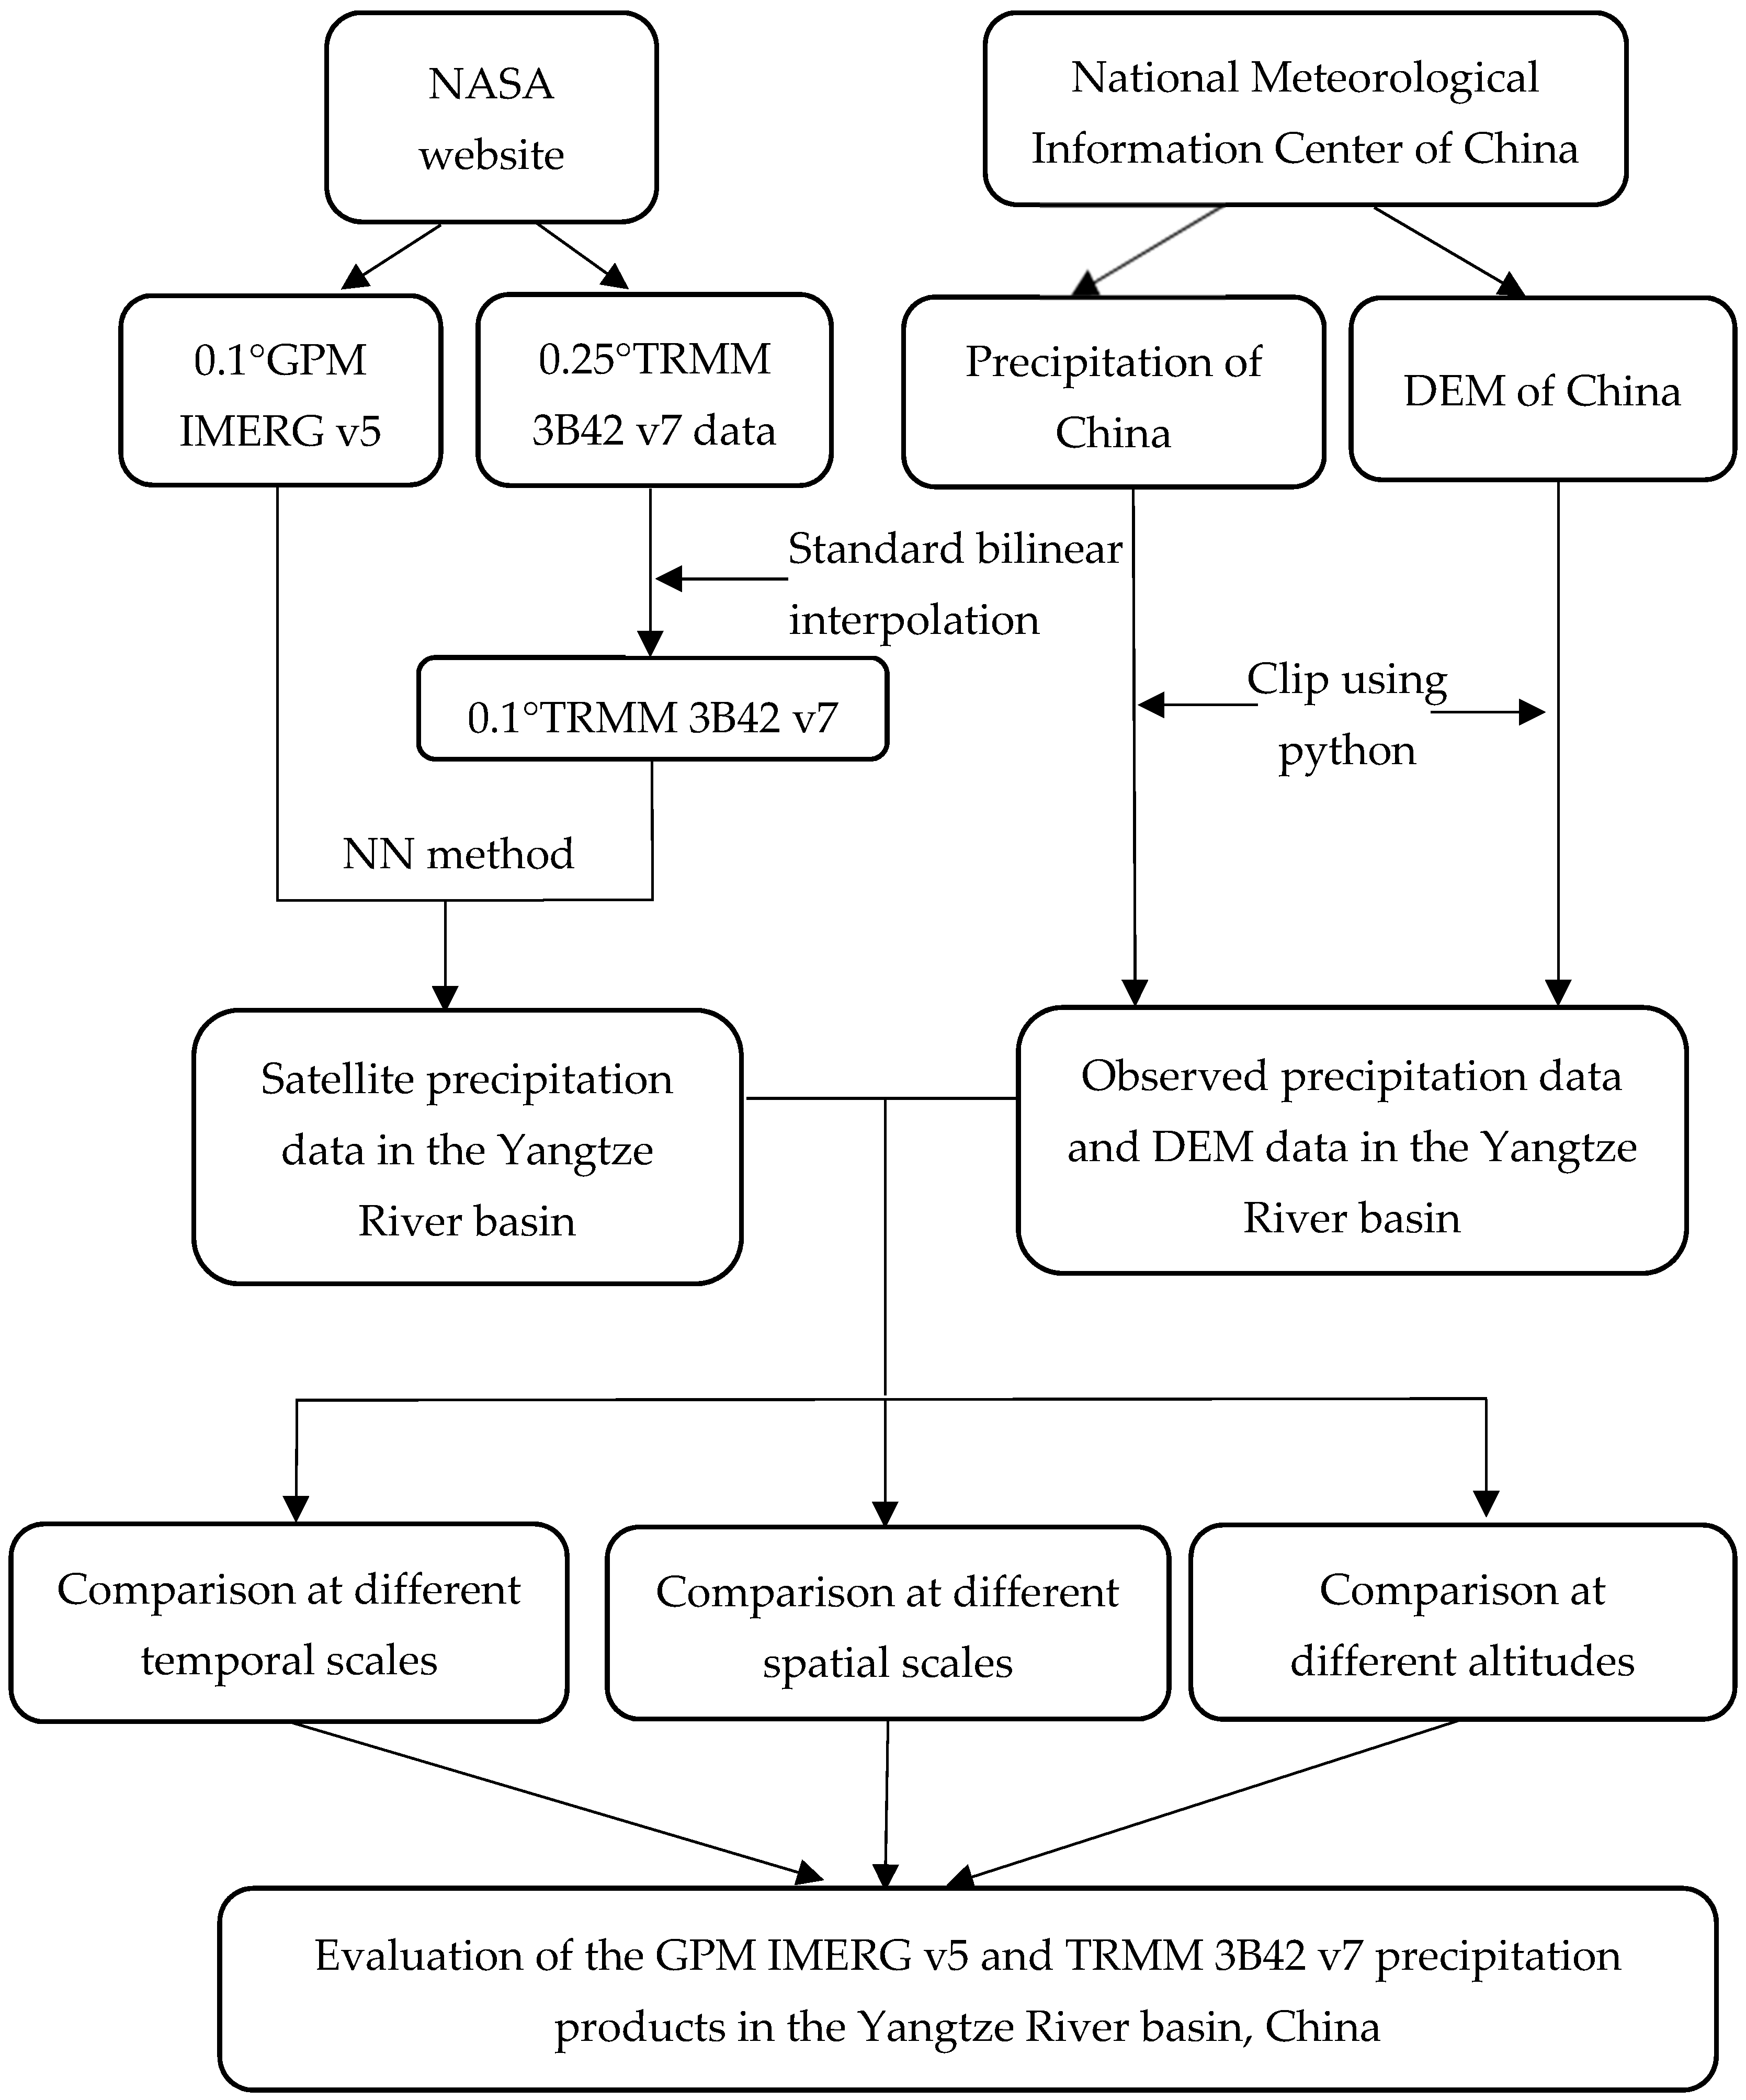
The GPM and TRMM data were both downloaded from the NASA Precipitation Measurement Program website (http://www.pmm.nasa.gov). In this study, the Level 3 calibrated GPM IMERG Day 1 Final Run v5 and the TRMM 3B42 version 7 daily precipitation data over the Yangtze River basin from April 2014 to December 2017 were used. The monthly and annual precipitation were obtained by the accumulation of daily precipitation data.
Due to the different spatial resolutions of GPM (0.1°) and TRMM (0.25°), the 3B42 v7 data was resampled to the 0.1° spatial resolution as IMERG v5 data using the standard bilinear interpolation method so as to make them comparable [33]. As topography usually plays an important role in the performance of interpolation, in this paper, a principal component analysis was used to deal with the impact elevation on the interpolation algorithm in the studied area. By adapting a stepwise regression method, insignificant variables were removed, and the remaining explanatory variable was optimal. Therefore, the principal-component and stepwise-regression methods were applied to establish the relationship between SPPs data and DEM (Digital Elevation Model). The processing steps are as follows [34]:
- (1)
- Resample the DEM data to the spatial resolution of 0.25° as TRMM.
- (2)
- Extract the daily precipitation data of TRMM and DEM data at each raster, and build a principal-component and stepwise-regress model to derive regression value of precipitation P0.25°regression (mm).
- (3)
- Calculate the residual between predictive value and TRMM value P0.25°residual via Equation (1).P0.25°residual = P0.25°original − P0.25°regression
- (4)
- Use standard bilinear interpolation method to get the residual at 0.1° spatial resolution P0.1°residual.
- (5)
- Resample the DEM data to the spatial resolution of 0.1°.
- (6)
- Use the regression coefficient of 0.25° spatial resolution to calculate predictive precipitation value P0.1°regression (mm) in DEM of 0.1° spatial resolution.
- (7)
- Get the down-scaled TRMM data via Equation (2).Pdown-scaled = P0.1°residual + P0.1°regression
For the sake of minimum error between rain gauge stations, the satellite pixels that contained at least one rain gauge were employed to be evaluated in this study, while other pixels with no rain gauges were excluded. Next, the pixel point that was the nearest to the each rain gauge station geographic coordinates was used to create a time series of SPPs without interpolation (NN, nearest neighbor method). It was noted that if there were two or more satellite pixels with the same distance from one meteorological station, the average value of satellite precipitation in these pixels was taken as the satellite precipitation. These above-mentioned data processing produces can be found in Figure 2.
2.3. Methodologies
In this paper, a Pearson correlation coefficient (R), root mean square error (RMSE), relative error (RB) and mean absolute deviation (MAE) were selected as evaluation indicators to quantify the performance of two kinds of satellite precipitation products in the Yangtze River basin. The correlation coefficient R is an index to quantify the agreement between satellite products and gauge observations. The RMSE, MAE and RB can measure systematic bias and an average error magnitude between satellite precipitation and gauge observations. The calculation formulas of these indicators are as follows.
To identify the probability of two kinds of satellite products describing rain/no rain events at a daily time step, several other types of evaluation metrics were applied for this study, such as POD, FAR, f-BIAS. The formulas for the three indicators are also shown in Table 1: POD can be used to assess the rate of precipitation events that were correctly detected, which reflected the accuracy of the satellite detection; FAR can be employed to indicate the ratio of rain occurrences falsely alarmed among total events that the satellite detected; f-BIAS denotes the fraction of the satellite precipitation product that overestimates or underestimates the observed precipitation. According to the classification of precipitation levels in the synoptic, the precipitation threshold of 0.1 mm/d, 1 mm/d, 5 mm/d, 10 mm/d, 25 mm/d, 50 mm/d were defined to evaluate the potential of satellite products for precipitation detection. Particularly, the rainfall rate thresholds of 0.1 mm/d, 10 mm/d, 25 mm/d, and 50 mm/d represented the rainfall events of raining or not-raining, light rain, moderate rain and heavy rain, respectively [35]. Then, the parameter values (H, F, M, Z) listed in the following 2 × 2 contingency table (Table 2) were calculated according to each threshold value.
3. Results
3.1. Temporal Distribution of IMERG v5 and 3B42 v7 Precipitation Data
Figure 3 displayed the scatterplots of two SPPs against gauge observed precipitation in the Yangtze River basin at different time scales, and a series of corresponding quantitative evaluation metrics was also obtained. Notably, three error indicators (Bias, RMSE and MAE) were based on the same unit of mm/d in this study to make them comparable. It can be seen that many points were well scattered around the best-fit line (1:1 reference line) at annual and monthly scales. However, at a daily scale, the points for both SPPs were distributed far from the reference line with many polarization feature values presented at the same time. As expected, IMERG v5 and 3B42 v7 showed quite a high degree of agreement with rain gauges at annual and monthly scales (R > 0.9), in which the Rs of IMERG v5 was slightly better than 3B42 v7. However, for the daily scale, a lower correlation with lower Rs were exhibited for both SPPs (RIMERG v5 = 0.44, R3B42 v7 = 0.46). The RB value for each SPPs at three time scales was similar, and generally showed a single digit of positive value, which indicated there was a small magnitude of overestimation for IMERG v5 and 3B42 v7. Moreover, it can be also concluded that IMERG v5 had a greater precipitation overestimation compared with the 3B42 v7 product. As far as RMSE and MAE were concerned, both SPPs displayed the highest value at a daily scale, and the lowest at annual scales. IMERG v5 tended to have lower RMSE and MAE values than 3B42 v7 in the Yangtze River basin, except for the daily timescale.
3.2. Spatial Distribution of IMERG v5 and 3B42 v7 Precipitation Data
3.2.1. Spatial Distribution of Mean Annual Precipitation
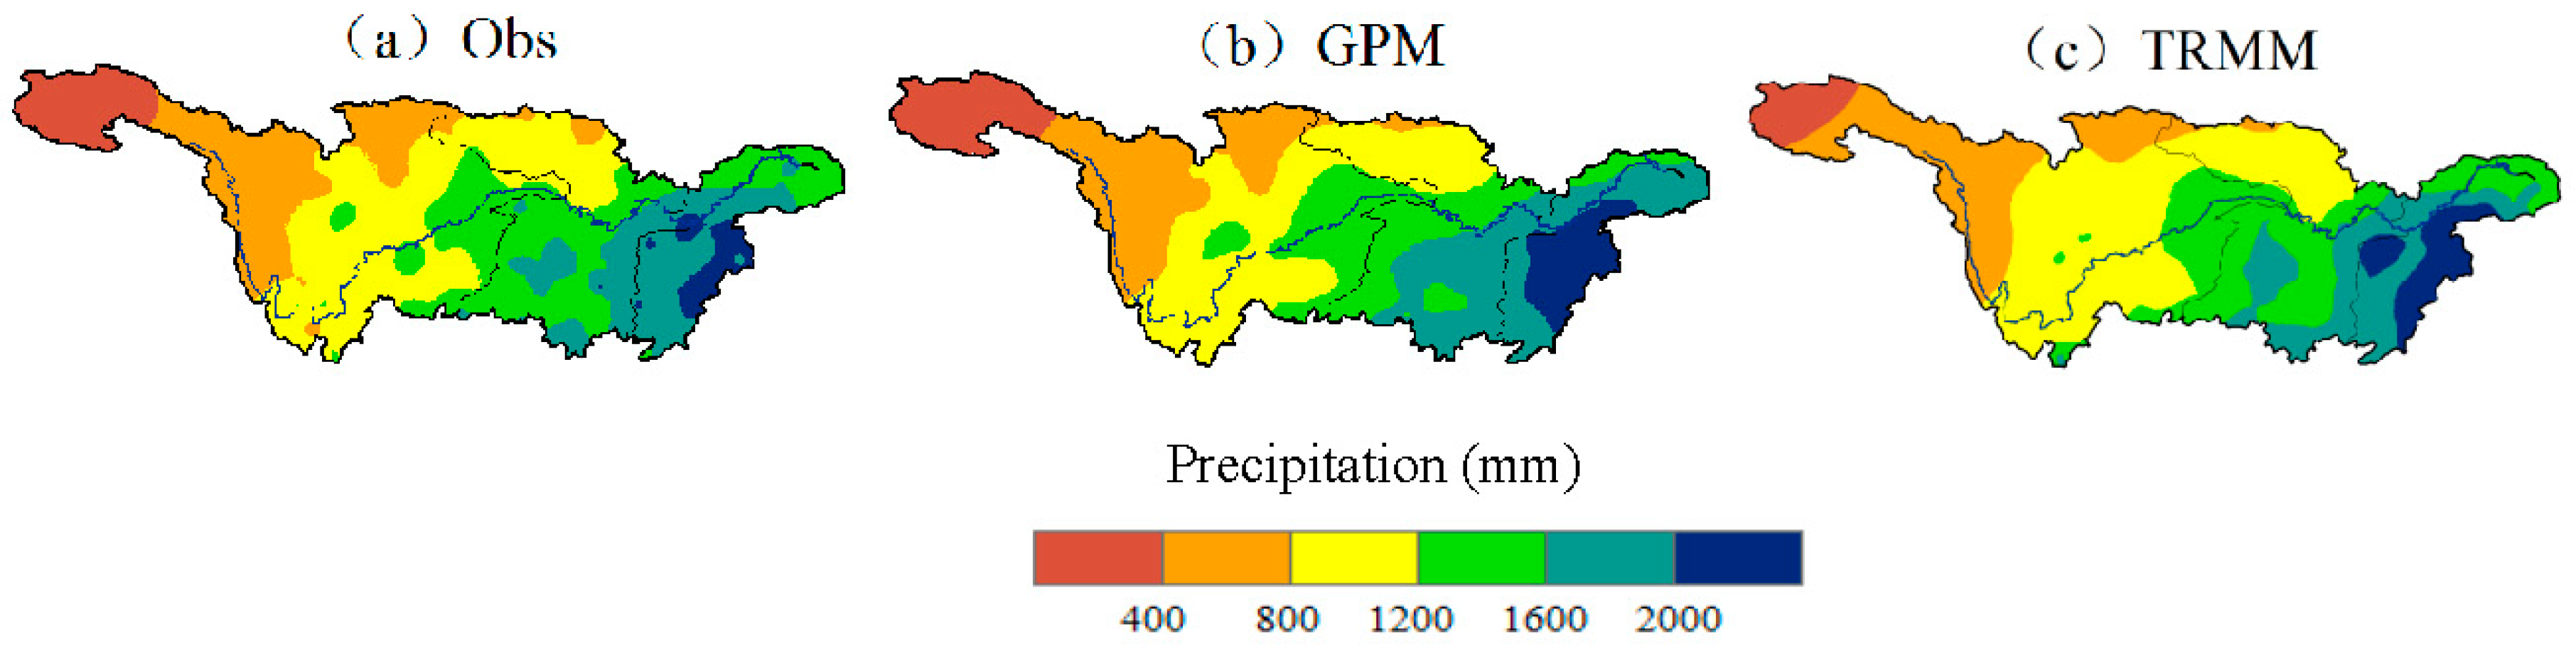
Figure 4 showed the spatial distributions of observed and satellite-estimated mean annual precipitation from 2015 to 2017 in the Yangtze River basin. It can be found that the observed rainfall decreased from the southeast to the northwest in the basin, and the 400 mm dividing line was mainly located at the region near the source of the Yangtze River, where the elevation is more than 3000 m. The 800 mm dividing line was distributed along the western edge of Sichuan basin, at the boundary of the subtropical monsoon region and plateau mountainous climate area. The 1200 mm precipitation line was located along the eastern edge of the Sichuan basin, which is mainly affected by the East Asia summer monsoon. The Ganjiang River basin, which is in the lower reaches, had the most precipitation of more than 2000 mm/year.
Intuitively, the spatial patterns of two SPPs were uniform, as precipitation decreased from the southeast to the northwest, which fitted similarly well with the gauge reference data. It was also found that the dividing line of the annual precipitation value of 400 mm, 800 mm and 1200 mm were similar to the observation values. Nonetheless, the differences between two SPPs and ground references should not be neglected. For example, IMERG v5 overestimated the range of rainfall rates > 2000 mm/year in the lower reaches of Yangtze River basin, while the 3B42 v7 product underestimated the range of precipitation <400 mm/year in the source of the Yangtze River. By comparison, the 3B42 v7 failed to detect the precipitation in the Sichuan basin by showing a striking underestimation, while IMERG v5 was more suitable for characterizing the spatial distribution of the precipitation in this area with a slight overestimation.
3.2.2. Spatial Distribution of Average Monthly Precipitation
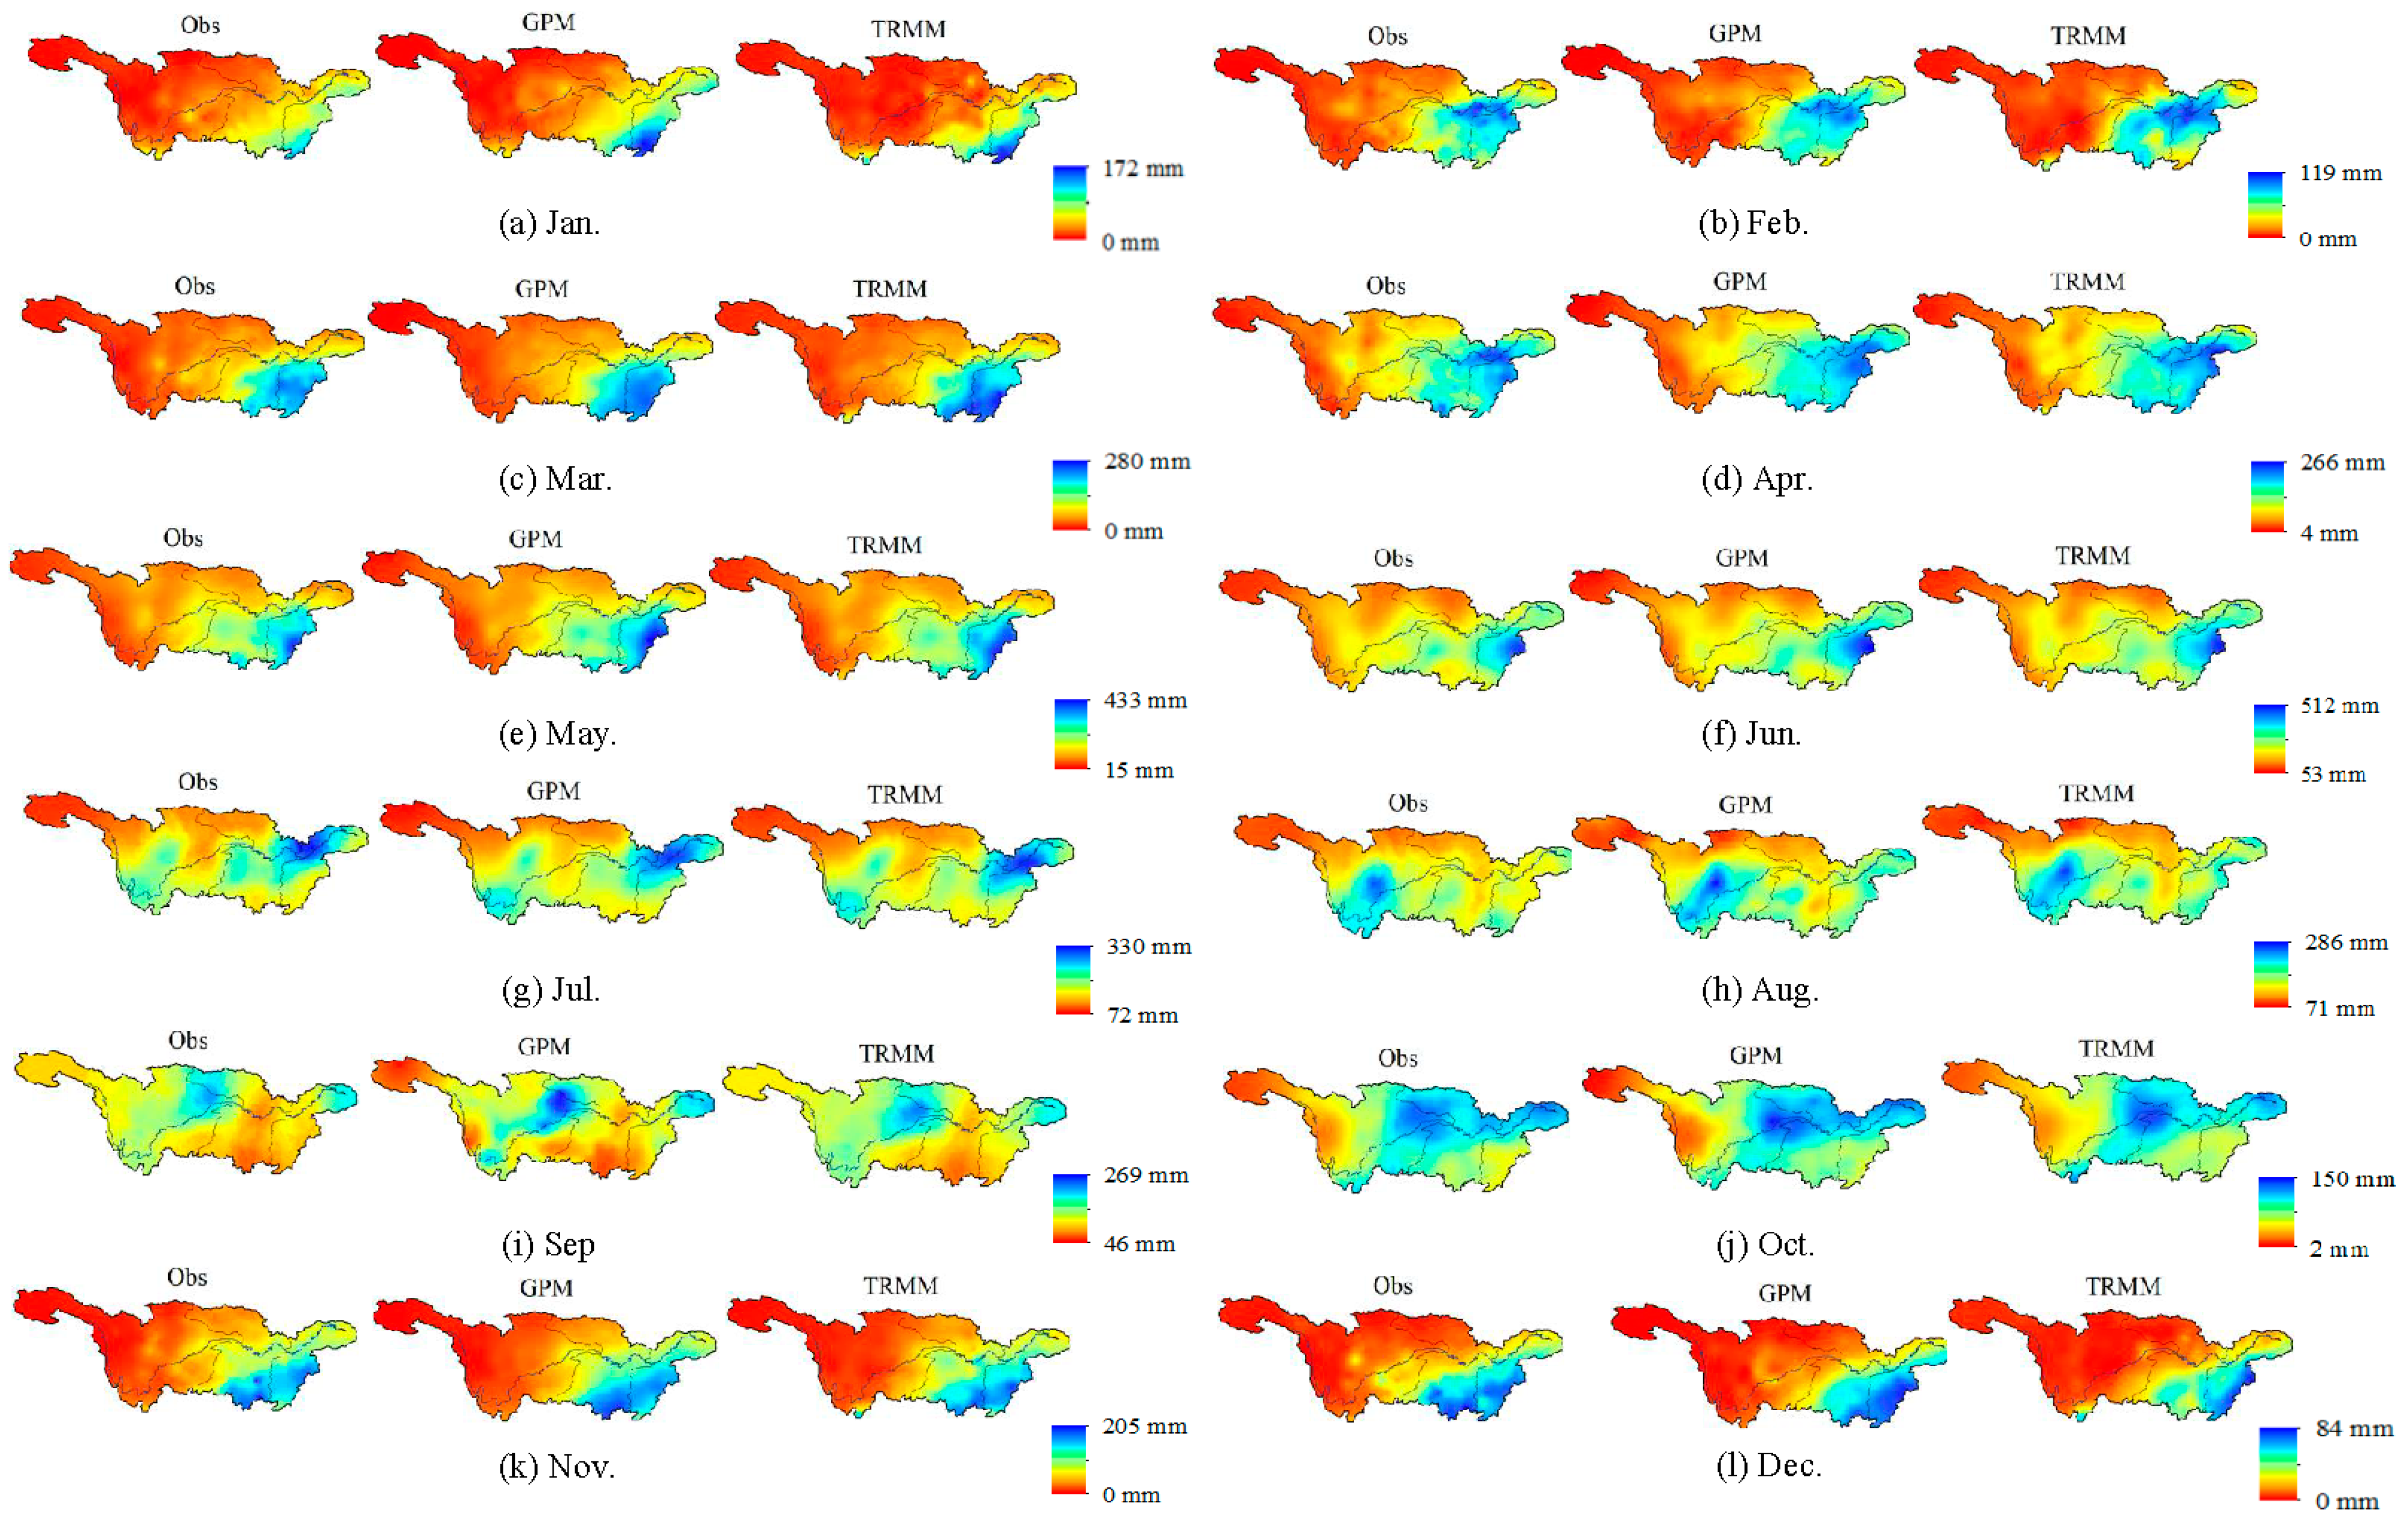
As shown in Figure 5, the monthly precipitation presented the characteristics of being higher in summer months and lower in winter months, in that the rainfall was concentrated in June, while the least precipitation appeared in December. Despite being affected by a cold and dry air mass from Siberia, the northwestern part of the Yangtze River basin had a lack of water vapor transport and dynamic forcing, thus the rainfall in this region was poor from November to May the next year. However, the precipitation in southeastern part was relatively abundant because of the mild climate and the effect of the southern branch trough. From June to September, the spatial distribution of precipitation had the feature of being higher in the south, lower in the north, in that the main rain belt was located in the region of Yangtze River estuary. This was attributed to the heavy rainfall caused by the Meiyu front in the northwest edge of the subtropical high. From September to October, with the western Pacific subtropical high lowering south and the cold air becoming active, the rainfall in the southern part of Yangtze River basin was even less than the northern part, which was located at the edge of the subtropical high at that time.
3.2.3. Spatial Distribution of Daily Precipitation
In order to investigate the spatial distribution of different precipitation thresholds, seven precipitation categories (P = 0, 0.1, 1, 5, 10, 25, 50 mm/day) and probability density functions (PDF) were employed to evaluate the detectability of two kinds of SPPs. It should be noted that PDFc is the percentage of detected precipitation events at a certain rainfall threshold. This has been widely used by scholars worldwide to quantify the ability of SPPs to retrieve various precipitation thresholds [38,39,40,41].
Figure 6 exhibited that the spatial distribution of various rainfall rates were different in the Yangtze River basin. For 0 < P ≤ 10 mm/day (Figure 6a–e), the PPDFc in the western and middle parts of the basin were generally larger than the eastern regions, while the PDFc of rainfall rates > 10 mm/day in the southeastern parts was higher than the northwestern parts. This was mainly because the southeastern parts of Yangtze River basin were under good heat and water vapor conditions, which was apt to form heavy rainfall events. However, this region was also more easily affected by typhoons in the summer seasons. In general, the PPDFc for rainfall rates > 25 mm/day was smaller than <25 mm/day. This was because the heavy rainfall events (>25 mm/day) usually occur in the summertime, while the light and moderate rain (<25 mm/day) can occur throughout the whole year.
As for IMERG v5, the spatial distribution pattern of P = 0 and 0 mm < P < 0.1 mm was quite different from the observed pattern, which was probably because the selected range was small. The subtle deviation generated by the satellite estimation can lead to great errors in spatial distribution patterns. During the rainfall of 0.1–5 mm/day, IMERG v5 showed an overestimation in most parts of the basin, especially in northern regions in the mid-lower reaches. This may be due to the flat terrain and mild climate conditions in these areas which contribute to acquiring raindrop size distribution products by DPR that are embedded in IMERG v5. However, its accuracy had also changed which may be due to its high sensitivity to light rainfall events, and therefore the overestimation was displayed in this threshold of precipitation [42]. When rainfall rates > 50 mm/day, IMERG v5 obviously overestimated in the lower reaches corresponding to low-altitude areas. Perhaps, the main reason may be that this category of precipitation is usually induced by short-lived convective storms progress. Therefore, IMERG v5 was not accurate enough to detect precipitation particles in this produce [42].
However, serious deviations were shown in estimating rainfall events <5 mm/day for 3B42 v7. For example, it seriously overestimated the PDFc when P = 0, significantly underestimated when 0 mm < P < 0.1 mm, and it also underestimated the PPDFc in the east of the Hengduan Mountains. During the rainfall of 5–10 mm/day, although the spatial distribution pattern of the PDFc index was close to the observed value, an underestimation was also displayed. By comparison, 3B42 v7 showed better accuracy in reproducing precipitation when rainfall rates > 10 mm/day, but the overestimation in the lower reaches should also not be neglected. These mismatches with the observed values may have been primarily due to the PR and TMI embedded in TRMM satellite not being sensitive due to heavy and light rainfall events. Thus, greater unexpected errors may occur when detecting extreme precipitation events.
In general, IMERG v5 outperformed 3B42 v7 in characterizing the spatial distribution pattern for different precipitation thresholds by showing the similar spatial distribution pattern of PDFc index in the Yangtze River basin. These results were consistent with Kim’s results [43] in the east of Asia based on GPM and TMPA precipitation data. The main reason, on the one hand, may be attributed to the higher spatial resolution of the GPM product, and on the other hand, it may be the GPM’s Ka and Ku wavebands that strengthen the capabilities to detect light and heavy rainfall events.
3.3. Influence of Elevation on Two Kinds of SPPs
In the previous sections, it can be inferred that the accuracy of SPPs was affected by the elevation and terrain to some degree. In this section, further research was undertaken to explore the detectability of IMERG v5 and 3B42 v7 in different altitudes.
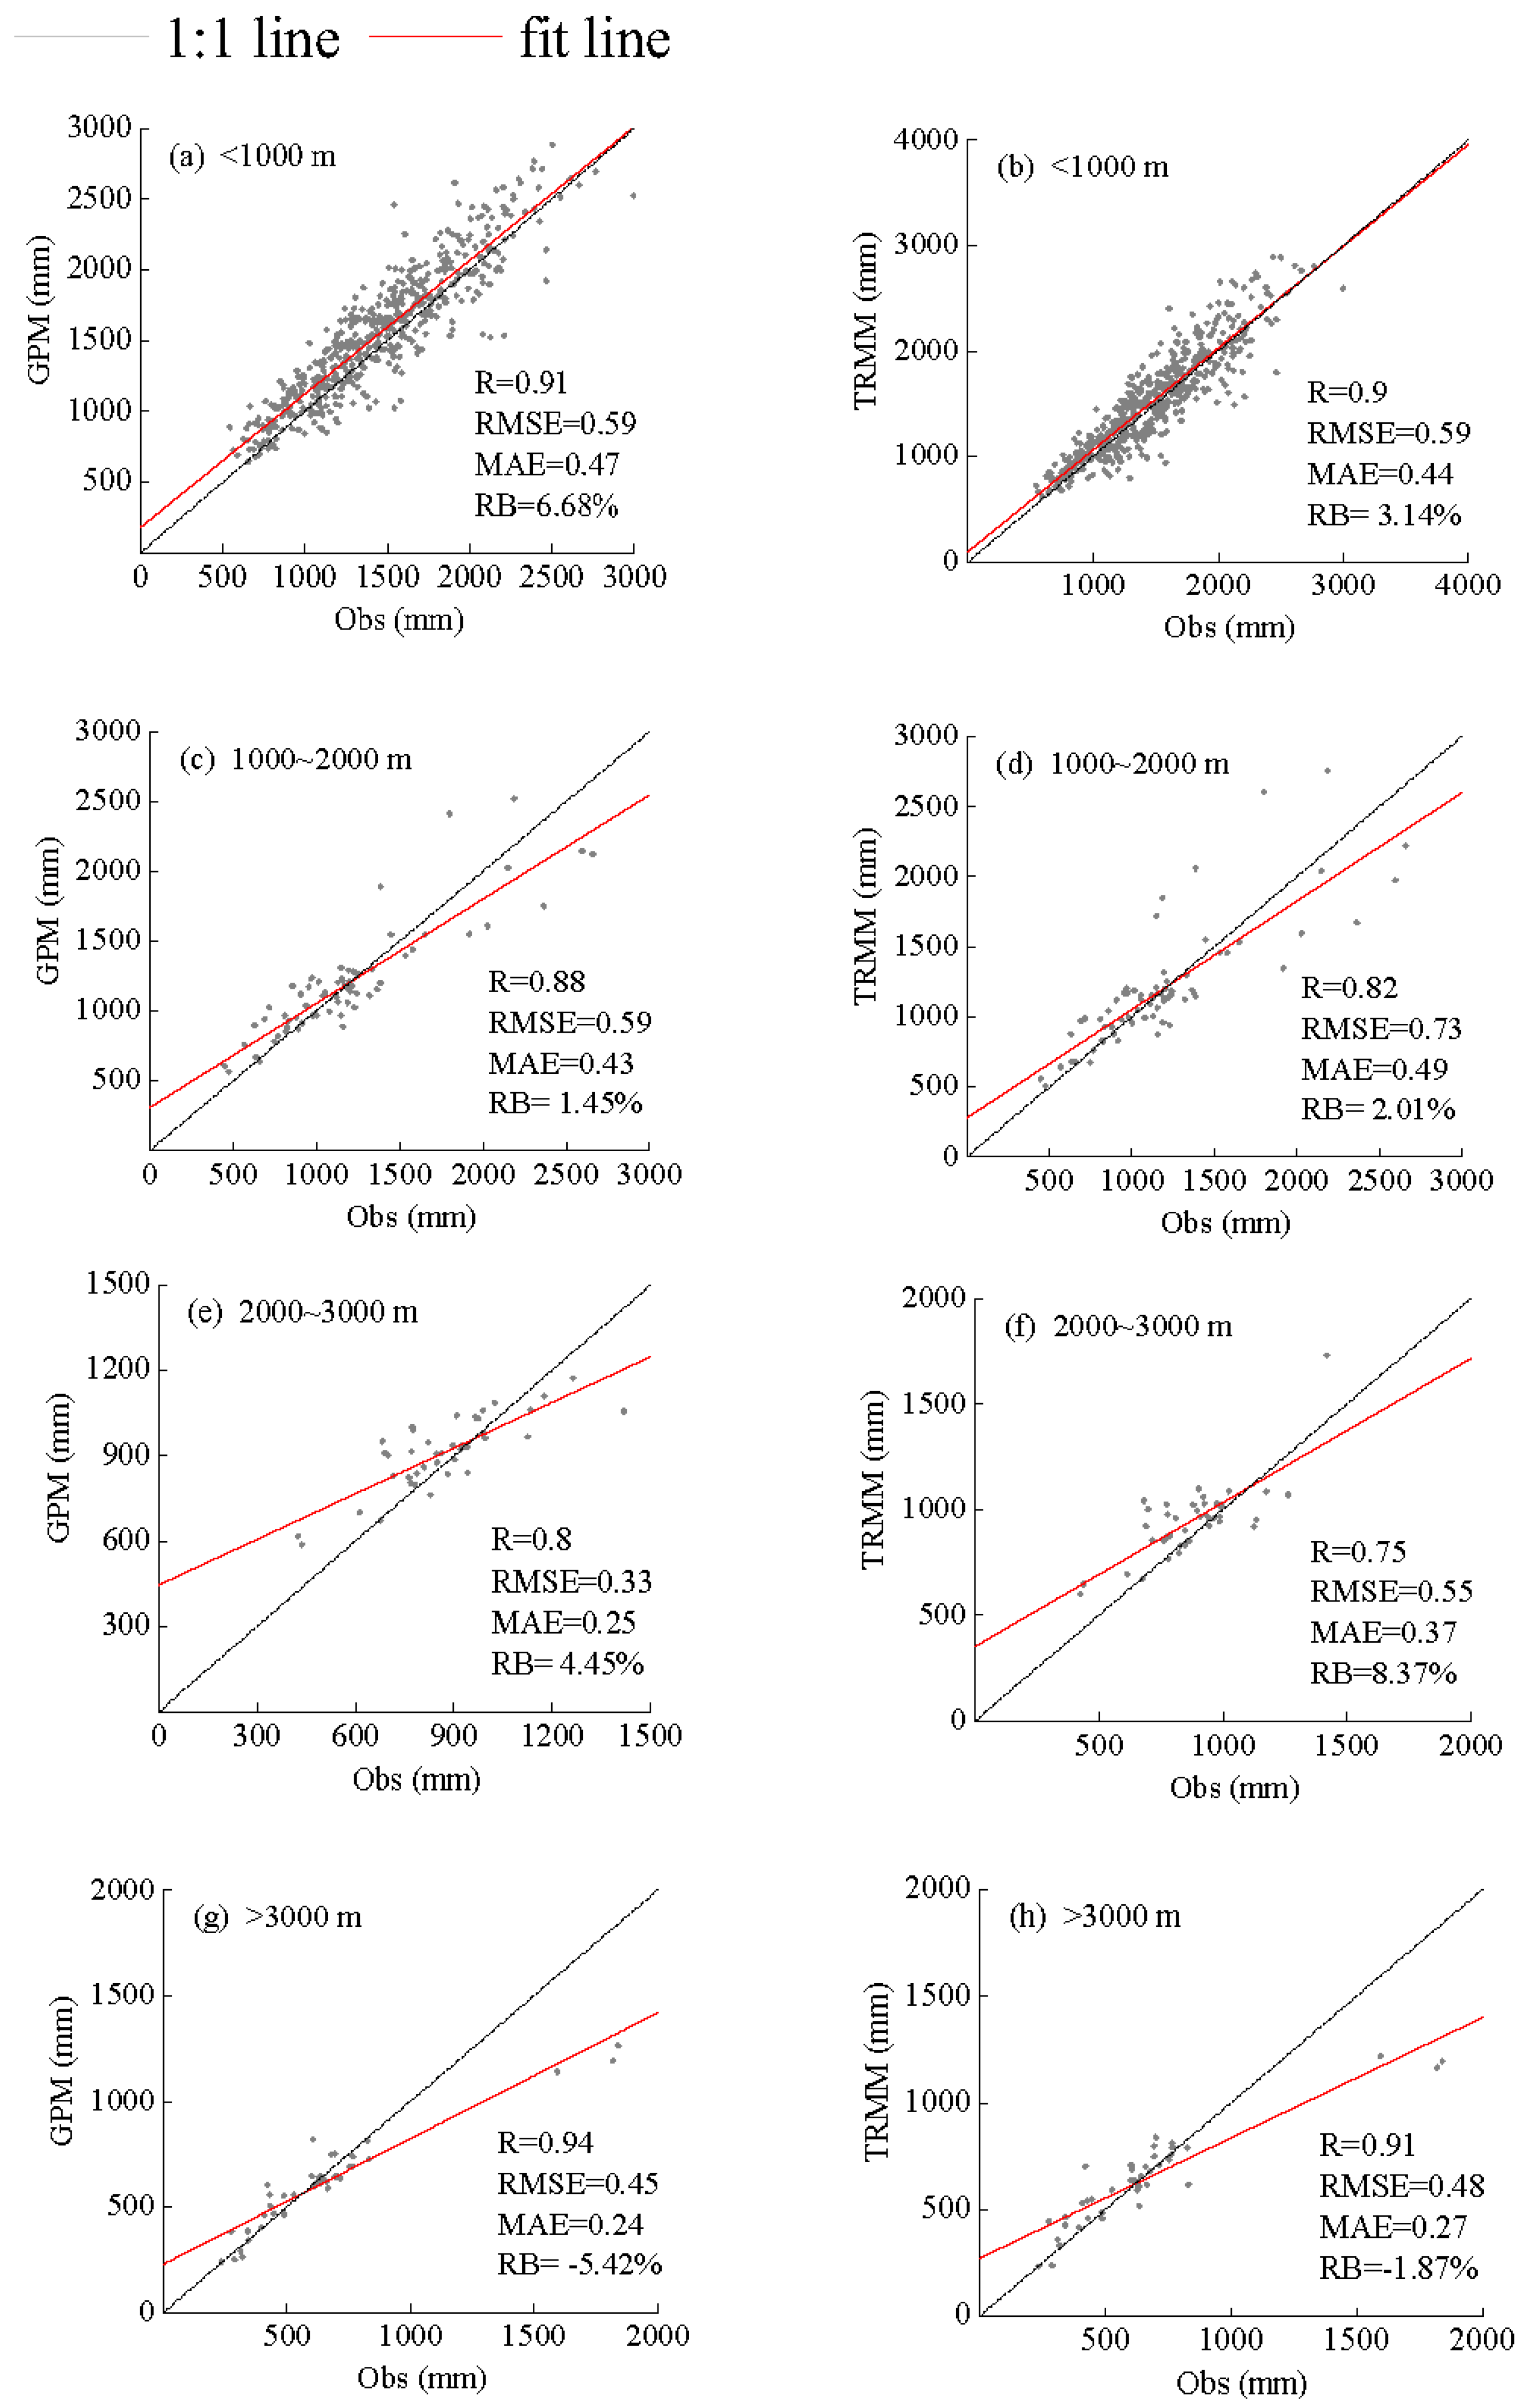
According to the elevation, 224 rain gauges in the whole basin were divided into four groups, and four kinds of evaluation indices (R, RB, RMSE and MAE) were used to evaluate the detection precision of IMERG v5 and 3B42 v7. The results were shown in Figure 7. It should be pointed that due to the bigger errors that may be caused at monthly and daily scales, annual precipitation data was selected to avoid errors. It can be seen that both of the two SPPs overestimated the precipitation below an altitude of 3000 m, especially IMERG v5 which showed the largest overestimation in the <1000 m range (RB = 6.68%). However, when the elevation exceeded 3000 m, IMERG v5 and 3B42 v7 both underestimated the precipitation, and IMERG v5 displayed a more obvious underestimation with RB = −5.42%. These findings were in accordance with Jin et al. [44] and Xu et al. [21]. Regarding the Pearson correlation coefficient, the two SPPs exhibited higher R values against the observed value, and the performance for IMERG v5 was a little more favorable than 3B42 v7 at all of the altitudes. In terms of RMSE and MAE, both IMERG v5 and 3B42 v7 showed a higher value in the lower altitude areas (<2000 m), compared to the higher altitude area (≥2000 m) regions. In comparison to the 3B42 v7 product, IMERG v5 had smaller RMSE and MAE values with the exception of the elevation which was lower than 1000 m, meaning that GPM IMERG v5 had a stable detectability in capturing the whole precipitation series generally.
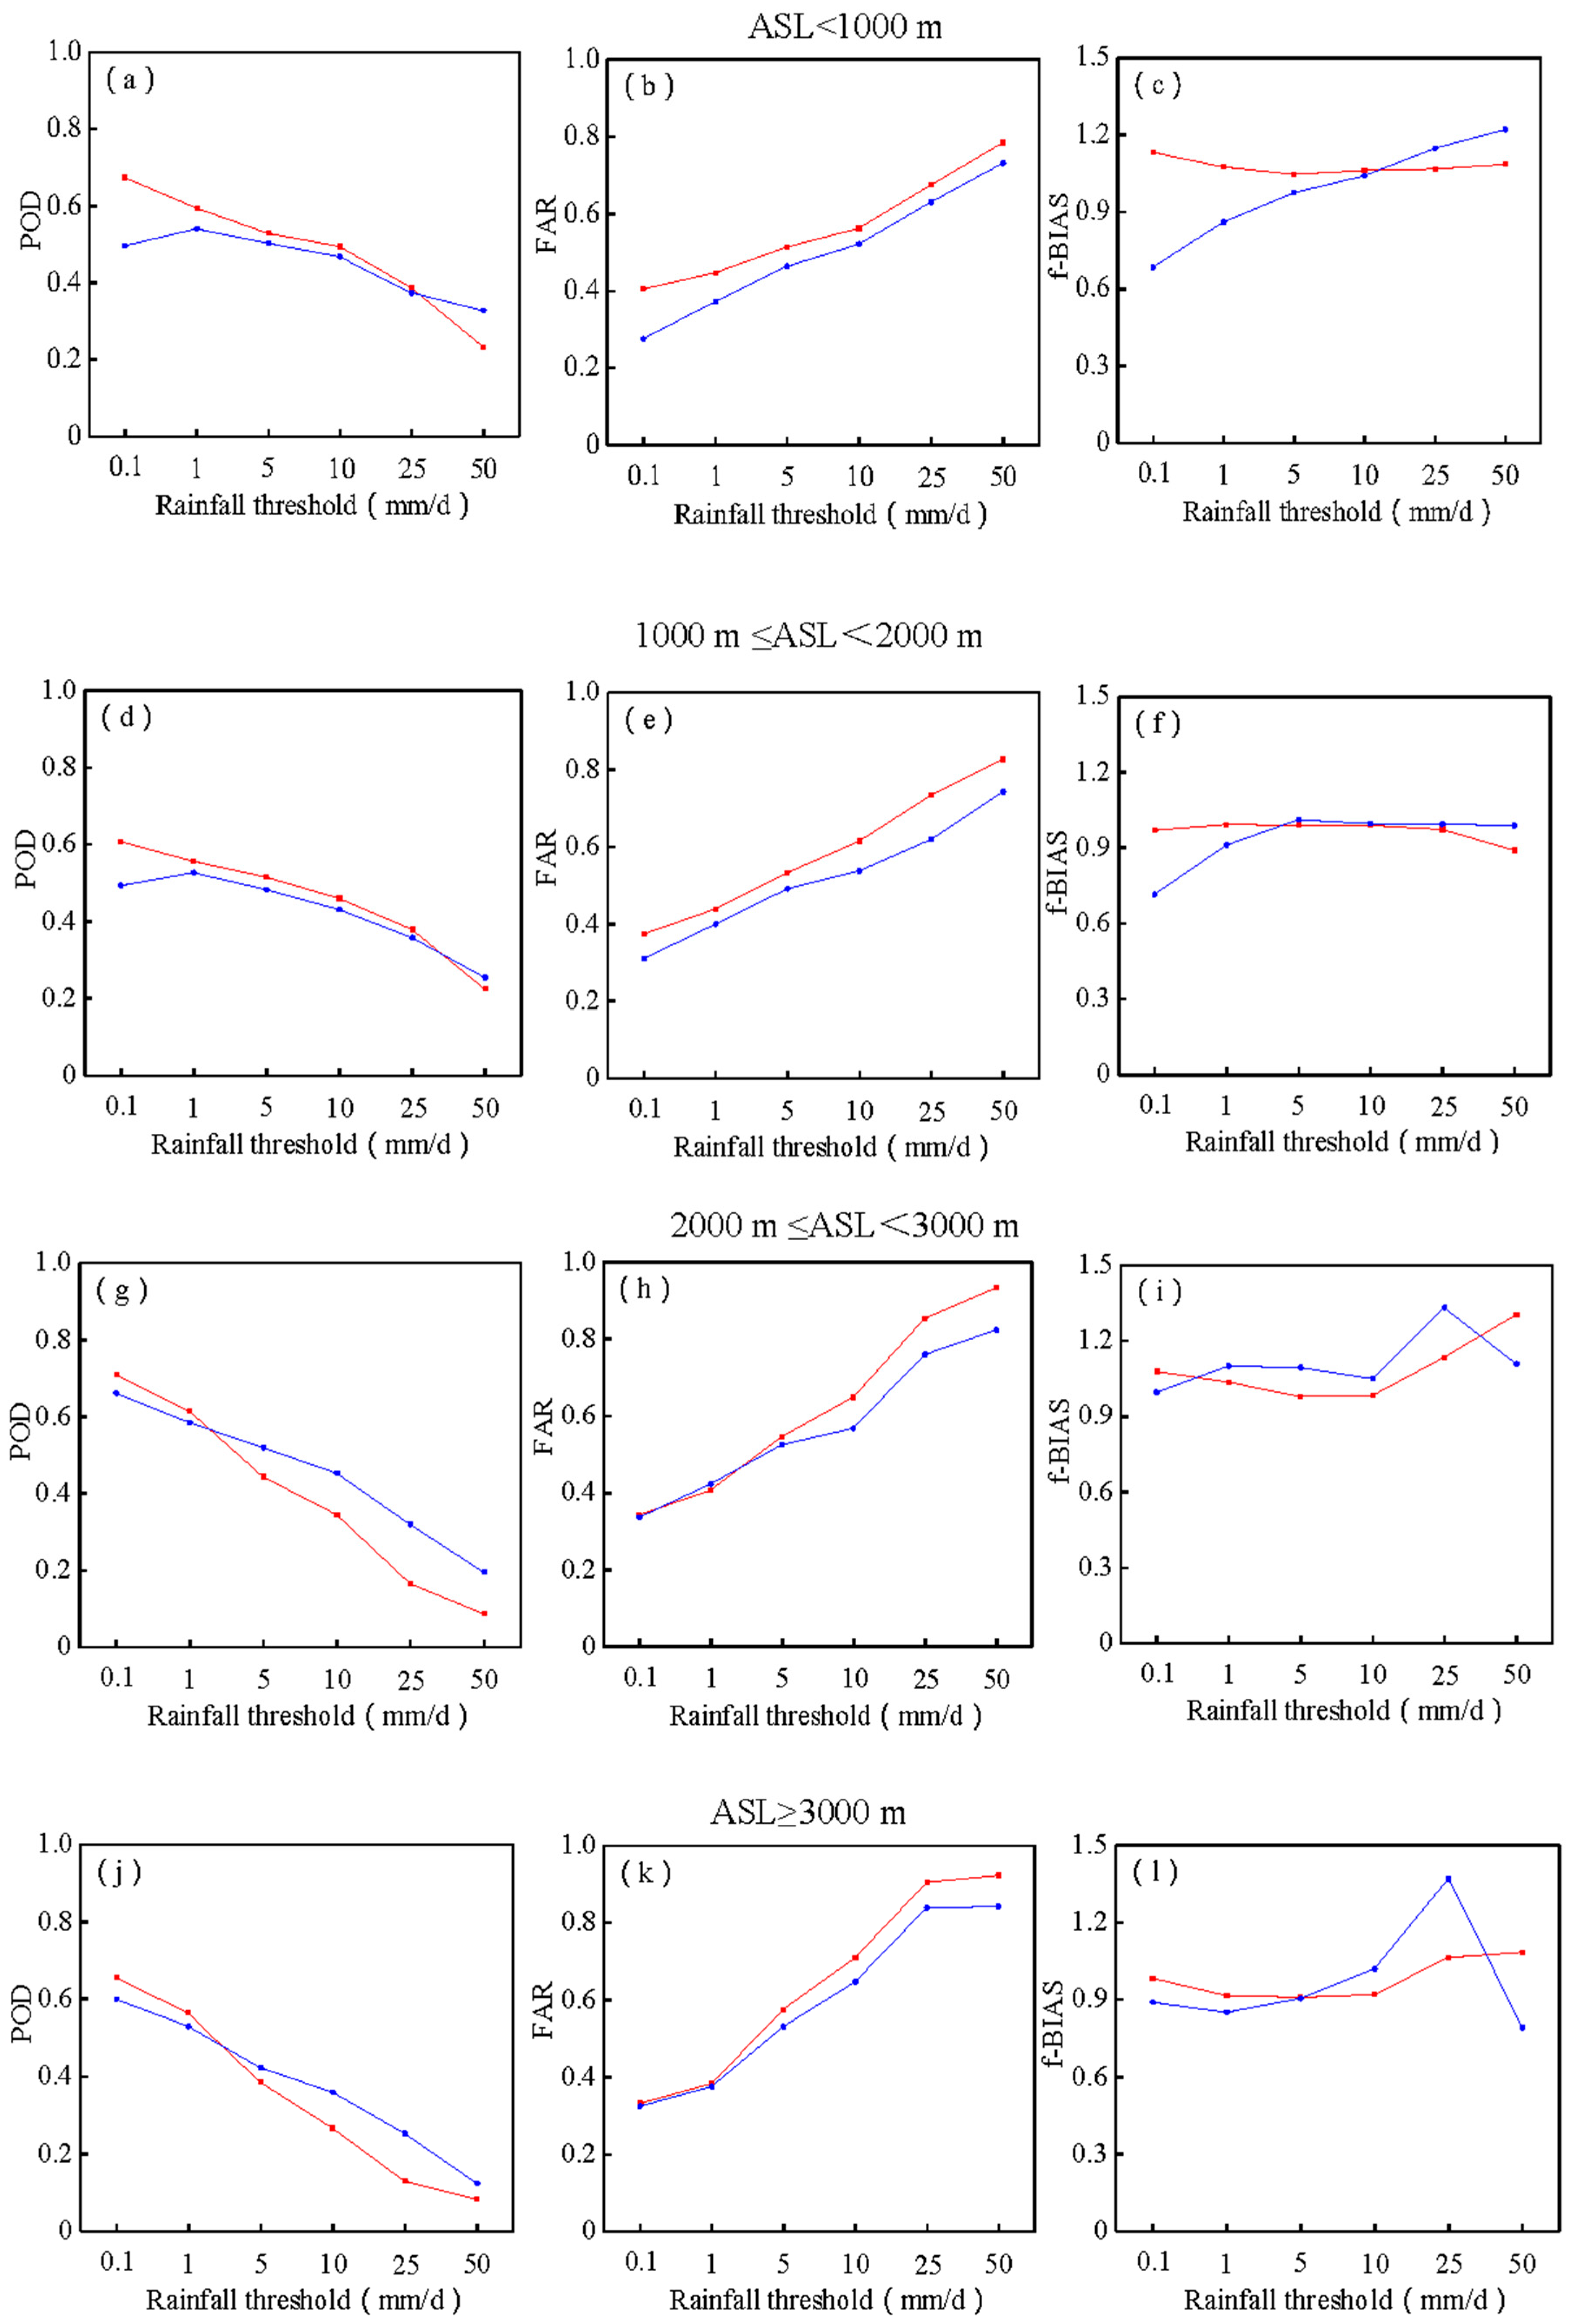
The daily results of a new set of statistical skill scores (POD, FAR, and f-BIAS) for various rain-rate ranks at different above sea levels were depicted in Figure 8. It can be found that with the increasing rainfall, PODs of IMERG v5 and 3B42 v7 both reduced, while FARs increased at the same time, which indicated that the detectability of IMERG v5 and 3B42 v7 was deteriorating with the increment of rainfall thresholds. Moreover, for the same rainfall magnitude, the PODs decreased, while FARs increased for both SPPs with the hoist of altitude, particularly in the ≥2000 m range, and the f-BIAS index varied greatly when the altitude exceeded 2000 m for both SPPs, especially in the >3000 m range. The main reason may be that the complex terrain and cold climate had limited the SPPs’ detection accuracy.
Based on the comparison of IMERG v5 and 3B42 v7, it can be concluded that the IMERG v5 product outperformed by showing a perfect POD value when rainfall rates were less than 25 mm/d in the lower-altitude areas (<2000 m). However, it can be also seen that the POD for IMERG v5 was only superior to 3B42 v7 at rainfall ranks of 0.1 mm/d and 1 mm/d when the elevation exceeded 2000 m, which highlights the limitation for IMERG v5 in the higher altitude areas. In the aspects of FAR, IMERG v5 was higher than 3B42 v7 at all the altitudes, which indicated that the sensitivity of GPM sill needed to be adjusted. However, the f-BIAS of IMERG v5 was more stable than 3B42 v7 and was closer to its perfect value (1) at all research zones. This indicated that IMERG v5 had a good accuracy in reproducing daily precipitation at all the altitudes, which may be primarily due to the Ka and Ku wave bands applied in the DPR that had combined the features of scattering and attenuation of light and heavy precipitation events.
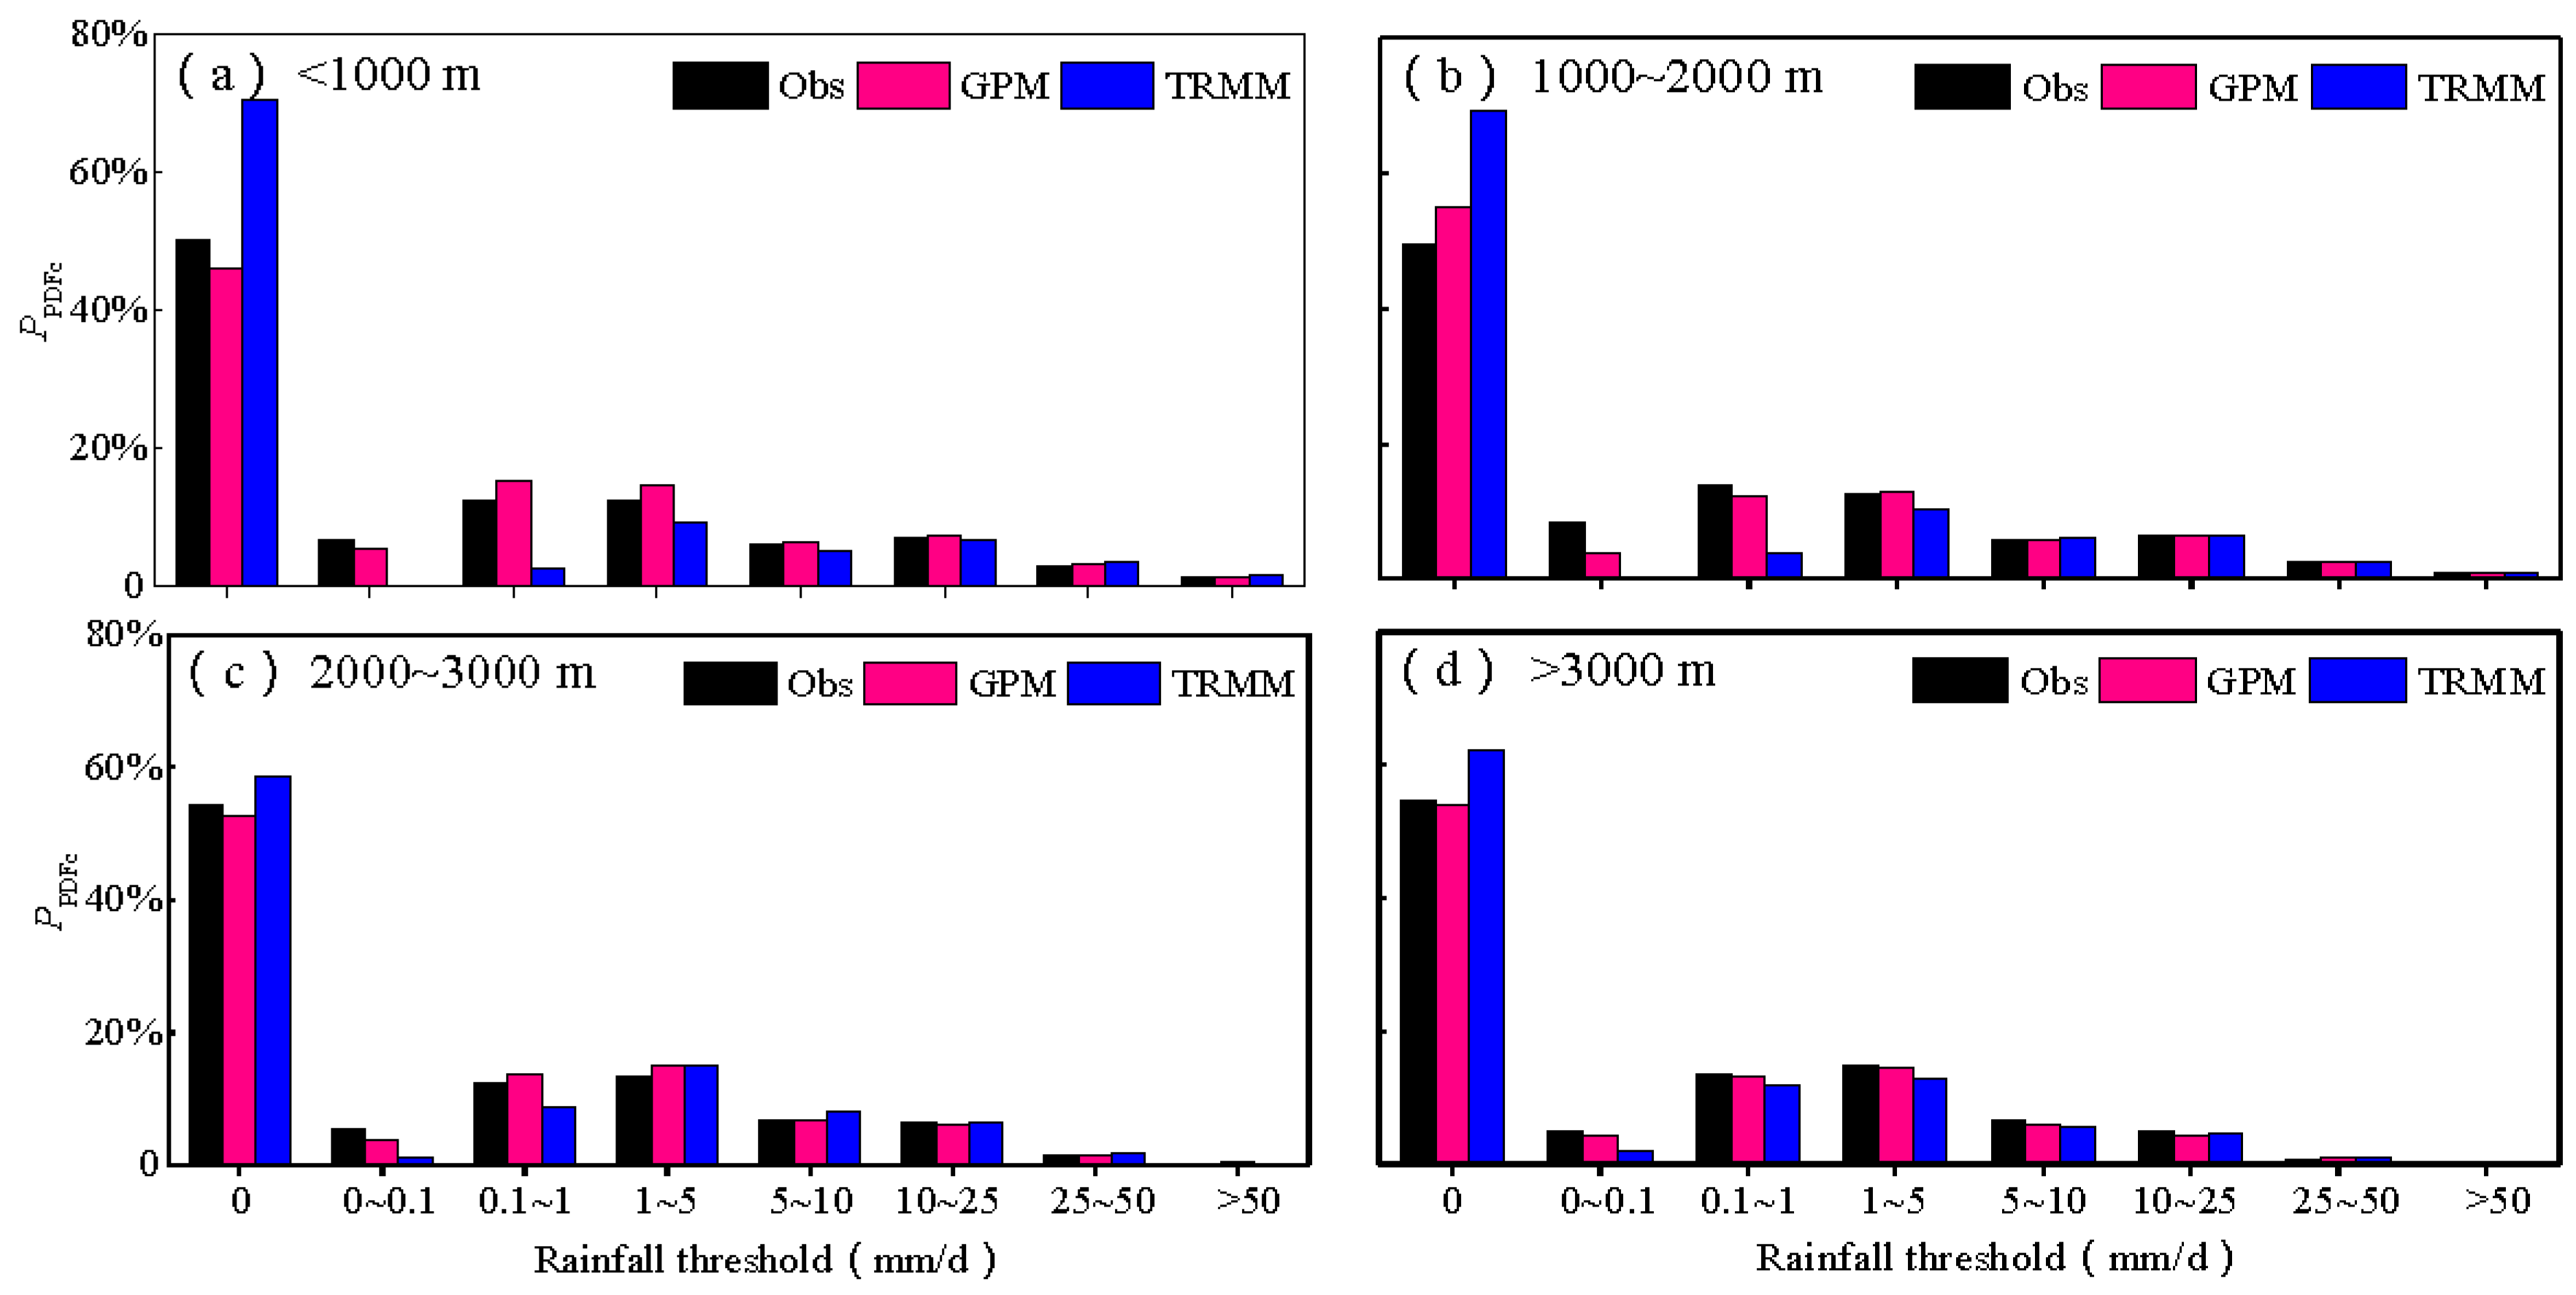
Figure 9 displayed the PDFc at different altitudes under various rainfall classes estimated by gauge data and satellite products, respectively. It can be concluded that the rainfall events of P = 0 mm had the highest incidence, with the PDFc value at approximately 50%, while the occurrence of P = 50 mm/day was the smallest, with PDFc value smaller than 5%. Moreover, the PPDFc of P = 0.1, 1, 5, 10, and 25 mm in each subregions were alike, but 3B42 v7 significantly overestimated the PPDFc when P = 0 at all the study areas. This further revealed the poor sensitivity of PR of 3B42 v7 to detect weak rainfall. By contrast, the PPDFc of IMERG v5 was much closer to the observed value. This was probably because the detection radar carried on IMERG v5 had a low frequency band (10–89 GHz) that can retrieve moderate and heavy rainfall events and also a high frequency band (166–183 GHz) that can detect weak precipitation [45]. It should be pointed that the conclusion that two SPPs underestimated the PDFc of all the rainfall classes when the elevation exceeded more than 3000 m which was in accordance with the result in the previous sector. This might be due to the detection of two SPPs which reproduced the precipitation information on top of the atmosphere rather than the surface. It may also be due to the thin atmosphere in the high-elevation areas that have less integrated liquid water content than low-elevation areas which can lead to lower brightness temperatures compared to the normal value. Thus both of the SPPs underestimated the precipitation [44].
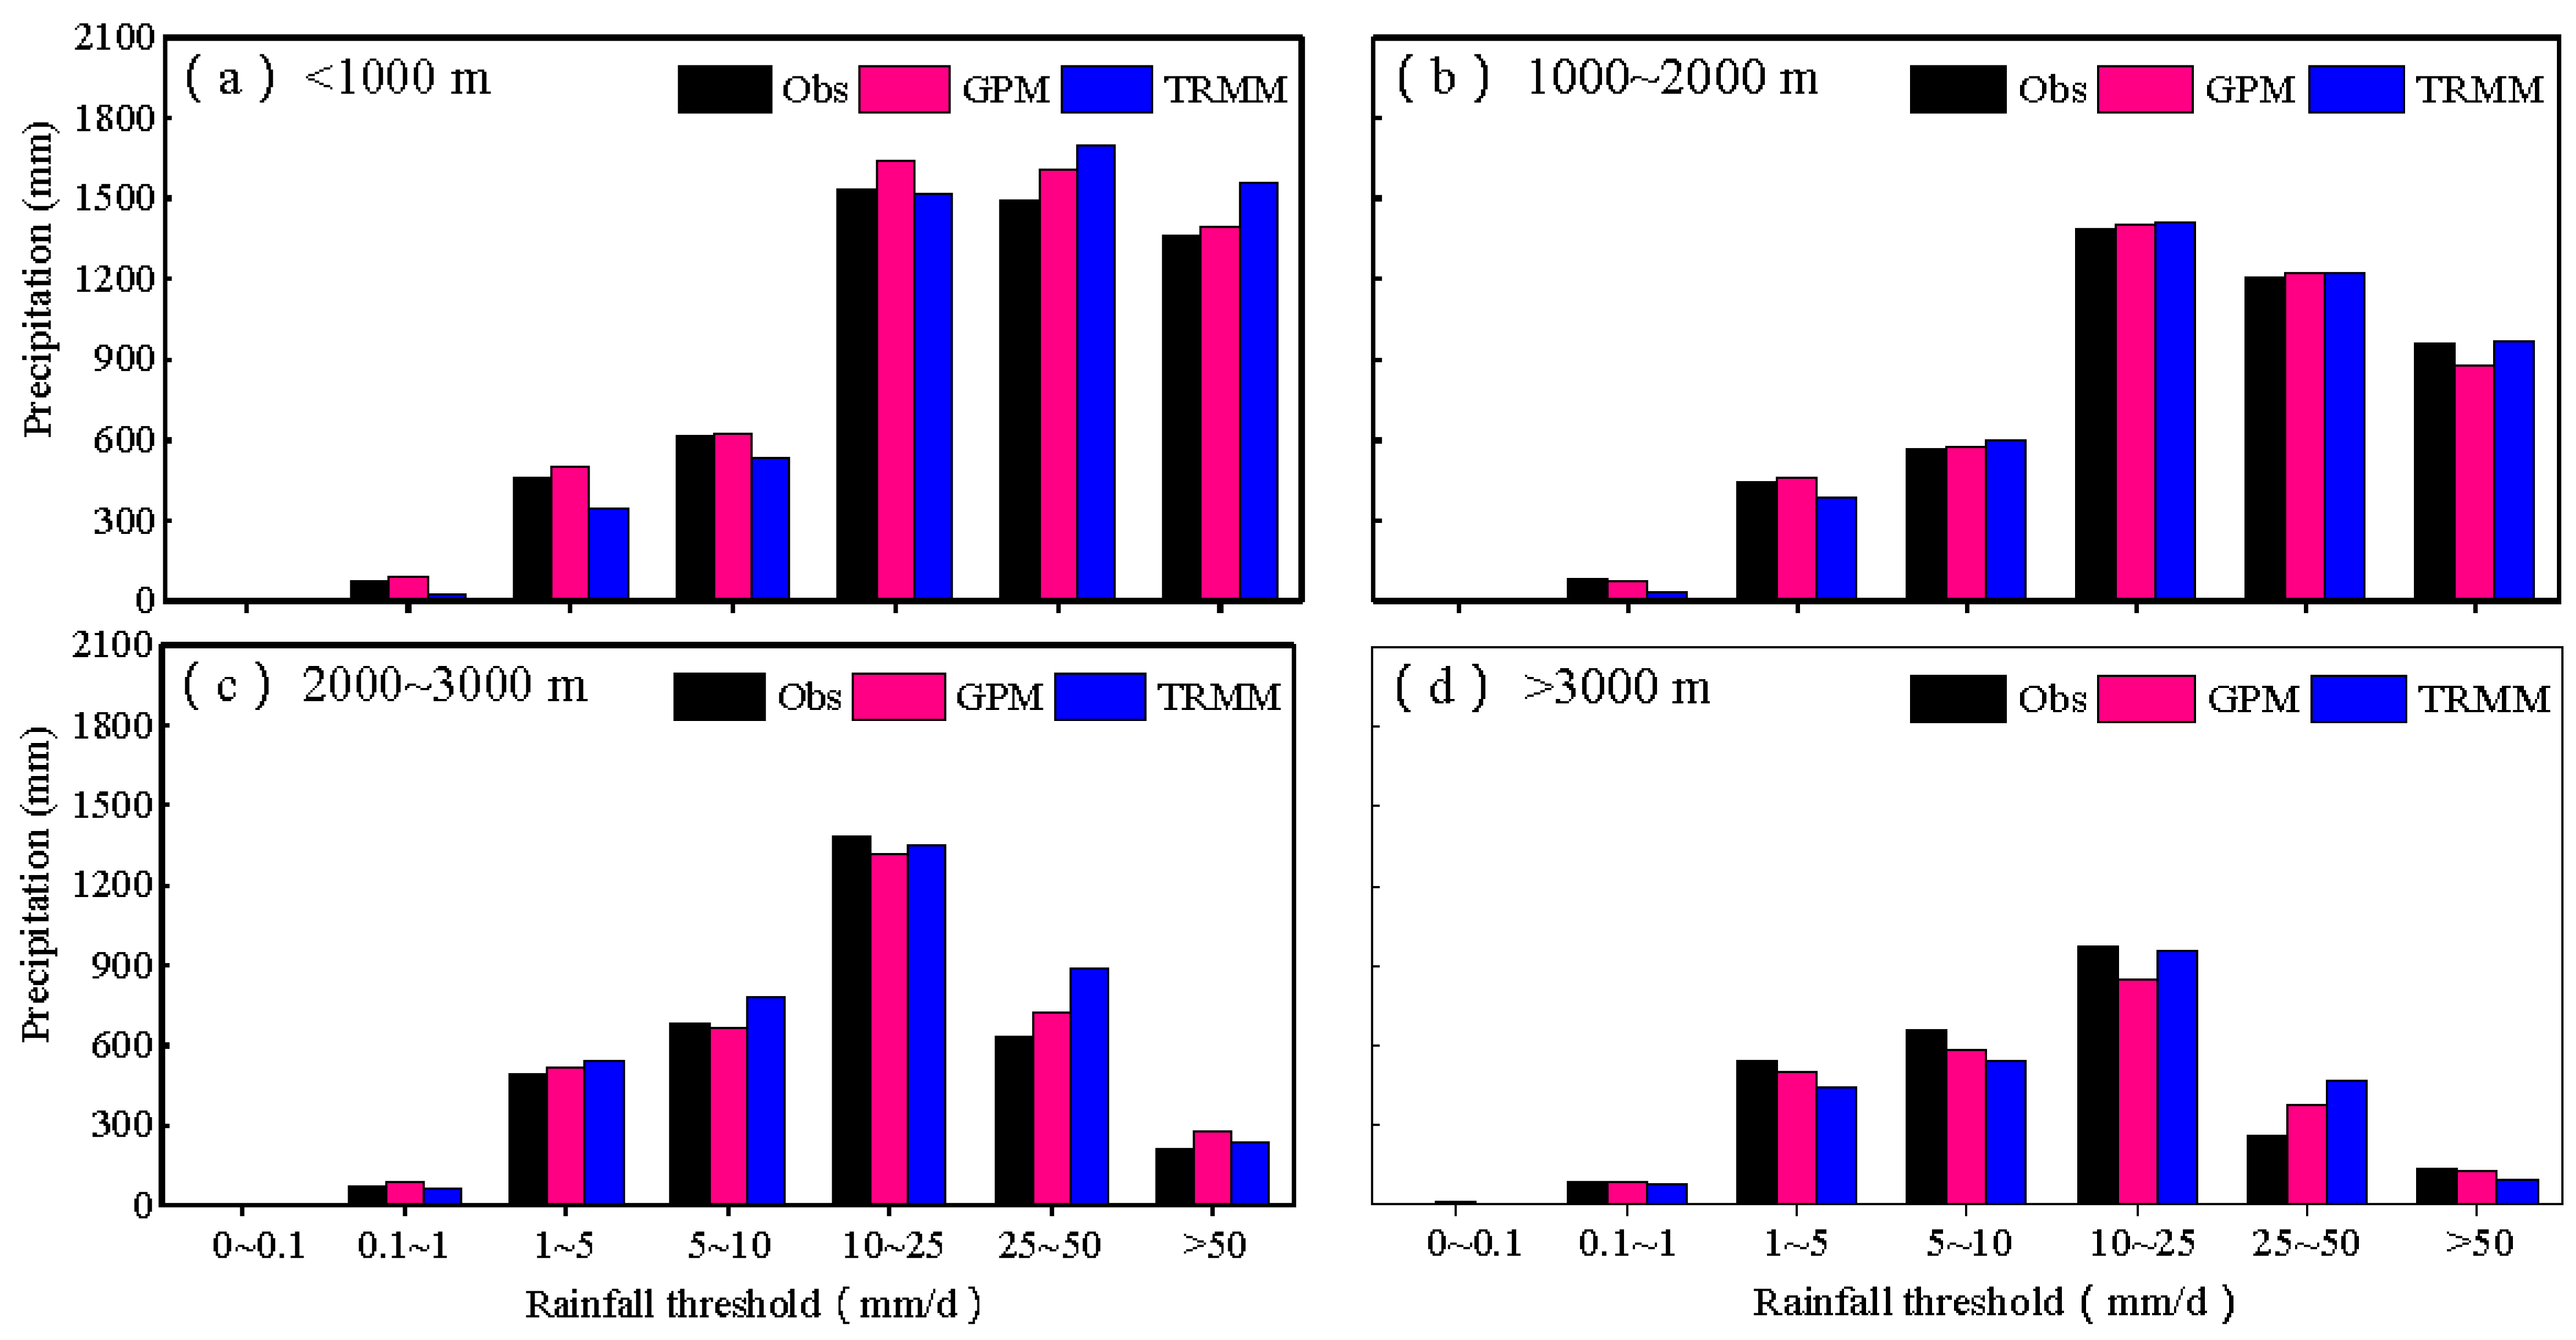
Figure 10 showed the mean rainfall volume at various precipitation thresholds for rain gauges and two kinds of SPPs. In order to make the different number of meteorological stations in different elevation areas comparable, the mean rainfall volume was calculated as the average of the total rainfall of the entire rain gauge stations in each subregion in this study. As was illustrated in Figure 10, the observed mean rainfall values in the four altitude categories were similar when the rainfall rates were at 0–0.1, 0.1–1, 1–5, and 5–10 mm/day. However, the situation changed when the precipitation thresholds were larger than 10 mm/day, which mainly manifested when the mean rainfall decreased with the increase of elevation. Notably, this characteristic was much more significant when the rainfall ranked above 50 mm/day and the mean precipitation in <1000 m range was much higher in >3000 m range. The main reason is that the low-altitude areas (such as <1000 m) are located mainly at the southern and eastern parts of the Yangtze River basin which are susceptible to intensive convective precipitation caused by tropical cyclones. The Meiyu front during the summertime and the high-altitude areas (such as >3000 m), however, are mainly distributed in the mountain plateau climate zone, where it is cold and dry throughout the year and rarely has heavy rainfall events. Generally, the above-mentioned features of different rainfall classes in various altitudes were well captured by two kinds of SPPs, but IMERG v5 overestimated the rainfall in the area < 1000 m, and underestimated the rainfall when the elevation > 3000 m (with the exception of the rainfall magnitude at 10–25 mm/day). These results were consistent with the previous conclusions of PPDFc for IMERG v5 in these two different altitudes. The TRMM 3B42 v7 product, on the other hand, showed underestimation when precipitation < 10 mm/d at almost all research areas (except 2000–3000 m range), but overestimated the precipitation at rainfall rates ≥ 10 mm/day (except for >3000 m range when rainfall rates > 50 mm/day). In general, the mean precipitation of IMERG v5 at all elevation for different rainfall thresholds were still closer to the observed value compared with 3B42 v7, indicating the better detectability of IMERG v5.
4. Discussion
In this study, an assessment of the capabilities between the level 3 of GPM IMERG v5 Final Run daily rainfall products and TRMM 3B42 v7 daily precipitation product for the Yangtze River basin during April 2014 to December 2017 was undertaken. It was found that the performance of the two SPPs at annual and monthly scales was different, but generally acceptable which appeared as higher correlation coefficients (R) and lower error indicators (Bias, RMSE and MAE). However, the performance of the two SPPs was much worse at a daily scale. This may be due to the same unit of mm/d which was used at three time scales. Previous studies have also confirmed this [33,46,47,48]. The cause of this difference may be due to the precipitation being much lower at a daily scale. Thus the smaller deviation generated by the two SPPs estimation lead to greater errors, while the errors were not obvious at monthly and annual scales because of the higher precipitation. However, the annual and precipitation data were derived from the accumulation of daily data. Therefore, the positive and negative misestimation at a daily scale can be offset, which can also contribute to better performance of the two SPPs at an annual and monthly scale. Additionally, from the comparison between IMERG v5 and 3B42 v7, it can be also found that IMERG v5 was superior to 3B42 v7 by displaying higher R, and lower RMSE and MAE at annual and monthly scales. At daily scales, however, the performance of IMERG v5 was much worse than 3B42 v7. Chen et al. [49] highlighted that IMERG v5 tended to overestimate the precipitation because of the path-integrated attenuation (PIA) inversion algorithm when detecting heavy daily rainfall events. Thus, the positive RB was shown at three temporal scales. However, due to the smaller individual value in the daily precipitation series, the lack of accuracy for IMERG v5 was shown more obviously at daily scales.
The study of the distribution of different rainfall categories is of great significance in hydrological research. Generally, the spatial distribution of PPDFc for IMERG v5 matched with the observed values much better at almost all defined precipitation thresholds. However, the 3B42 v7 product, by contrast, had serious deviations in estimating rainfall events <5 mm/day and significantly overestimated rainfall thresholds that exceeded 25 mm/day. Previous studies also reported TRMM’s unsatisfactory results when monitoring extreme rainfall [24,50]. One possible reason is that the PR and TMI sensors embedded in TRMM were not sensitive to detect light or heavy rainfall, while the GPM DPR and GMI were better at detecting light and solid rainfall events [16,51].
It is well-known that the high-mountainous topography might extensively affect the ability of SPPs to accurately capture the rainfall [15,45,52,53,54]. During this study, both SPPs obviously underestimated the precipitation and had worse POD values in the areas when elevation >3000 m. Similar results have been found in previous studies [15,33]. The main reason, on the one hand, may be due to the ice-covered surfaces and cloud-ice mixed meteorological conditions that can easily cause difficulties in signal acquisition. On the other hand, the sparsely distributed rain gauges used in the upper reaches can also create negative errors. It is traditionally believed that the fusion of Ka PR and Ku PR wave bands in DPR can cooperate effectively to enhance the detection capability of solid precipitation. However, in this paper, it was found that the performance of IMERG v5 was inferior to 3B42 v7 when in the >3000 m range. Daniele et al. [55] indicated that this misdetection has been worsened by the use of the noise-reducing algorithm component when the DPR calibrated the received reflecting signal, which weakened the noise and side lobe clutter to some extent. However, it also cut the low-reflectivity signals that have been associated with solid rainfall events (such as snowfall). Hence, IMERG v5 showed more obvious underestimation when elevation was above 3000 m.
It is worth mentioning that during this study, the standard bilinear interpolation method was applied to make the spatial resolution of 3B42 v7 data comparable with GPM IMERG v5 data. A grid-to-point approach (NN method) was also used to compare between the point-based rain gauges and pixel-based SPPs. However, attention should be given to the errors that may be induced after resampling and undertaking grid-to-point techniques due to scale mismatch issues, and the errors that have already existed due to fundamentally different measurements between rain gauges and SPPs [15,33,51]. Moreover, various interpolation methods and grid-to-point techniques can also produce different evaluation results. Therefore, the selection of an appropriate method to improve the accuracy of estimation is likely to be the subject of future research.
5. Conclusions
In this study, the performance of the TRMM 3B42 v7 precipitation products and its successor, the latest release of GPM IMERG v5 products over the Yangtze River basin during April 2014 to December 2017 was evaluated. The main conclusions were drawn as follows:
(1) Both of the SPPs performed acceptably in estimating rainfall at annual and monthly scales. However, poor detectability was shown when retrieving at daily scales for both SPPs. Moreover, IMERG v5 product outperformed the 3B42 v7 product at annual and monthly scales.
(2) The two SPPs can characterize the spatial distribution pattern of precipitation well generally. However, IMERG v5 tended to overestimate the distribution range of the main rain band, while 3B42 v7 underestimated the precipitation in the Sichuan basin. On the other side, huge spatial distribution errors were shown when retrieving little rainfall events, especially for precipitation ≤ 1 mm/day for the two SPPs.
(3) Generally, the PDFc index and mean precipitation at all altitudes for IMERG v5 were much closer to the observed values. However, there were many differences when estimating precipitation in different elevations for the IMERG v5 and 3B42 v7. Both of the SPPs underestimated precipitation in the higher elevation areas (e.g., ≥3000 m).
Overall, the GPM IMERG v5 product, being the latest released satellite-based precipitation product, was superior in providing more accurate precipitation evaluations and detecting weak precipitation events compared with its predecessor, the TRMM 3B42 v7 product. This was due to its finer spatiotemporal resolutions and more advanced sensors. However, it had poor skills when retrieving high precipitation events and when detecting in high-altitude areas which suggested its algorithms still needed to be improved further before being applied in hydrological fields.
Author Contributions
Y.W. completed the manuscript writing and tables and graphs drawing, Z.Z. provided the improvement of the concept of the research project and paper reviewing, Q.J. and Y.H. cooperated in acquiring and processing the dataset, J.C. and X.C. offered preparation of the needed software and critical technical guidance. All the authors participated actively in accomplishing this manuscript.
Funding
This paper is financially supported by National Natural Science Foundation of China (Grant No. 41171020) and Distinguished Young Scholars Fund of Nanjing Forestry University (NLJQ2015-01). The project supported by the Six Talent Peaks project in Jiangsu Province (Grant No. 2015-JY-017) and the Priority Academic Program Development of Jiangsu Higher Education Institutions (PAPD).
Acknowledgments
We would like to thank the National Climate Centre in Beijing for providing valuable climate datasets.
Conflicts of Interest
The authors declare no conflicts of interest.
References
- Kidd, C.; Huffman, G. Global precipitation measurement. Meteorol. Appl. 2011, 18, 334–353. [Google Scholar] [CrossRef]
- McAfee, S.A.; Guentchev, G.; Eischeid, J.K. Reconciling precipitation trends in Alaska: 1. Station-based analyses. J. Geophys. Res. Atmos. 2013, 118, 7523–7541. [Google Scholar] [CrossRef]
- Allen, M.R.; Ingram, W.J. Constraints on future changes in climate and the hydrologic cycle. Nature 2002, 419, 224–232. [Google Scholar] [CrossRef] [PubMed]
- Li, M.; Shao, Q.X. An improved statistical approach to merge satellite rainfall estimates and raingauge data. J. Hydrol. 2010, 385, 51–64. [Google Scholar] [CrossRef]
- Dinku, T.; Anagnostou, E.N.; Borga, M. Improving radar-based estimation of rainfall over complex terrain. J. Appl. Meteorol. 2002, 41, 1163–1178. [Google Scholar] [CrossRef]
- Wang, X.W.; Xie, H.J.; Sharif, H.; Zeitler, J. Validating NEXRAD MPE and Stage III precipitation products for uniform rainfall on the Upper Guadalupe River Basin of the Texas Hill Country. J. Hydrol. 2008, 348, 73–86. [Google Scholar] [CrossRef]
- Joyce, R.J.; Janowiak, J.E.; Arkin, P.A.; Xie, P.P. CMORPH: A Method that Produces Global Precipitation Estimates from Passive Microwave and Infrared Data at High Spatial and Temporal Resolution. J. Hydrometeorol. 2004, 5, 487–503. [Google Scholar] [CrossRef]
- Kubota, T.; Shige, S.; Hashizume, H.; Aonashi, K.; Takahashi, N.; Seto, S.; Hirose, M.; Takayabu, Y.N.; Ushio, T.; Nakagawa, K.; et al. Global Precipitation Map Using Satellite-Borne Microwave Radiometers by the GSMaP Project: Production and Validation. IEEE Trans. Geosci. Remote Sens. 2007, 45, 2259–2275. [Google Scholar] [CrossRef]
- Guo, H.; Chen, S.; Bao, A.M.; Hu, J.J.; Gebregiorgis, A.; Xue, X.W.; Zhang, X.H. Inter-Comparison of High-Resolution Satellite Precipitation Products over Central Asia. Remote Sens. 2015, 7, 7181–7211. [Google Scholar] [CrossRef] [Green Version]
- Funk, C.; Peterson, P.; Landsfeld, M.; Pedreros, D.; Verdin, J.; Shukla, S.; Husak, G.; Rowland, J.; Harrison, L.; Hoell, A.; et al. The climate hazards infrared precipitation with stations—A new environmental record for monitoring extremes. Sci. Data 2015, 2, 150066. [Google Scholar] [CrossRef]
- Mantas, V.M.; Liu, Z.; Caro, C.; Pereira, A.J.S.C. Validation of TRMM multi-satellite precipitation analysis (TMPA) products in the Peruvian Andes. Atmos. Res. 2015, 163, 132–145. [Google Scholar] [CrossRef]
- Alexandri, G.; Georgoulias, A.K.; Meleti, C.; Balis, D.; Kourtidis, K.A.; Sanchez-Lorenzo, A.; Trentmann, J.; Zanis, P. A high resolution satellite view of surface solar radiation over the climatically sensitive region of Eastern Mediterranean. Atmos. Res. 2017, 188, 107–121. [Google Scholar] [CrossRef]
- Zhao, H.G.; Yang, S.T.; Wang, Z.W.; Zhou, X.; Luo, Y.; Wu, L. Evaluating the suitability of TRMM satellite rainfall data for hydrological simulation using a distributed hydrological model in the Weihe River catchment in China. J. Geogr. Sci. 2015, 25, 177–195. [Google Scholar] [CrossRef]
- Huffman, G.J.; Bolvin, D.T.; Nelkin, E.J.; Wolff, D.B.; Adler, R.F.; Gu, G.J.; Hong, Y.; Bowman, K.P.; Stocker, E.F. The TRMM Multisatellite Precipitation Analysis (TMPA): Quasi-Global, Multiyear, Combined-Sensor Precipitation Estimates at Fine Scales. J. Hydrometeorol. 2007, 8, 38–55. [Google Scholar] [CrossRef]
- Hamada, A.; Takayabu, Y.N. Improvements in Detection of Light Precipitation with the Global Precipitation Measurement Dual-Frequency Precipitation Radar (GPM DPR). J. Atmos. Ocean. Technol. 2016, 33, 653–667. [Google Scholar] [CrossRef]
- Hou, A.Y.; Kakar, R.K.; Neeck, S.; Azarbarzin, A.A.; Kummerow, C.D.; Kojima, M.; Iguchi, T. The Global Precipitation Measurement Mission. Bull. Am. Meteorol. 2014, 95, 701–722. [Google Scholar] [CrossRef]
- Tan, M.L.; Santo, H. Comparison of GPM IMERG, TMPA 3B42 and PERSIANN-CDR satellite precipitation products over Malaysia. Atmos. Res. 2018, 202, 63–76. [Google Scholar] [CrossRef]
- Petersen, W.A.; Schwaller, M.R. Global Precipitation Measurement (GPM) Ground Validation (GV) Science Implementation Plan; Goddard Space Flight Center: Greenbelt, MD, USA, 2008.
- Tang, G.Q.; Ma, Y.Z.; Long, D.; Zhong, L.Z.; Hong, Y. Evaluation of GPM Day-1 IMERG and TMPA Version-7 legacy products over Mainland China at multiple spatiotemporal scales. J. Hydrol. 2016, 533, 152–167. [Google Scholar] [CrossRef]
- Guo, H.; Chen, S.; Bao, A.M.; Behrangi, A.; Hong, Y.; Ndayisaba, F.; Hu, J.J.; Stepanian, P.M. Early assessment of Integrated Multi-satellite Retrievals for Global Precipitation Measurement over China. Atmos. Res. 2016, 176, 121–133. [Google Scholar] [CrossRef]
- Xu, R.; Tian, F.Q.; Yang, L.; Hu, H.C.; Lu, H.; Hou, A.Z. Ground validation of GPM IMERG and TRMM 3B42V7 rainfall products over southern Tibetan Plateau based on a high-density rain gauge network. J. Geophys. Res. Atmos. 2017, 122, 910–924. [Google Scholar] [CrossRef]
- Shen, Y.; Xiong, A.Y.; Wang, Y.; Xie, P.P. Performance of high-resolution satellite precipitation products over China. J. Geophys. Res. 2010, 115, D02114. [Google Scholar] [CrossRef]
- Chen, G.X.; Li, W.B.; Yuan, Z.J.; Wen, Z.P. Evolution mechanisms of the intraseasonal oscillation associated with the Yangtze River Basin flood in 1998. Sci. China Ser. D 2005, 48, 957. [Google Scholar] [CrossRef]
- Cui, L.F.; Wang, L.C.; Qu, S.; Singh, R.P.; Lai, Z.P.; Yao, R. Spatiotemporal extremes of temperature and precipitation during 1960–2015 in the Yangtze River Basin (China) and impacts on vegetation dynamics. Theor. Appl. Climatol. 2019, 136, 675–692. [Google Scholar] [CrossRef]
- Lu, E.; Liu, S.Y.; Luo, Y.; Zhao, W.; Li, H.; Chen, H.X.; Zeng, Y.T.; Liu, P.; Wang, X.M.; Higgins, R.W.; et al. The atmospheric anomalies associated with the drought over the Yangtze River basin during spring 2011. J. Geophys. Res. Atmos. 2014, 119, 5881–5894. [Google Scholar] [CrossRef]
- Fu, R.; Hu, L.; Gu, G.; Li, Y. A comparison study of summer-time synoptic-scale waves in South China and the Yangtze River basin using the TRMM Multi-Satellite Precipitation Analysis daily product. Sci. China Ser. D Earth Sci. 2008, 51, 114–122. [Google Scholar] [CrossRef]
- Sun, Z.D.; Christian, O. Analyzing the Patterns and Variation of Precipitation in the Yangtze River Basin Using TRMM/PR Data. In Proceedings of the 2009 First International Conference on Information Science and Engineering, Baton Rouge, LA, USA, 25–27 May 2009. [Google Scholar]
- Yong, B.; Ren, L.L.; Hong, Y.; Wang, J.H.; Gourley, J.J.; Jiang, S.H.; Wang, W. Hydrologic evaluation of Multisatellite Precipitation Analysis standard precipitation products in basins beyond its inclined latitude band: A case study in Laohahe basin, China. Water Resour. Res. 2010, 46, 759–768. [Google Scholar] [CrossRef]
- Zhang, D.; Hong, H.T.; Zhang, Q.; Li, X.H. Attribution of the changes in annual streamflow in the Yangtze River Basin over the past 146 years. Theor. Appl. Climatol. 2015, 119, 323–332. [Google Scholar] [CrossRef]
- Bian, H.Q.; Lü, H.S.; Sadeghi, A.; Zhu, Y.H.; Yu, Z.B.; Ouyang, F.; Su, J.B.; Chen, R.S. Assessment on the Effect of Climate Change on Streamflow in the Source Region of the Yangtze River, China. Water 2017, 9, 70. [Google Scholar] [CrossRef]
- Yong, B.; Chen, B.; Tian, Y.D.; Yu, Z.B.; Hong, Y. Error-Component Analysis of TRMM-Based Multi-Satellite Precipitation Estimates over Mainland China. Remote Sens. 2016, 8, 440. [Google Scholar] [CrossRef]
- Shen, Y.P.; Wang, G.; Pu, J.; Wang, X. Impacts of climate change on glacial water resources and hydrological cycles in the Yangtze River source region, the Qinghai-Tibetan Plateau, China: A Progress Report. Sci. Cold Arid Reg. 2009, 1, 475–495. [Google Scholar]
- Yang, X.Q.; Geng, W.J. Accuracy Evaluation of TRMM-based Multi-satellite Precipitation in Huai River Basin. Water Resour. Power 2016, 34, 1–5. [Google Scholar]
- Fan, X.W.; Liu, H.L. Downscaling Method of TRMM Satellite Precipitation Data over the Tianshan Mountains. J. Nat. Resour. 2018, 33, 478–488. [Google Scholar]
- Liu, H.W.; Ding, Y.H. Analysis of daily precipitation characteristics over North China during rainy seasons. Chin. J. Atmos. Sci. 2010, 34, 12–22. [Google Scholar]
- Blacutt, L.A.; Herdies, D.L.; De Gonçalves, L.G.G.; Vila, D.A.; Andrade, M. Precipitation comparison for the CFSR, MERRA, TRMM3B42 and Combined Scheme datasets in Bolivia. Atmos. Res. 2015, 163, 117–131. [Google Scholar] [CrossRef] [Green Version]
- El Kenawy, A.M.; Lopez-Moreno, J.I.; McCabe, M.F.; Vicente-Serrano, S.M. Evaluation of the TMPA-3B42 precipitation product using a high-density rain gauge network over complex terrain in northeastern Iberia. Glob. Planet. Chang. 2015, 133, 188–200. [Google Scholar] [CrossRef] [Green Version]
- Li, Z.; Yang, D.; Hong, Y. Multi-scale evaluation of high-resolution multi-sensor blended global precipitation products over the Yangtze River. J. Hydrol. 2013, 500, 157–169. [Google Scholar] [CrossRef]
- Prat, O.P.; Nelson, B.R. Precipitation Contribution of Tropical Cyclones in the Southeastern United States from 1998 to 2009 Using TRMM Satellite Data. J. Clim. 2013, 26, 1047–1062. [Google Scholar] [CrossRef]
- Kirstetter, P.; Hong, Y.; Gourley, J.J.; Chen, S.; Flamig, Z.; Zhang, J.; Schwaller, M.; Petersen, W.; Amitai, E. Toward a Framework for Systematic Error Modeling of Spaceborne Precipitation Radar with NOAA/NSSL Ground Radar–Based National Mosaic QPE. J. Hydrometeorol. 2012, 13, 1285–1300. [Google Scholar] [CrossRef]
- Huang, Y.; Chen, S.; Feng, Y.; Zhai, J. Evaluation of TMPA Precipitation Estimates from 2008 to 2012 over China. Meteorol. Mon. 2015, 41, 353–363. [Google Scholar]
- Liao, L.; Meneghini, R.; Tokay, A. Uncertainties of GPM DPR Rain Estimates Caused by DSD Parameterizations. J. Appl. Meteorol. Climatol. 2014, 53, 2524–2537. [Google Scholar] [CrossRef] [Green Version]
- Kim, K.Y.; Park, J.M.; Baik, J.J.; Choi, M.H. Evaluation of topographical and seasonal feature using GPM IMERG and TRMM 3B42 over Far-East Asia. Atmos. Res. 2017, 187, 95–105. [Google Scholar] [CrossRef]
- Jin, X.L.; Shao, H.; Zhang, C.; Yan, Y. The Applicability Evaluation of Three Satellite Products in Tianshan Mountains. J. Nat. Resour. 2016, 31, 2074–2085. [Google Scholar]
- Tang, G.Q.; Wan, W.; Zeng, Z.Y.; Guo, X.L.; Li, N.; Long, D.; Hong, Y. An Overview of the Global Precipitation Measurement (GPM) Mission and It’s Latest Development. Remote Sens. Technol. Appl. 2015, 30, 607–615. [Google Scholar]
- Huang, P.; Lu, J.X.; Li, D.L.; Song, W.L.; Qu, W. Accuracy validation of TRMM precipitation data in Xiang River Basin. South. North. Water Transf. Water Sci. Technol. 2015, 13, 401–405. [Google Scholar]
- Tian, Y.D.; Peters-Lidard, C.D.; Choudhury, B.J.; Garcia, M. Multitemporal Analysis of TRMM-Based Satellite Precipitation Products for Land Data Assimilation Applications. J. Hydrometeorol. 2007, 8, 1165–1183. [Google Scholar] [CrossRef]
- Wei, S.; Cui, C.F.; Tong, S.L.; Guo, Y.G. Meteorological Satellite Precipitation Data Accuracy Test on Time Scale. Water Sav. Irrig. 2017, 62, 55–58. [Google Scholar]
- Chen, Q. The Problem and Primaiy Exploration of Exorbitant Precipitation Retrieval in GPM Product. Ph.D. Thesis, Nanjing University of Information Science and Technology, Nanjing, China, 2018. [Google Scholar]
- Chen, C.; Chen, Q.W.; Duan, Z.; Zhang, J.Y.; Mo, K.L.; Li, Z.; Tang, G.Q. Multiscale Comparative Evaluation of the GPM IMERG v5 and TRMM 3B42 v7 Precipitation Products from 2015 to 2017 over a Climate Transition Area of China. Remote Sens. 2018, 10, 944. [Google Scholar] [CrossRef]
- Ebrahimi, S.; Chen, C.; Chen, Q.; Zhang, Y.; Ma, N.; Zaman, Q. Effects of temporal scales and space mismatches on the TRMM 3B42 v7 precipitation product in a remote mountainous area. Hydrol. Process. 2017, 31, 4315–4327. [Google Scholar] [CrossRef]
- Su, J.; Lü, H.; Zhu, Y.; Wang, X.; Wei, G. Component Analysis of Errors in Four GPM-Based Precipitation Estimations over Mainland China. Remote Sens. 2018, 10, 1420. [Google Scholar] [CrossRef]
- Condom, T.; Rau, P.; Espinoza, J.C. Correction of TRMM 3B43 monthly precipitation data over the mountainous areas of Peru during the period 1998–2007. Hydrol. Process. 2011, 25, 1924–1933. [Google Scholar] [CrossRef]
- Dinku, T.; Ceccato, P.; Grover Kopec, E.; Lemma, M.; Connor, S.J.; Ropelewski, C.F. Validation of satellite rainfall products over East Africa’s complex topography. Int. J. Remote Sens. 2007, 28, 1503–1526. [Google Scholar] [CrossRef]
- Casella, D.; Panegrossi, G.; Sanò, P.; Marra, A.C.; Dietrich, S.; Johnson, B.T.; Kulie, M.S. Evaluation of the GPM-DPR snowfall detection capability. Atmos. Res. 2017, 197, 64–75. [Google Scholar] [CrossRef]
Figure 1.
A map of the Yangtze River basin, including elevation, river, location of the meteorological stations, as well as the spatial distributions of three subregions.
Figure 1.
A map of the Yangtze River basin, including elevation, river, location of the meteorological stations, as well as the spatial distributions of three subregions.

Figure 2.
Technology roadmap.

Figure 3.
Scatterplots of annual, monthly, and daily precipitation between rain gauge stations and two SPPs. (a,b): Annual scale; (c,d): monthly scale; (e,f): daily scale.
Figure 3.
Scatterplots of annual, monthly, and daily precipitation between rain gauge stations and two SPPs. (a,b): Annual scale; (c,d): monthly scale; (e,f): daily scale.

Figure 4.
Spatial distribution of the mean annual precipitation for GPM IMERG v5 and TRMM 3B42 v7 from April 2014 to December 2017 over the Yangtze River basin. (a): Obs; (b): GPM; (c): TRMM.
Figure 4.
Spatial distribution of the mean annual precipitation for GPM IMERG v5 and TRMM 3B42 v7 from April 2014 to December 2017 over the Yangtze River basin. (a): Obs; (b): GPM; (c): TRMM.

Figure 5.
Spatial distribution of monthly average precipitation of rain gauge stations, GPM IMERG v5 and TRMM 3B42 v7 during April 2014–December 2017. (a): January; (b): February; (c): March; (d): April; (e): May; (f): June; (g): July; (h): August; (i): September; (j): October; (k): November; (l): December.

Figure 6.
Spatial distribution of different daily rainfall thresholds between rain gauge stations and two satellite-based products during 1 April 2014–31 December 2017. (a): P = 0 mm; (b): 0 mm < P < 0.1 mm; (c): 0.1 mm ≤ P ≤ 1 mm; (d): 1 mm < P ≤ 5 mm; (e): 5 mm < P ≤ 10 mm; (f): 10 mm < P ≤ 25 mm; (g): 25 mm < P ≤50 mm; (h): P >50 mm).

Figure 7.
Scatterplots of annual precipitation between rain gauge stations and two SPPs at different altitudes. (a,b): <1000 m; (c,d): 1000~2000 m; (e,f): 2000~3000 m; (g,h): >3000 m.
Figure 7.
Scatterplots of annual precipitation between rain gauge stations and two SPPs at different altitudes. (a,b): <1000 m; (c,d): 1000~2000 m; (e,f): 2000~3000 m; (g,h): >3000 m.

Figure 8.
Contingency metrics of POD, FAR and f-BIAS at different altitudes. (a–c): ASL < 1000 m; (d–f): 1000 m ≤ ASL < 2000 m; (g–i): 2000 m ≤ ASL < 3000 m; (j–l): ASL ≥ 3000 m.
Figure 8.
Contingency metrics of POD, FAR and f-BIAS at different altitudes. (a–c): ASL < 1000 m; (d–f): 1000 m ≤ ASL < 2000 m; (g–i): 2000 m ≤ ASL < 3000 m; (j–l): ASL ≥ 3000 m.

Figure 9.
PPDFc of IMERG v5 and 3B42 v7 at different altitudes. (a): <1000 m; (b): 1000~2000 m; (c): 2000~3000 m; (d): >3000 m.
Figure 9.
PPDFc of IMERG v5 and 3B42 v7 at different altitudes. (a): <1000 m; (b): 1000~2000 m; (c): 2000~3000 m; (d): >3000 m.

Figure 10.
The mean rainfall at different precipitation thresholds of IMERG v5 and 3B42 v7 at different altitudes. (a): <1000 m; (b): 1000~2000 m; (c): 2000~3000 m; (d): >3000 m.
Figure 10.
The mean rainfall at different precipitation thresholds of IMERG v5 and 3B42 v7 at different altitudes. (a): <1000 m; (b): 1000~2000 m; (c): 2000~3000 m; (d): >3000 m.


Table 1.
List of the statistical metrics employed to quantify the performance of the satellite-based precipitation products (SPPs) [28,36,37].
| Statistical Metrics | Unit | Equation | Perfect Value | Number |
|---|---|---|---|---|
| Correlation coefficient (R) | N/A | 1 | 1 | |
| Root-mean-square error (RMSE) | mm | 0 | 2 | |
| Relative bias (RB) | N/A | 0 | 3 | |
| Mean Absolute Error (MAE) | mm | 0 | 4 | |
| Probability of detection (POD) | N/A | 1 | 5 | |
| False alarm ratio (FAR) | N/A | 0 | 6 | |
| Frequency bias (f-BIAS) | N/A | 1 | 7 |
* Where n is the number of observation stations, i represents the serial number of precipitation stations, and are gauge observations and their average, and represent satellite estimates and their average, respectively. H (hits) represents event that was detected to occur by the rain gauge and satellite simultaneously, F (false alarms) means the precipitation event that was detected to occur by satellite but not detected to occur by the rain gauge, M (misses) represents the event that was not detected to occur but observed to occur, and Z (correct negatives) refers to event that was not detected to occur by the rain gauge and the satellite.
Table 2.
Contingency table between SPPs data and observed data.
| SPPs Results | Rain Gauges Results | |
|---|---|---|
| S ≥ Threshold | S < Threshold | |
| P ≥ threshold | H | F |
| P < threshold | M | Z |
© 2019 by the authors. Licensee MDPI, Basel, Switzerland. This article is an open access article distributed under the terms and conditions of the Creative Commons Attribution (CC BY) license (http://creativecommons.org/licenses/by/4.0/).
Share and Cite
MDPI and ACS Style
Wu, Y.; Zhang, Z.; Huang, Y.; Jin, Q.; Chen, X.; Chang, J. Evaluation of the GPM IMERG v5 and TRMM 3B42 v7 Precipitation Products in the Yangtze River Basin, China. Water 2019, 11, 1459. https://doi.org/10.3390/w11071459
AMA Style
Wu Y, Zhang Z, Huang Y, Jin Q, Chen X, Chang J. Evaluation of the GPM IMERG v5 and TRMM 3B42 v7 Precipitation Products in the Yangtze River Basin, China. Water. 2019; 11(7):1459. https://doi.org/10.3390/w11071459
Chicago/Turabian StyleWu, Yifan, Zengxin Zhang, Yuhan Huang, Qiu Jin, Xi Chen, and Juan Chang. 2019. "Evaluation of the GPM IMERG v5 and TRMM 3B42 v7 Precipitation Products in the Yangtze River Basin, China" Water 11, no. 7: 1459. https://doi.org/10.3390/w11071459
Note that from the first issue of 2016, this journal uses article numbers instead of page numbers. See further details here.