Article

Crushed Autoclaved Aerated Concrete (CAAC), a Potential Reactive Filter Medium for Enhancing Phosphorus Removal in Nature-Based Solutions—Preliminary Batch Studies

by
Joana América da Cunha Castellar
1,*,
Joan Formosa
2,
Josep Maria Chimenos
2,
Joan Canals
1,
Montserrat Bosch
3,
Joan Ramon Rosell
3,
Heraldo Peixoto da Silva
4,
Jordi Morató
1,
Hans Brix
5,6 and
Carlos Alberto Arias
5,6
1
Polytechnic University of Catalonia, C/Colom 1, 08222 Terrassa, Spain
2
Departament de Ciència de Materials i Química Física, Universitat de Barcelona, Martí i Franquès 1, 08028 Barcelona, Spain
3
Polytechnic University of Catalonia (GICITED), Av. Doctor Marañón 44-50, 08028 Barcelona, Spain
4
Universidade Federal da Bahia (Instituto de Geociêcias) Rua Barão de Geremoabo S/N, Salvador 40.170-115, Brazil
5
Department of Bioscience, Aarhus University, Ole Worms Allé 1, Bldg 1135, 8000C Aarhus, Denmark
6
WATEC Aarhus University Centre for Water Technology, Ny Munkegade 120, Bdlg 1521, 8000C Aarhus, Denmark
*
Author to whom correspondence should be addressed.
Water 2019, 11(7), 1442; https://doi.org/10.3390/w11071442
Submission received: 5 June 2019 / Revised: 4 July 2019 / Accepted: 9 July 2019 / Published: 12 July 2019
(This article belongs to the Section Wastewater Treatment and Reuse)

Abstract

:
Phosphorus (P) is a limited resource and can promote eutrophication of water streams and acidification of oceans when discharged. Crushed autoclaved aerated concrete (CAAC), a by-product from demolition, has shown great potential for recovering P. The potential of CAAC to be used in nature-based solutions as a P-reactive filter medium was evaluated by performing preliminary batch essays. Here, we evaluated the interactions and main effects of the initial concentration of P (Pi; 5, 10 or 20 mg L−1), particle size (PS; 4 or 5 mm) and contact time (CT; 60, 180, 360, 720 and 1440 min) upon the removal. We performed physical and chemical characterization to understand the removal processes. Data collected were fitted in adsorption kinetic models. The statistical analysis showed a significant interaction between CT and Pi, with the combination of its main effects stronger on P removal than each one separately. Intriguingly, we noticed that the higher the concentration of Pi, the faster and higher the removal of P. Contrary to expectations, PS 5 mm showed higher removal rates than PS 4 mm, indicating that besides adsorption, other unidentified chemical processes are in place. Further studies using columns/pilots with real wastewater are recommended for a future follow-up.

Graphical Abstract

1. Introduction

Phosphorus (P) is a limited resource and an essential nutrient for the growth of plants, and it is found on Earth, mainly by geological natural weathering processes [1,2]. P from nature sources has been widely exploited for its use in agriculture (fertilizer) and industry. Moreover, the discharge of wastewaters with high concentrations of P and the intense use of P compounds in agriculture (chemical fertilizers) has led to an increase of P loading within ecosystems [3].
The accumulation of P leads to changes in terrestrial, aquatic and marine ecosystems, by eutrophication and ocean anoxic events; both processes are associated with loss of biodiversity and thus a reduction of natural resilience [1,4,5,6]. According to Karczmarczyk et al. [6], 1 g of P released into water bodies promotes the growth of up to 100 g of algae, enhancing eutrophication of surface water. Modelling analysis performed by Rockström et al. [1] has shown that P inflow into oceans will increase 10 times in the next 1000 years, leading to extreme anoxic conditions. Moreover, the author suggests that such an input of P is not feasible for more than 1000 years, considering the estimated amount of phosphate natural reserves.
In this regard, nature-based solutions (NBS) have been rising as a sustainable way to both remove and recovery P from wastewaters. NBS promote an efficient use of natural resources, human well-being and a socially inclusive green growth by replicating natural process and integrating ecosystem services into the human environment [7,8,9]. Several authors have demonstrated that NBS, such as constructed wetlands (CWs) and biological filter beds are environmentally friendly and efficient at removing P from water [5,6,10,11,12]. In such systems, the filter medium plays an important role at recovering P, mainly by promoting absorption and precipitation processes [5,13,14]. Therefore, studies on the efficiency of reactive filter mediums for recovering P are important for enhancing the ability of NBS at removing P from wastewaters.
The reuse of byproducts as reactive filter mediums is an important strategy regarding the connection of production chains and technological development in the scope of wastewater treatment. Such approaches promote a circular economy, an efficient use of resources and preservation of natural capital, mainly by reducing withdrawal of raw materials and water. Therefore, reusing tobermorite-rich waste, such as the scrap granulate generated from the production of crushed autoclaved aerated concrete (CAAC) or from the demolition of facilities built with this material, can be an interesting approach regarding recovery of P from wastewaters [4,5]. In addition, reusing this material also helps to promote the reuse of energy and to preserve natural capital, as concrete is embedded with high energy and raw material [15].
CAAC is a highly available building material used worldwide, mainly for masonry, insulation or structure reinforcement (lintels and roof/floor and wall panels) [5,6]. Several authors have demonstrated the potential of reusing CAAC for P removal [5,6,10,14,15,16]. For instance, estimations have shown that approximately 590 kg or 1.2 m3 of CAAC would be required to treat wastewater for one year from a household of five persons [5]. This is an impressive result considering that a CW requires a minimum of 2 m2/person [17].
For P removal, the potential processes promoted by CAAC are adsorption of P, chemical precipitation of P with calcium cations (Ca2+) and the formation of Ca-P–silicates aggregates, as the major compound of tobermorite is (Ca5Si6O16(OH)2·H2O), a calcium silicate hydrate (CSH) known for its high content of calcium and silicate [5,15,16]. Furthermore, physical properties of CAAC, such as its high specific surface (30 to 81 m2 g−1) and low density (275 to 400 kg m−3) [5,10,18], highlight the great potential of this material for P adsorption as compared to sand or gravel, the usual filter mediums used in CWs. In addition, CACC seems to have a great potential for recovering P for further reuse (fertilizer and industrial purposes). The product generated by using tobermorite-rich waste compounds to recover P from water has the promise to meet the requirements of the industry (phosphate rock substitute) and fertilizing features [19]. The total P in the mineral content varies from 11% to 13%, which is comparable to phosphate rock (apatite) with a 14% total P content. Therefore, for sustainability and maintaining policies of circular economy, CAAC can be considered as an accessible and environmentally-friendly reactive medium with a high potential for NBS.
However, several factors, such as adsorbent dosage (g L−1), pH, contact time (CT) and P initial concentration (Pi; mg L−1) can influence the efficiency of materials based on calcium silicate hydrates, such as CAAC. Comparing the performance of a CSH (CaO3Si·H2O) with Ca(OH)2 and CaCl2 at removing and recovering P has shown that the P removal efficiency varies from 1.2% up to 96% when varying the adsorbent dosage from 10 g L−1 to 20 g L−1 for CSH, while CaCl2 removed only 49% of P [2]. Further experiments have shown that CHS (P removal = 80%) perform better performance at removing P than CaCl2 (P removal = 65%) [16]. Indeed, the lower P removal promoted by CaCl2 is probably due to variations of pH, which affect the available ion species as well as the solubility of the products formed [16]. These results highlight that both the effect of the adsorbent dosage and the pH might play an important role in P removal processes of such materials.
In addition, Pi can play an important role in the performance of CSH-based materials, such as CAAC, with respect to P removal. The performance of autoclaved aerated concrete (AAC) at removing P under different Pi, as assessed by isotherm experiments, revealed that the P sorption increased as Pi increased [6]. A similar tendency was observed when using recycled crushed concrete: P removal increased linearly as Pi increased [15]. The authors suggest that, at higher Pi, other processes beside adsorption can take place, such as complexation and precipitation [15]. Considering that Pi can vary across different types of wastewaters, understanding the role of Pi with respect to the P removal potential provided by CAAC can play an important role for upscaling NBS for treatment of real wastewaters. Moreover, the PS not only influences the hydraulic design of NBS used for treating wastewaters but can also affect the sorption capacity of the material, mainly due to its effect on the specific surface available for sorption. As a general rule, the smaller the PS, the higher the specific surface and thus the higher the sorption capacity.
To the best of our knowledge, there is no information within the scientific literature about a study that correlates the effects of Pi, particle size (PS) and CT on the removal of P by CAAC. Therefore, due to the important roles of Pi, PS and CT on the removal of P, we tested this in preliminary batch studies. In this regard, our main goal was to investigate the interactions and main effects of Pi, PS and CT on the P removal promoted by CAAC. We have now obtained a model from the batch preliminary studies which helps to clarify the roles of Pi and PS and CT and to facilitate further optimization. The information about the effects and interactions between those factors can be expected to facilitate the further use of CAAC as filter medium in NBS for treating wastewaters rich in P. Finally, in order to better understand the removal of P provided by CAAC, we discuss possible P removal processes that occur when CAAC is used as a filter medium, based on the literature. Further validation of the model, both in the laboratory and on a real scale, is now recommended.

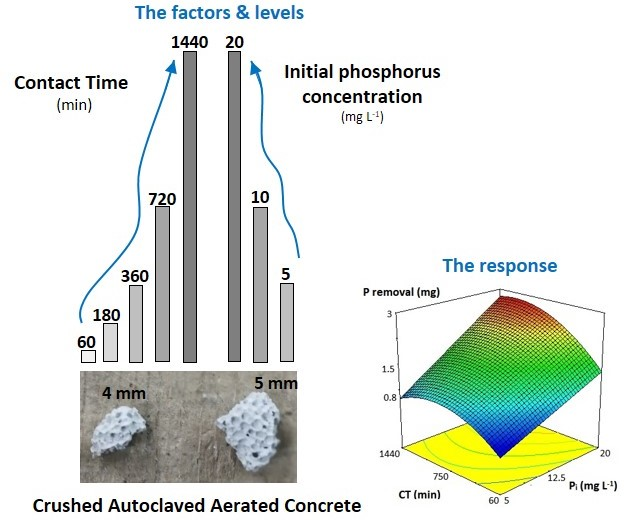
2. Materials and Methods

2.1. Adsorbent Preparation

During the process of building with CAAC, the blocks usually need to be cut in order to fit the design. Therefore, the tested material was supplied as 30 kg blocks, which were to be discarded by the company YTONG (https://www.ytong.es). Blocks were manually crushed and sieved using a mechanical sieve to obtain a PS of either 4 mm or 5 mm [15]. The sample was homogenized and quartered to a 1/16 splits to achieve representative subsamples. Afterwards, the material was washed three times with Milli-Q water to eliminate small particles (dust).

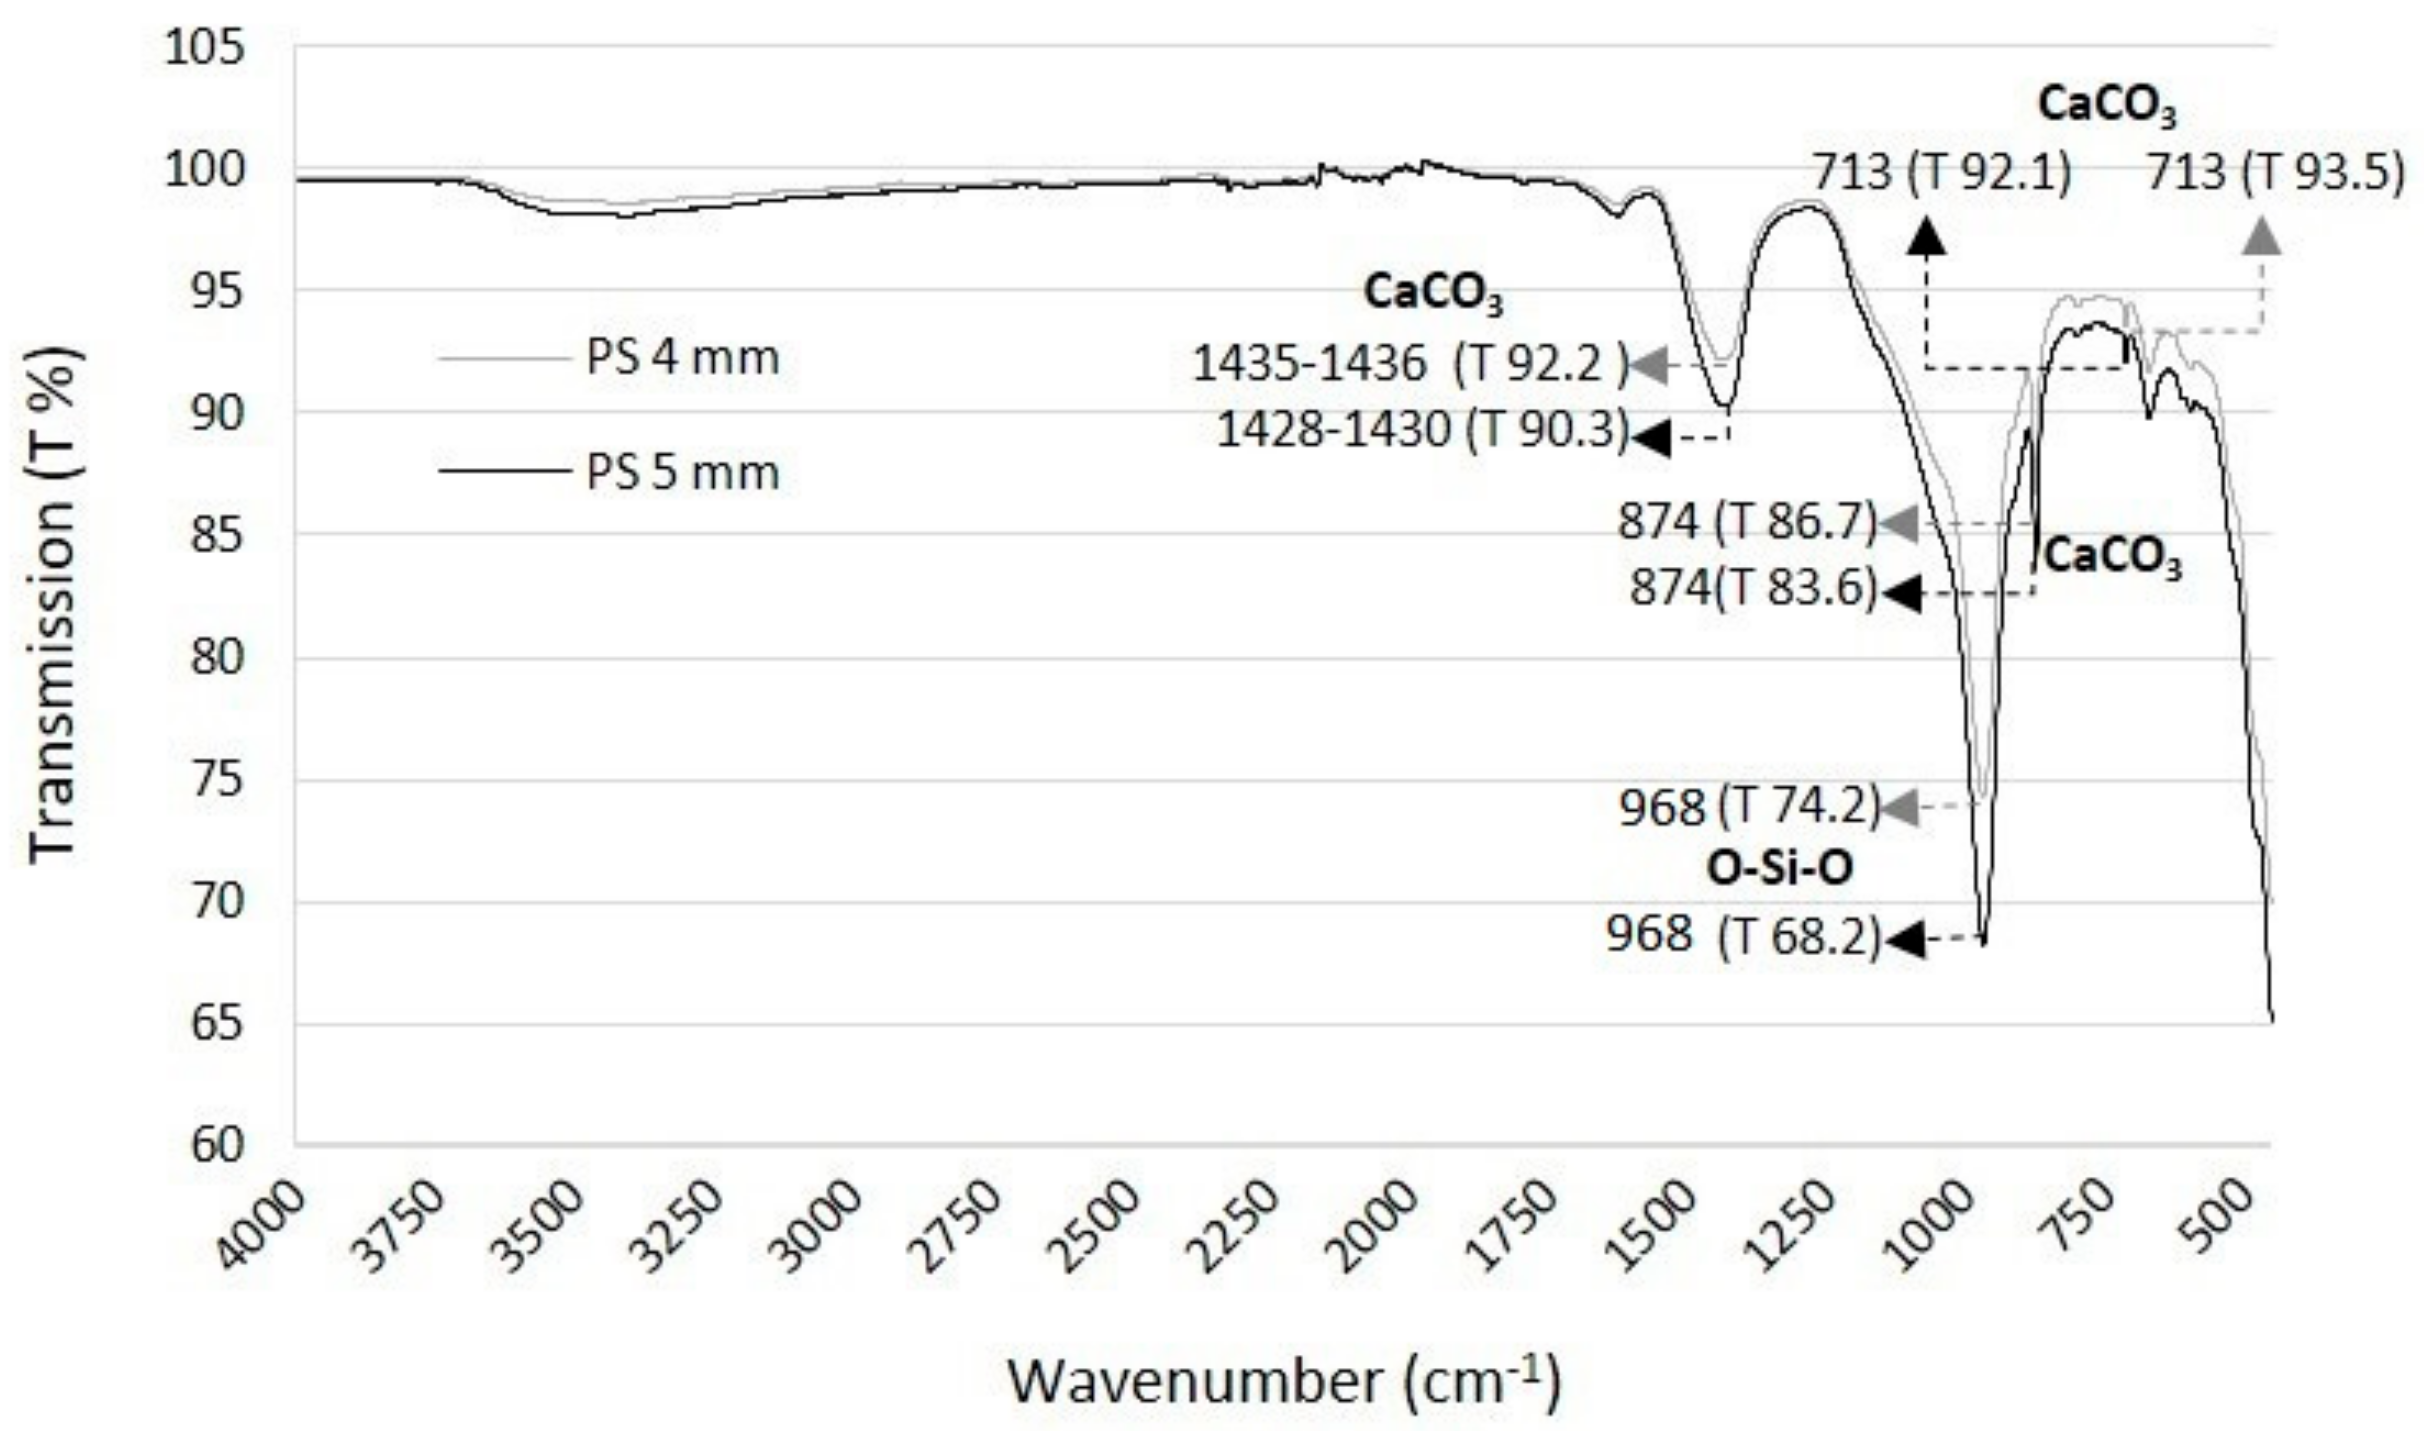
2.2. Chemical and Physical Characterization of the Adsorbent

Initial analysis of the specific surface area was performed following the BET single point method, with a Micrometrics Tristar 3000 porosimeter, and density was determined with helium pycnometer.
X-ray diffraction (XRD) initial analysis were performed with a Bragg Brentano Siemens D-500 powder diffractometer with Cu Kα radiation for a qualitative analysis of the crystalline phases. X-ray fluorescence (XRF) initial semi-quantitative analysis was conducted with a Philips PW2400 X-ray sequential spectrophotometer.
Initial analyses of Fourier-transform infrared spectroscopy (FTIR) were performed to evaluate chemical changes in the adsorbent, and to determine the correlation with potential chemical processes involving P removal. FTIR was performed by attenuated total reflectance (ATR) by using a FT-IR Spectrum TwoTM (Perkin Elmer, Walthan, MA, USA), with a working range from 400 to 4000 cm−1.

2.3. Kinetic Bath Studies

2.3.1. General Information

Kinetic batch studies were carried out at the Department of Bioscience—Aarhus University (Denmark). The experimental design was based on the following factors and levels: Pi, 5, 10 or 20 mg L−1; PS, 4 or 5 mm; and CT, 60, 180, 360, 720 and 1440 min.
Preliminary tests were performed using the conventional methodology for kinetics experiments [20]. Samples were placed in individual flasks, filtered and analyzed [20]. Unexpected and apparently conflicting results were obtained for P removal rates across CT; namely, the removal rate of P was greater at lower CT than at higher CT. In addition, significant differences between repetitions were also noticed, which can likely be attributed to the chemical heterogeneity of the material. Further, as the chemical composition of concrete blocks can vary across material surface and depth, putting each sample into an individual flack might lead to differences in P removal rates, related to the chemical heterogeneity of the absorbent rather than to the variables (PS, Pi and CT), reducing the reliability of the experiment.
The following method was used to reduce the effect of material heterogeneity on the removal of P and to ensure a reliable experimental design. The P solutions were prepared using KH2PO4 and tap water, to maintain the buffer capacity of the solution and to mimic real conditions (tap water characteristics can be seen in https://www.aarhusvand.dk). Pi represents the typical concentration of P in real wastewaters, which can vary from 5 to 10 mg L−1 and up to 20 or 30 mg L−1 in extreme cases [20]. All experiments were performed in triplicate.
For each treatment (Pi5PS4; Pi5PS5; Pi10PS4; Pi10PS5; Pi20PS4; Pi20PS5), three glass bottles were settled up, each one representing one repetition. Each crystal bottle (repetition) was filled up with the 0.2 L of the correspondent Pi solution, and 10 g of adsorbent was added, resulting in an adsorbent dosage of 50 g L−1.
Experiments were conducted under constant room temperature (20 °C ± 1 °C). Aliquots were shaken at 20 rpm (20 °C ± 1 °C), and at each pre-established CT (60, 180, 360, 720 and 1440 min), 0.5 mL of supernatant solution were sampled for P analysis and pH was measured. P analyses were performed according to the ascorbic acid method [21] using a Shimadzu UV-1800 spectrophotometer. Results were adjusted taking into account the amount of P used for each sampling time. Indeed, the amount of P taken represented less than 0.3% of the mass of P (mg) in the samples for all CT. These variations were not considered significant as they were within the expected error (0.5%).

2.3.2. Phosphorus Removal Indicators

All calculations were made in triplicate. The P removal indicators were:
m P t = P t × V t
where m P t (mg) is the mass of P removed at a certain time, P t is the concentration of P (mg L−1) in function of sampling time and V t is the volume (L) at the sampling time, discounting the volume of aliquots taken for sampling (which is accumulative);
  q t = m P i m P f M  
where q(t) (mg g−1) is the mass of P (mg) removed per gram of CAAC at certain time (adapted from [22]), m P i and m P f are the initial and final mass of P (mg) in the aqueous solution, respectively, and M is the mass of adsorbent (CAAC). Both, m P i and m P f were calculated using m P t ;
P % = m P f × 100 m P i
where P% is the percent of P removed at a certain time.   m P i and m P f were described previously.

2.3.3. Statistics

The interactions and main effects of the variables were analyzed by running split-plot ANOVA (repeated measures) and two-way ANOVA. The software used was SPSS version 23 (International Business Machines corporation—IBM, Armonk, NY, USA). For statistical purposes, P removal was calculated using m P t (mg). First, a split-plot ANOVA (repeated measures) were performed in order to determine the within and between variables effects (CT, Pi, PS). CT was the dependent variable measured in mg of P removed at five levels (60, 180, 360, 720 and 1440 min). The independent variables were: Pi with three levels (5, 10 and 20 mg L−1) and PS with two levels (4 and 5 mm). Indeed, tests of normality (Skewness & Kurtosis z-values and Shapiro-Wilk), homogeneity (Levene’s test), sphericity (Mauchly´s test), Bonferroni adjustment for multiple comparisons and post-hoc test were applied [23].
Second, a factorial two-way ANOVA was performed, to analyze in detail the main effects of Pi (5, 10 and 20 mg L−1), PS (2, 4 and 5 mm), CT (60, 180, 360, 720 and 1440 min) and the interaction of Pi and PS with CT. Bonferroni adjustment for multiple comparisons and a post-hoc test were applied in order to determine the significance of the differences between the means across levels [23].
Finally, the conducted experiments were analyzed using Design Expert® Version 7.0 (Statease, Minneapolis, MN, USA) and the use of Design of Experiments (DoEs) to optimize the experimental method [24]. The response surface methodology (RSM) was performed (historical data), in order to further perform an optimization process by using previously obtained results. The DoE methodology is based on the analysis of variance (ANOVA) and allows validation of whether or not there is a synergistic effect between the variables on the final response [23,24]. In this manner, a desirable phosphorous removal (P removal) can be achieved by varying the parameters under study (i.e., Pi and/or CT). Further, DoE allows the user to evaluate which parameters can influence the phosphorous removal (P removal) to a greater extent.

2.3.4. Kinetic Models

In addition to allowing the estimation of sorption rates and constants, kinetic models can also give a suitable expression of the possible processes involved in the removal of pollutants. Therefore, to elucidate the sorption process occurring within the time, the pseudo-first order (PFO) and pseudo-second order (PSO) kinetic models were selected to fit the experimental data acquired. The following non-linearized equations were applied (adapted from [25,26,27]):
PFO :   q t = q e ( 1 e k 1 t )
PSO :   q t = t K 2 q e 2 1 + t K 2 q e
where q(t) (mg g−1) is the amount of P removed at a certain time (t) per gram of CAAC and q(e) (mg g−1) is the amount of P removed at equilibrium per gram of CAAC. The constants K1 (min−1), K2 (g·mg−1 min−1) are the rate constant of PFO and PSO, respectively. All the fitting calculations were performed using MATLAB R2017b.
A least-squares non-linear regression method was applied [26,27,28]. The q(e) obtained were termed q(e)cal. The q(e) experimental (q(e)exp) represents the amount of P removed per gram of adsorbent at equilibrium, which might not be the last sample. Therefore, to estimate the equilibrium time, one-way ANOVA was performed. Equilibrium was assumed when there were no statistical differences between CT; this was termed CTANOVA. Note that while q(e)exp is equal to q(CTANOVA)exp, it was decided to call it q(e)exp; q(e)exp was calculated using the indicator (2), as previously described (Section 2.3.3).
Besides calculating the squared correlation coefficient (R2) for each model, the method of Marquardt’s percent standard deviation (MPSD) was also applied, in order to compare the fitted data (adapted from [28,29]):
M P S D = 1 n m n p i = 1 n q t , i ,   e x p q t , i ,   c a l c q t , i ,   e x p 2
where the terms “exp” and “calc” represent the experimental data acquired with the kinetic essays and the data calculated by fitting the experimental data into the PSF and PSO models, respectively.

3. Results and Discussion

3.1. Physical and Chemical Properties of the Adsorbent (CAAC)

The density of CAAC was found to be 2.51 g cm−3 and 2.46 g cm−3 for PS 4 and 5 mm, respectively. The specific surfaces for PS 4 mm and 5 mm were 12.35 m2 g−1 (± 0.10) and 11.82 (± 0.11), respectively. The density and specific surfaces do not seem to vary between PS. However, previous results have shown that the specific surface of similar materials was more than twice the values determined here, with around 30 m2 g−1 when the PS varied from 2 to 5 mm [5], from 1 to 6 mm [6] and from 2 to 4 mm [14]. As a general rule, the lower the PS, the higher the specific surface. Nevertheless, we noticed the opposite trend when we compared the values determined by Damrongsiri [18] and Bao et al. [10].
The latter indicates that PS is not the only thing that affects the specific surface of CAAC. For instance, the aeration method applied during the production of CAAC can vary according to each company’s protocols, affecting the porosity and specific surface of the material. In general, CAAC blocks are aerated with aluminum powder and autoclaved under specific pressure during a certain amount of time [5]. It is possible that variations related to the type of powder, pressure and duration of the aeration process affect the final specific surface and porosity of the material. The PS and specific surface are extremely important parameters for proper hydraulic design and for predicting sorption performance when NBS are used to remove P. Therefore, recommending general design standards can be challenging when CAAC is used as a filter medium, mainly due to its heterogeneity regarding the relation between specific surface and PS.
The initial FTIR analysis showed a strong peak around 968 cm−1 (Figure 1), which according to Fang et al. [30] represents the “antisymmetric stretching vibration of Si-O-Si”. The expressive peak of Si-O highlights the presence of tobermorite (Ca5Si6O16(OH)2·H2O), which has been determined to be the main component of this type of cement [5,15,16].
We observed a broad band at 1430 cm−1 and sharp peaks at 874 cm−1 and 713 cm−1 (Figure 1), indicating the presence of calcium carbonates [30,31,32]. Previous results from Kiefer et al. have shown a calcium carbonate spectrum with similar bands and peaks, at 1390 cm−1, 871 cm−1 and 712 cm−1 [32]. Indeed, Fang et al. [30] analyzed a similar calcium silicate with the same band, at 1430 cm−1, which according to the authors indicates the great potential of the material for releasing Ca2+ and OH. This indicates that the presence of calcium carbonates in the CAAC that we studied might lead to precipitation and crystallization of P with Ca. The PS 5 mm showed slightly lower transmission for all peaks as compared to PS 4 mm, which might indicate a tendency for having higher contents of the compounds described previously.
About 70% of the chemical composition of the CAAC under study is CaO and SiO2 (Table 1). Similar results were found in the literature, for instance, with a content of Ca and Si were 194 g kg−1 and 232 g kg−1, respectively, and for which CaO and SiO2 together represented more than 70% of the material composition [5,6,10].
For both PS values (4 mm or 5 mm), quartz (SiO2; PDF-01-083-0539), tobermorite (Ca2.25Si3O7.5(OH)1.5·H2O; PDF-01-083-1520), calcite (CaCO3; PDF-01-072-1937) and anhydrite (CaSO4; PDF-01-072-0916) were identified as the main crystalline phases (XRD analysis), which is in accordance with previous studies [5,31]. According to Hartmann et al. [31], the main components of aerated concrete are tobermorite, quartz and calcite (given in order of importance). It should be emphasized that three additional small peaks were detected only in PS 5 mm (23.5°, 27.8°, 30.22°, 48.10°, 51.11°). Those peaks can be attributed to the presence of Ca, Al and Si compounds, such as albite (K0.2Na0.8AlSi3O8; PDF-01-083-2215), wollastonite (CaSiO3; PDF-01-072-2284) and calcium aluminum oxide (Ca5Al6O14; PDF-00-011-0357).

3.2. Kinetics Batch Experiments

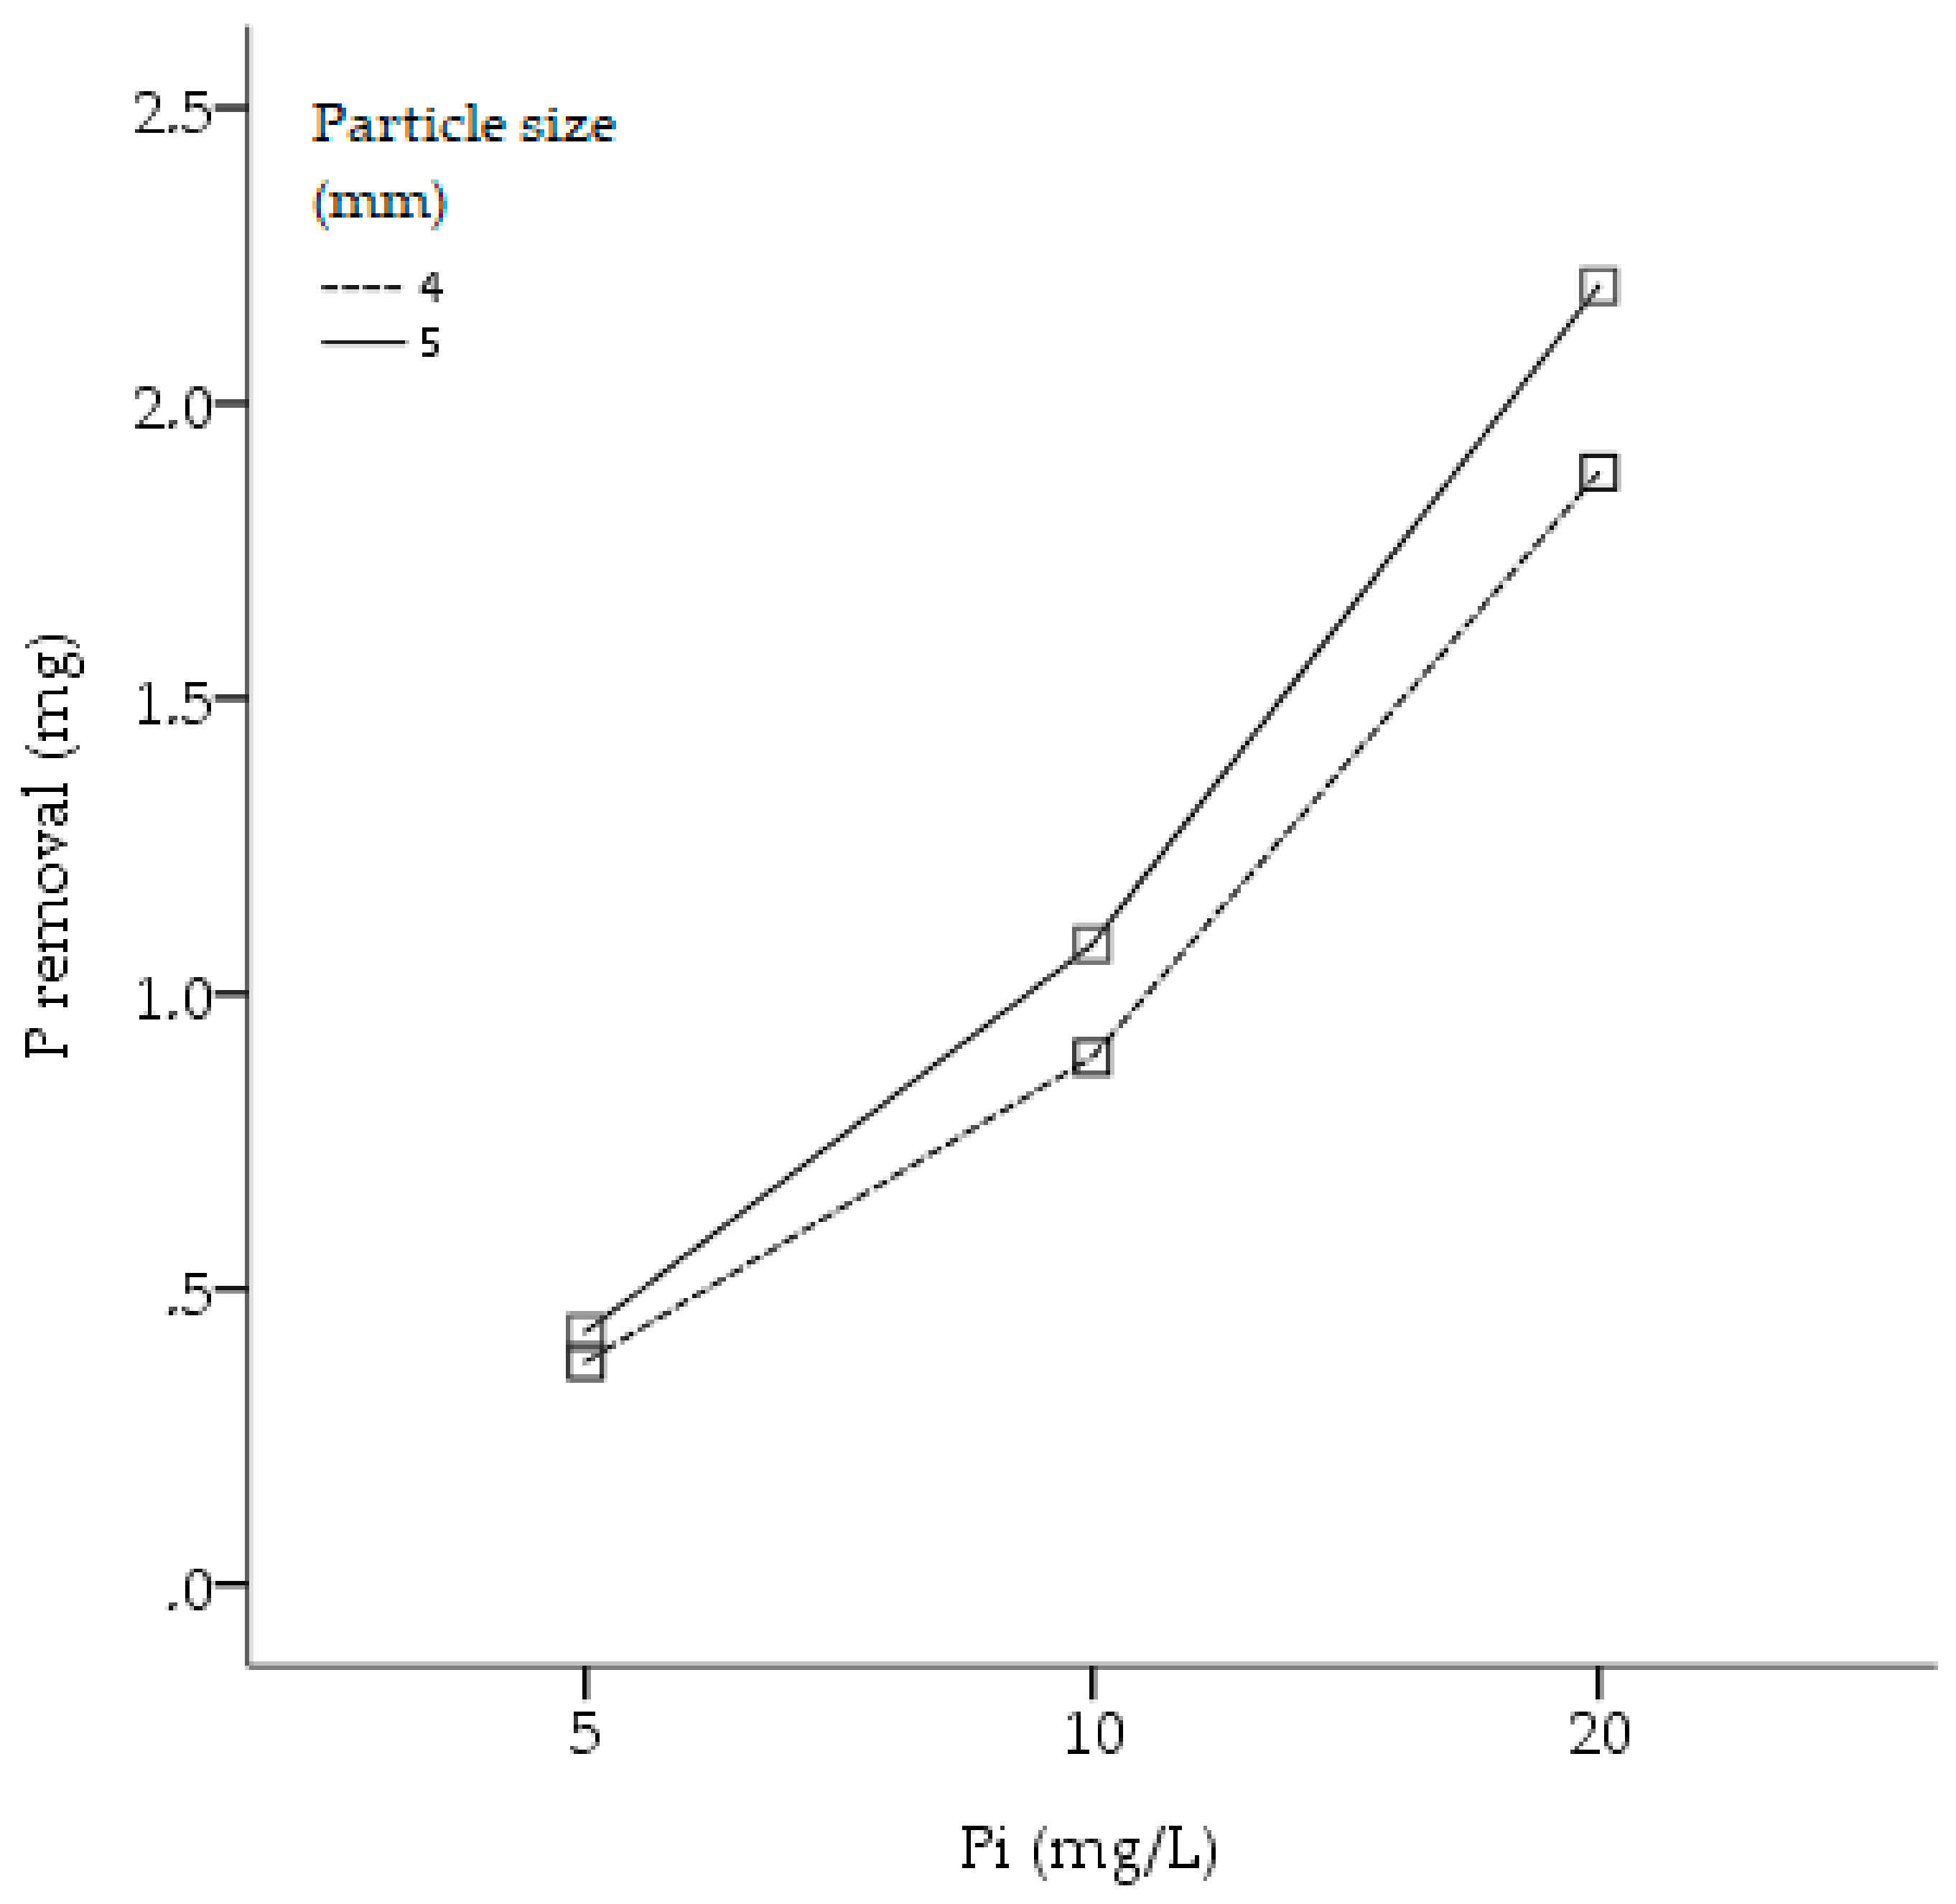
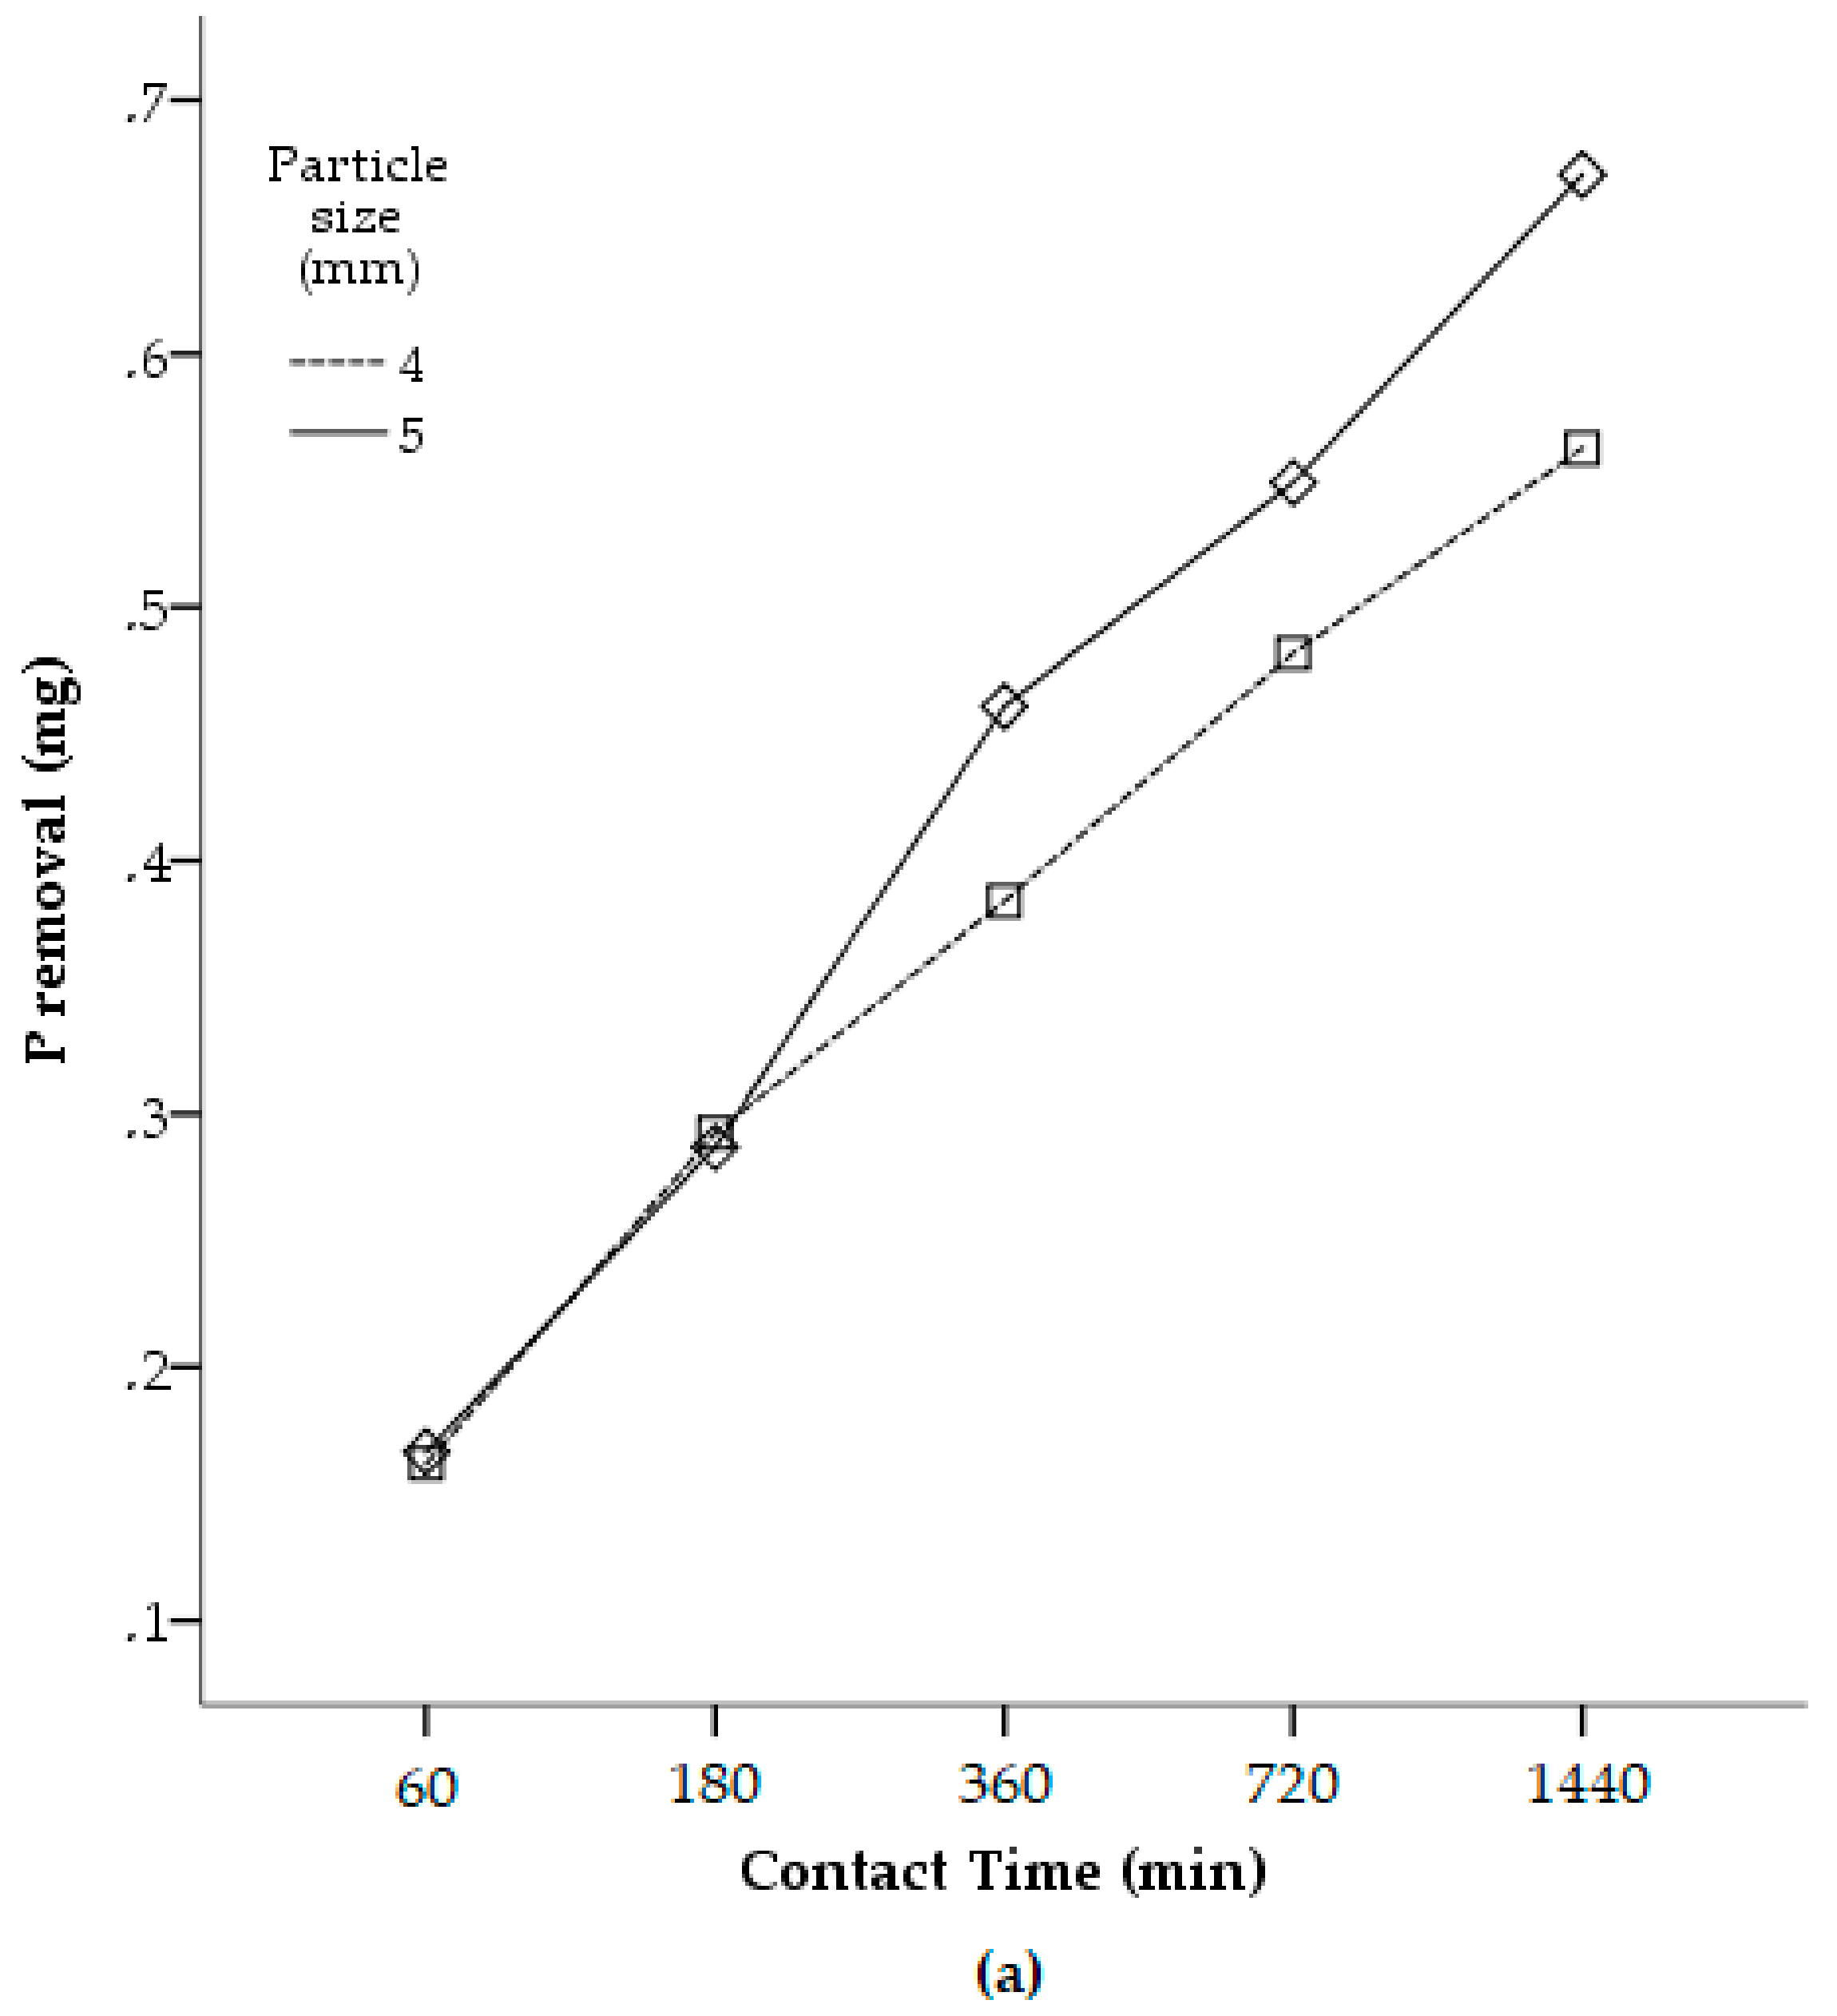
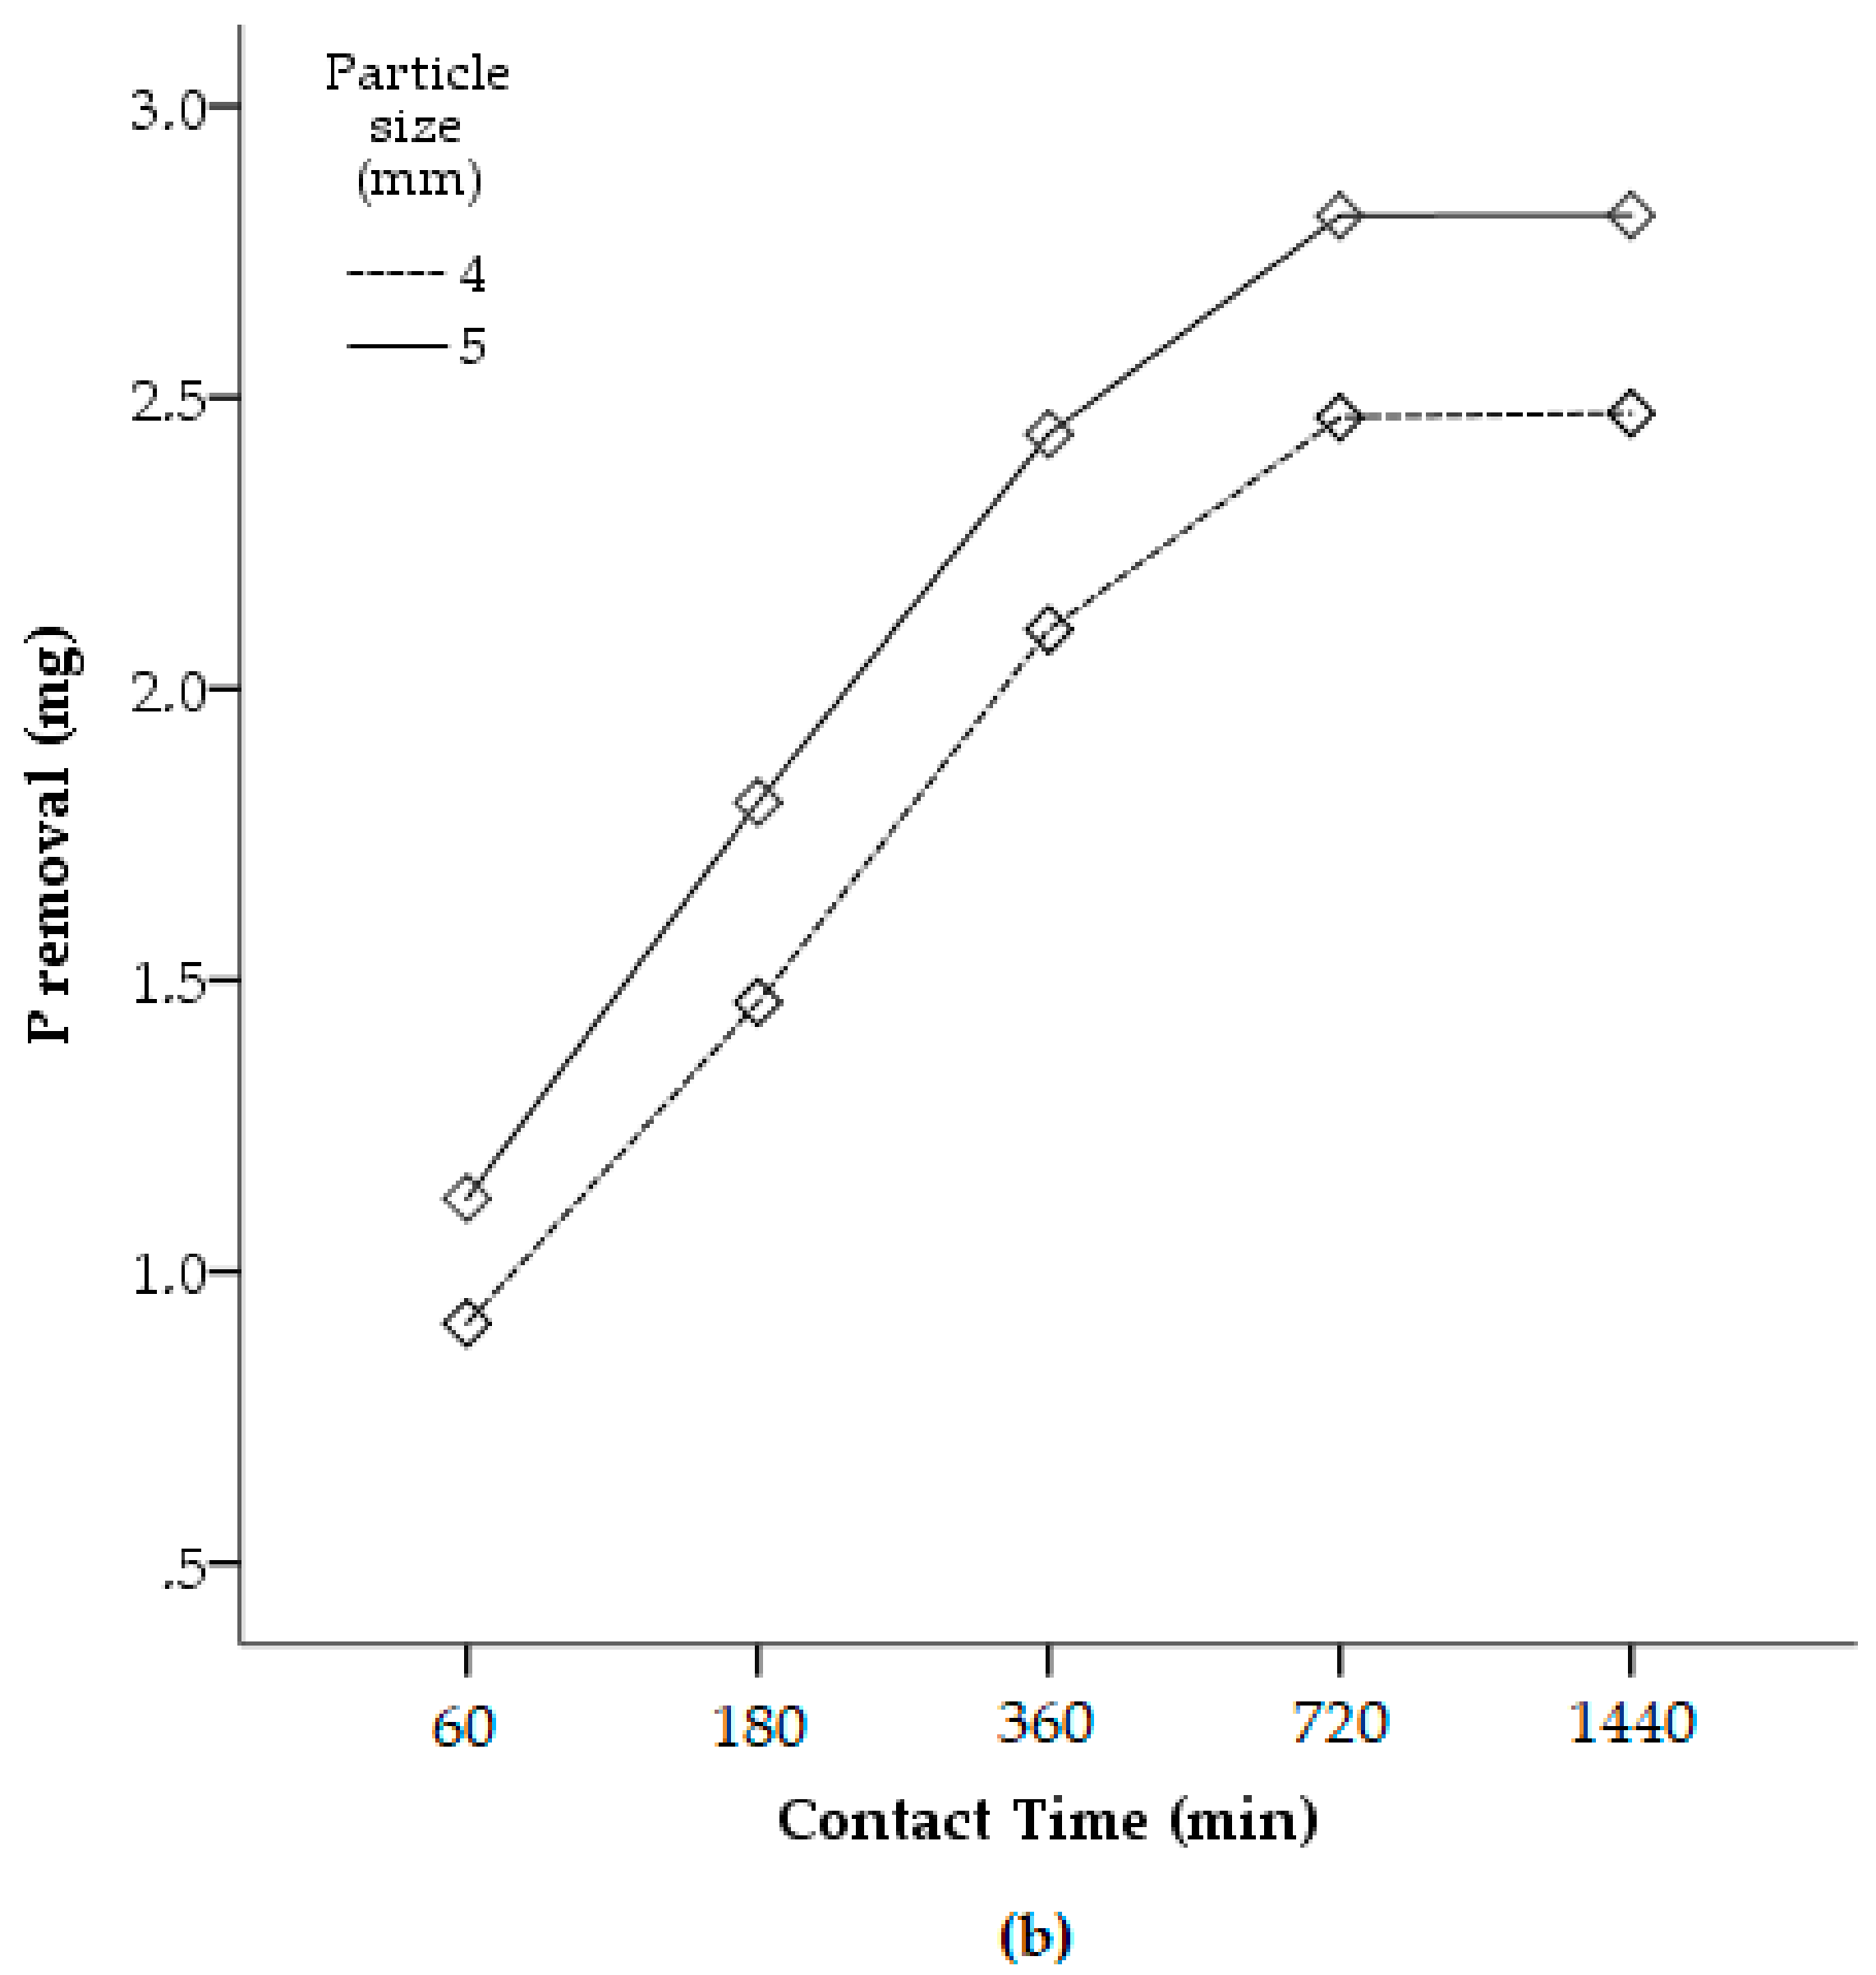
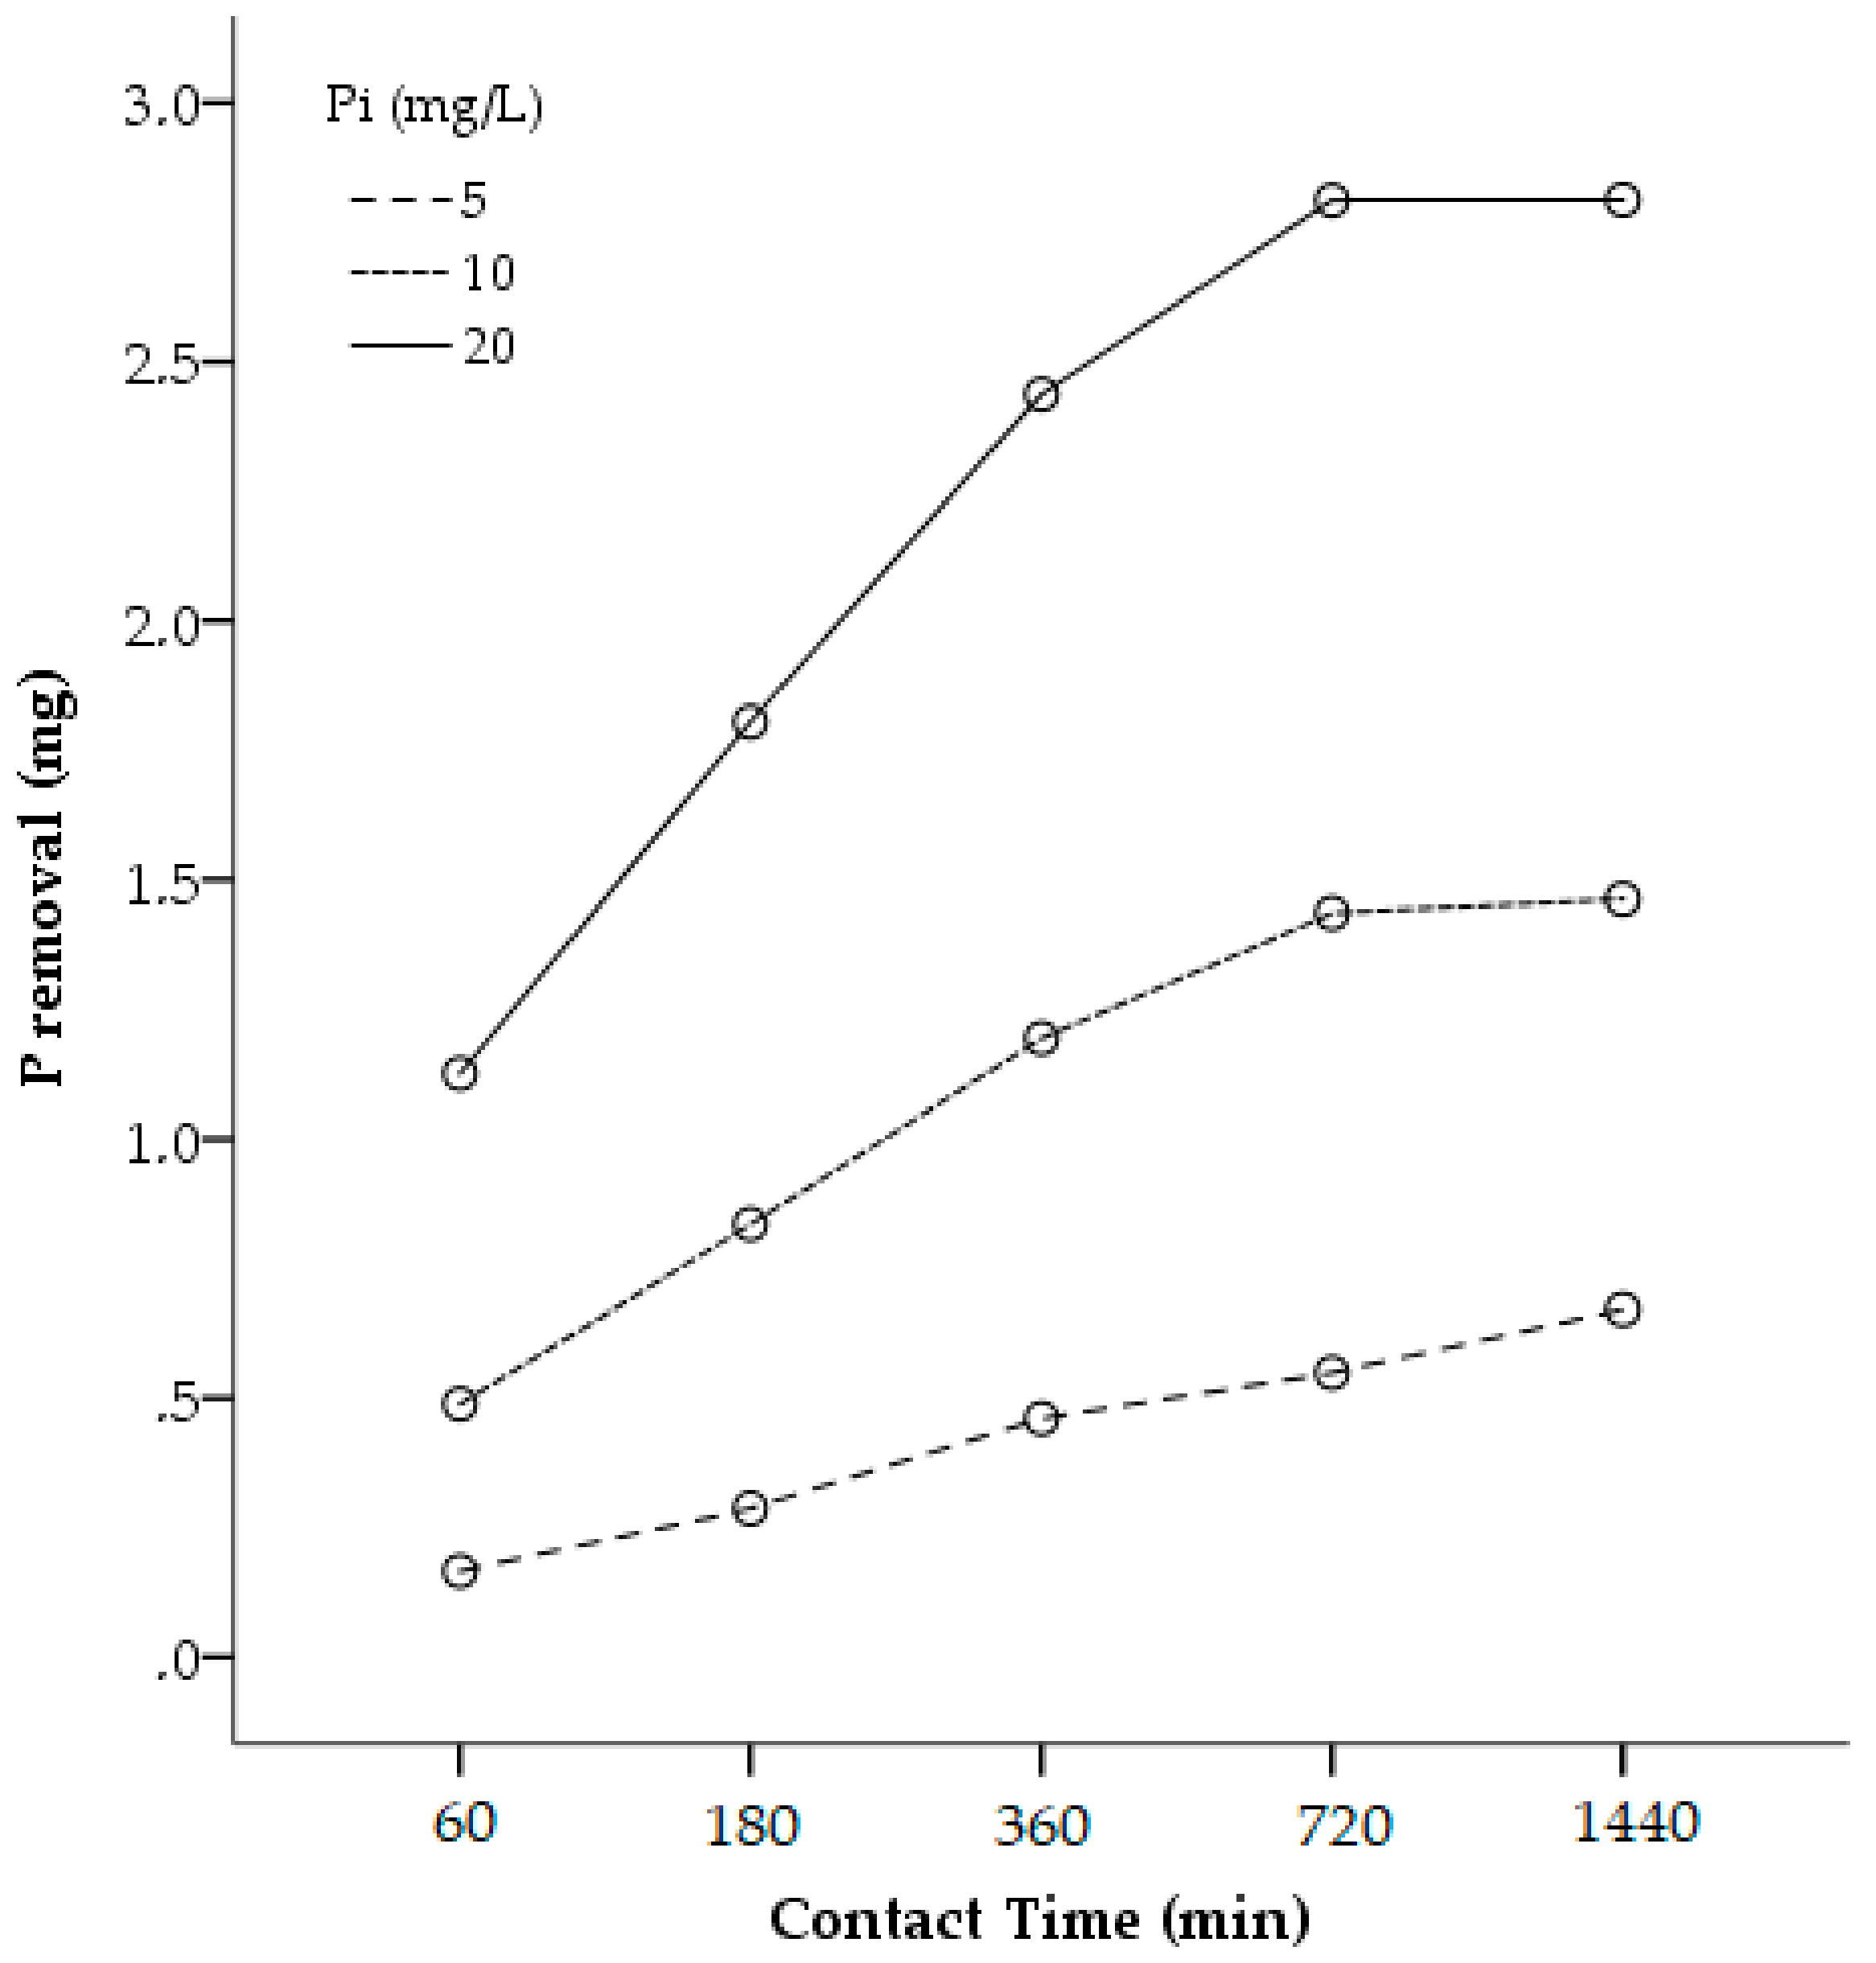
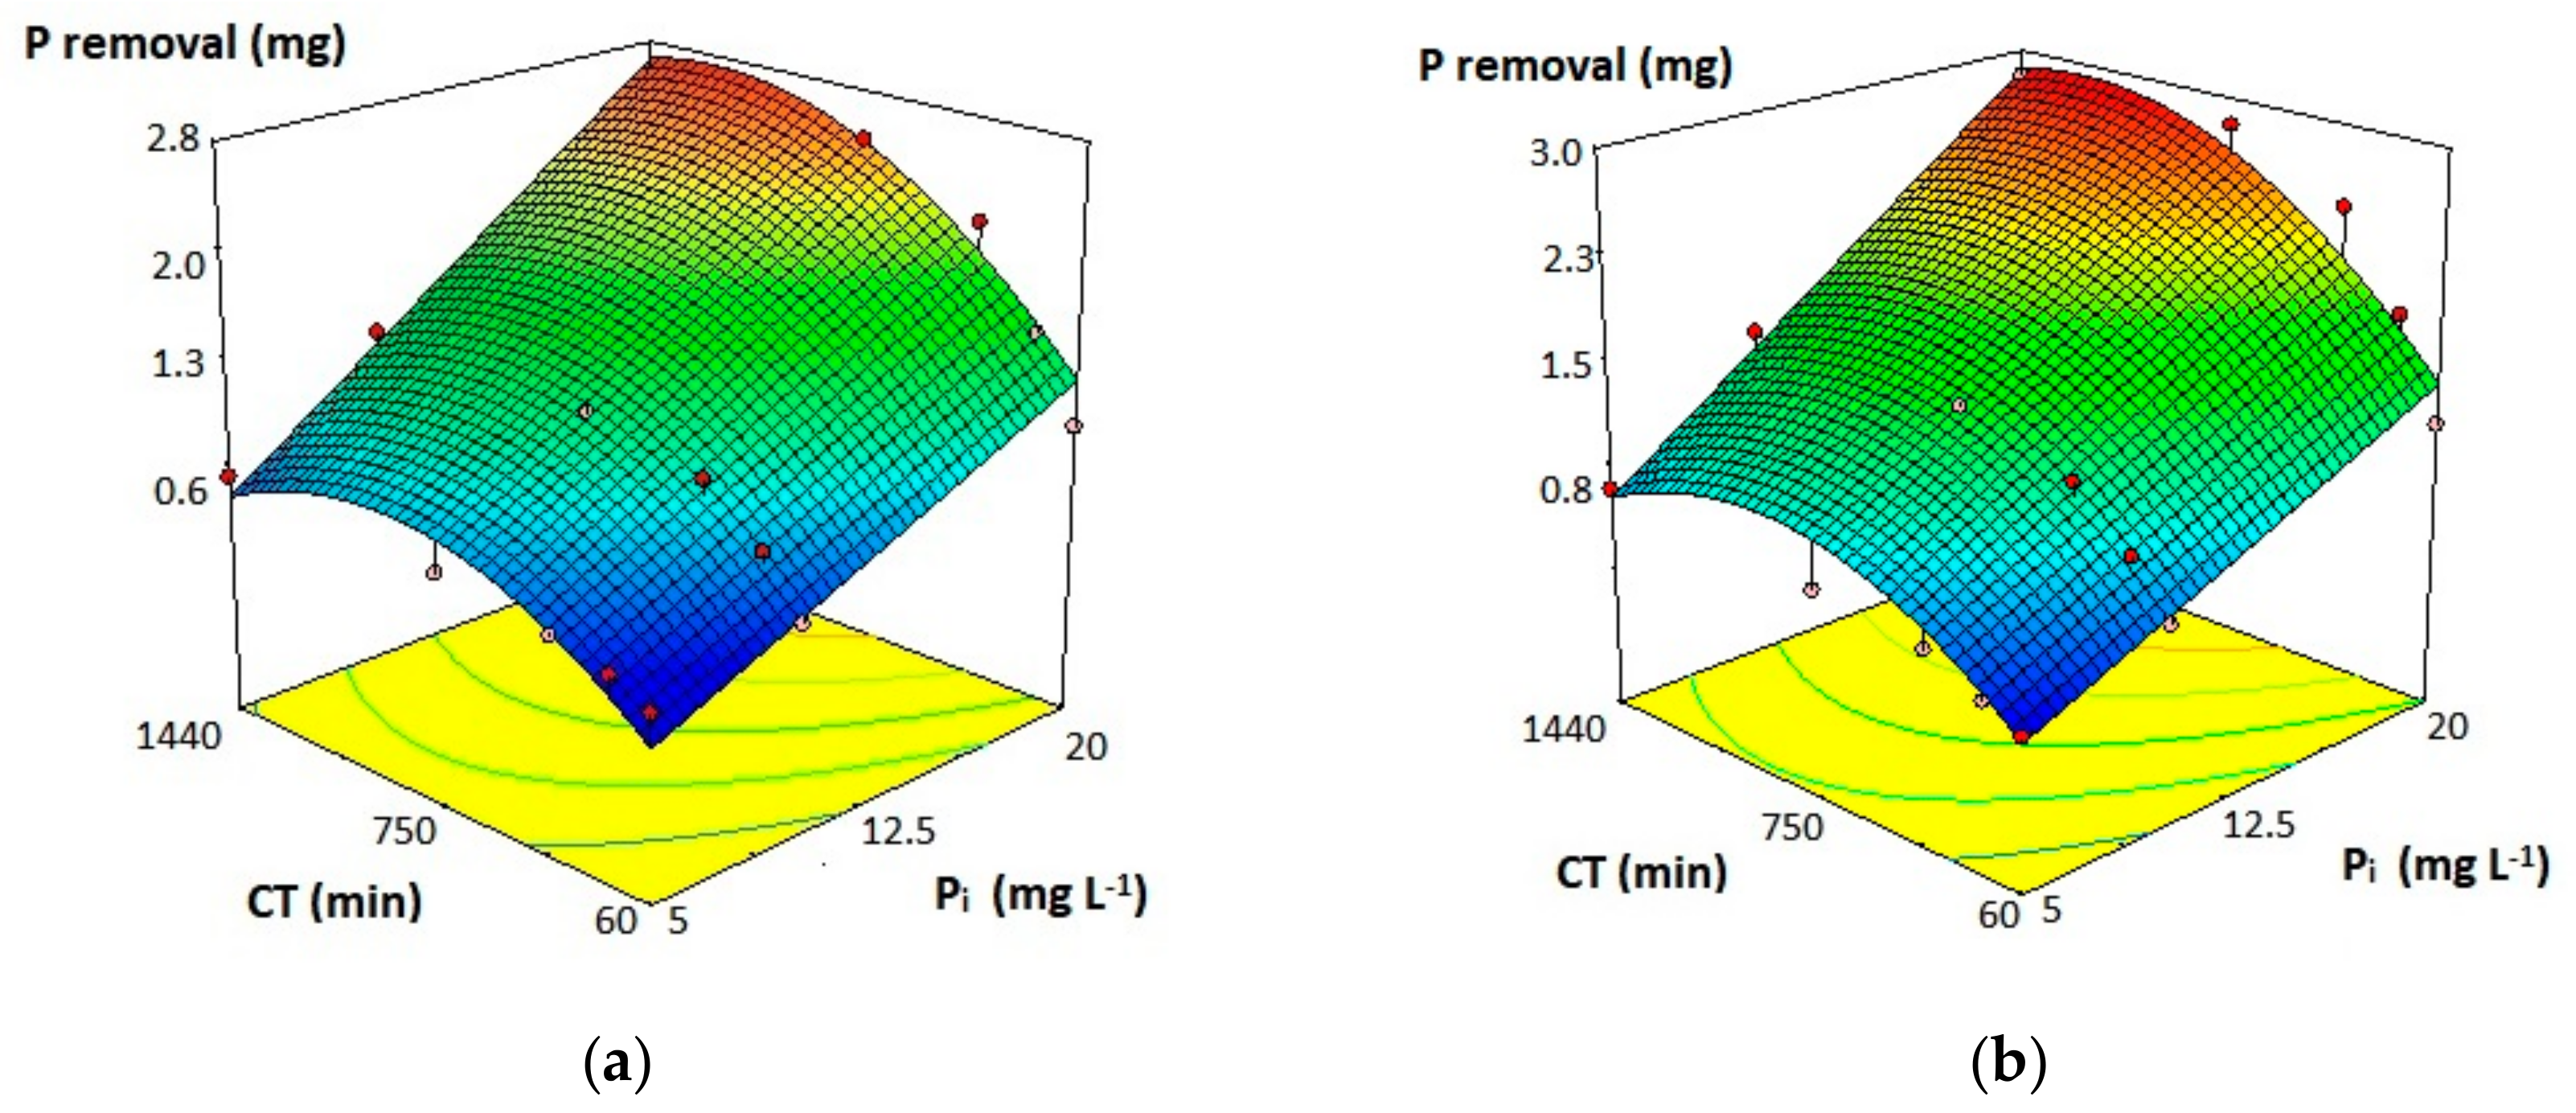
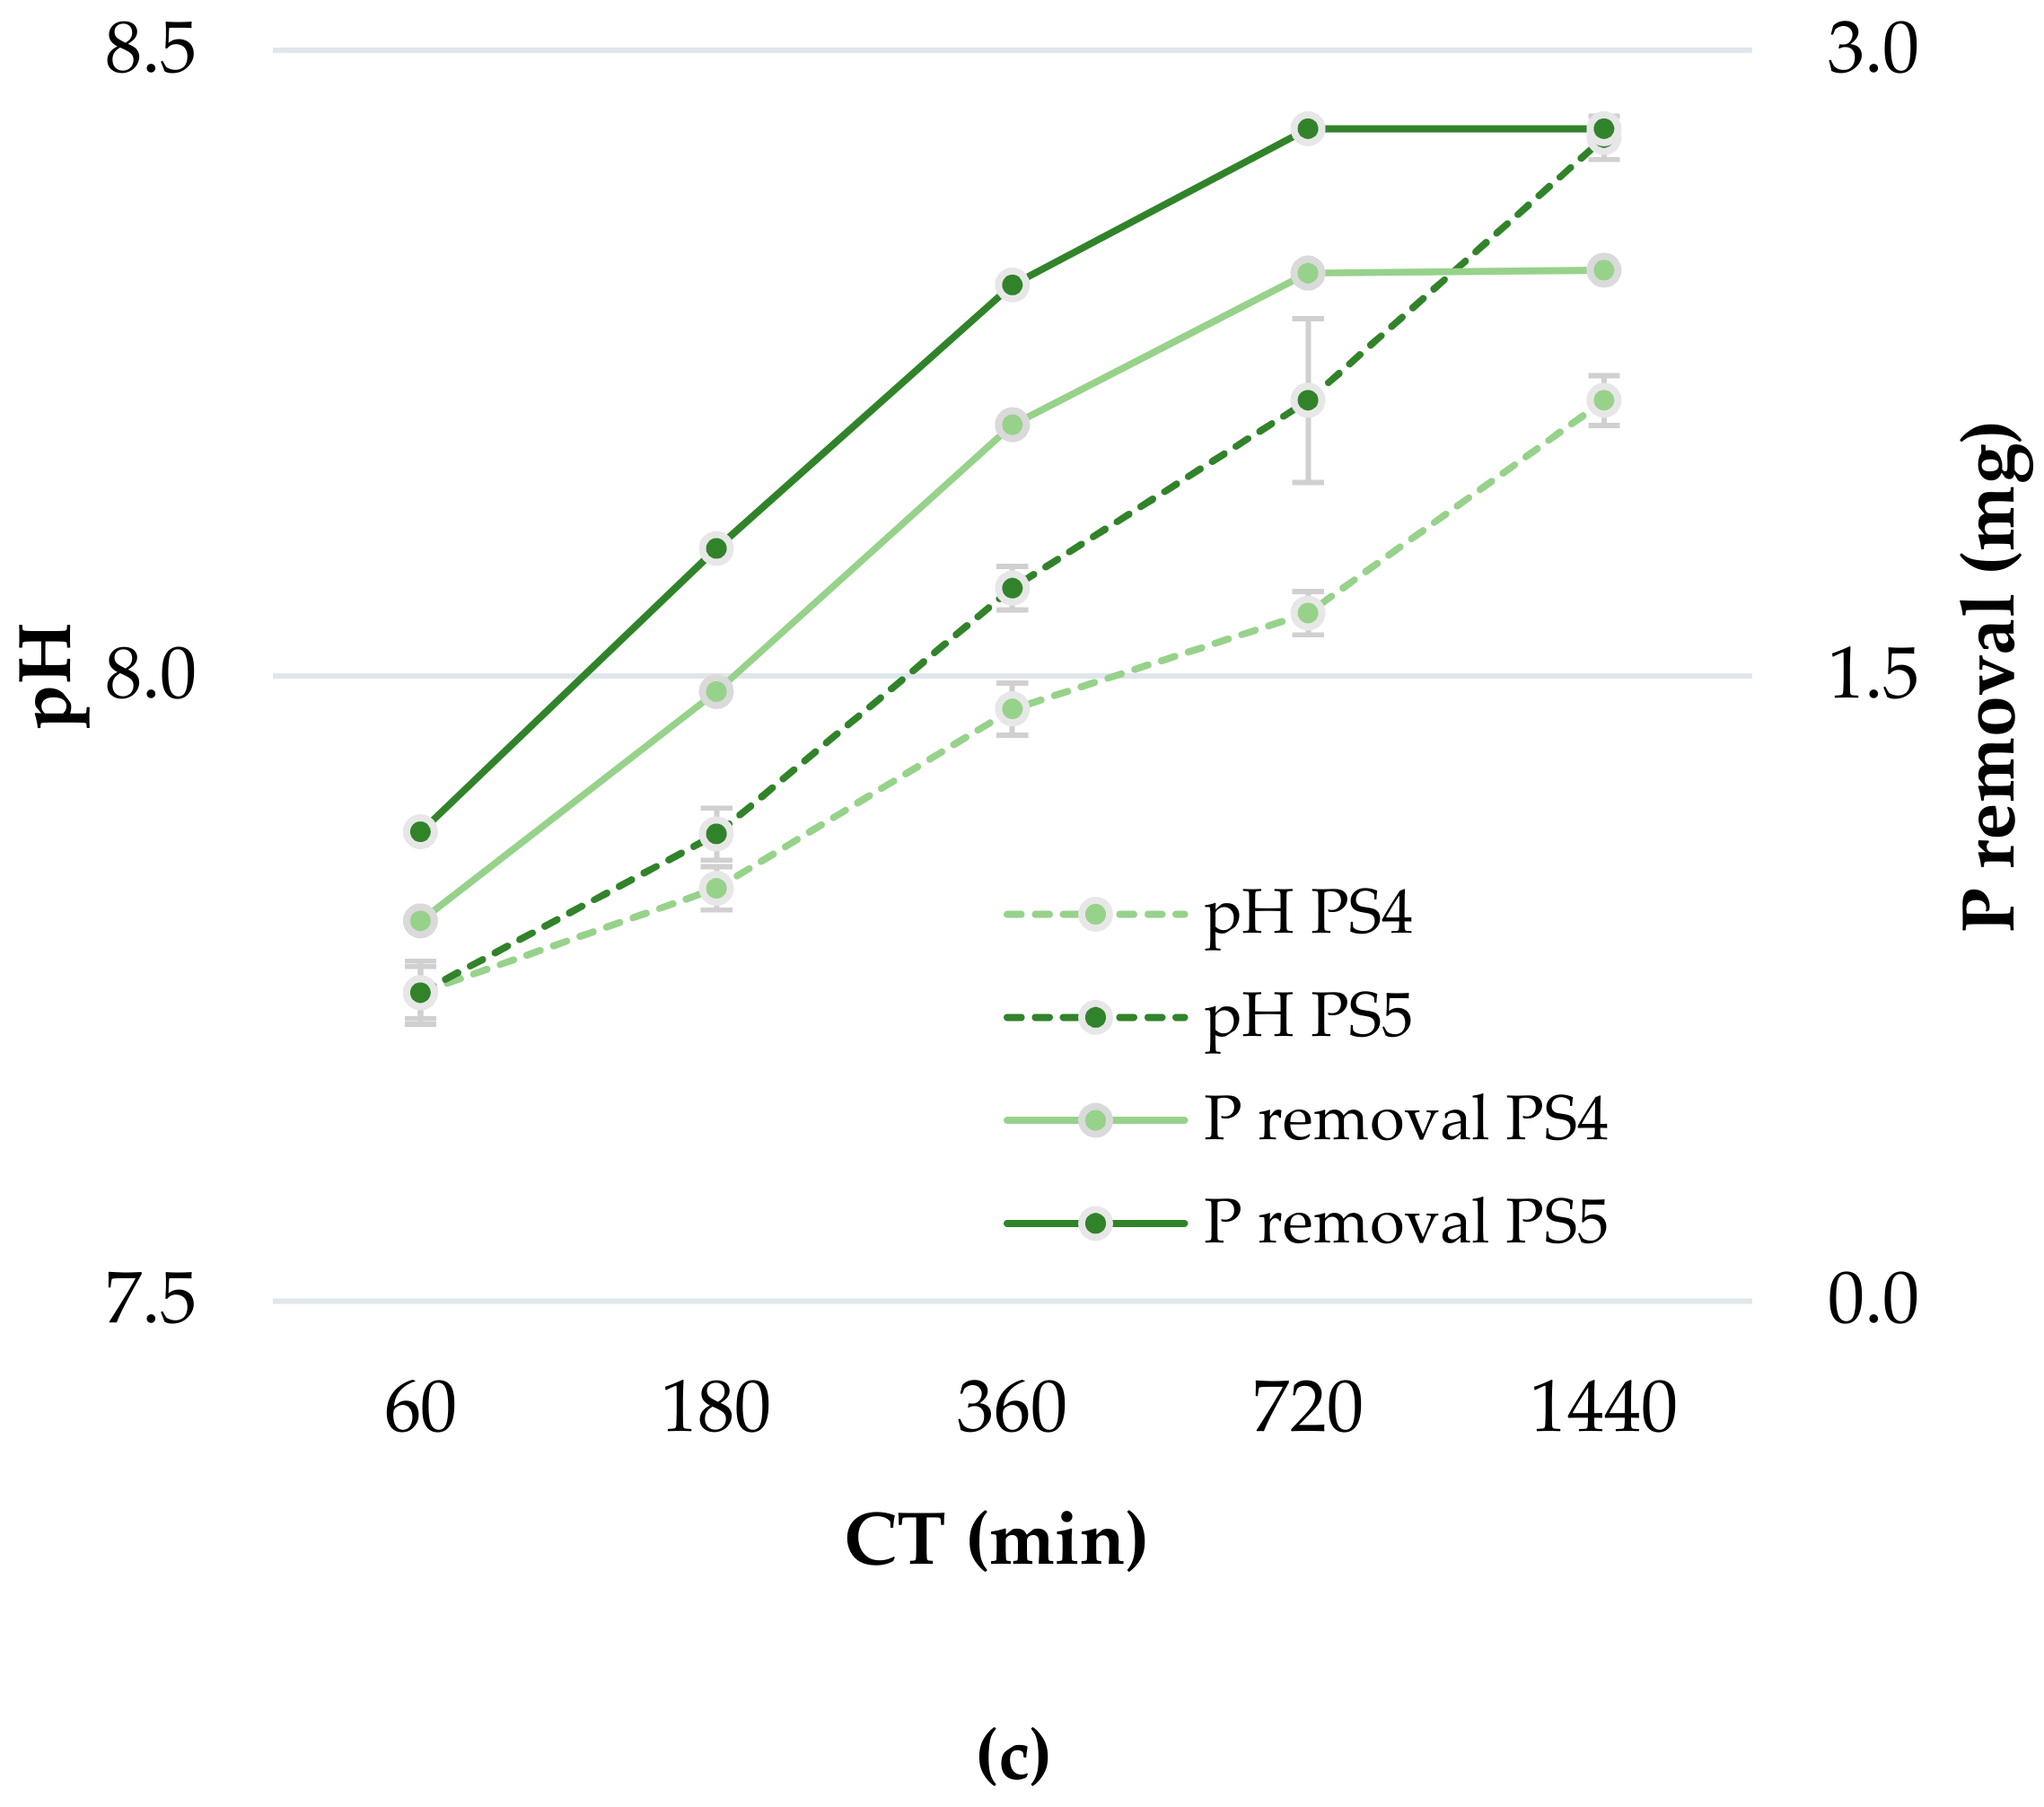
3.2.1. Interactions and Main Effects of Pi, PS and CT

This section aims to identify and discuss the interactions and main effect of Pi, PS and CT on the removal of P at the laboratory scale, mainly due to the importance of these variables for designing NBS for treating rich P wastewaters. On one hand, Pi and PS values can affect the CT needed to achieve the removal equilibrium [20]. Therefore, understanding the interactions and main effects of PS, Pi and CT, by performing kinetic studies, can be useful to predict the efficiency of the material within time in accordance to the PS and Pi. On the other hand, batch studies are usually focused on the sorption performance of material, even though other removal processes can also occur. With regard to the material properties, several factors can influence the sorption performance, such as PS and specific surface, chemical composition (functional groups) and surface charging. However, at the same time, Pi can influence the types of processes that occur with respect to P removal. For example, Deng and Wheatley [15] have suggested that at higher Pi, other processes beside adsorption, such as complexation and precipitation, can occur. Therefore, understanding the main effects of Pi and PS can clarify the role of each of these variables on the P removal process. In other words, accessing the variable has a stronger effect on P removal might also give indications about the prevalent removal process occurring, and thus facilitate further optimization when upscaling the experiment.
First, the interactions and main effects of Pi, PS and CT were analyzed using split-plot ANOVA (repeated measures). Data were considered to be approximately normally distributed. The Shewness and Kurtosis z-values were between −1.40 and 1.40, and the Shapiro-Wilk test significance were above 0.01. The Mauchly’s sphericity test showed a significance above 0.05, and therefore sphericity was assumed. The following assumptions can also be made. Time had a significant main effect on P removal (F(4, 48) = 2390.544, p < 0.001, ηp2 = 0.995); in other words, P removal was moderated by CT. A significant interaction occurred between CT and Pi (F(8, 48) = 310.758, p < 0.001, ηp2 = 0.981) and CT and PS (F(4, 48) = 5.215, p < 0.001, ηp2 = 0.303), in terms of removal of P, which means that the time effect was moderated by both Pi and PS. However, the interactions between CT and Pi seems to be stronger than between CT and PS, as 98% and 30% of P removal can be explained by these interactions, respectively.
The Levene’s test showed significance above 0.01 for all CT values (60, 180, 360, 720 and 1440 min). Therefore, for between-subject’s effects tests, the error variance of the dependent variable was considered equal across groups. The results showed a significant main effect Pi of (F(2, 12) = 2688.878, p < 0.001, ηp2 = 0.998) and PS on the removal of P (F(1, 12) = 100.789, p < 0.001, ηp2 = 0.894). Further, there was a significant interaction between Pi and PS regarding the removal of P (F(2,12) = 17.206, p < 0.001, ηp2 = 0.741) (Figure 2).
However, this interaction may be related to the absence of significant differences between PS when Pi was equal to 5 mg L−1, while for Pi equal to 10 and 20 mg L−1, the differences across levels of P were significant. Thus, the magnitude of the differences between levels of PS across levels of Pi were different (Figure 2), causing the interaction. Indeed, the main effects of PS might be stronger as Pi increases.
The three-way interaction between CT, Pi and PS was not significant in terms of P removal (F(8, 48) = 1.328, p = 0.253, ηp2 = 0.181). Therefore, a factorial two-way ANOVA was performed to understand in detail the main effects of Pi and PS and as well their interactions with CT (Table 2).
Furthermore, an interaction between PS and CT was observed when Pi was equal to 5 mg L−1 (Table 2), which was probably related to the fact that during the first 3 h, differences between PS were not significant (Figure 3a). However, no significant interactions occurred when Pi varied from 10 to 20 mg L−1, which are the mean differences significant for all CT (Figure 3b). The results presented for the interactions between PS with Pi, were likely related to the differences between levels of PS across levels of Pi, which were generated mainly by the absence of significant differences between PS during the first 3 h (CT: 180 min) when Pi was equal to 5 mg L−1, as previously stated. The interactions between PS × Pi and PS × CT can be explained by an absence of differences of one of three levels (Pi—5 mg L−1) and two of five levels (CT, 60 min and 180 min), respectively. For further studies, we would strongly recommend to increase the number of samples during the first 3 h for Pi equal or lower than 5 mg L−1.
The interaction between CT and Pi was significant, regardless of PS, with more than 90% of the variation of P removal explained by this interaction. In other words, the combination of CT and Pi generates a stronger effect on the removal of P than each one separately.
More than 95% of variability on the removal of P can be related to CT, irrespective of which variable is being analyzed. A main effect of PS on the removal of P was evident, regardless of the initial Pi. However, 56, 86 and 88% of the variation can be explained by PS for Pi equal to 5, 10 and 20 mg L−1, respectively. The removal increment provided by PS 5 mm when Pi was equal to 20 mg L−1 was 1.6 to 3.2 times higher when Pi equal to 10 and 5 mg L−1, respectively, suggesting that the main effects of PS might be stronger as the Pi increases.
Contrary to what was expected, PS 5 mm removed more P than PS 4 mm in all the cases, except when Pi was equal to 5 mg L−1 at CT 60 and 180 min, at which time no differences between PS were observed. P removal depends on chemical and physical properties of the adsorbent [20]; however, there were no differences between PS regarding specific surface. Thus, it is possible that the heterogeneity of the material regarding its chemical composition led to an increment of the P removal process, which is not dependent on specific surface or PS. For instance, chemical precipitation with Ca2+ and the formation of Ca–P–silicates aggregates can occur, as the CAAC studied is mainly made of tobermorite and calcite (Section 3.1). Several researchers have shown positive correlations between the chemical composition of filter material and the P sorption process, related mainly to the presence of Al, Fe and Ca [34,35,36,37].
The differences between Pi across the levels of CT were significant, with Pi 5 and 20 mg L−1 responsible for the lowest and highest P removal rates, respectively. The study of Deng and Wheatley [15] also showed a linear increment of P removal as the Pi increased (from 5 to 30 mg L−1). By compared the relationship between P sorption performance of different materials by varying Pi (mg L−1), Cucarella and Renman [20] found an exponential tendency: increasing Pi correlates with a higher sorption of P, as this interaction is stronger with increasing Pi. At higher concentrations of P, besides adsorption, other removal process such as complexation and precipitation took place, resulting in higher P removal rates [15,20].
Moreover, when Pi was 10 and 20 mg L−1, for both PS 4 mm and 5 mm, the pairwise comparison and post-hoc showed no significant differences between CT 720 and 1440 min. Thus, the equilibrium was most likely reached between 720 min and 1440 min (Figure 4). In contrast, the same is not observed however for Pi 5 mg L−1 once the differences between all CT were significant, indicating that the equilibrium was not reached until 1440 min of CT (Figure 4).
The experiment of Deng and Wheatley [15] also showed that equilibrium was reached between 720 min and 1440 min for Pi 15 mg L−1, while the results of Renman and Renman [5] showed that when Pi was equal to 5 mg L−1, 1440 min were needed to reach 100% of removal. Therefore, Pi seems to play an important role regarding the equilibrium. Indeed, there is a tendency that the higher the Pi, the faster equilibrium is reached, and vice versa.
Results of this study showed that with Pi 20 mg L−1 and PS 5 mm (Pi20PS5), more than 60% of P removal occurred during the first 320 min, with less than 10% of removal after this period. In contrast, with Pi 5 mg L−1 and PS 5 mm (Pi5PS5), 40% of P was removed by 320 min, and approximately 20% was removed between 320 min and 1440 min. Karczmarczyk et al. [6] had similar results, with 70% of P removed during the first 600 min and over 20% in the first 5 min. Indeed, Deng and Wheatley [15] showed a substantial removal of P between 60 min and 900 min, with more than 90% removed by 720 min. The processes of P removal needed to reach equilibrium are complex and are basically composed by fast sorption reactions in the beginning followed by slow processes, for instance that of intra-particle diffusion [20]. Therefore, taking into account the experimental conditions presented here as well as those previously published, a tendency can be appreciated: the larger the Pi, the faster and more efficient the removal of P.
Moreover, a proportional relation between Pi and total P removed was evident. The removal of P provided by Pi20PS5 was approximately four-times that of Pi5PS5. The total P removed by Pi20PS5 was approximately two times that of Pi10PS5. Finally, Pi10PS5 removed twice as much as Pi5PS5. The same relation was identified when PS 4 mm was used. Therefore, for the current experimental conditions, the removal of P is proportionally related to the Pi. In other words, if the Pi increases two or four times, it can be expected that the removal of P also will follow this proportional increment, regardless of PS.
The standard analysis of variance (ANOVA) was also conducted for P removal considering the initial 30 aliquots (using historical data design). The factors under study consist on Pi of 5, 10 and 20 mg L−1; PS of 4 and 5 mm; and CT of 1, 3, 6, 12 and 24 h. The response under evaluation was P removal in mg.
Hence, a response surface–reduced quadratic model was obtained. As the interaction between Pi and CT was noticed, a quadratic term for CT presented a significant effect on the response, in the range of study. The results obtained from the modification of any of the controllable variables can be translated into a predictive mathematical model. The obtained model can quantitatively predict the response in the range of study. As was mentioned above, the mathematical model only presents the statistically significant factors and interactions (i.e., p-value < 0.05). Therefore, the mathematical is depicted by the following equation:
P removal (mg) = 1.333 + 0.083Pi + 0.186PS + 0.107CT + 0.003Pi × CT + 0.004 × CT2
Figure 5 shows the surface plot obtained for P removal. An increase of Pi leads to an increase of P removal. Meanwhile, an increase of CT leads to an increase of P removal in a different manner because of the quadratic term in the equation.
Further, it is remarkable that an increase of both factors at the same time led to a higher effect than expected by considering the sum of each factor separately. This additional effect can be attributed to the positive interaction between them.

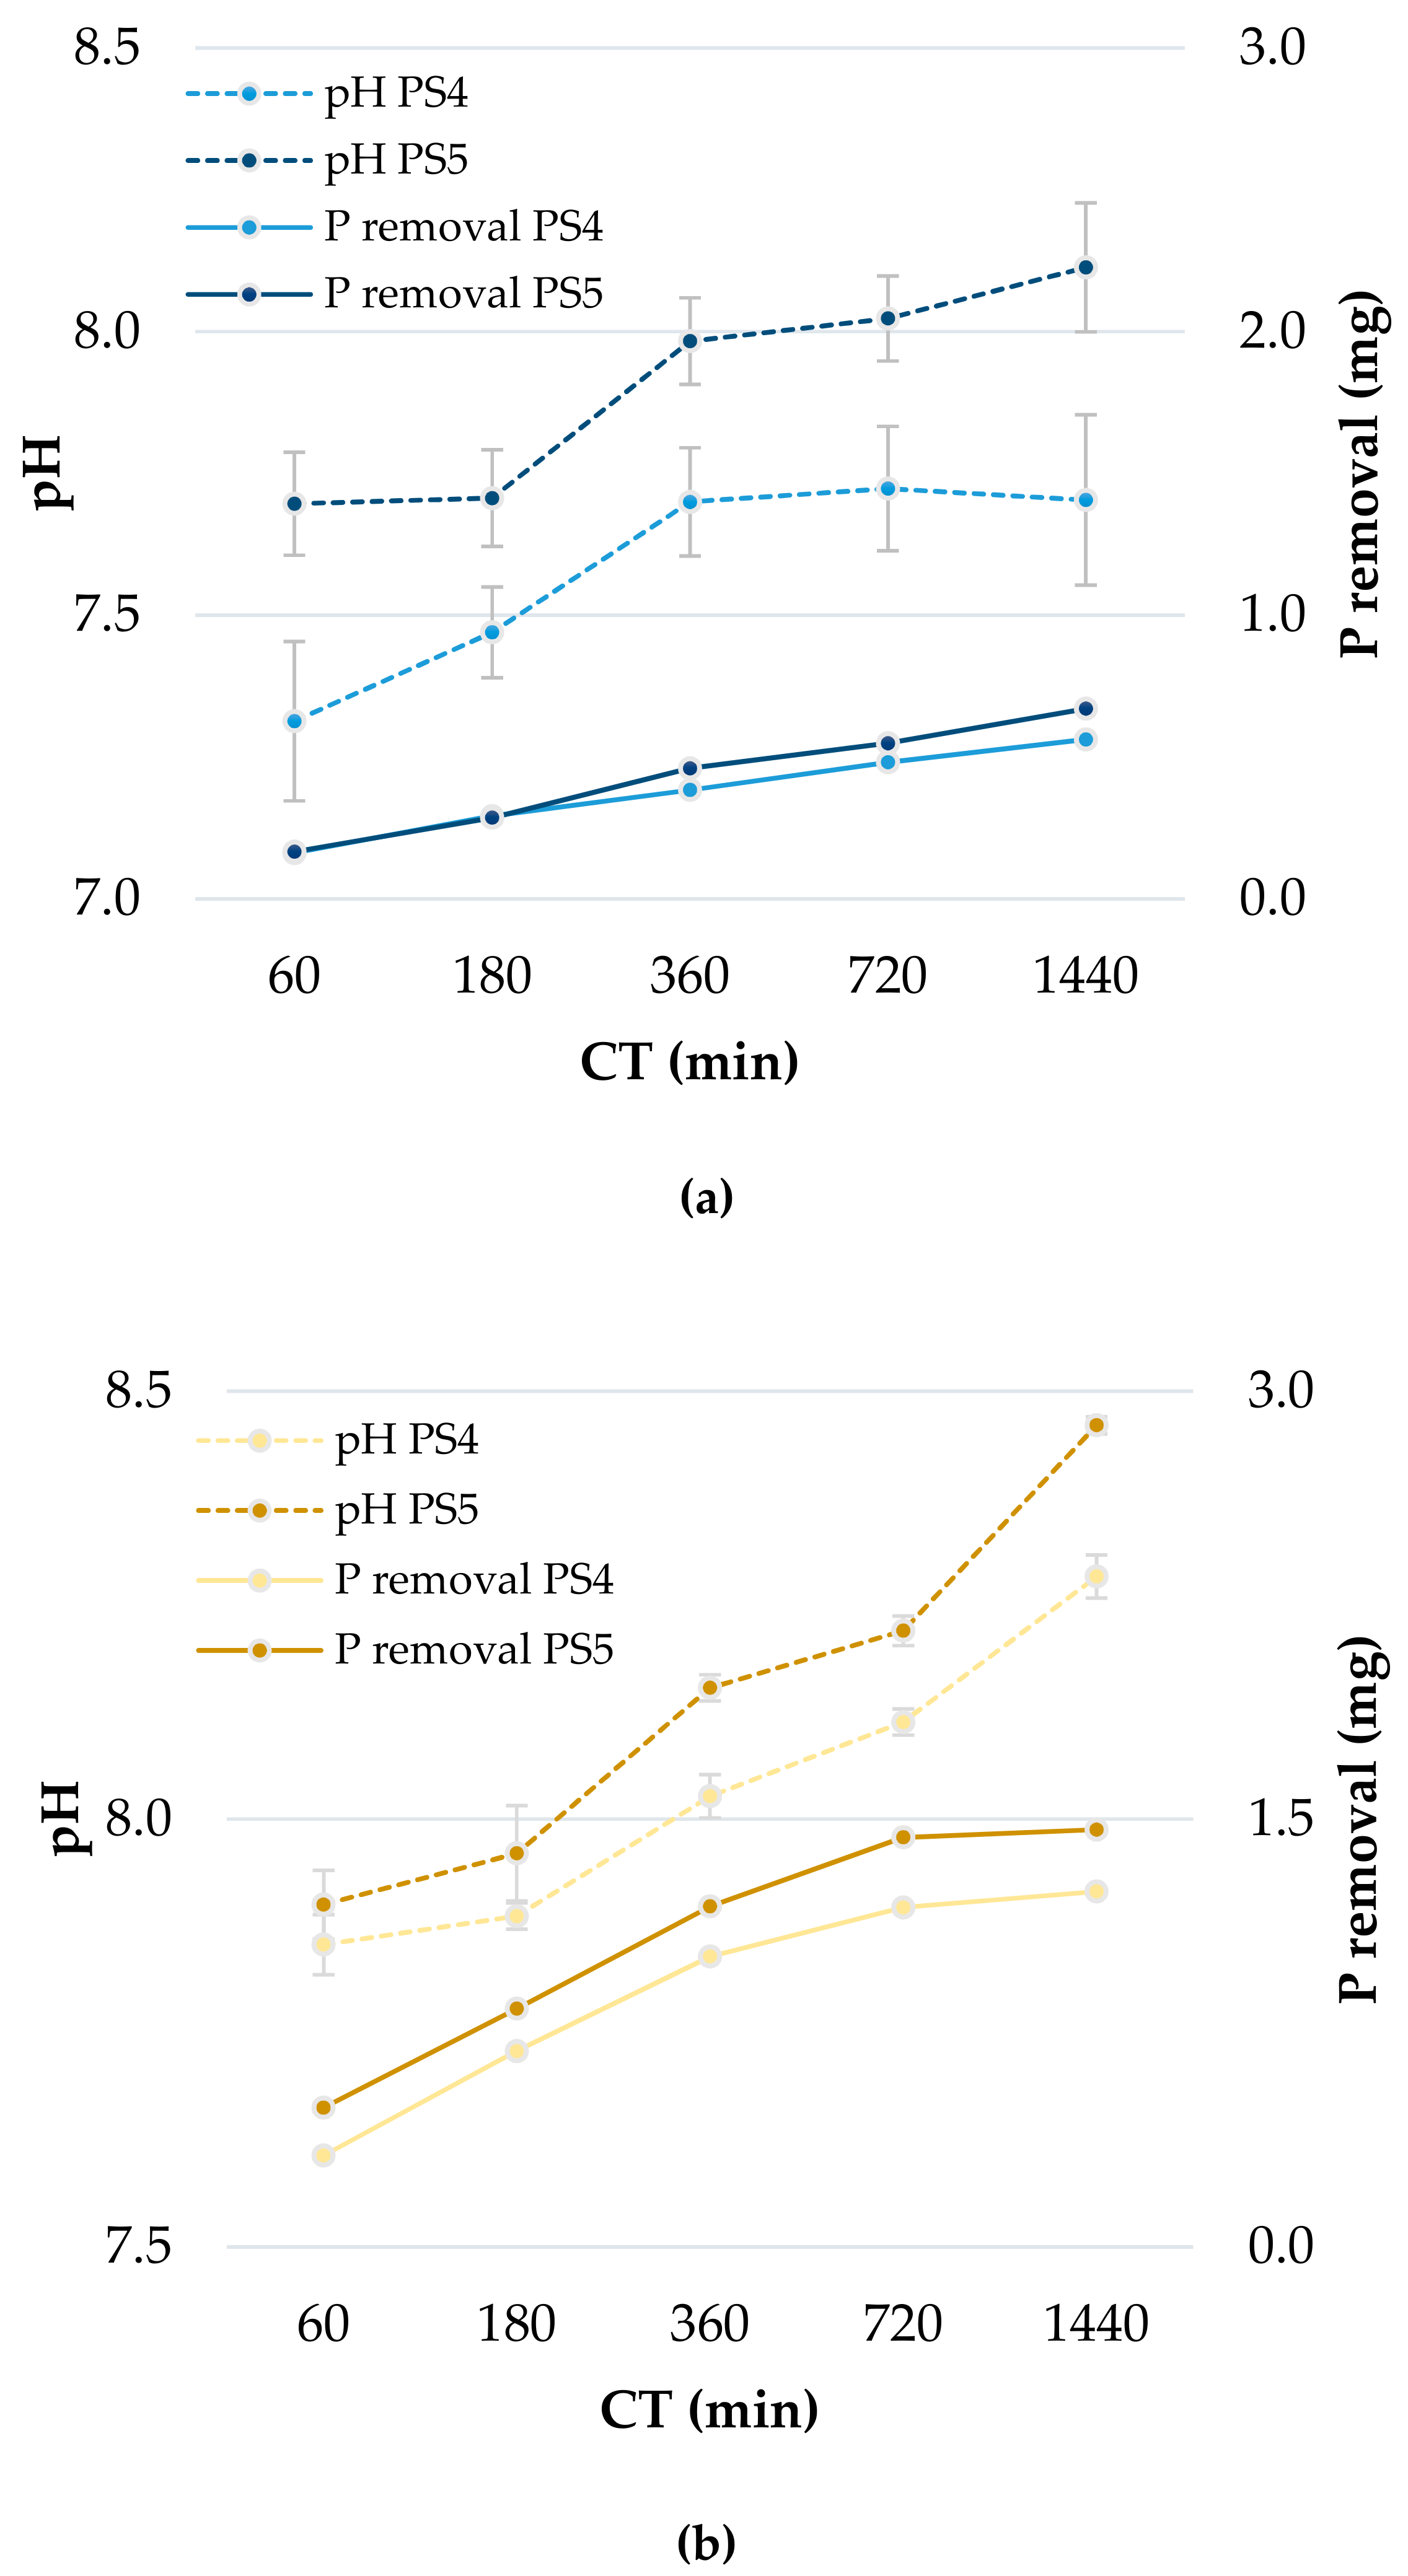
3.2.2. Potential Removal Process

Regarding P removal, several compounds formed can be expected, such as calcium phosphate dihydrate (CaHPO4·2H2O), octacalcium phosphate (Ca8H2(PO4)6·5H2O) and hydroxyapatite (Ca5(PO4)3OH) [3,15,35,38]). However, several factors can affect the formation and longevity of calcium phosphates, such as pH, Pi and Ca2+ availability [19].
The pH influences the availability of phosphates formed and the solubility of products formed with Ca. For example, hydroxyapatite is the most common Ca-P precipitate, which is normally formed at high pH (above 10), while calcium phosphate dihydrate and octacalcium phosphate are expected at lower pH [3]. In the pH range of the present study (7 to 8.5), H2PO4 and HPO4 were expected, which can form Ca(H2PO4)2, a highly soluble product, and CaHPO4; a less soluble form of Ca-P [39]. Thus, the removal of P by precipitation with Ca2+ might not be a predominant process, mainly due to the solubility of the products formed. However, precipitation might be an intermediate process.
Conflictive results can be found in the literature regarding the effect of pH on the removal of P. Several authors have suggested that P removal can be favored by acid pH [15,40]. Deng and Wheatley [15] suggested that, at an acidic pH, material is positively charged and therefore binds negative orthophosphates and acidic forms of P (H2PO4 and HPO42−). In contrast, functional groups dissociate at high pH, generating negative ions and thus reducing adsorption due the limited interactions of phosphate anions with the adsorbent surface [40]. In contrast, phosphate removal can be enhanced by an increased pH, as the released Ca2+ probably triggers crystallization of calcium phosphate compounds [19,38,41]. Wang et al. [42] have suggested that the release of Ca2+, Al3+ and OH ions lead to precipitation when cement-based material is used to recover P. Further studies should thus consider the determination of the point of zero charge of the adsorbent in order to clarify the range of pH at which the sorbent is negatively or positively charged.
In the present study, a pH increment and release of Ca2+ within time was expected, due to the presence of calcite (CaCO3) (Section 3.1). In this regard, ANOVA results showed a significant increase of pH with time, varying from 7 to 8.5. Calcite can react with H+ (CaCO3 + H+ = Ca2+ + CO2 + H2O), or for instance cement hydration products like calcium hydroxide, which can be dissolved (Ca(OH)2 = Ca2+ + 2OH) [18].
On one hand, the increment of effluent pH might become a limitation on using this material, as it can lead to loss of aquatic fauna biodiversity as well as to carbonation inhibition. In this regard, Nilsson et al. [14] studied a material called “sorbulite”, which is manufactured from autoclaved aerated concrete (AAC). The main goal was to remove several contaminants from wastewater, including P, and to minimize the pH increment or even reduce the pH. The results showed a reduction from a pH of 9.1 to 8.9, which is still higher than the range of pH registered in the present study (7.0–8.5) at approximately the same Pi (10 mg L−1). This suggests that the material used in the present study might have a low environmental risk with respect to the effects of higher pH on losses of aquatic fauna biodiversity.
On the other hand, the carbonate inhibition should not be an issue in the range of pH of the present study regarding the removal of P, as CO32− formation becomes significant at pH values above 9.0. However, carbonation inhibition can be more likely as Pi increases, due to the Pi effect on pH increment, considering that the pH reached equilibrium very quickly when Pi was 5 mg L−1, which was only after 180 min. In contrast, the pH kept increasing after 1440 min when Pi was 10 and 20 mg L−1. In this regard, Okano et al. [16] results showed a pH increment of up to 8.9 in just 20 min when Pi was 90 mg L−1 (approximately calculated considering authors data: 392 mg KH2PO4 L−1). Although, the author stated that free Ca2+ reacted rather preferably with HPO42− rather than CO32−, even at this range of pH where carbonate inhibition is expected, and the reasons remained unclear. For instance, the carbonation process can be moderated by Pi when pH is lower than 9. In addition, the current results suggest that Pi can influence either the release of Ca (as higher Pi as higher release of Ca2+), the increment of pH (as higher Pi as higher the increment of pH).
Moreover, when Pi was 20 and 10 mg L−1, P removal reached equilibrium after 720 min, and no pH equilibrium was reached (Figure 6). The fact that the pH continued to increase after P removal reached equilibrium might indicate that free Ca2+ was probably being released and not reacting with P. When Pi was 5 mg L−1, the pH reached equilibrium after 180 min, while P removal did not reach equilibrium until 1440 min (Figure 6). This might suggest that, after pH equilibrium, the release of free Ca2+ was most likely the “limiting factor”, indicating that other removal process, besides precipitation of Ca-P, were taking place.
Okano et al. [16] studied an amorphous CSH and concluded that precipitation of P with free Ca2+ cannot be considered as the prevailing mechanism for P removal. They suggest that the formation of Ca–P–silicates ion aggregates is likely to occur by binding of triple cations ([Ca2+-(HPO4)2+-Ca2+]2+) with the negatively-charged surface. For instance, two mechanisms can lead to a negatively charged surface, which indirectly favors the formation of Ca-P-silicates. When Ca2+ and Si are released, the surface acquires negative electrical charges [16]. Ca2+ release might increase as calcium phosphate are formed, as free calcium is removed from the aqueous solution, pushing the equilibrium.
The combination of higher values of both Pi concentration (20 mg L−1) and PS (5 mm) leading to better P removal rates can be attributed to two main theories, based on the previous publications (as discussed also above). First, considering that the specific surface was very similar for both PS values (Section 3.1), the chemical constitution seems to play an important role at P removal rates. Initial FTIR analyses of PS 5 mm showed lower transmission for all peaks as compared to PS 4 mm, which could for instance indicate higher amounts of calcium carbonates and silicates. In regard to PS, 5 mm showed higher values of pH in comparison with 4 mm, which might be related to the presence of wollastonite only in PS 5 mm. The dissolution of wollastonite can lead to an increment of pH in the aqueous solutions [43]. Moreover, wollastonite (CaSiO3), is a calcium meta-silicate known for its great performance at removing P [44,45]. According to simulations performed by Herrmann et al. [46], wollastonite can play an important role of providing Ca2+ and OH for PO4 precipitation. Moreover, P adsorption can also be related to, either by ion or surface exchange [47].
Second, higher Pi and PS values likely lead to faster and higher rates of Ca2+ release, which reacts and forms high/medium soluble calcium phosphates products (Ca(H2PO4)2 and CaHPO4), thus removing free calcium for a certain time, pushing the equilibrium and leading to a negatively charged surface of the absorbent. Therefore, at the experimental pH (which was lower than 8.5), the precipitation of Ca-P is likely to be an intermediate process that leads to sorption of triple Ca-P cations and perhaps also the formation of Ca-P–silicates ion aggregates.
Further studies focused on the main effects and interactions between pH and Pi are recommended to clarify the removal processes of P that have occurred to ensure an efficient and safe application of CAAC as a filter medium in NBS for treating wastewaters—in other words, to ensure high removal rates of P, and to avoid carbonation inhibition and environmental hazards due to the expected increase of pH (effluent).

3.2.3. Removal Rates

The phosphorus removal rate presented by Renman and Renman [5] was 57 mg of P g−1 of CAAC considering a Pi of 10 mg of P L−1, whereas the one from Karczmarczyk et al. [6] was lower than 20 mg g−1 for Pi concentrations lower than 200 mg L−1. According to the chemical compositions and physical properties (PS and specific surface), the material used by both authors seems to be very similar. In this regard, the adsorbent dosage (g mL−1) can play an important role when comparing the performance of experiments focused on P removal. According to Cucarella and Renman [20], higher material-to-solution ratio (grams of adsorbent: ml of solution) generally leads to an increment of P removed by the material. How many grams of adsorbent per liter of P solutions was used in these previous batch experiments is unclear. Therefore, we would recommend that, in the future, the adsorbent dosage used is reported, to make it possible to compare studies.
In an apparent conflict to our results, Deng and Wheatley [15] showed a P removal rate (0.75 mg of P g−1 of adsorbent) twice the maximum rate observed in our study (0.3 mg of P g−1 adsorbent) using a similar Pi (15 mg L−1) and similar material. This result is even more unexpected considering that the authors used less than half the adsorbent dosage (20 mg L−1) than we used in our study (50 g L−1). Such a significant difference regarding the P removal rate can be attributed to differences in experimental constants, such as pH and agitation velocity (rpm). For instance, the experiments performed by Deng and Wheatley [15] were carried out at pH 5, while ours were in a pH range of 7.0 to 8.5; as discussed above, the removal of P can be strongly affected by pH.
In addition, even though the authors used a similar PS (2 to 5 mm), samples were agitated at 180 rpm, as compared to 20 rpm in the present study. The higher agitation rate might lead to mechanically generating smaller particles, thereby increasing the specific surface available for adsorption of P as well as increasing P removal rates. According to Cucarella and Renman [20], stirring the aliquots over 100 rpm alters the physical properties and lead to overestimation of results. Moreover, 180 rpm is far from a real operational conditions of NBS. Thus, it is not possible to compare the results of the current study with those of Deng and Wheatley [15], mainly due to differences regarding pH range, adsorbent dosage (g L−1) and agitation velocity (rpm). In this regard, we would recommend keeping both the pH range and the agitation rate as close as possible to real conditions whenever the aim is to use the results for upscaling experiments.

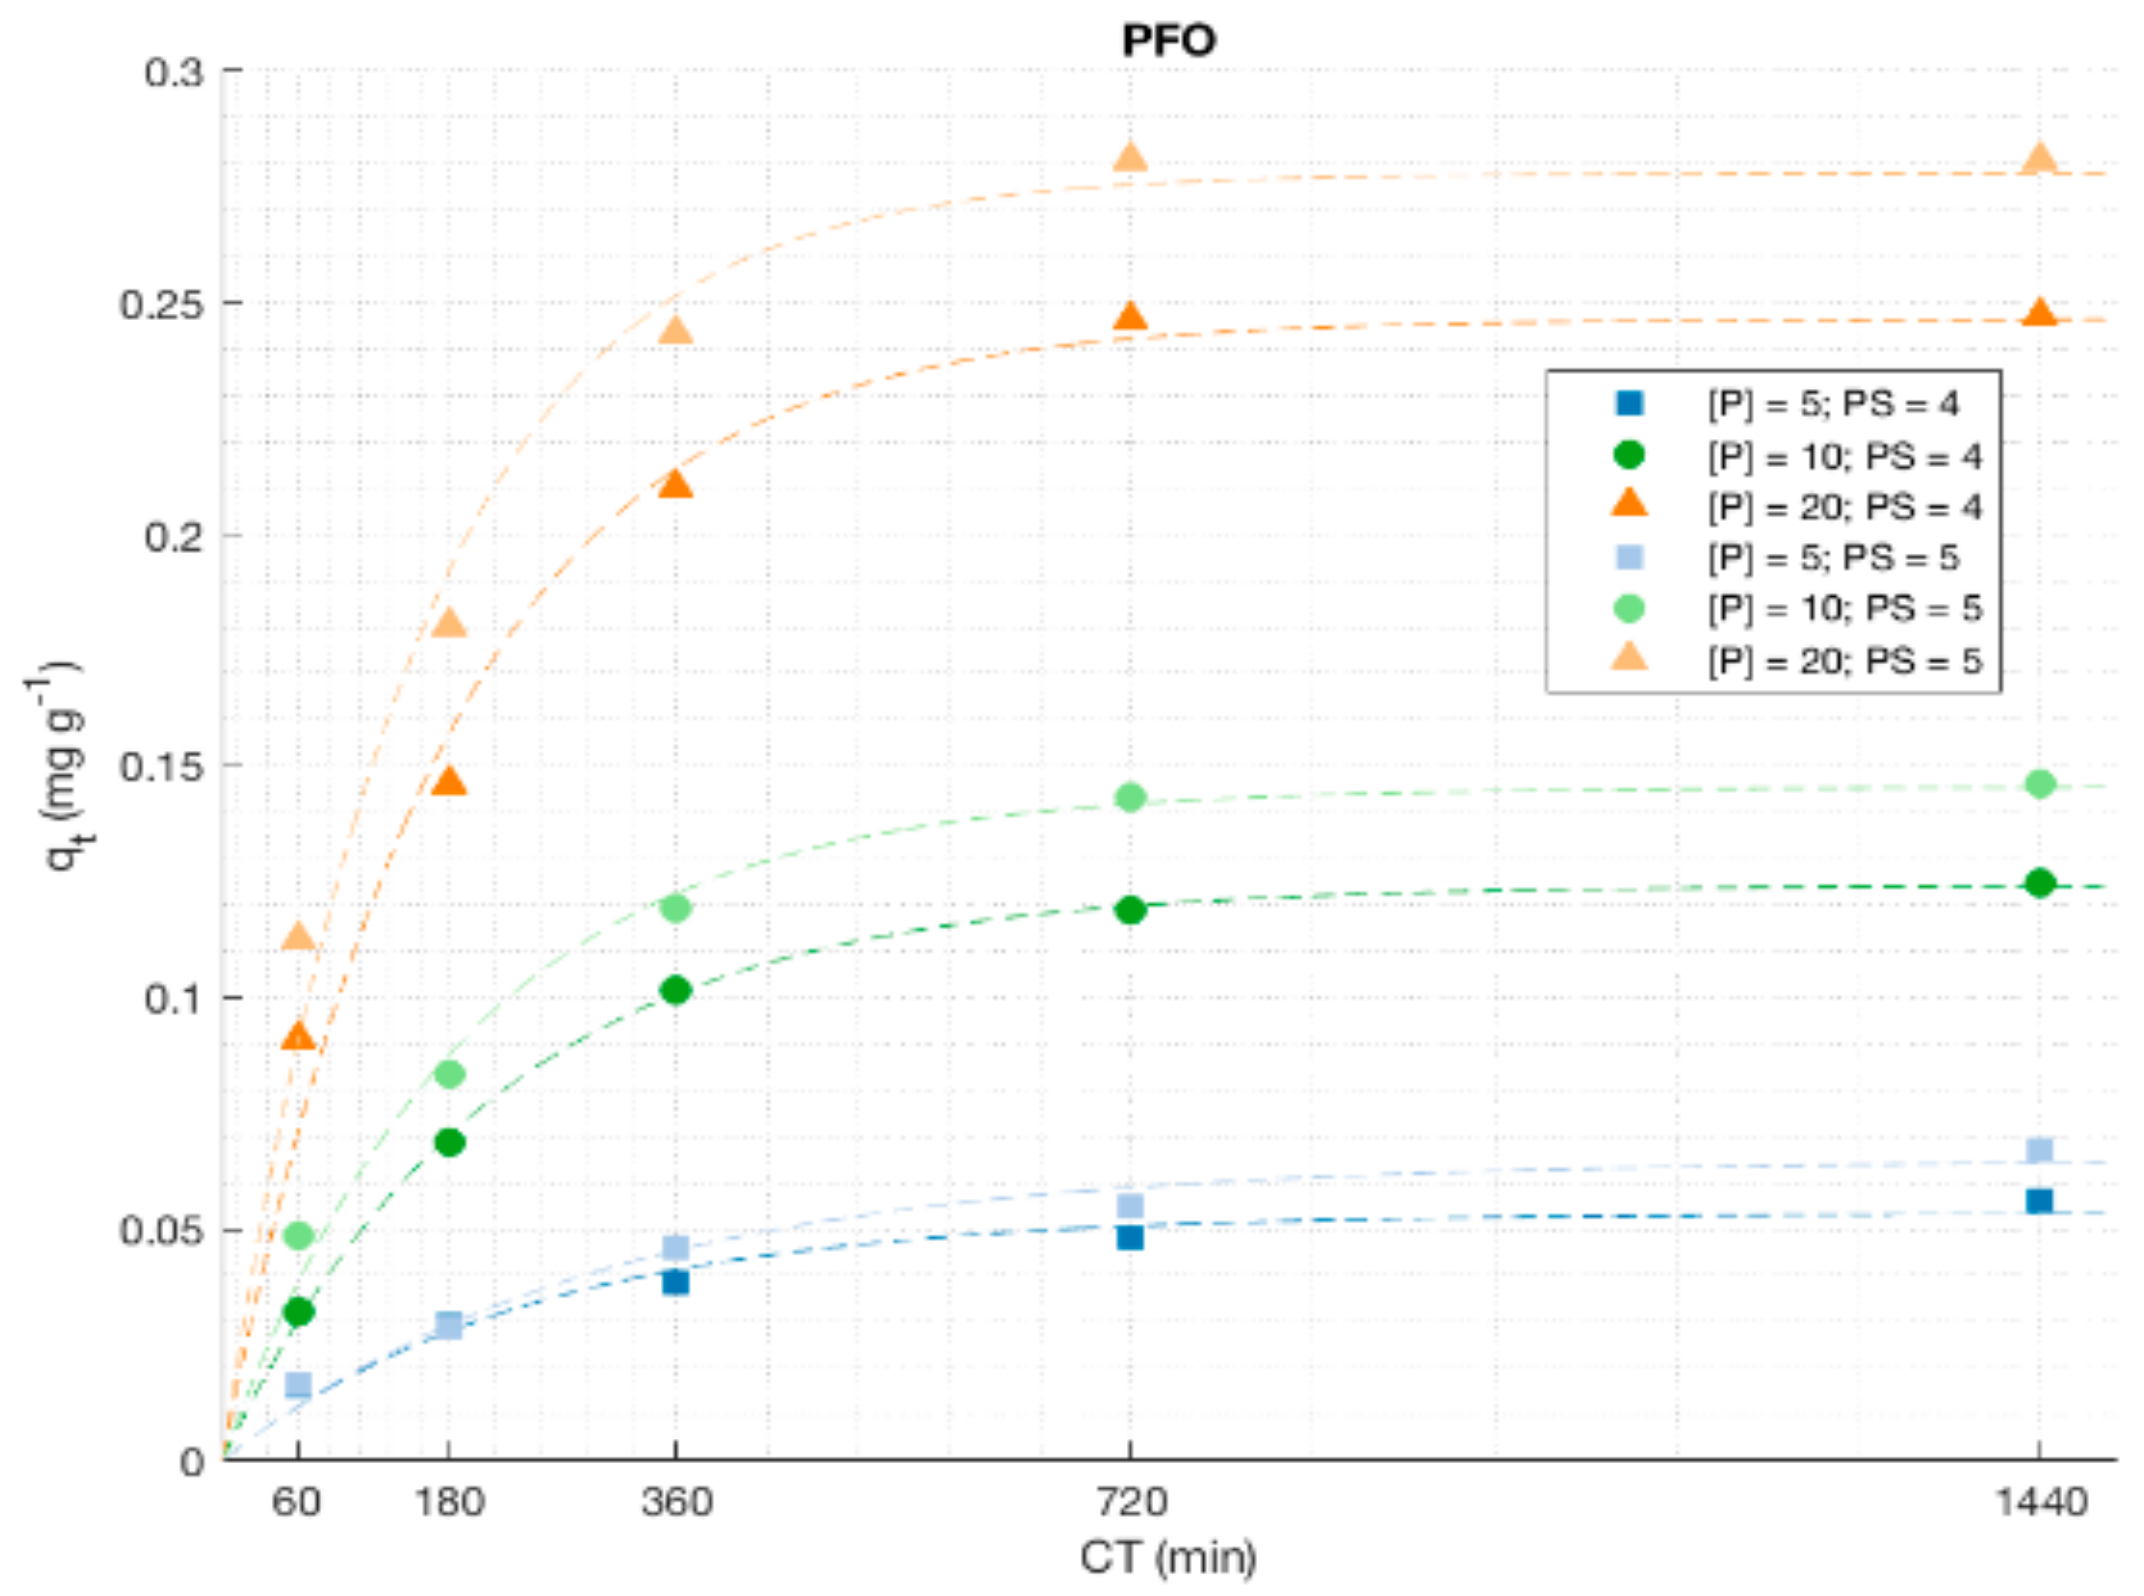
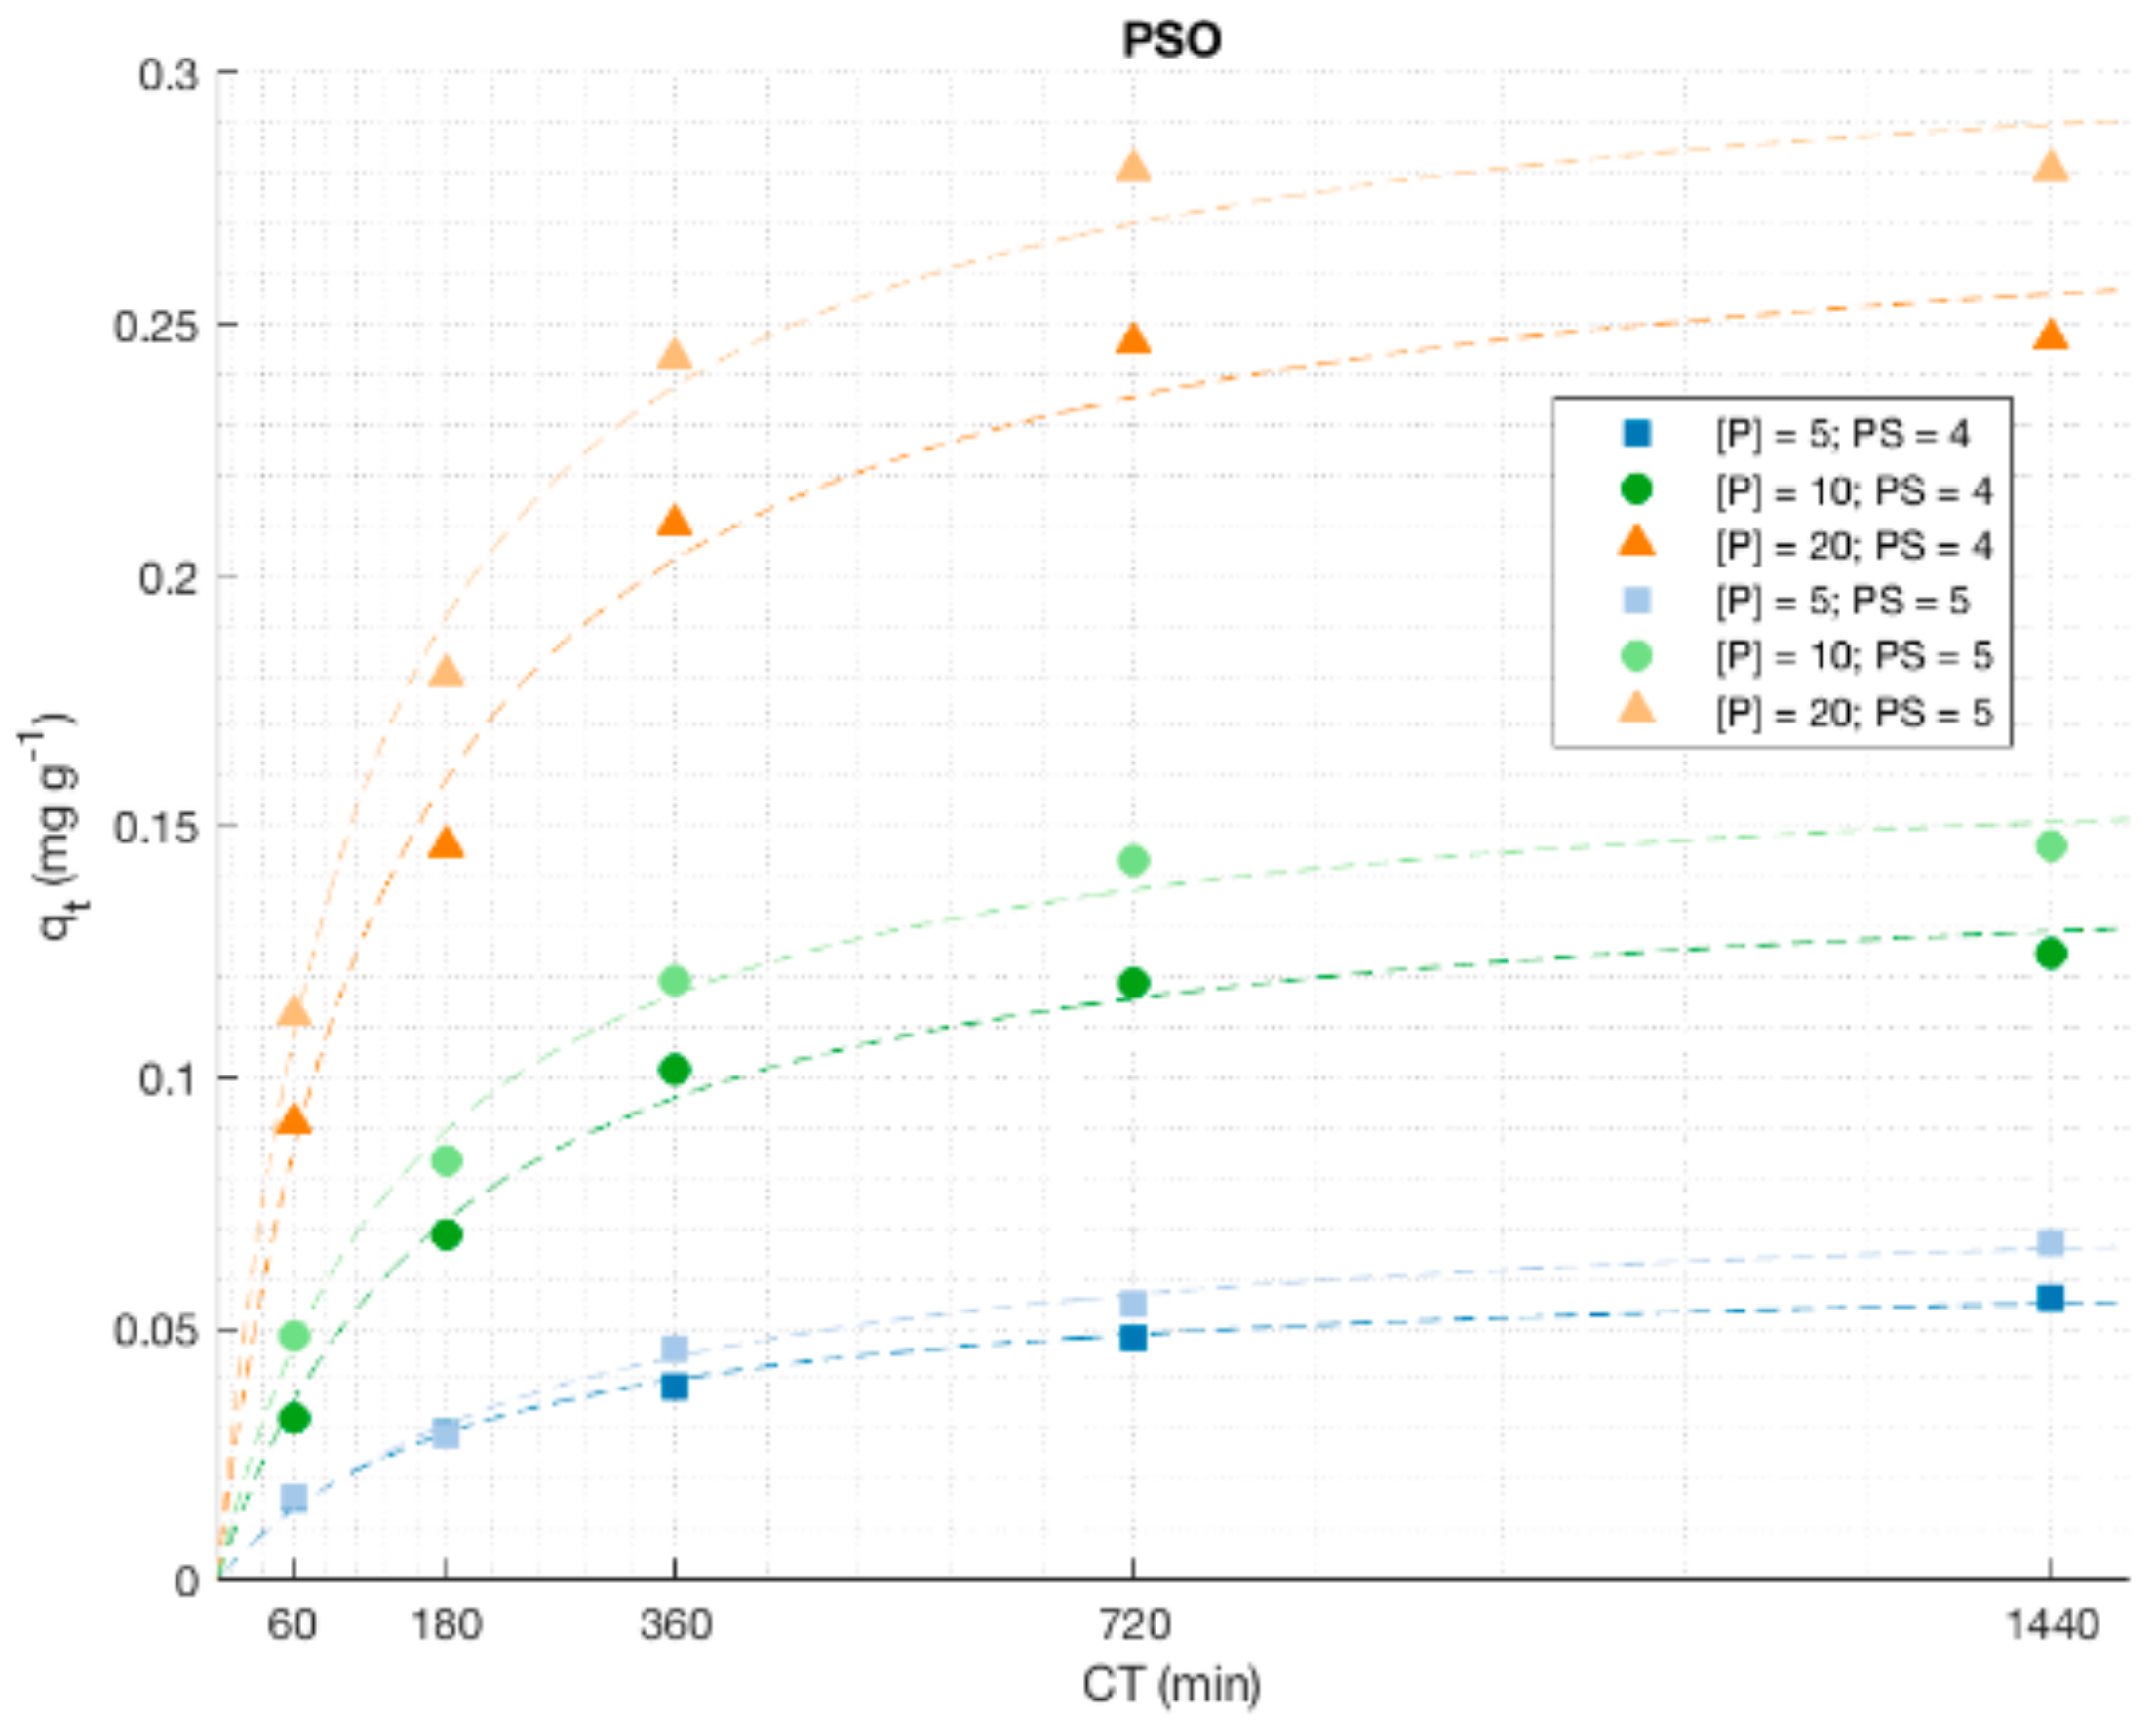
3.2.4. Kinetic Models

The kinetic models, PFO and PSO, were used to fit the experimental data. The q(e)calc values obtained from PFO were closer to q(e)exp than the ones obtained from PSO. Nevertheless, such comparisons have limitations, due mainly to the calculation procedure of q(e)exp. Namely, when calculating q(e)exp, defining an equilibrium point becomes a subjective matter. The supposed equilibrium point is defined either visually (sorption graph) or when a specific slope in the curve is reached.
Based on this study, we would suggest applying a one-way ANOVA to define the sampling point, which represents the equilibrium, and then to calculate q(e)exp (Section 2.3.4). However, it must be highlighted that ANOVA tests for significance consider only the mean difference between sample points, and therefore the results give a lower bound for CT at which q(e)exp is achieved. In contrast, the q(e)calc (non-linear regression models) is determined by evaluating the function at its limit when time tends to infinity. Thus, q(e)exp and q(e)calc, are not easily comparable, as one uses a specific time, whereas in the other the equilibrium time tends to infinity. Hence, the equilibrium q(t) from regression models was obtained using ANOVA (q(CTANOVA)calc).
As can be seen in Table 3, q(CTANOVA)calc is always lower than q(e)calc (PFO and PSO) and q(e)exp, indicating that the equilibrium of the models takes place after the CT defined by ANOVA. The latter makes sense considering that, as discussed in Section 3.2.1, no equilibrium was achieved for Pi 5 mg L−1 until 1440 min, and for Pi 10 and 20 mg L−1 the equilibrium was reached between 720 min and 1440 min. Furthermore, this stresses the fact that the CT obtained from one-way ANOVA are indeed conservative (lower bounded).
When calculating the percentage that q(CTANOVA)calc represents in relation to q(e)cal ( % e q u i l i b r i u m   r e a c h e d = ( q C T A N O V A c a l c × 100 ) q e c a l c )   , it becomes clear that for PFO, the equilibrium was closer to the sampling point defined by ANOVA than for PSO. For all treatments of PFO, 96% to 99% of the equilibrium was reached at the ANOVA experimental equilibrium point, while for PSO this range varied from 79% to 87% across treatments. When executing the same procedure and immediately comparing q(e)exp with q(e)calc ( % e q u i l i b r i u m   r e a c h e d = ( q e e x p × 100 ) q e c a l c ) , the percentage ranges increased, indicating that the equilibrium was either getting closer, or had even been reached for some of the treatments of PFO for which the values were higher than 100%. The latter facts also highlight that the equilibrium is reached faster for PFO than PSO.
The comparison of q(e)exp with q(e)calc only indicates how close q(e)calc was to the sample equilibrium point, but does not provide a good validation for the fitting of the model. One-way ANOVA determines the time (CTANOVA) at which the equilibrium point for q(e)exp is reached. Thus, we believe it is more robust to compare q(e)exp with q(CTANOVA)calc. The comparison is performed for the same CT and provides a better understanding of the validity of the model.
In this regard, the q(CTANOVA)calc values for both models (PFO and PSO) were very close to q(e)exp. Indeed, considering R2 and MPSD, the PSO fitted slightly better the experimental data when compared to PFO, (Table 3 and Figure 7). For all treatments, the correlation coefficient proved to be higher in PSO except for the PS4 Pi10 treatment, for which R2 was 1.3% below the PFO model fit for the same treatment. With similar results, a lower MPSD was obtained for the PSO model except for PS4 Pi10, which presented an increase of (2.6%) with respect to PFO model for the same treatment.
Similar results can be found in the literature, with PSO providing a better fit for experimental data regarding the sorption of P using similar materials, such as sorbulite [14], recycled crushed concrete [15], CAAC [5] and crystalline CSH or crystallized tobermorite [48]. As previously discussed, either adsorption and/or precipitation and formation of Ca–P–silicates can be involved in P removal. Hence, it can be assumed that the best fit of PSO is associated to chemical sorption rate-limitation regarding the sharing and/or exchanging of electrons between sorbent and sorbate [25].

4. Conclusions

As expected, initial FTIR analyses confirmed the presence of calcium carbonates and Si-O group, indicating the presence of tobermorite, which was later confirmed by XRD analysis.
The two-way ANOVA showed a significant main effect of CT, Pi and PS on the removal of P, with the removal of P moderated by these variables. In contrast to expectations, samples with PS 5 mm removed more P than those with PS4 mm. The latter was related to the heterogeneity of the material regarding its chemical composition. Further, the presence of certain Ca, Al, Si compounds only in the PS 5 mm samples might have led to greater P removal rates due to processes that are not dependent on specific surfaces (such as chemical precipitation with Ca2+ and the formation of Ca–P–silicate aggregates).
The equilibrium and the efficiency of removal seems to be dependent on Pi. Specifically, the higher the Pi, the faster the equilibrium was reached, and the higher the removal rate of P. We noticed that if the Pi increased two to four times, the removal of P also followed a similar proportional increment, regardless of the PS.
In addition, Pi seem to play an important role in moderating P removal. It is likely that Pi can affect Ca2+ release and thus regulate the precipitation process as well as the indirect sorption by influencing the negative charging of adsorbent surface. Moreover, the results suggest that higher Pi leads to higher increases of pH, which might affect the solubility of Ca-P precipitates.
When comparing the P removal rates with those given in the literature, the current results seem to be lower; this apparent conflict can however be attributed to differences regarding experimental conditions as well as the heterogeneity of concrete based materials, such as CAAC.
The PSO fitted better with the experimental data, which was in accordance with previous studies. However, we did not consider that the usual comparison of q(e)exp with q(e)calc is a feasible way to determine the quality of the fit: q(e)exp occurs at a “known time”, determined by one-way ANOVA, while q(e)calc, occurs after or before this known time (CTANOVA), making it impossible to compare these values. Therefore, it can be said that such comparisons have limitations regarding the validation of the model’s fit, mainly due to the fact that only give an idea about how closer q(e)calc was to the equilibrium point sampled (ANOVA CTANOVA). In this respect, we propose comparing q(CTANOVA)calc with q(e)exp to validate the model fit, which shows how the model responds at the equilibrium point determined by one-way ANOVA. Nonetheless, an improved methodology for determining the q(e)exp needs to be developed in order to make its comparison with q(e)calc more accurate.
In sum, reusing waste materials or by-products, such as CAAC, in the scope of water treatments is important with respect to integrating water management and circular economy, promoting natural capital preservation and climate change mitigation. However, due to the importance of Pi and pH regarding the removal of P when using CAAC, further studies at real-scale which allow these parameters to be co-related are recommended in order to optimize the removal of P in NBS.

Author Contributions

Conceptualization, J.A.d.C.C. and C.A.A.; formal analysis, J.A.d.C.C., J.F. and J.C.; funding acquisition, M.B., J.M. and C.A.A.; investigation, J.A.d.C.C. and C.A.A.; methodology, J.A.d.C.C. and C.A.A.; resources, J.F., M.B., J.M., H.B. and C.A.A.; supervision, M.B. and J.M.; visualization, J.A.d.C.C.; writing—original draft, J.A.d.C.C.; writing—review and editing, J.A.d.C.C., J.F., J.M.C., J.C., M.B., J.R.R., H.P.d.S., J.M., H.B. and C.A.A.

Funding

This research was funded by the National Council for Scientific and Technological Development from Brazil (Doctoral fellowship—207105/2014-6). In addition, the present study was partially financed by the project BIA2017-88401-R (AEI/FEDER, UE).

Acknowledgments

The authors would like to give an especial thanks to the National Council for Scientific and Technological Development—Brazil (CNPQ), for their financial support (doctoral fellowship—207105/2014-6). Thanks to Aarhus University (Denmark) for believing in this research and for supporting the experimental procedures required. Finally, thanks to UNESCO Chair on Sustainability of the Polytechnic University of Catalonia (Spain), and the research groups DIOPMA (2017 SGR 118) and GICITED (2014 SGR 1298) for their support during the development of the research for the current paper.

Conflicts of Interest

The authors declare no conflict of interest. The funders had no role in the design of the study; collection, analyses, or interpretation of data; manuscript writing; or the decision to publish the results.

References

  1. Rockström, J.; Steffen, W.; Noone, K.; Lambin, E.; Lenton, T.M.; Scheffer, M.; Folke, C.; Schellnhuber, H.J.; Wit, C.D.; Hughes, T.; et al. Planetary Boundaries: Exploring the Safe Operating Space for Humanity. Ecol. Soc. 2009, 14, 1–32. [Google Scholar] [CrossRef]
  2. Lee, C.-G.; Alvarez, P.J.J.; Kim, H.-G.; Jeong, S.; Lee, S.; Lee, K.B.; Lee, S.-H.; Choi, J.-W. Phosphorous recovery from sewage sludge using calcium silicate hydrates. Chemosphere 2018, 193, 1087–1093. [Google Scholar] [CrossRef] [PubMed]
  3. Melia, P.M.; Cundy, A.B.; Sohi, S.P.; Hooda, P.S.; Busquets, R. Trends in the recovery of phosphorus in bioavailable forms from wastewater. Chemosphere 2017, 186, 381–395. [Google Scholar] [CrossRef] [PubMed] [Green Version]
  4. Berg, U.; Donnert, D.; Ehbrecht, A.; Bumiller, W.; Kusche, I.; Weidler, P.G.; Nüesch, R. “Active filtration” for the elimination and recovery of phosphorus from waste water. Colloids Surf. A Physicochem. Eng. Asp. 2005, 265, 141–148. [Google Scholar] [CrossRef]
  5. Renman, G.; Renman, A. Sustainable use of crushed autoclaved aerated concrete (CAAC) as a filter medium in wastewater purification. In Proceedings of the WASCON 8th International Conference on Sustainable Management of Waste and Recycled Materials in Construction: Towards Effective, Durable and Sustainable Production and Use of Alternative Materials in Construction, Gothenburg, Sweden, 30 May–1 June 2012; Arm, M., Vandecasteele, C., Heynen, J., Suer, P., Lind, B., Eds.; ISCOWA and SGI: Gothenburg, Sweden, 2012; pp. 1–7. [Google Scholar]
  6. Karczmarczyk, A.; Baryła, A.; Agnieszka, B. Effect of P-Reactive Drainage Aggregates on Green Roof Runoff Quality. Water 2014, 6, 2575–2589. [Google Scholar] [CrossRef] [Green Version]
  7. European Commission. Towards an EU Research and Innovation Policy Agenda for Nature-Based Solutions & Re-Naturing Cities; Publications Office of the European Union: Luxembourg, 2015; ISBN 978-92-79-46051-7. [Google Scholar]
  8. Garcia-Holguera, M.; Clark, O.G.; Sprecher, A.; Gaskin, S.J. Ecosystem biomimetics for resource use optimization in buildings. Build. Res. Inf. 2015, 44, 263–278. [Google Scholar] [CrossRef]
  9. Blok, V.; Gremmen, B. Ecological Innovation: Biomimicry as a New Way of Thinking and Acting Ecologically. J. Agric. Environ. Ethics 2016, 29, 203–217. [Google Scholar] [CrossRef] [Green Version]
  10. Bao, T.; Chen, T.; Wille, M.L.; Chen, D.; Bian, J.; Qing, C.; Wu, W.; Frost, R.L. Advanced wastewater treatment with autoclaved aerated concrete particles in biological aerated filters. J. Water Process Eng. 2016, 9, 188–194. [Google Scholar] [CrossRef]
  11. Dal Ferro, N.; Ibrahim, H.M.S.; Borin, M. Newly-established free water-surface constructed wetland to treat agricultural waters in the low-lying Venetian plain: Performance on nitrogen and phosphorus removal. Sci. Total Environ. 2018, 639, 852–859. [Google Scholar] [CrossRef]
  12. Mendes, L.R.D.; Tonderski, K.; Iversen, B.V.; Kjaergaard, C. Phosphorus retention in surface-flow constructed wetlands targeting agricultural drainage water. Ecol. Eng. 2018, 120, 94–103. [Google Scholar] [CrossRef]
  13. Vymazal, J. Removal of nutrients in various types of constructed wetlands. Sci. Total Environ. 2007, 380, 48–65. [Google Scholar] [CrossRef] [PubMed]
  14. Nilsson, C.; Lakshmanan, R.; Renman, G.; Rajarao, G.K. Efficacy of reactive mineral-based sorbents forphosphate, bacteria, nitrogen and TOC removal-Column experiment in recirculation batch mode. Water Res. 2013, 47, 5165–5175. [Google Scholar] [CrossRef] [PubMed]
  15. Deng, Y.; Wheatley, A. Mechanisms of phosphorus removal by recycled crushed concrete. Int. J. Environ. Res. Public Health 2018, 15, 357. [Google Scholar] [CrossRef] [PubMed]
  16. Okano, K.; Miyamaru, S.; Kitao, A.; Takano, H.; Aketo, T.; Toda, M.; Honda, K.; Ohtake, H. Amorphous calcium silicate hydrates and their possible mechanism for recovering phosphate from wastewater. Sep. Purif. Technol. 2015, 144, 63–69. [Google Scholar] [CrossRef]
  17. Sakkas, P. Domestic Greywater Treatment through the Integration of Constucted Wetlands in Living Wall Systems (LWS). Master’s Thesis, Faculty of Architecture & Building Sciences, Technical University of Delft, Delft, The Netherlands, 2013. [Google Scholar]
  18. Damrongsiri, S. Feasibility of using demolition waste as an alternative heavy metal immobilising agent. J. Environ. Manag. 2017, 192, 197–202. [Google Scholar] [CrossRef] [PubMed]
  19. Berg, U.; Donnert, D.; Weidler, P.G.; Kaschka, E.; Knoll, G.; Nuesch, R. Phosphorus removal and recovery from wastewater by tobermorite-seeded crystallisation of calcium phosphate. Water Sci. Technol. 2006, 53, 131–138. [Google Scholar] [CrossRef] [PubMed]
  20. Cucarella, V.; Renman, G. Phosphorus Sorption Capacity of Filter Materials Used for On-site Wastewater Treatment Determined in Batch Experiments—A Comparative Study. J. Environ. Qual. 2009, 38, 381–392. [Google Scholar] [CrossRef]
  21. American Public Health Association. APHA Method 4500-P: Standard Methods for the Examination of Water and Wastewater. In Ascorbic Acid Method; American Public Health Association: Washignton, DC, USA, 1998; pp. 115–116. [Google Scholar]
  22. Wei, W.; Yang, L.; Zhong, W.; Cui, J.; Wei, Z. Poorly crystalline hydroxyapatite: A novel adsorbent for enhanced fulvic acid removal from aqueous solution. Appl. Surf. Sci. 2015, 332, 328–339. [Google Scholar] [CrossRef]
  23. Montgomery, D.C. Design and Analysis of Experiments, 8th ed.; Montgomery, D.C., Peck, E.A., Vining, G.G., Eds.; John Wiley & Sons, Inc.: Hoboken, NJ, USA, 2012; ISBN 9781118146927. [Google Scholar]
  24. Formosa, J.; Chimenos, J.M.; Lacasta, A.M.; Niubo, M. Interaction between low-grade magnesium oxide and boric acid in chemically bonded phosphate ceramics formulation. Ceram. Int. 2012, 38, 2483–2493. [Google Scholar] [CrossRef]
  25. Ho, Y.S.; Mckay, G. Pseudo-second order model for sorption processes. Process Biochem. 1999, 34, 451–465. [Google Scholar] [CrossRef]
  26. Simonin, J. On the comparison of pseudo-first order and pseudo-second order rate laws in the modeling of adsorption kinetics. Chem. Eng. J. 2016, 300, 254–263. [Google Scholar] [CrossRef] [Green Version]
  27. Moussout, H.; Ahlafi, H.; Aazza, M.; Maghat, H. Critical of linear and nonlinear equations of pseudo-first order and pseudo-second order kinetic models. Karbala Int. J. Mod. Sci. 2018, 4, 244–254. [Google Scholar] [CrossRef]
  28. Kushwaha, J.P.; Srivastava, V.C.; Mall, I.D. Bioresource Technology Treatment of dairy wastewater by commercial activated carbon and bagasse fly ash: Parametric, kinetic and equilibrium modelling, disposal studies. Bioresour. Technol. 2010, 101, 3474–3483. [Google Scholar] [CrossRef]
  29. Marquardt, D.W. An algorithm for least-squares estimation of nonlinear parameters. J. Soc. Ind. Appl. Math. 1963, 11, 431–441. [Google Scholar] [CrossRef]
  30. Fang, D.; Huang, L.; Fang, Z.; Zhang, Q.; Shen, Q.; Li, Y.; Xu, X.; Ji, F. Evaluation of porous calcium silicate hydrate derived from carbide slag for removing phosphate from wastewater. Chem. Eng. J. 2018, 354, 1–11. [Google Scholar] [CrossRef]
  31. Hartmann, A.; Buhl, J.; Lutz, W. Synthesis and Properties of Zeolites from Autoclaved Aerated Concrete (AAC) Waste. Z. Anorg. Allg. Chem. 2012, 638, 1297–1306. [Google Scholar] [CrossRef]
  32. Kiefer, J.; Stark, A.; Kiefer, A.L.; Glade, H. Infrared Spectroscopic Analysis of the Inorganic Deposits from Water in Domestic and Technical Heat Exchangers. Energies 2018, 11, 798. [Google Scholar] [CrossRef]
  33. Chen, D.; Chen, D.; Yu, C.; Bao, T.; Zhu, C.; Qing, C. Simultaneous removal of nitrogen and phosphorus using autoclaved aerated concrete particles in biological aerated filters. Desalin. Water Treat. 2016, 57, 19402–19410. [Google Scholar] [CrossRef]
  34. Brix, H.; Arias, C.A.; Del Bubba, M. Media selection for sustainable phosphorus removal in subsurface flow constructed wetlands. Water Sci. Technol. 2001, 44, 47–54. [Google Scholar] [CrossRef]
  35. Khadhraoui, M.; Watanabe, T.; Kuroda, M. The effect of the physical structure of a porous Ca-based sorbent on its phosphorus removal capacity. Water Res. 2002, 36, 3711–3718. [Google Scholar] [CrossRef]
  36. Arias, C.A.; Brix, H.; Johansen, N.H. Phosphorus removal from municipal wastewater in an experimental two-stage vertical flow constructed wetland system equipped with a calcite filter. Water Sci. Technol. 2003, 48, 51–58. [Google Scholar] [CrossRef] [PubMed]
  37. Arias, C.A.; Brix, H. Phosphorus removal in constructed wetlands: Can suitable alternative media be identified? Water Sci. Technol. 2005, 51, 267–273. [Google Scholar] [CrossRef] [PubMed]
  38. Chen, X.; Kong, H.; Wu, D.; Wang, X.; Lin, Y. Phosphate removal and recovery through crystallization of hydroxyapatite using xonotlite as seed crystal. J. Environ. Sci. 2009, 21, 575–580. [Google Scholar] [CrossRef]
  39. Okano, K.; Uemoto, M.; Kagami, J.; Miura, K.; Aketo, T.; Toda, M.; Honda, K.; Ohtake, H. Novel technique for phosphorus recovery from aqueous solutions using amorphous calcium silicate hydrates (A-CSHs). Water Res. 2013, 47, 2251–2259. [Google Scholar] [CrossRef] [PubMed]
  40. Mor, S.; Chhoden, K.; Khaiwal, R. Application of Agro-waste Rice Husk Ash for the Removal of Phosphate from the Wastewater. J. Clean. Prod. 2016, 129, 673–680. [Google Scholar] [CrossRef]
  41. Molle, P.; Liénard, A.; Grasmick, A.; Iwena, A. Phosphorus sorption in subsurface constructed wetlands: Investigations focused on calcareous materials and their chemical reactions. Water Sci. Technol. 2003, 48, 75–83. [Google Scholar] [CrossRef] [PubMed]
  42. Wang, X.; Chen, J.; Kong, Y.; Shi, X. Sequestration of phosphorus from wastewater by cement-based or alternative cementitious materials. Water Res. 2014, 62, 86–96. [Google Scholar] [CrossRef]
  43. Gustafsson, J.P.; Renman, A.; Renman, G.; Poll, K. Phosphate removal by mineral-based sorbents used in filters for small-scale wastewater treatment. Water Res. 2008, 42, 189–197. [Google Scholar] [CrossRef] [Green Version]
  44. Cucarella, V.; Zaleski, T.; Mazurek, R.; Renman, G. Effect of reactive substrates used for the removal of phosphorus from wastewater on the fertility of acid soils. Bioresour. Technol. 2008, 99, 4308–4314. [Google Scholar] [CrossRef]
  45. Westholm, L.J. Substrates for phosphorus removal—Potential benefits for on-site wastewater treatment? Water Res. 2006, 40, 23–36. [Google Scholar] [CrossRef]
  46. Herrmann, I.; Jourak, A.; Gustafsson, J.P.; Hedström, A.; Lundström, T.S.; Viklander, M. Modeling phosphate transport and removal in a compact bed filled with a mineral-based sorbent for domestic wastewater treatment. J. Contam. Hydrol. 2013, 154, 70–77. [Google Scholar] [CrossRef] [PubMed]
  47. Brooks, A.S.; Rozenwald, M.N.; Geohring, L.D.; Lion, L.W.; Steenhuis, T.S. Phosphorus removal by wollastonite: A constructed wetland substrate. Ecol. Eng. 2000, 15, 121–132. [Google Scholar] [CrossRef] [Green Version]
  48. Zeng, L.; Yang, L.; Wang, S.; Yang, K. Synthesis and characterization of different crystalline calcium silicate hydrate: Application for the removal of aflatoxin b1 from aqueous solution. J. Nanomater. 2014, 2014, 431925. [Google Scholar] [CrossRef]
Figure 1. Main functional groups of the CAAC studied (results of FTIR)
Water 11 01442 g001
Figure 2. Interaction between Pi and PS.
Water 11 01442 g002
Figure 3. Effects of PS Pi and CT on the removal of P. (a) Pi: 5 mg L−1; (b) Pi: 20 mg L−1.
Water 11 01442 g003aWater 11 01442 g003b
Figure 4. Effect of CT and Pi on the removal of P (results of PS 5 mm).
Water 11 01442 g004
Figure 5. Response surface plot for P removal. (a): PS 4 mm; (b): PS 5 mm. Adapted from Design Expert® software (version 7.0, Statease, Minneapolis, MN, USA).
Water 11 01442 g005
Figure 6. Kinetics of P removal (mg) and pH. (a) Pi 5 mg L−1; (b) Pi 10 mg L−1; (c) Pi 20 mg L−1.
Water 11 01442 g006aWater 11 01442 g006b
Figure 7. Non-linear kinetic fitting (PFO and PSO). Dashed lines represents the kinetic model regression.
Water 11 01442 g007aWater 11 01442 g007b
Table 1. The chemical composition of CAAC (Results of XRF).
ChemicalCurrent StudyLiterature
CompoundPS 4 mmPS 5 mm
SiO2 (%)47.4646.881,2,3,4 44.8–57.0
CaO (%)26.5326.951,2,3,4 24.9–27.6
Al2O3 (%)3.283.281,2,3,4 1.95–16.06
Fe2O3 (%)1.181.181,2,3 1.0–4.2
K2O (%)0.740.744 0.7
MgO (%)0.650.642,4 0.5–0.6
1 Renman and Renman [5]: PS 2–5 mm. 2 Karczmarczyk et al. [6]: PS 1–6 mm. 3 Chen et al. [33]: PS 5–9 mm. 4 Hartmann et al. [31]: 5–20 μm.
Table 2. Two-way ANOVA. Results regarding P removal (mg).
Pi (mg L−1)FactorsdfFαηp2PS (mm)FactorsdfFαηp2
5CT4263.855<0.010.9814CT4395.825<0.010.981
PS125.903<0.010.564Pi22332.852<0.010.994
CT × PS44.895<0.010.495CT × Pi856.205<0.010.937
10CT4442.058<0.010.9895CT41192.745<0.010.994
PS1124.721<0.010.862Pi27985.244<0.010.998
CT × PS41.0710.400.176CT × Pi8143.770<0.010.975
20CT4595.938<0.010.992
PS1149.948<0.010.882
CT × PS40.9780.440.164
Df: degrees of freedom; α: significance (Tukey 95%): ηp2: partial Eta squared.
Table 3. Results of kinetic models fit (PFO and PSO).
Factors ExperimentalPFOPSO
PSPiq(e)exp1CTANOVAq(e)calc2q(CTANOVA)calcK1R2MPSDq(e)calcq(CTANOVA)calcK2R2MPSD
450.05614400.0530.053 4.12 × 10 3 0.9540.1730.0630.055 7.68 × 10 2 0.9910.078
4100.1197200.1240.120 4.64 × 10 3 0.9990.0380.1460.116 3.67 × 10 2 0.9860.077
4200.2467200.2460.242 5.65 × 10 3 0.9690.1370.2800.236 2.62 × 10 2 0.9760.074
550.06714400.0650.064 3.36 × 10 3 0.9700.1750.0790.066 4.58 × 10 2 0.9880.107
5100.1437200.1450.142 5.13 × 10 3 0.9800.1260.1670.137 3.83 × 10 2 0.9840.061
5200.2817200.2780.275 6.54 × 10 3 0.9650.1230.3130.270 2.82 × 10 2 0.9820.053
Units: PS (mm), Pi (mg L−1), q(e) (mg g−1), K1 (min−1) K2 (mg/g min). 1 CTANOVA: CT of equilibrium (min) determined by using one-way ANOVA. 2 q(CTANOVA) was obtained by evaluating the nonlinear regression model at the contact time from ANOVA (CTANOVA). The colors in the columns make clear the difference between experimental data and models data.

