Article

Batch and Column Scale Removal of Cadmium from Water Using Raw and Acid Activated Wheat Straw Biochar

1
Department of Environmental Sciences, COMSATS University Islamabad, Vehari Campus, Vehari 61100, Pakistan
2
Department of Environmental Engineering and Management, Technical University Gheorghe Asachi of Iasi, 700050 Iasi, Romania
*
Authors to whom correspondence should be addressed.
Water 2019, 11(7), 1438; https://doi.org/10.3390/w11071438
Submission received: 8 May 2019 / Revised: 3 July 2019 / Accepted: 8 July 2019 / Published: 12 July 2019
(This article belongs to the Special Issue Removal of Heavy Metals from Wastewater)

Abstract

:
The present study examined novel wheat straw biochar (WSB) and acid treated wheat straw biochar (AWSB) for cadmium removal from contaminated water. A series of batch and column scale experiments was conducted to evaluate the potential of WSB and AWSB for cadmium removal at different biochar dosage (0.5–8 g/L), initial cadmium concentration (5–100 mg/L), solution pH (2–8) and contact time (5–180 min). Results revealed that cadmium adsorption decreased by increasing biochar dosage from 0.5 to 8 g/L; however, optimum dosage for maximum (99%) removal of cadmium was 2 g/L by WSB and 1 g/L by AWSB. Enhanced cadmium removal potential by AWSB is attributed to increased surface area, microporosity and variation in functional groups. Equilibrium experimental data was well described by Freundlich adsorption isotherm whereas kinetic data were better explained with pseudo-second order model. Both WSB and AWSB have shown good adsorption capacity of 31.65 mg/g and 74.63 mg/g, respectively, that is comparable with other costly adsorbents. Columns packed with WSB and AWSB at laboratory scale have also shown good retention of cadmium with excellent reusability. These findings indicate that WSB especially AWSB could be a promising, cost-effective and environmental friendly strategy for the removal of metals from contaminated water.

1. Introduction

Cadmium (Cd) is a non-essential heavy metal naturally occurring in geological formations. It enters the ecosystems through erosion and abrasion of rocks and soils. The beneficial use of Cd in the industry also contributes to environmental contamination with Cd as it can enter into the wastewater from industrial processes such as electroplating, Cd-Ni batteries, fertilizers, pesticides, ore mining, plastics, pigments, dyes, etc. Consumption of Cd containing food leads to its accumulation in living tissues causing various diseases and disorders. Hence, Cd must be removed from the wastewater before its disposal to the environment [1,2]. A variety of physical and chemical techniques is employed to remove metals, including Cd from contaminated water e.g., ion exchange, precipitation, flocculation/coagulation, adsorption, membrane filtration, evaporation and reverse osmosis etc. [2]. Most of these methods have limitations for metal removal due to sludge production, higher cost of energy and by-product formation [1,2]. However, the use of adsorbents for the removal of heavy metals has been increased in the last few years [3]. There are various adsorbents but carbon materials have been reported to be the best due to their numerous characteristics, are highly stable, have excellent removal efficiency and contain large surface area [4,5,6]. Wood and bark biochars have been used effectively as carbon materials to remove heavy metals from water e.g., arsenic (As), Cd and lead (Pb) [7].
Recent literature shows that surface features of the biochar have been modified to enhance the adsorption potential, increase the number of functional groups and selectivity of biochar to remove several pollutants from polluted systems [8,9,10]. In addition, phosphate compound containing liquids such as phosphoric acid (H3PO4) are known for their effectiveness in remediation of contaminated soils and also for the remediation of wastewater contaminated with heavy metals. The author of [11] reported that the addition of PO43− in wastewater results in numerous stabilization reactions. During these stabilization reactions, sorption of metals that are present in wastewater occur on particulate surfaces [12,13]. Furthermore, new surface metal precipitates, discrete heterogeneous and homogeneous metal precipitates are also formed. If biochar is modified with phosphate, it can be helpful to increase the ability of biochar to remove heavy metals by enhancing its sorption ability [13]. Phosphate modification can be very helpful for heavy metal removal but only few studies have been carried out in this regard.
The use of wheat straw biochar (WSB) has also been reported for the remediation of water contaminated with heavy metals and organic chemicals [14]. However, raw WSB may not be considered as a good material for the removal of heavy metals because of unavailability of sufficient functional groups as well as less surface area. The present study was carried out to evaluate the potential of WSB and WSB modified with H3PO4 to remove Cd from contaminated water. Adsorption capacities and Cd removal efficiencies of non-modified WSB and WSB modified with H3PO4 were compared after performing several batch experiments. To get insight into the microstructure and physical characteristics of both biochars (WSB and AWSB), multiple instrumental techniques including Fourier Transform Infrared spectroscopy (FTIR), Brunauer–Emmett–Teller (BET), Scanning electron microscopy (SEM) and X-ray diffraction (XRD) were used. The influence of adsorbent parameters such as residence time, solution pH, adsorbent dosage and concentration of adsorbate (Cd) are evaluated. Moreover, the adsorption capacity of WSB and AWSB was compared with the literature and experimental data were validated with equilibrium and kinetic sorption models.

2. Materials and Methods

2.1. Preparation and Characterization of Biochar

Wheat straw (WS) feedstock was obtained from the nearby farmer field (30.02° N, 72.21° E) to prepare biochar. Feedstock was first dried in oven (70 °C) for 24 h and then was sieved through a 1 mm sieve). Biochar was prepared by a method described by [15] at 350 °C for 30 min @10 °C min−1. Acidified wheat straw biochar (AWSB) was prepared using physical activation method with second pyrolysis. The prepared biochar was mixed with a 30% phosphoric acid (H3PO4) for 24 h at 2:1 (H3PO4: biochar). The acid treated biochar was washed with deionized (DI) water and then dried at 70 °C in an oven for 24 h. After oven drying, the activated biochar was pyrolyzed again in furnace under the same conditions as were used during the first pyrolysis.
A CHNS/O analyzer (2400 Series II, Perkin Elmer, Shelton, CT, USA) was used to find Carbon (C), hydrogen (H), oxygen (O) and sulfur (S) content in WSB and AWSB with dry combustion. The concentrations of phosphorus (P), potassium (K), iron (Fe), calcium (Ca), magnesium (Mg), sodium (Na) and Cd in both adsorbents were determined by digestion process as described by [16]. All the chemicals that have been used during the analysis were of analytical grade. Moisture content of the samples was measured on the basis of mass loss after drying samples at 105 °C, while volatile matter was calculated on heating the samples in covered crucible for 10 min at 950 °C. Ash content in the samples was found after drying the samples in open crucible at 750 °C until a constant mass was obtained. FTIR spectra on the surface of WSB and AWSB was determined in absorbance mode by forming pellets with KI or KBr powder using Matson Polaris IR spectrophotometer. Surface morphological characteristics of WSB and AWSB were found by scanning electron microscope (SEM) at 5 and 10 kV with high magnification at 20 mm distance. Amorphous nature of WSB and AWSB was found using X-ray diffraction (XRD). While Brunauer-Emmett-Teller (BET, Tristar II 3020) was used to measure the BET surface area SBET, total pore volume Vt and average pore diameter Dp.

2.2. Measurement of Point of Zero Charge

Point of zero charge (PZC) of WSB and AWSB was measured by using an electrolyte solution [17]. Electrolyte solution was prepared by using NaCl (0.1 M) in distilled water and separated in 250 mL conical flasks. The pH of the solution in flasks was maintained to 2, 4, 6 and 8 with NaOH and HCl solutions (0.1 N) with pH meter (Milwaukee pH 55, Thailand). Dosage of 0.1 g of WSB and AWSB was added in each flask separately. As a control, four flasks of pH 2, 4, 6 and 8 were used without WSB and AWSB. All these flasks were shaken at 150 rpm for 24 h. After that, filtrate of the samples was obtained and their pH was measured. A graph was plotted between initial pH (2, 4, 6 and 8) and final pH after interaction of the material with electrolyte solution. The point of intersection of curve of the control and curve with WSB and AWSB pH gave PZC.

2.3. Preparation of Synthetic Wastewater

Analytical grade cadmium nitrate (Cd (NO3)2; Merck) was used to prepare a stock solution of Cd (1000 mg/L) in distilled water. Stock solution was diluted to prepare the working solutions of different Cd concentrations (5, 10, 25, 50 and 100 mg/L).

2.4. Batch Experiment

A series of batch scale adsorption experiments for evaluating the affinity of adsorbents (WSB and AWSB) for Cd sorption was performed in duplicate sets in 250 mL conical flasks having 100 mL of Cd solution.

2.4.1. Effect of Adsorbent Dose and pH

Effective (optimum) dosage of WSB and AWSB for the removal of Cd was found by changing their dosage from 0.5 to 8 g/L keeping other parameters constant. A measured quantity of WSB and AWSB was taken in 100 mL Cd solution at fixed pH 6 and Cd concentration until equilibrium. Effective dose was chosen on the basis of Cd removal (%) at different doses of WSB and AWSB. Impact of solution pH on Cd adsorption and removal was evaluated at pH (2–8) by keeping other factors such as initial concentration of Cd (25 mg/L), WSB and AWSB dosage 2 g/L and room temperature constant. Samples were agitated on a rotary shaker and were collected at equilibrium.

2.4.2. Effect of Initial Cd Concentration and Time

Adsorption capacity and metal removal (%) by WSB and AWSB was determined at different initial concentrations of Cd (5–100 mg/L) at constant pH 6, WSB (2 g/L) and AWSB (1 g/L) at room temperature. Water samples were taken after 15, 30, 60, 90, 120 and 180 min until equilibrium was reached in the solution. Water samples were shaken at 150 rpm with a mechanical shaker and centrifuged for 10 min at 3000 rpm. The samples were filtered with a Whatman filter paper (0.45 µm). Residual concentration of Cd was measured in the filtrate with Atomic Absorption Spectrophotometer (AAS, PerkinElmer PinAAcle900F, Waltham, USA). The reliability of the Cd measurement was ensured by running standard solutions of Cd after every 15 samples. The calibration curve obtained with standard solutions of Cd using AAS had R2 = 0.9998.

2.4.3. Adsorption and Removal Analysis

The mass of the Cd adsorbed per unit mass of the biochar ( q e ) (mg/g) at equilibrium was calculated using Equation (1) from the initial concentration of Cd (mg/L) in solution C i , concentration of Cd ions at equilibrium C e , dosage W (g) of WSB and AWSB, and volume V of Cd containing solution (L) [18,19].
q e = ( C i C e W ) × V
The removal of Cd ions ( R ) by WSB and AWSB was estimated with Equation (2).
R = ( C i C f C i ) × 100
where C i and C f are the initial and final concentrations of Cd (mg/L) in solution.

2.4.4. Modeling Equilibrium Sorption Data

Adsorption characteristics of WSB and AWSB were determined using four equilibrium adsorption isotherm models namely Langmuir, Freundlich, Temkin and Dubinin-Radushkevich. Langmuir isotherm model has been expressed in Equation (3) [19] and the values of adsorption parameters KL and Q max were calculated from the intercept and slope of the curve between C e q e versus C e by using Equation (4):
q e = K L C e Q max 1 + K L C e
C e q e = 1 K L Q max + 1 Q max C e
where Q max gives the highest adsorption of Cd by WSB and AWSB (mg/g), K L is a constant calculated from Langmuir mode (L/mg). Freundlich model has been empirically represented in Equation (5) [19].
q e = K F C e 1 / n
In Equation (5), q e indicates the Cd adsorbed per unit mass of the WSB and AWSB at equilibrium (mg/g), C e is the residual Cd concentration at equilibrium (mg/L), K F is the Freundlich sorption constant and n gives the adsorption intensity of WSB and AWSB. The values of Freundlich model parameters (n and KF) were determined using linearized form of the model (Equation (6)) [19].
ln q e = ln K F + 1 n ln C e
Other two models employed for equilibrium adsorption are Temkin (Equation (7)) and Dubinin-Radushkevich (DR) models (Equation (8)).
q e = B ln A + B ln C e     where   B = R T b
ln q e = ln q m k D R ε 2     where   ε = [ R T ln ( 1 + 1 C e ) ]
In Equation (7), A and B are Temkin isotherm constants (L/g) and sorption energy (J/mol), respectively. The R is the gas constant (J/mol/K), b is the Temkin isotherm model constant linked to the energy parameter B. While q m indicates the theoretical sorption (mg/g), k D R is Dubinin-Radushkevich constant indicating mean sorption energy. The values of models parameters were found following [19]. The adsorption kinetics were evaluated with WSB (0.2 g) and AWSB (0.1 g) at Cd concentration of 50 mg/L and pH 6. The samples were taken in 10 mL plastic bottles at room temperature after 15, 30, 60, 90, 120 and 180 min of shaking. To validate the kinetic response of the Cd removal by both WSB and AWSB; pseudo-first order, pseudo-second order, intra-particle and Elovich models were employed (Equation 9) [20,21].
log ( q e q t ) = log q e k 1 2.303 t ( Pseudo - first   order ) t q t = 1 k 2 q e 2 + t q t ( Pseudo - sec ond   order ) q t = k d i f t + C ( Intra - particle   diffusion ) q t = 1 β ln ( α β ) + 1 β ln t ( Elovich )
where q e stands for the simulated equilibrium adsorption (mg/g), q e is the kinetic adsorption at time t (min), k 1 indicates the pseudo-first order adsorption rate constant (1/min), k 2 pseudo-second order adsorption rate constant (g/mg/min), k d i f indicates intra-particle diffusion constant (mg/g/min0.5), C is a constant representing boundary layer thickness (mg/g), α is the initial adsorption rate (mg/g/min) calculated in Elovich model and β is the magnitude of the surface area covered by the Cd ions (g/mg).

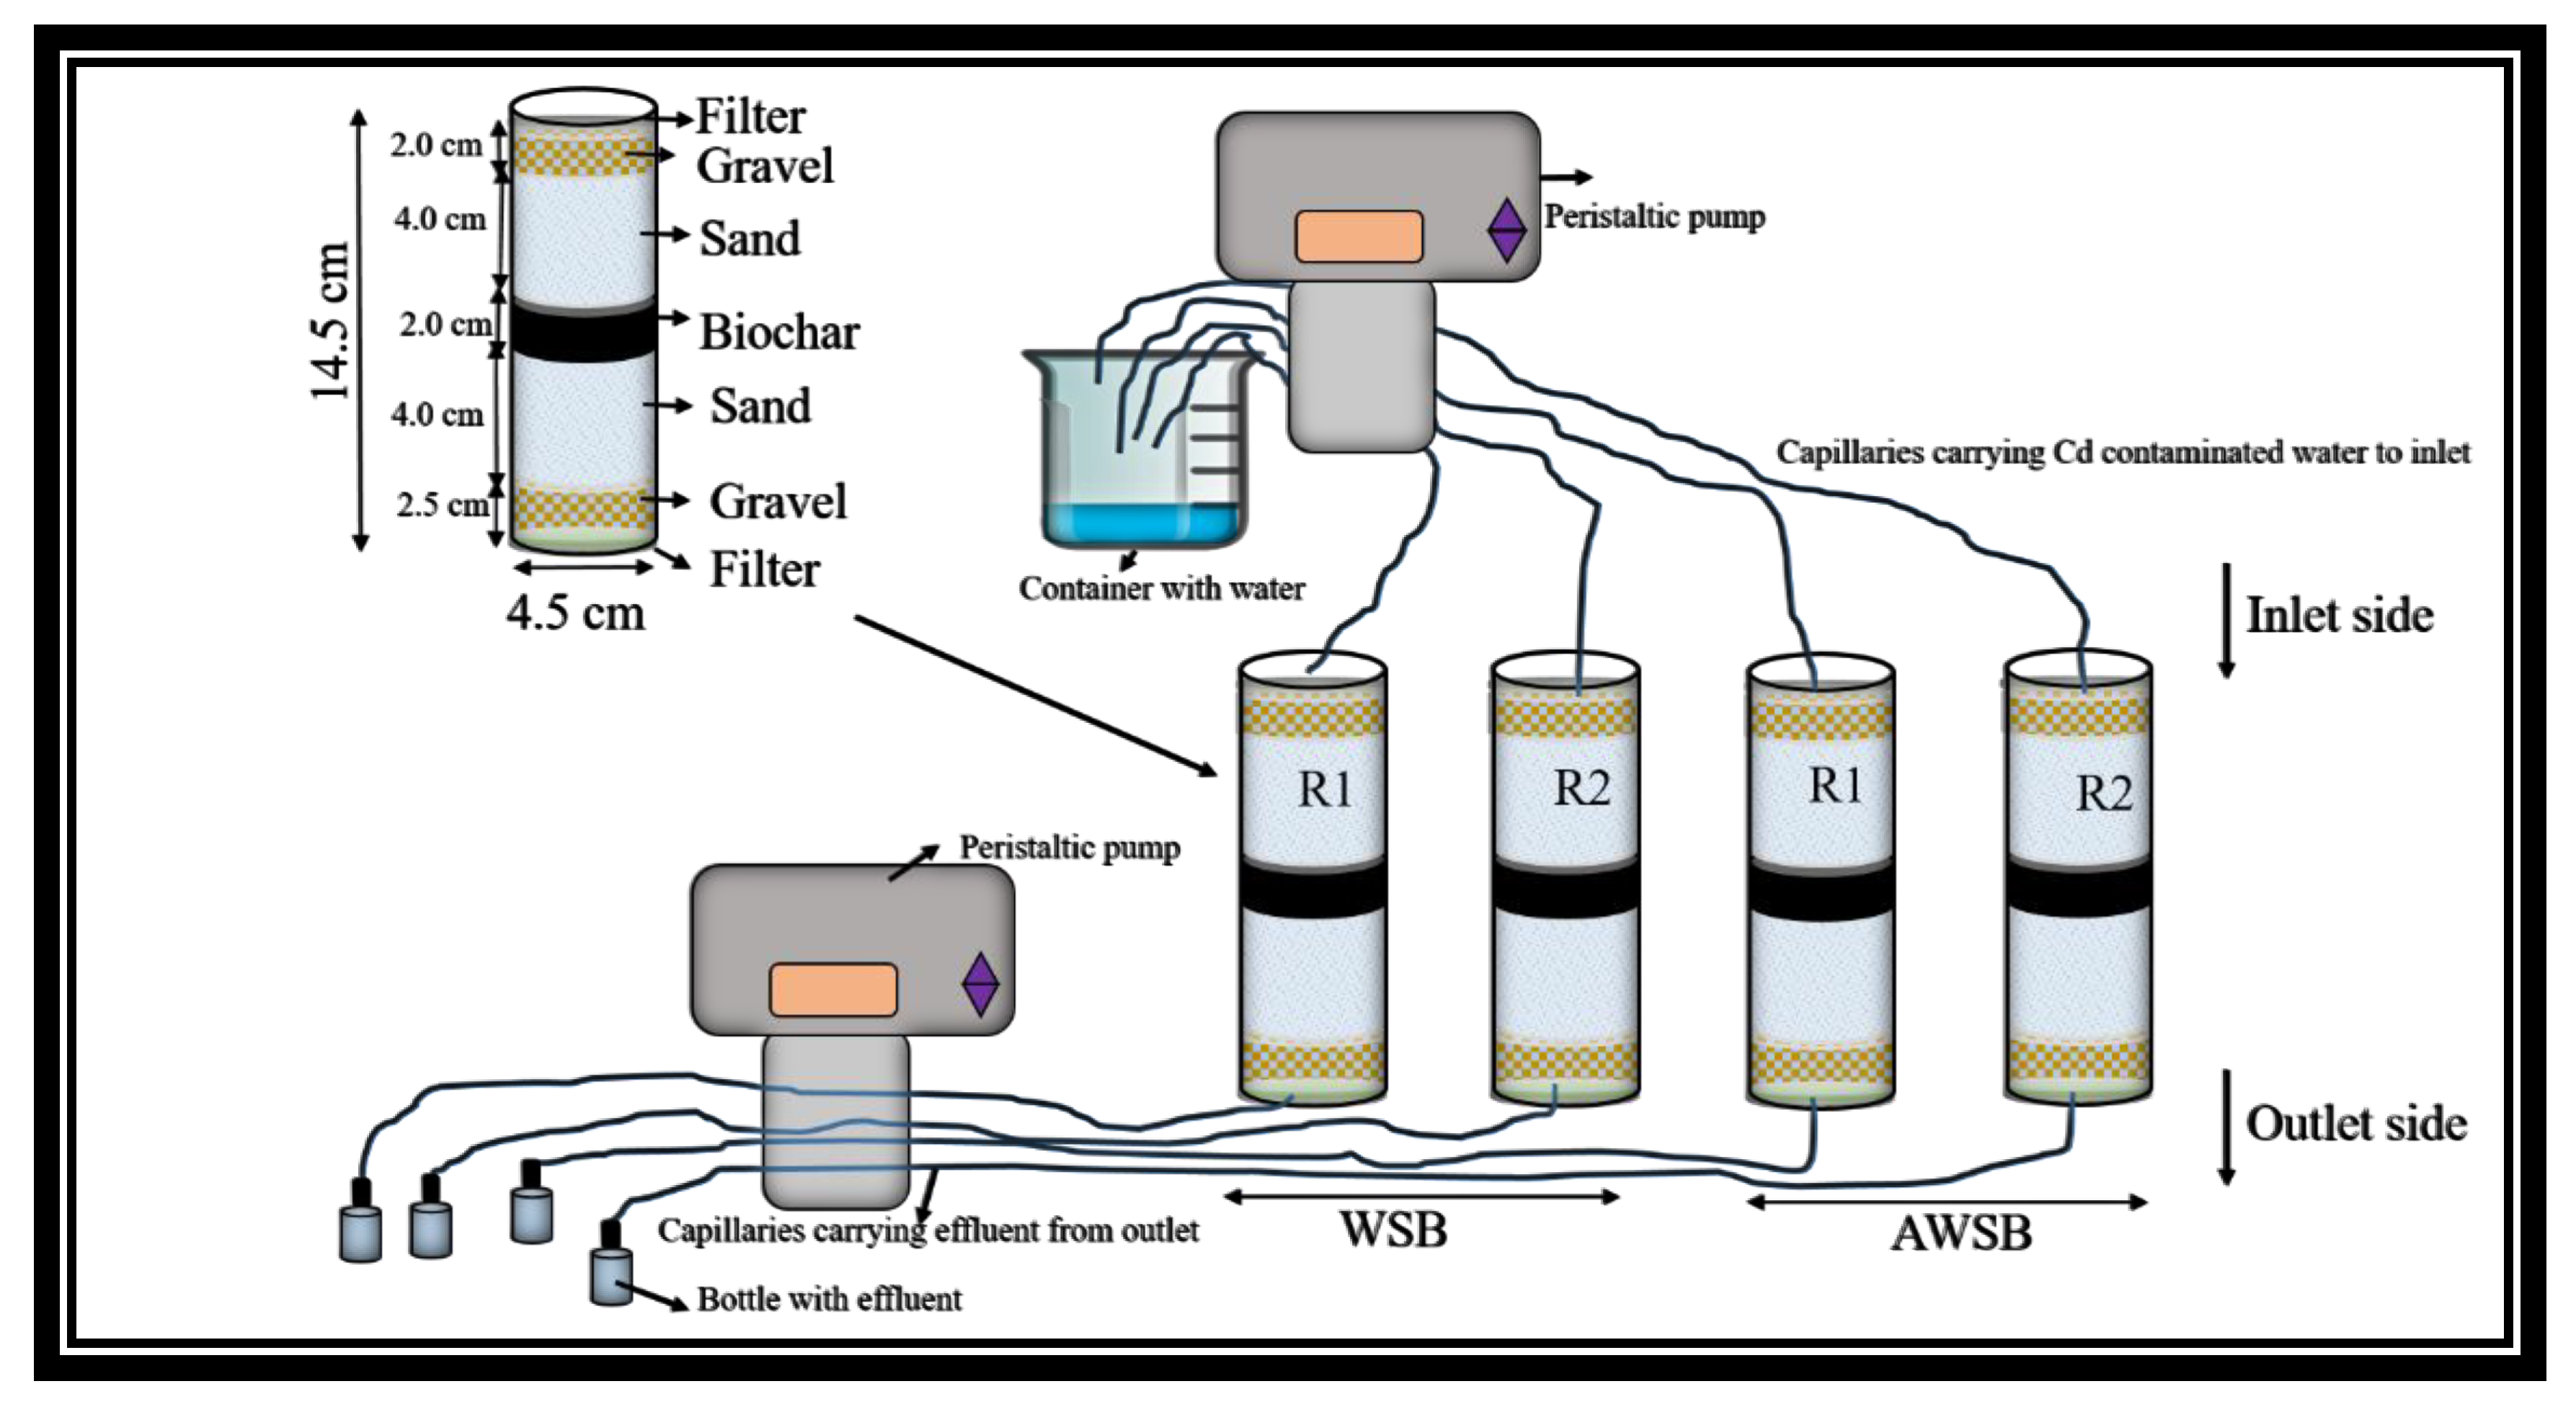
2.5. Laboratory Scale Column Experiments and Reusability of the Biochar

Column experiments on laboratory scale were carried out at steady state in duplicate sets using plexiglass columns with the dimensions and arrangement given in Figure 1. About 5 g of WSB and AWSB was wet-packed separately as an interlayer between acid-cleaned quartz sand (0.2–0.5 mm) and gravel (2–2.5 mm) purchased from local market. After filling, the columns were initially flushed with distilled water for 1 h. The experiment was carried out at four different initial concentrations of Cd (25, 50 and 100 mg/L) at flow rate 2.1 mL/min at pH 5 (optimized in batch scale experiments). The effluent was collected after 10, 30, 60, 90, 120, 180, 240, 300, 330, 390, 600, 660, 720, 810, 900, 960, 1020 and 1080 min to determine the Cd concentration after retention of the contaminant at WSB and AWSB surface. The flow rate (2.1 mL/min) at inlet and outlet sides was maintained with a peristaltic pump at each end. The acronyms R1 and R2 in Figure 1 represent replication one and replication two of the column experiments. To evaluate the reusability of WSB and AWSB, after each experimental run, the columns were flushed with 1% HCl solution and then flushed with distilled water for 30 min before starting injection of the next concentration in columns.

3. Results and Discussion

3.1. Characterization of Biochars

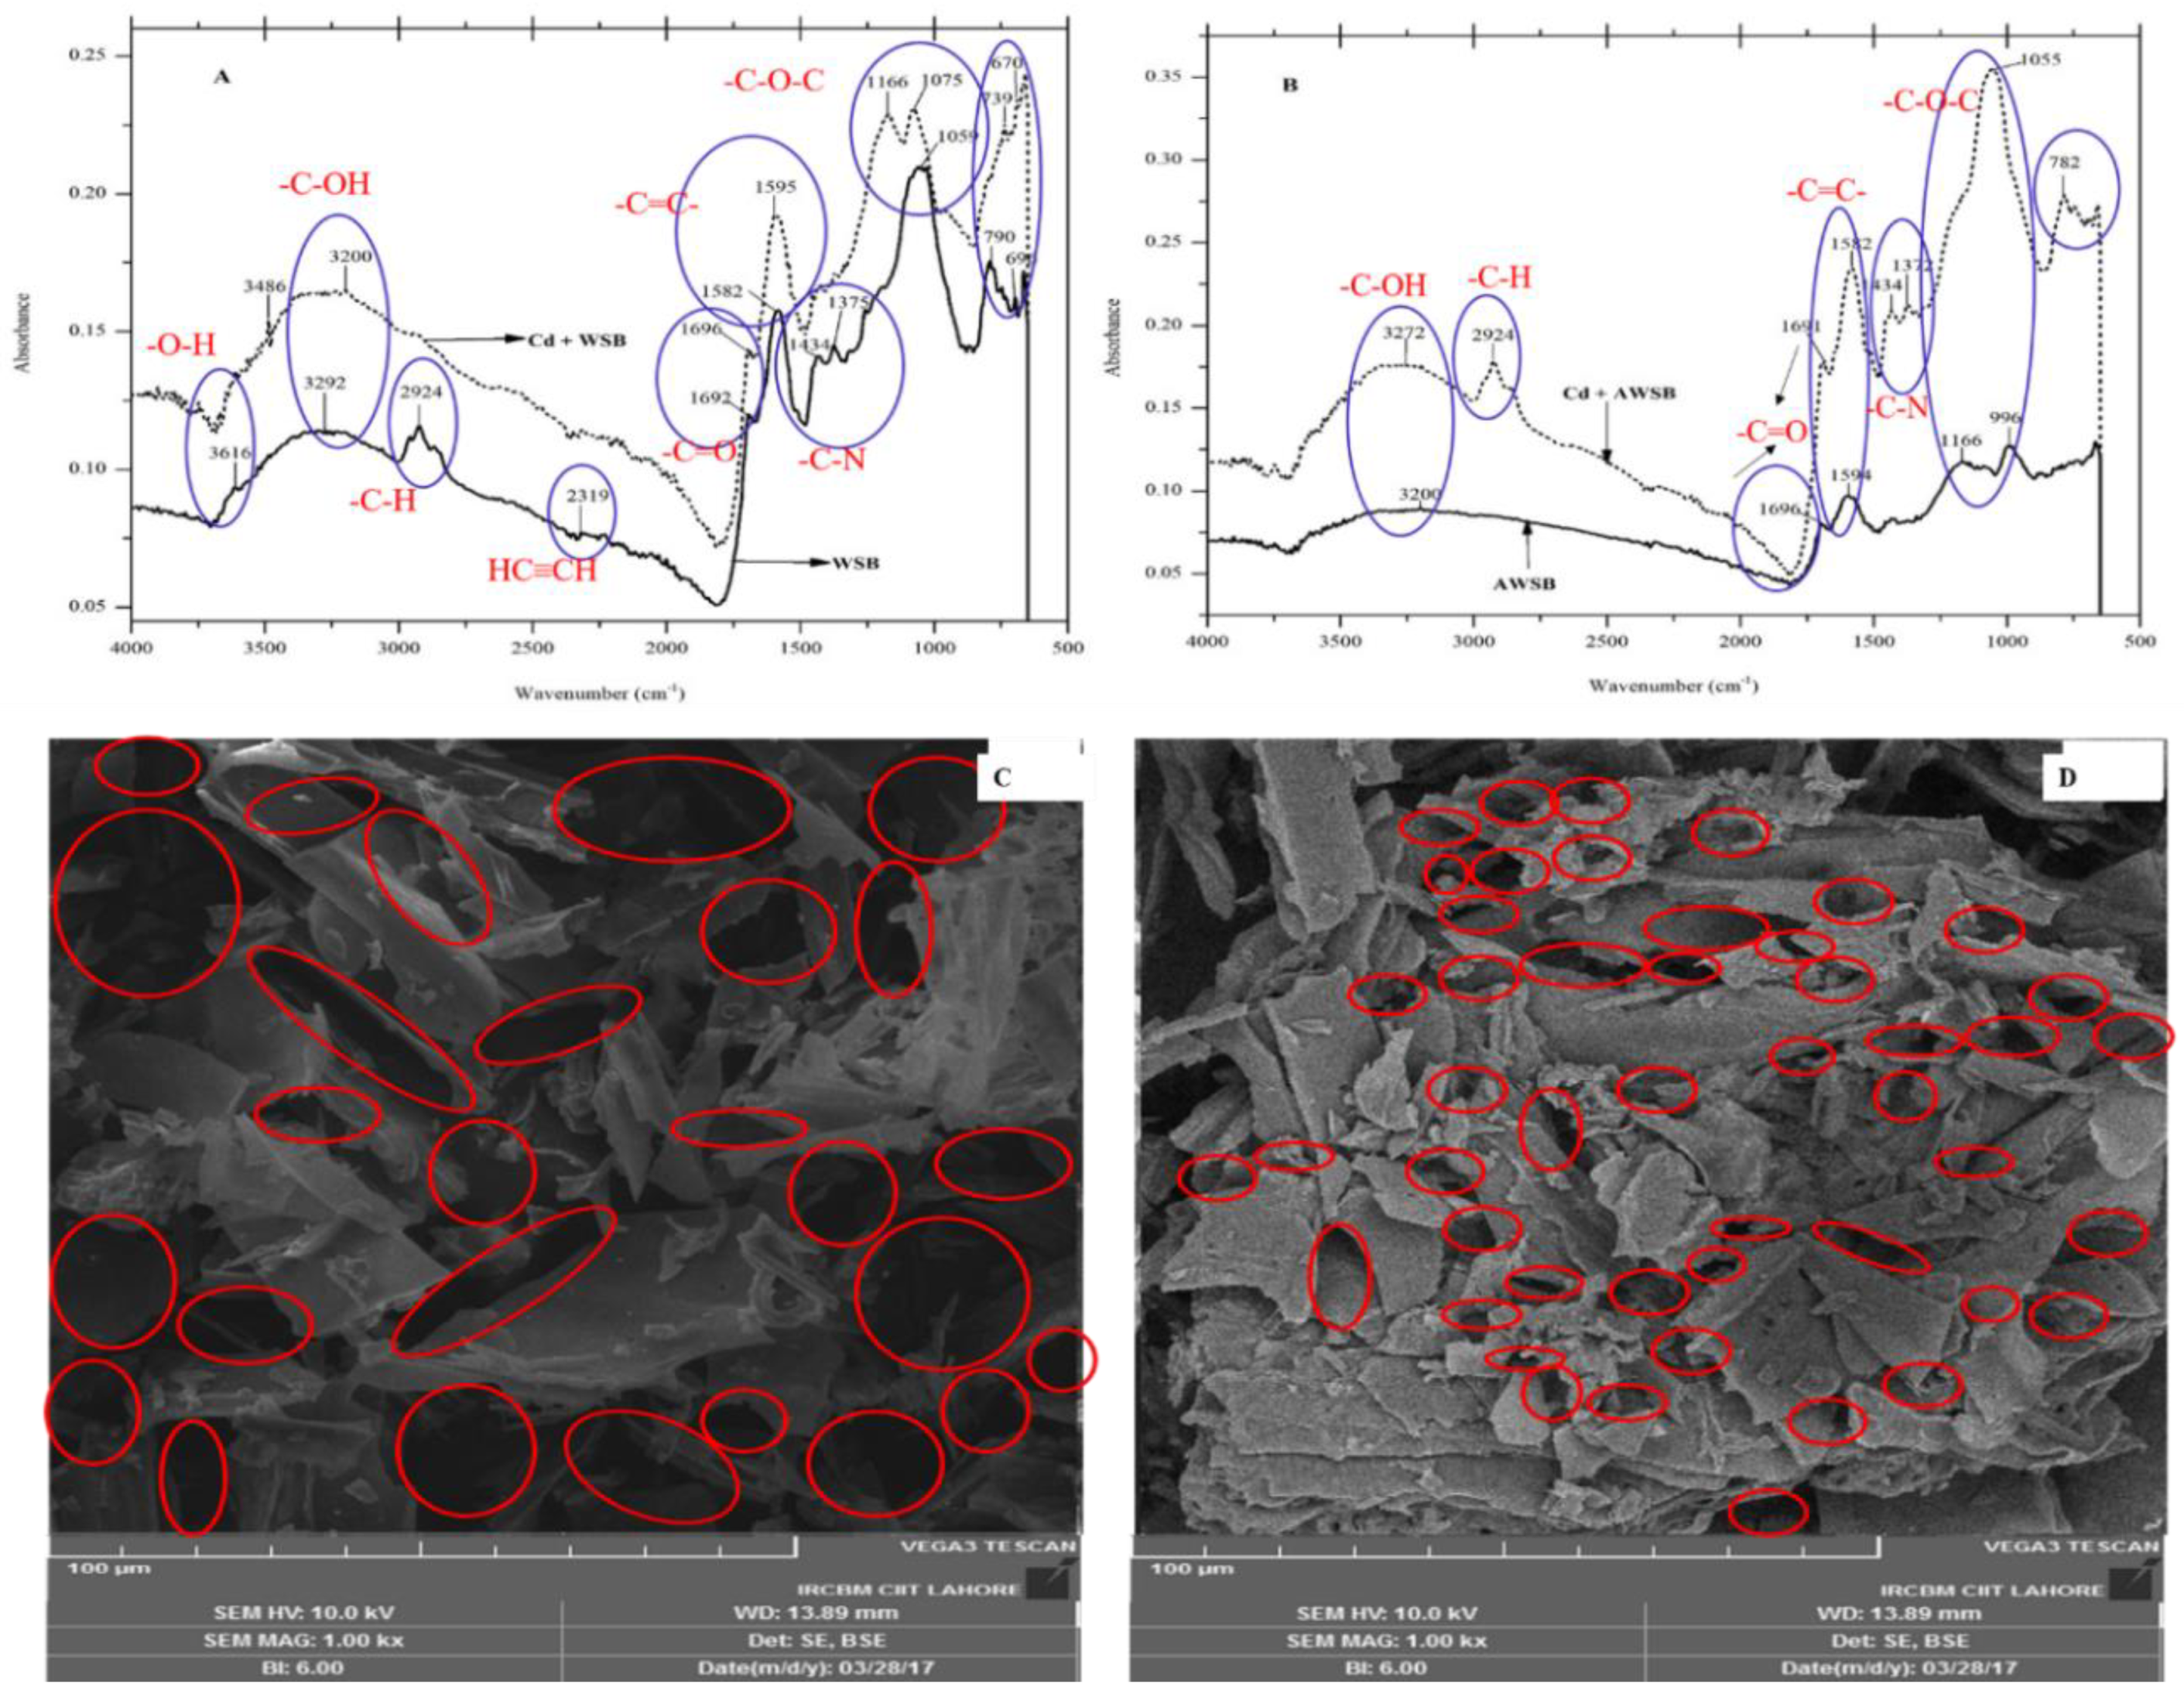
3.1.1. Fourier Transform Infrared Spectra (FTIR)

Various functional groups on the surface of biochars before and after the removal of Cd are shown in Figure 2A,B. The WSB and AWSB showed variation in absorbance peaks responsible for difference in Cd removal from the contaminated water. The area under absorbance peak in case of WSB was smaller as compared to AWSB. More hydroxyl functional groups (–OH) were observed in WSB at 3600–3300 cm−1, while O–H stretching bands were less in AWSB.
The results indicated that phosphoric acid (H3PO4) worked as dehydrating agent and reacted with raw biochar (WSB) [22,23]. Addition of H3PO4 helped to reduce a substantial amount of hydrogen because asymmetric stretching of C–H at 2924 cm−1 was observed in AWSB. This decline (171%) in hydrogen content has also been observed in Table 1. Variation in absorbance peaks was observed in WSB after Cd adsorption, the peaks changed from 3616 cm−1 (–OH) to 3486 cm−1. The WSB did not show presence of aliphatic functional groups after Cd adsorption. However, the asymmetric C–H stretching bands at 2940 cm−1 was observed in WSB before Cd adsorption, indicating the presence of aliphatic functional groups. Both of the WSB and AWSB showed presence of carboxyl groups and aromatic rings in the absorbance peaks attained at 1696 and 1585 cm−1, respectively [24,25]. Analysis of AWSB did not show the presence of C–H asymmetric at 1370 cm−1 and symmetric bending at 1440 cm−1 [23]. However, after sorption of Cd, these bands were prevalent in AWSB. Presence of lactone and carbonyl groups was also observed at 1582 cm–1 in WSB, and at 1585 cm−1 in AWSB [26]. A decline in a series of very complex bands was observed in AWSB in the range of 1000–1260 cm−1.
Vibration of (–OH) group can be observed at 3434 cm−1 in fiber sources and this vibration indicates the adsorption of metals present in contaminated water [1,2]. Presence of methyle and methylene groups (C–H) was observed at 2960 to 2924 cm−1 [27]. FTIR spectra showed that the functional groups such as alkane (C–H), carbonyls (C=O) and alcoholic (–OH) observed on WSB and AWSB surface might have significantly contributed to the adsorption of Cd ions from contaminated water.

3.1.2. Scanning Electron Microscopy (SEM) and BET Analysis
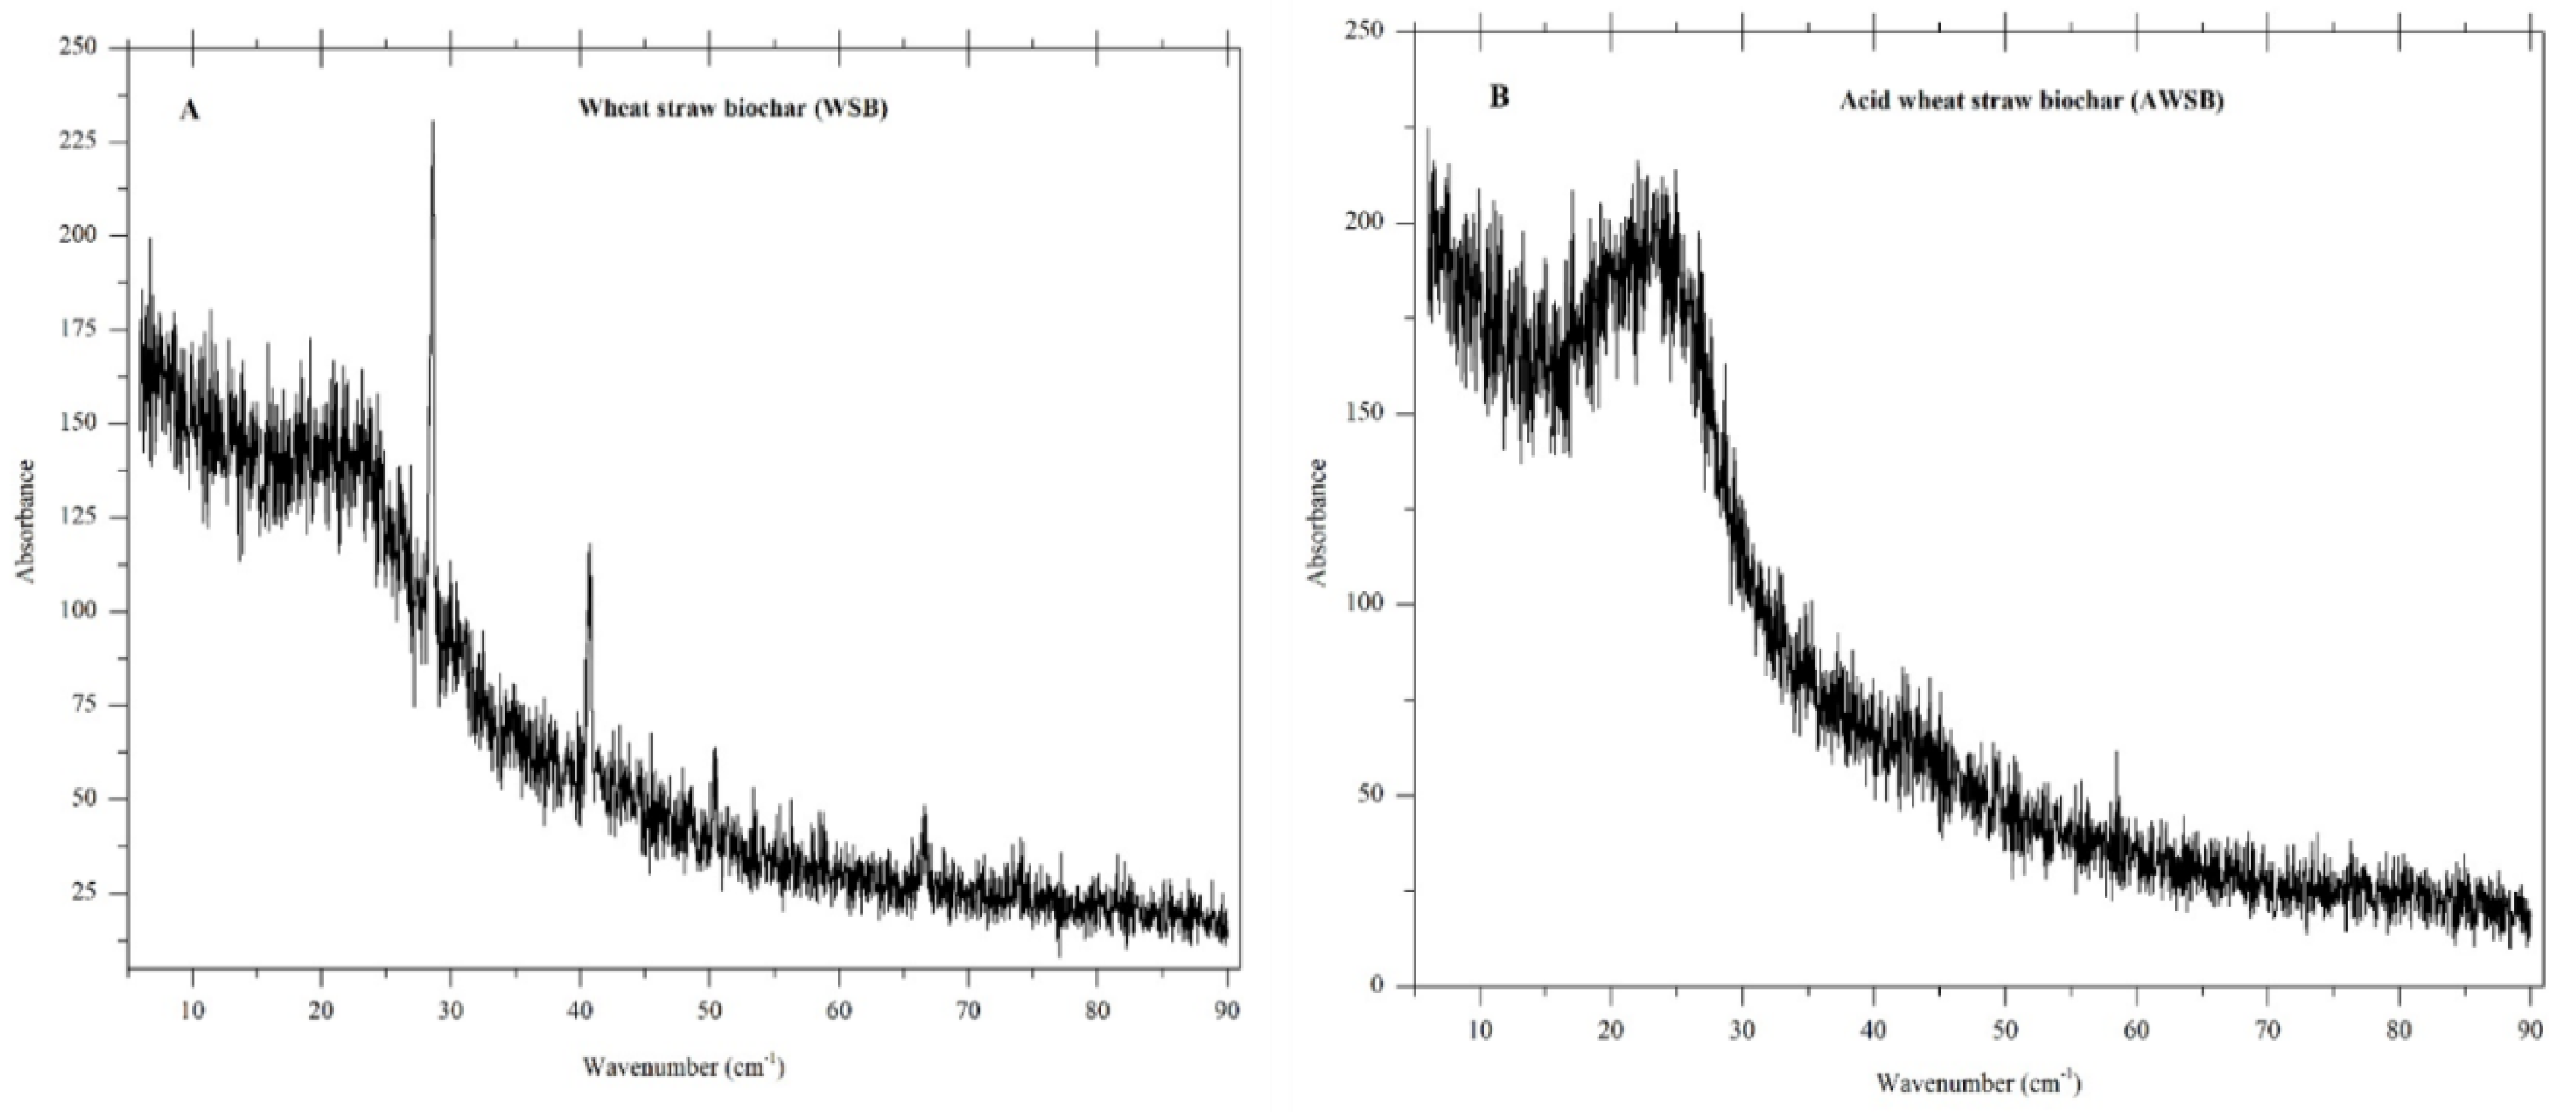
The SEM results showed the surface morphology of WSB and AWSB (Figure 2C,D). It has been shown that thermal treatment of biochar resulted in increased graphitization effect and that probably could be due to the reason that biochar possessed turbostratic structure [28]. The activation of WSB with H3PO4 has changed the macro-pores into micro-pores that was observed on the surface of AWSB. Furthermore, the micro-pores were interlinked with meso-pores and this made it easy to access macro-pores present in inner surface, hence, showing larger surface area [29,30]. Acid treatment increased the area of AWSB (471.67 m2/g) by 2.27 times as compared to the area of WSB (207.33 m2/g). Furthermore, acid treated WSB also showed increased porosity and enhanced absorption capacity of biochar.

3.1.3. XRD Analysis

The XRD analysis showed the crystalline nature and revealed the structure of aromatic layers as indicated by the extremes at 2θ (20–30°) (Figure 3A,B). Crystallites perpendicular to aromatic layers have small dimensions and broadening is the result of these small dimensions [31]. Existence of inorganic components such as crystalline SiO2 has been indicated by sharp and the strongest peak at 2θ = 28.61° [32]. XRD results showed that the surface of WSB and AWSB could be heterogeneous.

3.1.4. Elemental Analysis

Elemental analysis for C, H, O, S, P, K, Fe, Ca, Mg, K, S, Na and Cd in both WSB and AWSB was performed (Table 1). It has also been shown the volatile matter, moisture content, fixed carbon and ash carbon (Table 1).

3.2. Measurement of PZC

To evaluate the nature (acidity/basicity) of WSB and AWSB, PZC was measured with an electrolyte solution. It determined the pH where net surface charge of carbon material has been zero resulting from interaction between WSB, AWSB and electrolyte solution. The functional groups, protonation and deprotonation on the surface of WSB and AWSB influenced the determination of pHpzc. The pHpzc of the WSB was 5.3 and the pHpzc of the AWSB was 3.7. So, if pH has been less than pHpzc, the surface of WSB and AWSB would be positively charged and if pH > pHpzc, then surface of WSB and AWSB would be negatively charged [33].

3.3. Optimization for Cd Removal and Adsorption

Adsorption has been influenced by many factors, such as pH, dose of WSB and AWSB, shaking time and initial Cd concentration in aqueous solution. Therefore, these parameters were investigated to achieve optimum removal efficiency.

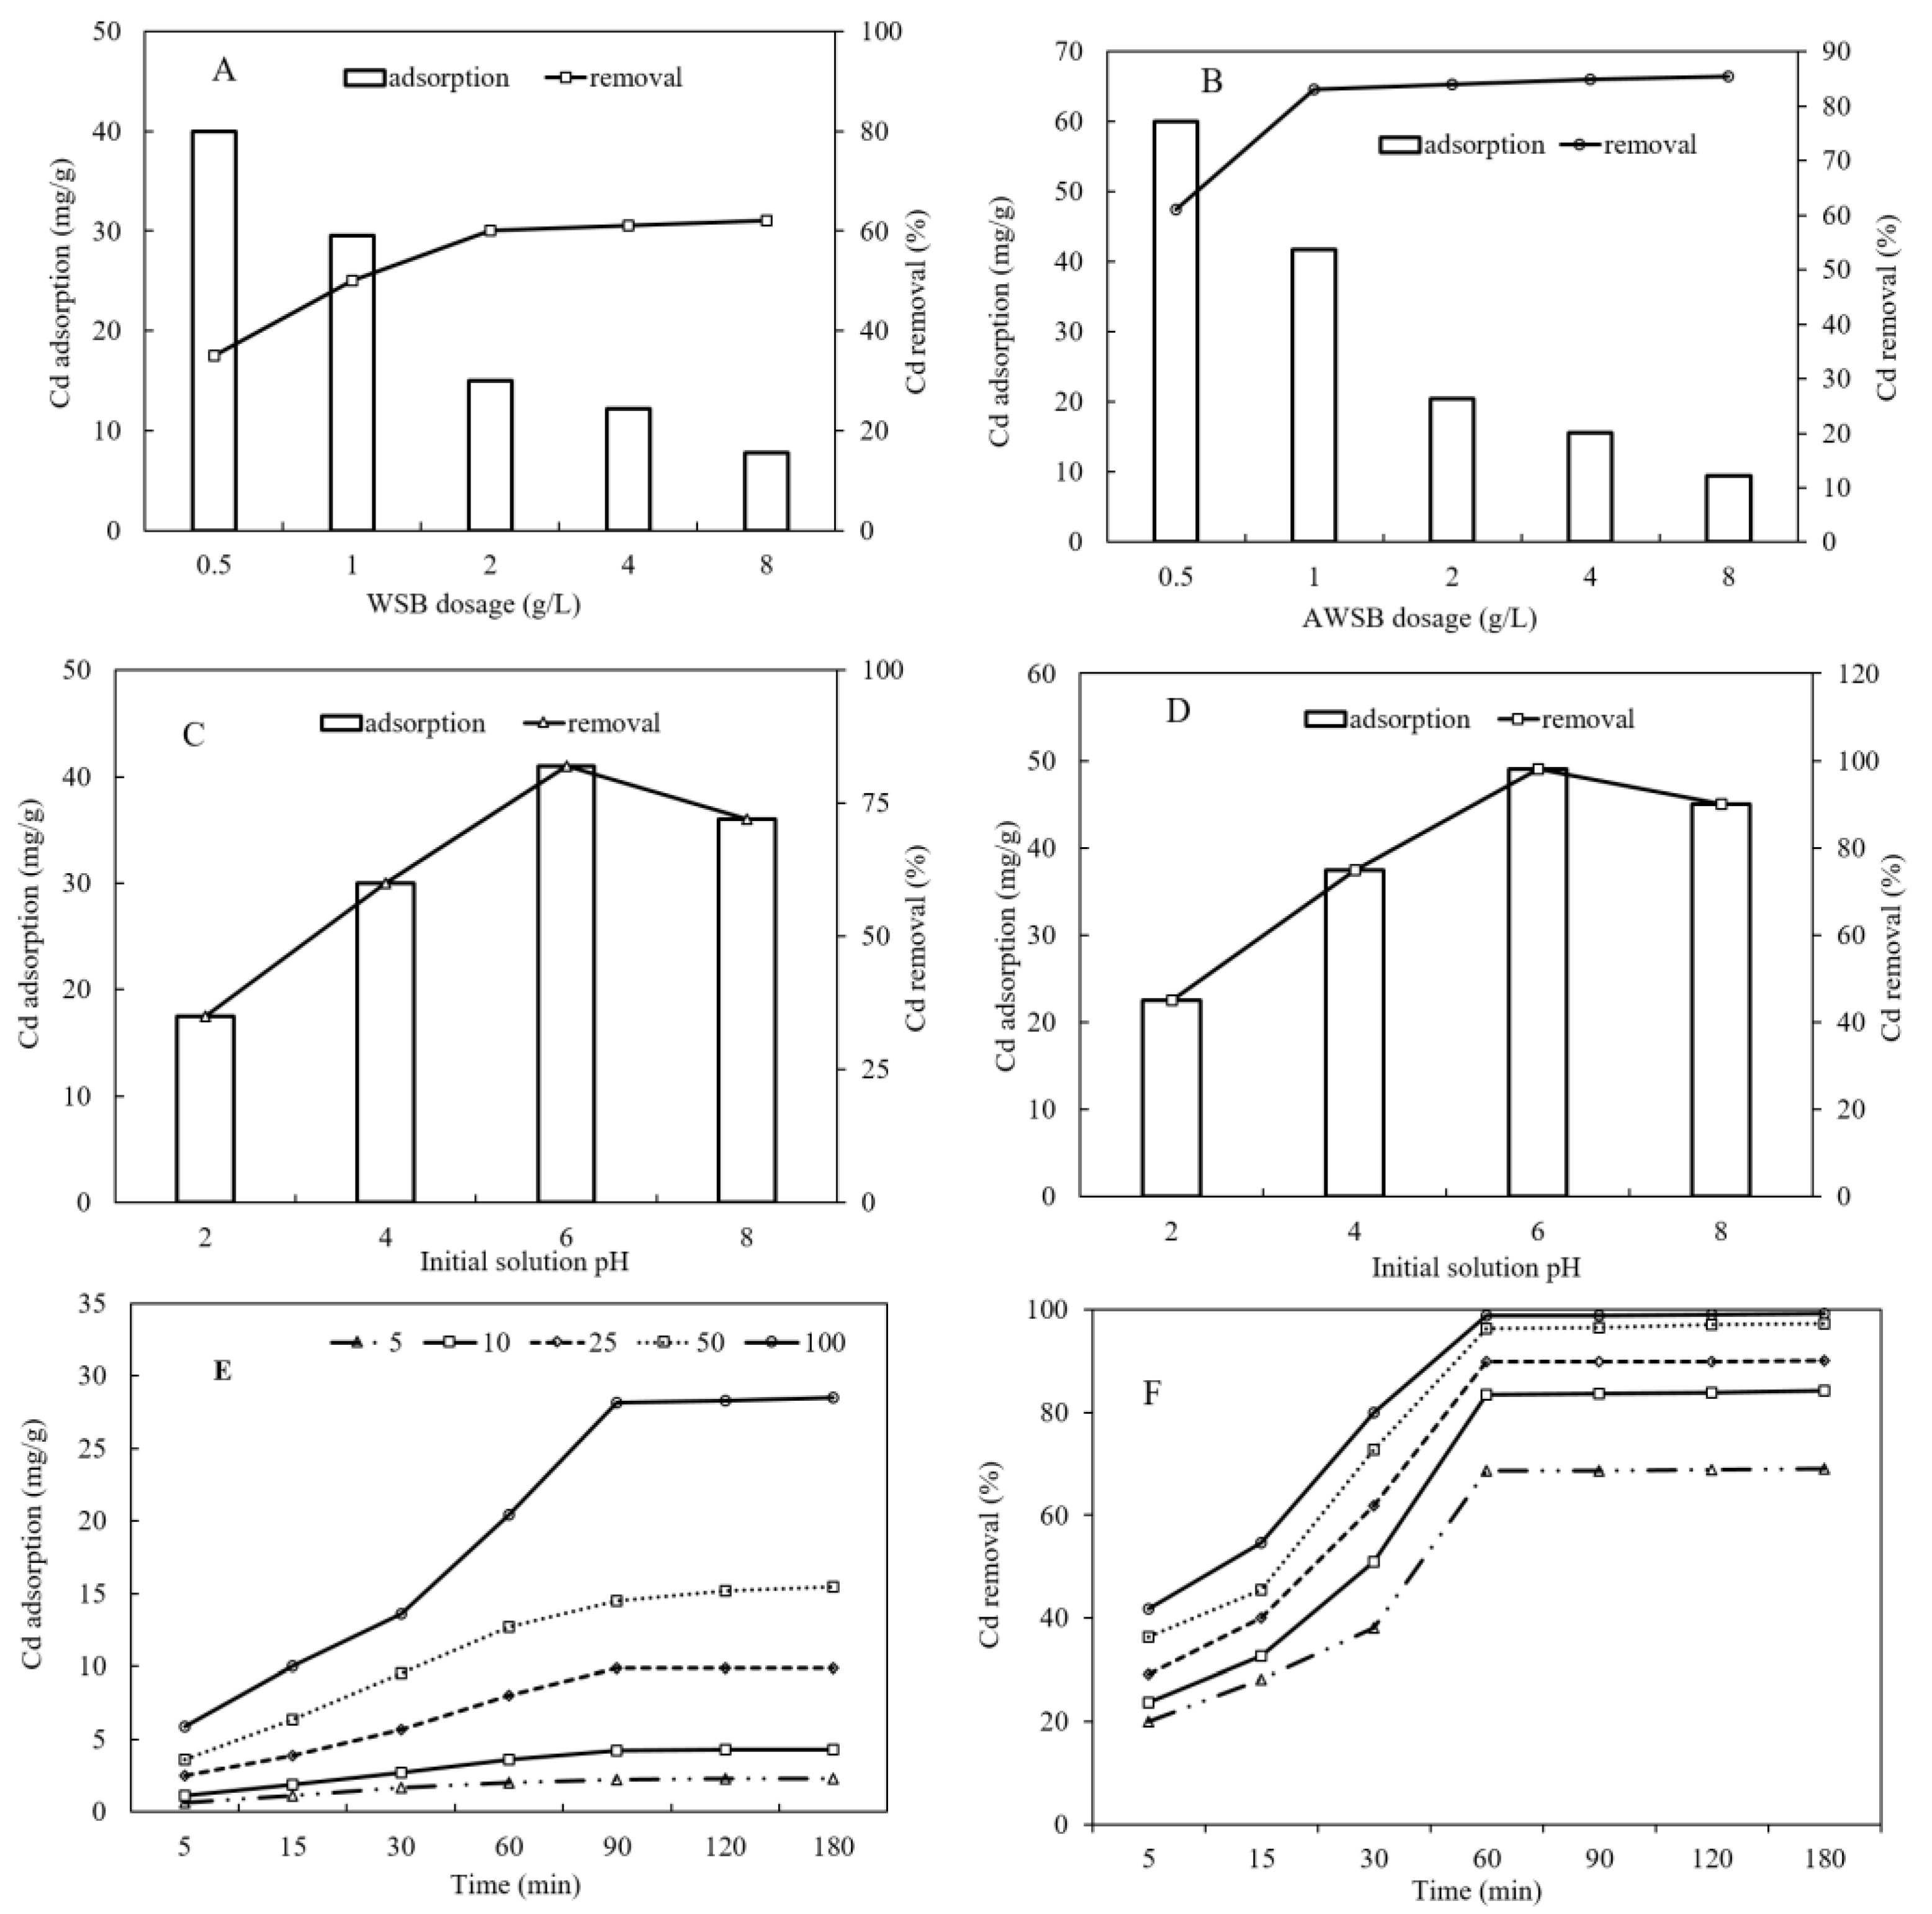
3.3.1. Effect of Adsorbent Dosage and pH

One of the important factors controlling removal of contaminants from aqueous systems was dosage of the adsorbent material. Figure 4A,B showed Cd adsorption (mg/g) and its removal (%) from Cd contaminated water, respectively. The maximum Cd was adsorbed at the dosage 0.5 g/L of WSB and AWSB. The adsorption of Cd on biochar surface decreased with increase in dose of WSB and AWSB. The Cd adsorption on AWSB was higher (60 mg/g) as compared to adsorption on WSB (40 mg/g) at the dose of 0.5 g/L. In case of Cd removal (%), the optimum dosage of WSB and AWSB was 2 g/L and 1 g/L, respectively. The Cd removal by AWSB was higher than that of WSB. The removal increased from 61 to 86% for AWSB. However, the removal increased from 35% to 62% for WSB. The difference in Cd adsorbed on surface of biochar was more prominent when adsorbent mass added into Cd contaminated water was the lowest (i.e., 0.5 and 1 g/L). This difference was pronounced as the dose of adsorbent increased, for example from 2 g/L to 8 g/L (Figure 4B). However, at each adsorbent dose, the Cd removed from contaminated water was always less in WSB as compared to AWSB (Figure 4B).
The increment in the dosage of WSB and AWSB (0.5 to 8.0 g/L) resulted in decline of Cd adsorption; however, it increased Cd removal (Figure 4A,B). This happened because of larger surface area and higher number of adsorption sites [34,35,36]. The results showed that the increment in the dosage of WSB and AWSB enhanced the removal efficiency of Cd, but there was a decline in Cd sorption per unit mass. This decrease in Cd adsorption could be attributed to incomplete usage of adsorption sites or due to formation of aggregates in response to high adsorbent dosage [19,37,38]. The results of the present study are in complete agreement with literature [39], where adsorption of Cd decreased when adsorbent dose was increased. The difference in Cd removal with adsorbent WSB decreases after 2 g dose and in AWSB it decreased after 1 g dose. This may have happened because of the establishment of an equilibrium between WSB, AWSB and Cd concentration in the solution [40].
The pH of contaminated water also affects the adsorption of Cd by WSB and AWSB because it can change the charges present on the surface of WSB and AWSB thereby influencing the ionic strength of the solution [33]. The results showed that difference between WSB and AWSB in the Cd removal efficiency and adsorption capacity stays the same even after changing the pH of the solution (Figure 4C,D). But the adsorbent treated with phosphoric acid (AWSB) performed better for Cd remediation than WSB. The adsorption of Cd decreases with decrease in pH, and the lowest adsorption was recorded when pH of solution was 2. The adsorption of Cd and removal efficiency increased at higher pH of Cd contaminated water. Maximum Cd was removed at pH 6.0 for both biochars (WSB and AWSB). However, adsorption capacity (mg/g) started to decrease when pH was changed from 6.0 to 8.0. Results revealed that the Cd removal efficiency improved from 35% to 82% when pH was varied from 2.0 to 6.0 for WSB. On the other hand, removal efficiency was more prominent in AWSB (45 to 98%) when pH was changed from 2.0–6.0 while Cd adsorption by WSB enhanced from 16 to 41 mg/g when pH changed from 2.0–6.0. However, AWSB showed higher Cd adsorption (23–48 mg/g) than WSB.
This decline in adsorption efficiency at low pH may be attributed to the abundance of H+ ions because they result in solid competition with Cd for the available adsorption sites of WSB and AWSB. However, adsorption capacity was improved with increase in pH due to the increased negative charges on biochars resulting from deprotonation of carboxylic and hydroxyl functional groups. Literature shows that adsorption of the heavy metals increases when there is an increase in solution pH [36,41,42]. It may be credited to the reduced competition among protons and Cd ions to occupy the available sorption sites. Moreover, the number of binding sites is improved at higher pH leading to increase in total metal adsorbed on the adsorbent surface [36,42].
Moreover, pH effect on the Cd adsorption can be described from the results of pHpzc for both adsorbents (WSB and AWSB). The results of pHpzc showed that the pHpzc for WSB was higher (5.3) as compared with AWSB (3.7) (Figure 4C,D). If the pH < pHpzc it can reduce Cd removal efficiency because of likely electrostatic repulsion among positively charged ions of H+ and Cd. Adsorption of Cd is enhanced when pH is increased because of electrostatic forces of attraction between surface of WSB and AWSB containing negative charges and positive Cd ions. The current study showed maximum removal of Cd at pH 6, which is also applicable in the environment as most of the water resources have pH in the range 6–8.

3.3.2. Effect of Initial Cd Concentration and Contact Time

Figure 4E,F presents the effect of shaking time (0–180 min) on the amount of Cd adsorbed per unit mass of WSB and AWSB ( q t ) and removal at different Cd concentrations (10–100 mg/L). Comparison between AWSB and WSB revealed that AWSB showed maximum adsorption and removal of Cd ions in 60 min, while WSB took 90 min. The Cd adsorption by WSB changed from 2.3 to 28.2 mg/g after 90 min of shaking when Cd levels varied from 5 to 100 mg/L, respectively. However, in case of AWSB at equilibrium, an increase in adsorption capacity (4.9 to 68.6 mg/g) was observed, while the Cd removal decreased from 89.9% to 69%. The adsorption process was of biphasic nature. Firstly, fast Cd adsorption was noticed within 90 min by WSB and 60 min by AWSB, following which the adsorption rate became slow due to equilibrium. The results revealed that Cd removal was relatively higher and adsorption capacity of both adsorbents showed decline when initial concentration of the Cd was increased. The results showed that AWSB performed better as compared with WSB for Cd removal from contaminated water. There was a slight variation in adsorption of Cd on AWSB (4 mg/g) and WSB (2 mg/g) at initial Cd level 5 mg/L while this difference was improved with increment in initial Cd levels. The results showed that q t for WSB was less (20.5 mg/g) than AWSB (68.6 mg/g) after 60 min of agitation at 100 mg Cd/L. A comparison between Cd removal by adsorbents at initial concentration (5 mg/L) showed that WSB removed 92% Cd as compared with AWSB (99%) (Figure 4E,F).
The presence of electrostatic field around the adsorbent was the main reason behind enhanced Cd adsorption when initial levels of Cd increased in the solution [43]. The adsorption of Cd on adsorbents was quicker at initial Cd concentration due to the fast adsorption process, which was associated with its activation energy [44]. After fast adsorption, the adsorption of Cd on adsorbents became slow because of the rearrangement of adsorbed Cd on the adsorbent surface, which caused better utilization of active adsorption sites.

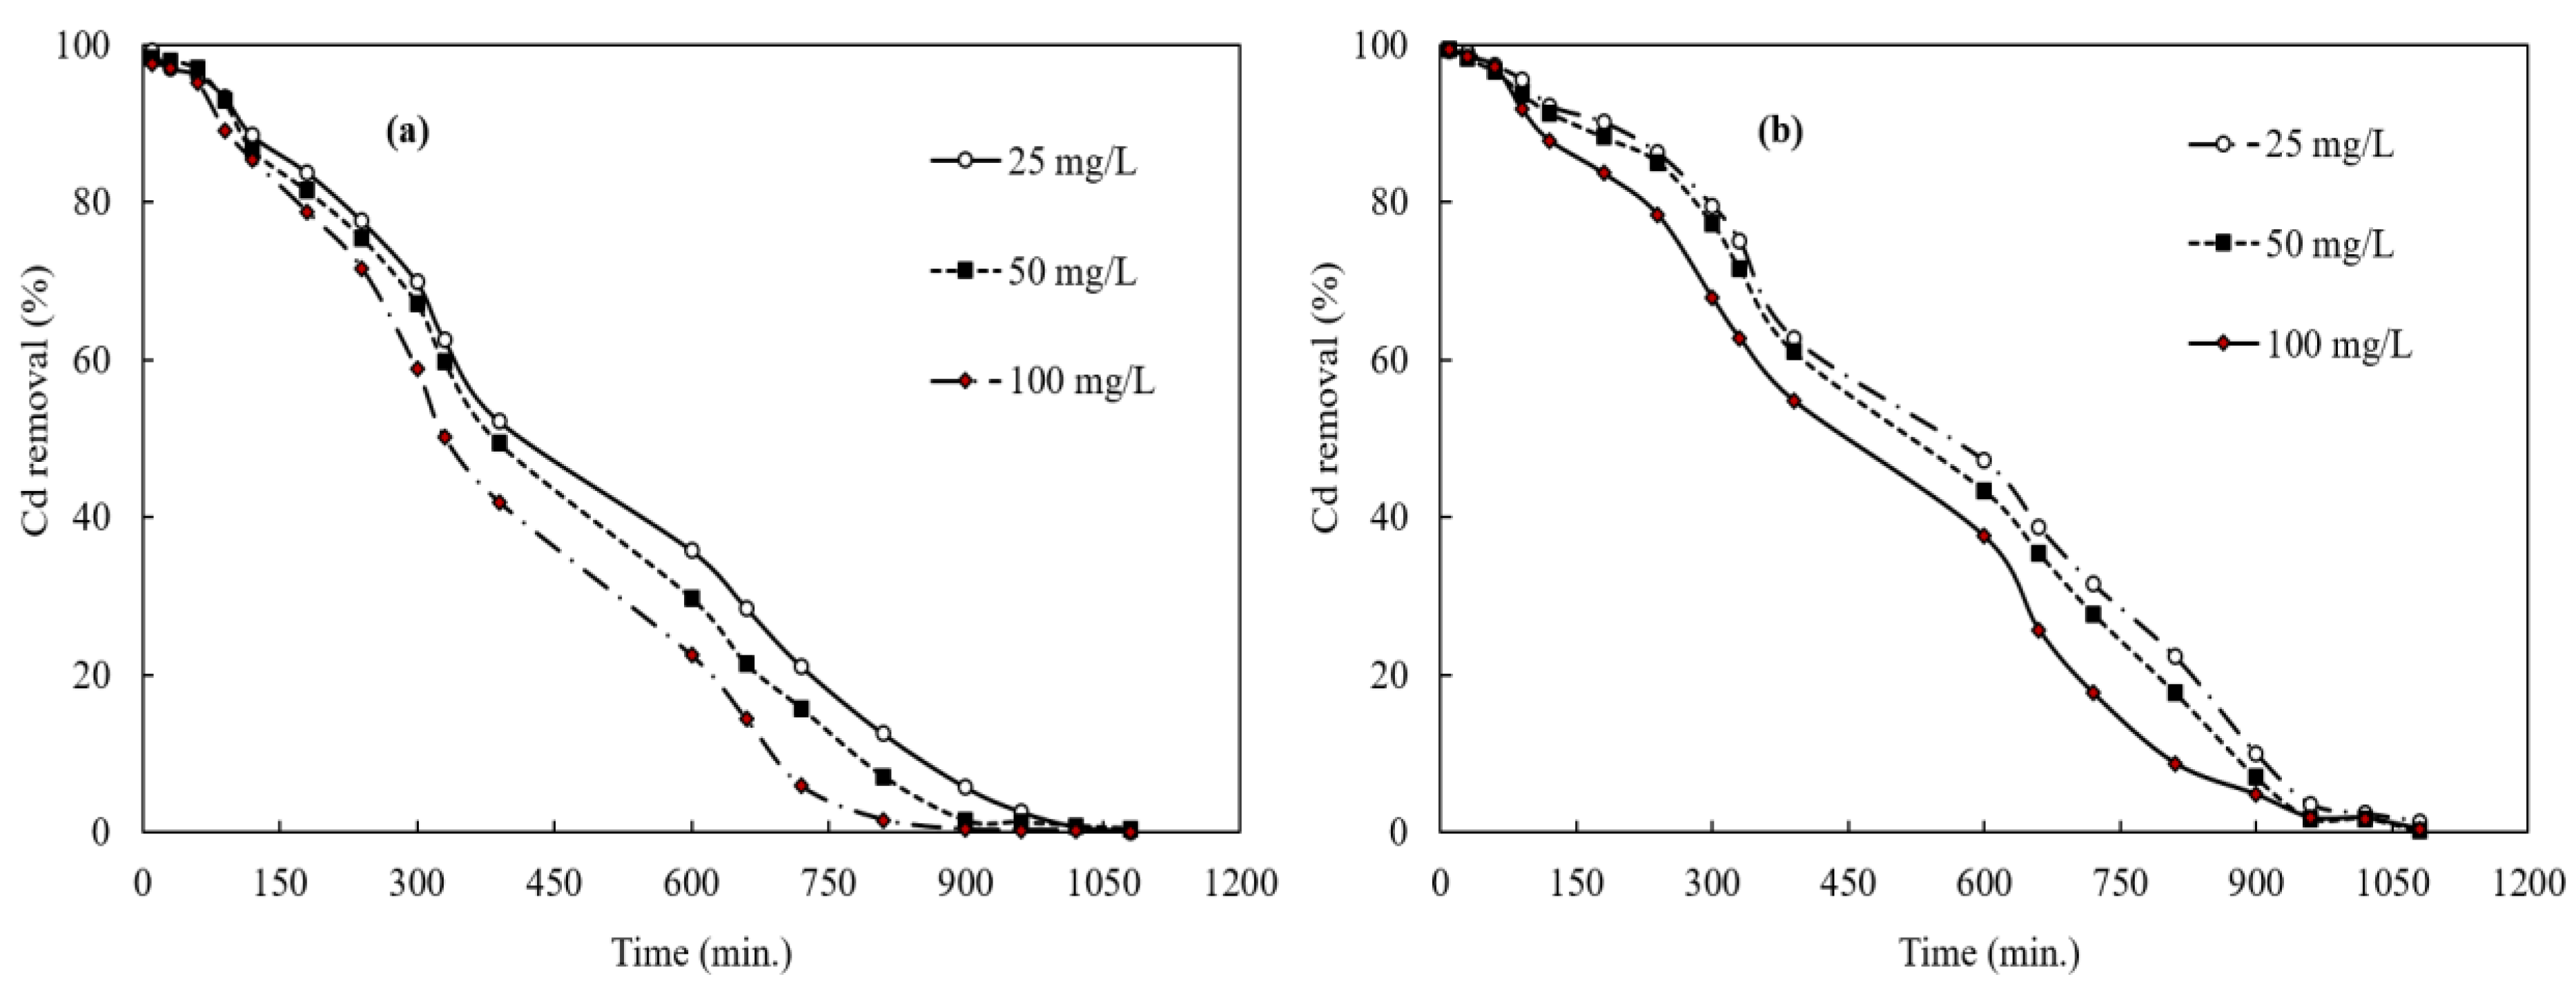
3.4. Cadmium Removal from Laboratory Scale Column Experiments and Reusability of The Biochar

Figure 5 shows Cd removal (a, b) by WSB and AWSB, respectively, at three different initial concentrations of Cd (25, 50 and 100 mg/L) in laboratory scale column experiments carried out with continuous injection of Cd contaminated water at steady state. These laboratory scale column experiments were carried out at fixed dosage, pH, and temperature. The samples were collected from each column after 10, 30, 60, 90, 120, 180, 240, 300, 330, 390, 600, 660, 720, 810, 900, 960, 1020 and 1080 min. The breakthrough curves for Cd removal show that maximum Cd was removed with AWSB in first 90 min when injected Cd concentration changed from 25–100 mg/L as compared with WSB.
Inlet concentration of contaminant is a significant factor affecting the performance of column experiments as it is the driving force for the transport of the adsorbate molecules towards the adsorbent surface [32,45]. In first 90 min, Cd removal changed from 89.2–93.35% and 92.3–95.6%, respectively by WSB and AWSB when Cd concentration varied from 100–25 mg/L. While after 240 min, WSB showed 71.6–77.5% removal and 78.4–86.28% Cd was removed by AWSB when initial concentration of Cd was varied from 100–25 mg/L. However, there was a decline in Cd removal with increase in initial concentration of Cd at a given time. The difference in Cd removal between 25 and 50 mg/L is less than the Cd removal between 50 and 100 mg/L. This maximum removal of Cd by WSB and AWSB might be attributed to the dosage (5 g) and higher potential of WSB and AWSB due to the presence of different functional groups as shown in FTIR spectroscopy. The dosage or bed height of the adsorbent primarily affects the total uptake of a contaminant by the adsorbent [7,45]. At higher dosage (5 g/column) of WSB and AWSB, there is more contact of Cd with the adsorbents, which led to maximum removal of Cd at column scale. In future studies, column scale studies will be conducted to evaluate the effects of different process parameters: bed height, flow rate, temperature etc.
For reusability of WSB and AWSB, each column was flushed with 1% HCl solution for 2 h to remove/desorb the Cd and then with distilled water for 30 min before injection of new concentration of Cd containing water. Over all, WSB and AWSB has excellent reusability for Cd removal.

3.5. Study of Adsorption Isotherm Modeling

Efficiency of Cd sorption on the surface of WSB and AWSB was studied using adsorption isotherm models. It was found that Freundlich isotherm model better explained the Cd equilibrium sorption data with WSB and AWSB due to heterogeneous surface as compared with other isotherms (Langmuir, Temkin and Dubinin-Radushkevich) (Table 2). The R2 of isotherm plots were >0.98 with Freundlich model. Furthermore, activation of WSB with acid improved adsorption characteristics of biochar surface because of heterogeneous surface as confirmed with SEM. The linear plots with Temkin and Dubinin-Radushkevich yielded less R2 (0.68–0.87) indicating less suitability (Table 2). Hence, the highest adsorption of WSB and AWSB illustrated from Langmuir model were 31.65 and 74.63 mg/g, respectively. Moreover, it was also higher than activated carbons produced by using wood and bark as feedstock material (0.34–5.40 mg/g) [7] and activated carbons available for sale in markets (8.00 mg/g). Furthermore, biochars derived from pig and cow manure yielded Qmax ranging from 78.2 to 118 mg/g [41].
The values of n are important to show whether the adsorbent materials are appropriate for Cd adsorption. In our case, the values of n showed that WSB and AWSB favored the Cd adsorption. The Cd sorption potential of AWSB was approximately four times the WSB as inferred from the values of KF, 15.95 and 3.46, respectively. Specifically, KF values improved considerably for AWSB, probably as a result of the increased surface area (Table 1). It resulted in a higher concentration gradient driven movement of Cd ions into pore spaces of AWSB (Figure 2C,D). Considerably, greater Freundlich adsorption constant (KF) values obtained with AWSB suggest its efficient application for the removal of Cd ions from contaminated water.

3.6. Adsorption Kinetics of Cd

In the present work, pseudo-first order, pseudo-second order, intra-particle diffusion and Elovich kinetic models were used to describe the kinetic adsorption of Cd onto WSB and AWSB. The parameters calculated for Cd adsorption by using kinetic models are presented in Table 3. The coefficient of determination (R2) in kinetic studies showed that Cd adsorption fitted well with pseudo-second order kinetic model rather than pseudo-first order, intra-particle diffusion and Elovich kinetic models. Furthermore, second-order kinetic model gave maximum correlation coefficients (R2 = 0.978–0.997) indicating possible chemisorption of the Cd onto surface of adsorbents (WSB and AWSB) [46,47]. The results showed that q e values of pseudo-second order kinetic model with AWSB and WSB were 34.84 mg/g and 16.18 mg/g, respectively. It is reported that the second order kinetic model can easily describe details about metals retained on biochar and activated carbon [48]. In the present study, results indicate that chemisorption might be the rate controlling mechanism, suggesting possible sharing of electrons between Cd ions and WSB and AWSB [36].

3.7. Comparison of Cd Sorption Capacity with Other Adsorbents

The Cd adsorption on WSB and AWSB (mg/g) was compared with different adsorbents used in previous studies for the Cd removal (Table 4). The adsorption capacities reported by other researchers varied greatly among different adsorbents. The reason behind this variation can be different chemical composition and surface characteristics, particle size and presence of certain functional groups [21,49]. In the present work, the biochar was prepared with wheat straw, which contains significant amounts of lignin (24.1%), cellulose (32.6%) and hemicellulose (22.2%) [50]. This was the reason that the biochar produced with crop straws e.g., WS possessed high surface area and more developed pore spaces in comparison with other feed stock materials [51]. This characteristic along with other properties such as heterogeneous surface, existence of carbon-oxygen functional group, made WSB an adsorbent of choice as compared with other adsorbents. Furthermore, the pyrolysis and addition of phosphoric acid further enhanced the adsorption capacity of WSB because of the modifications in surface characteristics of the adsorbent (functional groups). It is reported that biochar produced with ligno-cellulosic material as a feedstock adsorbed metal with the help of chemical charged groups (e.g., amino and carboxylic etc.). It is attributed to the enhanced metal sorption of AWSB as compared with WSB due to the surface modification with phosphoric acid.

4. Conclusions

The results revealed that the surface modification of biochar significantly improved the surface properties, thereby improving performance for Cd removal. Therefore, more Cd (99%) was removed with AWSB from water as compared with WSB. The Cd removal was improved at higher dosage of each sorbent (WSB and AWSB) from 0.5 to 8 g/L. However, the optimum dose of WSB and AWSB for Cd removal was 2 g/L and 1.0 g/L, respectively. Removal of Cd changed from 56–90% and 70–99% with WSB and AWSB, respectively, when initial concentration of Cd varied from 100–5 mg/L. The maximum Cd was removed at pH 6 with both WSB and AWSB. The adsorption experimental data obtained with WSB and AWSB adsorbents fitted well with Freundlich isotherm as compared with Langmuir, Temkin and Dubinin-Radushkevich models. The increased Cd removal efficiency from 69% to 99% with acid treatment is accredited to the enhanced BET surface area and removal of impurities from particles surface with acid, thereby changing functional groups on AWSB. The experimental kinetic data was well described with pseudo-second order kinetic model in comparison with pseudo-first order, intra-particle diffusion and Elovich models. Laboratory scale column experiments showed excellent retention of Cd with WSB and AWSB even at 100 mg Cd/L. This study concluded that activated wheat straw biochar is a cost-effective adsorbent for Cd removal from wastewater and have the potential for the removal of organic and inorganic pollutants.

Author Contributions

M.A.N., M.I. and I.A. conceptualized the project design; M.A.N., M.A. prepared biochar and executed work; G.A., M.T. and B.M. performed characterization; M.I. and A.Z. performed modeling on the data, M.S. and L.B. contributed in the final draft of the manuscript. All authors contributed to the review and edit process. M.I. and I.A. submit and review the manuscript.

Funding

This study was part of the project “SRGP Grant Number 1001” funded by the Higher Education Commission of Pakistan (HEC).

Acknowledgments

We are thankful to the Higher Education Commission of Pakistan (HEC) for the financial support of the current research work under SRGP. We are also thankful to the anonymous reviewers for their positive criticism on this manuscript.

Conflicts of Interest

The authors declare no conflict of interest.

References

  1. Rao, K.; Mohapatra, M.; Anand, S.; Venkateswarlu, P. Review on cadmium removal from aqueous solutions. Int. J. Eng. Sci. Technol. 2010, 2, 81–103. [Google Scholar] [CrossRef]
  2. Haris, M.R.; Wahab, N.A.; Reng, C.W.; Azahari, B.; Sathasivam, K. The sorption of cadmium (II) ions on mercerized rice husk and activated carbon. Turk. J. Chem. 2011, 35, 939–950. [Google Scholar]
  3. Sawalha, M.F.; Peralta-Videa, J.R.; Romero-González, J.; Gardea-Torresdey, J.L. Biosorption of Cd (II), Cr (III), and Cr (VI) by saltbush (Atriplex canescens) biomass: Thermodynamic and isotherm studies. J. Colloid Interface Sci. 2006, 300, 100–104. [Google Scholar] [CrossRef] [PubMed]
  4. Chandra, V.; Park, J.; Chun, Y.; Lee, J.W.; Hwang, I.-C.; Kim, K.S. Water-Dispersible Magnetite-Reduced Graphene Oxide Composites for Arsenic Removal. ACS Nano 2010, 4, 3979–3986. [Google Scholar] [CrossRef] [PubMed]
  5. Hanigan, D.; Zhang, J.; Herckes, P.; Krasner, S.W.; Chen, C.; Westerhoff, P. Adsorption ofN-Nitrosodimethylamine Precursors by Powdered and Granular Activated Carbon. Environ. Sci. Technol. 2012, 46, 12630–12639. [Google Scholar] [CrossRef] [PubMed]
  6. Zhang, Y.; Min, Q.; Wang, W.; He, L.; Zheng, J. Impact of household social-economic characteristics on the willingness to grow crops: A case study of jasmine growers in Fuzhou based on conservation of the agricultural heritage system. Zhongguo Shengtai Nongye Xuebao/Chin. J. Eco-Agric. 2016, 24, 1714–1721. [Google Scholar]
  7. Mohan, D.; Pittman, C.U.; Bricka, M.; Smith, F.; Yancey, B.; Mohammad, J.; Steele, P.H.; Alexandre-Franco, M.F.; Gómez-Serrano, V.; Gong, H.; et al. Sorption of arsenic, cadmium, and lead by chars produced from fast pyrolysis of wood and bark during bio-oil production. J. Colloid Interface Sci. 2007, 310, 57–73. [Google Scholar] [CrossRef] [PubMed]
  8. Chen, J.P.; Wu, S.; Chong, K.-H. Surface modification of a granular activated carbon by citric acid for enhancement of copper adsorption. Carbon 2003, 41, 1979–1986. [Google Scholar] [CrossRef]
  9. Rivera-Utrilla, J.; Sánchez-Polo, M.; Gómez-Serrano, V.; Álvarez, P.; Alvim-Ferraz, M.; Dias, J.M.; José, R.-U.; Alvarez, P.; Alvim-Ferraz, M.D.C. Activated carbon modifications to enhance its water treatment applications. An overview. J. Hazard. Mater. 2011, 187, 1–23. [Google Scholar] [CrossRef] [PubMed]
  10. Ma, Y.; Liu, W.-J.; Zhang, N.; Li, Y.-S.; Jiang, H.; Sheng, G.-P. Polyethylenimine modified biochar adsorbent for hexavalent chromium removal from the aqueous solution. Bioresour. Technol. 2014, 169, 403–408. [Google Scholar] [CrossRef] [PubMed]
  11. Zhang, F.; Wang, X.; Yin, D.; Peng, B.; Tan, C.; Liu, Y.; Tan, X.; Wu, S. Efficiency and mechanisms of Cd removal from aqueous solution by biochar derived from water hyacinth (Eichornia crassipes). J. Environ. Manag. 2015, 153, 68–73. [Google Scholar] [CrossRef] [PubMed]
  12. Crannell, B.S.; Eighmy, T.T.; Krzanowski, J.E.; Eusden, J.D., Jr.; Shaw, E.L.; Francis, C.A. Heavy metal stabilization in municipal solid waste combustion bottom ash using soluble phosphate. Waste Manag. 2000, 20, 135–148. [Google Scholar] [CrossRef]
  13. Seshadri, B.; Bolan, N.; Choppala, G.; Kunhikrishnan, A.; Sanderson, P.; Wang, H.; Currie, L.; Tsang, D.C.; Ok, Y.; Kim, G.; et al. Potential value of phosphate compounds in enhancing immobilization and reducing bioavailability of mixed heavy metal contaminants in shooting range soil. Chemosphere 2017, 184, 197–206. [Google Scholar] [CrossRef] [PubMed]
  14. Saleh, T.A.; Sulaiman, K.O.; Al-Hammadi, S.A.; Dafalla, H.; Danmaliki, G.I. Adsorptive desulfurization of thiophene, benzothiophene and dibenzothiophene over activated carbon manganese oxide nanocomposite: With column system evaluation. J. Clean. Prod. 2017, 154, 401–412. [Google Scholar] [CrossRef]
  15. Sánchez, M.; Lindao, E.; Margaleff, D.; Martínez, O.; Morán, A. Pyrolysis of agricultural residues from rape and sunflowers: Production and characterization of bio-fuels and biochar soil management. J. Anal. Appl. Pyrolysis 2009, 85, 142–144. [Google Scholar] [CrossRef]
  16. Lima, I.M.; Boykin, D.L.; Klasson, K.T.; Uchimiya, M. Influence of post-treatment strategies on the properties of activated chars from broiler manure. Chemosphere 2014, 95, 96–104. [Google Scholar] [CrossRef] [PubMed]
  17. Aliabadi, H.M.; Saberikhah, E.; Pirbazari, A.E.; Khakpour, R.; Alipour, H. Triethoxysilylpropylamine modified alkali treated wheat straw: An efficient adsorbent for methyl orange adsorption. Cellul. Chem. Technol. 2018, 52, 129–140. [Google Scholar]
  18. Edokpayi, J.N.; Odiyo, J.O.; Msagati, T.A.M.; Popoola, E.O. A Novel Approach for the Removal of Lead(II) Ion from Wastewater Using Mucilaginous Leaves of Diceriocaryum eriocarpum Plant. Sustainability 2015, 7, 14026–14041. [Google Scholar] [CrossRef]
  19. Imran, M.; Suddique, M.; Shah, G.M.; Ahmad, I.; Murtaza, B.; Shah, N.S.; Mubeen, M.; Ahmad, S.; Zakir, A.; Schotting, R.J. Kinetic and equilibrium studies for cadmium biosorption from contaminated water using Cassia fistula biomass. Int. J. Environ. Sci. Technol. 2018, 16, 3099–3108. [Google Scholar] [CrossRef]
  20. Babarinde, A.; Onyiaocha, G.O. Equilibrium sorption of divalent metal ions onto groundnut (Arachis hypogaea) shell: Kinetics, isotherm and thermodynamics. Chem. Int. 2016, 2, 37–46. [Google Scholar]
  21. Shah, G.M.; Nasir, M.; Imran, M.; Bakhat, H.F.; Rabbani, F.; Sajjad, M.; Farooq, A.B.U.; Ahmad, S.; Song, L.; Eroglu, E. Biosorption potential of natural, pyrolysed and acid-assisted pyrolysed sugarcane bagasse for the removal of lead from contaminated water. PeerJ 2018, 6, e5672. [Google Scholar] [CrossRef] [PubMed]
  22. Hesas, R.H.; Arami-Niya, A.; Daud, W.M.; Sahu, J.N. Preparation and Characterization of Activated Carbon from Apple Waste by Microwave-Assisted Phosphoric Acid Activation: Application in Methylene Blue Adsorption. BioResources 2013, 8, 2950–2966. [Google Scholar]
  23. Suárez-García, F.; Martínez-Alonso, A.; Tascón, J. Pyrolysis of apple pulp: Effect of operation conditions and chemical additives. J. Anal. Appl. Pyrolysis 2002, 62, 93–109. [Google Scholar] [CrossRef]
  24. Regmi, P.; Moscoso, J.L.G.; Kumar, S.; Cao, X.; Mao, J.; Schafran, G. Removal of copper and cadmium from aqueous solution using switchgrass biochar produced via hydrothermal carbonization process. J. Environ. Manag. 2012, 109, 61–69. [Google Scholar] [CrossRef] [PubMed]
  25. Jiang, Y.; Huo, X.; Zhu, Y.; Ji, H. Chemisorption and Physical Adsorption Roles in Cadmium Biosorption by Chlamydomonas Reinhardtii. Chin. J. Popul. Resour. Environ. 2010, 8, 54–58. [Google Scholar]
  26. Deng, Y.; Huang, S.; Laird, D.A.; Wang, X.; Dong, C. Quantitative mechanisms of cadmium adsorption on rice straw- and swine manure-derived biochars. Environ. Sci. Pollut. Res. 2018, 25, 32418–32432. [Google Scholar] [CrossRef] [PubMed]
  27. Tangjuank, S.; Insuk, N.; Tontrakoon, J.; Udeye, V. Adsorption of lead (II) and cadmium (II) ions from aqueous solutions by adsorption on activated carbon prepared from cashew nut shells. World Acad. Sci. Eng. Technol. 2009, 52, 110–116. [Google Scholar]
  28. Keiluweit, M.; Nico, P.S.; Johnson, M.G.; Kleber, M. Dynamic Molecular Structure of Plant Biomass-Derived Black Carbon (Biochar). Environ. Sci. Technol. 2010, 44, 1247–1253. [Google Scholar] [CrossRef] [Green Version]
  29. Azargohar, R.; Dalai, A. Steam and KOH activation of biochar: Experimental and modeling studies. Microporous Mesoporous Mater. 2008, 110, 413–421. [Google Scholar] [CrossRef]
  30. Prapagdee, S.; Piyatiratitivorakul, S.; Petsom, A. Activation of Cassava Stem Biochar by Physico-Chemical Method for Stimulating Cadmium Removal Efficiency from Aqueous Solution. Environ. Asia 2014, 7, 60–69. [Google Scholar]
  31. Takagi, H.; Maruyama, K.; Yoshizawa, N.; Yamada, Y.; Sato, Y. XRD analysis of carbon stacking structure in coal during heat treatment. Fuel 2004, 83, 2427–2433. [Google Scholar] [CrossRef]
  32. Liu, Y.; Zhao, X.; Li, J.; Ma, D.; Han, R. Characterization of bio-char from pyrolysis of wheat straw and its evaluation on methylene blue adsorption. Desalin. Water Treat. 2012, 46, 115–123. [Google Scholar] [CrossRef]
  33. Al-Degs, Y.; Elbarghouthi, M.; Elsheikh, A.; Walker, G. Effect of solution pH, ionic strength, and temperature on adsorption behavior of reactive dyes on activated carbon. Dye. Pigment. 2008, 77, 16–23. [Google Scholar] [CrossRef]
  34. Chen, X.; Chen, G.; Chen, L.; Chen, Y.; Lehmann, J.; McBride, M.B.; Hay, A.G. Adsorption of copper and zinc by biochars produced from pyrolysis of hardwood and corn straw in aqueous solution. Bioresour. Technol. 2011, 102, 8877–8884. [Google Scholar] [CrossRef]
  35. Chen, Z.; Liu, T.; Tang, J.; Zheng, Z.; Wang, H.; Shao, Q.; Chen, G.; Li, Z.; Chen, Y.; Zhu, J.; et al. Characteristics and mechanisms of cadmium adsorption from aqueous solution using lotus seedpod-derived biochar at two pyrolytic temperatures. Environ. Sci. Pollut. Res. 2018, 25, 11854–11866. [Google Scholar] [CrossRef] [PubMed]
  36. Usman, A.; Sallam, A.; Zhang, M.; Vithanage, M.; Ahmad, M.; Al-Farraj, A.; Ok, Y.S.; Abduljabbar, A.; Al-Wabel, M. Sorption process of date palm biochar for aqueous Cd (II) removal: Efficiency and mechanisms. Water Air Soil Pollut. 2016, 227, 449. [Google Scholar] [CrossRef]
  37. Ahmad, M.; Lee, S.S.; Dou, X.; Mohan, D.; Sung, J.-K.; Yang, J.E.; Ok, Y.S. Effects of pyrolysis temperature on soybean stover-and peanut shell-derived biochar properties and TCE adsorption in water. Bioresour. Technol. 2012, 118, 536–544. [Google Scholar] [CrossRef]
  38. Ahmad, M.; Moon, D.H.; Vithanage, M.; Koutsospyros, A.; Lee, S.S.; Yang, J.E.; Lee, S.E.; Jeon, C.; Ok, Y.S. Production and use of biochar from buffalo-weed (Ambrosia trifida L.) for trichloroethylene removal from water. J. Chem. Technol. Biotechnol. 2014, 89, 150–157. [Google Scholar] [CrossRef]
  39. Ahmad, I.; Akhtar, M.J.; Jadoon, I.B.K.; Imran, M.; Ali, S. Equilibrium modeling of cadmium biosorption from aqueous solution by compost. Environ. Sci. Pollut. Res. 2017, 24, 5277–5284. [Google Scholar] [CrossRef]
  40. Boudrahem, F.; Soualah, A.; Aissani-Benissad, F. Pb(II) and Cd(II) Removal from Aqueous Solutions Using Activated Carbon Developed from Coffee Residue Activated with Phosphoric Acid and Zinc Chloride. J. Chem. Eng. Data 2011, 56, 1946–1955. [Google Scholar] [CrossRef]
  41. Kołodyńska, D.; Wnetrzak, R.; Leahy, J.J.; Hayes, M.; Kwapinski, W.; Hubicki, Z. Kinetic and adsorptive characterization of biochar in metal ions removal. Chem. Eng. J. 2012, 197, 295–305. [Google Scholar] [CrossRef]
  42. Sallam, A.S.; Al-Omran, A.; El-Naggar, A.H.; Nadeem, M.; Al-Wabel, M.I.; Usman, A.R.; Alenazi, K.K. Chemically Modified Biochar Produced from Conocarpus Wastes: An Efficient Sorbent for Fe(II) Removal from Acidic Aqueous Solutions. Adsorpt. Sci. Technol. 2013, 31, 625–640. [Google Scholar]
  43. Jiang, K.; Sun, T.-H.; Sun, L.-N.; Li, H.-B. Adsorption characteristics of copper, lead, zinc and cadmium ions by tourmaline. J. Environ. Sci. 2006, 18, 1221–1225. [Google Scholar] [CrossRef]
  44. Guo, Z.; Liu, X.; Huang, H. Kinetics and Thermodynamics of Reserpine Adsorption onto Strong Acidic Cationic Exchange Fiber. PLoS ONE 2015, 10, e0138619. [Google Scholar] [CrossRef] [PubMed]
  45. Ge, X.; Wu, Z.; Manzoli, M.; Jicsinszky, L.; Wu, Z.; Nosyrev, A.E.; Cravotto, G. Adsorptive Recovery of Iopamidol from Aqueous Solution and Parallel Reuse of Activated Carbon: Batch and Flow Study. Ind. Eng. Chem. Res. 2019, 58, 7284–7295. [Google Scholar] [CrossRef]
  46. Kim, W.-K.; Shim, T.; Kim, Y.-S.; Hyun, S.; Ryu, C.; Park, Y.-K.; Jung, J. Characterization of cadmium removal from aqueous solution by biochar produced from a giant Miscanthus at different pyrolytic temperatures. Bioresour. Technol. 2013, 138, 266–270. [Google Scholar] [CrossRef]
  47. Lu, H.; Zhang, W.; Yang, Y.; Huang, X.; Wang, S.; Qiu, R. Relative distribution of Pb2+ sorption mechanisms by sludge-derived biochar. Water Res. 2012, 46, 854–862. [Google Scholar] [CrossRef]
  48. Inyang, M.; Gao, B.; Yao, Y.; Xue, Y.; Zimmerman, A.R.; Pullammanappallil, P.; Cao, X. Removal of heavy metals from aqueous solution by biochars derived from anaerobically digested biomass. Bioresour. Technol. 2012, 110, 50–56. [Google Scholar] [CrossRef]
  49. Salam, O.E.A.; Reiad, N.A.; Elshafei, M.M. A study of the removal characteristics of heavy metals from wastewater by low-cost adsorbents. J. Adv. Res. 2011, 2, 297–303. [Google Scholar] [CrossRef] [Green Version]
  50. Guo, W.; Xiong, W.; Gao, S.; Hu, Z.; Liu, H.; Yu, R. Impact of temperature on the isothermal adsorption/desorption of shale gas. Pet. Explor. Dev. 2013, 40, 514–519. [Google Scholar] [CrossRef]
  51. Sun, Y.; Gao, B.; Yao, Y.; Fang, J.; Zhang, M.; Zhou, Y.; Chen, H.; Yang, L. Effects of feedstock type, production method, and pyrolysis temperature on biochar and hydrochar properties. Chem. Eng. J. 2014, 240, 574–578. [Google Scholar] [CrossRef]
  52. Zhang, S.; Zhang, H.; Cai, J.; Zhang, X.; Zhang, J.; Shao, J. Evaluation and Prediction of Cadmium Removal from Aqueous Solution by Phosphate-Modified Activated Bamboo Biochar. Energy Fuels 2017, 32, 4469–4477. [Google Scholar] [CrossRef]
  53. Cui, X.; Fang, S.; Yao, Y.; Li, T.; Ni, Q.; Yang, X.; He, Z. Potential mechanisms of cadmium removal from aqueous solution by Canna indica derived biochar. Sci. Total. Environ. 2016, 562, 517–525. [Google Scholar] [CrossRef] [PubMed]
  54. Goswami, R.; Shim, J.; Deka, S.; Kumari, D.; Kataki, R.; Kumar, M. Characterization of cadmium removal from aqueous solution by biochar produced from Ipomoea fistulosa at different pyrolytic temperatures. Ecol. Eng. 2016, 97, 444–451. [Google Scholar] [CrossRef]
  55. Xu, X.; Cao, X.; Zhao, L.; Wang, H.; Yu, H.; Gao, B. Removal of Cu, Zn, and Cd from aqueous solutions by the dairy manure-derived biochar. Environ. Sci. Pollut. Res. 2013, 20, 358–368. [Google Scholar] [CrossRef] [PubMed]
  56. Li, F.; Shen, K.; Long, X.; Wen, J.; Xie, X.; Zeng, X.; Liang, Y.; Wei, Y.; Lin, Z.; Huang, W.; et al. Preparation and Characterization of Biochars from Eichornia crassipes for Cadmium Removal in Aqueous Solutions. PLoS ONE 2016, 11, 0148132. [Google Scholar] [CrossRef] [PubMed]
  57. Trakal, L.; Bingöl, D.; Pohořelý, M.; Hruška, M.; Komárek, M. Geochemical and spectroscopic investigations of Cd and Pb sorption mechanisms on contrasting biochars: Engineering implications. Bioresour. Technol. 2014, 171, 442–451. [Google Scholar] [CrossRef] [PubMed]
  58. Han, X.; Liang, C.-F.; Li, T.-Q.; Wang, K.; Huang, H.-G.; Yang, X.-E. Simultaneous removal of cadmium and sulfamethoxazole from aqueous solution by rice straw biochar. J. Zhejiang Univ. Sci. B 2013, 14, 640–649. [Google Scholar] [CrossRef] [PubMed] [Green Version]
  59. Yakkala, K.; Yu, M.-R.; Roh, H.; Yang, J.-K.; Chang, Y.-Y. Buffalo weed (Ambrosia trifida L. var. trifida) biochar for cadmium (II) and lead (II) adsorption in single and mixed system. Desalin. Water Treat. 2013, 51, 7732–7745. [Google Scholar] [CrossRef]
Figure 1. Schematic representation of column scale experiments in laboratory for the removal of Cd from water using wheat straw biochar (WSB) and acid treated wheat straw biochar (AWSB).
Water 11 01438 g001
Figure 2. Fourier Transform Infrared (FTIR) spectra of Cd loaded and unloaded wheat straw biochar (WSB, (A)) and acid activated wheat straw biochar (AWSB, (B)); Scanning electron microscopy (SEM) images of WSB (C) and AWSB (D).
Water 11 01438 g002
Figure 3. X-ray diffraction (XRD) patterns of wheat straw biochar (A) and acid activated wheat straw biochar (B) used for the removal of Cd from contaminated water.
Water 11 01438 g003
Figure 4. Adsorption and removal of Cd from contaminated water at different adsorbent dosage of wheat straw biochar (WSB; (A)) and acid activated wheat straw biochar (AWSB; (B)), solution pH of WSB (C), and AWSB (D); contact time (5–180 min; (E) and initial Cd concentrations of solution (5–100 mg/L; (F) amended with WSB (2 g/L) and AWSB (1 g/L).
Water 11 01438 g004
Figure 5. Removal of Cd at laboratory scale column experiments by WSB (a) and with AWSB (b) having different initial concentrations of Cd (25, 50 and 100 mg/L) in response to WSB and AWSB dose (5 g/column).
Water 11 01438 g005
Table 1. Various properties of wheat straw biochar (WSB) and acid wheat straw biochar (AWSB).
ParametersWSBAWSB
Moisture %5.83 ± 0.184.25 ± 0.25
Volatile matters %23.23 ± 0.2541.50 ± 0.50
Fixed carbon %64.43 ± 0.7144.30 ± 0.50
Ash content %12.50 ± 0.5014.23 ± 0.25
C (mg/g)74.27 ± 0.7068.23 ± 0.55
H (mg/g)5.90 ± 0.182.17 ± 0.30
O (mg/g)14.48 ± 0.5025.50 ± 0.50
P (mg/g)0.54 ± 0.113.69 ± 0.20
K (mg/g)10.43 ± 0.250.30 ± 0.20
Ca (mg/g)8.95 ± 0.203.82 ± 0.20
Mg (mg/g)4.01 ± 0.201.25 ± 0.25
S (mg/g)0.63 ± 0.130.31 ± 0.20
Na (mg/g)0.97 ± 0.130.12 ± 0.08
Fe (mg/g)8.20 ± 0.206.24 ± 0.25
pH7.95 ± 0.103.7 ± 0.13
SBET (m2/g)207.33 ± 12.01471.67 ± 17.56
Vt (cm3/g)0.12 ± 0.040.45 ± 0.05
Dp (nm)5.94 ± 0.2211.25 ± 0.25
Table 2. Parameters of adsorption isotherm models at constant temperature (room temperature), pH 6 and optimum dose of WSB (dosage = 2 g/L) and AWSB (dosage = 1 g/L).
ModelsLangmuirFreundlichTemkinDubinin-Radushkevich
ParametersKLQmaxR2KFnR2KTBR2qmkDRER2
WSB0.87131.650.8493.461.870.9821.92478.30.85613.330.2471.40.694
AWSB0.27174.630.96715.952.370.99612.55255.90.87032.790.0383.60.689
Table 3. Parameters of kinetic models at initial Cd concentration (25 mg/L), constant temperature (room temperature), pH 6 and optimum dose of WSB (dosage = 2 g/L) and AWSB (dosage = 1 g/L).
ModelsPseudo-First OrderPseudo-Second OrderIntra-Particle DiffusionElovich
Parametersk1qeR2k2qeR2kdifCR2αβR2
WSB0.23911.950.8030.002516.180.9870.5455.540.7254.490.6580.879
AWSB0.51426.380.7430.003034.840.9961.1015.380.5505.050.3560.725
Table 4. Comparative analysis of sorption capacity (mg/g) of various plant-based biochars.
FeedstockQmaxReference
Water hyacinth70.30[11]
KOH activated Cassava stem24.88[30]
Cassava stem10.46[30]
Peanut shells32.00[37]
Phosphate modified activated bamboo202.55[52]
Bamboo24.95[52]
Canna indica188.80[53]
Ipomoea fistulosa41.67–72.43[54]
Dairy manure 54.60[55]
Eichornia Crassipes49.84[56]
Wheat straw45.00[57]
Grape husk29.20[57]
Rice straw34.13[58]
Buffalo weed11.63[59]
Wheat straw 31.65–74.63Present study

