Spatial Error Distribution and Error Cause Analysis of TMPA-3B42V7 Satellite-Based Precipitation Products over Mainland China


1
School of Civil Engineering and Transportation, South China University of Technology, Guangzhou 510641, China
2
State Key Lab of Subtropical Building Science, South China University of Technology, Guangzhou 510641, China
3
Guangdong Engineering Technology Research Center of Safety and Greenization for Water Conservancy Project, Guangzhou 510641, China
*
Author to whom correspondence should be addressed.
Water 2019, 11(7), 1435; https://doi.org/10.3390/w11071435
Submission received: 12 May 2019
/
Revised: 5 July 2019
/
Accepted: 8 July 2019
/
Published: 12 July 2019
(This article belongs to the Section Hydrology)
Abstract
:With a high spatial resolution and wide coverage, satellite-based precipitation products have compensated for the shortcomings of traditional measuring methods based on rain gauge stations, such as the sparse and uneven distribution of rain gauge stations. However, the accuracy of satellite precipitation products is not high enough in some areas, and the causes of their errors are complicated. In order to better calibrate and apply the product’s data, relevant research on this kind of product is required. Accordingly, this study investigated the spatial error distribution and spatial influence factors of the Tropical Rainfall Measuring Mission (TRMM) Multi-Satellite Precipitation Analysis (TMPA) post-process 3B42V7 (hereafter abbreviated as 3B42V7) data over mainland China. This study calculated accuracy indicators based on the 3B42V7 data and daily precipitation data from 797 rain gauge stations across mainland China over the time range of 1998–2012. Then, a clustering analysis was conducted based on the accuracy indicators. Moreover, the geographical detector (GD) was used to perform the error cause analysis of the 3B42V7. The main findings of this study are the following. (1) Within mainland China, the 3B42V7 data accuracy decreased gradually from the southeast coast to the northwest inland, and shows a similar distribution for precipitation. High values of systematic error (>1.0) is mainly concentrated in the southwest Tibetan Plateau, while high values of random error (>1.0) are mainly concentrated around the Tarim Basin. (2) Mainland China can be divided into three areas by the spectral clustering method. It is recommended that the 3B42V7 can be effectively used in Area I, while in Area III the product should be calibrated before use, and the product in Area II can be used after an applicability study. (3) The GD result shows that precipitation is the most important spatial factor among the seven factors influencing the spatial error distribution of the 3B42V7 data. The relationships between spatial factors are synergistic rather than individual when influencing the product’s accuracy.
1. Introduction
Precipitation data availability has been highlighted as a major constraint on the effective application of the hydrological model, and it has been argued that the quality of the precipitation data inputs to the model is often more important than the choice of model itself [1]. Currently, there are two common ways to collect precipitation data. One is the traditional direct measuring method based on ground rain gauge stations. This type of data plays an important part in documenting the characteristics of precipitation over global land areas, and the regional precipitation data are usually obtained by spatial interpolation. However, due to the characteristic spatial uncertainty of precipitation and the sparse and uneven distribution of rain gauge stations on the land’s surface, it is generally difficult to satisfy the quality requirements of precipitation data for spatial distribution in some areas where precipitation data is obtained by this method [2,3]. The other way is the indirect measuring method based on sensor and data assimilation technology, such as precipitation radar and satellite-based remote sensing technology. Especially for a series of satellite-based precipitation products developed in recent years, this method effectively compensates for the deficiencies of the spatial continuity of the conventional measuring method based on rain gauge stations [4]. With a larger coverage and higher spatiotemporal resolution, this method satisfies demands for the spatial distribution of precipitation data and could provide data references for some areas lacking rain gauge stations.
During recent decades, a series of satellite-based precipitation products have been released and applied, such as the Climate Prediction Center Morphing (CMORPH) technique product [5], the Integrated Multi-Satellite Retrievals for Global Precipitation Measurement (IMERG) [6], the Precipitation Estimation from Remotely Sensed Information using Artificial Neural Networks (PERSIANN) [7] and the Tropical Rainfall Measuring Mission (TRMM) Multi-satellite Precipitation Analysis (TMPA) [8]. Among the satellite-based precipitation products, the TMPA-3B42 product exhibits excellent comprehensive performance and is considered as one of the best products [9,10,11,12]. This data product actually consists of two products, namely the near-real-time TMPA-3B42RT product (hereafter abbreviated 3B42RT) and the post-process TMPA-3B42 product. Currently, the latest updated Version 7 of the post-process TMPA-3B42 product was released [13] with verified higher accuracy and reliability than previous versions [14,15]. The 3B42V7 is a daily precipitation product that incorporates several kinds of observations, such as the Precipitation Radar (PR), Visible and InfraRed Scanner (VIRS), TRMM Microwave Imager (TMI), Cloud and Earth Radiant Energy Sensor (CERES) and Lightning Imaging Sensor (LIS). The product features a spatial resolution of 0.25° × 0.25° over the 50° N–S global latitude band, a time range beginning on 1 January 1998 and a 3-h highest temporal resolution [8,13]. However, the accuracy of satellite-based precipitation data in some areas is still not high enough, which somewhat limits the application of such data. Therefore, the evaluation and improvement of the accuracy for such satellite-based precipitation data has become a hot topic. In the past few decades, numerous relevant studies have been conducted in many regions, including Brazil [16], Peru [17], Central Asia [18], USA [19,20], Africa [21], etc.
As is widely known, China is a vast territory with a variety of typical landform and climate characteristics. Therefore, the evaluation and application of the TMPA-3B42’s accuracy in China has attracted considerable attention. The accuracy and the applicability of the TMPA-3B42 product has been examined not only at the national scale [22,23,24,25,26,27,28,29], but also at the regional scale. For example, in the southeast of China [30,31,32], southwest China [33,34,35], northeast China [36,37], northwest China [38,39,40,41], and other regions [42,43,44,45]. In the above studies, the comparisons of rain gauge station data and precipitation product data were widely used as the key methods for evaluation. In addition, many studies have found that the accuracy and applicability of TMPA-3B42 products is not always satisfactory in certain areas due to their unique topography, climate, latitude and longitude. Therefore, some studies have performed an error cause analysis of the TMPA. For example, a study in the Ganjiang River basin found that the accuracy of the TMPA-3B42 has a certain relationship with topography, and the accuracy in mountainous area is relatively low [46]. Taking the arid southern Tibetan Plateau as an example, Xu et al. [47] reached a similar conclusion by analyzing the dependence of the performance of 3B42V7 on topography and rainfall intensity. Another study also showed that slope has a greater impact on the quality of the product data compared with elevation, by verifying the accuracy of the Tropical Rainfall Measuring Mission 3B43 (TRMM-3B43) in the Lancang River Basin [48]. In addition, the inter-comparison between the high-and low-latitude basins revealed that 3B42V7 still has much room for improvement at high latitudes [36].
Summing up the above findings, we established that there are sufficient studies that explored the applicability and hydrological utility of 3B42V7 in local areas in China with different topographical and climatic conditions, and concluded that the product accuracy is closely related to geographical factors and spatial effects like topography and terrain, longitude and latitude. However, the findings in local areas have obvious regional characteristics due to the relatively small study area, which also caused a fragmented knowledge on the entirety China on this topic. As a result, studies on the spatial error distribution of 3B42V7 at the national scale in China are relatively scarce. Additionally, few studies using geographical detectors (GDs) to perform quantitative analysis about the effect of spatial influence factors on 3B42V7 data accuracy have been reported. Also, the interaction of various spatial influence factors on product accuracy needs further exploration.
Therefore, the major objectives of this study are the following: (1) to study the spatial error distribution in mainland China using the 3B42V7 data as the research data set and eight statistical parameters as accuracy evaluation indicators; (2) to use the spectral clustering method to divide the area with similar accuracy according to the accuracy indicators, and then propose the corresponding usage recommendations for the areas with similar accuracy; (3) explore the cause of spatial error distribution by using GD. This study can provide a reference for research on the evaluation, calibration, and application of the 3B42V7 in mainland China.
2. Study Area and Dataset
2.1. Study Area
The territory of China spans nearly 50 degrees of latitude from north to south (3°31″ N–53°33′ N) and over 62 degrees of longitude from west to east (135°2′30″ E–73°30′ E). Nearly all the areas in mainland China are included in the coverage region of 3B42V7 (below 50° N). Located in eastern Asia, this study area has a wide variety of topographic features and its mountains and plateaus cover a vast area. The topography of the study area appears to have a ladder-like distribution from west to east and can generally be divided into three levels. The first ladder, with an average altitude of above 4000 m, consists mainly of the Tibetan Plateau, and its climate is basically an alpine highland climate. The second ladder, with an average altitude of 1000–2000 m, consists predominantly of basins and plateaus and various climates including mainly alpine plateau climates, temperate continental climates, temperate monsoon climates, and subtropical monsoon climates. The third ladder is mostly below 500 m and consists mainly of plains and hills with various climates including mainly tropical monsoon climates, subtropical monsoon climates, and temperate monsoon climates. Generally, the monsoon climate in the study area is significant and most areas belong to temperate continental monsoon climates.
2.2. Dataset
In this study, the daily precipitation data from 812 rain gauge stations over mainland China archived by the China Meteorological Administration (CMA) for 15 years (from 1998 to 2012) was collected as the benchmark precipitation data. After removing incomplete data sequences or areas not covered by 3B42V7, data from a total of 797 stations (Figure 1) are still available. The rain gauge stations are generally sparsely distributed in the western mountains and deserts of China, but are considerably denser at low elevations in the eastern part. These precipitation data had been subjected to a series of quality controls, including examining extreme values and internal consistency checks (e.g., duplicate data and position, incorrect units, and data coding, etc.), and removal of questionable data. This data set was used as the reference data.
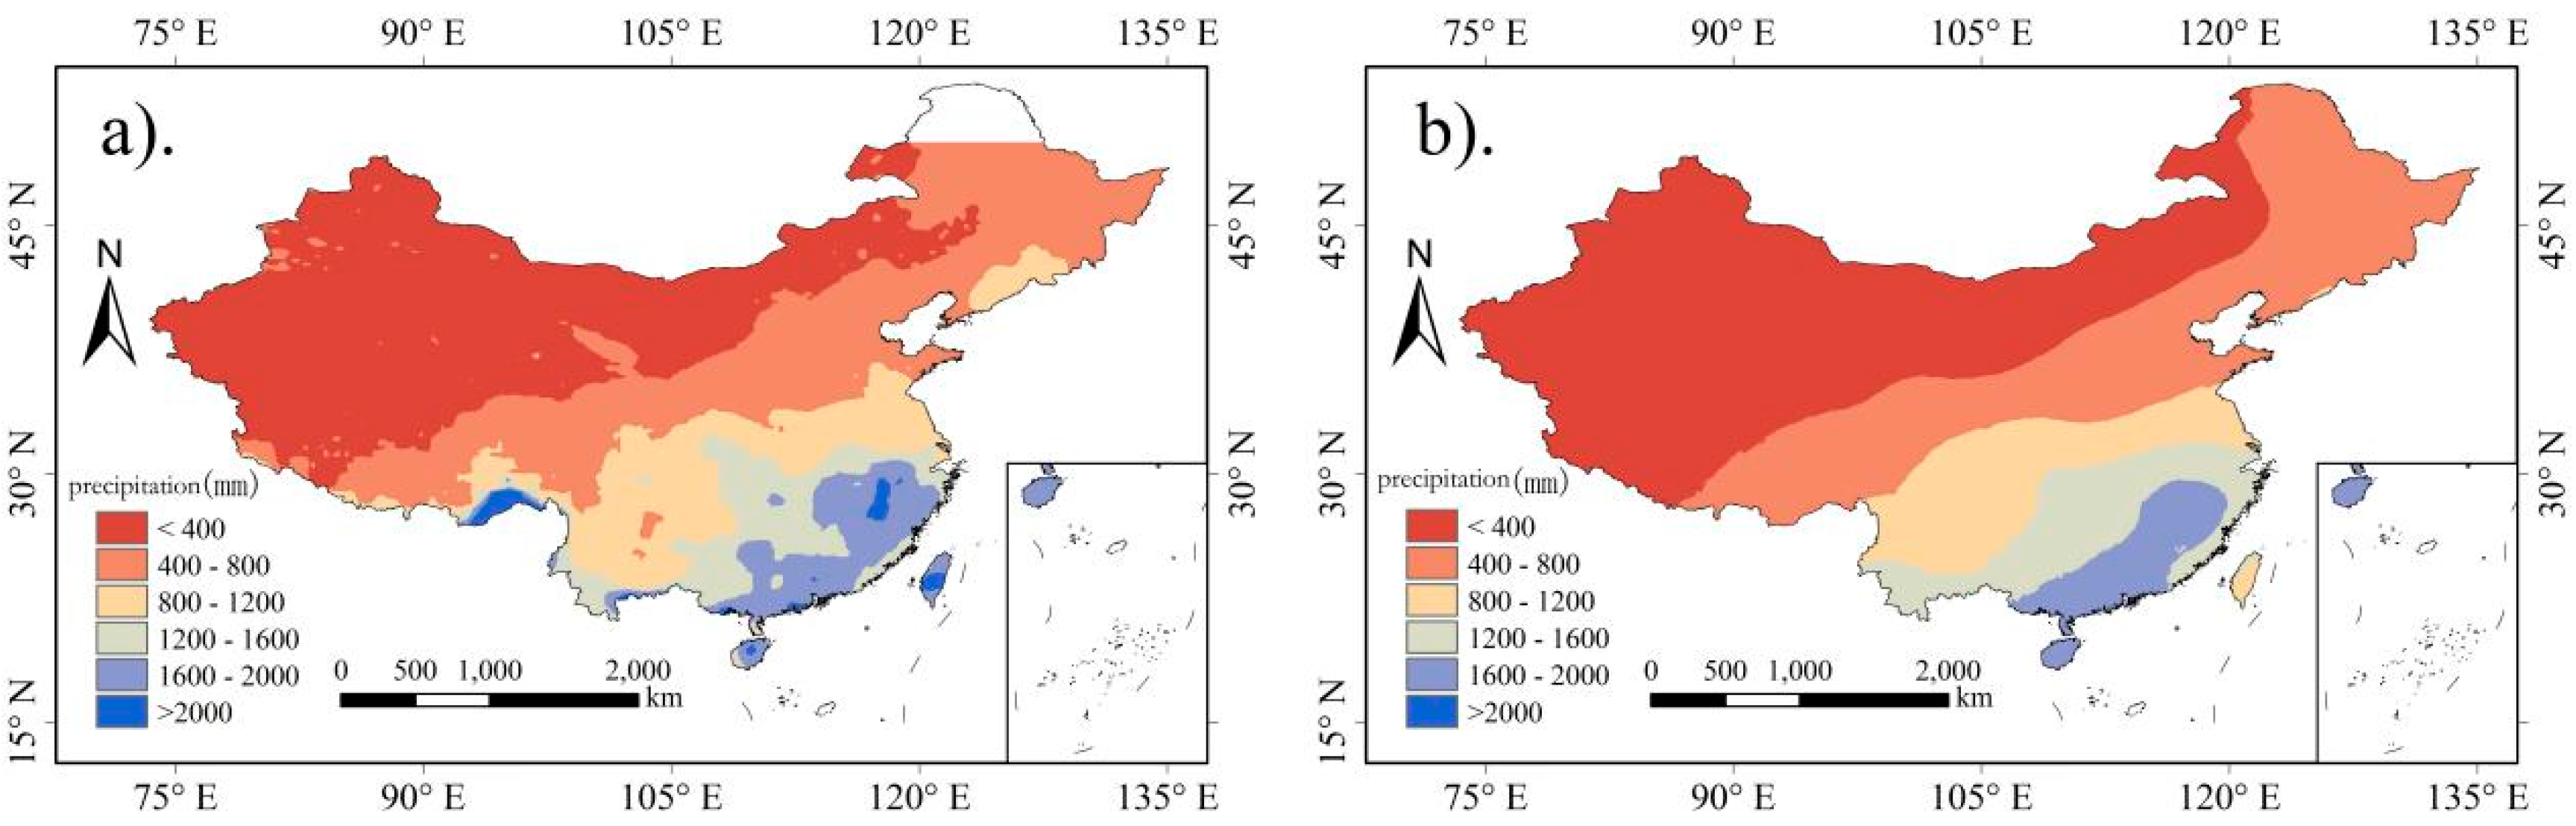
We collected the daily precipitation data extracted from the 3B42V7 data which can be downloaded from the following NASA website (https://pmm.nasa.gov/data-access/downloads/trmm). The 3B42V7 data also includes the corresponding sequences from 1998 to 2012 for 15 years. These data have a spatial resolution of 0.25° × 0.25° over the 50° N–S global latitude band, a time range beginning on 1 January 1998 and a 3-h highest temporal resolution. The rain gauge station data is completely independent of the 3B42V7 data, because the rain gauge station data is directly measured by rain gauges while the 3B42V7 data is generated by sensor and data assimilation technology. The spatial distribution of the annual average precipitation is shown in Figure 2.
The Digital Elevation Model (DEM) data was used to extract geographical factors, such as elevation, slope, slope direction, longitude, latitude, terrain complexity, aspect and the annual average precipitation. The DEM data on mainland China (Figure 1) with a 1-km resolution is released by the United States Geological Survey (USGS, Reston, VA, USA).
3. Methodology
3.1. Accuracy Evaluation Indicator
This study calculated accuracy indicators based on the rain gauge station data and the precipitation data extracted from the 3B42V7 data set from the rain gauge station grid from 1998 to 2012. The accuracy evaluation indicators can be divided into the following three categories:
- (1)
- Correlation indicators: they are used to measure the similarity between the 3B42V7 data and ground rain gauge stations. The Pearson correlation coefficient R is used as an indicator here.
- (2)
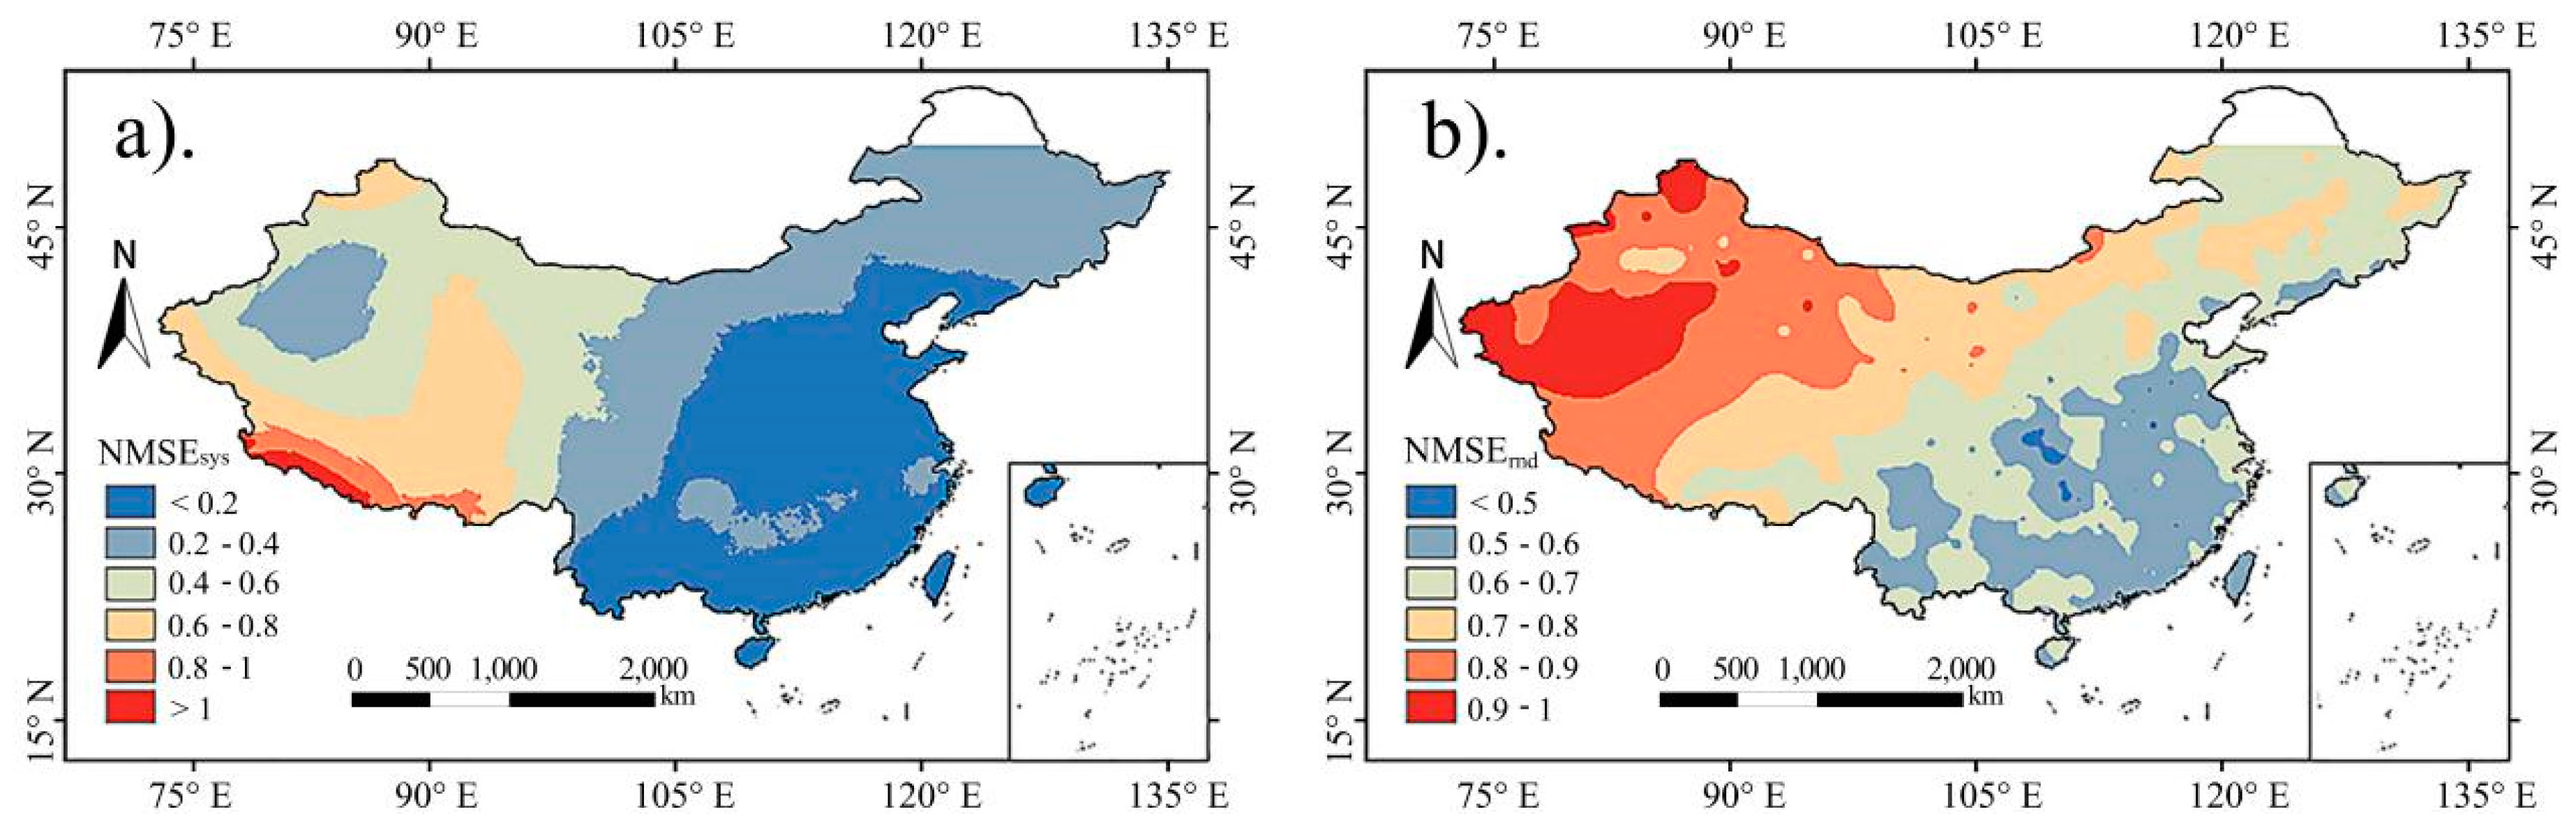
- Error indicators: in order to measure the deviation from the total rainfall of the 3B42V7 data, the absolute bias (BABS) was selected as the indicator. For the error measurement during the calculation process, precipitation has a strong positive correlation with the mean square error (MSE) and root-mean-square error (RMSE) [49], thus it is difficult to reflect the true situation of the error in China. Therefore, the normalized mean square error (NMSE) was adopted as the indicator [50,51]. The NMSE represents the ratio of the deviation of the estimation error from the observation. When the NMSE is greater than 1, it can be considered that the advisability of product estimation is inferior to that of the rain gauge station observation [49]. Considering the systematic and random components of the error in the TMPA-3B42 product [52], we adopted the systematic normalized mean square error () and the random normalized mean square error () as the error indicators in this study. The systematic and random errors are large when the and are greater than one. The systematic and random errors are the quantification of uncertainties of satellite precipitation products. The larger the random component of the error is, the greater the uncertainty of the TMPA-3B42. Generally, the uncertainty of products is caused by sensor error, retrieval error, spatial and temporal sampling and other factors. In this study, the calculations and decomposition of the and refer to those previously reported in the research [53].
- (3)
- Forecast capacity indicators: this type of indicator can be used to assess the ability to identify whether a daily precipitation event has occurred. In this study, several widely used statistical indices were selected to quantitatively identify whether a daily precipitation event has occurred, including the probability of detection (POD), false alarm ratio (FAR) [54] and Heidke’s skill score (HSS) [46]. The POD reflects the degree of omission of the 3B42V7 data for precipitation events ranging from 0 at the good end to 1 at the poor end. The FAR reflects the degree of false reporting of the product data ranging from 0 at the good end to 1 at the poor end. The HSS reflects the comprehensive ability to recognize the occurrence of precipitation events from the product data, representing the accuracy of the product data prediction compared to random forecasts.
The R, NMSE, and are correspondingly calculated at the daily and monthly scales, and the other indicators are only calculated at the daily scale. The formulas to calculate the above-mentioned indices are listed in the Table 1.
3.2. Spectral Clustering Method
The spectral clustering method [55,56], a kind of clustering method based on spectral graph theory [57], was used to regionally divide the rain gauge stations in mainland China according to the accuracy indicators. The main steps of spectral clustering are as follows. First, a data point set is treated as a vertex of a weighted undirected graph structure, and the weight of each side in the weighted undirected graph structure is the similarity between points. Using the similarity between all points, we can obtain the adjacency matrix of the weighted undirected graph. After calculating the sum of the elements of each row of the adjacent matrix, we can obtain a diagonal matrix called the degree matrix. Second, the degree matrix and adjacency matrix are combined to calculate the Laplace matrix and extract the eigenvectors and eigenvalues. Third, the eigenvectors corresponding to the minimum k eigenvalues are partitioned [58]. The spectral clustering method was originally used as an image processing method [59]. It was later extended as a new unsupervised learning method to other fields, such as speech recognition [60], biology [61], geoinformatics [62], process control [63], etc. Compared with conventional clustering methods, like K-means and hierarchical clustering, the spectral clustering method can cluster on the sample space of arbitrary shapes and converge results to the global optimal solution. Generally, this method has a better performance with various kinds of data sets [58].
Currently, the spectral clustering method is fully implemented in MATLAB, Python, R and other platforms. The Speccalt package in the R platform was used in this study (https://CRAN.R-project.org/package=speccalt).
3.3. Geographical Detector
In order to investigate the causes of the spatial error distribution of the product, the GD is used to detect the relationship between the 3B42V7 data accuracy and the various spatial influencing factors. The GD, released by Wang et al. [64,65] is a new statistical method used to detect the spatial stratified heterogeneity and determine the driving factors among the factors. With no linear hypothesis, this method has an elegant form and definite physical meaning. It was originally used to investigate the mechanism of geographical influencing factors on disease risk. The GD can be used to measure spatial stratified heterogeneity, detect explanatory factors and analyze interactions between variables. In view of its advantages, this method has already been applied in many fields of natural and social sciences, such as landscape ecology [66], land utilization [67], urban and rural planning [68], etc. In this study, we used GD to study the effects of the spatial influencing factors on the research indicators.
There are four kinds of GDs, namely the Rick detector, factor detector, ecological detector and interaction detector. In this study, we used the factor detector and interaction detector to analyze the main spatial influencing factors influencing the 3B42V7 data accuracy and the interaction of various factors. The main feature of the factor detector is that it discretizes each spatial influence factor into different levels and calculates the variance of the accuracy indicator at the different levels of each factor. The equation of model is as follows:
where is the influencing power of the indicator of the spatial influencing factor D on the accuracy indicator I; , and are the total number of samples and the variance of the accuracy indicators, respectively; m is the number of the level of factor D; , and are the total number of samples and the variance of accuracy indicator I in the level l of factor D, respectively. The value of is between 0 and 1, and the larger the value is, the more significant the influence of factor D is on the accuracy indicator I.
The main step of the interaction detector is to calculate the indicator between the two kinds of different influence factors and the indicator of each factor, and then compare the two indicators to determine whether its effect on the accuracy of the product indicators is one of mutual enhancement or mutual weakening. According to the formulas and the specific methods in the study of Wang et al. [64,65], we wrote a computing program in R language to implement the computing task. The specific methods are as follows:
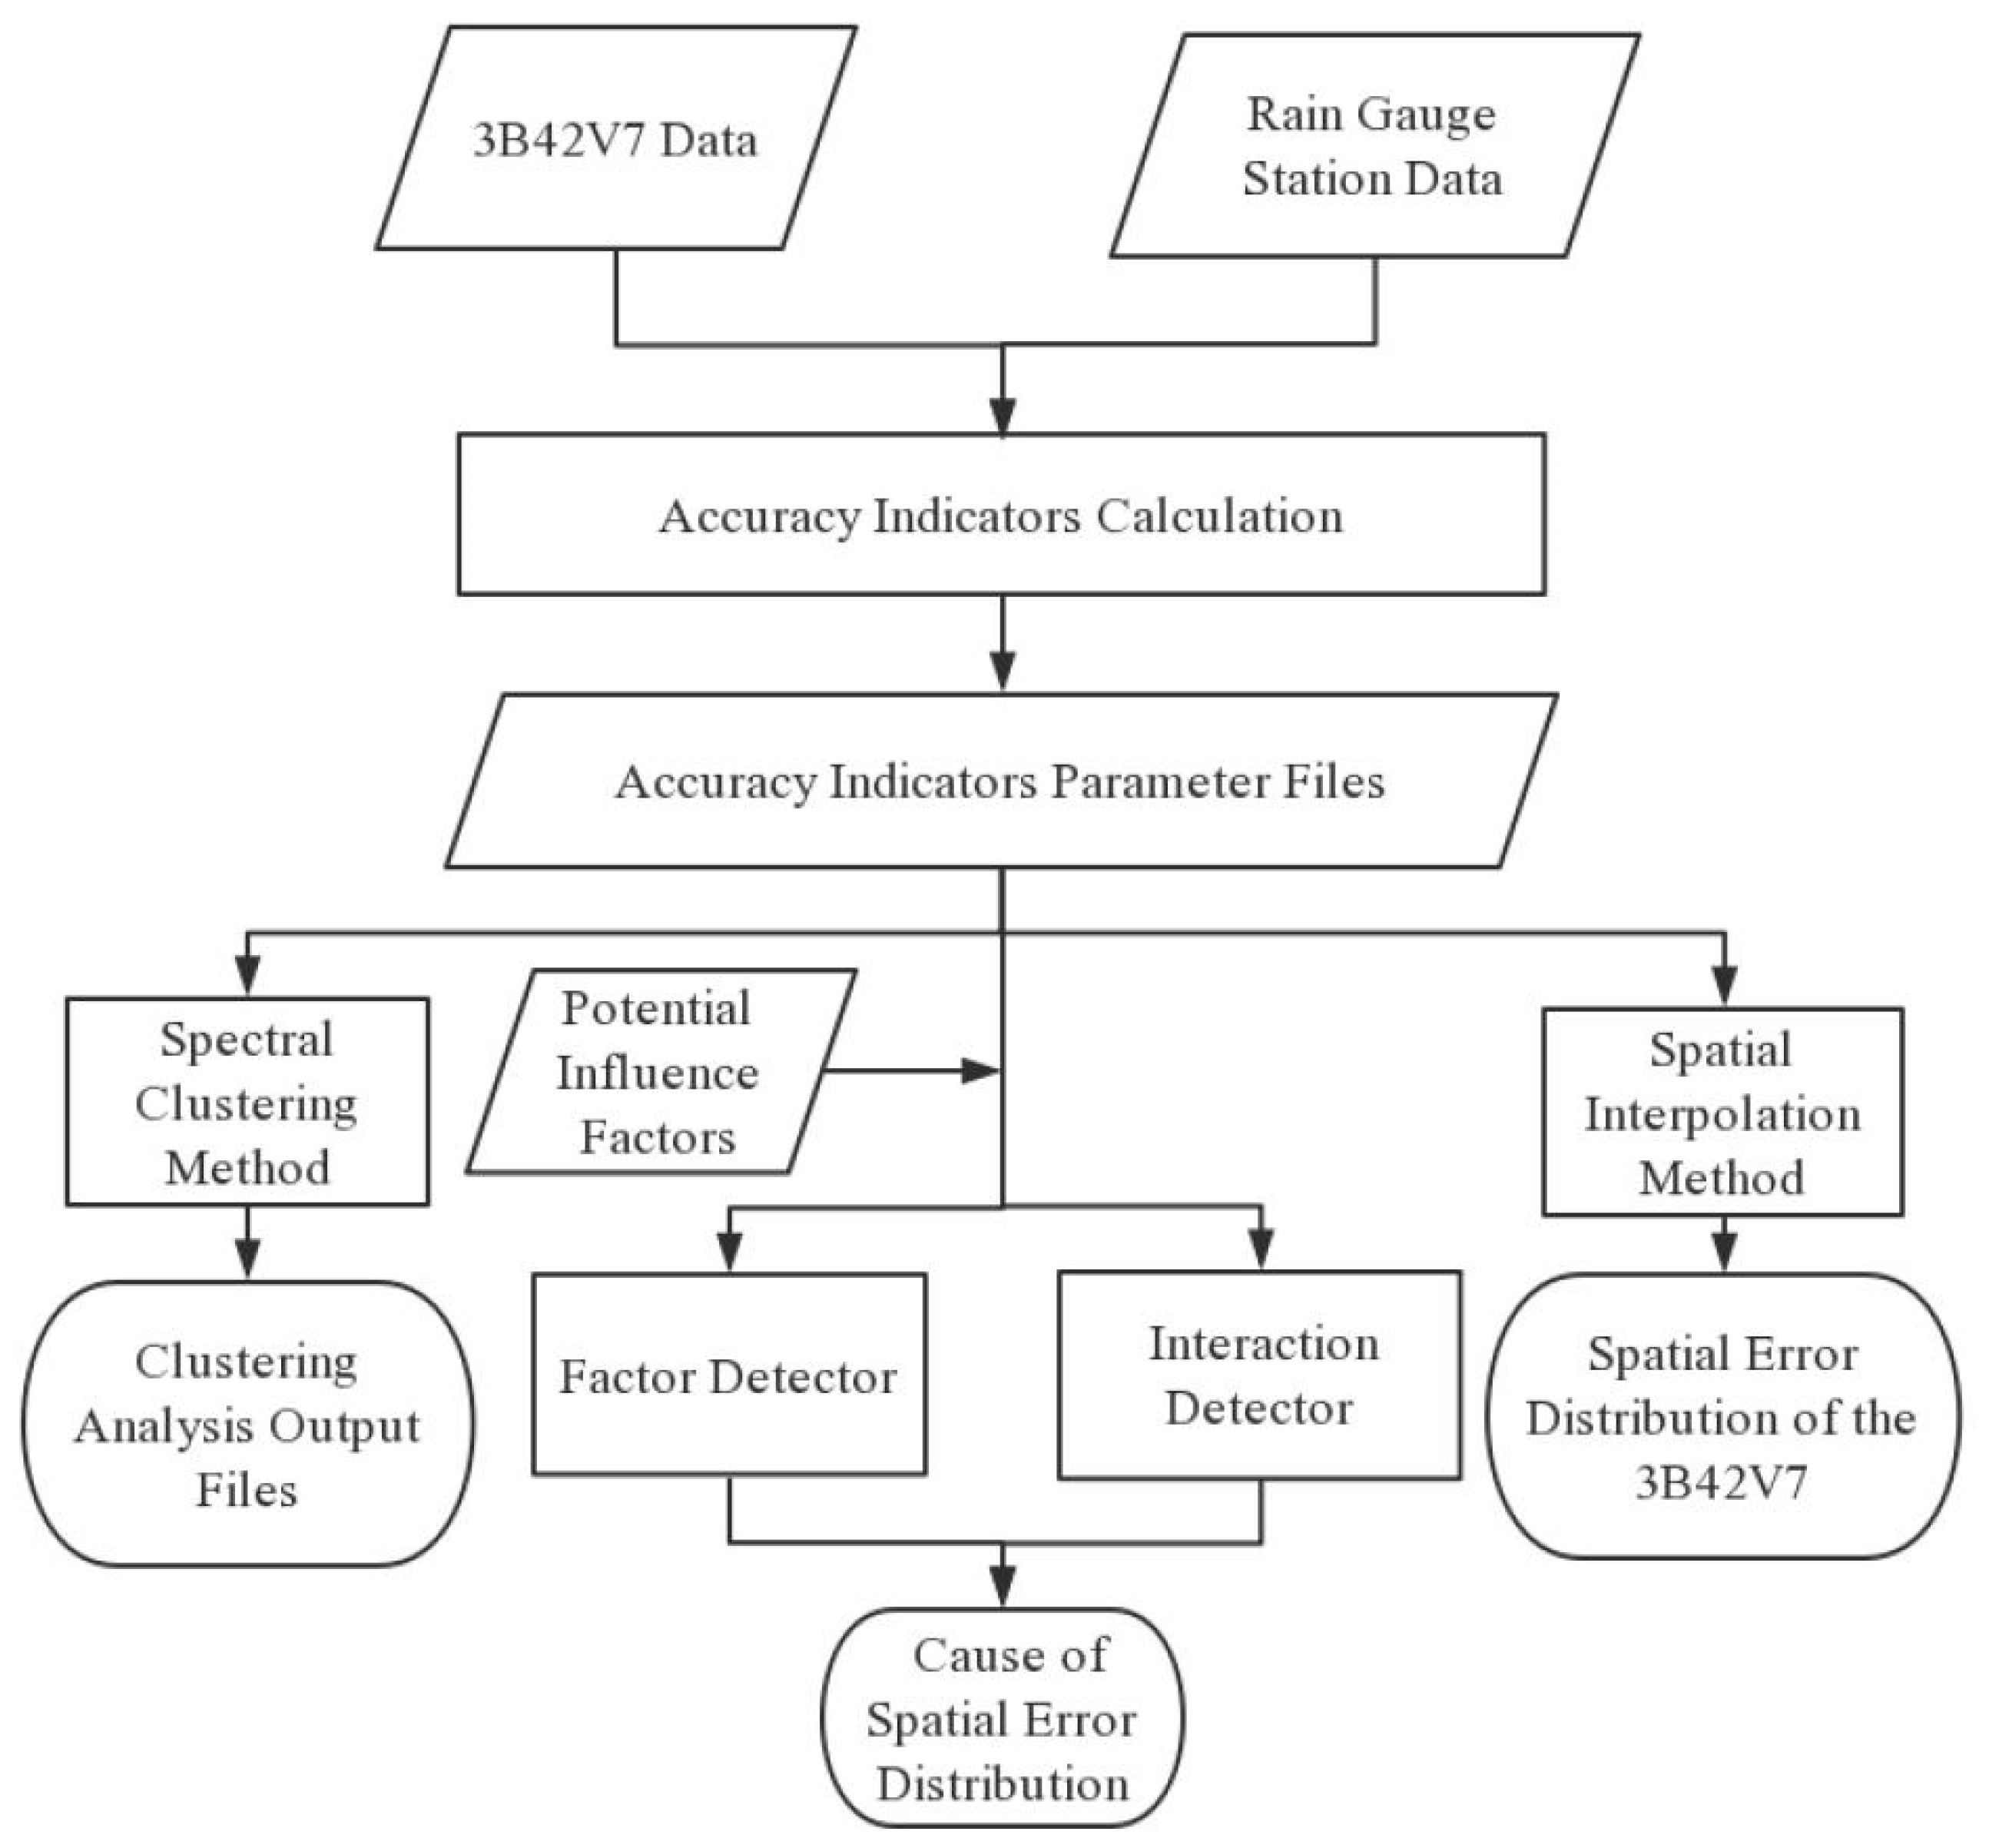
We then could obtain the spatial error distribution over mainland China and explore the error cause of TMPA-3B42V7 satellite-based precipitation products by using the above-mentioned methodologies. The flow chart of the research process is shown in Figure 3.
4. Results and Analysis
4.1. The Spatial Error Distribution of the 3B42V7
Based on the 3B42V7 data and rain gauge station data, we calculated the accuracy indicators and then obtained the spatial distribution of each indicator using the spatial interpolation method, as shown in Figure 4, Figure 5, Figure 6, Figure 7 and Figure 8.
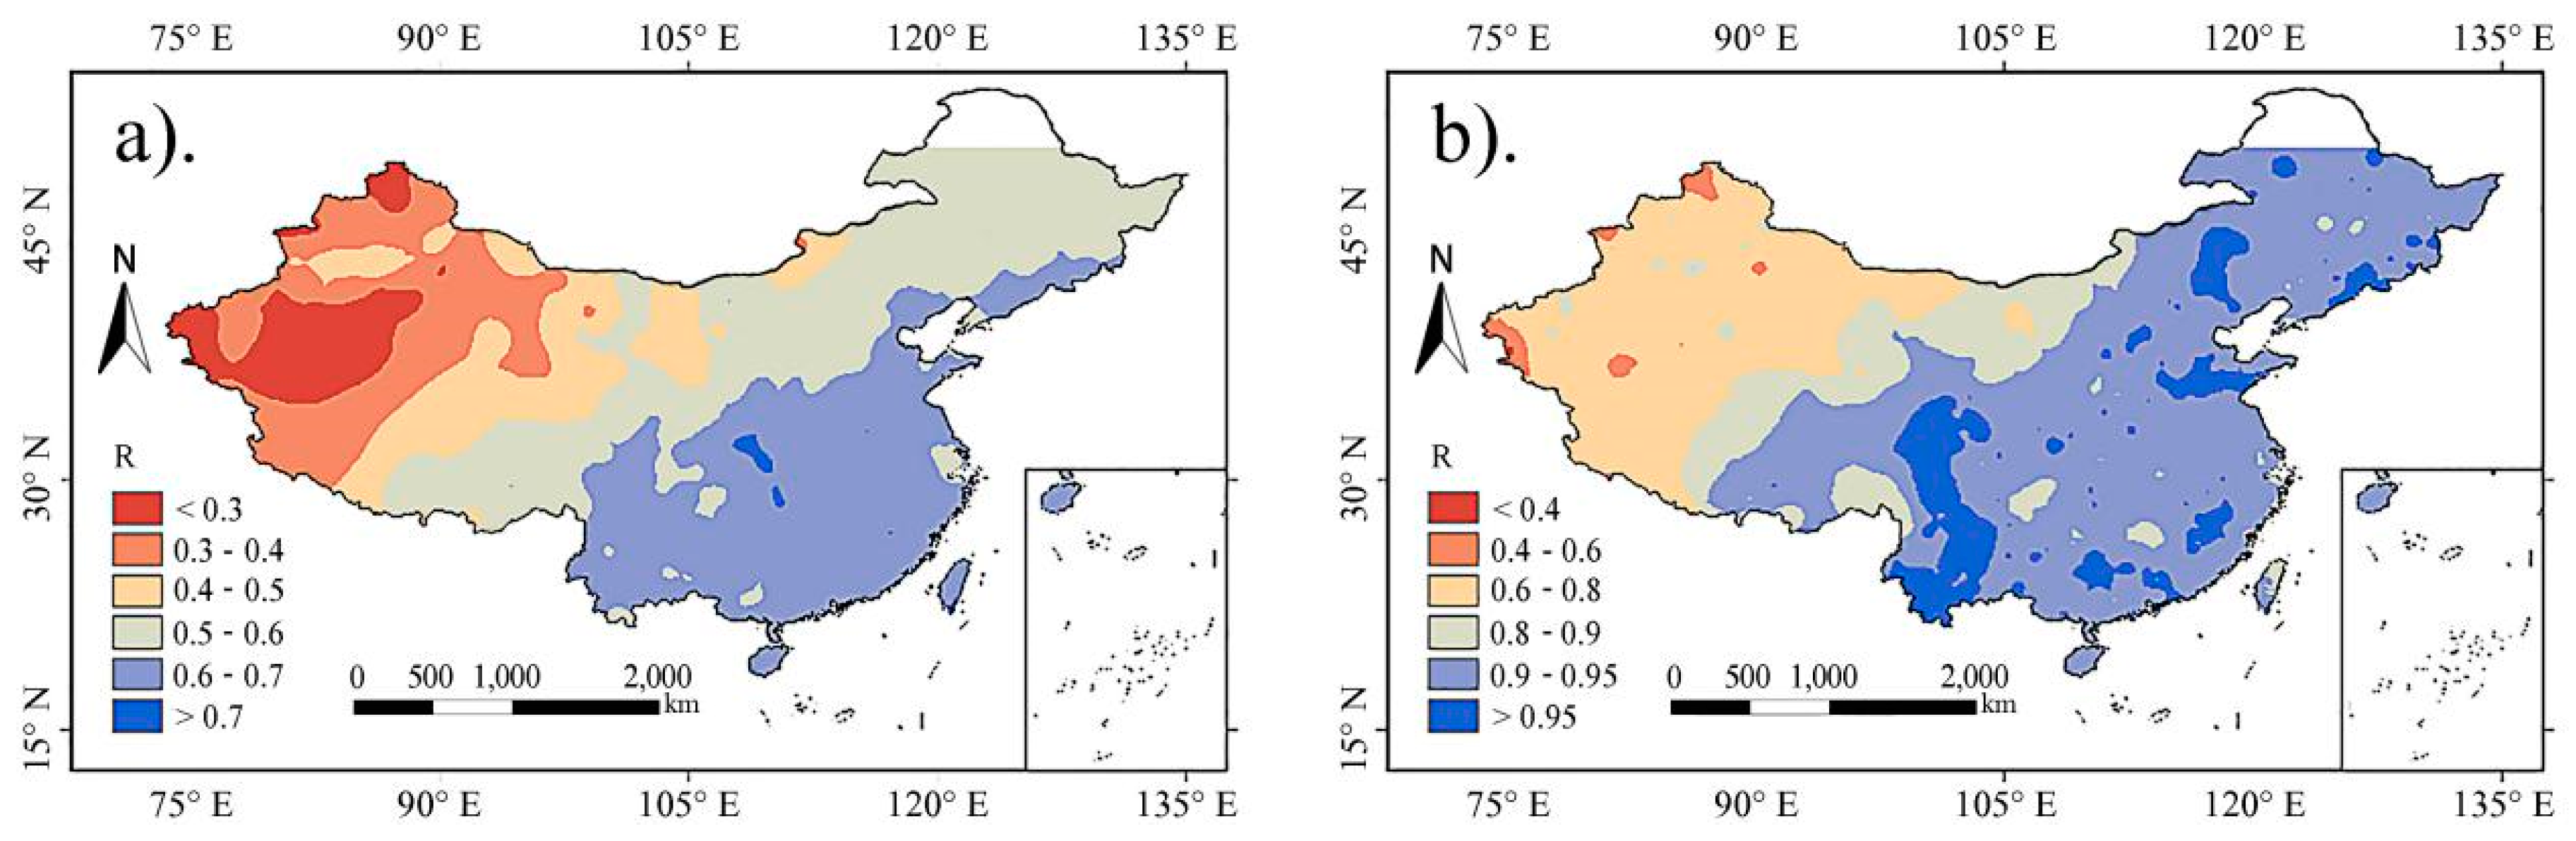
The results of the spatial interpolation show that, in general, the consequence of the accuracy indicators gets worse from southeastern to northwestern China and such distribution is similar to the spatial distribution of precipitation, which is consistent with earlier relevant research. Accordingly, it is surmised that geographical factors, such as topography and spatial distribution of precipitation, may have a great influence on the spatial error distribution of the 3B42V7 data. Specifically, from the spatial distribution of the Pearson correlation coefficient R value (Figure 4), at the daily scale, the values in the southeast and southwest of China are apparently higher than those in the northwest of China. The R values in some regions, such as the Tarim Basin are even below 0.3, and some regions from the northeast of China to southern Tibet are approximately at the median level (0.5). Instead, at the monthly scale, most regions in eastern China have high R values (above 0.9), but in some regions in northwest China still have relatively low R values (about 0.6).
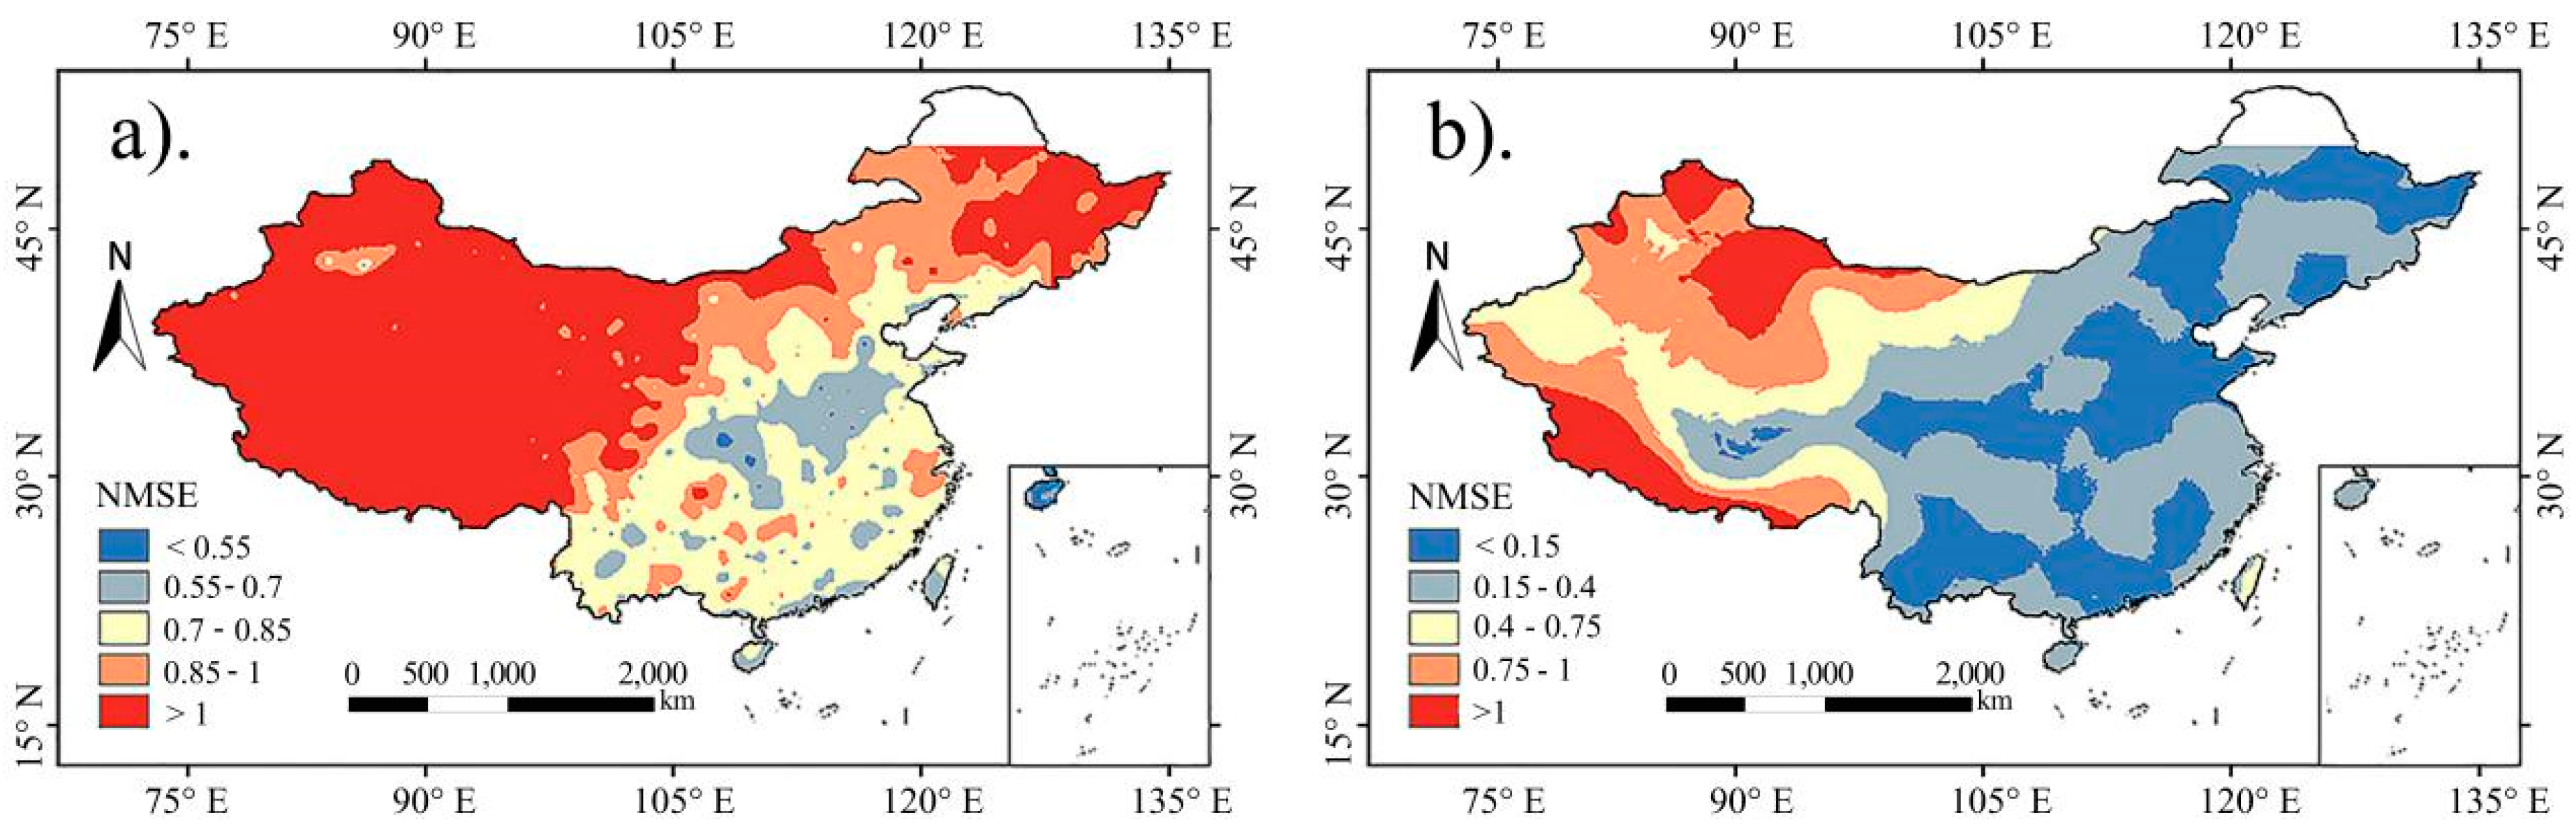
The spatial distribution of the NMSE at the daily and monthly scales of the 3B42V7 data in mainland China are shown in Figure 5. At the daily scale, the NMSE values in most of western China and parts of northeastern China are above 1.0, which indicates that the advisability of the product estimation is inferior to that of the rain gauge station observation and the products are not recommended for use in these regions [51]. At the monthly scale, the NMSE values in most regions significantly decreased, with most of them falling below 0.4. However, in some regions, such as the southwest of the Tibetan Plateau and the northeast of Sinkiang, the NMSE values were still high (above 1.0).
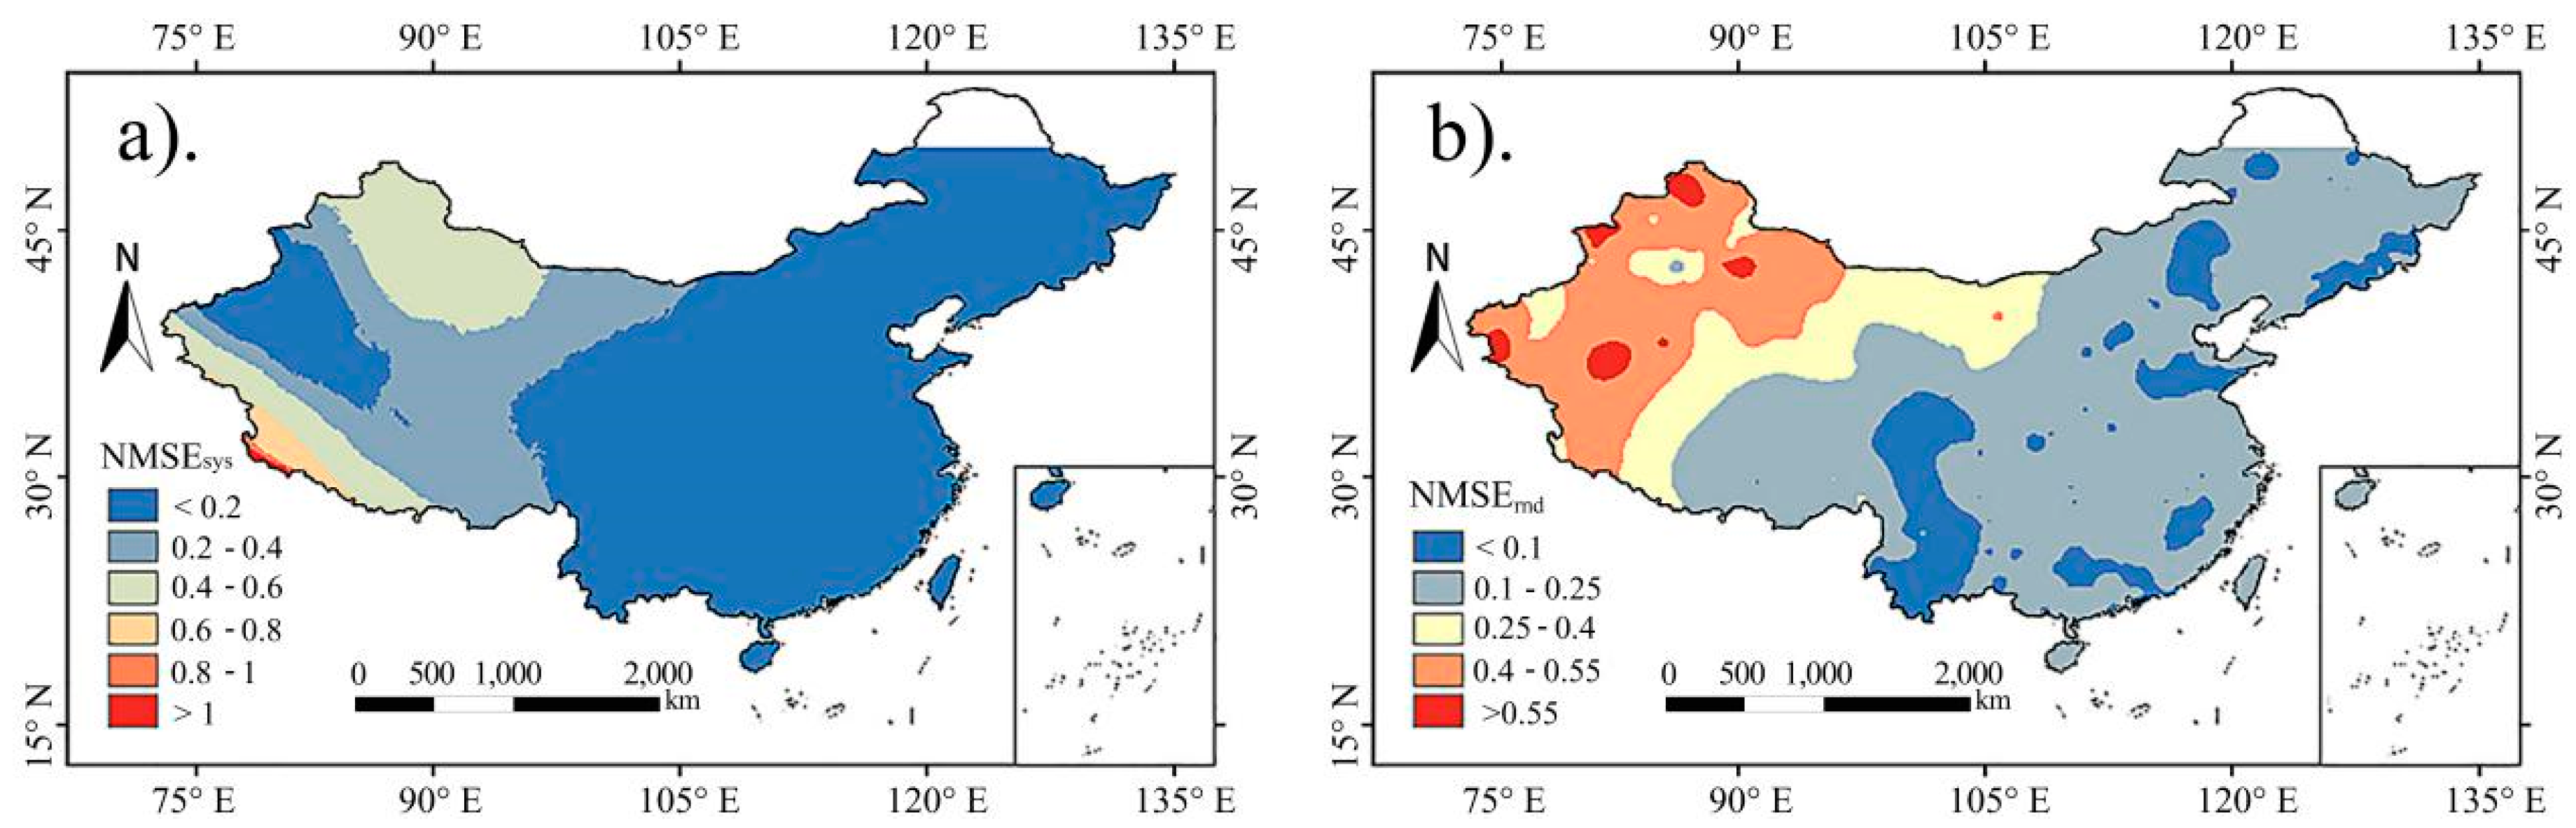
The spatial distribution of the and at the daily and monthly scales of the 3B42V7 data in mainland China are shown in Figure 6 and Figure 7. According to the spatial distribution of the , the product has a low systematic error in most regions, and the areas with high values are mainly distributed in the southwest of the Tibetan Plateau. It is speculated that the spatial distribution of the is more likely to be influenced by topography. In comparison, the spatial distribution of the is closer to that of the correlation coefficient R, which has a gradual trend with low values in the southeast and high values in the northwest. Also, areas with the highest values are around the Tarim Basin, which indicates that the random error may be more closely related to less precipitation in these areas. According to the distribution of the two accuracy indicators, it is speculated that the errors of the 3B42V7 data in the northwest and northeast of China are more likely to be caused by random error, while those in the Tibet region are more likely to be caused by systematic error.
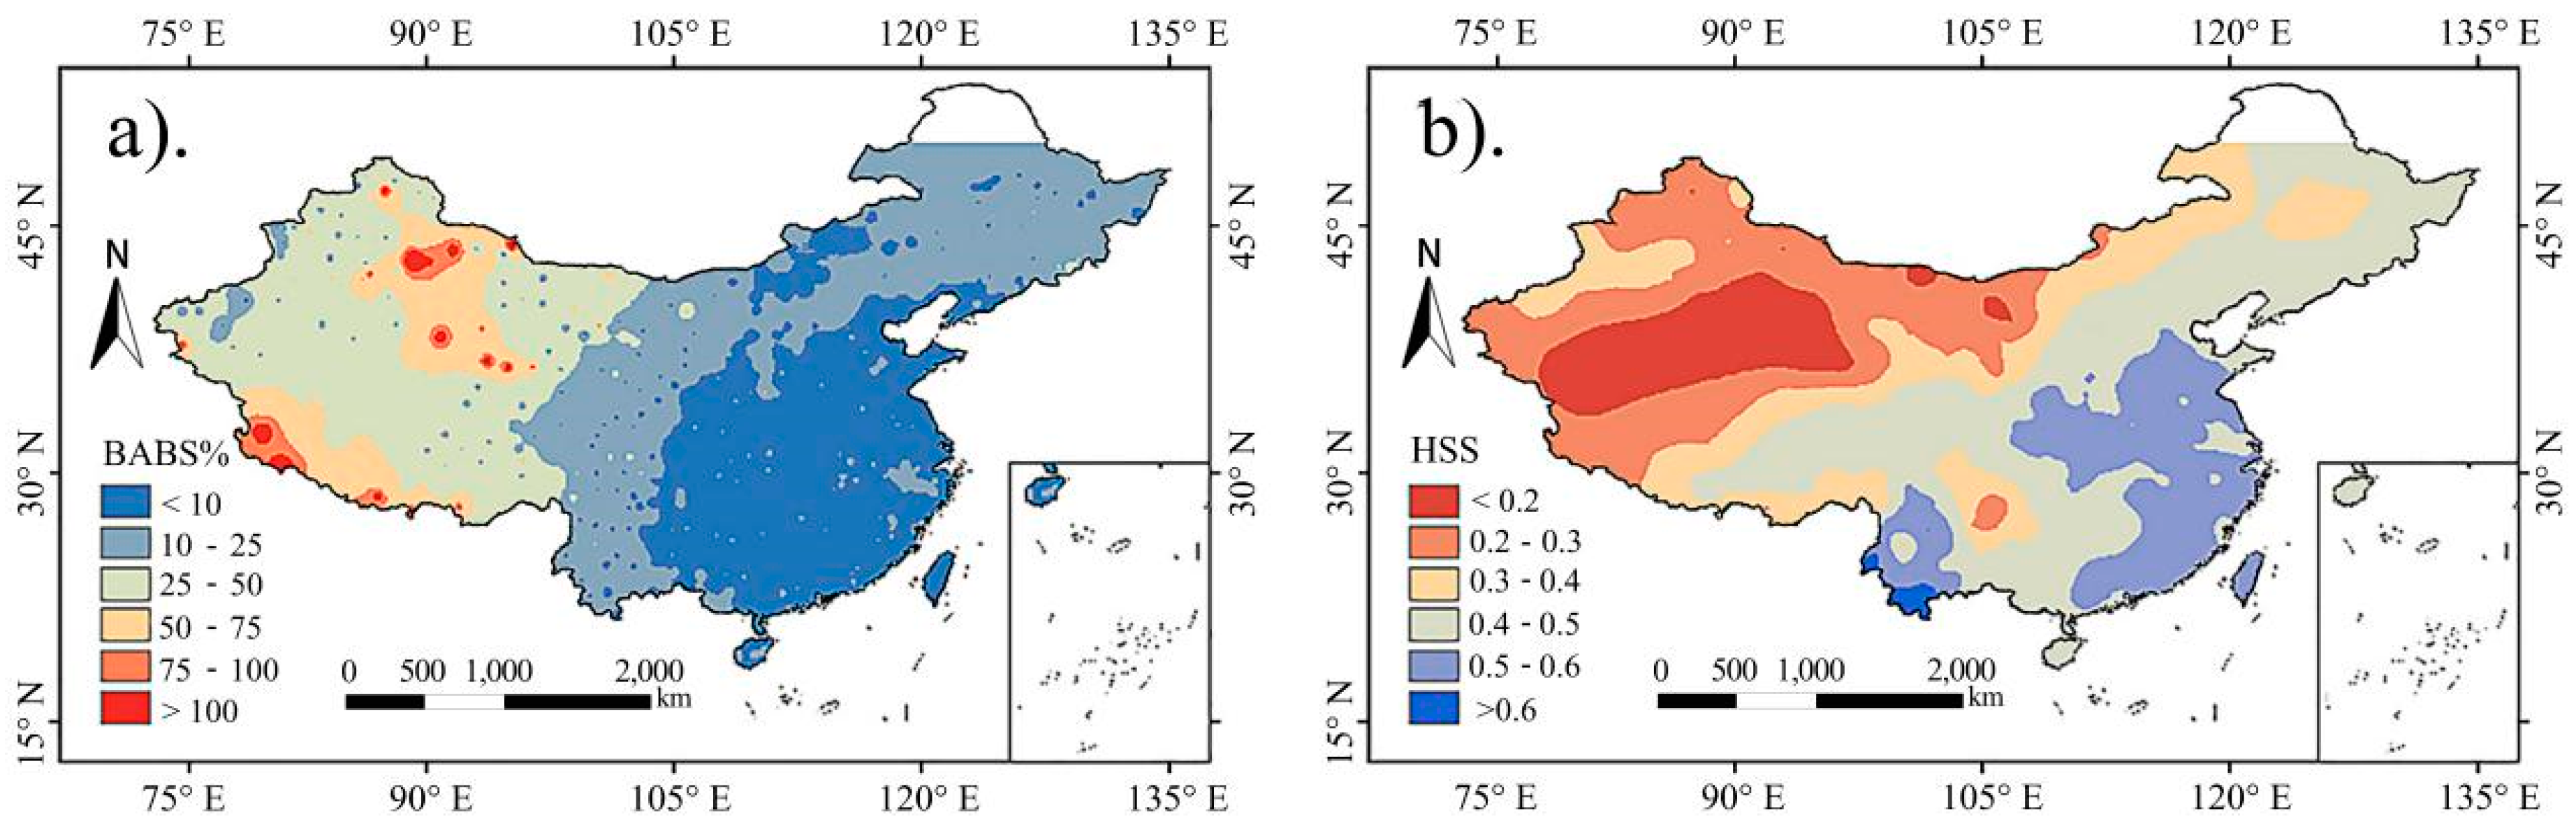
According to the spatial distribution of the BABS and HSS of the 3B42V7 data in mainland China (Figure 8), the BABS in eastern China are within 25% to 50% in most regions of western China, and there are large BABS parts in the Himalayas, Qaidam Basin and eastern Mount Tianshan. The above analysis indicates that topographic factors may have a greater impact on the relative bias of the product. The ability of the product to detect precipitation events reveals a spatial distribution in which the southeast is superior to the northwest. Moreover, some regions in the Yunnan-Guizhou Plateau have a lower HSS than those in other areas.
4.2. Clustering Analysis of the 3B42V7 Data Accuracy
In order to more concisely present the comprehensive accuracy distribution of 3B42V7 data in mainland China, we performed a clustering analysis focusing on rain gauge stations based on the accuracy indicators of spectral clustering methods. According to the 3B42V7 data and the precipitation data of the 797 rain gauge stations, the eight accuracy indicators (i.e., R, NMSE, , at the daily and monthly scale, BABS, HSS, POD and FAR) were taken as sample data, taking each accuracy indicator as the sample characteristics. In order to make the clustering consequence as concise as possible for reference, the number of clustering was selected as 3.
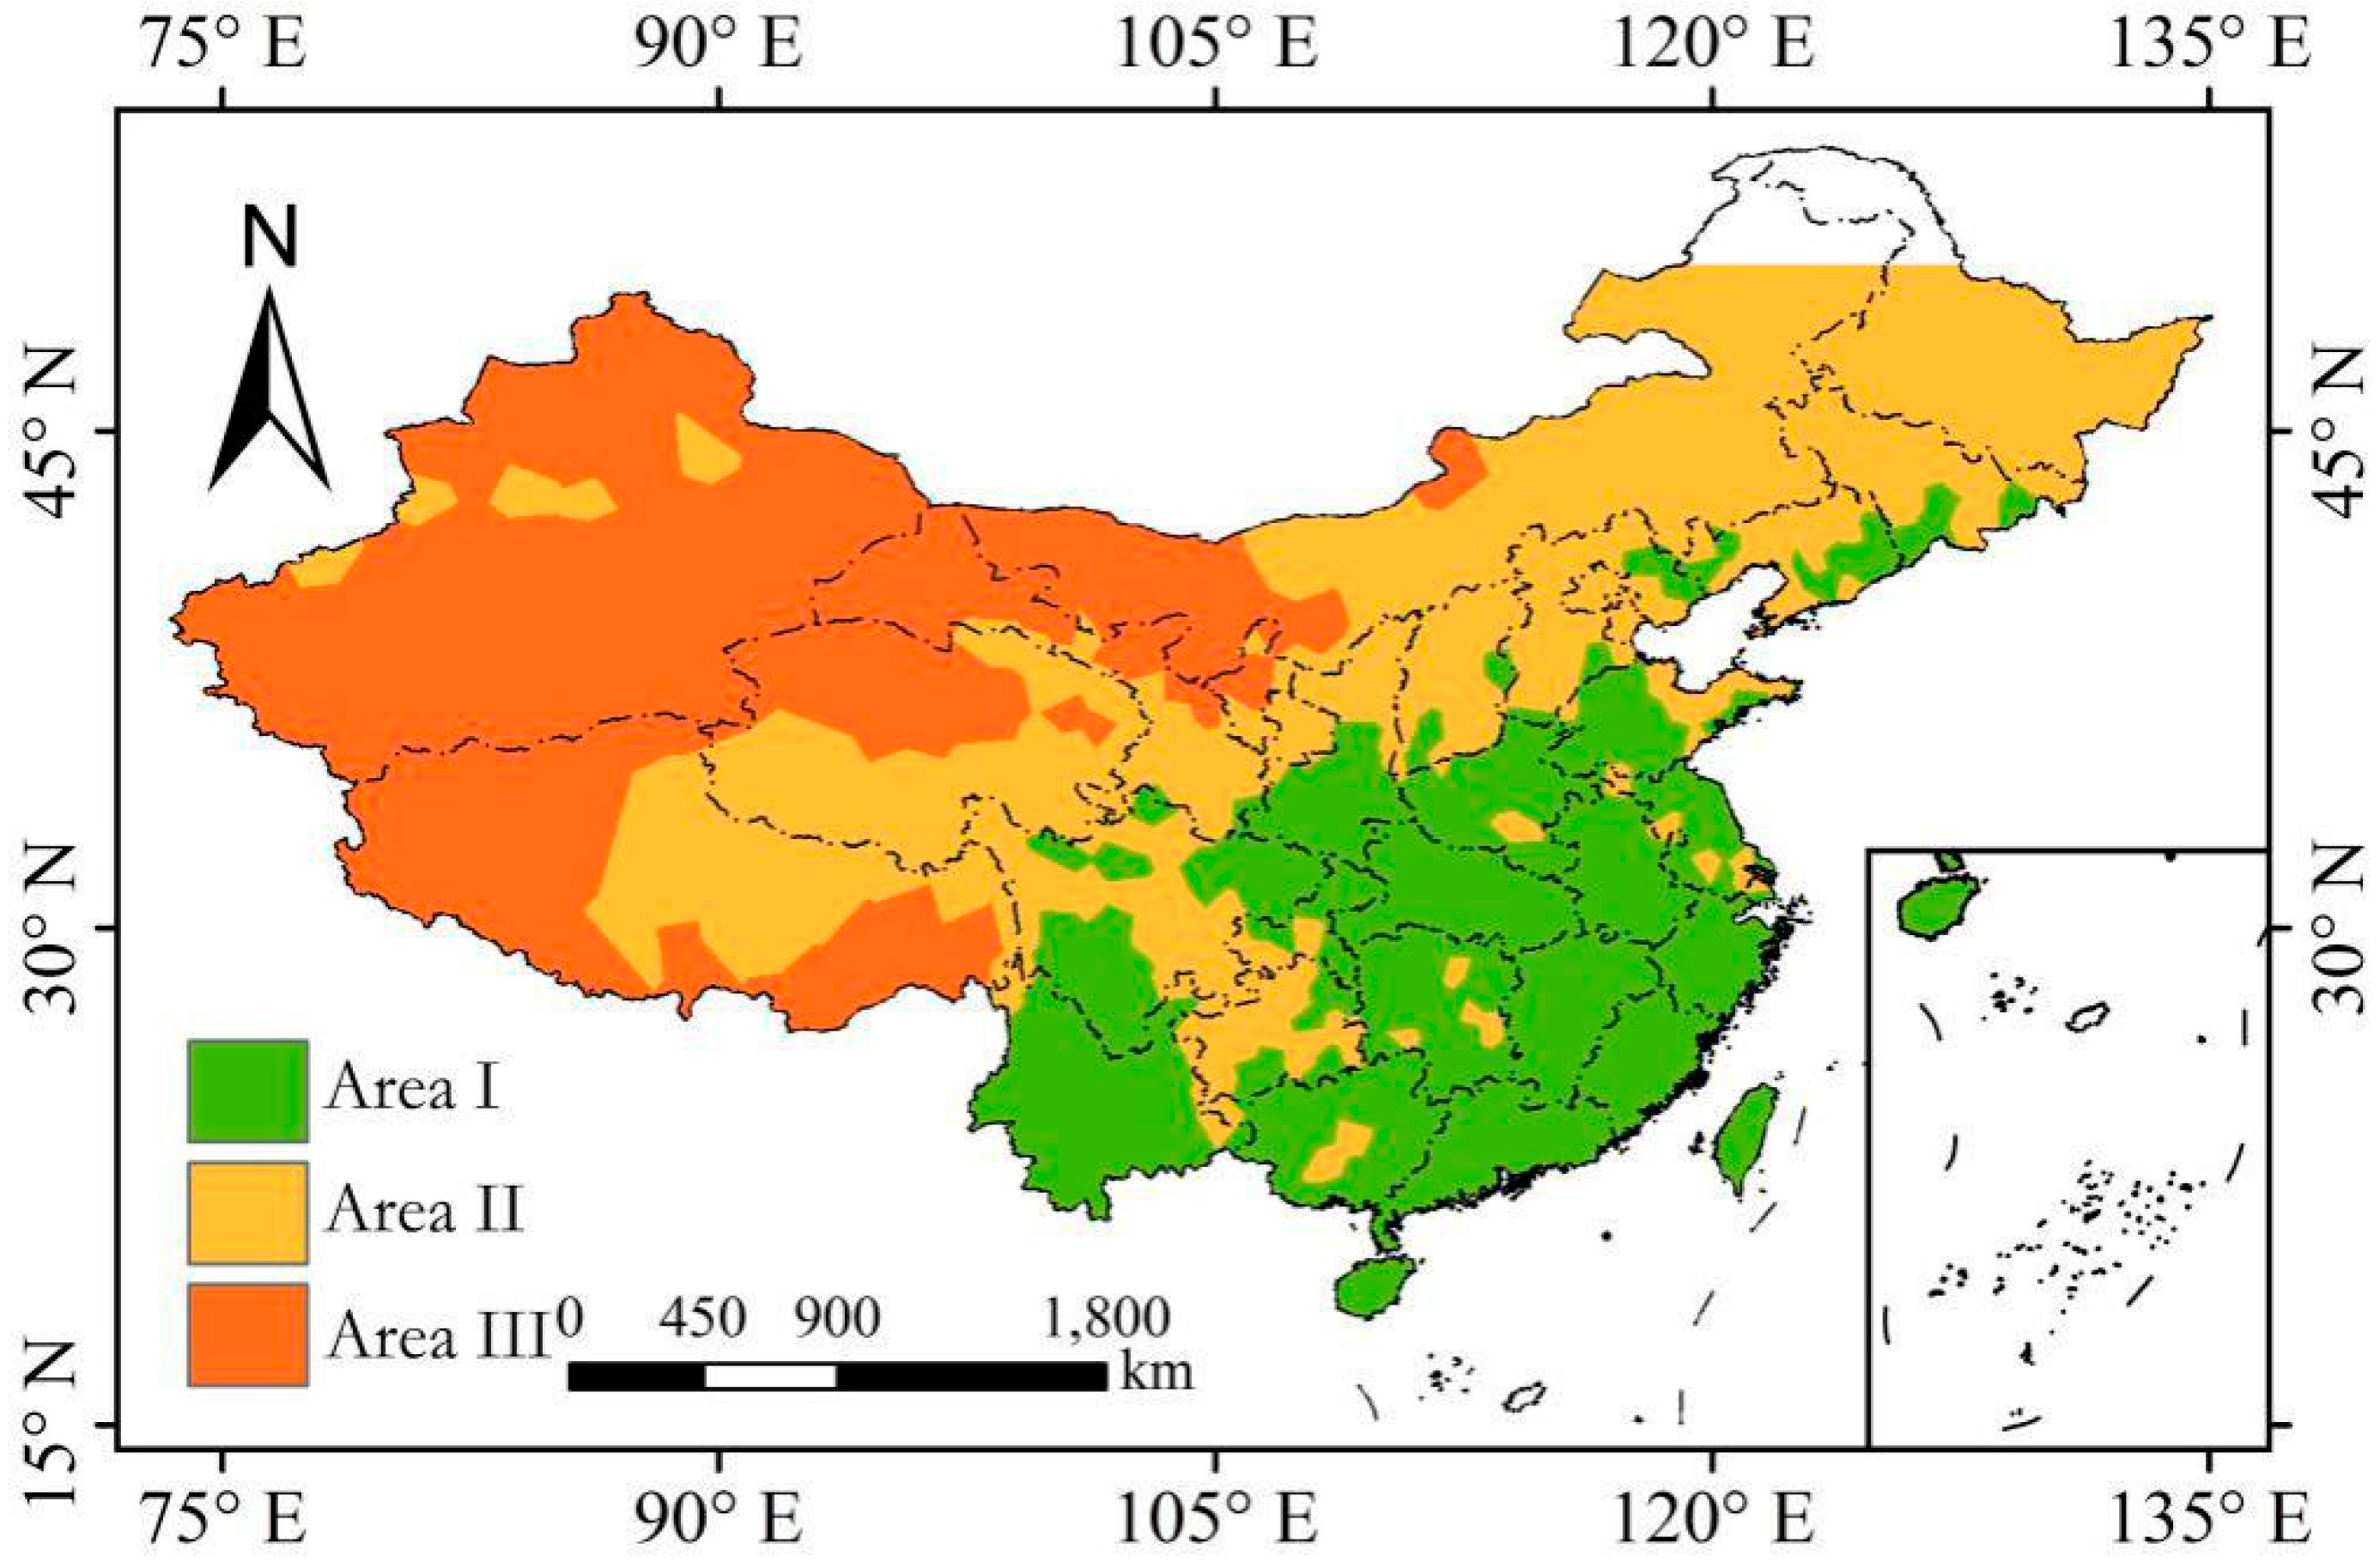
Due to large differences in the dimensions of the accuracy indicators, the sample data should be standardized before clustering. Accordingly, the standardized treatment is that the eigenvalues of all samples corresponding to each of the sample characteristics is subtracted from the mean value and then the calculated result is divided by the standard deviation of the eigenvalues, which ultimately makes the numerical distribution of the features as consistent as possible. Then, the spectral clustering method was used to cluster the standardized sample data, and the affinity matrix was calculated by the Gaussian radial basis function. However, it is difficult for each clustering method to directly give a perfect clustering result. Thus, according to the spatial distribution of each point, we manually classified some points that were clearly problematic for partitioning after clustering. According to the spectral clustering result, the entire mainland China was divided into three regions by three accuracy levels (Figure 9).
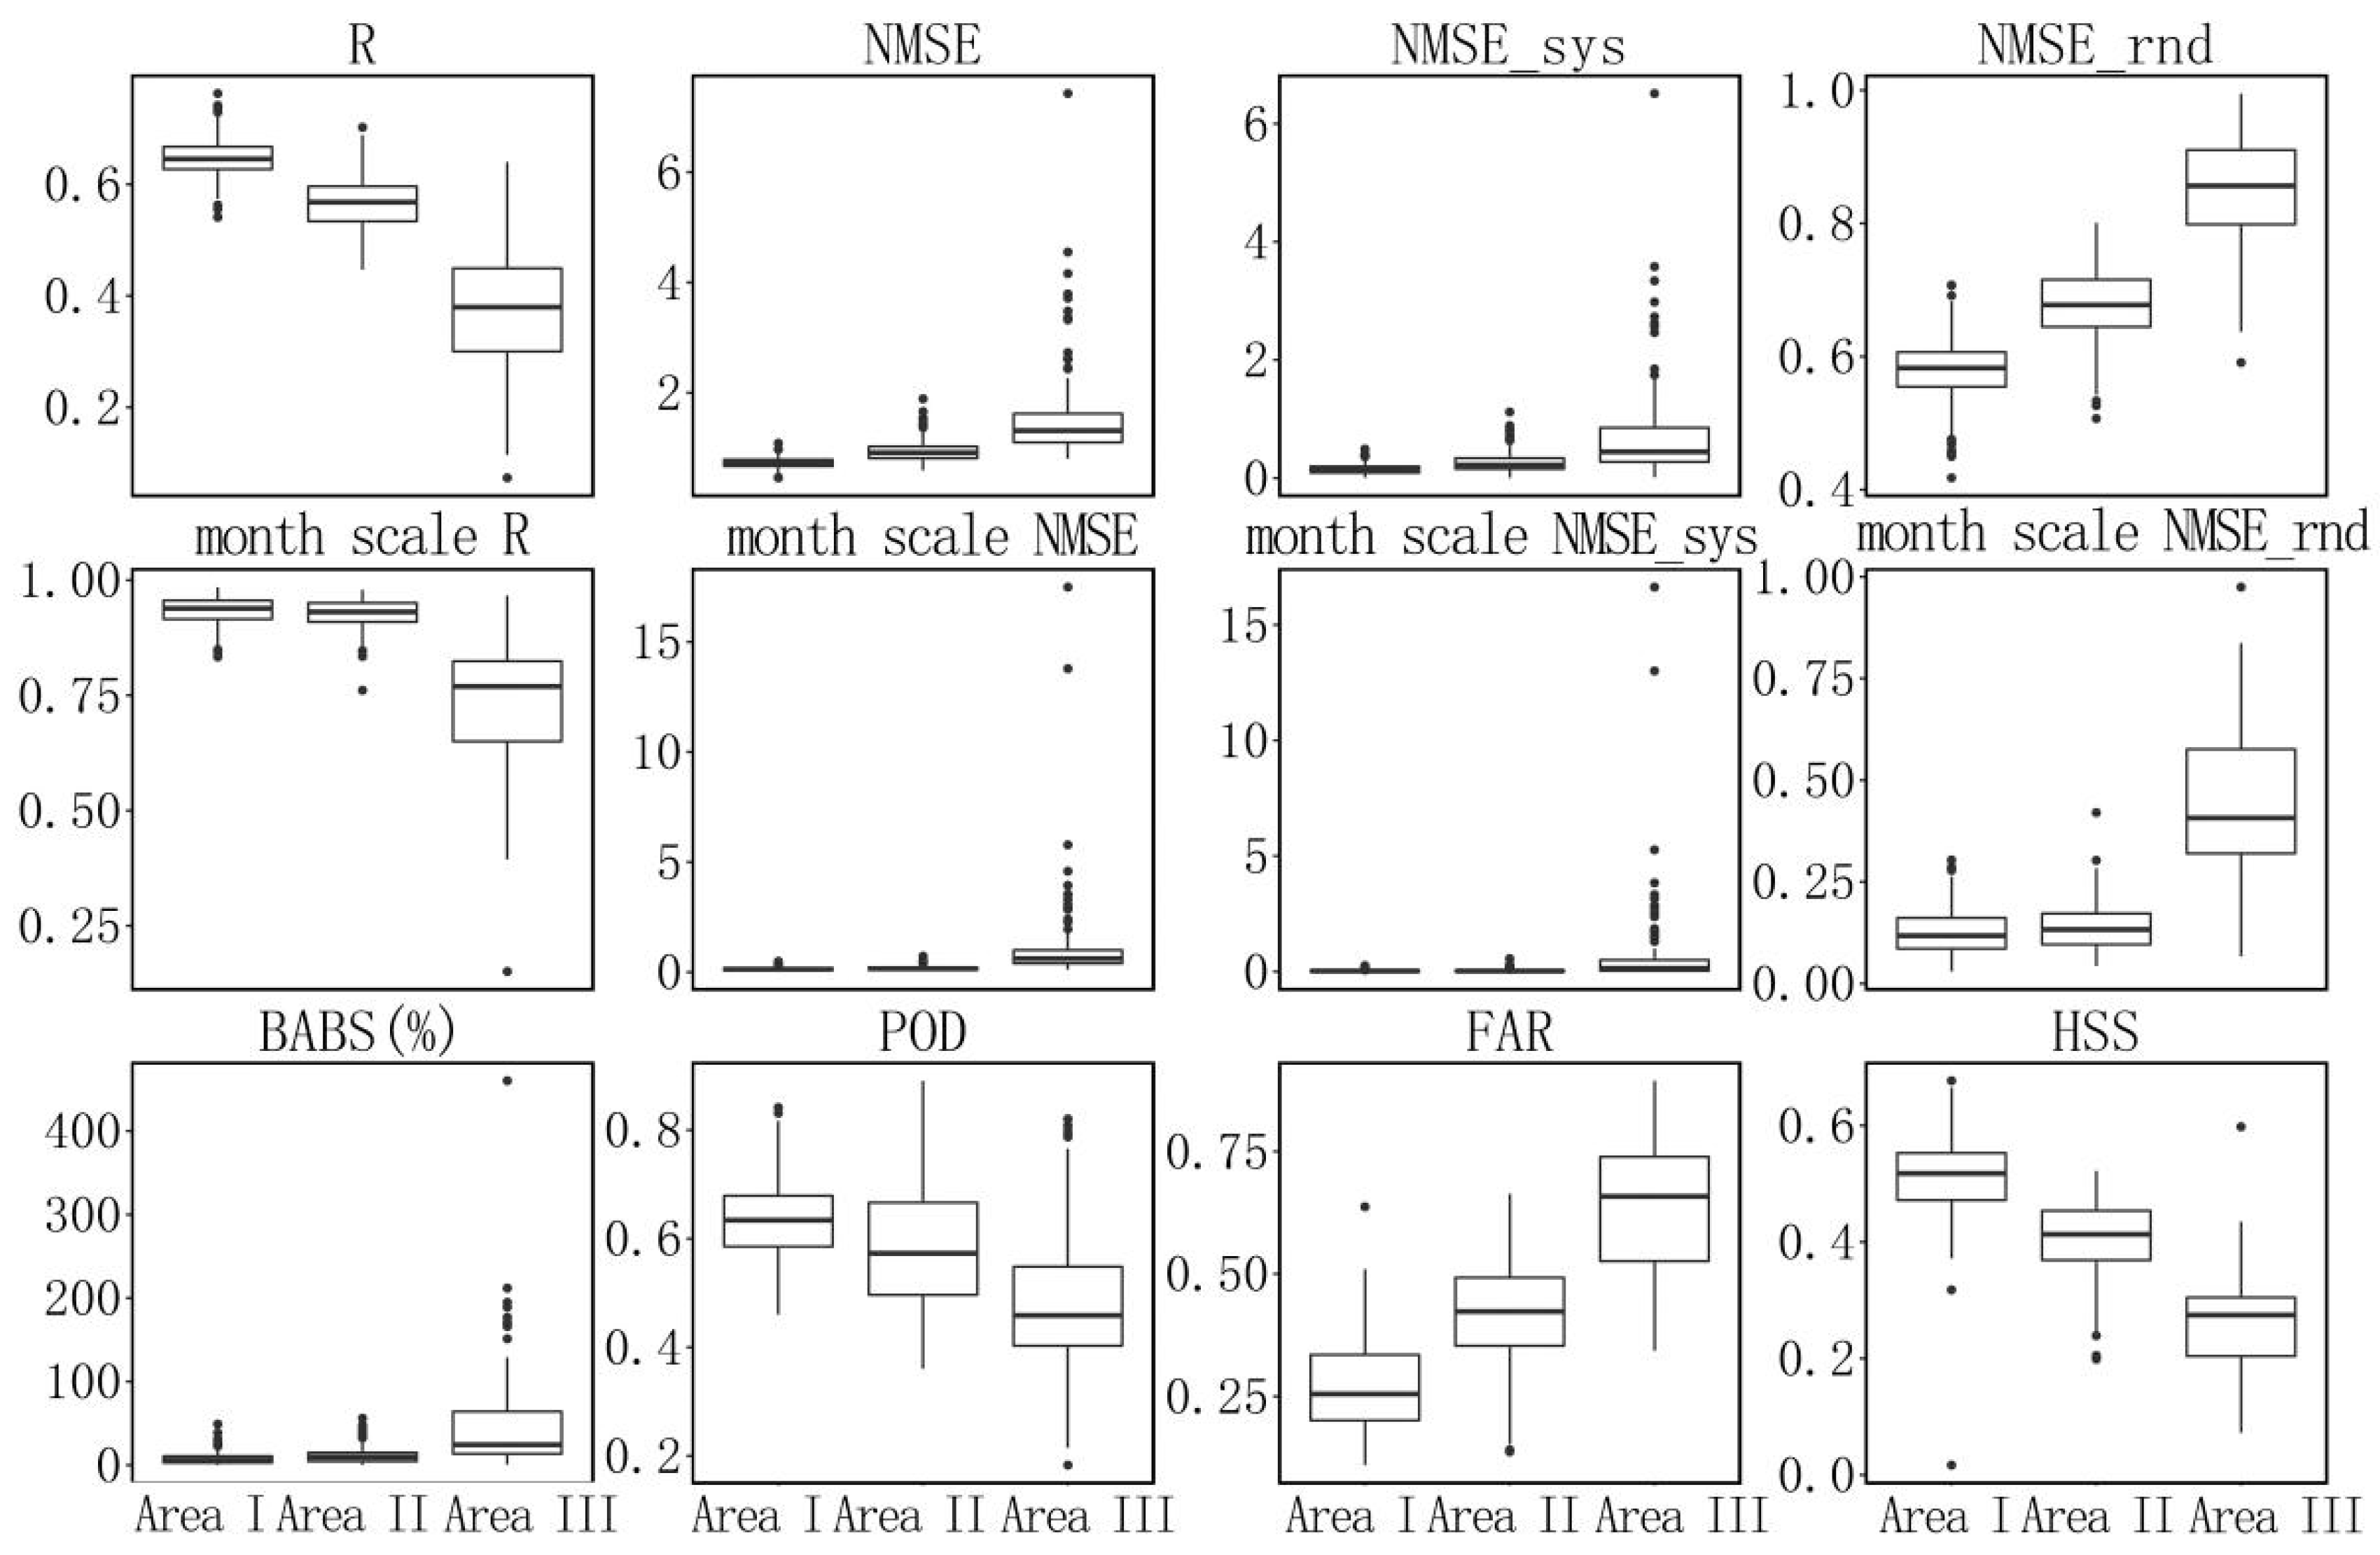
The distribution of the accuracy indicators of the three accuracy level areas shown in Figure 10 reveals that the spectral clustering method produces a reasonable division for each point. In the same accuracy level region, the 3B42V7 data accuracy is similar, but is quite different between different accuracy level regions. The characteristics of the 3B42V7 data accuracy in each area are as follows:
- (1)
- Area I includes most areas in the southeast of China, the southern region of the North China Plain, the western Yunnan-Guizhou Plateau, the northern Sichuan Basin and the southeast of the Liaoning province. In most parts of Area I, the error of the 3B42V7 data is low (daily R is above 0.6 and monthly R is above 0.9).
- (2)
- Area II includes most areas in the northeast of China, the Inner Mongolia Plateau and its surrounding areas, eastern and southern Qinghai, the Yili Basin, the northern piedmont of the Tianshan mountains and the coast of the Bohai Sea. In most parts of Area II, the error of the 3B42V7 data is still low at the monthly scale with a high monthly R, but the error was relatively high at the daily scale, with a low daily R.
- (3)
- Area III includes most areas in the northwest of China, western Tibet, and the mountain regions in the southern Himalayas. In most parts of Area III, the error of the 3B42V7 data at the daily and monthly scales is significantly higher than that in the regions of Area I and Area II.
4.3. Influence Factors Analysis for the 3B42V7 Data Accuracy
In order to perform a more comprehensive analysis of the influencing factors for 3B42V7 data accuracy, the R, NMSE, , , HSS and BABS were selected in this study as accuracy indicators based on the 3B42V7 data and rain gauge station data, and the following seven indicators were selected as potential influence factors: longitude (LNG), latitude (LAT), elevation (ELEV) of each ground rain gauge station, terrain complexity (TC) measured by the standard deviation of surface elevation within the grid, slope (SLO), the aspect (ASP) at the surface within the grid cell where the rain gauge stations are located, and the annual average precipitation (PREC). Then, we used the factor detector and interaction detector to further analyze the relationship between the spatial influencing factors and product accuracy. This method could quantitatively analyze the relative influence of each factor and the interaction between factors. In this way, we can perform a direct comparison and ascertain which kind of influence factors that mainly affects the errors of the product. Considering the high error of the 3B42V7 data in Area III in the clustering analysis results, it is not recommended to use this product directly in Area III, and we additionally believe that the cause analysis of the 3B42V7 data in Area III is of little significance in this study. Therefore, only 682 rain gauge stations in Area I and Area II were selected for the GD analysis. In addition, the calculation of the GD needs the discrete data from potential influencing factors. Thus, in advance, we discretized the potential influencing factors into 10 levels by the K-means method.
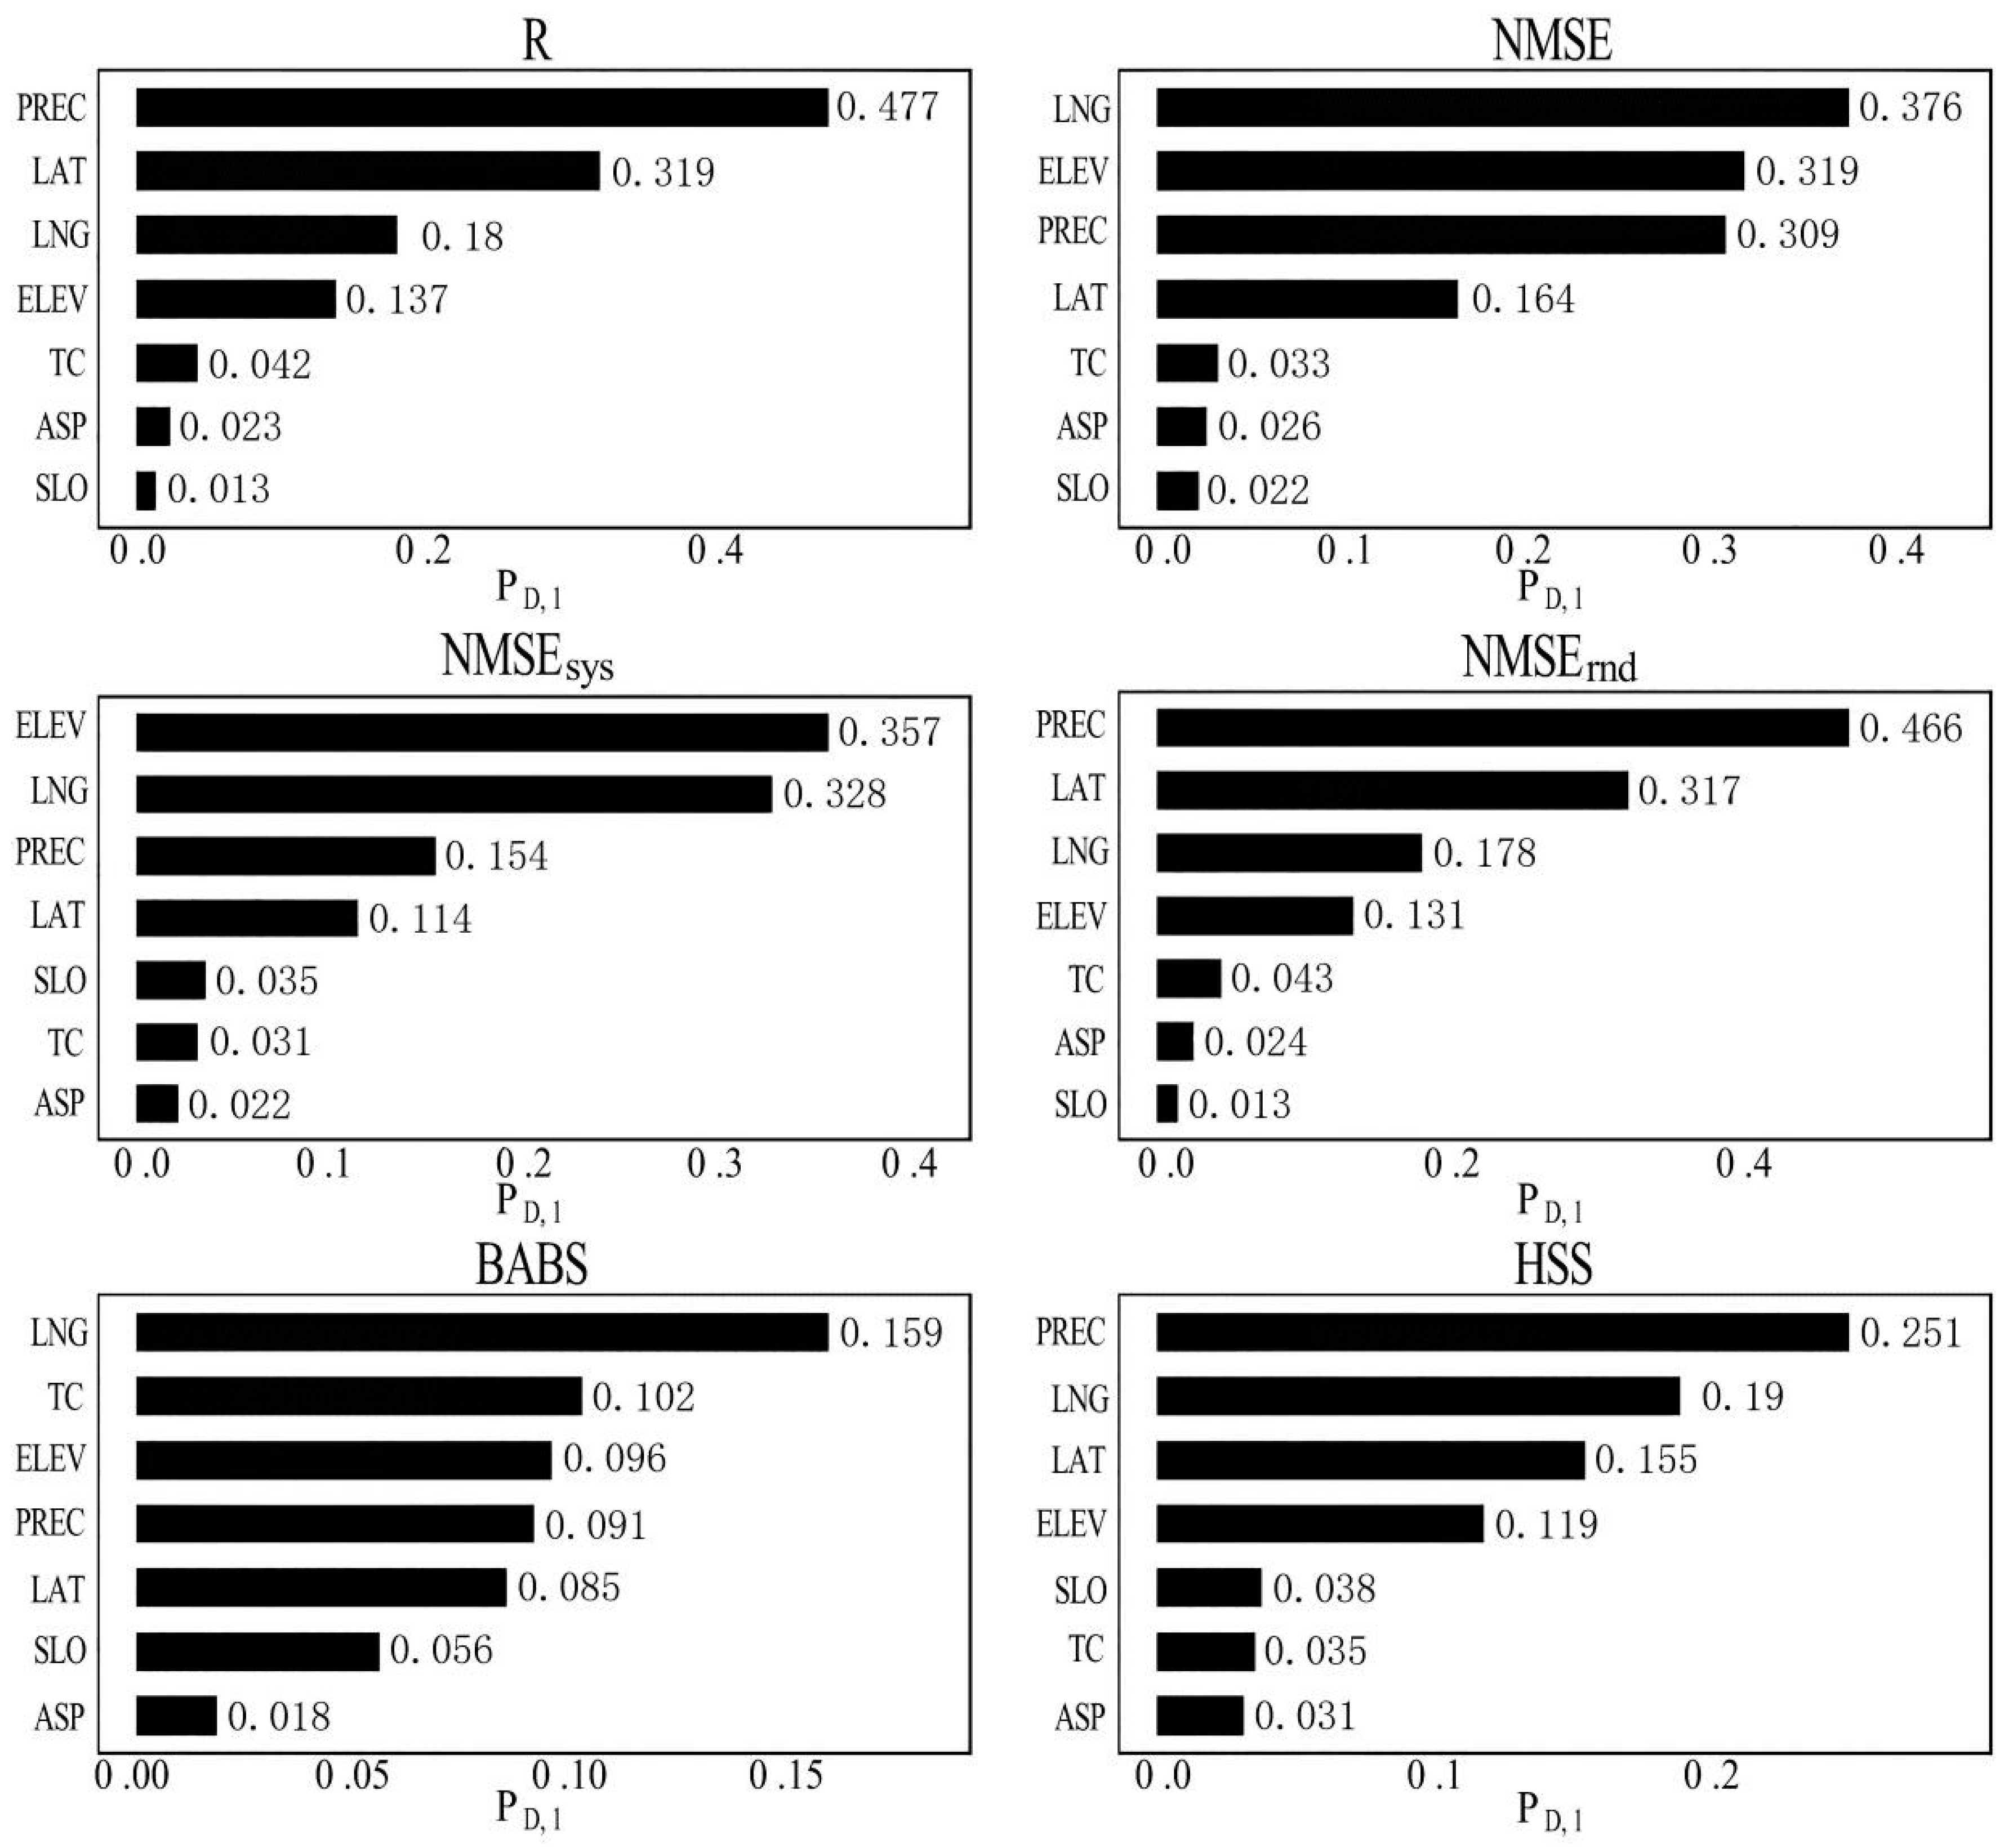
The results of the factor detection of accuracy indicators in Area I and Area II, shown in Figure 11, reveal that the value of PREC is the highest in R, and HSS, which indicates that PREC is a strong determinant for these three accuracy indicators. In R and , the values of LAT are only second to PREC and are also high in HSS. So, it is obvious that LAT is also a relatively strong determinant for these three indicators. The ranking of the value of LAT in the is higher than that in the , which indicates that LAT has a greater impact on the random error than on the systematic error. For the NMSE, the values of LNG and ELEV are slightly higher than those of the other potential influencing factors. For BABS, the value of ELEV is clearly higher than those of the other potential influencing factors. For the , the value of ELEV and LNG are significantly higher than those of the other potential influencing factors. In addition, SLO and ASP have low values in these six accuracy indicators, thus it can be speculated that the slope and slope direction have a low impact on the accuracy of the product.
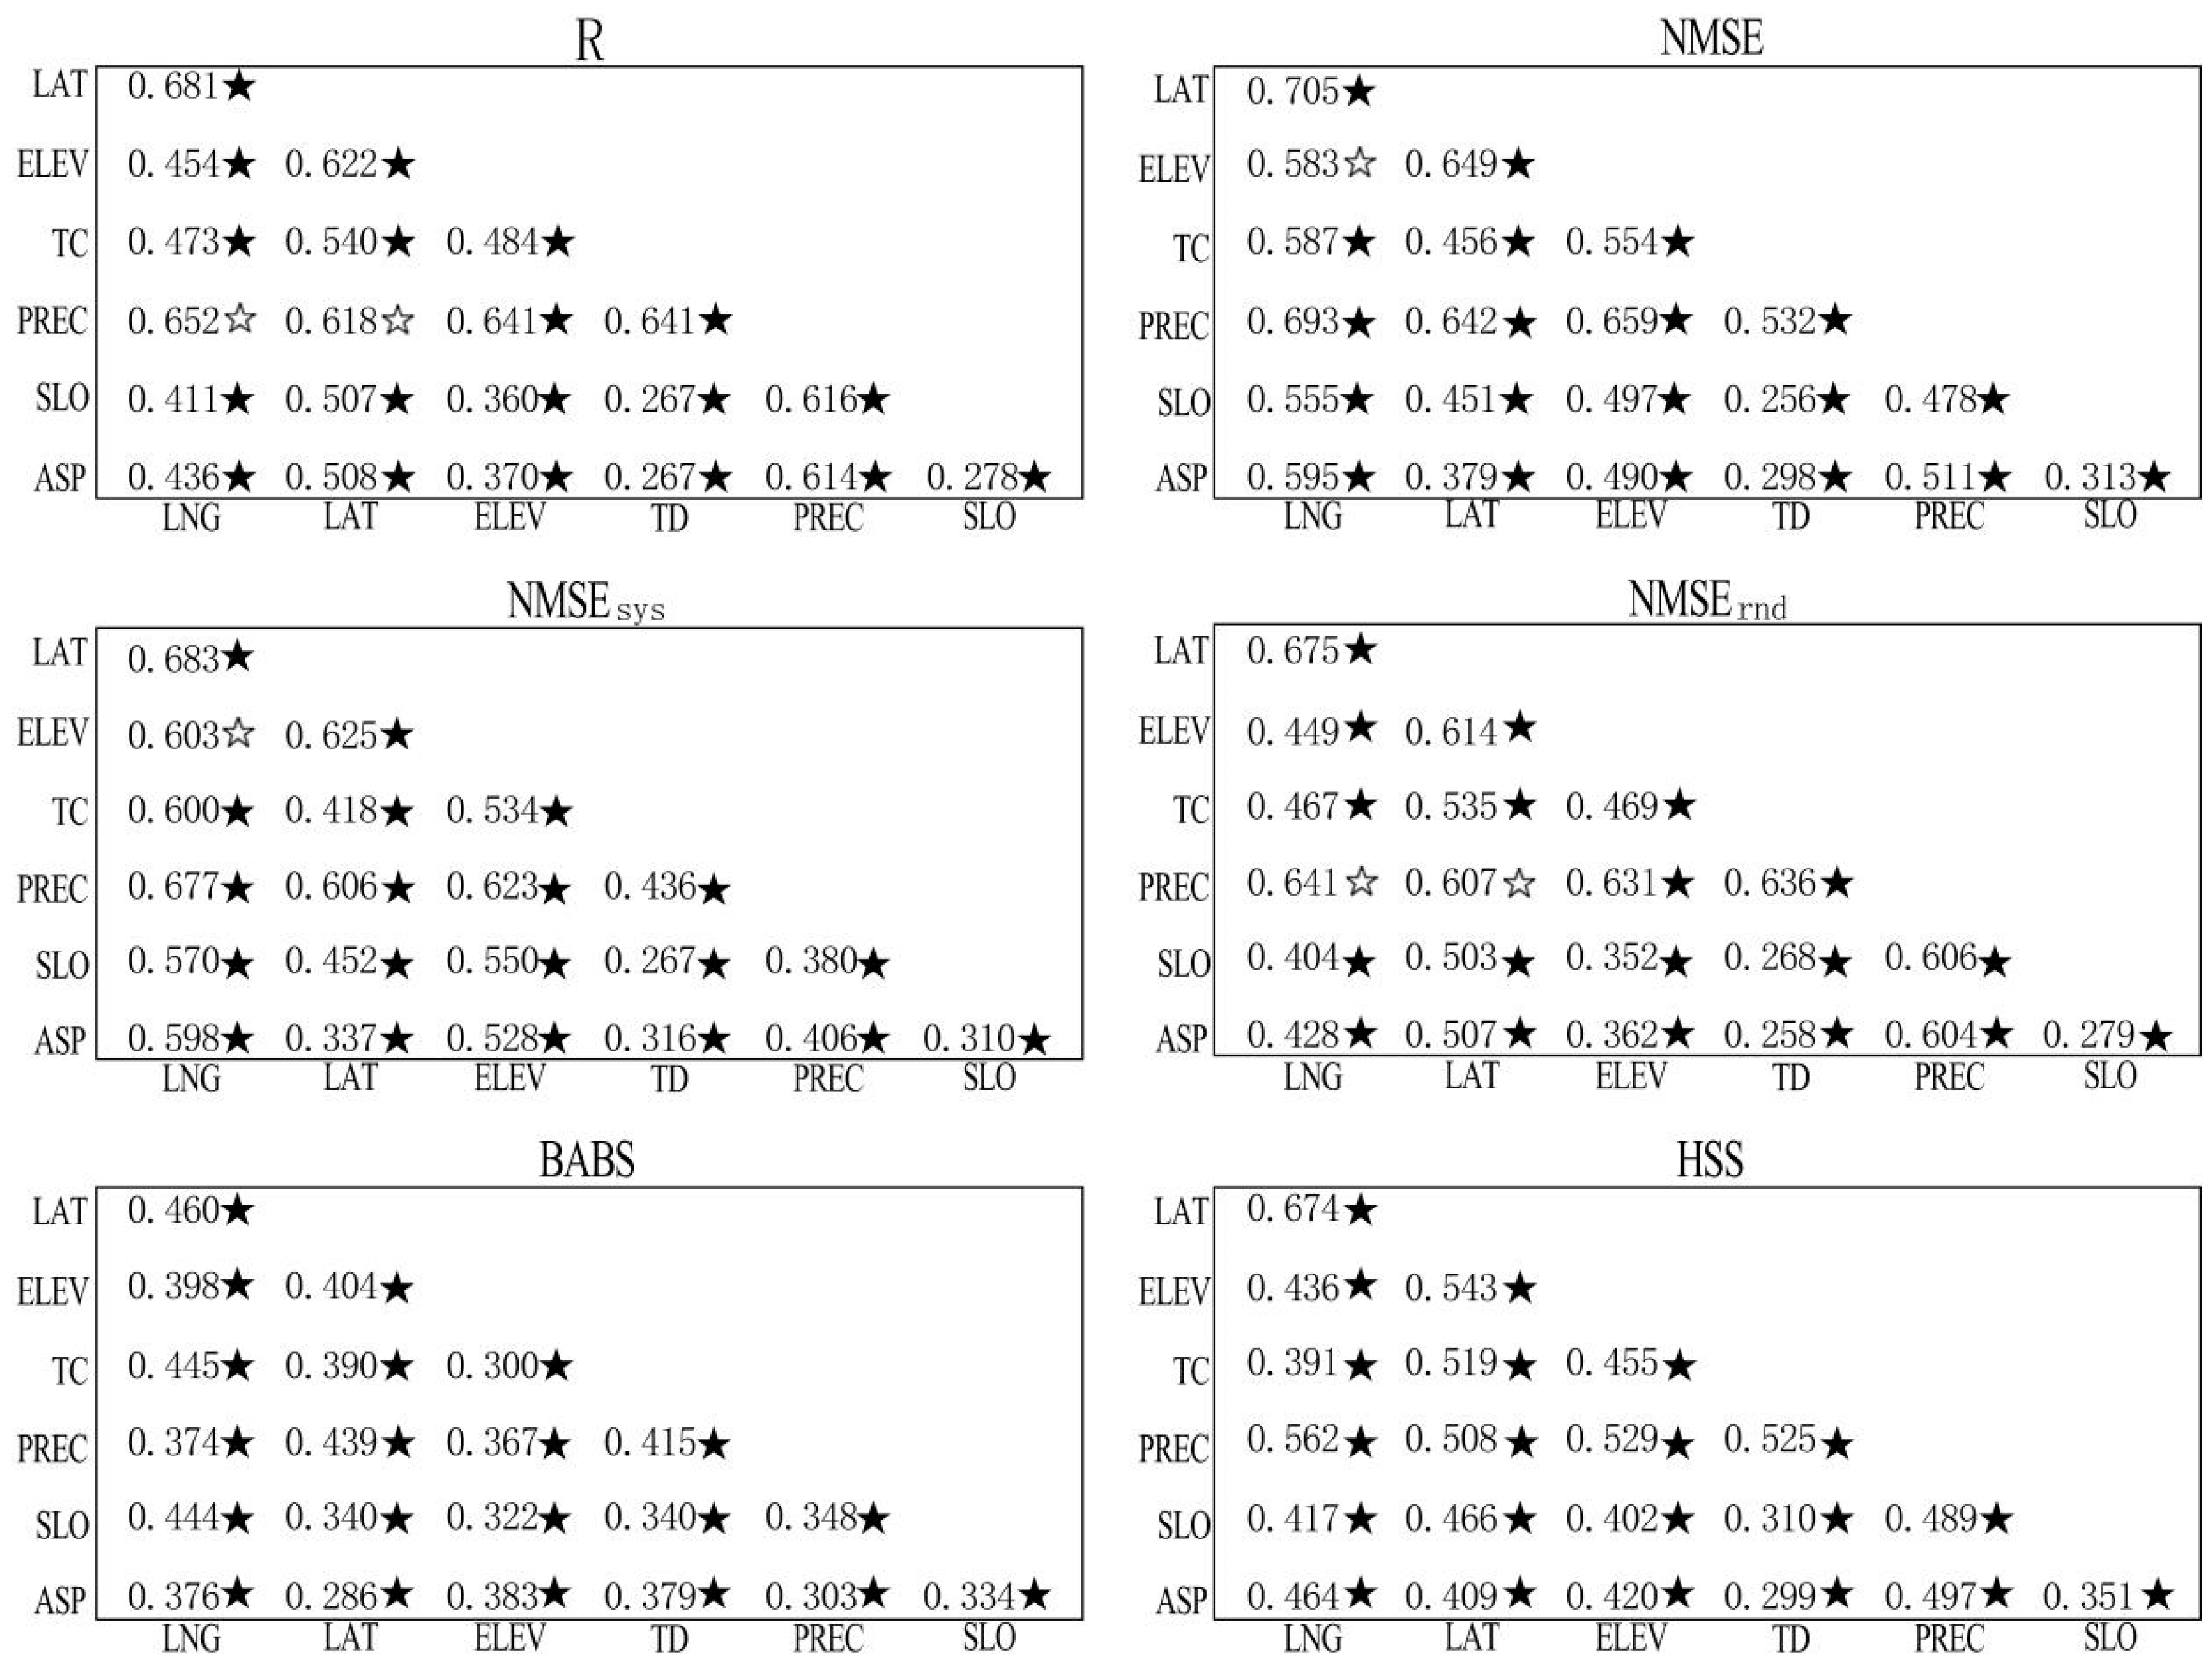
The results of the interaction detector for the accuracy indicators shown in Figure 12 reveal that the interaction of LNG, LAT and PREC (both in R and ) and the interaction of LNG and ELEV (both in NMSE and ) exhibited bivariate enhancement. The interactions of the other potential influencing factors are higher than the sum of their respective influences and show a nonlinear synergistic relationship.
5. Discussion
In this study area, we found that, in general, the consequence of accuracy indicators gets worse from southeastern to northwestern China. Such a distribution is not only similar to the spatial distribution of precipitation, but also to the spatial distribution of the topography, climate type and temperature zones of mainland China. Our results are also consistent with those of other studies showing that in general, the accuracy of TRMM rainfall events decreased from the southeast coastal region to the northwest inland region [26,27,38]. According to the relevant studies and the results of this study, it is hypothesized that the spatial error distribution of the 3B42V7 may be mainly affected by spatial factors, such as topography and precipitation.
This study conducted a clustering analysis based on accuracy indicators and the spectral clustering method to produce a reasonable division. The 3B42V7 data accuracy is similar in the same accuracy level region, but is quite different between different accuracy level regions. In these three areas, many studies have evaluated product accuracy and hydrological utility of the 3B42V7 at different basin scales.
In Area I, some researchers have conducted runoff simulations based on the rain gauge station data and 3B42V7 data over the Lijiang River Basin, Xiangjiang River basin and Xinjiang catchment, and they all found that the applicability of the 3B42V7 data is satisfactory [32,43,44]. By using the calibrated 3B42V7 data, Zhang et al. [28] successfully applied two different hydrological models for runoff monitoring in the Yangtze River Basin. Other researchers have also proposed an improved method for analyzing the hydrological utility of the 3B42V7 data. For example, Wu et al. [45] have developed a multi-source precipitation-merging method to improve the applicability of the product’s data in a typical region of the East China Plain. In the field of drought monitoring, some studies have found that 3B42V7 data can reflect the temporal and spatial evolution of droughts in mainland China, and 3B42V7 data is suitable for the monitoring and evaluation of meteorological drought at a large scale [22,23]. In the field of water resource planning, Yang et al. [31] found that 3B42V7 data is useful for monthly streamflow simulations and long-term reservoir operations. Thus, the above studies found that 3B42V7 data has a satisfactory hydrological utility at the basin scale.
In Area II, Wang et al. [39] evaluated and bias-corrected 3B42V7 data under complex topographic and climatic conditions over the Hexi Region, located in the northwest arid region of China. Their results suggested that regional assessment and bias correction of 3B42V7 data were essential in similar areas. Taking the upper reaches of the Yangtze River as their research area, Yang at al. [69] found that 3B42V7 data has an acceptable application value, but its application was better after integration and calibration of the precipitation data from the ground rain gauge data. Another study also found that the error of the 3B42V7 data over the Hun-Tai Basin in the northeast of China was relatively high, and suggested calibration be performed [70]. According to the above findings, effective calibration can improve the practicability of 3B42V7 data for hydrological applications in Area II.
In Area III, there are relatively few studies on the evaluation of a series of product. Relatively limited studies suggested that the TMPA-3B42 product has a relatively poor performance in the Tibetan Plateau, Sinkiang, parts of Gansu, Inner Mongolia, Qinghai, and Ningxia provinces, and therefore some necessary corrections need to be performed before using it [40,41,47].
Based on the results of the clustering analysis and previous research, this study provides the following usage recommendations for the three areas. For Area I, 3B42V7 data can be effectively used for hydrological simulation, water resource planning, drought monitoring and other research purposes or applications. It can be used after studying its local applicability if necessary. For Area II, when using 3B42V7 data, it would be better to conduct an accuracy evaluation and applicability research first, and perform a calibration if necessary. For Area III, 3B42V7 data should be calibrated before use. Hopefully, the regional division and usage recommendations proposed in this study can provide a reference for meteorological and hydrological studies on 3B42V7 data in mainland China.
In this study, we also conducted an error cause analysis of the 3B42V7 data. Some related studies have examined the influencing factors of 3B42V7 data accuracy. For example, taking the southern Tibetan Plateau as an example, Xu et al. [47] found that the performance of the 3B42V7 data is associated with topography and rainfall intensity. However, generally, few studies exploring influencing factors at the national scale have been reported. Additionally, previous studies have usually ignored some key factors, such as latitude, longitude and terrain complexity. In this study, we selected seven indicators (LNG, LAT, ELEV, TC, SLO, ASP, and PREC) as potential influencing factors and then used GD to quantitatively analyze the relationship between these potential influencing factors and the product accuracy. In the evaluation of the accuracy of the satellite-based precipitation product, the GD method is rarely used, but it may provide a new method for evaluating the influences of influencing factors on product accuracy. In this study, the results of factor detection showed that PREC is the primacy influencing factor for the R, and HSS. Thus, it can be inferred that the spatial error distribution of the 3B42V7 data in mainland China is primarily caused by the spatial distribution of decreasing precipitation from the coast to inland regions. In addition, LAT is also an important determinant for the three indicators. We also found that LAT has a greater impact on random errors than on systematic errors. It can also be inferred that the influence of the latitude factors on 3B42V7 data accuracy is mainly embodied in the random error, which supports the observations of Yong et al. [36,37] who suggested that the error structures of TMPA-3B42 were associated with latitude and elevation bands. The LNG and ELEV have a strong impact on the NMSE, while LNG, SD and ELEV are the spatial factors with great influence on the BABS. Thus, geographical factors have great influence on the spatial distribution of product accuracy. The main influencing factors for are ELEV and LNG, and the main influencing factor for is PREC. Accordingly, it can be inferred that the systematic error is mainly affected by geographical factors and the random error is mainly affected by precipitation. Moreover, SLO and ASP have low values in the six accuracy indicators, thus indicating that slope and slope direction have no significant influence on 3B42V7 data accuracy. However, Zeng et al. [48] found that the slope has an influence on the accuracy of the TRMM-3B43, suggesting that a steeper slope was an indicator of a worse quality of product data, which is quite different from the findings of this study. However, their study area is only focused on the Lancang River basin, which features typical alpine and gorge regions. Thus, it is not surprising that its topography has a significant influence on the accuracy of the satellite-based precipitation product. Generally, only seven potential influencing factors were used in our study due to data unavailability and the results could be more detailed if more influencing factors were considered, such as different types of cloud and precipitation that induce errors [3,29,71,72].
The results of the interaction detection clearly revealed that the relationships between spatial factors were synergistic rather than individual when influencing product accuracy. It can also be surmised that in the case of the same climatic condition, 3B42V7 data accuracy would decrease in some areas with complex topography and long span area. Therefore, when calibrating the 3B42V7 data, the geographical factors of the study area should be fully considered so as to further improve the applicability and accuracy of the data.
Based on these findings, we propose the following suggestions: (1) to improve satellite precipitation retrieval algorithms, it is recommended to focus more on geographical influence factors as well as the interaction between influencing factors. (2) GD has considerable potential in the error cause analysis of the satellite precipitation products, as it could be used to quantitatively analyze the relative influence of a single factor and the interaction between factors. Additionally, it could also be used to detect the most influential factors on product accuracy in different study areas, which would provide guidance for product data correction.
6. Conclusions
In this study, we calculated eight accuracy indicators (i.e., daily and monthly R, NMSE, , and BABS, POD, FAR, and HSS) based on 3B42V7 and rain gauge station data. We also analyzed the spatial distribution of the accuracy indicators and conducted a clustering analysis focusing on data from rain gauge stations based on accuracy indicators by spectral clustering methods. Moreover, the GD was used to assess the relationship between product accuracy and the seven spatial influencing factors. The main conclusions drawn from this study are summarized as follows:
- (1)
- Within mainland China, 3B42V7 data accuracy decreases gradually from the southeast coastal region to the northwest inland region, which shows a similar distribution to precipitation. At the daily scale, the product has large errors in most regions of western China and parts of the northeast of China (NMSE > 1.0). In comparison, at the monthly scale, the product errors in most regions of mainland China have significantly smaller values (most of the NMSEs are below 0.4), but there are still large errors in the southwest of the Tibetan Plateau and the northeast of Sinkiang. The high value of the systematic error is mainly concentrated in the southwest of the Tibetan Plateau, while the high values of the random error are mainly concentrated around the Tarim Basin. Additionally, the relative bias in eastern China is within 25%, and most areas in western China are less than 50%.
- (2)
- Mainland China can be divided into three areas by the spectral clustering method. The 3B42V7 data could be used effectively in Area I due to its high product accuracy, while the product in Area III should be calibrated before use due to the relatively low product accuracy. The product accuracy in Area II is between that of Area I and III and the product can be used after an applicability study.
- (3)
- Precipitation is the most important spatial factor among the seven factors influencing the spatial error distribution of the 3B42V7, with great influence on all the accuracy indicators, especially for R, and HSS. Latitude also has a certain influence on the spatial error distribution, which was mainly embodied in the random error. Topography is the main factor influencing the systematic error distribution of the product, and precipitation is the main factor influencing the random error distribution. Also, slope and slope direction have no significant influence on product accuracy. The influence of various spatial factors on 3B42V7 data accuracy showed significant mutual enhancement, rather than individual, when influencing the product accuracy, and most enhancements were nonlinear.
Author Contributions
Z.D. performed the data analysis and wrote the manuscript; extensive editing, revisions to the final manuscript and conclusions were contributed by Z.W.; C.L. conceived and designed the research.
Funding
This research was funded by the National Key R&D Program of China (2018YFC1508200), the National Natural Science Foundation of China (Grant Nos. 51879107, 51709117), and the Natural Science Foundation of Central University-Outstanding Youth Science Fund Project.
Acknowledgments
We appreciate China Meteorological Administration, United States Geological Survey, and NASA for freely providing the data. We also acknowledge the handling editor and two anonymous reviewers for their insightful review and professional revision suggestions, which are greatly helpful for further improvement of this manuscript.
Conflicts of Interest
The authors declare no conflict of interest.
References
- Wilk, J.; Kniveton, D.; Andersson, L.; Layberry, R.; Todd, M.C.; Hughes, D.; Ringrose, S. Estimating rainfall and water balance over the Okavango River Basin for hydrological applications. J. Hydrol. 2006, 331, 18–29. [Google Scholar] [CrossRef] [Green Version]
- Xie, P.; Arkin, P.A. Analyses of Global Monthly Precipitation Using Gauge Observations, Satellite Estimates, and Numerical Model Predictions. J. Clim. 1996, 9, 840–858. [Google Scholar] [CrossRef] [Green Version]
- Wang, Z.; Zhong, R.; Lai, C.; Chen, J. Evaluation of the GPM IMERG satellite-based precipitation products and the hydrological utility. Atmos. Res. 2017, 196, 151–163. [Google Scholar] [CrossRef]
- Turso, S.; Paolella, S.; Gabella, M.; Perona, G. MicroRadarNet: A network of weather micro radars for the identification of local high resolution precipitation patterns. Atmos. Res. 2013, 119, 81–96. [Google Scholar] [CrossRef]
- Joyce, R.J.; Janowiak, J.E.; Arkin, P.A.; Xie, P. CMORPH: A Method that Produces Global Precipitation Estimates from Passive Microwave and Infrared Data at High Spatial and Temporal Resolution. J. Hydrometeorol. 2004, 5, 487–503. [Google Scholar] [CrossRef]
- Hou, A.Y.; Kakar, R.K.; Neeck, S.; Azarbarzin, A.A.; Kummerow, C.D.; Kojima, M.; Oki, R.; Nakamura, K.; Iguchi, T. The global precipitation measurement mission. Bull. Am. Meteorol. Soc. 2014, 95, 701–722. [Google Scholar] [CrossRef]
- Hsu, K.-L.; Gao, X.; Sorooshian, S.; Gupta, H.V. Precipitation Estimation from Remotely Sensed Information Using Artificial Neural Networks. J. Appl. Meteorol. 1997, 36, 1176–1190. [Google Scholar] [CrossRef]
- Huffman, G.J.; Adler, R.F.; Bolvin, D.T.; Nelkin, E.J. The TRMM Multi-Satellite Precipitation Analysis (TMPA). In Satellite Rainfall Applications for Surface Hydrology; Springer: Dordrecht, The Netherlands, 2010; pp. 3–22. [Google Scholar]
- Asadullah, A.; McINTYRE, N.; Kigobe, M. Evaluation of five satellite products for estimation of rainfall over Uganda. Hydrol. Sci. J. 2008, 53, 1137–1150. [Google Scholar] [CrossRef]
- Jiang, S.; Ren, L.; Hong, Y.; Yong, B.; Yang, X.; Yuan, F.; Ma, M. Comprehensive evaluation of multi-satellite precipitation products with a dense rain gauge network and optimally merging their simulated hydrological flows using the Bayesian model averaging method. J. Hydrol. 2012, 452–453, 213–225. [Google Scholar] [CrossRef]
- Li, Z.; Yang, D.; Hong, Y. Multi-scale evaluation of high-resolution multi-sensor blended global precipitation products over the Yangtze River. J. Hydrol. 2013, 500, 157–169. [Google Scholar] [CrossRef]
- Zhu, Q.; Xuan, W.; Liu, L.; Xu, Y.-P. Evaluation and hydrological application of precipitation estimates derived from PERSIANN-CDR, TRMM 3B42V7, and NCEP-CFSR over humid regions in China: Evaluation and Hydrological Application of Precipitation Estimates. Hydrol. Process. 2016, 30, 3061–3083. [Google Scholar] [CrossRef]
- Huffman, G.; Bolvin, D.T. TRMM and Other Data Precipitation Data Set Documentation; NASA: Washington, DC, USA, 2013. [Google Scholar]
- Zulkafli, Z.; Buytaert, W.; Onof, C.; Manz, B.; Tarnavsky, E.; Lavado, W.; Guyot, J.-L. A Comparative Performance Analysis of TRMM 3B42 (TMPA) Versions 6 and 7 for Hydrological Applications over Andean–Amazon River Basins. J. Hydrometeorol. 2014, 15, 581–592. [Google Scholar] [CrossRef]
- Prakash, S.; Mitra, A.K.; Momin, I.M.; Pai, D.S.; Rajagopal, E.N.; Basu, S. Comparison of TMPA-3B42 Versions 6 and 7 Precipitation Products with Gauge-Based Data over India for the Southwest Monsoon Period. J. Hydrometeorol. 2015, 16, 346–362. [Google Scholar] [CrossRef]
- de CD Melo, D.; Xavier, A.C.; Bianchi, T.; Oliveira, P.T.S.; Scanlon, B.R.; Lucas, M.C.; Wendland, E.; Wendland, E. Performance evaluation of rainfall estimates by TRMM Multi-satellite Precipitation Analysis 3B42V6 and V7 over Brazil. J. Geophys. Res. Atmos. 2015, 120, 9426–9436. [Google Scholar] [CrossRef]
- Mantas, V.M.; Liu, Z.; Caro, C.; Pereira, A.J.S.C. Validation of TRMM multi-satellite precipitation analysis (TMPA) products in the Peruvian Andes. Atmos. Res. 2015, 163, 132–145. [Google Scholar] [CrossRef]
- Guo, H.; Chen, S.; Bao, A.; Hu, J.; Gebregiorgis, A.S.; Xue, X.; Zhang, X. Inter-comparison of high-resolution satellite precipitation products over Central Asia. Remote. Sens. 2015, 7, 7181–7211. [Google Scholar] [CrossRef]
- Chen, S.; Hong, Y.; Gourley, J.J.; Huffman, G.J.; Tian, Y.; Cao, Q.; Yong, B.; Kirstetter, P.-E.; Hu, J.; Hardy, J.; et al. Evaluation of the successive V6 and V7 TRMM multisatellite precipitation analysis over the Continental United States. Water Resour. Res. 2013, 49, 8174–8186. [Google Scholar] [CrossRef]
- Qiao, L.; Hong, Y.; Chen, S.; Zou, C.B.; Gourley, J.J.; Yong, B. Performance assessment of the successive Version 6 and Version 7 TMPA products over the climate-transitional zone in the southern Great Plains, USA. J. Hydrol. 2014, 513, 446–456. [Google Scholar] [CrossRef]
- Sahoo, A.K.; Sheffield, J.; Pan, M.; Wood, E.F. Evaluation of the Tropical Rainfall Measuring Mission Multi-Satellite Precipitation Analysis (TMPA) for assessment of large-scale meteorological drought. Remote Sens. Environ. 2015, 159, 181–193. [Google Scholar] [CrossRef]
- Lai, C.; Zhong, R.; Wang, P.; Wang, Z.; Wu, X.; Chen, X.; Lian, Y. Monitoring hydrological drought using long-term satellite-based precipitation data. Sci. Total Environ. 2019, 649, 1198–1208. [Google Scholar] [CrossRef] [PubMed]
- Zhong, R.; Chen, X.; Lai, C.; Wang, Z.; Lian, Y.; Yu, H.; Wu, X. Drought monitoring utility of satellite-based precipitation products across mainland China. J. Hydrol. 2019, 568, 343–359. [Google Scholar] [CrossRef]
- Zhao, T.; Yatagai, A. Evaluation of TRMM 3B42 product using a new gauge-based analysis of daily precipitation over China. Int. J. Climatol. 2014, 34, 2749–2762. [Google Scholar] [CrossRef]
- Tang, G.; Ma, Y.; Long, D.; Zhong, L.; Hong, Y. Evaluation of GPM Day-1 IMERG and TMPA Version-7 legacy products over Mainland China at multiple spatiotemporal scales. J. Hydrol. 2016, 533, 152–167. [Google Scholar] [CrossRef]
- Liu, S.; Yan, D.; Wang, H.; Li, C.; Qin, T.; Weng, B.; Xing, Z. Evaluation of TRMM 3B42V7 at the basin scale over mainland China. Adv. Water Sci. 2016, 27, 639–651. [Google Scholar]
- Huang, Y.; Chen, S.; Feng, Y.; Zhai, Q. Evaluation of TMPA Precipitation Estimates from 2008 to 2012 over China. Meteorol. Mon. 2015, 41, 353–363. [Google Scholar]
- Zhang, Y.; Sun, H.; Sun, A.; Gui, D.; Xue, J.; Liao, W.; Yan, D.; Zhao, N.; Zeng, X. Error adjustment of TMPA satellite precipitation estimates and assessment of their hydrological utility in the middle and upper Yangtze River Basin, China. Atmos. Res. 2019, 216, 52–64. [Google Scholar] [CrossRef]
- Wang, Z.; Zhong, R.; Lai, C. Evaluation and hydrologic validation of TMPA satellite precipitation product downstream of the Pearl River Basin, China. Hydrol. Process. 2017, 31, 4169–4182. [Google Scholar] [CrossRef]
- Sheng, C.; Hu, J.; Zhang, Z.; Behrangi, A.; Yang, H.; Gebregiorgis, A.S.; Cao, J.; Hu, B.; Xue, X.; Zhang, X. Hydrologic Evaluation of the TRMM Multisatellite Precipitation Analysis Over Ganjiang Basin in Humid Southeastern China. IEEE J. Sel. Top. Appl. Earth Obs. Remote. Sens. 2017, 8, 4568–4580. [Google Scholar]
- Yang, N.; Zhang, K.; Hong, Y.; Zhao, Q.; Huang, Q.; Xu, Y.; Xue, X.; Chen, S. Evaluation of the TRMM multisatellite precipitation analysis and its applicability in supporting reservoir operation and water resources management in Hanjiang basin, China. J. Hydrol. 2017, 549, 313–325. [Google Scholar] [CrossRef]
- Yang, Y.; Du, J.; Cheng, L.; Xu, W. Applicability of TRMM satellite precipitation in driving hydrological model for identifying flood events: A case study in the Xiangjiang River Basin, China. Nat. Hazards 2017, 87, 1489–1505. [Google Scholar] [CrossRef]
- Meng, J.; Li, L.; Hao, Z.; Wang, J.; Shao, Q. Suitability of TRMM satellite rainfall in driving a distributed hydrological model in the source region of Yellow River. J. Hydrol. 2014, 509, 320–332. [Google Scholar] [CrossRef]
- Liu, M.; Xu, X.; Sun, A.Y.; Wang, K.; Yue, Y.; Tong, X.; Liu, W. Evaluation of high-resolution satellite rainfall products using rain gauge data over complex terrain in southwest China. Theor. Appl. Climatol. 2015, 119, 203–219. [Google Scholar] [CrossRef]
- Wang, Z.; Chen, J.; Lai, C.; Zhong, R.; Chen, X.; Yu, H. Hydrologic assessment of the TMPA 3B42-V7 product in a typical alpine and gorge region: The Lancang River basin, China. Hydrol. Res. 2018, 49, 2002–2015. [Google Scholar] [CrossRef]
- Yong, B.; Chen, S.; Chen, X.; Chen, B.; Gourley, J.J.; Ren, L.; Hong, Y.; Wang, W.; Gong, L. Intercomparison of the Version-6 and Version-7 TMPA precipitation products over high and low latitudes basins with independent gauge networks: Is the newer version better in both real-time and post-real-time analysis for water resources and hydrologic extremes? J. Hydrol. 2014, 508, 77–87. [Google Scholar]
- Yong, B.; Ren, L.-L.; Hong, Y.; Wang, J.-H.; Gourley, J.J.; Jiang, S.-H.; Chen, X.; Wang, W. Hydrologic evaluation of Multisatellite Precipitation Analysis standard precipitation products in basins beyond its inclined latitude band: A case study in Laohahe basin, China. Water Resour. Res. 2010, 46, 759–768. [Google Scholar] [CrossRef]
- Zhang, C.; Chen, X.; Shao, H.; Chen, S.; Liu, T.; Chen, C.; Ding, Q.; Du, H. Evaluation and intercomparison of high-resolution satellite precipitation estimates-GPM, TRMM, and CMORPH in the Tianshan Mountain Area. Remote Sens. 2018, 10, 1543. [Google Scholar] [CrossRef]
- Wang, X.; Ding, Y.; Zhao, C.; Wang, J. Validation of TRMM 3B42V7 Rainfall Product under Complex Topographic and Climatic Conditions over Hexi Region in the Northwest Arid Region of China. Water 2018, 10, 1006. [Google Scholar] [CrossRef]
- Yang, Y.; Luo, Y. Evaluating the performance of remote sensing precipitation products CMORPH, PERSIANN, and TMPA, in the arid region of northwest China. Theor. Appl. Climatol. 2014, 118, 429–445. [Google Scholar] [CrossRef]
- Zhang, Q.; Shi, P.; Singh, V.P.; Fan, K.; Huang, J. Spatial downscaling of TRMM-based precipitation data using vegetative response in Xinjiang, China: SPATIAL DOWNSCALING OF TRMM-BASED PRECIPITATION DATA. Int. J. Clim. 2017, 37, 3895–3909. [Google Scholar] [CrossRef]
- Sun, L.-Q.; Hao, Z.-C.; Wang, J.-H.; Nistor, I.; Seidou, O. Assessment and correction of TMPA products 3B42RT and 3B42V6. J. Hydraul. Eng. 2014, 45, 1135–1146. [Google Scholar]
- Guo, B.; Zhang, J.; Xu, T.; Croke, B.; Jakeman, A.; Song, Y.; Yang, Q.; Lei, X.; Liao, W. Applicability Assessment and Uncertainty Analysis of Multi-Precipitation Datasets for the Simulation of Hydrologic Models. Water 2018, 10, 1611. [Google Scholar] [CrossRef]
- Li, X.-H.; Zhang, Q.; Xu, C.-Y. Suitability of the TRMM satellite rainfalls in driving a distributed hydrological model for water balance computations in Xinjiang catchment, Poyang lake basin. J. Hydrol. 2012, 426–427, 28–38. [Google Scholar] [CrossRef]
- Wu, Z.; Zhang, Y.; Sun, Z.; Lin, Q.; He, H. Improvement of a combination of TMPA (or IMERG) and ground-based precipitation and application to a typical region of the East China Plain. Sci. Total Environ. 2018, 640–641, 1165–1175. [Google Scholar] [CrossRef] [PubMed]
- Hu, Q.; Yang, D.; Wang, Y.; Yang, H.; Liu, Y. Characteristics and sources of errors in daily TRMM precipitation product over Ganjiang River basin in China. Adv. Water Sci. 2013, 24, 794–800. [Google Scholar]
- Xu, R.; Tian, F.; Yang, L.; Hu, H.; Lu, H.; Hou, A. Ground validation of GPM IMERG and TRMM 3B42V7 rainfall products over southern Tibetan Plateau based on a high-density rain gauge network: Validation of GPM and TRMM Over TP. J. Geophys. Res. Atmos. 2017, 122, 910–924. [Google Scholar] [CrossRef]
- Zeng, H.; Li, L. Accuracy validation of TRMM 3B43 data in Lancang river basin. Acta Geogr. Sin. 2011, 66, 994–1004. [Google Scholar]
- Levine, R.A. Statistical Methods in the Atmospheric Sciences. J. Am. Stat. Assoc. 2000, 95, 344–345. [Google Scholar] [CrossRef]
- Torgo, L. Data Mining with R: Learning with Case Studies, 2nd ed.; Chapman and Hall/CRC: London, UK, 2017; ISBN 1-4822-3489-0 978-1-4822-3489-3. [Google Scholar]
- Yao, J.; Tan, C.L. A case study on using neural networks to perform technical forecasting of forex. Neurocomputing 2000, 34, 79–98. [Google Scholar] [CrossRef] [Green Version]
- Prakash, S.; Mitra, A.K.; AghaKouchak, A.; Pai, D.S. Error characterization of TRMM Multisatellite Precipitation Analysis (TMPA-3B42) products over India for different seasons. J. Hydrol. 2015, 529, 1302–1312. [Google Scholar] [CrossRef]
- Aghakouchak, A.; Mehran, A.; Norouzi, H.; Behrangi, A. Systematic and random error components in satellite precipitation data sets. Geophys. Res. Lett. 2012, 39, 4. [Google Scholar] [CrossRef]
- Nastos, P.T.; Kapsomenakis, J.; Philandras, K.M. Evaluation of the TRMM 3B43 gridded precipitation estimates over Greece. Atmos. Res. 2016, 169, 497–514. [Google Scholar] [CrossRef]
- Ng, A.Y.; Jordan, M.I.; Weiss, Y. On spectral clustering: Analysis and an algorithm. In the Advances in Neural Information Processing Systems 14; Dietterich, T.G., Becker, S., Ghahramani, Z., Eds.; MIT Press: Cambridge, MA, USA, 2002; pp. 849–856. [Google Scholar]
- Cristianini, N.; Shawe-Taylor, J.; Kandola, J. Spectral kernel methods for clustering. In the Advances in Neural Information Processing Systems 14; Dietterich, T.G., Becker, S., Ghahramani, Z., Eds.; MIT Press: Cambridge, MA, USA, 2002; pp. 649–655. [Google Scholar]
- Jeribi, A. Spectral Theory and Applications of Linear Operators and Block Operator Matrices, 2015th ed.; Springer: Berlin, Germany, 2015; ISBN 3-319-17565-3. [Google Scholar]
- Luxburg, U. von A tutorial on spectral clustering. Stat. Comput. 2007, 17, 395–416. [Google Scholar] [CrossRef]
- Shi, J.; Malik, J. Normalized cuts and image segmentation. IEEE Trans. Pattern Anal. Mach. Intell. 2000, 22, 888–905. [Google Scholar]
- Iso, K. Speaker clustering using vector quantization and spectral clustering. In Proceedings of the 2010 IEEE International Conference on Acoustics, Speech and Signal Processing, Dallas, TX, USA, 14–19 March 2010; pp. 4986–4989. [Google Scholar]
- Paccanaro, A.; Casbon, J.A.; Saqi, M.A.S. Spectral clustering of protein sequences. Nucleic Acids Res. 2006, 34, 1571–1580. [Google Scholar] [CrossRef] [PubMed]
- Noulas, A.; Scellato, S.; Mascolo, C.; Pontil, M. Exploiting semantic annotations for clustering geographic areas and users in location-based social networks. In Proceedings of the the Fifth International AAAI Conference on Weblogs and Social Media, Barcelona, Spain, 17–21 July 2011; Volume WS-11-02, pp. 32–35. [Google Scholar]
- Jiang, Q.; Yan, X. Nonlinear plant-wide process monitoring using MI-spectral clustering and Bayesian inference-based multiblock KPCA. J. Process. Control. 2015, 32, 38–50. [Google Scholar] [CrossRef]
- Wang, J.-F.; Li, X.-H.; Christakos, G.; Liao, Y.-L.; Zhang, T.; Gu, X.; Zheng, X.-Y. Geographical Detectors-Based Health Risk Assessment and its Application in the Neural Tube Defects Study of the Heshun Region, China. Int. J. Geogr. Inf. Sci. 2010, 24, 107–127. [Google Scholar] [CrossRef]
- Wang, J.-F.; Hu, Y. Environmental health risk detection with GeogDetector. Environ. Modell. Softw. 2012, 33, 114–115. [Google Scholar] [CrossRef]
- Ren, Y.; Deng, L.; Zuo, S.; Luo, Y.; Shao, G.; Wei, X.; Hua, L.; Yang, Y. Geographical modeling of spatial interaction between human activity and forest connectivity in an urban landscape of southeast China. Landsc. Ecol. 2014, 29, 1741–1758. [Google Scholar] [CrossRef]
- Yang, R.; Liu, Y.; Long, H.; Qiao, L. Spatio-temporal characteristics of rural settlements and land use in the Bohai Rim of China. J. Geogr. Sci. 2015, 25, 559–572. [Google Scholar] [CrossRef] [Green Version]
- Zhan, D.; Kwan, M.-P.; Zhang, W.; Fan, J.; Yu, J.; Dang, Y. Assessment and determinants of satisfaction with urban livability in China. Cities 2018, 79, 92–101. [Google Scholar] [CrossRef]
- Yang, Y.; Cheng, G.; Fan, J.; Sun, J.; Li, W. Representativeness and reliability of satellite rainfall dataset in alpine and gorge region. Adv. Water Sci. 2013, 24, 24–33. [Google Scholar]
- Cai, Y.; Jin, C.; Wang, A.; Guan, D.; Wu, J.; Yuan, F.; Xu, L. Comprehensive precipitation evaluation of TRMM 3B42 with dense rain gauge networks in a mid-latitude basin, northeast, China. Theor. Appl. Climatol. 2016, 126, 659–671. [Google Scholar] [CrossRef]
- Utsumi, N.; Kim, H. Warm Season Satellite Precipitation Biases for Different Cloud Types Over Western North Pacific. IEEE Geosci. Remote Sens. Lett. 2018, 15, 808–812. [Google Scholar] [CrossRef]
- Kobayashi, T.; Adachi, A. Precipitation and cloud properties derived from synergetic use of the TRMM sensors. In Proceedings of the SPIE, Goa, India, 5 December 2006; Volume 6404, p. 64040D. [Google Scholar]
Figure 1.
Elevation Model (DEM) data and distribution of the 797 rain gauge stations in mainland China.
Figure 1.
Elevation Model (DEM) data and distribution of the 797 rain gauge stations in mainland China.

Figure 2.
Annual average precipitation revealed by the 3B42V7 data (a) and rain gauge station data (b) in mainland China.
Figure 2.
Annual average precipitation revealed by the 3B42V7 data (a) and rain gauge station data (b) in mainland China.

Figure 3.
Flow chart of the research process.

Figure 4.
Spatial distribution of R, at the daily (a) and monthly (b) scale of the 3B42V7 data in mainland China.
Figure 4.
Spatial distribution of R, at the daily (a) and monthly (b) scale of the 3B42V7 data in mainland China.

Figure 5.
Spatial distribution of the NMSE at the daily (a) and monthly (b) scale of the 3B42V7 data in mainland China.
Figure 5.
Spatial distribution of the NMSE at the daily (a) and monthly (b) scale of the 3B42V7 data in mainland China.

Figure 6.
Spatial distribution of the daily (a) and (b) of the 3B42V7 data in mainland China.

Figure 7.
Spatial distribution of the monthly (a) and (b) of the 3B42V7 data in mainland China.

Figure 8.
Spatial distribution of the BABS (a) and HSS (b) of the 3B42V7 data in mainland China.

Figure 9.
Division of accuracy level areas of China.

Figure 10.
Distribution of the accuracy indicators of the three accuracy level areas. The box plots display the statistical accuracy indicators at the daily and monthly scales. The upper and lower edges of the box indicate the upper and lower quartiles (75% and 25%, respectively); the solid line in the box indicates the median; the points indicate the outliers.

Figure 11.
Result of the factor detector of accuracy indicators.

Figure 12.
Values of of interaction detection for accuracy indicators (“☆” indicates bivariate enhancement, while “★” indicates nonlinear enhancement).
Figure 12.
Values of of interaction detection for accuracy indicators (“☆” indicates bivariate enhancement, while “★” indicates nonlinear enhancement).


Table 1.
Formulas of the accuracy indicators.
| Accuracy Indicator | Calculation Formulas | Comments | Perfect Value |
|---|---|---|---|
| R | is the rain gauge station data, and is its mean value; is the data of the 3B42V7, and is its mean value. | 1 | |
| BABS | 0% | ||
| NMSE | 0 | ||
| is calculated as follows: Note that a, b are slope and intercept of P~Q least squares regression line respectively. P, Q are ibid. | 0 | ||
| 0 | |||
| POD | is the frequency of rain for 3B42V7 data and rain gauge station data; is the frequency of occurrence of rainfall events in the former and no occurrence of rainfall events in the latter; is the frequency of no occurrence of rainfall events in the former and occurrence of rainfall events in the latter; is the frequency of both without rain. | 1 | |
| FAR | 0 | ||
| HSS | 1 |
Note: R-Pearson correlation coefficient, BABS-absolute bias, NMSE-normalized mean square error, NMSEsys-systematic normalized mean square error, NMSErnd-random normalized mean square error, POD- probability of detection, FAR-false alarm ratio, HSS-Heidke’s skill score.
© 2019 by the authors. Licensee MDPI, Basel, Switzerland. This article is an open access article distributed under the terms and conditions of the Creative Commons Attribution (CC BY) license (http://creativecommons.org/licenses/by/4.0/).
Share and Cite
MDPI and ACS Style
Deng, Z.; Wang, Z.; Lai, C. Spatial Error Distribution and Error Cause Analysis of TMPA-3B42V7 Satellite-Based Precipitation Products over Mainland China. Water 2019, 11, 1435. https://doi.org/10.3390/w11071435
AMA Style
Deng Z, Wang Z, Lai C. Spatial Error Distribution and Error Cause Analysis of TMPA-3B42V7 Satellite-Based Precipitation Products over Mainland China. Water. 2019; 11(7):1435. https://doi.org/10.3390/w11071435
Chicago/Turabian StyleDeng, Zifeng, Zhaoli Wang, and Chengguang Lai. 2019. "Spatial Error Distribution and Error Cause Analysis of TMPA-3B42V7 Satellite-Based Precipitation Products over Mainland China" Water 11, no. 7: 1435. https://doi.org/10.3390/w11071435
Note that from the first issue of 2016, this journal uses article numbers instead of page numbers. See further details here.