Article

Using Internet Surveys to Estimate Visitors’ Willingness to Pay for Coral Reef Conservation in the Kenting National Park, Taiwan

by
Nathaniel Maynard
1,
Pierre-Alexandre Château
2,3,*,
Lauriane Ribas-Deulofeu
3,4,5 and
Je-Liang Liou
1,*
1
Center for Green Economy, Chung-Hua Institution for Economic Research, Taipei 10672, Taiwan
2
Department of Marine Environment and Engineering, National Sun Yat-sen University, Kaohsiung 80424, Taiwan
3
Biodiversity Research Center, Academia Sinica, Taipei 11529, Taiwan
4
Biodiversity Program, Taiwan International Graduate Program, Academia Sinica & National Taiwan Normal University, Taipei 11529, Taiwan
5
Department of Life Science, National Taiwan Normal University, Taipei 10610, Taiwan
*
Authors to whom correspondence should be addressed.
Water 2019, 11(7), 1411; https://doi.org/10.3390/w11071411
Submission received: 30 April 2019 / Revised: 5 July 2019 / Accepted: 8 July 2019 / Published: 9 July 2019
(This article belongs to the Special Issue Coastal Resources Economics and Ecosystem Valuation)

Abstract

:
Without appropriate conservation action, coral reefs globally continue to degrade, causing declines in economic value. Therefore, their local conservation and quantifying its benefits become increasingly important. However, accurately measuring these values remains expensive or complicated. Leveraging digital survey tools, an interdisciplinary on-line survey was created to estimate willingness to pay (WTP) for coral reef conservation using pictures and ecological data. Using the contingent valuation method we estimate current values as well as changes in value due to restoration or degradation for coral ecosystems in the Kenting National Park (KNP) in Taiwan. Results suggest that conserving degraded coral reef ecosystems leads to larger gains in value than healthier ones. Average WTP estimates a non-market economic value of 680 million US$ per year for the whole KNP marine area. Despite potential self-reporting bias and limits on sample size, these values appear consistent with similar studies and suggest future economic sampling strategies for KNP.

1. Introduction

The oceans provide trillions of dollars in economic and biodiversity values. It has been estimated that corals, mangroves and marine fisheries have a global asset value of US$ 6.9 trillion and that nearly three billion people rely on fish as a major source of animal protein [1]. However, due to pressures from pollution, climate change and overfishing, marine assets continuously decline [1,2].
Marine reserves have evolved to not only restrict fishing but also as resource management zones to reverse this trend [3]. Well managed marine resources provide sustained economic benefits over time primarily in the form of tourism, cultural, food and climate change mitigation value [4,5,6]. Proper marine protected areas management requires sustainable funding and adequate local capacity to increase biodiversity [7,8]. Unfortunately, global marine conservation remains inadequate, especially in the Asia-Pacific region [9,10].

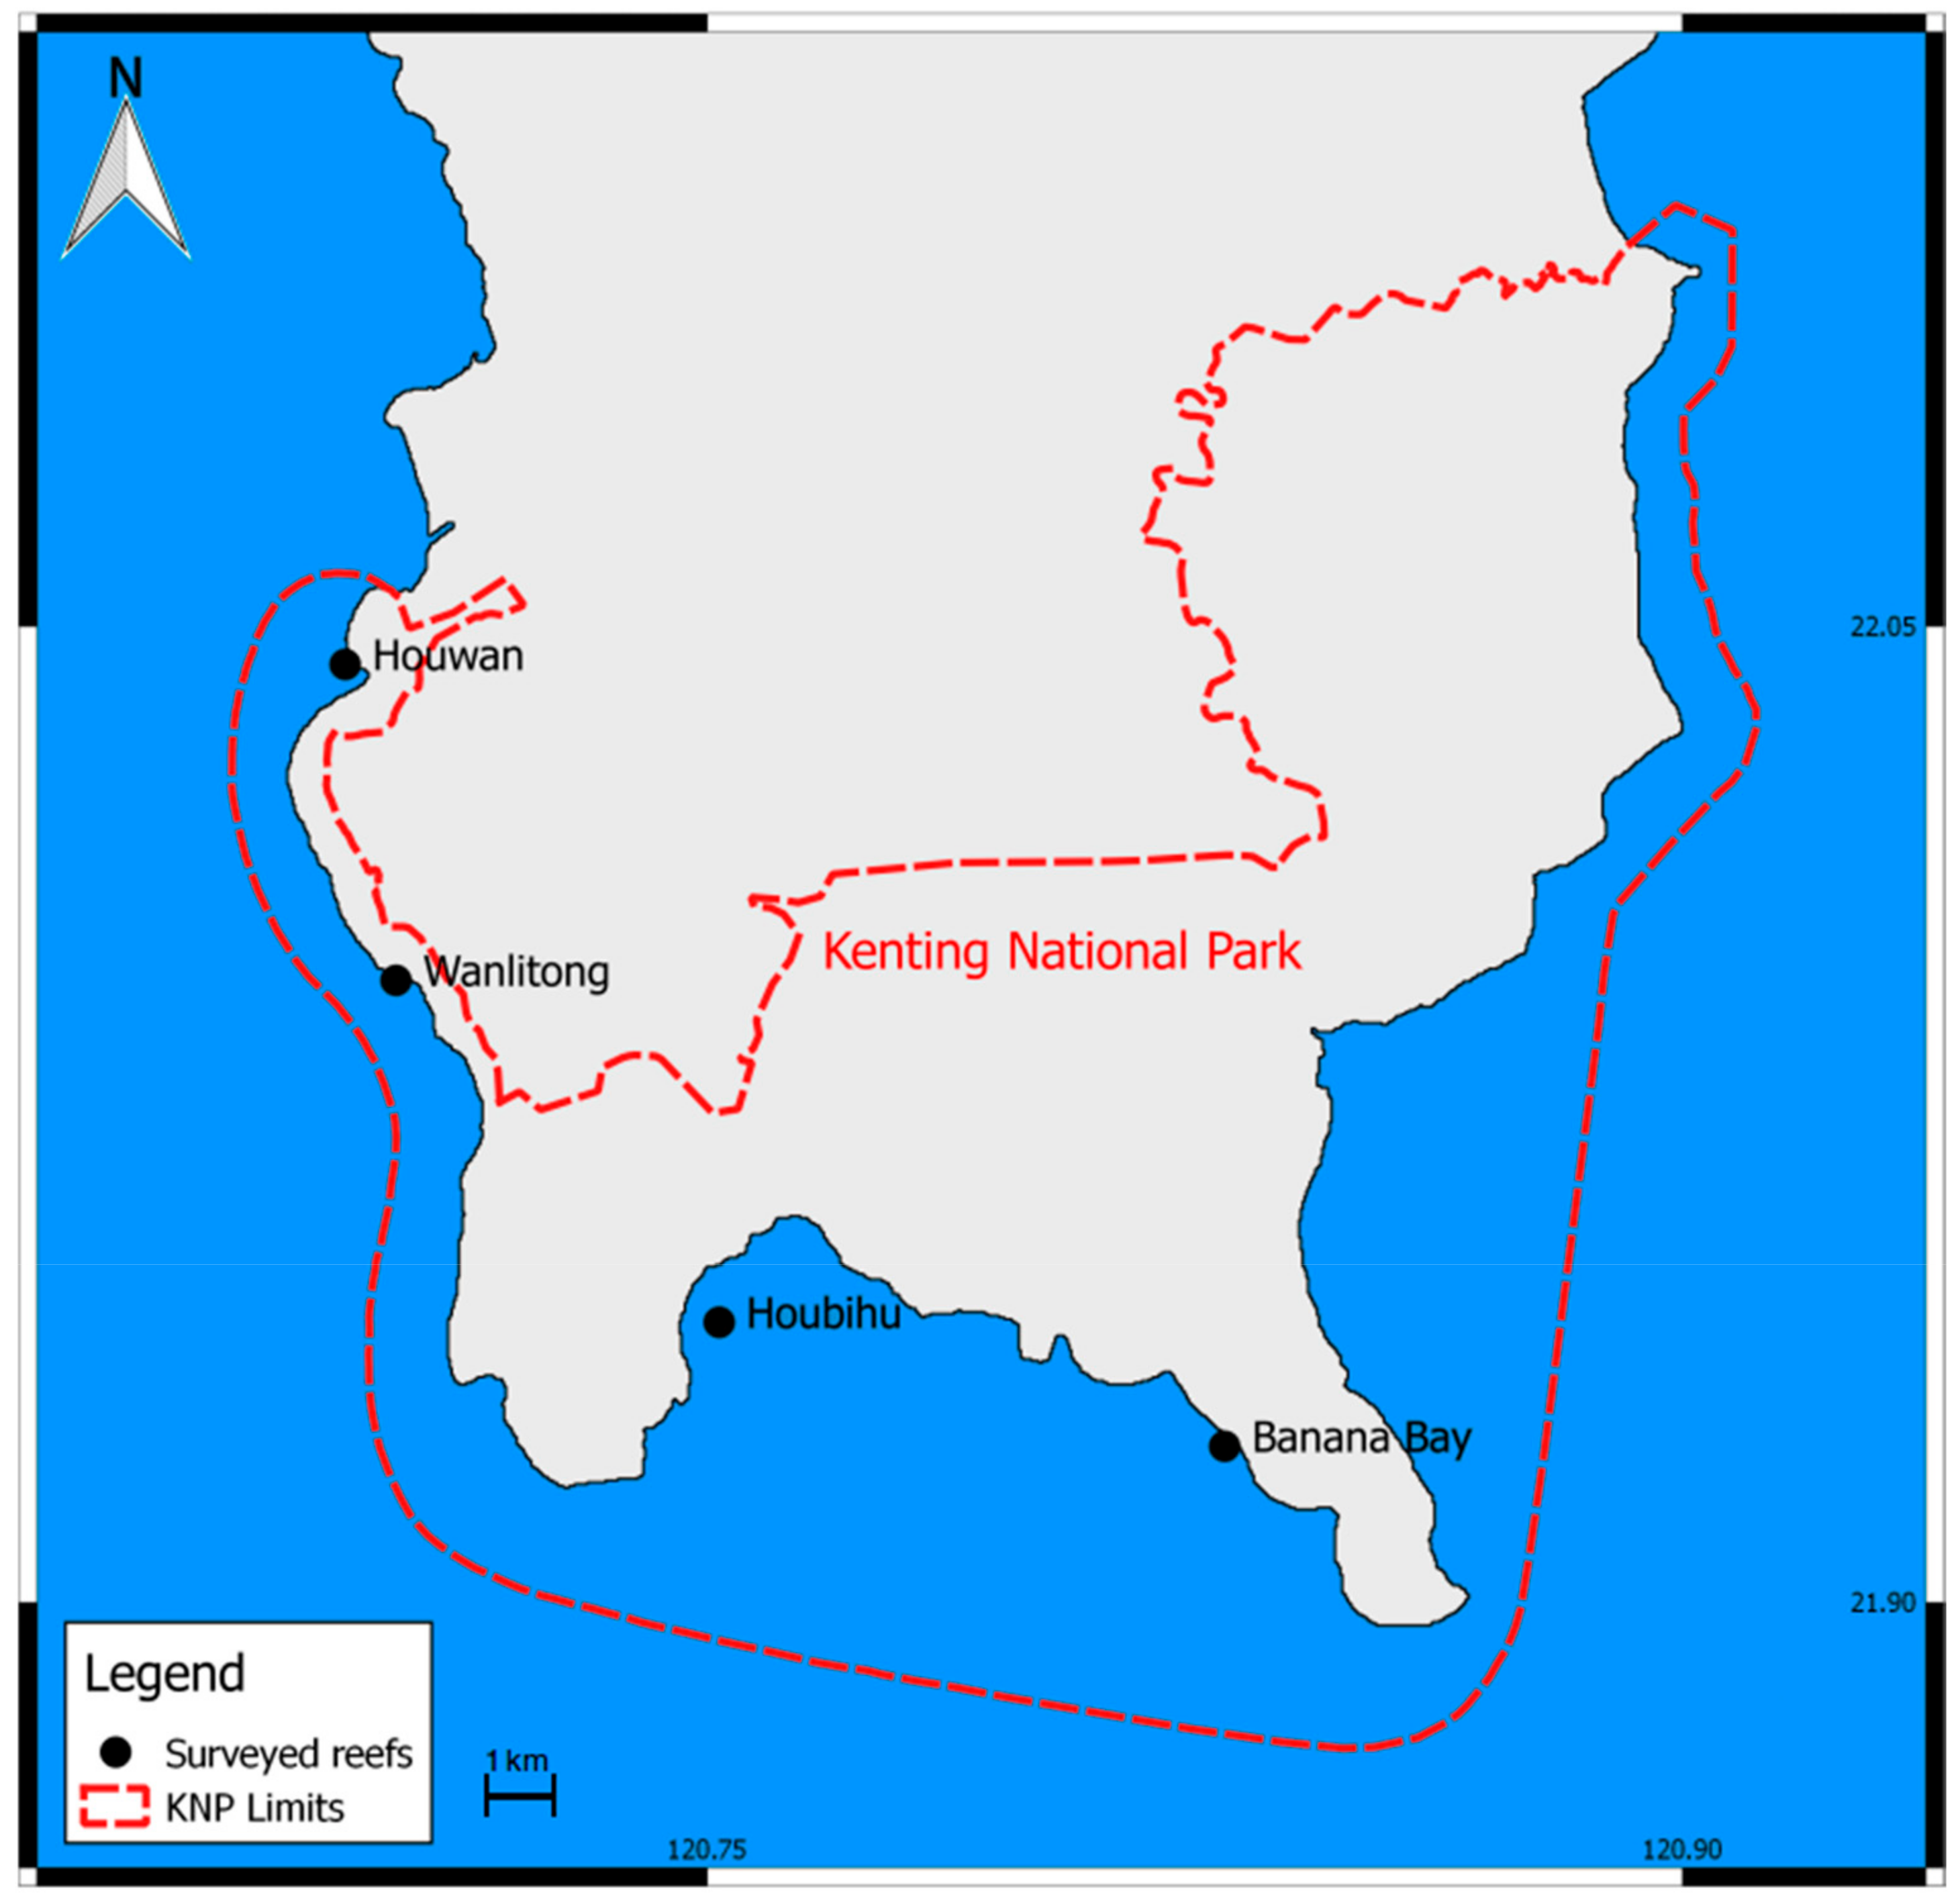
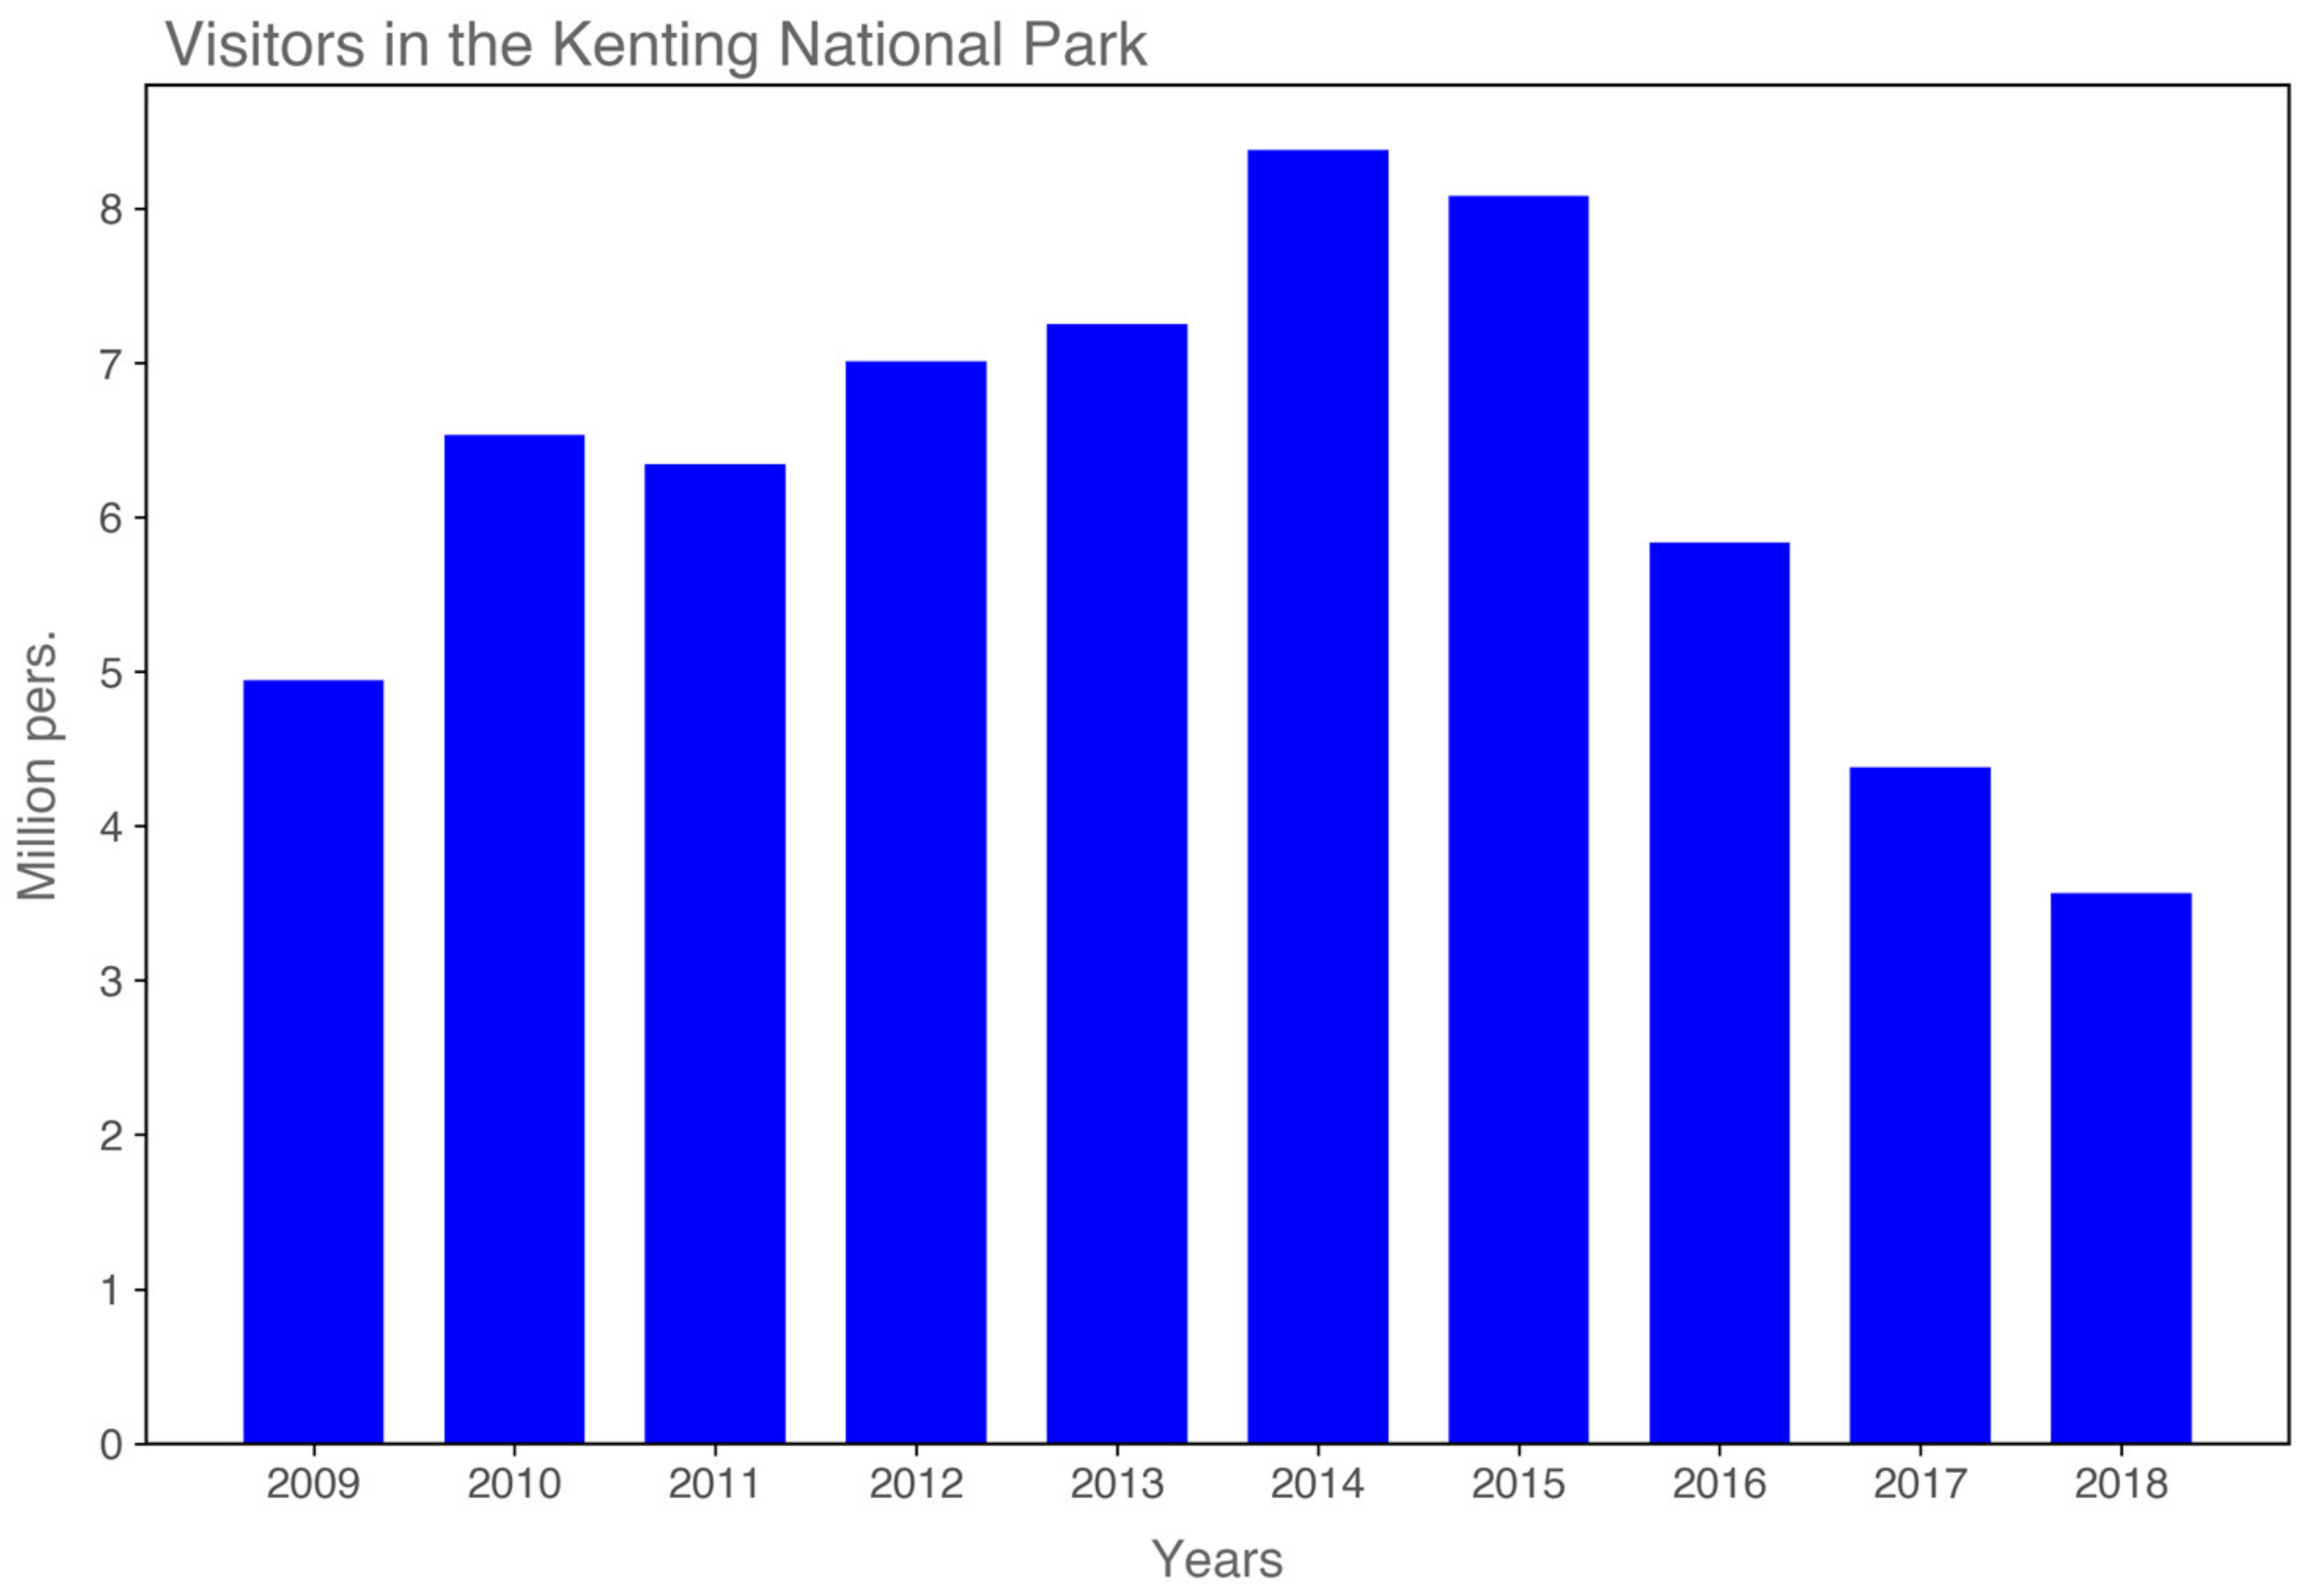
1.1. Background on the Kenting National Park

Located in East Asia, Taiwan has tremendous marine and terrestrial biodiversity, especially in term of coral reef associated organisms [11,12]. Its reef associated biodiversity had put Taiwan among the worldwide ten most important marine hotspots of biodiversity [13]. The Kenting National Park (KNP) established in 1984 in the southern Hengchun Peninsula of Taiwan covers a terrestrial area of 181 km2 and a marine area of 150 km2 (Figure 1) and contains high levels of biodiversity, especially corals [14,15]. The KNP’s impressive natural features and beaches draw millions of tourists per year (Figure 2). With a peak above eight million visitors in 2014, tourism has declined to just under four million in 2018.
Despite the recent decline in visitors, excessive nutrient pollution from tourism [16,17,18], persistent overfishing [19] and coastal development continue to degrade coral reefs [20,21,22]. Locally induced anthropogenic disturbances combined with typhoons and past bleaching events in Kenting are responsible for the loss of more than 50% of the coral coverage and an increase by almost three folds of macro-algae over the last three decades [22]. Rapid phase-shift from Acropora dominated state to sea-anemone Condylactis has been observed in Nanwan Bay [23]. A combination of bleaching events and typhoons followed by subsequent landslides and sewage overflows was suspected to be the cause of the rapid shift in the community as well as the local loss of biodiversity. Instead of the sudden regime shifts from destructive fishing practices commonly found in Asia-Pacific coral regions, the KNP reefs risk slowly yet irreversibly shifting to a lower biodiversity state with decreasing ecosystem services [24,25], which could also damage local livelihoods [26]. These corals may regenerate to a pre-disturbed state but are unlikely to unless conservation measures are enacted [15,23].

1.2. Coral Reef Valuation

Coral reef valuation started in the late 1980s focusing on coral reef degradation. By 2000, over 100 coral reef studies existed, and Brander et al. created the first meta evaluation based on recreational value [5]. Their analysis reveals that the worldwide average value of coral reef recreation is 184 US$ per person per visit. The median value, however, is 17 US$ per person per visit, showing that the distribution of values is skewed with a long tail of high values.
An evaluation of global ecosystem services found that coral reefs on average provided 352,249 INT$/ha/year, with most of this value coming from outside the market [27,28]. Another recent global study has found an average coral reef tourism value of 482,428 US$/km2/year [6].
Several studies have estimated consumer surplus of national parks in Taiwan, although few have asked directly about coral [29,30]. Other studies have looked at the transportation cost of accessing Nanwan Beach, one of the most important coastal recreation areas in Kenting, but did not ask respondents specifically about coral reefs [31]. Others have asked about the impacts of oil spills [32]. Lastly, one study asked about the overall impact of climate change on coral for all of Taiwan [33].
All these previous studies look at different aspects of valuing coastal natural ecosystems in Taiwan. To improve conservation outcomes, how could one understand the benefits of conservation specifically for coral reefs in Taiwan updated with on-line sampling techniques? Would the public both adjacent to the park and far away support such measures? Due to high levels of tourism and challenges with park enforcement, the KNP is an ideal study site both in terms of potential information and need for updated economic valuation.
Natural resource economics has emerged to help policy makers and the wider community understand the economic benefits of conservation and how to fund such initiatives. Often, researchers use benefit transfers to quickly estimate values. A benefit transfer, where values from one natural resource valuation study are transferred from one site to another, allows for rapid estimates of ecosystem services [34]. While generally accepted to provide order of magnitude estimates, some have pointed out criticisms of benefit transfer regarding accuracy. Study quality and methodology can explain around 75% of variance between studies [35]. With such a variance in quality, cost and training become limiting factors for accuracy. Others have identified techniques to lower inaccuracy including adapting currency, matching transfers based on cultural similarity, habitat similarity and reef health [36]. Despite large amounts of tourism, valuation based on benefit transfers will not likely yield valuable results as Kenting has a relatively small (15,200 ha) fringing reef with very high tourism [37]. Spatially-based benefit-transfer estimations would therefore not yield accurate values.
Numerous studies have noted that visual criteria strongly influence willingness to pay (WTP) in corals [38], particularly water clarity [39] and fish abundance [40,41]. KNP has a diverse array of coral ecosystems across the peninsula spanning a wide mixture of soft and hard corals. Water clarity also changes due to a mix of anthropogenic and natural factors. Fish abundance and diversity depends on coral diversity and by association coral coverage [42].
Therefore, a rapid digital assessment of coral ecosystem value would help address key cost and accuracy concerns while also providing useful data for other sectors. This study aims to estimate visitors and residents WTP for coral reef conservation in the KNP. On this basis, a WTP function of coral coverage is fitted as a tool to estimate the economic value of different sites in southern Taiwan. The estimation results of this study provide a useful reference point for further usage of benefit transfer for evaluation of coral reef with diverse coverages.

2. Materials and Methods

2.1. Contingent Valuation Method

As a stated preference technique, contingent valuation (CV) has the potential to capture non-use and indirect values [43], which are crucial value components of coral reefs. CV surveys ask respondents to imagine a realistic scenario where they would spend money on a conservation activity in order to estimate the perceived value for that ecosystem or service [44].
The inspiration for asking questions digitally came from a study in Israel where the researchers used computer enhanced images to selectively remove coral, fish and other attributes in order to find values of each attribute [45]. Besides demographic information, we also wanted to collect visitation data, which can be useful for the tourism and public sector to better manage capacity. Other studies use hypothetical scenarios to estimate the value of restoring entire ecosystems and then apply those findings to larger regions [46]. Previous literature suggests that digital surveys do not have significantly different outcomes from in person surveys [47,48,49]. Moreover, an on-line questionnaire allows researchers to collect more responses than a typical survey, especially from users who do not frequently visit natural sites.

2.2. Survey Design

An initial pre-test was given to a group of 15 students at the College of Marine Sciences, National Sun Yat-sen University. Based on their responses, the survey was modified to improve clarity. The elicitation method in this phase was an open-ended format, and the results constituted the basis on which the payment card bidding levels were adjusted.
The survey was available on-line from May 2016 to mid-June 2016. The text was written in Mandarin Chinese on Google Forms and shared through email lists and Facebook posts with an emphasis on coral or dive groups and academic groups. Given funding limitations, we used a snowball approach to share the survey among various groups.
The survey begins with a short explanation on Kenting’s biodiversity, threats to coral, as well as who the researchers were and what they plan to use the data for. The survey then collected demographic data including questions asking for gender, age, educational level, occupation, income, participation in environmental non-governmental organization (NGO) activities and place of residence. Respondents were then asked if they have been to the KNP before, how many times do they have visited in the past five years, how long did they stay and to indicate if they SCUBA dive or snorkel in the park.
After these questions about usage, they were asked valuation questions based on photographs of coral at different locations in the park. The question for willingness to pay was framed as a yearly payment into a “coral reef conservation fund” established by the government to maintain coral health at its current level. The site values were cumulative, as we asked the users at the start of the survey to pay for four sites. Below is the description text before the pictures:
“The KNP can be divided into four different regions based on ecosystem type (diversity and type of species) and health (quality and abundance). In Taiwan, the healthiest regions typically have coral covering 75% of the zone. However, with increasing tourism and pollution, coral coverage and diversity has decreased. To reverse this decline, the government will potentially set up a “Coral Protection Trust” (managed by an independent board) to enforce existing laws and prevent further degradation. In the next section, we will show you four pictures representing different regions and levels of coral coverage: Wanlitong (28% coral coverage), Houwan (32% coral coverage), Banana Bay (40% coral coverage) and Houbihu (50% coral coverage). We wish to know the amount you would be willing to pay for the conservation fund for each site to maintain its current state and prevent further degradation.”
Participants were shown four separate pictures of different coral reefs around the KNP with varying levels of ecosystem quality (Figure 3). Each picture contained a short description and had a range of payments to select from (less than 3.2 US$/person/year to more than 64 US$/person/year, with increments of 3.2 US$/person/year).

2.3. Pictures Selection

Images were selected to best represent the ecosystem quality of the four zones. The main factors we looked at when assessing coral reef ecosystem health included: coral coverage, algae abundance and fish abundance. Using ecological field studies as a reference, the survey presented a sample of coral sites that formed a steady progression of coral coverage (Table 1). In the pre-test, respondents tended to value corals along a progression in quality regardless of actual coral quality; embracing this, the survey was modified to include descriptions of coral quality at each stage to mitigate this bias. Coral pictures were then ranked from least coverage to highest (Figure 3).
Each picture included a short description of the area and any important features including location. Biological information is based on recent field data [15] and was summarized in very simple terms.
“Picture 1 (Figure 3a): Wanlitong (average coral reef coverage of 28%). This area is located between the marine ecological protection zone (Haishengyi) and the Haidi Park on the western coast of Kenting. It is characterized by a moderate coral coverage, a low number of fish and high biomass of seaweed.
Picture 2 (Figure 3b): Houwan (average coral reef coverage of 32%). This area is located on the western coast of Kenting, close to the homes of local residents and a large resort hotel. The environment is characterized by a moderate coral coverage, low quantities of fish and a moderate amount of seaweed.
Picture 3 (Figure 3c): Banana Bay (average coral reef coverage of 40%). This area is located in the ecological protection area (Haisheng III) on the east side of Nanwan Bay. There are only a few hotels in the vicinity, and the environmental characteristics are better than in Wanlitong. Banana Bay has a higher coral reef coverage, a moderate amount of fish and a small amount of seaweed.
Picture 4 (Figure 3d): Houbihu (average coral reef coverage of 50%). This area is currently a marine resource protection demonstration zone with rich coral reef ecology. Coral coverage is high, fish are diverse and abundant, and the amount of seaweed is relatively low. Houbihu is a popular area for scuba diving and snorkeling.”
Before each picture respondents had to check a box to indicate whether or not they would be willing to pay for that specific site. If respondents indicated they would not be willing to pay, they would receive an additional question at the end asking them why they did not want to pay into the coral conservation fund. Several potential reasons were proposed, such as “It’s the government’s responsibility to protect coral” and “Corals have no value to me”. Space was included to write in a personal reason that was not listed.

3. Results

Some degree of bias is unavoidable in WTP surveys especially with smaller sample sizes and with non-random sample groups. To minimize that interference, an ex-post data screening approach was used [50]: We used winsorization to limit the 5% extreme values. Self-selection bias for Internet surveys does not appear to be significantly stronger than that of in person surveys; as with any form of survey, there is some degree of self-selection [47].
We collected 296 responses of which 231 were considered appropriate for the survey. A total of 26 protest responses opted to fill out the survey but did not provide any WTP information, with the most common reason being “It’s the government’s responsibility to protect coral”. Other reasons include: “Corals have no value to me”, “I don’t trust an organization to conserve coral reefs”, “Local industries should take the responsibility of protecting corals”, “Before contributing, I need to see for the effectiveness of conservation”. The remaining 39 excluded responses either did not fill in the survey completely or improperly filled in answers.

3.1. Demographics

According to Table 2, collected demographic information was similar to average demographics in Taiwan although slightly biased towards the environment, higher salaries and with more men represented. One potential source of bias in the WTP values comes from 39% of respondents having participated in some form of environmental conservation activities, although that group could include non-profit membership to a hobby group such as diving.
Additionally, the sample had higher levels of educational level than the average in Taiwan. Previous studies have shown that educational attainment, income and environmental group membership increase WTP value [33]. The average age of the sample size was 33, which is slightly younger than the median age in Taiwan. The gender ratio was fairly split with males making up 53% (139) and females 47% (122).
The average wage (1344.79 US$/month) was likely driven up by higher incomes from professionals. While the most common response of 159.3 US$/month reflected the large amount of student responses (71). The median salary was 1115.1 US$/month.
Occupations fell primarily into service (48), student (71), industry (53), or public service/education (49). This means roughly 46% of respondents are in some way connected to academia or public service.
Next, we asked about visitation rates to KNP. We found the vast majority of respondents (239 i.e. 91.5%) had already been to KNP but only 190 (73%) within the last five years. Among them, only 98 (37.5%) saw coral during a snorkeling or scuba diving trip. This number is likely higher than the national average due to a large amount of responses from diving or environmental groups, although no such diving surveys could be found.
The average visitation rate in the past five years was 5.22 times, with a median of two and a mode of one visit. We also asked how many times participants went scuba diving with an average response of 17.95 and a median and mode of zero. This suggests that there are high frequency divers in the survey. Snorkeling was not as popular with the average reaching 2.36 times over five years, with zero and zero for median and mode respectively.

3.2. Willingness to Pay for the Four Pictures

The mean WTP (US$/person/year) for pictures 1 through 4 was equal to 16.0 ± 2.16, 18.55 ± 2.2, 20.46 ± 2.33, 25.15 ± 2.64, respectively. These values can be taken cumulatively to find a total WTP for the conservation of Kenting’s corals of 80.160 ± 8.678 US$/person/year or 0.53 US$/km2/person/year.
To test the equality of WTP across pictures, the nonparametric Kruskal–Wallis (KW) equality-of-population rank test [51] was employed (Table 3). According to the results of this test, almost all pairwise comparisons showed significant differences; only the WTP of pictures 2 and 3 were not distinguishable at the 10% level.
We organized the responses into a series of paired groups, according to the demographic information collected in the first section of the survey:
-
People that once participated in an NGO activity vs. those who did not;
-
Men vs. Women;
-
Local people (Southern Taiwan) vs. tourists (Central and Northern Taiwan);
-
Higher education (higher than college) vs. lower education (lower than college);
-
Young people (less than 33 years old) vs older people (more than 33 years old).
We then used the KW test to assess whether the WTP of the paired groups were similarly distributed or not. The KW test did not find significant differences between the paired groups, but a small effect size was observable for NGO affiliation, residency and age. Table 4 provides the total WTP for each group and the effect size as measured by Cohen’s d [52].

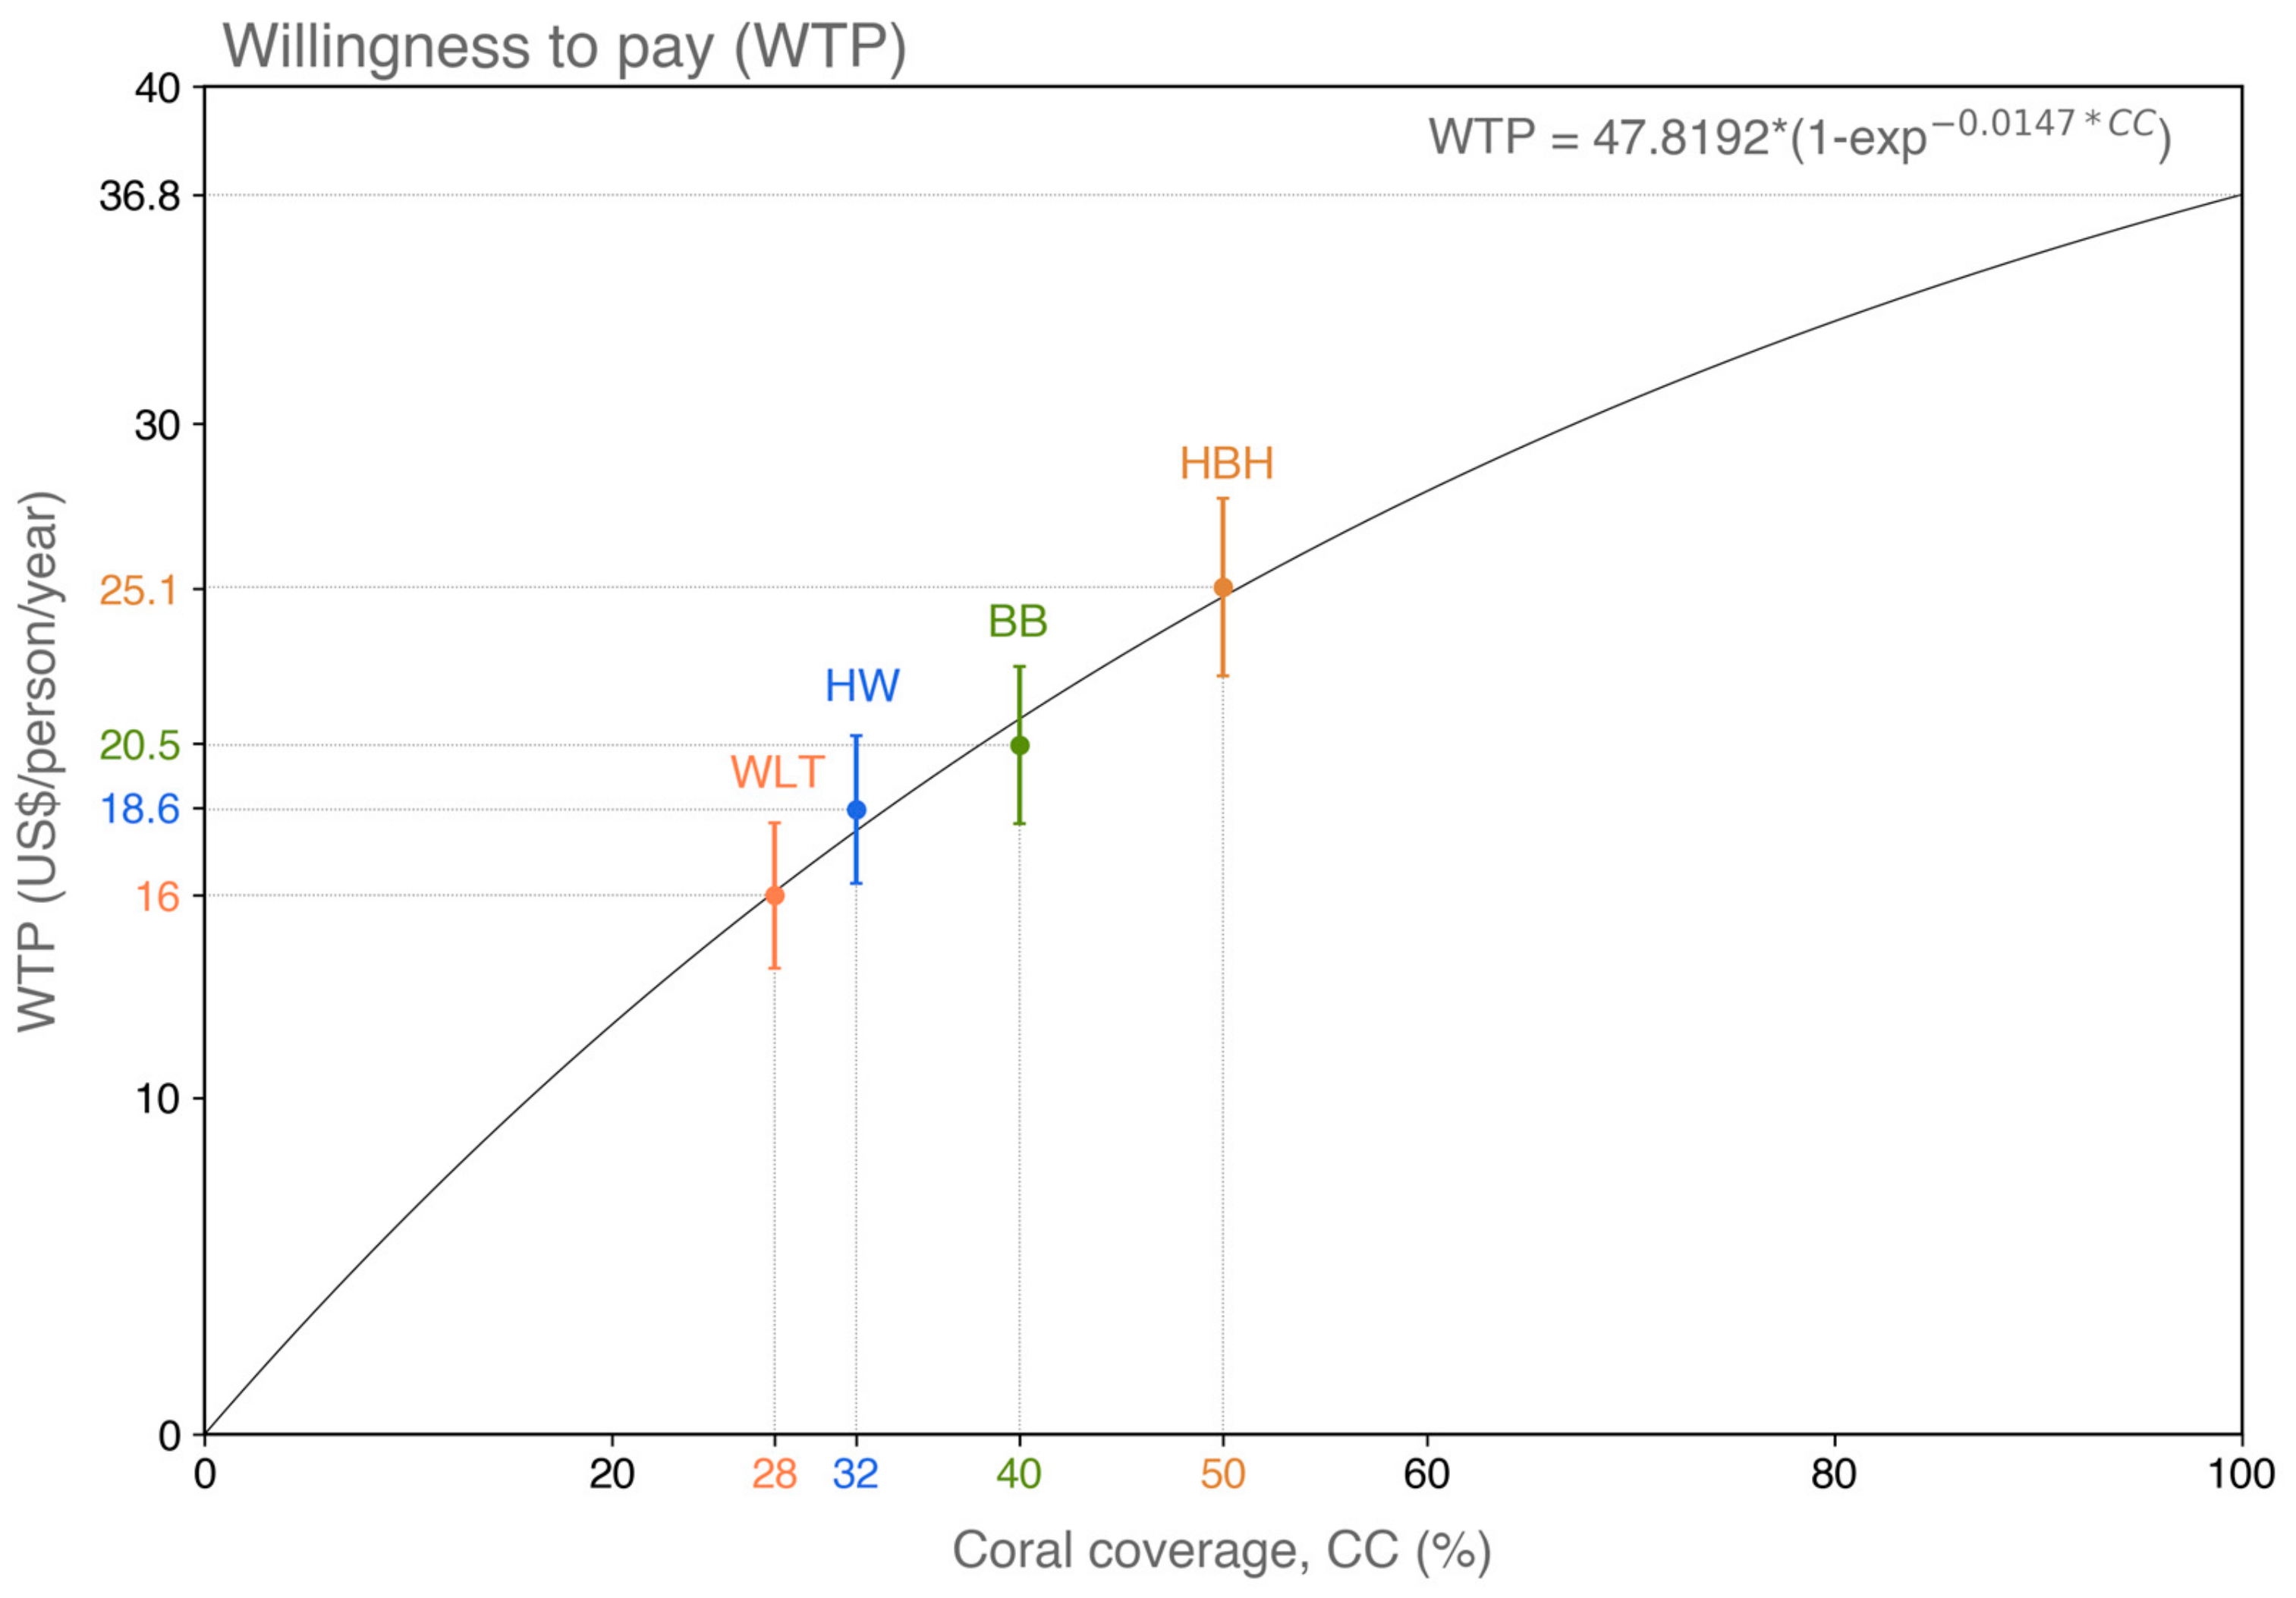
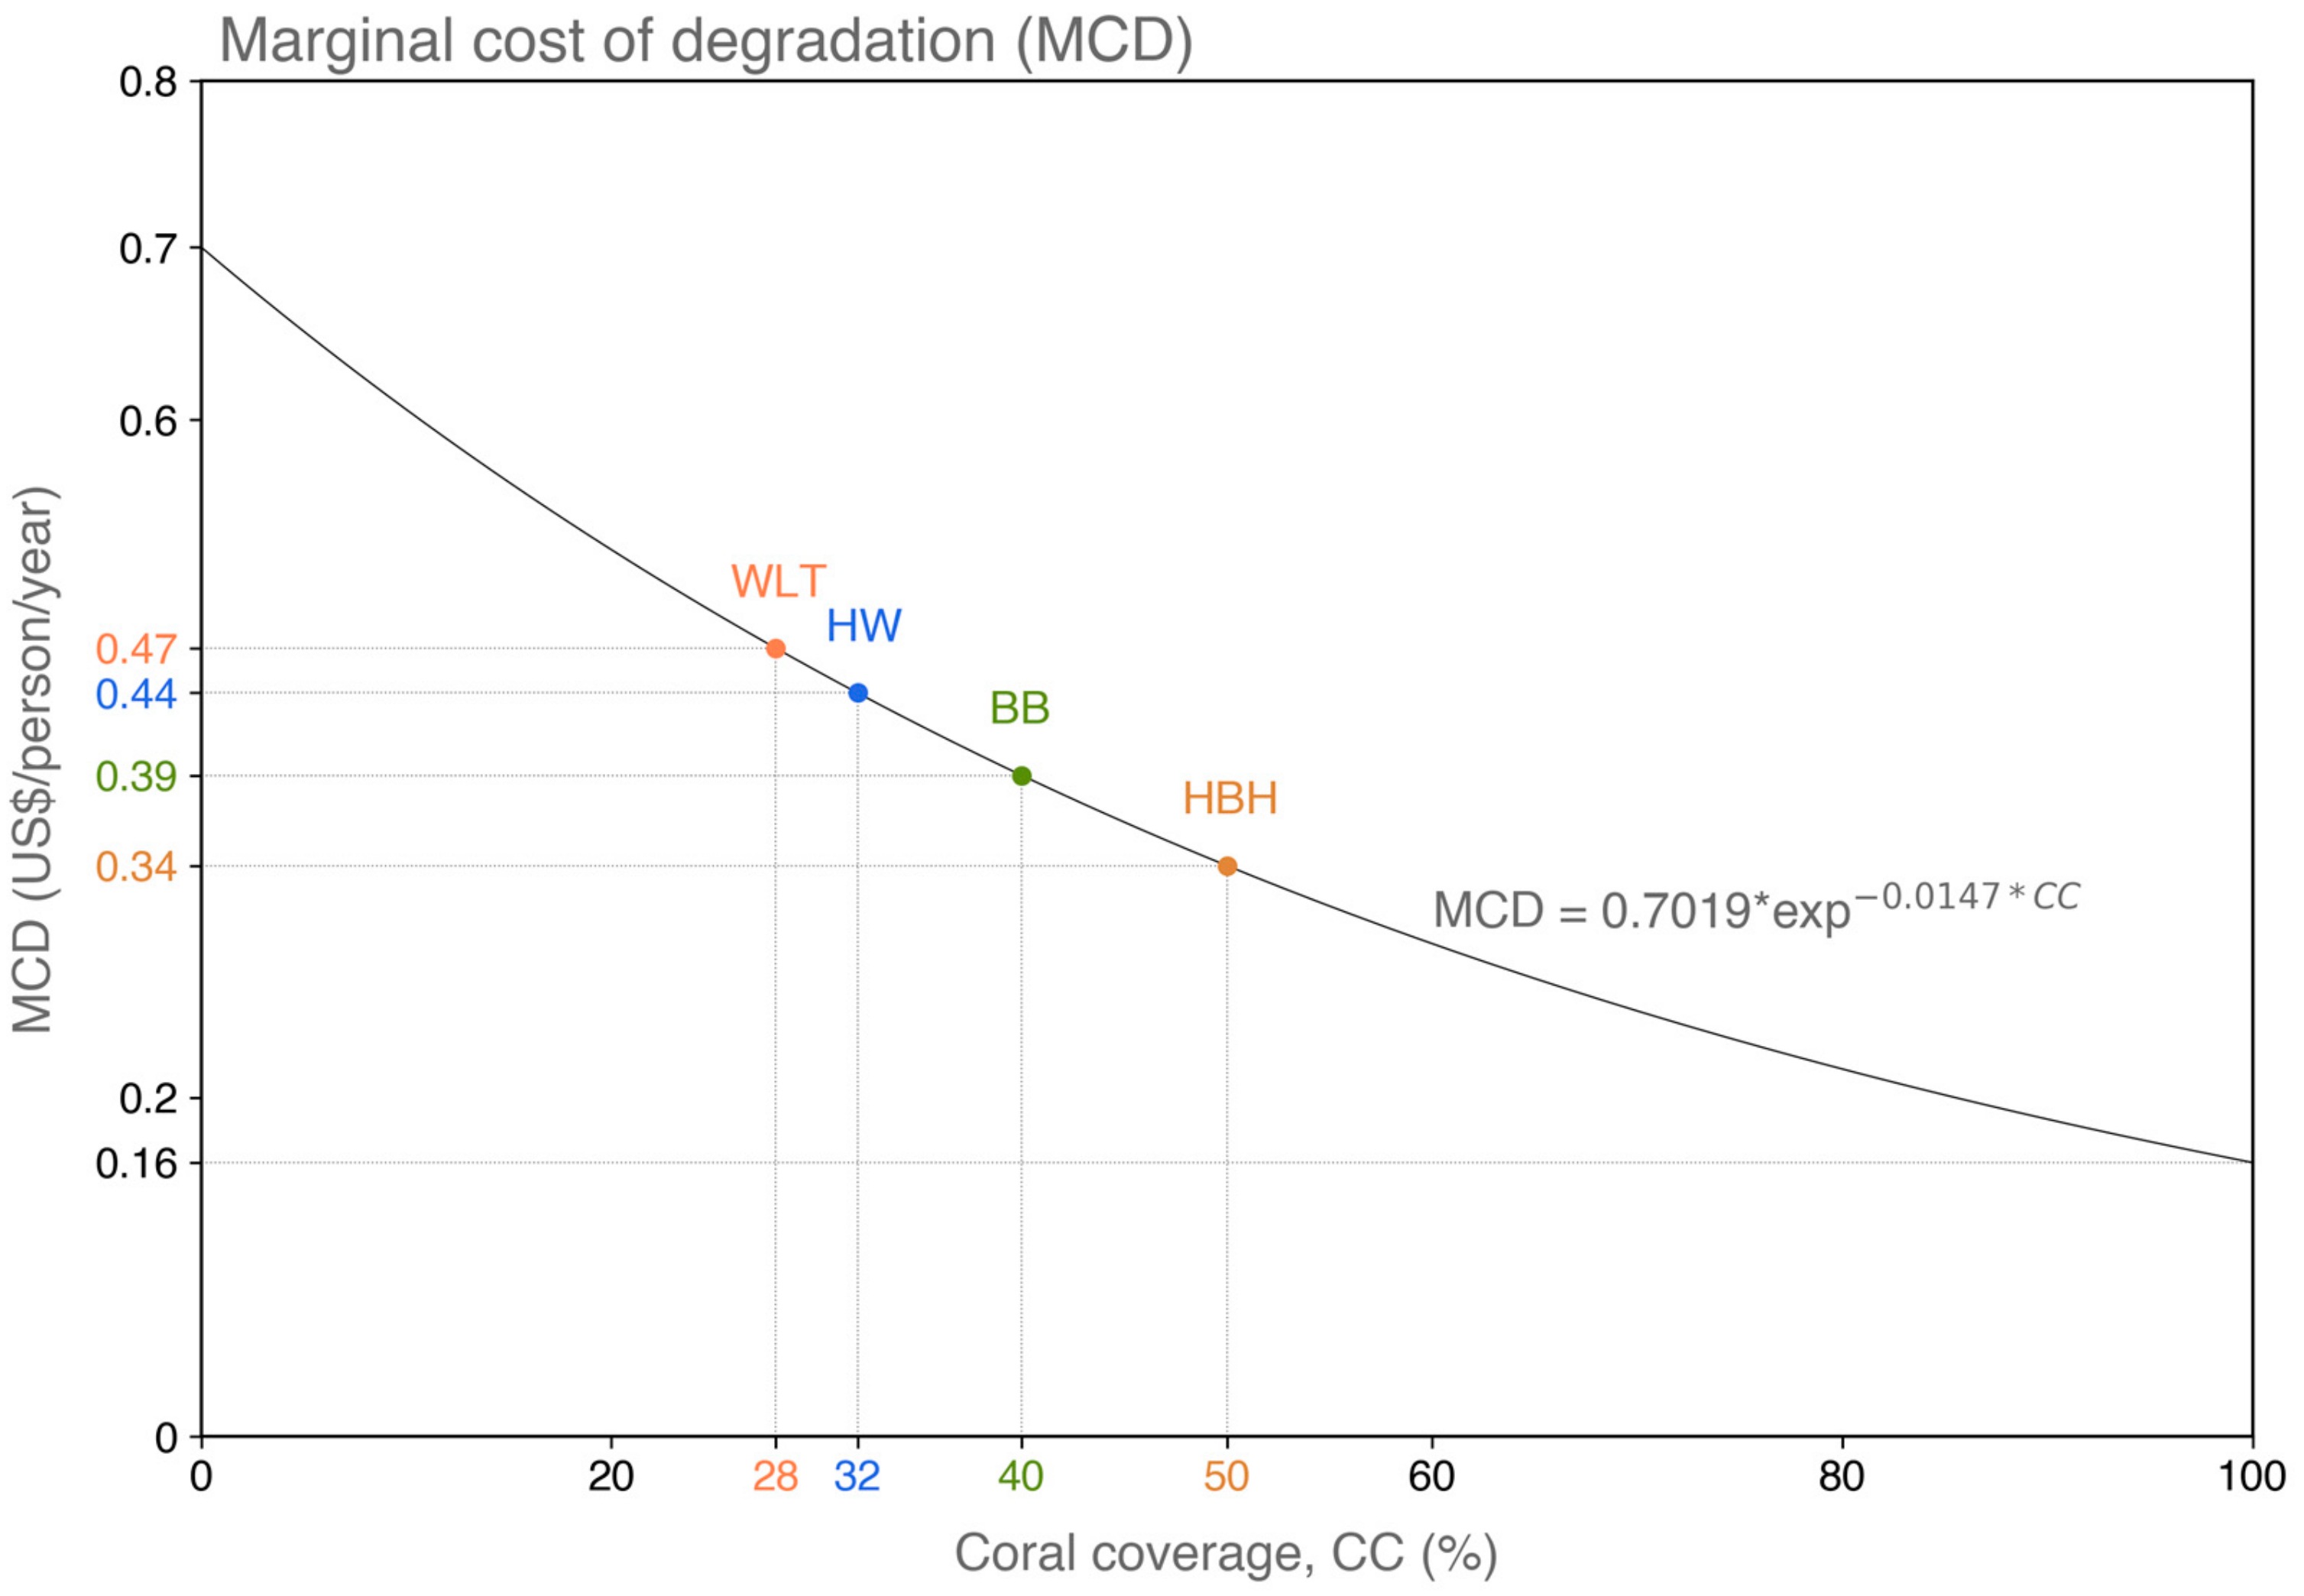
3.3. Willingness to Pay as a Function of Coral Coverage

Using coral coverage as a proxy for ecosystem health at the four different sites, the WTP was expressed as a function of coral coverage (Figure 4). A concave utility function was fitted to the observed values, thereby providing a relation between WTP and coral coverage that could be used for the estimation of the WTP at other sites. This relation follows the law of diminishing marginal utility commonly observed for other economic goods. Visitors are willing to pay more for well protected sites than for degraded ones, but the rate of increase of their WTP decreases with coral coverage.
The restoration of degraded ecosystems could provide larger gains in tourism value than an equivalent amelioration of healthier ones. Derived from this relation, Figure 5 shows the marginal cost of reef degradation as a function of coral coverage.
Adopting such a marginal approach to conservation helps shifting the focus from highly covered reefs to reefs with a lower coverage but with higher potential increases in value. For example, a one point reduction in coral coverage is perceived as 38% more expensive in Wanlitong (0.47 US$/person/year) than it is in Houbihu (0.34 US$/person/year).

4. Discussion

This survey aimed to quickly and cheaply collect information on the value of the KNP coral reef ecosystems using pictures as a reference. Initial concerns included bias, response rate and picture clarity. Despite not paying for promotion, the survey quickly received a satisfying number of responses, with only few protest or improperly filled responses. Several findings are of particular relevance for local conservation.
First, individuals that were at least temporarily involved in an environmental NGO activity were willing to pay more (85.792 vs. 76.566 US$/person/year on average; Cohen’s d = 13.8%) for coral conservation than those who were not, confirming previous results in Taiwan [33] and highlighting the importance of environmental education.
Second, age also influenced the WTP with people younger than 33 years old willing to pay less than people older than 33 (74.561 vs. 85.522 US$/person/year on average; Cohen’s d = −16.4%). This is most likely due to differences of purchasing power between the younger respondents (mean income of 703.45 US$/month) and the older respondents (mean income of 1935.15 US$/month).
Third, there was another small size effect between locals (people residing nearby the KNP) and tourists (people residing elsewhere), with locals willing to pay less than tourists (74.258 vs. 82.471 US$/person/year on average; Cohen’s d = −12.3%), reflecting the fact that for tourists corals are part of the reasons why they visit the KNP in the first place, so paying for their conservation is less a problem for them than for those who live nearby.
Finally, extrapolating average WTP to the 8.5 million households of Taiwan (https://census.dgbas.gov.tw/PHC2010/english/rehome.htm (accessed on June 14 2019)), the estimated contribution for conserving the KNP reaches 680 million US$/year or 4.5 million US$/km2/year. This estimation is an order of magnitude lower than the estimation of de Groot [27], which accounted for all ecosystem services, and an order of magnitude higher than Spalding [6], which focused on tourism. This suggests that our estimation may be somewhat optimistic. Indeed, the first economic valuation study in the KNP for an oil spill found an average WTP of 44.66 US$/person/year [32]. Another coral valuation study for all the reefs in Taiwan [33] found an average value of 35.75 US$/person/year. Our study reports values that are approximately twice higher, probably due to differences in sampling and methodology. Our questionnaire included pictures of coral reefs with specific biodiversity information. This may have positively influenced the respondents. The mode of survey was on-line, which may have made respondents more comfortable to record a higher value. On the other hand, the digital survey design, if properly marketed, can reach segments of society that do not frequently visit natural sites. Finally, numbers are likely higher due to the academic relationship of the majority of those surveyed and the participation in environmental group [53,54].
Larger sample sizes and additional surveys are required to determine more accurate values. Scope sensitivity has been studied extensively and continues to be debated within natural resource economics [55,56]. Moving economic values across cultures remains imprecise due to the spatial distribution of benefits and changes in price sensitivity. For the majority of studies, coral provides most value from fishing, wave blockage and tourism [27], but many corals in KNP do not provide significant shelter from waves or might have diminished or protected fisheries, while tourism may be much larger than in other reefs.
A larger goal of this research was to value biodiversity and resilience through revealed preference. By comparing the economic value of pictures with the real biological data, one could value a bundle of attributes as an ecosystem rather than the usual abstract category of “coral”. This in turn would allow for better scenario analysis as we could model the changes in value due to ecosystem decline or restoration.
Expanding on this, another goal of this research was to value the marginal changes in ecosystem health. Does it make sense from an economic perspective to conserve a pristine area? Or would the benefits be greater if focusing on more degraded ecosystems? Our results show that respondents adjusted their WTP according to the given pictures and the short descriptions of environmental conditions that were provided. Their WTP for each picture differed significantly from one another, with the exception of pictures 2 and 3. This increasing WTP as we move towards healthier reefs allowed for the estimation of the WTP as a function of coral coverage (Figure 4).
Taking advantage of on-line tools can empower natural resource economics helping it reach more people and analyze a greater number of ecosystems. In the future, expanding the sample size to include a more representative sample of the Taiwanese population in terms of income, education level and environmental group membership would likely lead to a more accurate representation of value.

5. Conclusions

The KNP is a highly frequented area of international importance and high biodiversity, thus quantifying its benefits remains challenging. This study is, to our knowledge, the first in Taiwan to use Internet survey for coral reef valuation. Our results suggest that a total value of 680 million US$/year could theoretically be collected for conservation. We showed that areas of mid-range coral coverage could garner higher tourism value than highly covered sites. This implies that focusing conservation on marginal areas would lead to a better balance of conservation outcomes and tourism growth. While these results in no way suggest cutting funding from existing conservation, they instead point towards an opportunity for a higher value return on protecting the less well-preserved sites.

Author Contributions

Conceptualization, N.M., P.-A.C.; data curation, P.-A.C., J.-L.L.; investigation, N.M., L.R.-D.; methodology, N.M., P.-A.C., L.R.-D.; resources, J.-L.L.; supervision, J.-L.L.; writing—original draft, N.M.; writing—review and editing, P.-A.C., L.R.-D., J.-L.L.

Funding

During this study, N.M. was a recipient of the Fulbright Research Fellowship and P.-A.C. was the recipient of a postdoctoral fellowship from the Academia Sinica Sustainability Center (AS-104-SS-A03). L.R.D was the recipient of a Taiwan International Graduate Program scholarship (http://tigp.sinica.edu.tw/) and worked for the Academia Sinica Sustainability Project (AS-104-SS-A03).

Acknowledgments

The authors are thankful to the respondents who took the survey, especially those who shared it via their social networks. We also thank R.F. Wunderlich and two anonymous reviewers for their constructive comments.

Conflicts of Interest

The authors declare no conflict of interest.

References

  1. Hoegh-Guldberg, O.; Global Change Institute; Boston Consulting Group. Reviving the Ocean Economy: The Case for Action—2015; World Wide Fund For Nature (WWF): Gland, Switzerland, 2015. [Google Scholar]
  2. Cesar, A.H.; Burke, A.L.; Pet-Soede, A.L. The Economics of Worldwide Coral Reef Degradation; International Coral Reef Action Network, Cesar Environmental Economics Consulting (CEEC): Arnhem, The Netherlands, 2003. [Google Scholar]
  3. Angulo-Valdés, J.A.; Hatcher, B.G. A new typology of benefits derived from marine protected areas. Mar. Pol. 2010, 34, 635–644. [Google Scholar] [CrossRef]
  4. Moberg, F.; Folke, C. Ecological goods and services of coral reef ecosystems. Ecol. Econ. 1999, 29, 215–233. [Google Scholar] [CrossRef]
  5. Brander, L.M.; Beukering, P.V.; Cesar, H.S.J. The recreational value of coral reefs: A meta-analysis. Ecol. Econ. 2007, 63, 209–218. [Google Scholar] [CrossRef] [Green Version]
  6. Spalding, M.; Burke, L.; Wood, S.A.; Ashpole, J.; Hutchison, J.; zu Ermgassen, P. Mapping the global value and distribution of coral reef tourism. Mar. Pol. 2017, 82, 104–113. [Google Scholar] [CrossRef]
  7. Waite, R.; Burkeand, L.; Gray, E.; van Beukering, P.; Brander, L.; McKenzie, E.; Pendleton, L.; Schuhmann, P.; Tompkins, E. Coastal Capital: Ecosystem Valuation for Decision Making in the Caribbean; World Resources Institute: Washington, DC, USA, 2014. [Google Scholar]
  8. Anthony, K.R.N.; Marshall, P.A.; Abdulla, A.; Beeden, R.; Bergh, C.; Black, R.; Eakin, C.M.; Game, E.T.; Gooch, M.; Graham, N.A.J.; et al. Operationalizing resilience for adaptive coral reef management under global environmental change. Glob. Chang. Biol. 2015, 21, 48–61. [Google Scholar] [CrossRef] [PubMed]
  9. Burke, L.; Selig, L.; Spalding, M. Reefs at Risk in Southeast Asia; World Resources Institute: Washington, DC, USA, 2002. [Google Scholar]
  10. Burke, L.; Reytar, K.; Spalding, M.; Perry, A. Reefs at Risk Revisited; World Resources Institute: Washington, DC, USA, 2011. [Google Scholar]
  11. Denis, V.; De Palmas, S.; Benzoni, F.; Chen, C.A. Extension of the known distribution and depth range of the scleractinian coral Psammocora stellata: First record from a Taiwanese mesophotic reef. Mar. Biodivers. 2015, 45, 619–620. [Google Scholar] [CrossRef]
  12. Huang, D.; Licuanan, W.Y.; Hoeksema, B.W.; Chen, C.A.; Ang, P.O.; Huang, H.; Lane, D.J.W.; Vo, S.T.; Waheed, Z.; Affendi, Y.A.; et al. Extraordinary diversity of reef corals in the South China Sea. Mar. Biodivers. 2015, 45, 157–168. [Google Scholar] [CrossRef]
  13. Allen, G.R. Conservation hotspots of biodiversity and endemism for Indo-Pacific coral reef fishes. Aquat. Conserv. Mar. Freshw. Ecosyst. 2008, 18, 541–556. [Google Scholar] [CrossRef]
  14. Wu, T.-Y. Exploring Stakeholders’ View of Management Effectiveness in Kenting National Park, Taiwan. Master’s Thesis, Duke University, Durham, NC, USA, 2010. Available online: http://hdl.handle.net/10161/2153 (accessed on 9 July 2019).
  15. Ribas-Deulofeu, L.; Denis, V.; De Palmas, S.; Kuo, C.-Y.; Hsieh, H.J.; Chen, C.A. Structure of Benthic Communities along the Taiwan Latitudinal Gradient. PLoS ONE 2016, 11, e0160601. [Google Scholar] [CrossRef]
  16. Lin, H.-J.; Wu, C.-Y.; Kao, S.-J.; Kao, W.-Y.; Meng, P.-J. Mapping anthropogenic nitrogen through point sources in coral reefs using delta N-15 in macroalgae. Mar. Ecol. Prog. Ser. 2007, 335, 95–109. [Google Scholar] [CrossRef]
  17. Liu, P.-J.; Meng, P.-J.; Liu, L.-L.; Wang, J.-T.; Leu, M.-Y. Impacts of human activities on coral reef ecosystems of southern Taiwan: A long-term study. Mar. Pollut. Bull. 2012, 64, 1129–1135. [Google Scholar] [CrossRef] [PubMed]
  18. Chen, T.-H.; Chen, Y.-L.; Chen, C.-Y.; Liu, P.-J.; Cheng, J.-O.; Ko, F.-C. Assessment of ichthyotoxicity and anthropogenic contamination in the surface waters of Kenting National Park, Taiwan. Environ. Monit. Assess. 2015, 187, 1–16. [Google Scholar] [CrossRef] [PubMed]
  19. Liu, P.-J.; Shao, K.-T.; Jan, R.-Q.; Fan, T.-Y.; Wong, S.-L.; Hwang, J.-S.; Chen, J.-P.; Chen, C.-C.; Lin, H.-J. A trophic model of fringing coral reefs in Nanwan Bay, southern Taiwan suggests overfishing. Mar. Environ. Res. 2009, 68, 106–117. [Google Scholar] [CrossRef] [PubMed] [Green Version]
  20. Chang, Y.-C.; Hong, F.-W.; Lee, M.-T. A System Dynamic based DSS for sustainable coral reef management in Kenting coastal zone, Taiwan. Ecol. Modell. 2008, 211, 153–168. [Google Scholar] [CrossRef]
  21. Meng, P.-J.; Lee, H.-J.; Wang, J.-T.; Chen, C.-C.; Lin, H.-J.; Tew, K.S.; Hsieh, W.-J. A long-term survey on anthropogenic impacts to the water quality of coral reefs, southern Taiwan. Environ. Pollut. 2008, 156, 67–75. [Google Scholar] [CrossRef] [PubMed]
  22. Kuo, C.-Y.; Yuen, Y.S.; Meng, P.-J.; Ho, P.-H.; Wang, J.-T.; Liu, P.-J.; Chang, Y.-C.; Dai, C.-F.; Fan, T.-Y.; Lin, H.-J.; et al. Recurrent Disturbances and the Degradation of Hard Coral Communities in Taiwan. PLoS ONE 2012, 7, e44364. [Google Scholar] [CrossRef] [PubMed]
  23. Chen, C.A.; Dai, C.-F. Local phase shift from Acropora-dominant to Condylactis-dominant community in the Tiao-Shi Reef, Kenting National Park, southern Taiwan. In Coral Reefs; Springer: Berlin, Germany, 2004; Volume 23, p. 508. [Google Scholar]
  24. Tew, K.S.; Leu, M.-Y.; Wang, J.-T.; Chang, C.-M.; Chen, C.-C.; Meng, P.-J. A continuous, real-time water quality monitoring system for the coral reef ecosystems of Nanwan Bay, Southern Taiwan. Mar. Pollut. Bull. 2014, 85, 641–647. [Google Scholar] [CrossRef]
  25. Keshavmurthy, S.; Meng, P.-J.; Wang, J.-T.; Kuo, C.-Y.; Yang, S.-Y.; Hsu, C.-M.; Gan, C.-H.; Dai, C.-F.; Chen, C.A. Can resistant coral-Symbiodinium associations enable coral communities to survive climate change? A study of a site exposed to long-term hot water input. PeerJ 2014, 2, e327. [Google Scholar] [CrossRef]
  26. Lee, M.-T.; Wu, C.-C.; Ho, C.-H.; Liu, W.-H. Towards Marine Spatial Planning in Southern Taiwan. Sustainability 2014, 6, 8466–8484. [Google Scholar] [CrossRef] [Green Version]
  27. De Groot, R.; Brander, L.; van der Ploeg, S.; Costanza, R.; Bernard, F.; Braat, L.; Christie, M.; Crossman, N.; Ghermandi, A.; Hein, L.; et al. Global estimates of the value of ecosystems and their services in monetary units. Ecosyst. Serv. 2012, 1, 50–61. [Google Scholar] [CrossRef]
  28. Costanza, R.; de Groot, R.; Braat, L.; Kubiszewski, I.; Fioramonti, L.; Sutton, P.; Farber, S.; Grasso, M. Twenty years of ecosystem services: How far have we come and how far do we still need to go? Ecosyst. Serv. 2017, 28, 1–16. [Google Scholar] [CrossRef]
  29. Yen, S.-C.; Chen, K.-H.; Wang, Y.; Wang, C.-P. Residents’ attitudes toward reintroduced sika deer in Kenting National Park, Taiwan. Wildl. Biol. 2015, 21, 220–227. [Google Scholar] [CrossRef]
  30. Dong, C.-M.; Lin, C.-C. Applying Count Models to Estimate the Tourism Demands and Recreation Benefits of Taijiang National Park. Adv. Soc. Sci. Res. J. 2019, 6, 256–273. [Google Scholar]
  31. Dong, C.-M.; Lin, C.-C.; Lin, S.-P. Study on the Appraisal of Tourism Demands and Recreation Benefits for Nanwan Beach, Kenting, Taiwan. Environments 2018, 5, 97. [Google Scholar] [CrossRef]
  32. Chen, C.-C.; Tew, K.S.; Ho, P.-H.; Ko, F.-C.; Hsieh, H.-Y.; Meng, P.-J. The impact of two oil spill events on the water quality along coastal area of Kenting National Park, southern Taiwan. Mar. Pollut. Bull. 2017, 124, 974–983. [Google Scholar] [CrossRef] [PubMed]
  33. Tseng, W.W.-C.; Hsu, S.-H.; Chen, C.-C. Estimating the willingness to pay to protect coral reefs from potential damage caused by climate change: The evidence from Taiwan. Mar. Pollut. Bull. 2015, 101, 556–565. [Google Scholar] [CrossRef] [PubMed]
  34. Lindhjem, H.; Tuan, T.H. Valuation of species and nature conservation in Asia and Oceania: A meta-analysis. Environ. Econ. Policy Stud. 2012, 14, 1–22. [Google Scholar] [CrossRef]
  35. Liu, S.; Stern, D.I. A Meta-Analysis of Contingent Valuation Studies in Coastal and Near-Shore Marine Ecosystems; MPRA Paper 11720; University Library of Munich: München, Germany, 2008. [Google Scholar]
  36. Londoño, L.M.; Johnston, R.J. Enhancing the reliability of benefit transfer over heterogeneous sites: A meta-analysis of international coral reef values. Ecol. Econ. 2012, 78, 80–89. [Google Scholar] [CrossRef]
  37. Kung, T.A.; Lee, S.H.; Yang, T.C.; Wang, W.H. Survey of selected personal care products in surface water of coral reefs in Kenting National Park, Taiwan. Sci. Total Environ. 2018, 635, 1302–1307. [Google Scholar] [CrossRef]
  38. Robles-Zavala, E.; Reynoso, A.G.C. The recreational value of coral reefs in the Mexican Pacific. Ocean Coast. Manage. 2018, 157, 1–8. [Google Scholar] [CrossRef]
  39. Farr, M.; Stoeckl, N.; Esparon, M.; Larson, S.; Jarvis, D. The Importance of Water Clarity to Great Barrier Reef Tourists and Their Willingness to Pay to Improve it. Tour. Econ. 2016, 22, 331–352. [Google Scholar] [CrossRef]
  40. Andersson, J.E. The recreational cost of coral bleaching—A stated and revealed preference study of international tourists. Ecol. Econ. 2007, 62, 704–715. [Google Scholar] [CrossRef]
  41. Grafeld, S.; Oleson, K.; Barnes, M.; Peng, M.; Chan, C.; Weijerman, M. Divers’ willingness to pay for improved coral reef conditions in Guam: An untapped source of funding for management and conservation? Ecol. Econ. 2016, 128, 202–213. [Google Scholar] [CrossRef]
  42. Komyakova, V.; Munday, P.L.; Jones, G.P. Relative Importance of Coral Cover, Habitat Complexity and Diversity in Determining the Structure of Reef Fish Communities. PLoS ONE 2013, 8, e83178. [Google Scholar] [CrossRef] [PubMed]
  43. Bartkowski, B.; Lienhoop, N.; Hansjürgens, B. Capturing the complexity of biodiversity: A critical review of economic valuation studies of biological diversity. Ecol. Econ. 2015, 113, 1–14. [Google Scholar] [CrossRef]
  44. Carson, R.T. Contingent Valuation: A Practical Alternative When Prices Aren’t Available. J. Econ. Perspect. 2012, 26, 27–42. [Google Scholar] [CrossRef]
  45. Polak, O.; Shashar, N. Economic value of biological attributes of artificial coral reefs. ICES J. Mar. Sci. 2013, 70, 904–912. [Google Scholar] [CrossRef] [Green Version]
  46. Bishop, R.C.; Chapman, D.J.; Kanninen, B.J.; Krosnick, J.A.; Leeworthy, B.; Meade, N.F. Total Economic Value for Protecting and Restoring Hawaiian Coral Reef Ecosystems: Final Report; NOAA Office of National Marine Sanctuaries, Office of Response and Restoration and Coral Reef Conservation Program; NOAA Technical Memorandum CRCP 16; NOAA: Silver Spring, MD, USA, 2011. [Google Scholar]
  47. Lindhjem, H.; Navrud, S. Are Internet surveys an alternative to face-to-face interviews in contingent valuation? Ecol. Econ. 2011, 70, 1628–1637. [Google Scholar] [CrossRef]
  48. Nielsen, J.S. Use of the Internet for willingness-to-pay surveys: A comparison of face-to-face and web-based interviews. Resour. Energy Econ. 2011, 33, 119–129. [Google Scholar] [CrossRef]
  49. Marta-Pedroso, C.; Freitas, H.; Domingos, T. Testing for the survey mode effect on contingent valuation data quality: A case study of web based versus in-person interviews. Ecol. Econ. 2007, 62, 388–398. [Google Scholar] [CrossRef] [Green Version]
  50. Loomis, J.B. 2013 WAEA Keynote Address: Strategies for Overcoming Hypothetical Bias in Stated Preference Surveys. J. Agric. Resour. Econ. 2014, 39, 34–46. [Google Scholar]
  51. Kruskal, W.H.; Wallis, W.A. Use of Ranks in One-Criterion Variance Analysis. J. Am. Stat. Assoc. 1952, 47, 583–621. [Google Scholar] [CrossRef]
  52. Cohen, J. Statistical Power Analysis for the Behavioral Sciences; Routledge: New York, NY, USA, 1988. [Google Scholar]
  53. Spash, C.L. Non-Economic Motivation for Contingent Values: Rights and Attitudinal Beliefs in the Willingness to Pay for Environmental Improvements. Land Econ. 2006, 82, 602–622. [Google Scholar] [CrossRef]
  54. Ahmed, M.; Umali, G.M.; Chong, C.K.; Rull, M.F.; Garcia, M.C. Valuing recreational and conservation benefits of coral reefs - The case of Bolinao, Philippines. Ocean Coast. Manag. 2007, 50, 103–118. [Google Scholar] [CrossRef]
  55. Borzykowski, N.; Baranzini, A.; Maradan, D. Scope Effects in Contingent Valuation: Does the Assumed Statistical Distribution of WTP Matter? Ecol. Econ. 2018, 144, 319–329. [Google Scholar] [CrossRef]
  56. Veisten, K.; Hoen, H.F.; Navrud, S.; Strand, J. Scope insensitivity in contingent valuation of complex environmental amenities. J. Environ. Manag. 2004, 73, 317–331. [Google Scholar] [CrossRef] [PubMed]
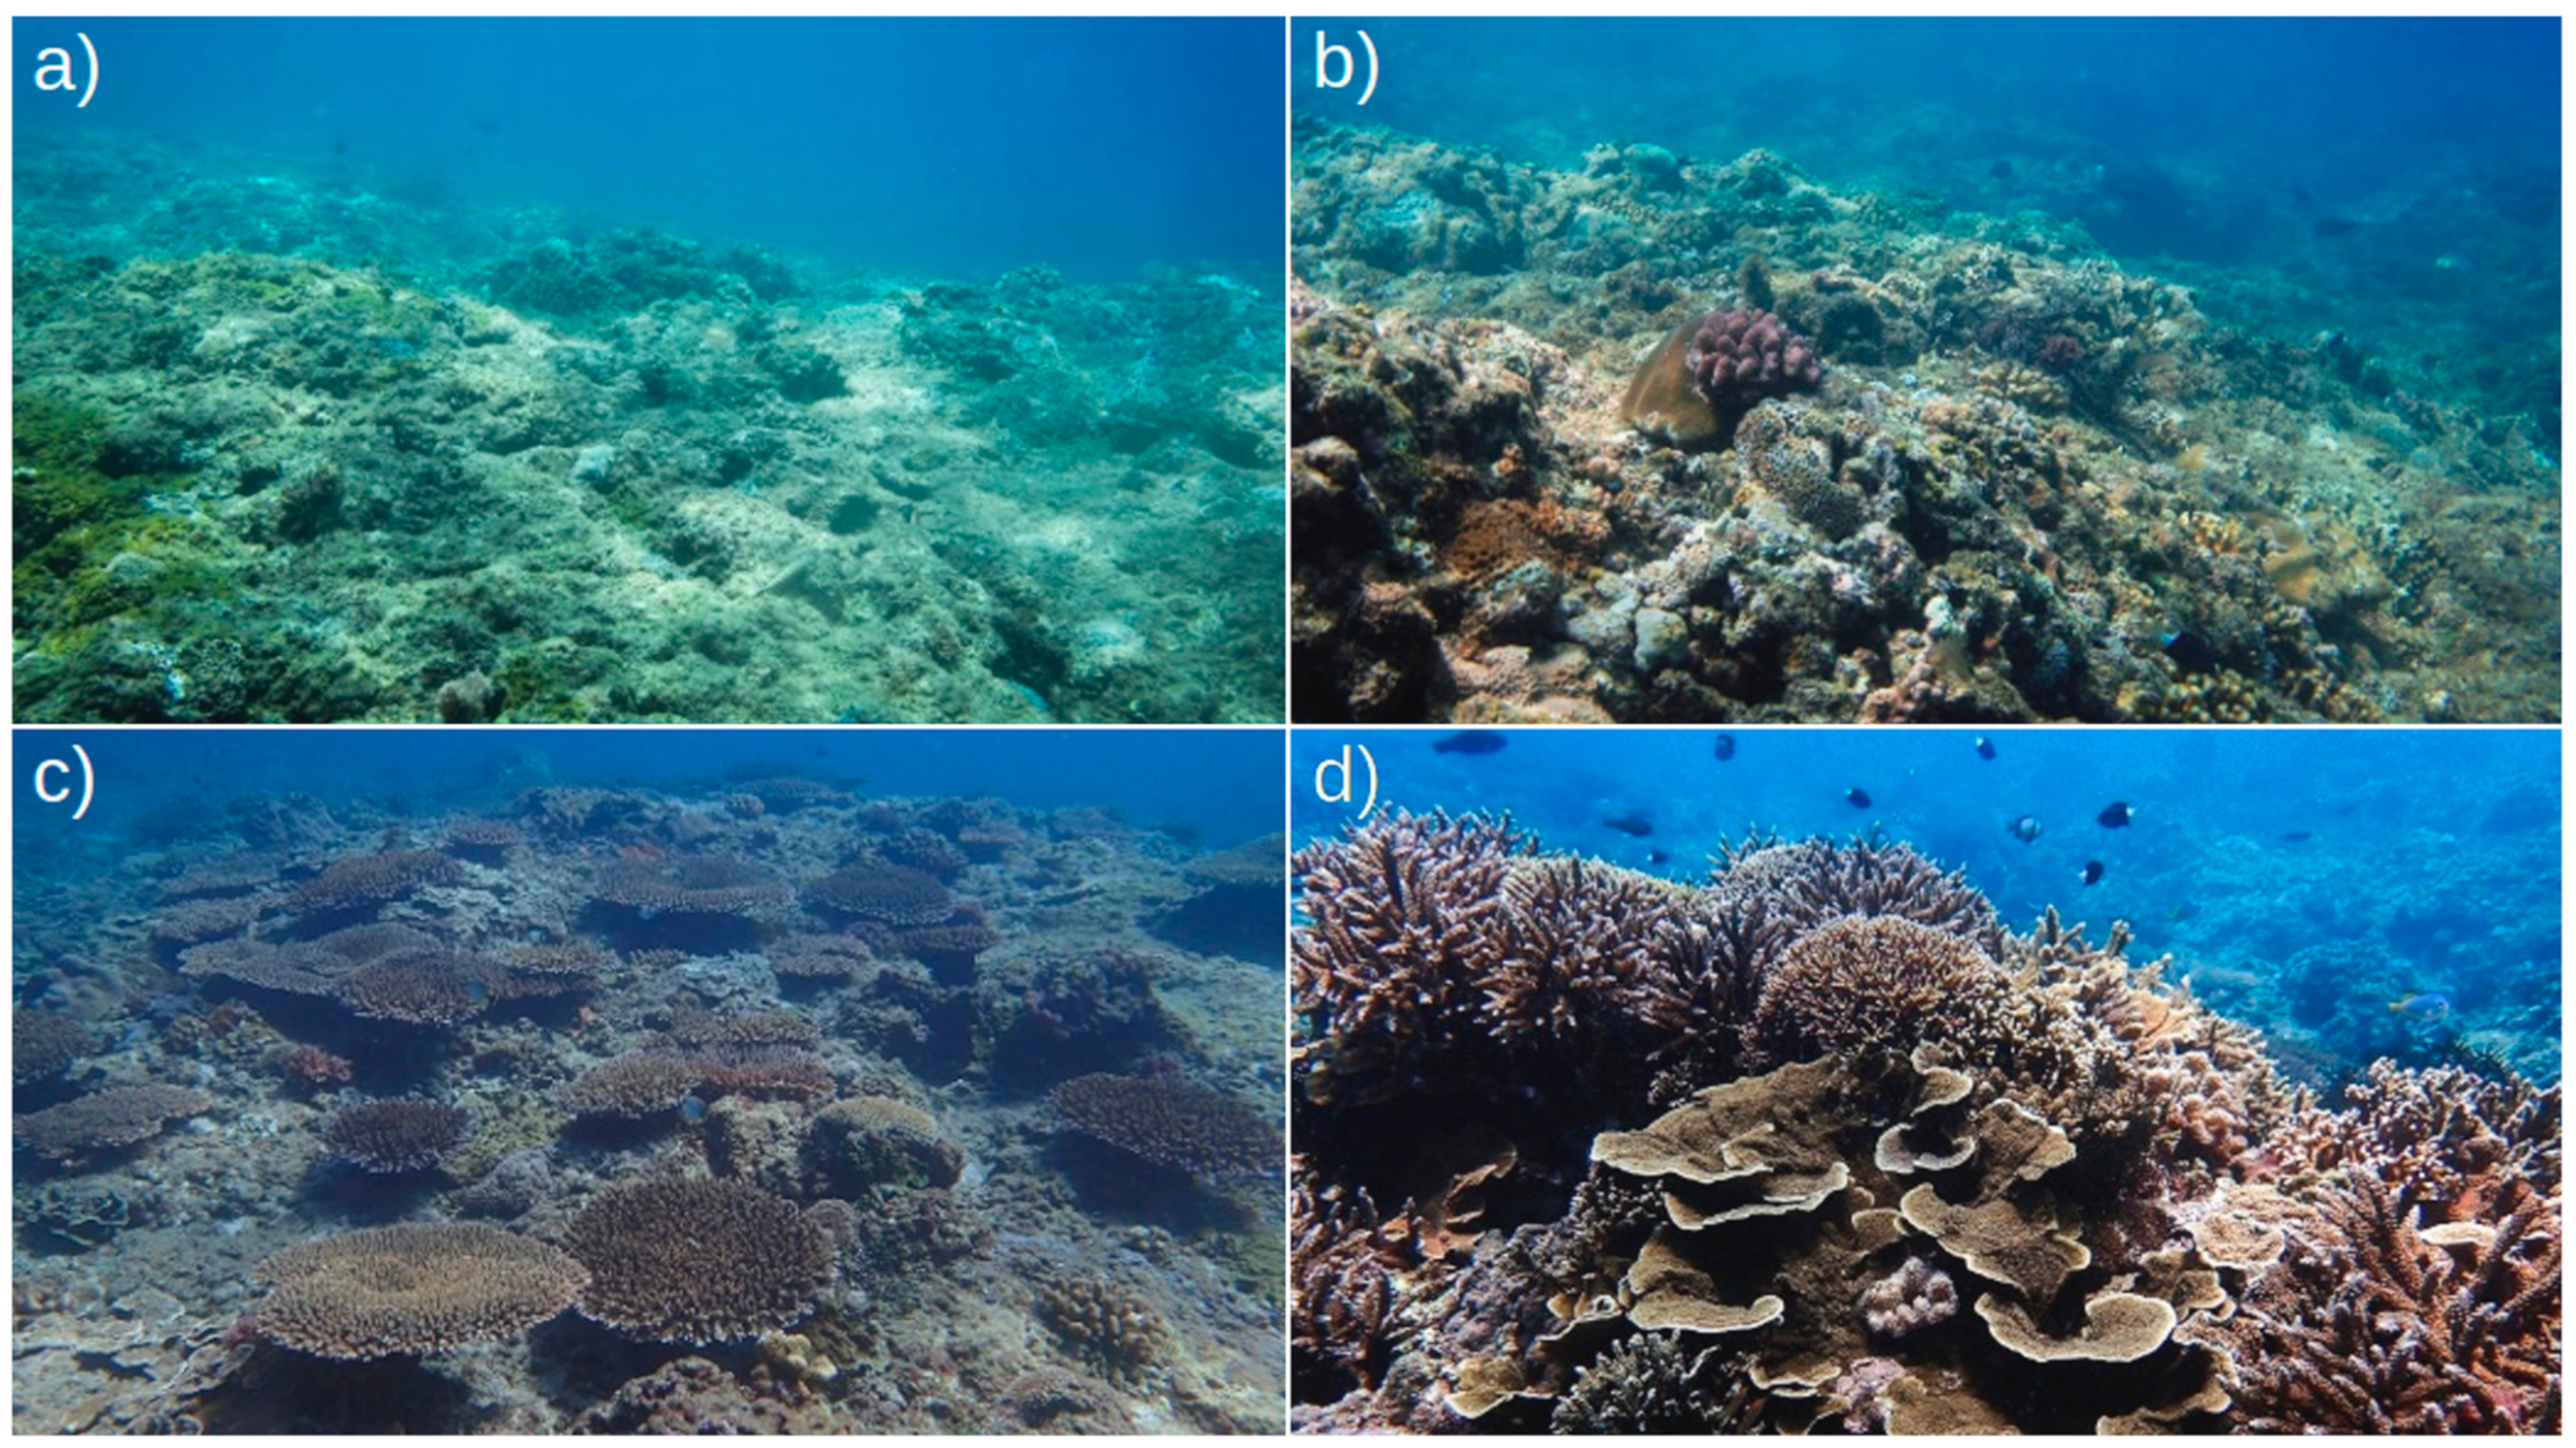
Figure 1. The Kenting National Park.
Water 11 01411 g001
Figure 2. Visitors in the Kenting National Park. (https://www.ktnp.gov.tw/News.aspx?n=228F1362E45E0B89&sms=830F4DD99E91DBB7 (accessed on June 10 2019)).
Water 11 01411 g002
Figure 3. Pictures shown: (a) Wanlitong, (b) Houwan, (c) Banana Bay and (d) Houbihu.
Water 11 01411 g003
Figure 4. Willingness to pay as a function of coral coverage (US$/person/year).WLT: Wanlitong, HW: Houwan, BB: Banana Bay and HBH: Houbihu.
Water 11 01411 g004
Figure 5. Marginal cost of degradation as a function of coral coverage (US$/person/year) WLT: Wanlitong, HW: Houwan, BB: Banana Bay and HBH: Houbihu.
Water 11 01411 g005
Table 1. Biological features of selected pictures.
Picture (Site)AlgaeFishCoral Coverage (%)Coverage Level
1 (Wanlitong)HighLow284
2 (Houwan)MediumLow323
3 (Banana Bay)LowMedium402
4 (Houbihu)LowHigh501
Table 2. Comparison between sample and population statistics (the gender ratio is defined as the ratio of men to women in 2016).
Comparison with PopulationMonthly Income (US$/Month)Schooling (Years)Gender Ratio
Sample mean1344.7916.851.14
Population mean1320.92 116.6 20.99 3
Relative difference+1.8%+1.5%+15%
Note: 1: https://www.stat.gov.tw/np.asp?ctNode=522&mp=4 (accessed on May 22 2019); 2: https://www.stat.gov.tw/ct.asp?xItem=33332&CtNode=6020&mp=4 (accessed on May 22 2019); 3: https://www.ris.gov.tw/app/portal/346 (accessed on May 22 2019).
Table 3. KW tests for WTP across pictures (significant at *: 10%, **: 5%, ***: 1%).
KW TestWTP1WTP2WTP3WTP4
WTP1-3.143 *6.145 **24.55 ***
WTP23.143 *-0.49811.664 ***
WTP36.145 **0.498-7.759 ***
WTP424.55 ***11.664 ***7.759 ***-
Table 4. Total WTP by groups (US$/person/year).
GroupsSample SizeTotal WTPEffect Size (Cohen’s d)
Activity with NGOyes
no
90
141
85.792 ± 14.896
76.566 ± 10.678
0.138
GenderM
F
119
112
79.115 ± 12.520
81.271 ± 12.172
−0.032
Localsyes
no
65
166
74.258 ± 14.976
82.471 ± 10.629
−0.123
EducationHigh
Low
114
117
80.740 ± 12.238
79.596 ± 12.482
0.017
Age<33
>33
113
118
74.561 ± 10.808
85.522 ± 13.559
−0.164
Overall-23180.160 ± 8.678-

