Flow Control in Culverts: A Performance Comparison between Inlet and Outlet Control
by
Rick Jaeger
1,*, 
Katharina Tondera
2,
Selvan Pather
1,
Mark Porter
1,
Carolyn Jacobs
1 and
Neil Tindale
1 1
School of Science and Engineering, University of the Sunshine Coast, Sippy Downs 4556, QLD, Australia
2
IMT Atlantique Bretagne—Pays de Loire, Department of Energy Systems and Environment, 44307 Nantes, France
*
Author to whom correspondence should be addressed.
Water 2019, 11(7), 1408; https://doi.org/10.3390/w11071408
Submission received: 5 June 2019
/
Revised: 30 June 2019
/
Accepted: 3 July 2019
/
Published: 9 July 2019
(This article belongs to the Section Hydraulics and Hydrodynamics)
Abstract
:Culverts, as an essential part of drainage networks worldwide, provide an efficient solution for flowing waters to cross man-made barriers including roads. Existing structures can be many years old and changes in rainfall patterns due to global warming might not have been considered in their original design. While correctly designed culverts can effectively drain water during high-intensity rainfall events, poorly designed or outdated structures could cause upstream flooding resulting in costly damage and losses. Hydraulic improvements to prepare existing culverts for greater discharge rates could be a favorable alternative to rebuilding every failing structure. Modern design guidelines calculate the performance for inlet and outlet controlled flows on the basis of established hydraulic theories. After calculating the headwater levels for both flow controls, the inferior one is then chosen, based on the assumption that the culvert will operate in its least efficient state. Flow improvements could be made by enforcing the better performing option. Outlet control can be ensured by raising the tailwater levels as high as the outlet thereby utilizing the entire cross-sectional area of the culvert. It was found that, in some cases, an enforced outlet control enables culverts to perform better than operation under inlet control. However, only smooth and short culverts with high losses at the inlet were identified as benefiting from this approach and many existing structures could be improved by better inlet designs.
1. Introduction
Culverts play an important role at the intersection of the stormwater drainage system and transport infrastructure. They are typically designed using historical rainfall data to estimate discharge rates. However, with extreme precipitation variations due to global warming, there is an increased likelihood of future flood disasters due to undersized and poorly designed culverts [1,2,3,4]. Increasing the capacity of existing culverts, would reduce costs by making complete rebuilds unnecessary, enabling communities to adapt their infrastructure faster to predicted higher rates of precipitation.
To date, hydraulically optimized designs have played a minor role in culvert design. Guidelines support designers and engineers in choosing adequate pipe sizes but there is little advice on when to use low friction materials, certain wingwall angles or steep slopes, leaving designers and planners with little information regarding the potential benefits. This has led to the common use of culverts with square inlet corners or with high friction losses inside the barrel, both designs that have low hydraulic efficiency. One of the most comprehensive guidelines today is the Hydraulic Design Series Number 5 (HDS-5)—Hydraulic Design of Highway Culverts [5]. It is developed by the Federal Highway Administration in the United States. Equations from the HDS-5 guideline were derived from the Bernoulli equation, with adjustments according to results from experiments conducted in the 1950s and 60s [6,7,8,9,10,11,12].
The two different flow types described in this and most other culvert design standards, are based on two different hydraulic theories: (i) inlet control (IC); and (ii) outlet control (OC). Under inlet control, the only limiting factor for the flow is the size, shape and configuration of the inlet. The sudden reduction of the cross-sectional flow area at the inlet, where an open channel enters the culvert, causes head loss [13]. The culvert barrel could still convey higher flow rates and does not limit the flow. In these situations, the culvert flows are treated as weir (unsubmerged) or orifice flows (submerged). The headwater height under inlet control is determined by the flow rate, the cross-sectional area, the shape and the inlet configuration of the culvert [5].
While the culvert could still convey higher flowrates under inlet control, the barrel itself contributes to the head loss under outlet control. Calculations of outlet control incorporate the parameters from inlet control as well as the length and material of the culvert and the tailwater height [5]. Under submerged inlet control, where the culvert is hydraulically operating as an orifice, a steady flow of air recirculates from the end of the culvert, resulting in less area being utilized by the water and higher flow velocities or lower flow rates. When the outlet becomes submerged, all air within the culvert gets displaced, with the entire cross-sectional area being filled with water and, under these conditions, the flow changes from an open conduit to a pressurized flow [14].
Our study reviews the potential for increasing capacities in existing structures, by forcing culverts from one flow control into another. Current design guidelines assume that the culvert would operate in its least efficient state, so enforcing the better performing control could potentially increase the capacity of existing culverts. Dasika [14] suggested enforcing full pipe flows in every culvert by raising the tailwater levels, so that any air in the barrel gets displaced. His experiments showed that culverts operating in this way would flow more efficiently, that is, have lower headwater levels, than in their original configuration.
Montes [15] criticized Dasika for using unsuitable empirical equations instead of “models that are well grounded in a rational theory”. They continued by stating that strong vortex formation prevents complete outlet control and considerably delays full pipe flow and identified this as the “weak point of the author’s suggestion for flow improvement”. There is no comparison between the two flow types for different culvert setups. Our study investigates which culvert configurations would benefit from an enforced outlet control and what flow rates and headwater heights are necessary.
2. Methods
This study consists of two parts. First, different rectangular and circular culvert lengths were tested in an experimental flume, with different slopes and flowrates and the data compared to the results of Dasika [14].
Second, a broader variety of culvert configurations was analyzed with a comparison between inlet and outlet controls for each setup. The main focus was on the performance of full flowing pipes and submerged inlet control flows, therefore, this study only used the orifice flow equation and ignored weir flows under inlet control.
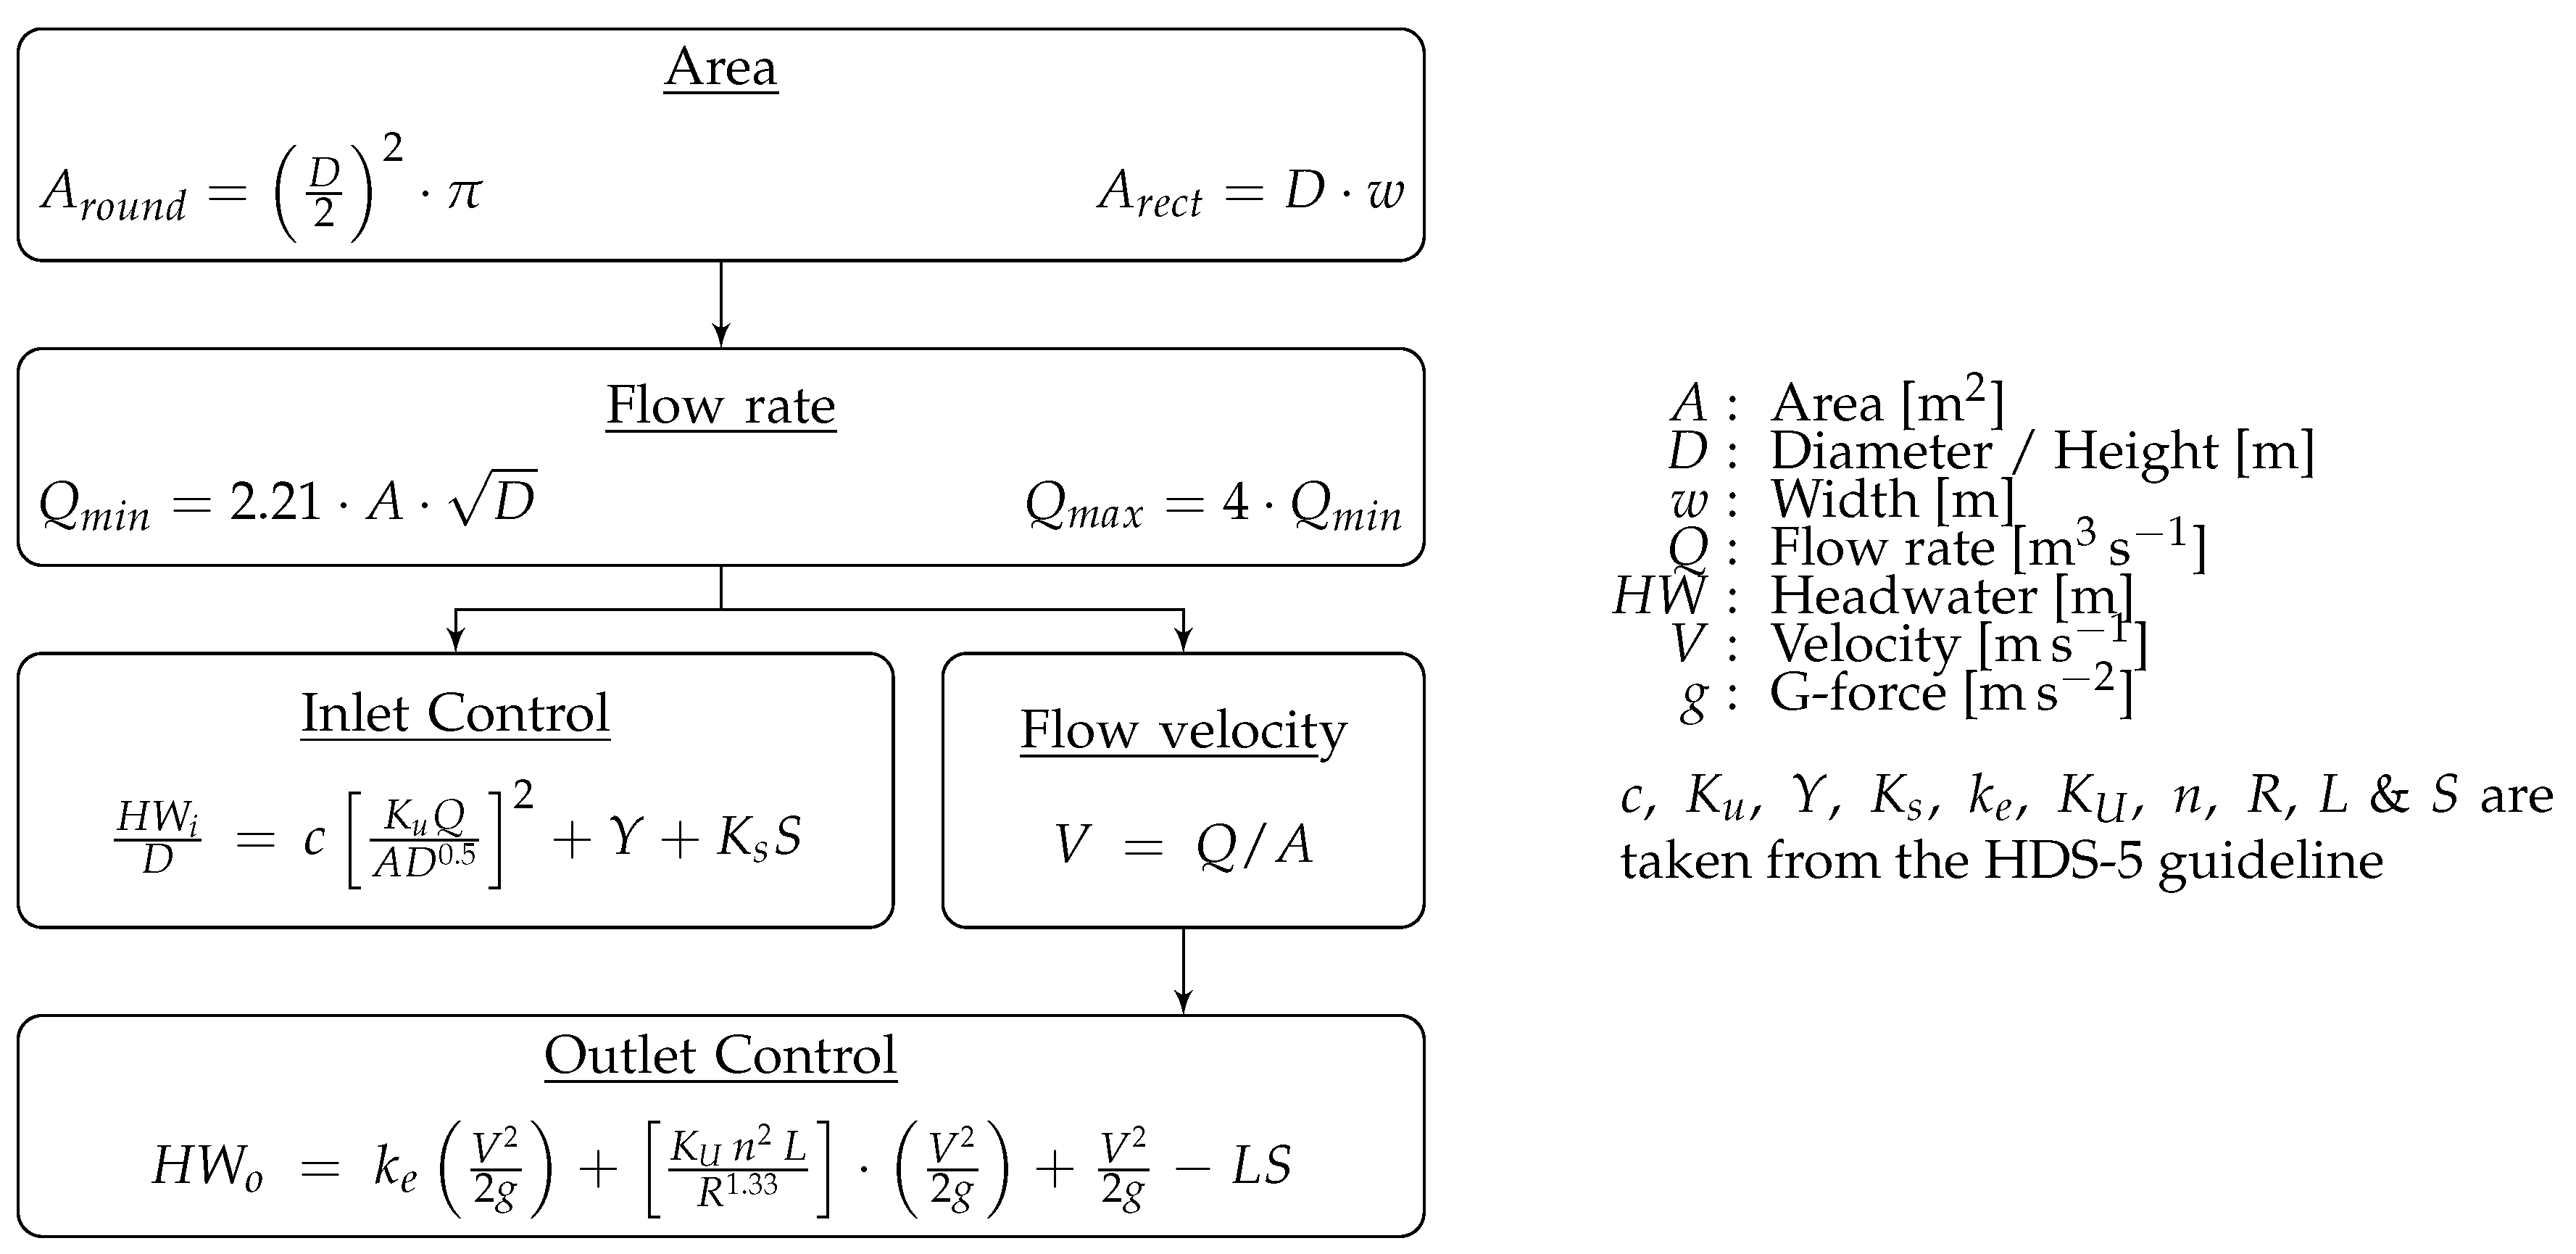
All configurations were calculated based on the HDS-5 guideline [5]. The inlet control equation for submerged inlets in this guideline is based on the orifice flow equation. Instead of using one loss coefficient (-value) as in the original equation, the HDS-5 equation for submerged inlets uses two loss coefficients and includes the slope of the culvert. These changes recognize the different inlet designs used for culverts and allow for a more flexible headwater calculation as the Bernoulli equation. To calculate the headwater levels under inlet control, the cross-sectional culvert area was calculated first. From there, an array of potential flow rates was calculated, beginning with the minimum flow rate for submerged culverts [5] and ending with a maximum four times larger than the minimum one. In the third step, headwater levels under inlet control were calculated for all different flow rates. As a full flowing pipe requires submerged inlets, this study only used the orifice flow equation and ignored weir flows under inlet control.
To calculate the headwater under outlet control, the area and flow rate needs to be calculated as well as the flow velocity. Area and flow rates were already calculated for inlet controlled flows, the flow velocities were calculated for the array of flow rates. The different headwater levels under outlet control were calculated with the equation from Reference [5], which is also based on the simplified Bernoulli equation for incompressible fluids. But the modifications are not as distinct as in the inlet control equation, the inlet loss is calculated with a single coefficient and adds to the other losses from the outlet, the friction within the pipe and the height difference between inlet and outlet. The variables used in this study were taken from the HDS-5 guideline and all coefficients used as standard properties are listed in Table 2.
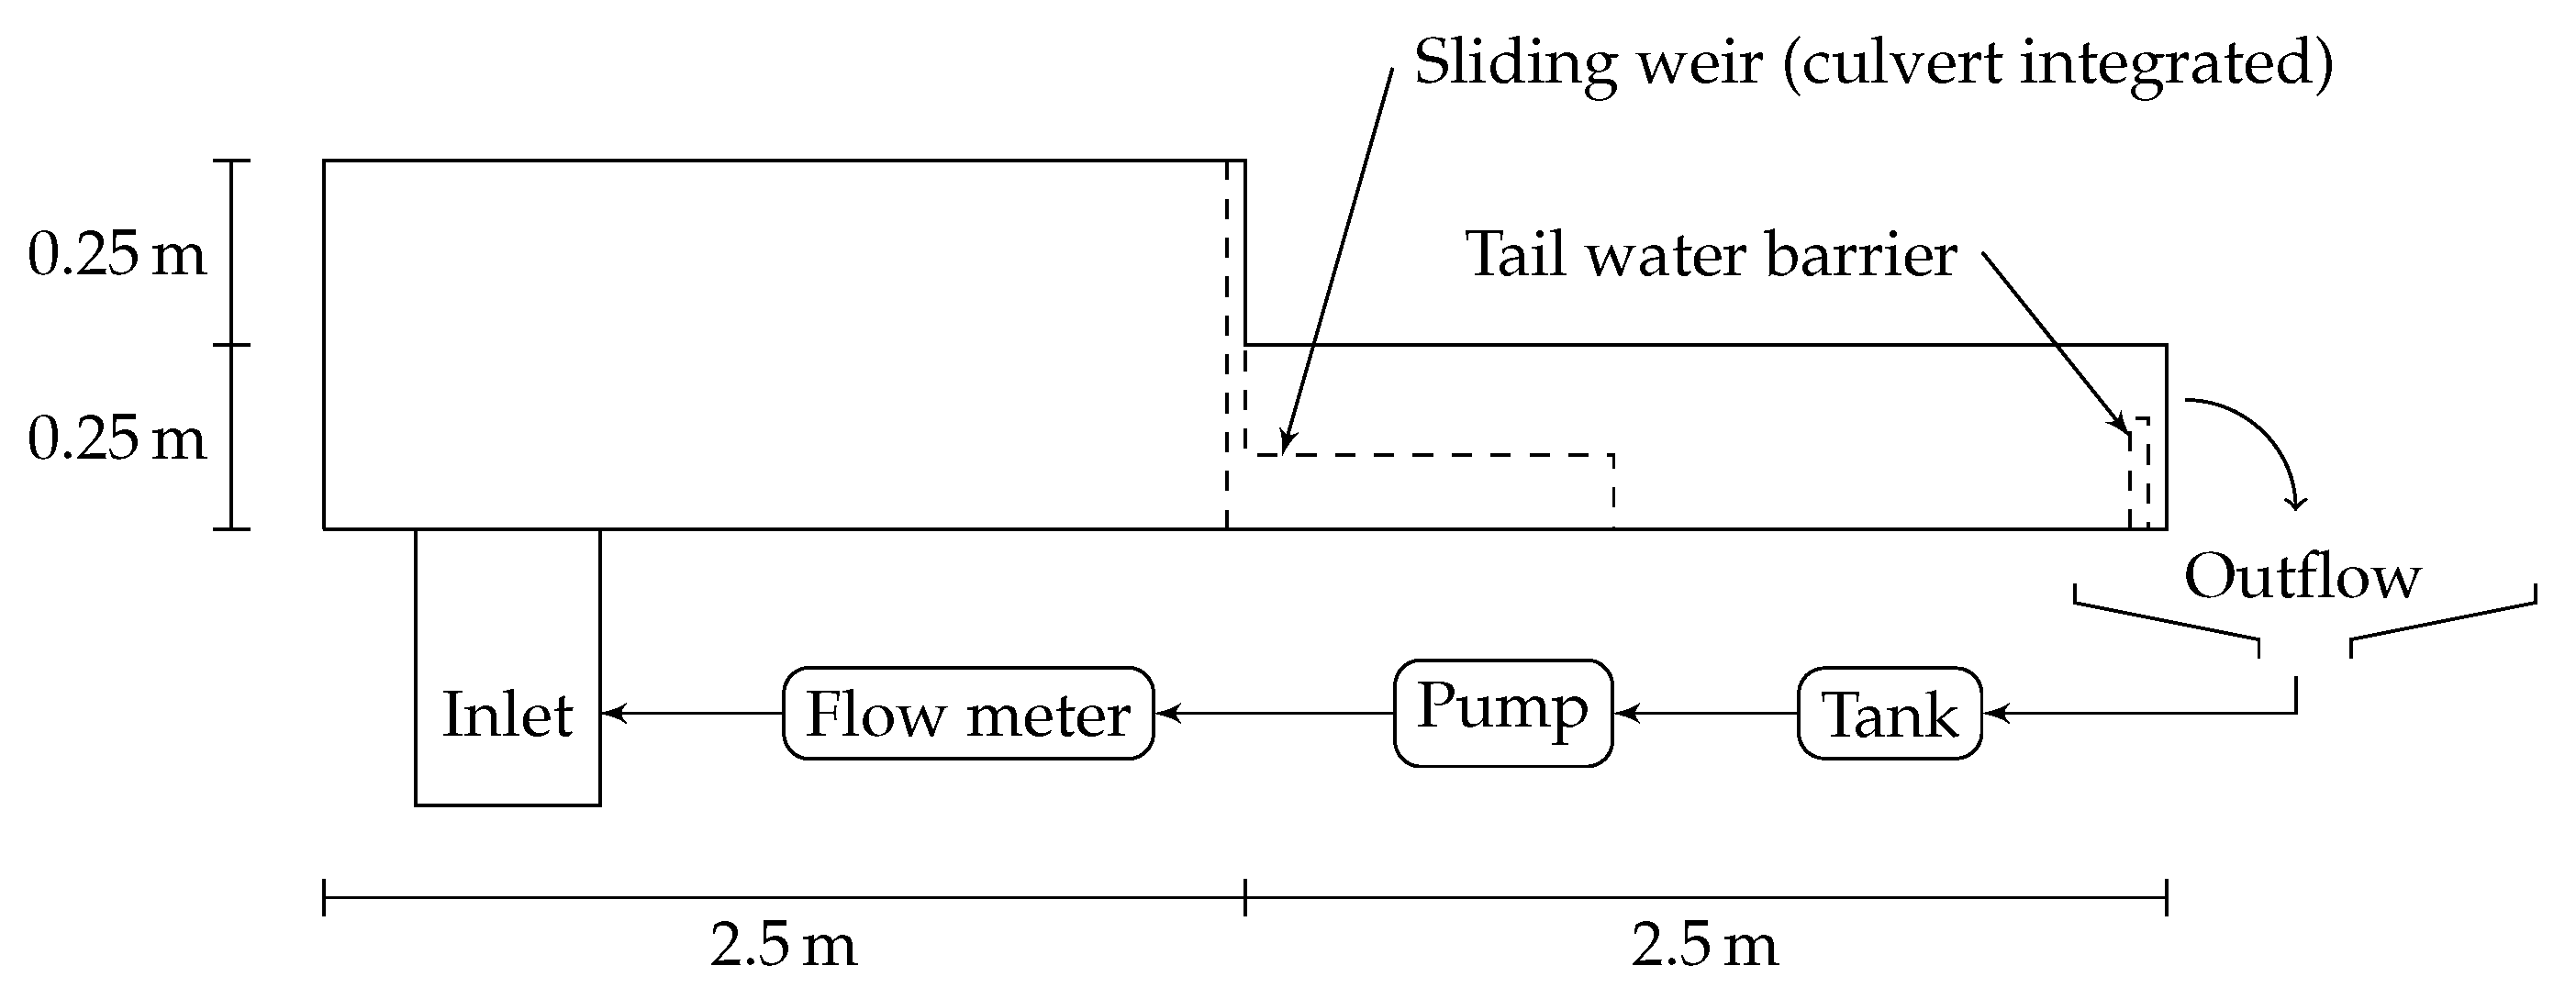
2.1. Experimental Setup
An evaluation of Dasika’s experiments shows that a flume was constructed to test a variety of different model culverts [14]. A similar experimental design was used for our study (Figure A1). The flume had a width of and a total length of 5 with the culvert model inlet being installed after . The maximum possible headwater height in the channel was and the tailwater could be raised up to 250 (different optional barriers could be installed just before the channel end). The flowrate was controlled by a variable speed drive, alternating the utility frequency of the pump. A magnetic flow meter (WaterMaster—FEX100, ABB Australia) was used to monitor the total inflow generated by the pump. The maximum error for this flow meter, as determined by the manufacturer, was less than 1%. The water entered the channel through an overflow construction, reducing turbulence in the headwater.
Measurements were taken five minutes after each flow rate change, to ensure there was enough time for the headwater levels to stabilize. Rectangular and round culvert shapes were tested, as they are the most common ones. The rectangular culverts had a cross-sectional area of 8640 mm2 while the round ones had a cross-sectional area of 8660 mm2. Both shapes were tested for different lengths (0.4 m, 0.7 m and 1 ). These were tested for flow rates up to 15 and slopes up to 2.5°. All these setups were tested for a culvert inlet configuration with straight headwalls and sharp, rectangular inlet corners.
A computer numerical controlled (CNC) router was used to cut the holes of different shapes into the perspex weirs to ensure precision. Headwater levels were measured with a piezometer and a ruler. The tailwater levels were measured with a ruler. The influence of the Venturi effect on the piezometer was determined over the range of flow rates by comparing ruler and piezometer measurements and correcting the final results.
To compare the experimental results with the calculated ones, the measured values were adjusted. For inlet control and outlet control, the measured headwater levels were corrected by incorporating the Venturi effect occurring in the piezometer. Experimental results under outlet control were corrected by taking account of the slope, the water height over the tailwater barrier and the height difference between the tailwater barrier and the culvert diameter.
2.2. Numerical Approach
As some setups are complex and more difficult to model in a scaled flume, the headwater levels for further culvert setups were calculated according to the HDS-5 guideline [5] rather than measured in experiments. The aim of these calculations was to identify the impact of the following factors on inlet and outlet control. The design configurations used in the modeled comparisons are given in parentheses.
- slope (0% and 2.5%)
- length (20 m and 100 m)
- shape (circular, rectangular)
- width:height ratio (1:1, 4:1)
- culvert material (smooth concrete, corrugated metal)
- inlet configuration (good, medium, bad)
It should be noted that several additional configurations were not investigated including: (i) multibarrel structures, as they mostly follow the superposition principle [16]; (ii) slip-lined culverts, as this culvert repair method must be evaluated for every case [17]; (iii) culverts with a natural stream bed, as they mimic natural creeks and enforced full pipe flow would oppose the design purpose [18] and (iv) Minimum Energy Loss Culverts [19], as they have more complex structure than standard culverts and are specifically designed for certain flows.
For the minimum flow rate the definition for submerged culverts from Reference [5] was used to calculate the starting flowrate for each setup individually. Another eight flow rates were calculated, stepwise increased by . These nine flow rates were used to calculate the headwater levels under inlet and outlet control, creating discharge curves for every setup (Figure A2).
The culvert setups used for these calculations were chosen with the dimensions and specifications given in Table 1. For inlet control, relevant coefficients were taken from the HDS-5 guideline, while for outlet control, the tailwater height, outlet losses and the friction losses were unknown. These were calculated using the flow velocities for each flow rate. Outlet losses were calculated with to incorporate water exiting the culvert, as the flow velocity decreased to that of the tailwater velocity. This represents cases where the flow velocity downstream is small compared to the culvert velocity and would be caused by a cross-sectional flow area downstream being much greater than that inside the culvert. This is a likely situation to occur with a downstream barrier.
The tailwater height was chosen to be as high as the outlet (tailwater height = culvert height). In reality, the tailwater levels would increase with higher flow rates and be determined by the width of the downstream weir. A rise in tailwater levels would contribute directly to the headwater. The chosen approach will show the greatest theoretical efficiency under outlet control and hence the height of the tailwater barrier could be chosen according to the flowrate.
3. Results and Discussion
The following results are displayed as dimensionless values according to Reference [20]. The relative energy head is written as with and the non-dimensional flow rate is defined as .
3.1. Experimental Results
The results from the flow experiments agreed well with the HDS-5 guideline. Figure 1a,b show a direct comparison between the experimental data and the HDS-5 calculations for both inlet and outlet control. The loss coefficients (Table 2) were used for the inlet and outlet control equations. The headwater levels of the inlet controlled flows matched the expected results from the calculations. The measured levels stayed within the expected accuracy of the experiments, as determined by the flow meter (max. error: 1%) and the piezometer (max. error 2 ).
The deviations between the experimental outlet control flows and the calculated results using the HDS-5 equations were greater than under inlet control. The measured headwater levels during very low flowrates were slightly higher than predicted (Figure 1a,b). With increasing flow rates the measured results were lower than the calculated ones. The maximum deviation between calculated predictions and experimental data in these cases was 11 . The most likely cause for the greater differences under outlet control than inlet control was the turbulent tailwater. The tailwater barrier that was used to force the model culvert into full pipe flow caused turbulence as it redirected the high velocity jet leaving the culvert. This caused an uneven water surface formation, with much less measurable precision than the headwater. Especially under higher flowrates, the downstream water body would consist of many areas with re-circulations and turbulence. The calculations though, would not incorporate these effects and had anticipated a calm and even surface downstream.
All lengths, slopes and shapes tested during the experiments performed better with an enforced full pipe flow at very high flowrates because the headwater levels were lower than under orifice control. Under inlet control, headwater levels rose higher than under outlet control, resulting in a better performance of full flowing culverts at high flowrates.
3.2. Numerical Analysis
Our experiments showed that culverts with high inlet and small pipe losses can benefit from an enforced full pipe flow during high flowrates. This supports the theory in Reference [14], but it is not known which culvert configurations demonstrate an improved performance under full pipe flow conditions. Setups with higher pipe friction losses and better performing inlets might not increase effectiveness under full flowing pipe conditions.
To evaluate this, headwater levels for a greater variety of culvert configurations were calculated for both inlet and outlet control. This allowed a comparison of individual culvert components in order to identify the overall performance in both flow controls.
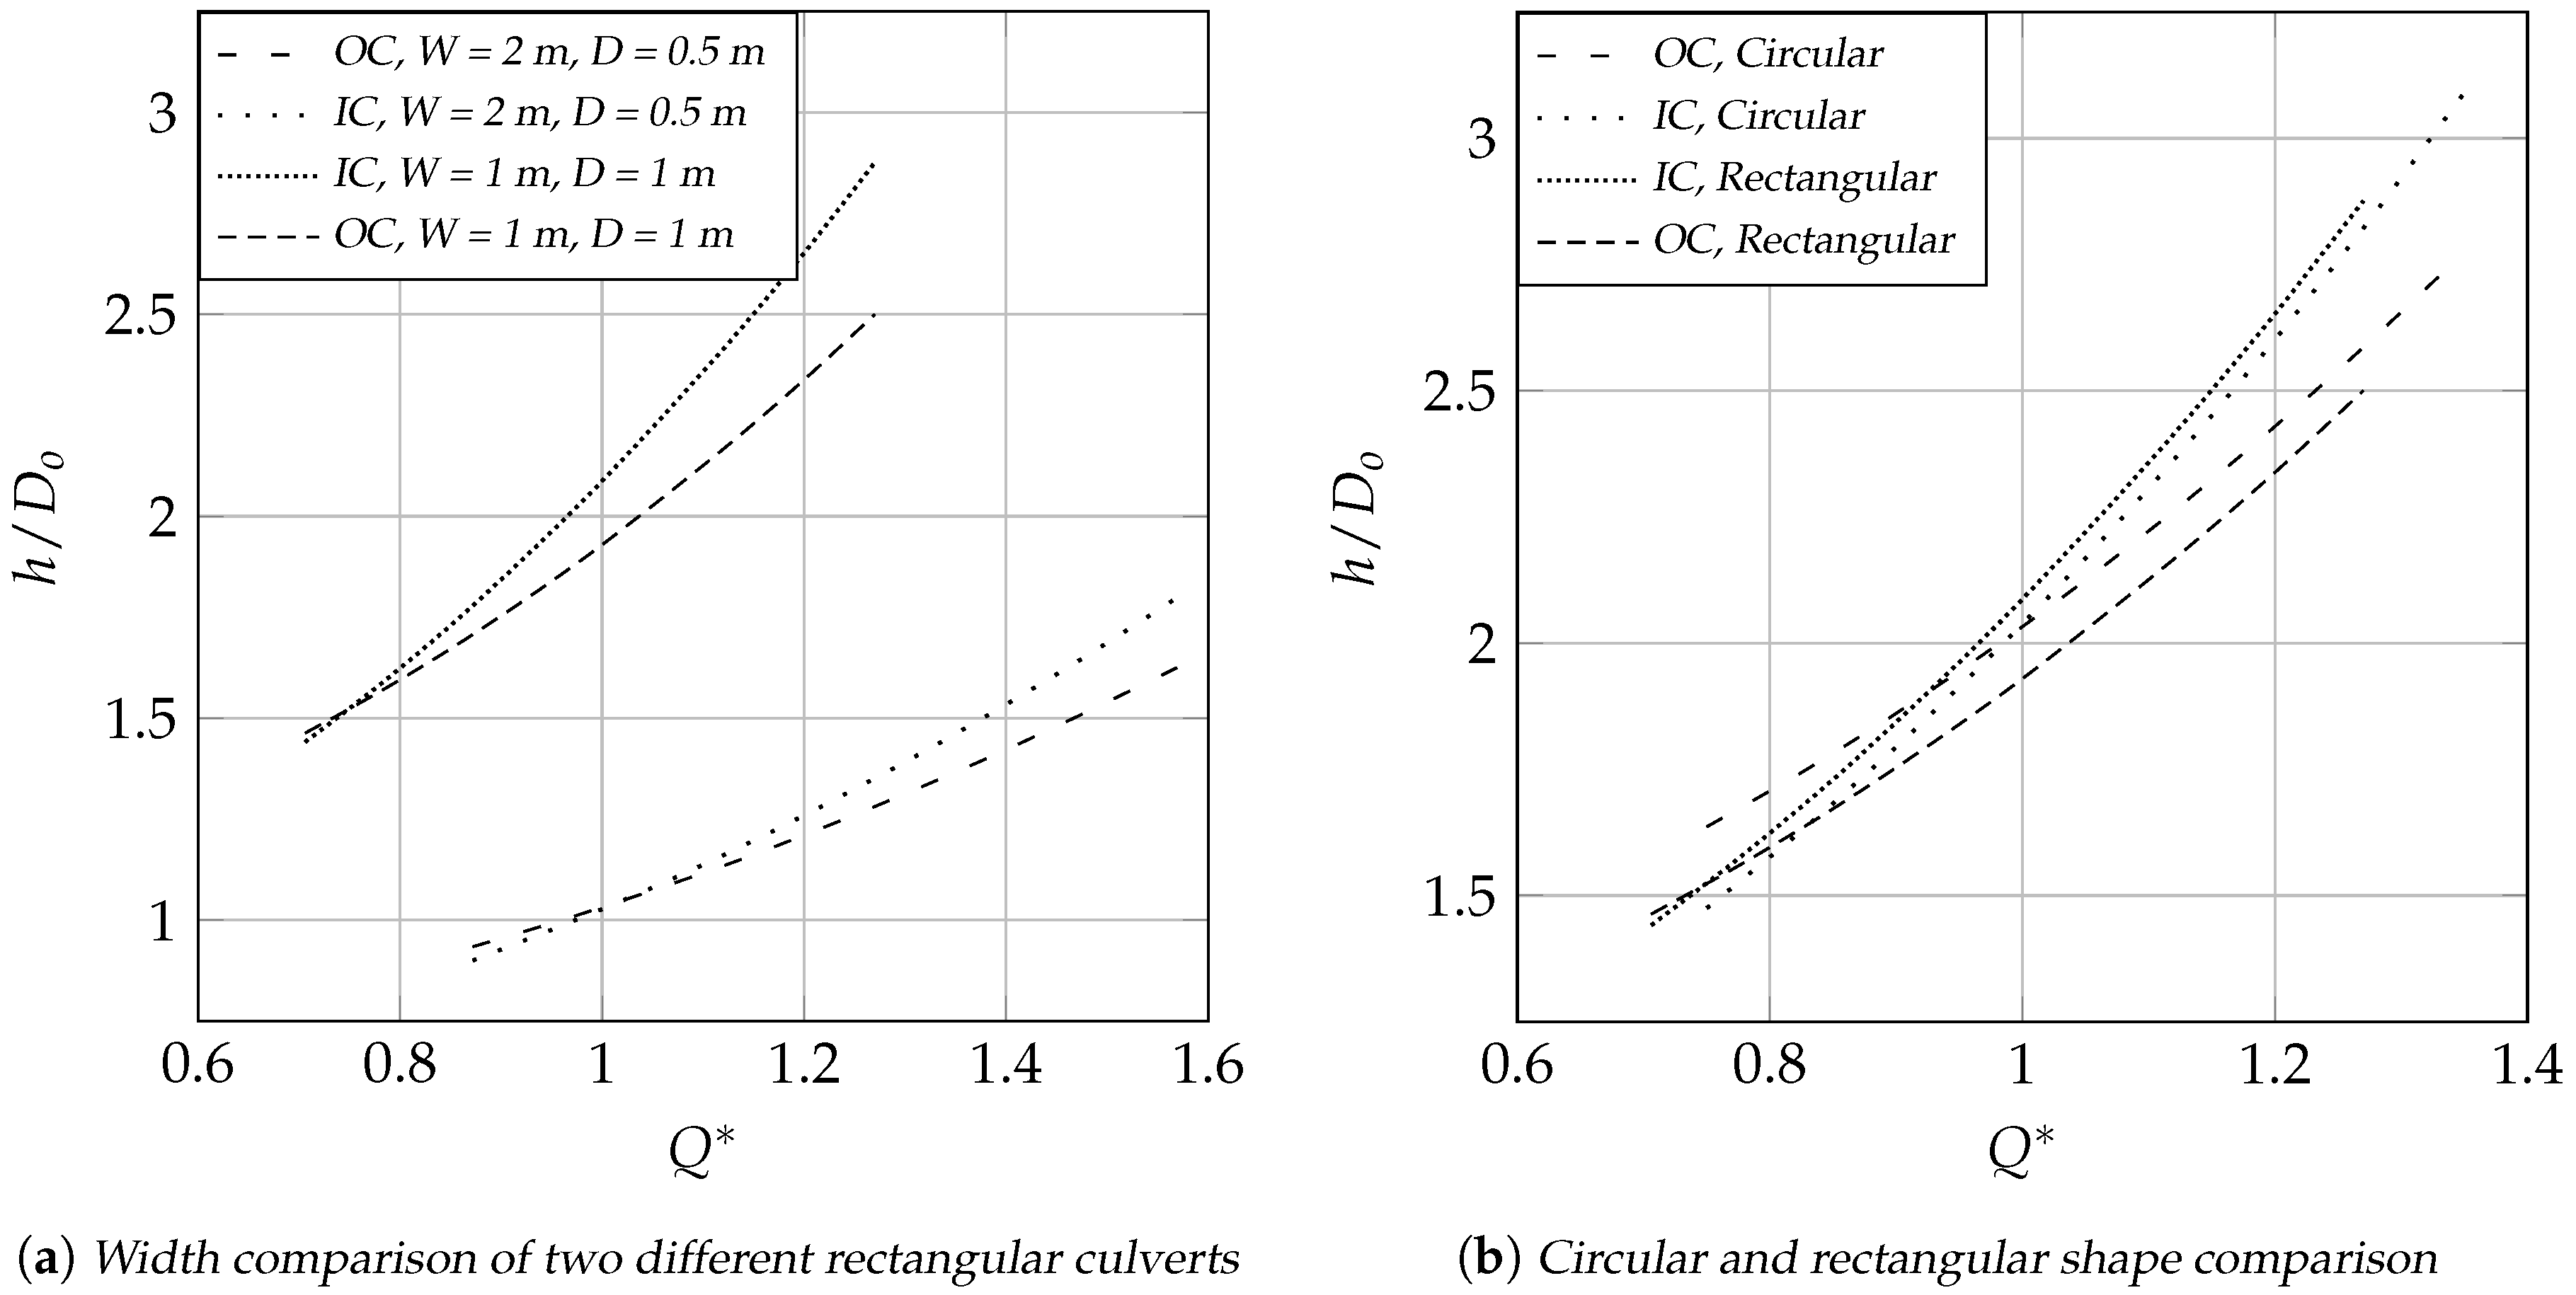
3.2.1. Comparison of Different Widths
Figure 2a shows two different height to width ratios: (i) a square rectangular culvert with 1 height and 1 width; and (ii) a square rectangular culvert with 0.5 height and 2 width. The cross-sectional area was the same in both configurations (1 m2), each had a square edge with headwall, 0% slope and a pipe with smooth concrete friction losses was used in the calculations.
A height to width ratio of approximately one seems preferable, as the ratio between the wetted perimeter and the cross-sectional area is low and, therefore, the associated losses will also be low. The direct comparison between these two shapes shows that the flat culvert performed better as the centroid is lower and, therefore, the usable headwater higher. This forces more water through the culvert. Using the greatest width in a channel crossing rather than maximizing the height seems preferable, as a greater headwater height relative to the culvert height increases the flow through the culvert.
3.2.2. Comparison of Different Shapes
In this set of calculations, the shape was altered: the rectangular and circular culvert both had the same cross-sectional area of 1 m2 and the inlet configuration consisted of a headwall with square edges at the inlet (Figure 2b). The rectangular profile performs better with an enforced full pipe flow from relatively low headwater levels on. The circular setup needs higher headwater levels in order to flow more efficiently under outlet control.
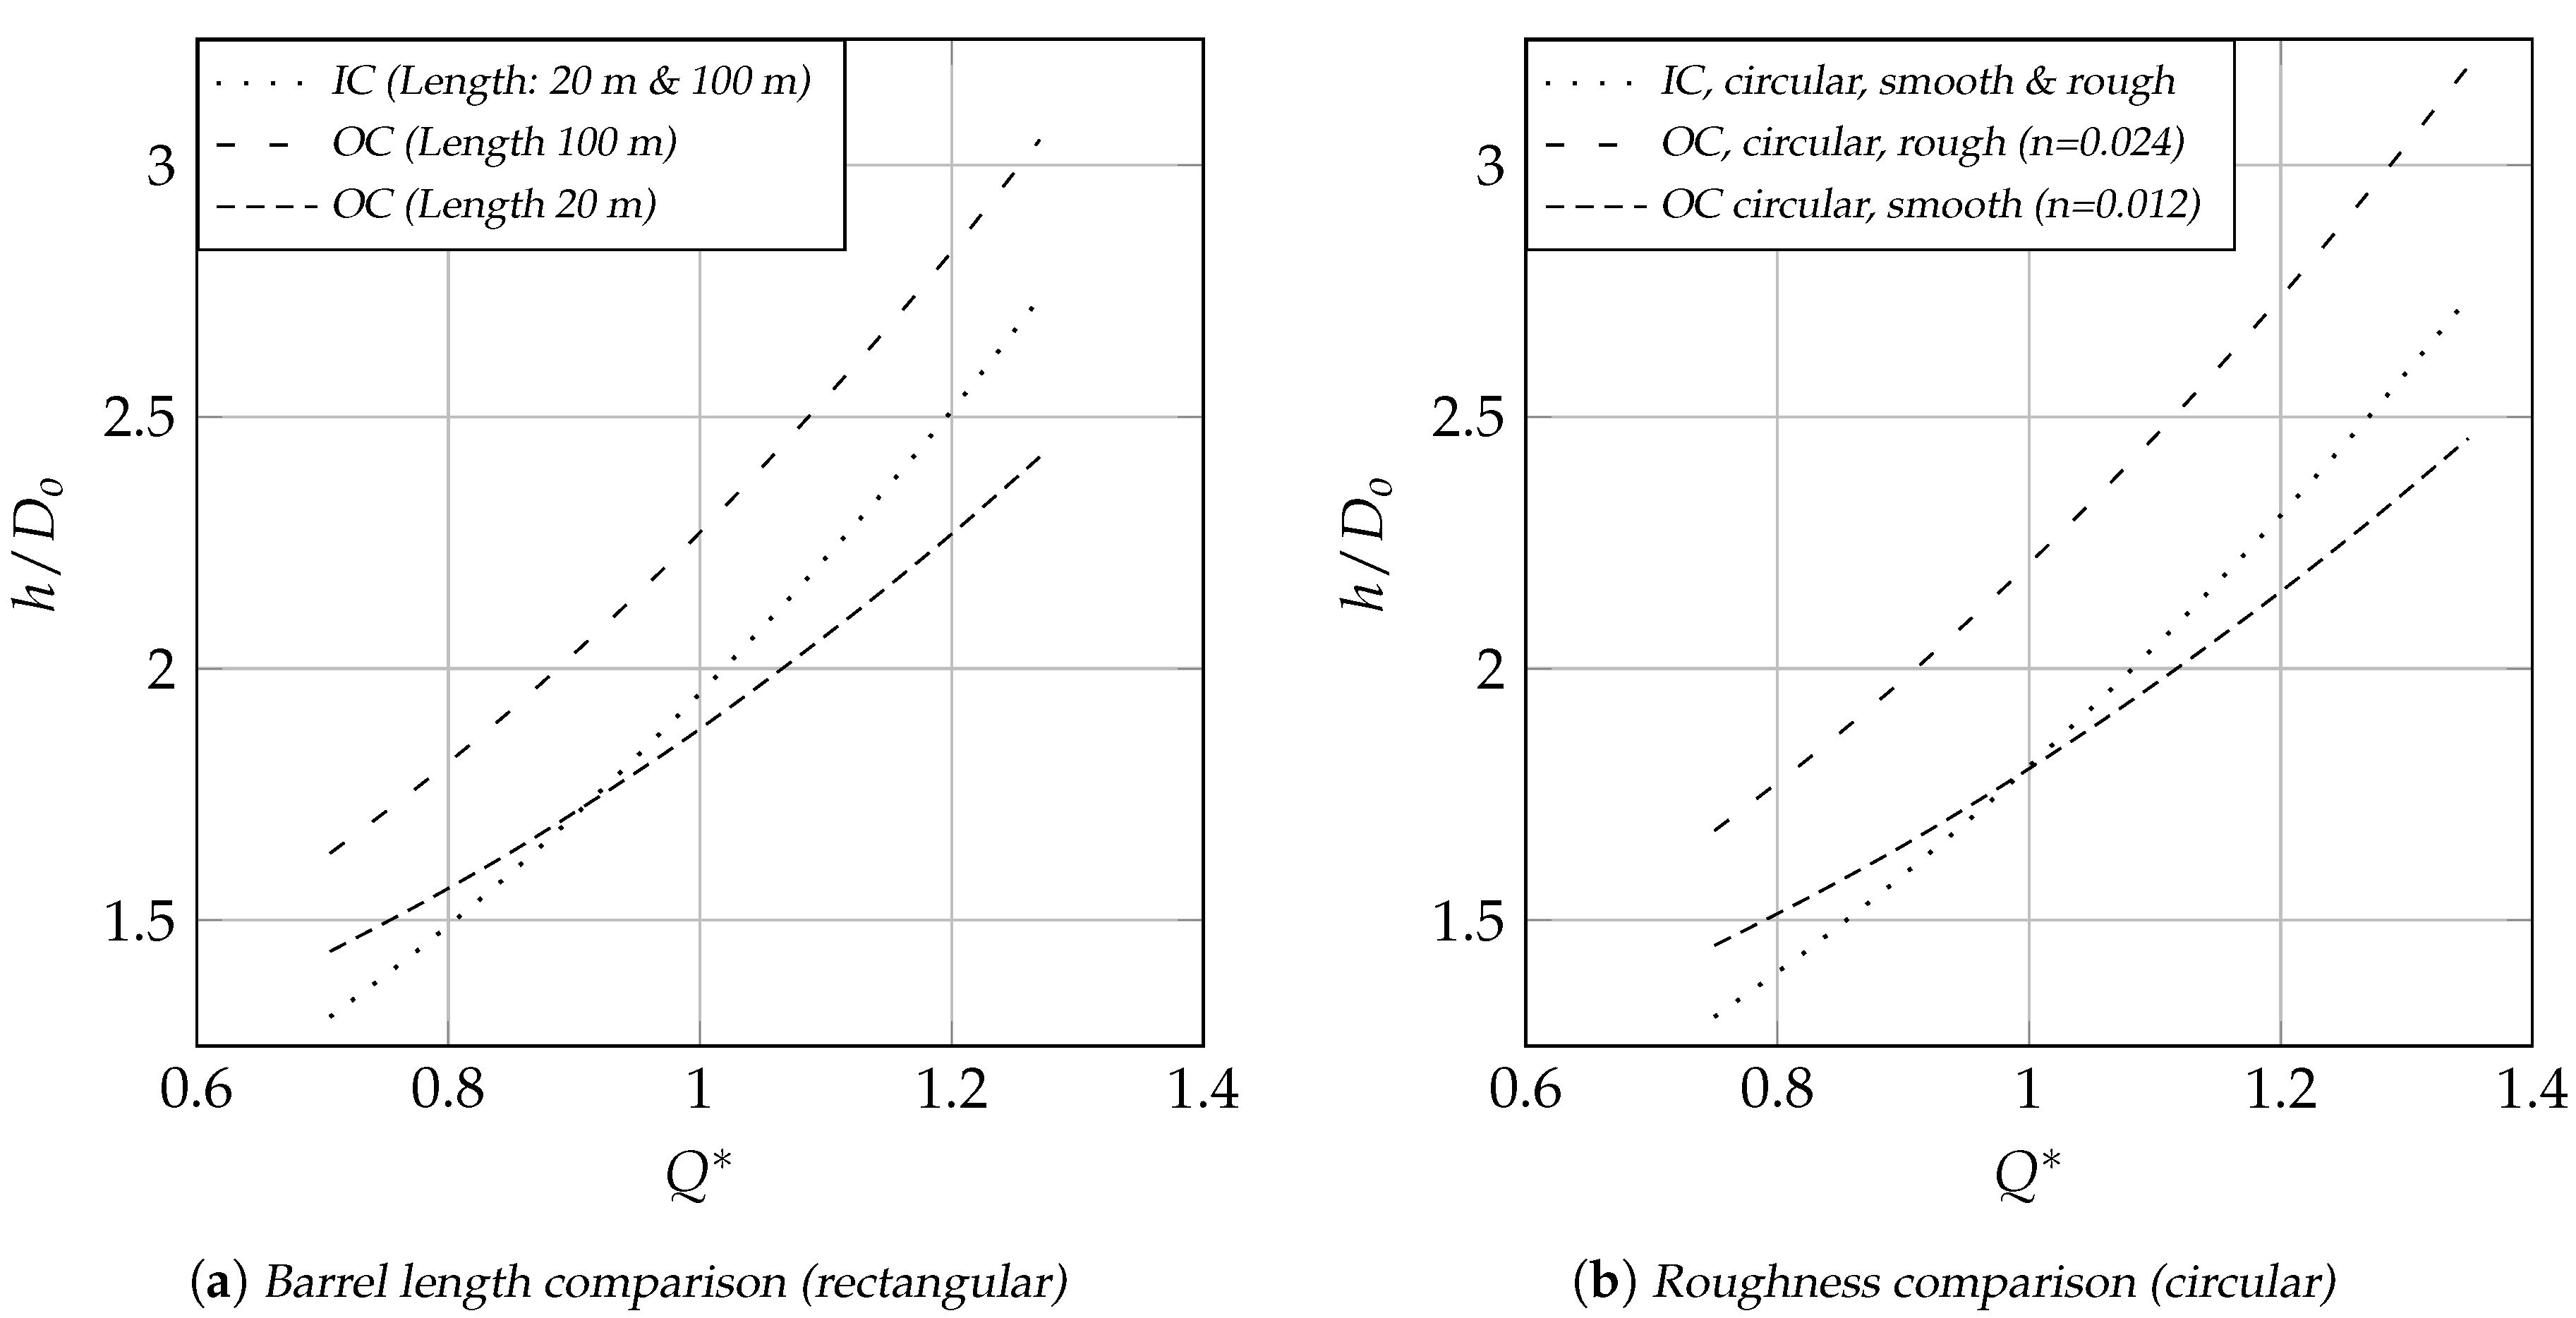
3.2.3. Comparison of Different Lengths
The influence of pipe length was evaluated by comparing a 20 m and 100 long circular culvert (Figure 3a) both with the same performance curve for inlet control as this control is not influenced by length. The results for outlet control, on the other hand, clearly indicated a change. The shorter culvert was more efficient under outlet control beyond headwater levels higher than 1.75 times the culvert height, whereas the 100 long culvert always performed worse under outlet control than under inlet controlled flows. Although both culverts were modeled as smooth concrete pipes with little friction losses in the pipe, the differences under outlet control were clearly visible.
3.2.4. Comparison of Different Materials
Different materials in culverts cause different friction losses under outlet control. Commonly used materials including concrete and corrugated metal, differ greatly in roughness and resulting friction losses. A comparatively smooth surface such as concrete has a much smaller Manning’s n value (n = 0.012) than corrugated metal (n = 0.024).
The different materials are compared in Figure 3b for circular culverts, as corrugated metal culverts do not exist in a rectangular shape. The flow in a smooth concrete pipe could be increased when outlet control is enforced for headwater levels greater than 1.8 times the culvert height. However, with a corrugated metal pipe, high friction causes losses within the pipe and enforcing outlet control would not increase the performance. Hence, the choice of pipe material is one of the most important factors regarding the overall performance of a culvert.
3.2.5. Comparison of Different Inlet Configurations
Figure 4 shows performance curves for different inlet configurations in (a) circular and (b) rectangular culverts. The tested configurations were taken from the HDS-5 guideline ([5], Tables A.1 & C.2). The guideline does not follow a consistent approach in naming inlet designs. Therefore the most similar descriptions were chosen from the inlet and outlet control section and directly compared with each other (coefficients listed in Table 3). Three configurations were chosen for each of the two shapes: (i) a very inefficient configuration; (ii) a standard headwall configuration; and (iii) a very efficient configuration.
Projecting pipes and parallel wingwalls have the worst overall hydraulic performance and the performance under inlet control is worse than under outlet control for higher flow rates. This configuration would benefit from a change to outlet control but the difference between inlet and outlet controlled flows changes as inlet designs improves. For the most efficient inlet designs from the HDS-5 guideline (Table 3—smooth tapered inlet design and beveled edges), the inlet controlled flow is always more efficient than the outlet controlled flow. Just by changing the inlet design of a culvert, headwater levels can be reduced from 1.5 times the culvert height down to 1.25 times the culvert height (Figure 4a,b) with even greater differences at higher flow rates.
4. Summary and Conclusions
Our experiments and calculations show that some culvert configurations perform better under outlet control than under inlet control at higher flow rates. For low flow rates, the headwater levels are typically higher under outlet control than under inlet control. When headwater levels are above 1.5 times the culvert height, outlet control can be more efficient than inlet control in culverts with high inlet losses and very low pipe losses. Minimal friction losses within a pipe require a low-drag material, short pipes or a longer, sloped pipe. High inlet losses are found in culverts with poor hydraulic designs, such as sharp bends or corners. The discharge rates of those culverts would benefit from a tailwater barrier that enforces outlet control during higher flow rates. In contrast to Dasika’s suggestion [14] to enforce outlet control in every existing culvert, this study has shown that there are only some culverts, where the flow rates could be increased by this approach.
During this study into the advantages of enforced outlet control in culverts, the following observations were made:
- Pressurized flows benefit from steeper slopes. Inclusion of slopes has a negligible influence under inlet control but a substantial impact under outlet control. As the flow is pressurized, it utilizes the full height difference between the culvert inlet and outlet and results in lower headwater levels.
- The height to width ratio has little influence on the performance differences between inlet and outlet control but a greater perimeter to cross-sectional area ratio results in higher friction losses and a lower overall flow capacity.
- The barrel roughness has a high impact on the outlet control performance. In terms of high flow rates, some smooth concrete culverts under outlet control perform better than under inlet control. Enforced outlet control could be utilized in smooth concrete culverts to increase their efficiency. Rougher pipe materials prevent the same effect due to higher friction losses, that is, corrugated metal culverts never perform better under outlet than they do under inlet control.
- Similar to the high influence of the barrel roughness under outlet control, the length plays an important role as well. The longer an outlet controlled culvert, the higher the friction losses within the barrel. Steeper slopes, however, can partially compensate for pipe losses. But as greater lengths lead to greater, velocity dependent friction losses as well, the advantage of the height difference is often canceled out.
- Inlet design has a significant impact on the relative performance of inlet and outlet controlled flows. Inlets with improved hydraulic performance can increase the flow through a culvert by up to 30% (Figure 4a,b). The use of hydraulic efficient inlets will improve many culverts, as discharge rates increase under both flow controls. Many culverts are built without hydraulic considerations of the inlet because design guidelines do not explicitly state the performance benefits of an optimized inlet design.
Dasika [14] suggested that performances could be increased by raising the tailwater levels but our research showed that not to be the case for most configurations. However, flow rates in culverts can be improved with better inlet design. Both flow controls benefit from optimized inlet designs which is potentially cheaper and easier to implement than the installation of tailwater barriers. Improving the inlet in existing and future culverts would increase the performance significantly. With this modification existing culverts would be able to handle the higher discharge rates expected as a consequence of global warming.
Author Contributions
Conceptualization, formal analysis, investigation, methodology, software, validation, writing–original draft preparation, R.J.; writing–review and editing, R.J., K.T., S.P., M.P., C.J. and N.T.; supervision, K.T., S.P., M.P., C.J. and N.T.
Funding
The authors thank the Sunshine Coast Council for the provided funding and their helpful input.
Acknowledgments
Special thanks go to Stewart Lloyd who helped in the construction of the experimental flume.
Conflicts of Interest
The authors declare no conflict of interest. The funders had no role in the design of the study; in the collection, analyses, or interpretation of data; in the writing of the manuscript, or in the decision to publish the results.
Abbreviations
The following abbreviations are used in this manuscript:
| A | Area |
| D | Diameter |
| Hydraulic diameter | |
| eqn. | Equation |
| g | Gravitational force |
| h | Head water |
| HDS-5 | Hydraulic Design of Highway Culverts, Hydraulic Design Series 5 |
| HW | Head wall |
| IC | Inlet control |
| OC | Outlet control |
| P | Wetted perimeter |
| Q | Flow rate |
| Non-dimensional flow rate | |
| W | Width |
| WW | Wing wall |
Appendix A. Methods
Figure A1.
Schematic sideview of the experimental flume.

Figure A2.
Calculation flowchart showing area calculations for rectangular and round shaped culverts and flow rate calculation for submerged inlets according to Reference [5]. Maximum used flow rate was 4 times larger than the minimum one; flow velocities only calculated for full flowing pipes.
Figure A2.
Calculation flowchart showing area calculations for rectangular and round shaped culverts and flow rate calculation for submerged inlets according to Reference [5]. Maximum used flow rate was 4 times larger than the minimum one; flow velocities only calculated for full flowing pipes.

References
- Chang, H.K.; Tan, Y.C.; Lai, J.S.; Pan, T.Y.; Liu, T.M.; Tung, C.P. Improvement of a drainage system for flood management with assessment of the potential effects of climate change. Hydrol. Sci. J. 2013, 58, 1581–1597. [Google Scholar] [CrossRef] [Green Version]
- Mamo, T.G. Evaluation of the Potential Impact of Rainfall Intensity Variation due to Climate Change on Existing Drainage Infrastructure. J. Irrig. Drain. Eng. 2015, 141, 05015002. [Google Scholar] [CrossRef]
- Modesto Gonzalez Pereira, M.J.; Sanches Fernandes, L.F.; Barros Macário, E.M.; Gaspar, S.M.; Pinto, J.G. Climate Change Impacts in the Design of Drainage Systems: Case Study of Portugal. J. Irrig. Drain. Eng. 2015, 141, 05014009. [Google Scholar] [CrossRef] [Green Version]
- Todeschini, S. Trends in long daily rainfall series of Lombardia (northern Italy) affecting urban stormwater control. Int. J. Climatol. 2012, 32, 900–919. [Google Scholar] [CrossRef]
- Schall, J.D.; Thompson, P.L.; Zerges, S.M.; Kilgore, R.T.; Morris, J.L. Hydraulic Design of Highway Culverts, 3rd ed.; Hydraulic Design Series; U.S. Department of Transportation, Federal Highway Administration: Washington, DC, USA, 2012; Volume 5.
- French, J.L. First Progress Report on Hydraulics of Short Pipes: Hydraulic Characteristics of Commonly Used Pipe Entrances; NBS Report; U.S. Department of Commerce, National Bureau of Standards: Washington, DC, USA, 1955; Volume 4444.
- French, J.L. Second Progress Report on Hydraulics of Culverts: Pressure and Resistance Characteristics of a Model Pipe Culvert; NBS Report; U.S. Department of Commerce, National Bureau of Standards: Washington, DC, USA, 1956; Volume 4911.
- French, J.L. Third Progress Report on Hydraulics of Culverts: Effect of Approach Channel Characteristics on Model Pipe Culvert Operation; NBS Report; U.S. Department of Commerce, National Bureau of Standards: Washington, DC, USA, 1957; Volume 5306.
- French, J.L. Fourth Progress Report on Hydraulics of Culverts: Hydraulics of Improved Inlet Structures for Pipe Culverts; NBS Report; U.S. Department of Commerce, National Bureau of Standards: Washington, DC, USA, 1961; Volume 7178.
- French, J.L. Fifth Progress Report on Hydraulics of Culverts Nonenlarged Box Culvert Inlets; NBS Report; NBS: Washington, DC, USA, 1966; Volume 9327.
- French, J.L. Sixth Progress Report on Hydraulics of Culverts: Tapered Box Culvert Inlets; NBS Report; U.S. Department of Commerce, National Bureau of Standards: Gaithersburg, MD, USA, 1966; Volume 9355.
- French, J.L.; Bossy, H.G. Seventh Progress Report on Hydraulics of Culverts: Tapered Box Culvert Inlets with Fall Concentration in the Inlet Structure; National Bureau of Standards: Washington, DC, USA, 1967.
- Bodhaine, G.L. Measurement of Peak Discharge at Culverts by Indirect Methods; Techniques of Water-Resources Investigations of the United States Geological Survey; U.S. G.P.O: Washington, DC, USA, 1968; Volume bk. 3, Chapter A3.
- Dasika, B. New approach to design of culverts. J. Irrig. Drain. Eng. 1995, 121, 261–264. [Google Scholar] [CrossRef]
- Montes, J.S.; Dasika, B. Discussion and Closure: New Approach to Design of Culverts. J. Irrig. Drain. Eng. 1997, 123, 71–72. [Google Scholar] [CrossRef]
- Haderlie, G.M.; Tulis, B.P. Hydraulics of multibarrel culverts under inlet control. J. Irrig. Drain. Eng. 2008, 134, 507–514. [Google Scholar] [CrossRef]
- Tullis, B.P.; Anderson, D.S. Slip-Lined Culvert Inlet End Treatment Hydraulics. J. Irrig. Drain. Eng. 2010, 136, 31–36. [Google Scholar] [CrossRef]
- Tullis, B.P.; Anderson, D.S.; Robinson, S.C. Entrance loss coefficients and inlet control head-discharge relationships for buried-invert culverts. J. Irrig. Drain. Eng. 2008, 134, 831–839. [Google Scholar] [CrossRef]
- Chanson, H. Minimum Specific Energy and Critical Flow Conditions in Open Channels. J. Irrig. Drain. Eng. 2006, 132, 498–502. [Google Scholar] [CrossRef] [Green Version]
- Hager, W.H.; Del Giudice, G. Generalized culvert design diagram. J. Irrig. Drain. Eng. 1998, 124, 271–274. [Google Scholar] [CrossRef]
Figure 1.
Experimental and calculated test results with a total pipe length of 700 . Max. error flow meter: 1%; max. error piezometer: 2 ; n = 5.
Figure 1.
Experimental and calculated test results with a total pipe length of 700 . Max. error flow meter: 1%; max. error piezometer: 2 ; n = 5.

Figure 2.
Comparison between different widths and shapes.

Figure 3.
Comparison between lengths and roughnesses.

Figure 4.
Comparison of different inlet configurations for (a) circular and (b) rectangular culverts.
Figure 4.
Comparison of different inlet configurations for (a) circular and (b) rectangular culverts.


Table 1.
Standard properties for investigated culvert. Unless stated otherwise, these values were used for all calculations.
Table 1.
Standard properties for investigated culvert. Unless stated otherwise, these values were used for all calculations.
| Slope | [-] | 0 | |
| Length | [] | 20 | |
| Mannings n (Material) | [-] | 0.012 (smooth concrete—[5]) | |
| Inlet Configuration | Headwall with square edge | ||
| Rectangular | Circular | ||
| Height | [] | 1 | |
| Width | [] | 1 | - |
Table 2.
Entrance loss coefficients for modeled culverts. c and Y are loss coefficients from the inlet control equation, is a loss coefficient from the outlet control equation.
Table 2.
Entrance loss coefficients for modeled culverts. c and Y are loss coefficients from the inlet control equation, is a loss coefficient from the outlet control equation.
| Shape | Inlet Configuration | IC (submerged) | OC | |
|---|---|---|---|---|
| Circular | Square edge with headwall | 0.0398 | 0.67 | 0.5 |
| Rectangular | 90° to 15° wingwall flares | 0.04 | 0.08 | 0.5 |
Table 3.
Entrance loss coefficients for modeled culverts. These coefficients were used to compare different inlet designs under the two different flow controls. The inlet control equation contains two variables (c & Y) to describe the head losses, the outlet control equation uses just one (); HW = headwall, WW = wingwall.
| HDS-5 Description | c | Y | Efficiency | ||
|---|---|---|---|---|---|
| Circular IC: | Projecting | 0.0553 | 0.54 | bad | |
| Circular OC: | Projecting from fill | 0.9 | bad | ||
| Circular IC: | Square edge with HW | 0.0398 | 0.67 | medium | |
| Circular OC: | HW or HW & WW, Square edge | 0.5 | medium | ||
| Circular IC: | Smooth tapered inlet throat | 0.0196 | 0.9 | good | |
| Circular OC: | Side- or slope-tapered inlet | 0.2 | good | ||
| Rectangular IC: | wingwall flares | 0.0423 | 0.82 | bad | |
| Rectangular OC: | WW parallel Square-edged at crown | 0.7 | bad | ||
| Rectangular IC: | to wingwall flares | 0.04 | 0.08 | medium | |
| Rectangular OC: | WW at to to barrel Square-edged at crown | 0.5 | medium | ||
| Rectangular IC: | HW with bevels | 0.0252 | 0.865 | good | |
| Rectangular OC: | HW parallel to embankment, rounded or beveled edges | 0.2 | good | ||
© 2019 by the authors. Licensee MDPI, Basel, Switzerland. This article is an open access article distributed under the terms and conditions of the Creative Commons Attribution (CC BY) license (http://creativecommons.org/licenses/by/4.0/).
Share and Cite
MDPI and ACS Style
Jaeger, R.; Tondera, K.; Pather, S.; Porter, M.; Jacobs, C.; Tindale, N. Flow Control in Culverts: A Performance Comparison between Inlet and Outlet Control. Water 2019, 11, 1408. https://doi.org/10.3390/w11071408
AMA Style
Jaeger R, Tondera K, Pather S, Porter M, Jacobs C, Tindale N. Flow Control in Culverts: A Performance Comparison between Inlet and Outlet Control. Water. 2019; 11(7):1408. https://doi.org/10.3390/w11071408
Chicago/Turabian StyleJaeger, Rick, Katharina Tondera, Selvan Pather, Mark Porter, Carolyn Jacobs, and Neil Tindale. 2019. "Flow Control in Culverts: A Performance Comparison between Inlet and Outlet Control" Water 11, no. 7: 1408. https://doi.org/10.3390/w11071408
Note that from the first issue of 2016, this journal uses article numbers instead of page numbers. See further details here.