The Role of the Unsaturated Zone for Rainwater Retention and Runoff at a Drained Wetland Site


1
Leibniz Centre for Agricultural Landscape Research (ZALF), Eberswalder Straße 84, D-15374 Müncheberg, Germany
2
Federal Institute for Geosciences and Natural Resources (BGR), Stilleweg 2, D-30655 Hannover, Germany
*
Author to whom correspondence should be addressed.
Water 2019, 11(7), 1404; https://doi.org/10.3390/w11071404
Submission received: 10 May 2019
/
Revised: 29 June 2019
/
Accepted: 5 July 2019
/
Published: 9 July 2019
(This article belongs to the Section Hydrology)
Abstract
:Drained wetland sites with shallow water tables cover large parts of Central and Western European lowlands. Their hydrological behaviour is complex and depends on their specific characteristics. In this paper, we analysed how the water budget components of such areas behaved when undergoing rainfall events with amounts greater than 10 mm. All the water budget components were determined using a weighable groundwater lysimeter that was installed in the Spreewald wetland, Germany. On average, 69% of the rainfall was stored in the wetland, while only 8% was discharged and 23% was dissipated by evapotranspiration during the time of the runoff process during and after the rainfall event. More than half of the water that was stored could be attributed to storage within the unsaturated zone, while only a minor part was due to the water storage change under quasi-equilibrium conditions. Hence, the soil moisture depletion in the unsaturated zone in the period before the rainfall had a big influence on the site’s available water storage capacity. The findings show that models and approaches assuming hydrostatic conditions might strongly underestimate the water storage capacity of shallow water table sites and, consequently, overestimate the runoff. Hence, the hydrostatic assumption does not describe the process dynamics of these sites in an appropriate manner.
1. Introduction
Wetlands are often described as natural sinks for water and nutrients transported by water. Natural wetlands, especially, are perceived to act as a sponge; they are believed to buffer surplus water coming from precipitation or inflow from the catchment (via groundwater flow or from water bodies) and to emit it slowly to the downstream part of the river basin [1]. However, in Central and Western Europe, many wetlands have been drained in the last 200 years to lower groundwater levels and allow the land use to shift towards agriculture or forestry, or to optimize conditions for grassland use (e.g., increasing yields, enhanced species composition, and trafficability for machinery) [2,3]. The water balance of these drained wetlands is nowadays strongly altered due to active regulation by water management systems consisting of ditches, weirs, and sometimes pumping stations. Still, some typical wetland characteristics remain: water tables (WTs) only a few decimetres below the ground, high evapotranspiration, the domination of what is by now mostly degraded peat or hydric soils, and extensive grasslands as the prevailing form of land use.
In a broad overview, Bullock and Acreman [4] showed that the role of wetlands in the hydrological cycle can be very heterogeneous and depends on the wetland type. In their review, wetlands were distinguished based on their catchment location, connectivity to the groundwater system and connectivity to the downstream channel network. Independently of the type, the location within a catchment or the state of a wetland, the hydrological response to rainfall (P) is complex, especially the resulting behaviour of the outflow (Rout). Bacon, et al. [5] listed diverse examples from the literature where peatlands did not behave like sponges. The behaviour of the peatlands varied depending on the site conditions. A comprehensive understanding can only be achieved when all water balance components are taken into account, i.e., including the share of rainfall dissipated by actual evapotranspiration (ETa) and the water storage change (ΔS) caused by the rainfall. Yet most studies have had a limited focus and concentrated on Rout only.
The potential of natural wetlands for water storage and streamflow regulation is constrained. Natural wetlands can store water, especially when WTs are low, a condition which is rarely met. The WT position also controls how the streamflow emerging from peatlands responds to summer rains [6]. Rout increases rapidly when the storage capacity of a wetland is exceeded and surface runoff starts [7]. When the soils are saturated or the WTs are above ground, streamflow can increase quickly, especially during intense storms, as runoff is then dominated by overland flow [8,9]. This behaviour is more typical of upland wetlands than wetlands located in downstream valleys, since the latter have a rather flat topography. Reactions of Rout to rainfall events are also sensitive to the antecedent saturation of the wetland soils, the storage and flow characteristics of the unsaturated and saturated zone, and the conveyance capabilities of the wetland channel system [10,11,12]. In general, wetlands are poor regulators of runoff when saturated [13]. Comparable results were found for agriculturally used shallow water table sites in connection with storm events [14,15,16,17,18].
The hydrology of drained wetlands deviates from that of natural wetlands. However, the empirical evidence given by the available publications is not homogeneous. Some papers report increasing Rout and peak flows and decreasing surface-water storage [19,20,21,22] as well as an increase in summer low flows [23]. Some studies report decreasing peak flows as, for instance, the influence of lowered WTs can exceed that of the increased channel conveyance capacity [24]. Restoring drained peatlands by ditch blocking, followed by increased WTs, can lead to a reduction in Rout. This is comparable to the effects of controlled drainage at agriculturally used shallow water table sites [14,25,26]. Yet wetter antecedent conditions can increase the variability of Rout and peak flows [14,16,27,28], while increased water storage after restoration can also cause greater WT stability and a reduction in peak flows [29,30].
In summary, the water retention at shallow water table sites, natural or drained, depends on the soil hydraulic properties and the hydraulic gradients within the soil profile. The hydraulic gradient at the beginning of a rainfall event is mainly affected by the depletion of the unsaturated zone by evapotranspiration. However, according to the literature, it is difficult to quantify the depletion and hence the available storage capacity depending on the actual but temporarily changing site conditions. Most of the studies mentioned above only analysed the relationship between P and Rout, because P, WT and Rout in ditches can be relatively easily measured. Estimating ΔS is much more problematic, especially for large fields or on a catchment scale. While ΔS can be neglected in long-term studies, given that similar WTs prevail at the start and the end of the investigated time period [25], it has to be considered when investigating short-term reactions to rainfall events. ΔS can be calculated indirectly from soil analyses or soil moisture measurements [14,31,32,33], or as a residuum of the water budget. Such methods have been used in many paired field studies.
An improved understanding of the storage behaviour of a shallow water table site is a crucial precondition to better interpret the reaction of those sites during and after rainfall events. An important challenge in this respect is to distinguish ΔS under hydrostatic (i.e., equilibrium) conditions in the soil column from ΔS under dynamic soil moisture conditions affected by downward (recharge) fluxes or upward (evapotranspiration) fluxes in the unsaturated zone. Nachabe [31] refers in his conclusions to the fact that most of the estimated specific yields in the groundwater literature are based on the assumption of equilibrium conditions, while the actual initial water content in a profile is very likely to deviate from equilibrium. Estimating the specific yield, considering dynamic soil moisture conditions with upward or downward water fluxes, requires much more effort. Flow models based on the Richards equation are able to consider the dynamic conditions of the water storage of the unsaturated zone [34]. But they are elaborate to set up and need specific data for calibration and validation (soil moisture and water tension at different depths) which are often not available. Stochastic models are another option which better takes into account the dynamic behaviour of the water content in the unsaturated zone [35,36]. The relevance of the distinction between both storage parts at shallow water table sites was also descriptively shown by Acharya, et al. [37], Laio, et al. [38] and Nachabe, et al. [39]. They all demonstrated that a hydrostatic soil water model is not able to fully explain the WT dynamics and hence the water storage dynamics of a shallow water table site.
The main objective of this paper is to explain the responses of the water balance components to rainfall events at a shallow water table site. For the investigation, we used a weighable groundwater lysimeter that was able to measure ΔS directly while determining ETa as a residuum of the water budget equation. The behaviour of the water balance components was evaluated for selected rainfall events, analysing time windows from the start of the rainfall until the end of the runoff. A method was developed to separate ΔS into, on one hand, storage change due to a water table change under quasi-equilibrium conditions (ΔSeq) and, on the other, storage change related to the soil moisture changes in the partly depleted unsaturated zone (ΔSuz) under dynamic soil moisture conditions. Based on ΔSeq the runoff under the assumption of hydrostatic conditions (Req) was derived and compared to the measured runoff.
2. Materials and Methods
2.1. Study Site
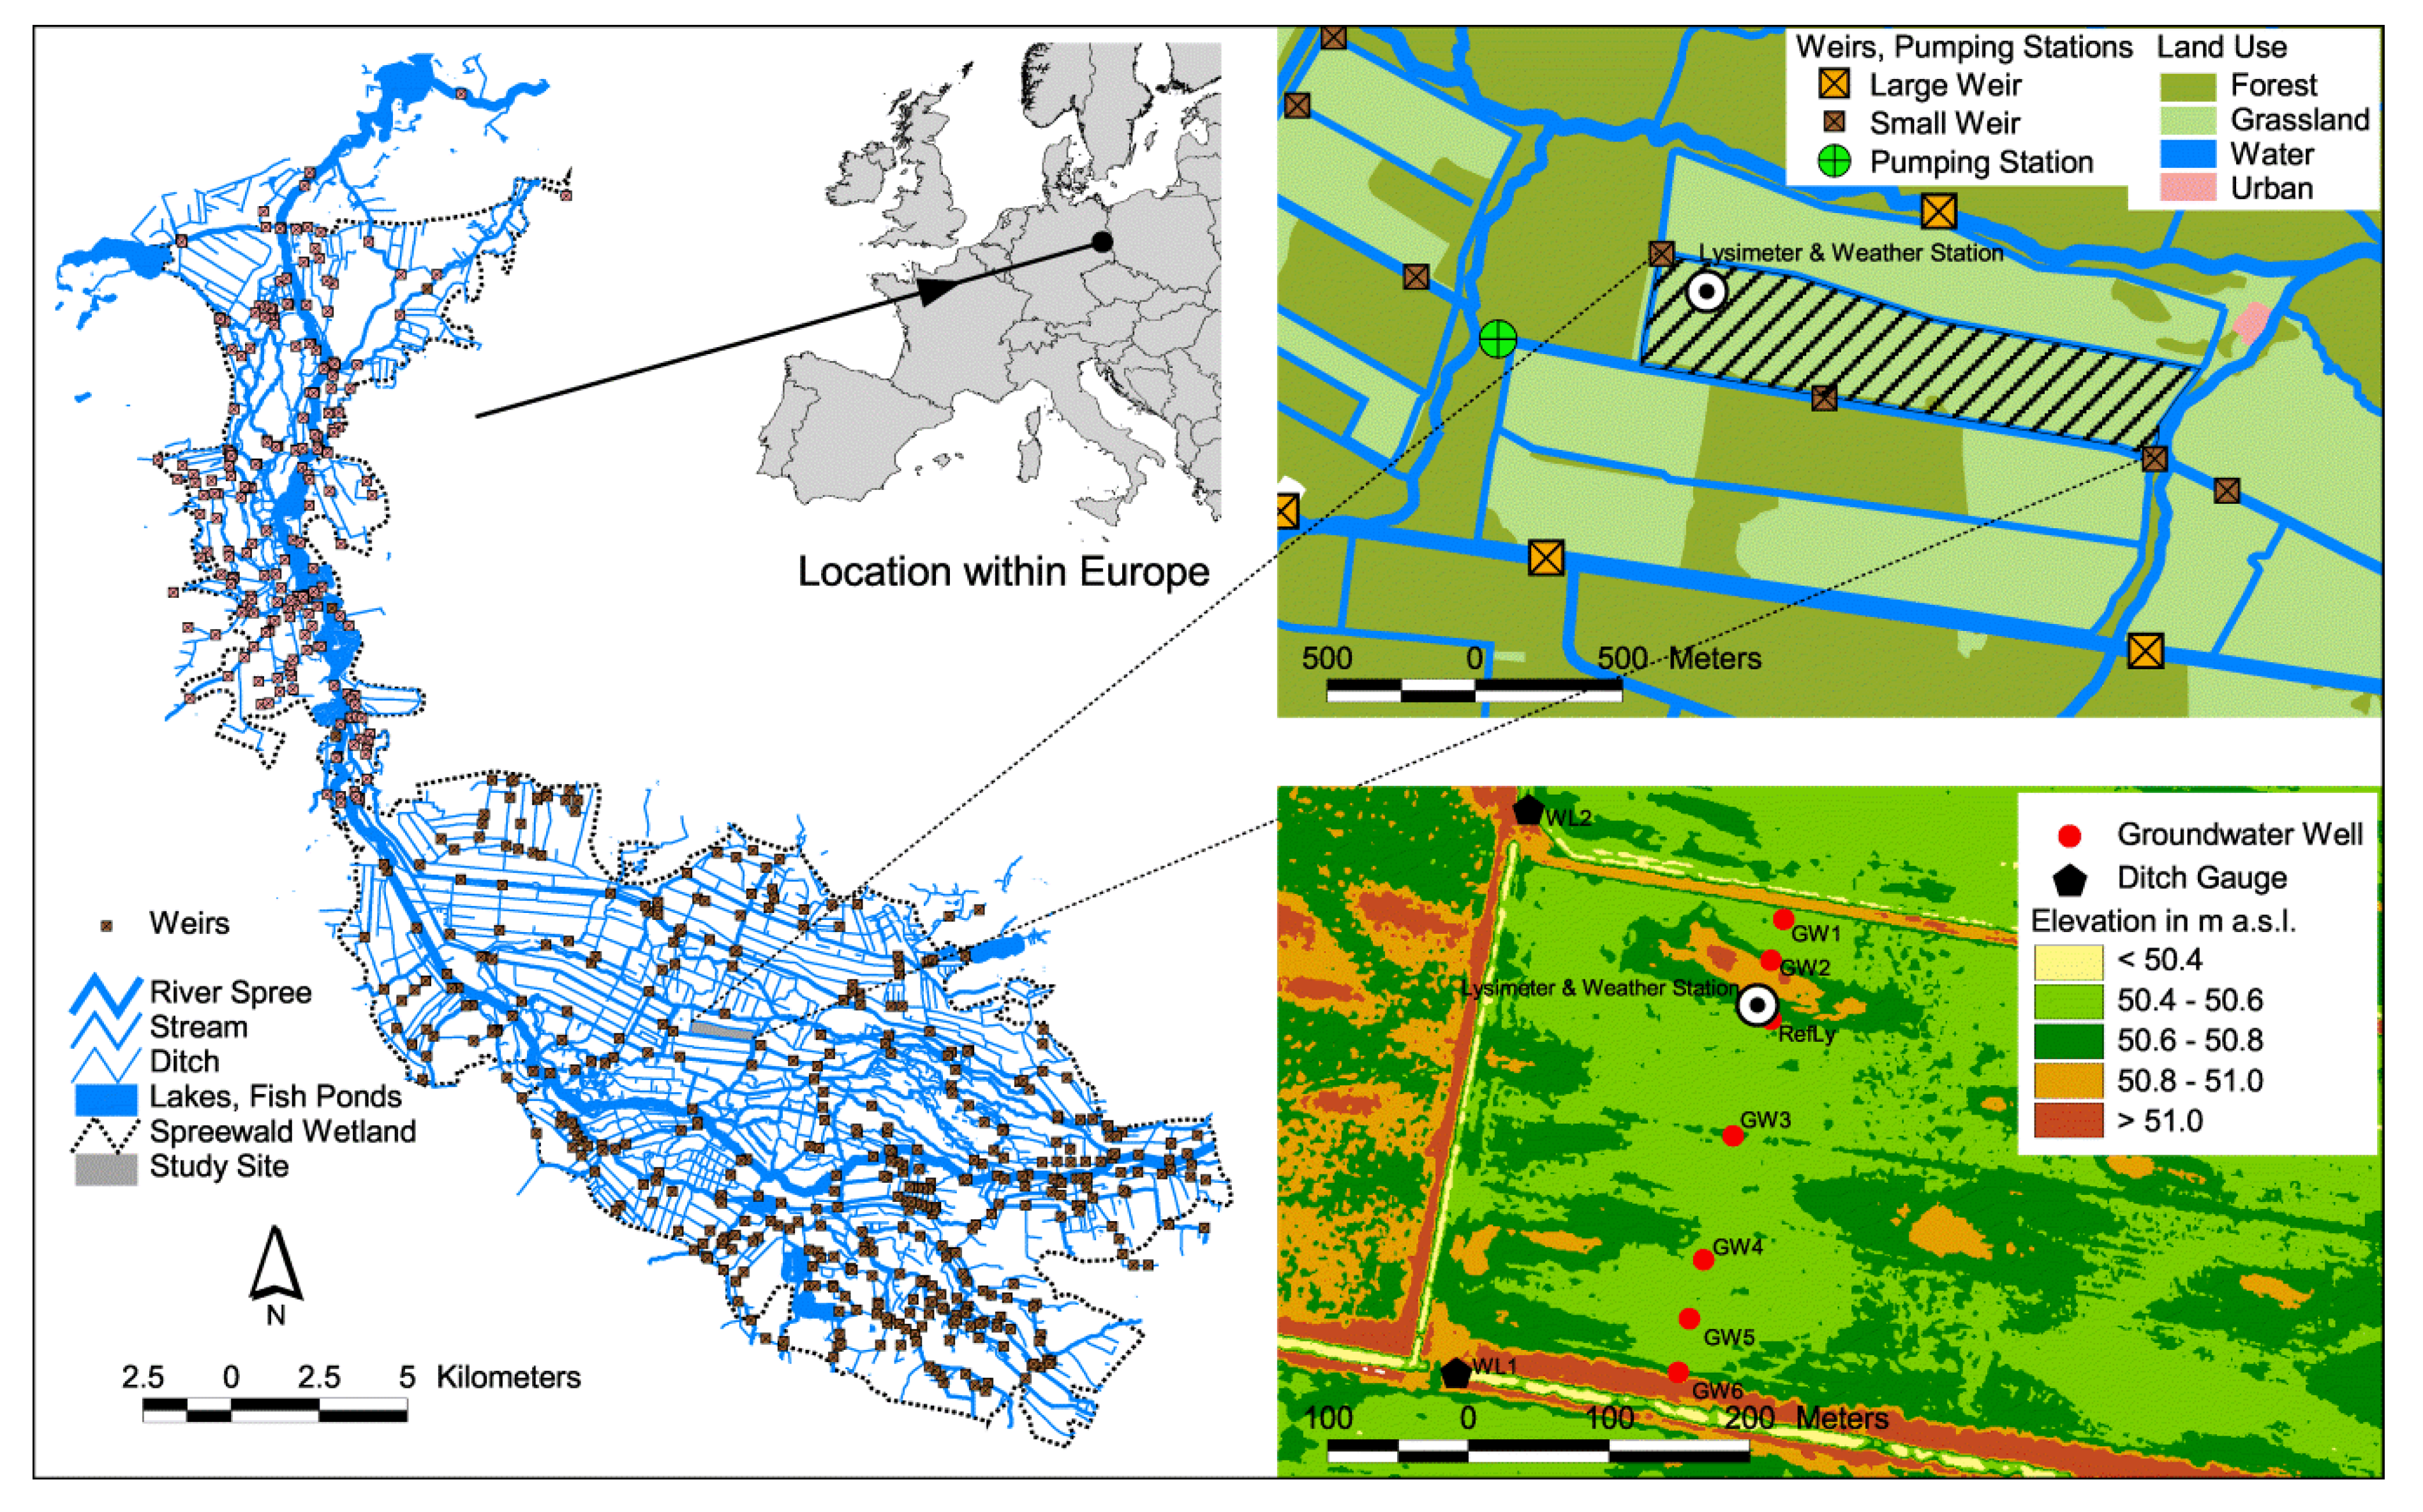
The study site is situated in the Spreewald, around 85 km south-east of Berlin, Germany (51°52’ N, 14°02’ E). The Spreewald is one of the major wetlands in Germany and covers an area of approximately 320 km². The wetland is located within the Spree River basin, whose upstream part has been affected by opencast lignite mining for many decades [40]. When the river Spree reaches the Spreewald wetland, it ramifies into a complex network of smaller streams and channels that reunite at the outlet of the wetland (Figure 1, left). Depending on the prevailing hydrological conditions and the water resource management strategies used, the river can drain the wetland or it can act as a water supplier [41]. Large weirs in the main streams control the water distribution within the wetland. Small weirs within the ditches control the water levels in the ditches and neighbouring wetland areas. In summer, in particular, the wetland areas are supplied with considerable amounts of water from the Spree river basin. The ditches only drain the wetland areas during especially wet periods, since the region is among the driest in Germany. Its long-term mean precipitation is around 585 mm year−1 and its mean annual FAO grass reference evapotranspiration is around 610 mm year−1 [42].
Rainfall events from 2010 to 2012 were used for our study. The first year was relatively wet (789 mm in 2010), while the following two years received average amounts of precipitation (578 mm in 2011 and 585 mm in 2012). During the study period, rainfall occurred on 479 days (227 days between November and April and 252 days between May and October). In most cases, daily quantities were less than 10 mm (208 November to April, 211 May to October). Days with more than 10 mm of precipitation occurred more than twice as often from May to October (41) as they did from November to April (19). All three years showed some notable peaks in the temporal distribution of the rainfall. Except for a very dry period in June 2010 (3 mm), the summer months received above-average rainfall amounts. The periods from July to September 2010 (494 mm), from July to September 2011 (319 mm) and June/July 2012 (214 mm) were exceptionally wet for this region.
Within the wetland, the study site is situated in the central part of the Upper Spreewald (Figure 1, top right). It is surrounded by ditches, whose water levels can be regulated by small weirs. The field comprises an area of nearly 65 hectares (350 m × 1850 m). The elevation ranges between 50.5 m and 51.0 m a.s.l. with a slight slope of around 0.03% from the east to the west (Figure 1, bottom right). There is no slope in the north-south direction. The soils of the study site are categorized as fens [43], but the peat layer is degraded and not very thick (30–50 cm). Below the degraded peat layer lies a gley horizon (30–120 cm) of fluvial loam including clayey and sandy portions followed by a gley horizon of fluvial sands. The top aquifer is about 20 m thick in this region. The groundwater basin of the Spreewald wetland is relatively small compared to the wetland size and the Spree River basin. The aquifer of the wetland is mostly supplied by water from larger streams and channels flowing through the wetland. The study site is used as grassland. The grass is cut in June, while afterwards, the field is used as a pasture for the remaining vegetation period. The WTs typically vary between 30 to 60 cm below the surface in the summer months, while inundations can occur during winter or during wet periods.
2.2. Measurement Equipment
The study site was equipped with a wide range of devices to monitor its water budget. A transect of seven wells of slotted PE-HD groundwater pipes (diameter of 5 cm) monitored the WTs between the two ditches (Figure 1). The WTs of three wells (GW2, GW3, GW6) were recorded at 60-minute intervals using pressure transducers and data loggers (Dipper-3, SEBA, Kempten, Germany). One well (GW-Ref) had a pressure transducer (PR-46X, Keller, Winterthur, Switzerland), which was connected to the data logger of the lysimeter station (DL-104, UGT, Müncheberg, Germany); this stored the WTs at 10-min intervals. The remaining three observation wells were read manually every two weeks. The water levels in the ditches located at the north and south ends of the site were measured every 60 min with pressure transducers and data loggers (Dipper-3, SEBA).
A UGT container lysimeter station was installed at the study site in autumn 2009. The station consisted of four monoliths, which were extracted at the place where the station is located now. The extraction procedure, which is described in Meissner, et al. [44], retained the original soil structure and vegetation. Hence, conditions were comparable to that of the surrounding area. The monoliths had an area of 1 m² and a height of 2 m, and were placed on weighing systems consisting of three loading cells (model 3510, Soemer, Lennestadt, Germany).
Each monolith was connected to a separate regulation reservoir. The water levels in the monolith and the reservoir were balanced since they acted as communicating vessels. The WT in the reservoir (and accordingly in the monolith) was regulated by pumping water from or to a well next to the container station. During the short pumping period, the reservoir and the monolith were automatically disconnected by a valve. Measurements of the changes in the reservoir water level (pressure transducers PR-46X, Keller, resolution 1 mm) enabled the calculation of the inflow (Rin) and outflow (Rout) to and from the monolith at hourly resolution. All data were logged at 10-minute intervals (data logger DL-104, UGT).
For our investigation, one of the four monoliths was used to simulate the WT of the surrounding field. For this purpose, the measured WT of the observation well, WT-Ref (Figure 1), was used as a reference value. The WTs of the well and the reservoir were checked every hour and whenever the difference was larger than ±5 mm, the WT in the reservoir was automatically adjusted. Applying this procedure, the WT measured at the site can be simulated in the lysimeter with high accuracy [45]. For a more detailed description of the lysimeter station refer to Dietrich, et al. [46].
A meteorological station measured the net radiation (CNR 4, Kipp & Zonen, Delft, Netherlands), soil heat flux (HFP01SC, Huxeflux, Delft, Netherlands), wind speed and direction (classic, Thies, Göttingen, Germany), air temperature and relative humidity 2 m above the surface (PC-ME, Galltec+mela, Bondorf, Germany) and precipitation 1 m above the surface (Hellmann RG 50, Thies). Meteorological data were logged at one-minute intervals.
2.3. Measurement of the Water Budget Components
Our basic assumption was that the lysimeter represented the water balance of the surrounding area. The lysimeter was directly installed in the shallow water table area where the monoliths had been extracted, which was done without disturbing the sample. Hence, the soil and vegetation characteristics were identical. Further, the WT in the lysimeter (WT-Ly) was adjusted to the value of the surrounding area (WT-Ref, Figure 2). Hydrological processes around and within the lysimeter should, therefore, be similar and the assumption valid.
The lysimeter measured all water budget components at hourly resolution. The storage change ΔS was determined from the mass change of the lysimeter. Since the lysimeters had a surface area of 1 m², a mass change of 1 kg corresponded to a storage change of 1 mm (or 1 l/m²). The inflow to the monolith (Rin), representing sub-irrigation, and the outflow of the monolith (Rout), representing subsurface drainage from the area to the ditches, were derived from water level changes in the regulation reservoir, multiplied by the reservoir’s area to get volume flows. Note that both Rin and Rout are always positive. Actual evapotranspiration (ETa) was not measured directly but calculated by applying the water balance equation of the lysimeter:
where P is the precipitation. In order to avoid measurement errors related to rain gauges, the precipitation amounts were estimated by the lysimeter using Equation (1), assuming that evapotranspiration can be neglected during the rainfall event. The installed rain gauge only served to determine the start and end time of the rainfall events. All measured raw data were stored in a database and underwent a quality analysis before being converted into hourly and daily values.
ETa = P − ΔS + Rin − Rout,
In addition to the components measured by the lysimeter, the potential evapotranspiration (ETp) was calculated based on the meteorological variables as the FAO grass reference evapotranspiration according to Allen, et al. [47].
2.4. Selection of Rainfall Events
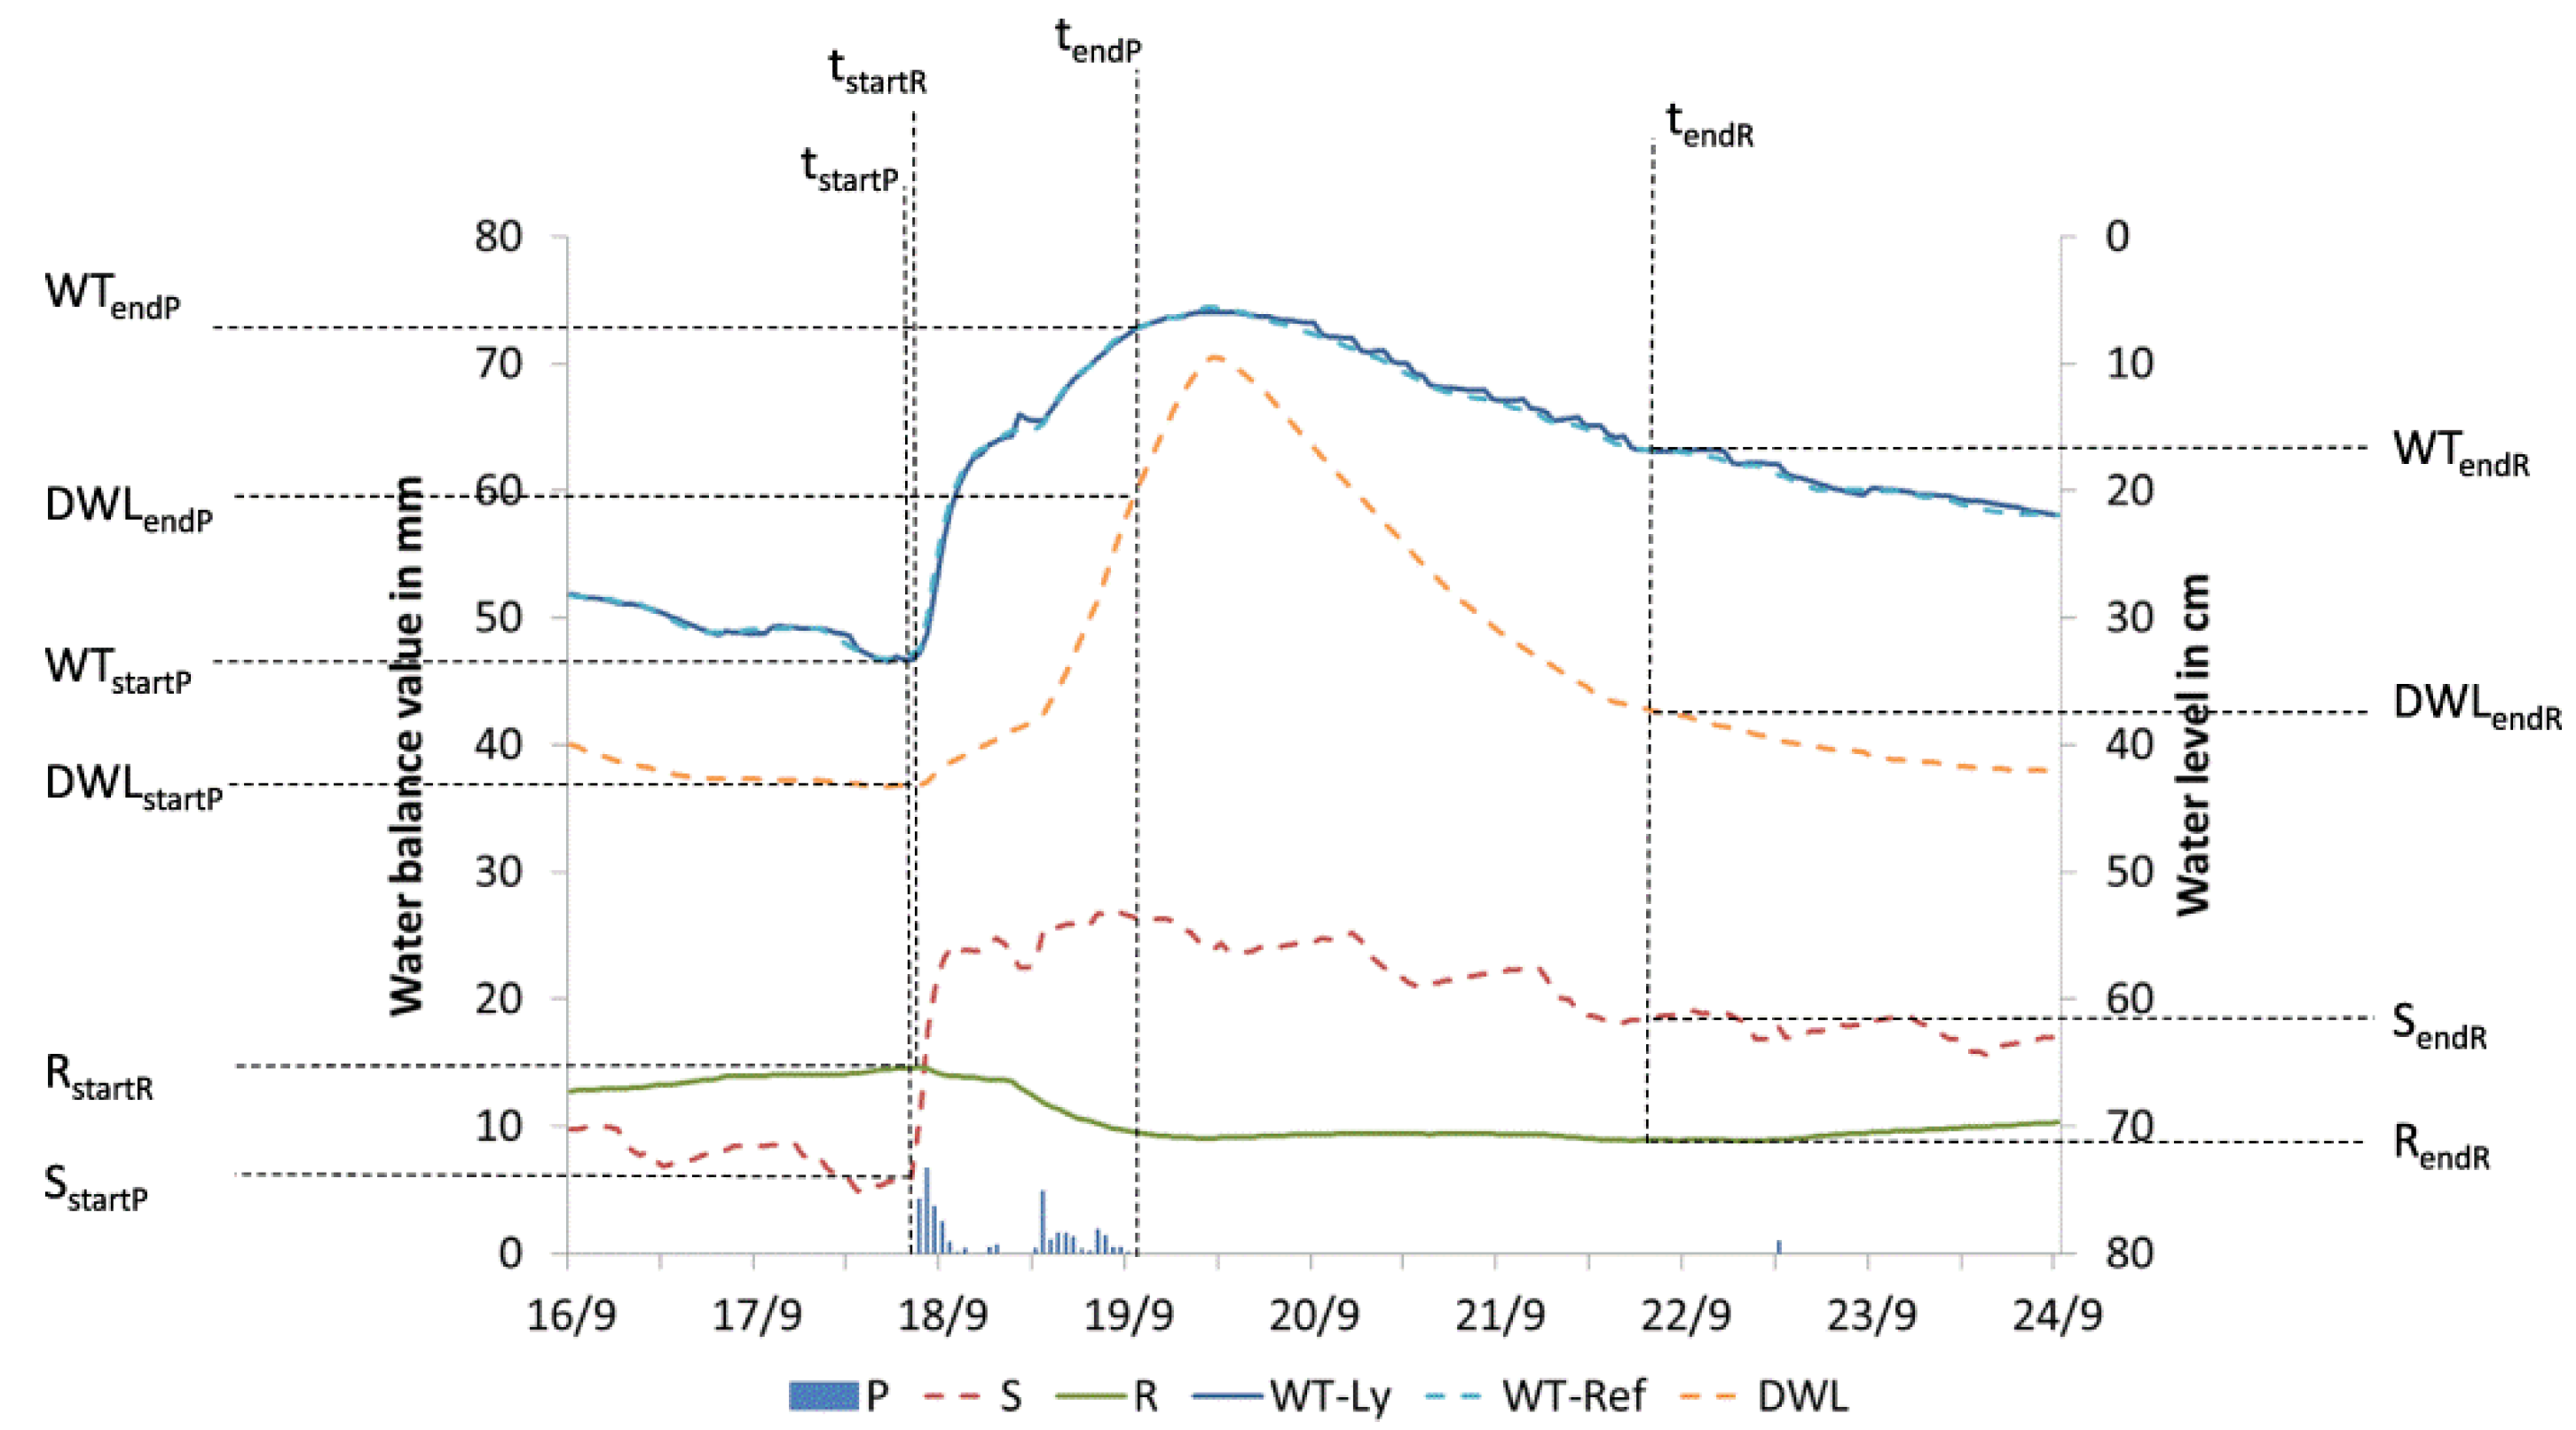
Since this study investigates the response of a shallow water table site to observed rainfall events, suitable events had to be selected. The following criteria had to be met: (1) sum of rainfall is greater than 10 mm; (2) no rainfall break longer than 6 h (hence, an event was considered to have ended when the rain stopped for more than six h); (3) reference water table has to be below the maximum technically feasible water level at the lysimeter station (3 cm below surface); (4) no periods with frozen soil or snowfall and (5) no lysimeter measurement errors. The start times (tstartP) and end times (tendP) of all rainfall events that met these criteria were determined (Figure 2). The start (tstartR) and the end (tendR) of the runoff process were derived from the cumulated runoff curve (R = Rin − Rout). The upper reversal point of the curve (RstartR, Figure 2) defined tstartR, while the lower reversal point marked the end of the runoff process (RendR). Afterwards, a no-outflow condition prevailed. When drainage conditions already occurred at the start of the rainfall event, tstartR was set to tstartP.
All hydrological and meteorological variables for the respective events were determined for the duration Δttot from tstartP to tendR. Rainfall occurring after the selected event (i.e., between tendP and tendR) was also considered, as otherwise water balance errors would have been caused.
Runoff for the selected rainfall event was calculated as
Rout = RstartR − RendR.
Yet in the case of sub-irrigation conditions prevailing at the beginning of the precipitation event, an inflow (Rin) to the lysimeter might have occurred between tstartP and tstartR:
where RstartP is the value of the cumulated runoff curve at the beginning of the rainfall event. The total runoff Rtot attributed to a rainfall event was then
Rin = RstartR − RstartP,
Rtot = RstartP − RendR = Rout − Rin,
Note that in some cases the inflow was higher than the outflow and Rtot negative, e.g., when the rainfall did not cause any runoff at all (i.e., tendP = tstartR = tendR).
2.5. Water Storage Separation
Based on the lysimeter measurements we developed an approach to divide the measured water storage change (ΔS) of each rainfall event into two water storage change components. The first component results from the WT change under the assumption of quasi-equilibrium conditions (ΔSeq) and the second component is attributable to the filling of the depleted unsaturated zone (ΔSuz) without a WT change having occurred. This is in accordance with the modelling study of Shah and Ross [48] who divided storage change into two components: a component causing WT change and a component not causing WT change, termed ‘change in free vadose zone storage’ and being equivalent to ΔSuz.
Our central idea was to derive a water storage curve that relates WT and lysimeter mass under soil water conditions close to equilibrium. Using this curve, ΔSeq can be estimated for a given WT change as the change in lysimeter mass equates to the change in water stored in the lysimeter. Subsequently, ΔSuz can be calculated as the difference between ΔS and ΔSeq.
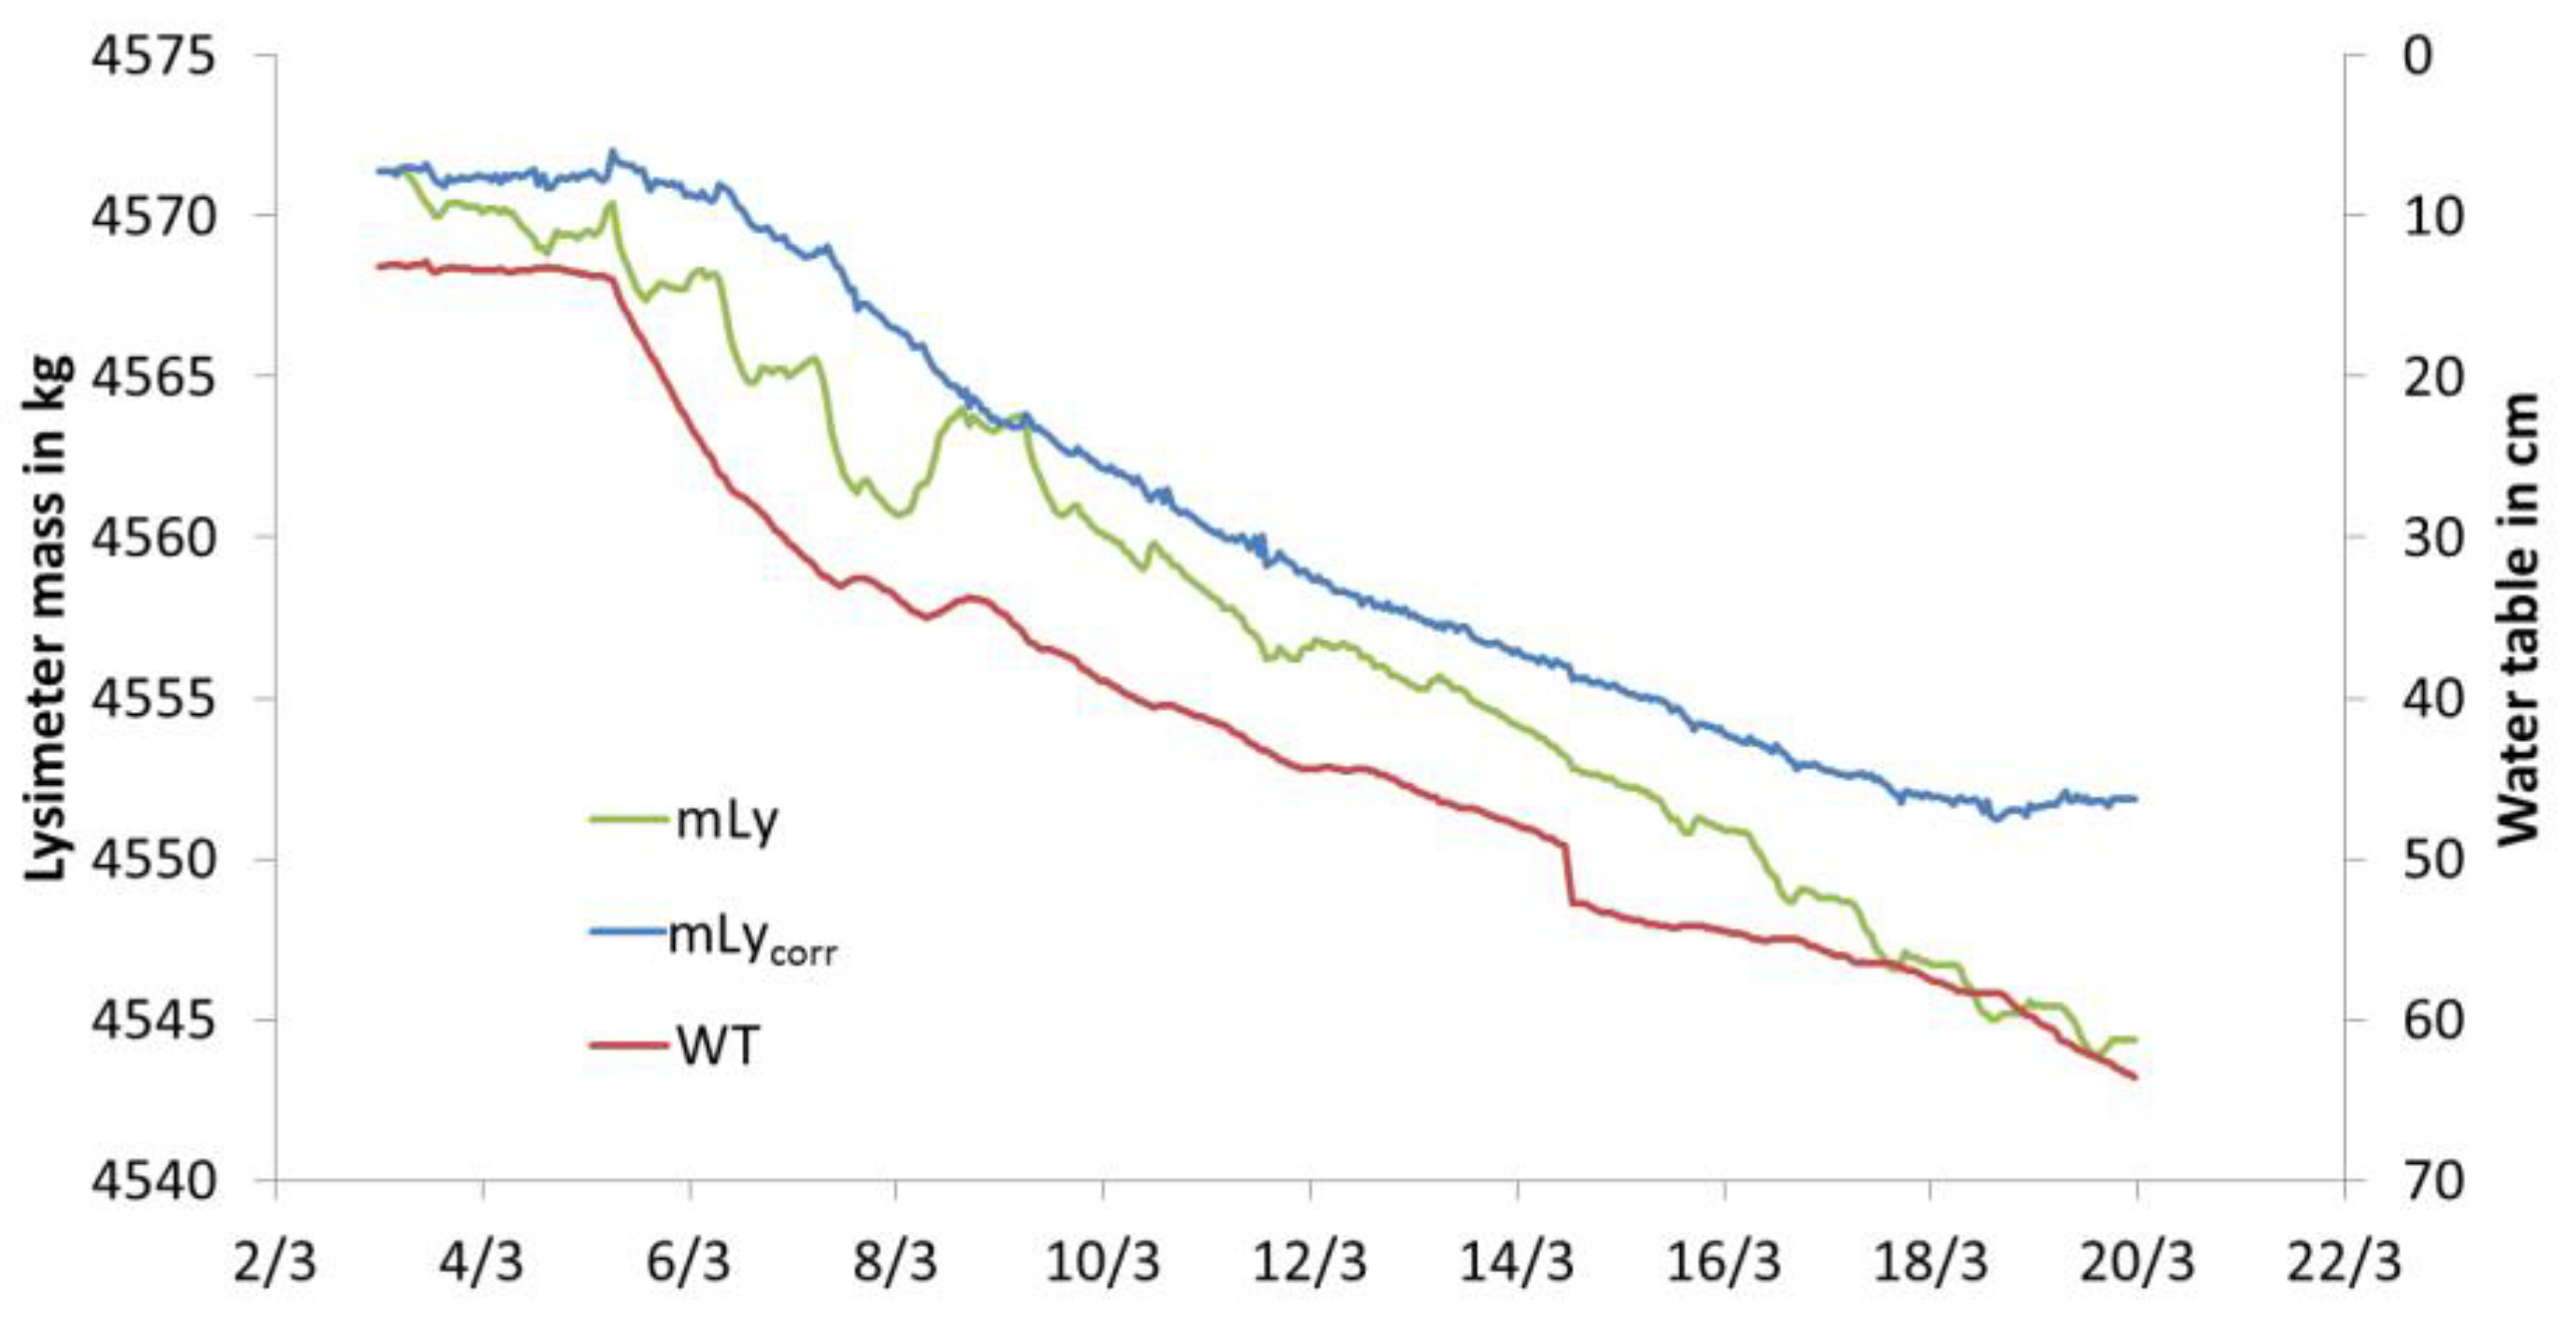
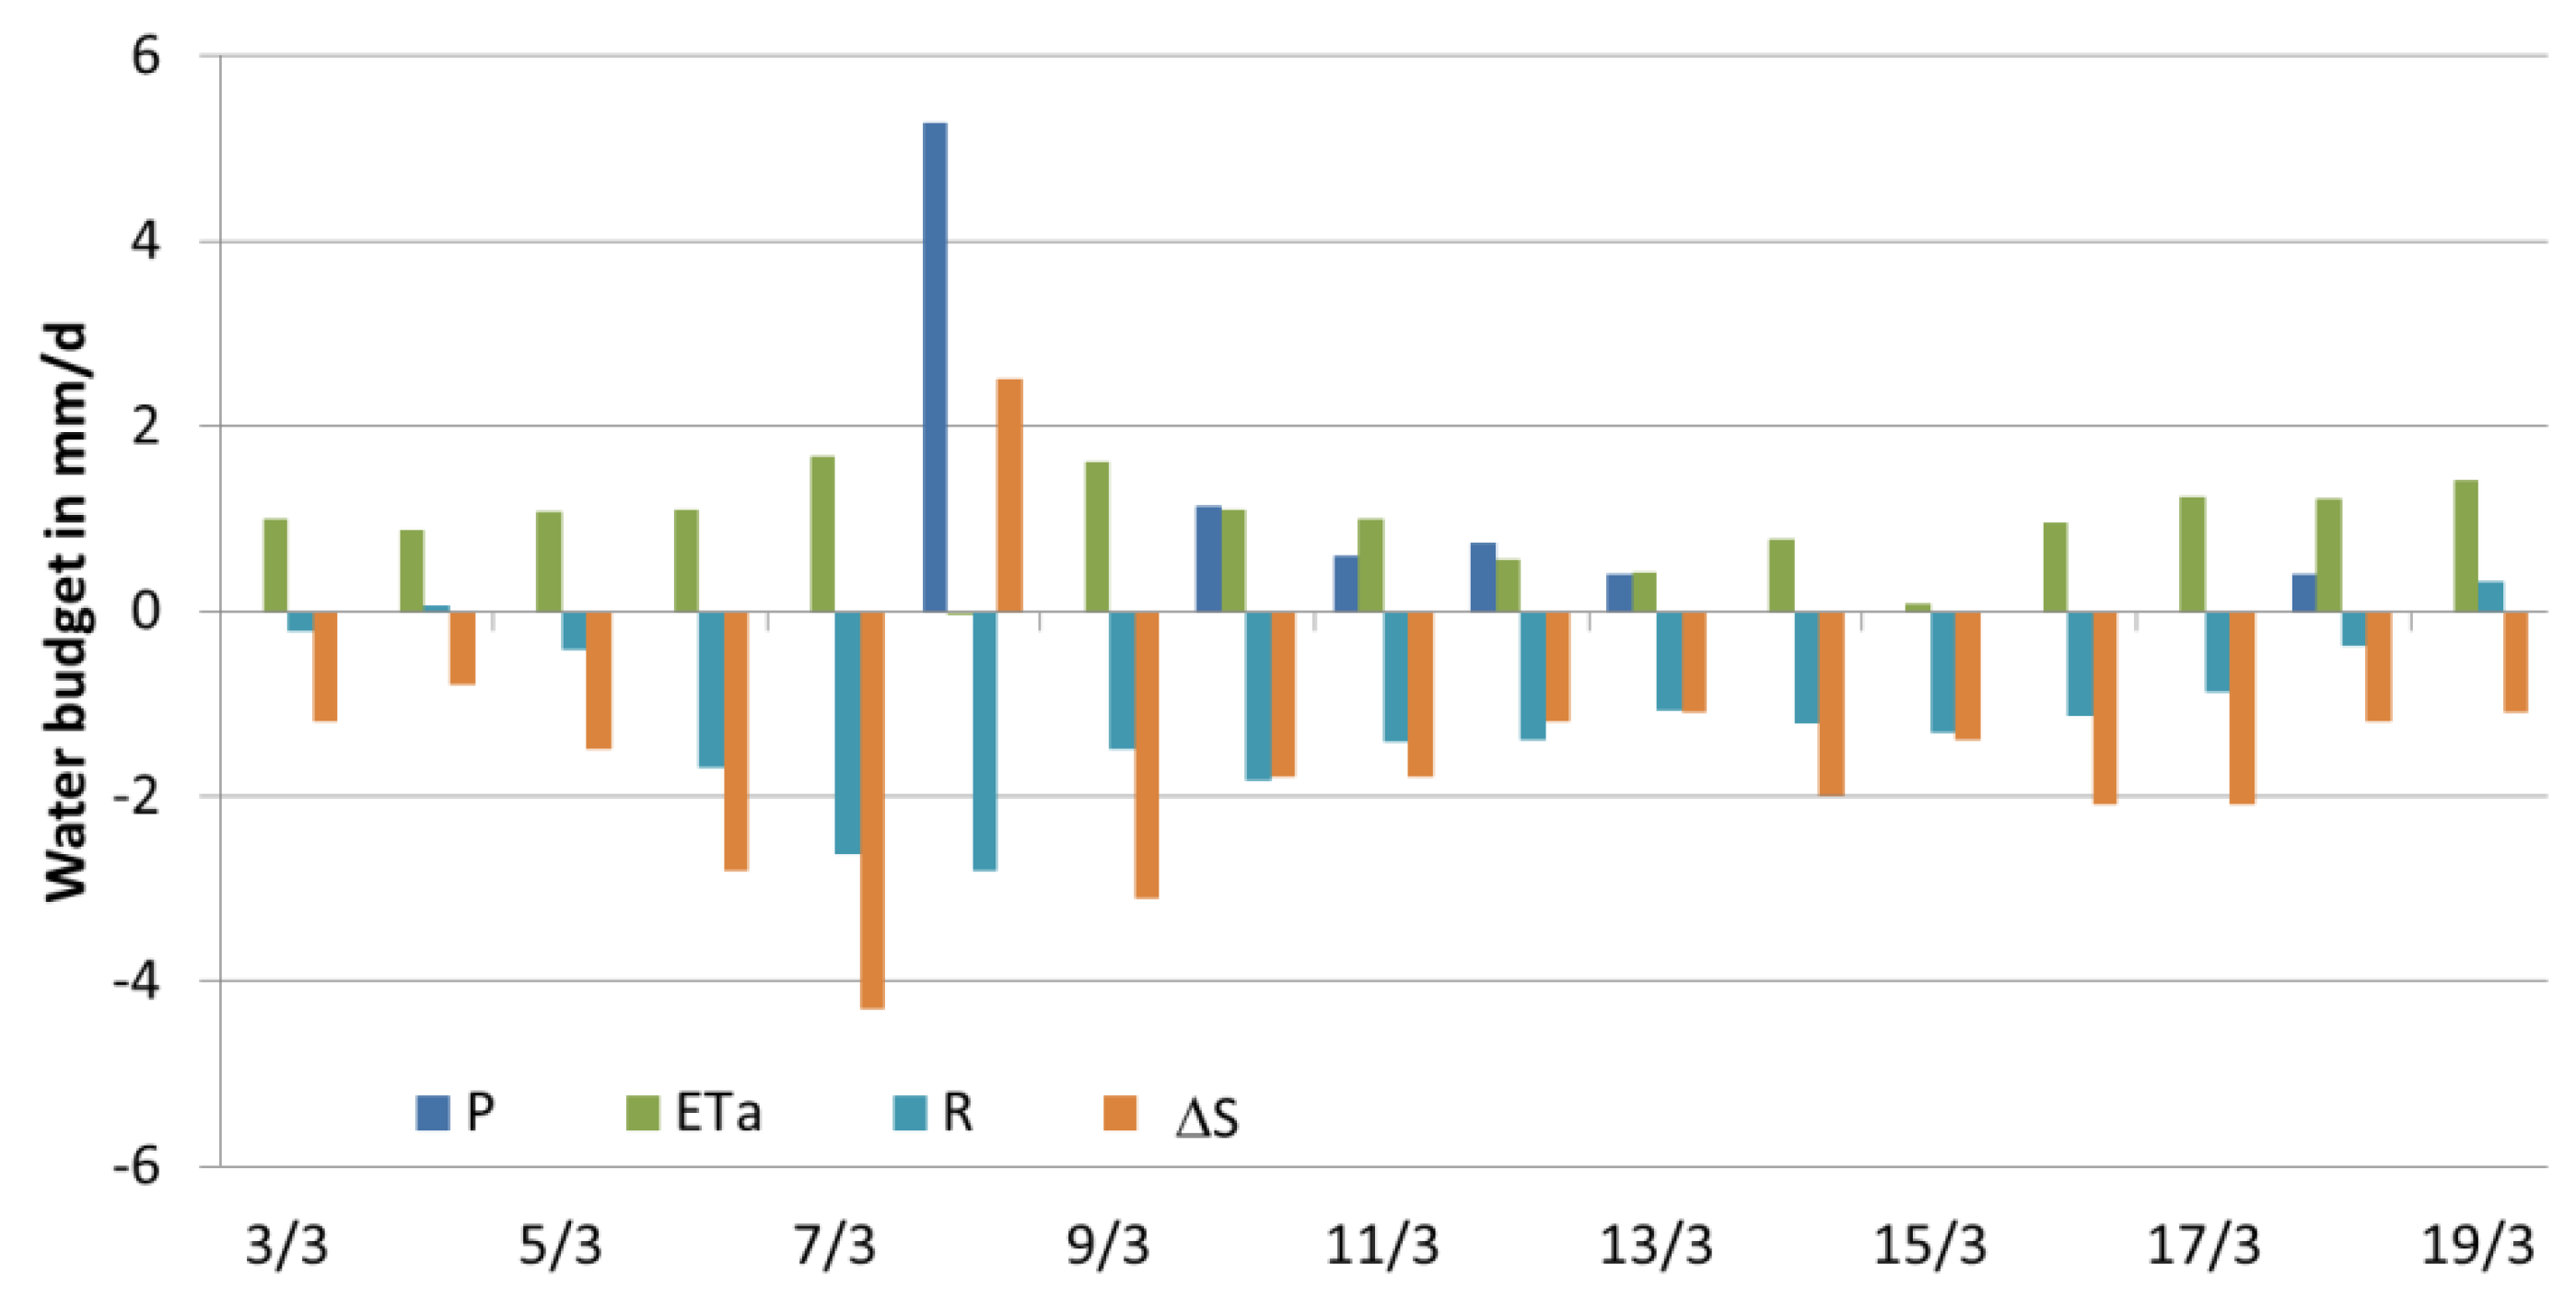
The water storage curve was derived during drainage conditions, as we investigated the hydrological reaction to rainfall events, and based on a 17-days-period of continuous water level decline during March 2012. The period started from persistently high water levels (around 10 cm below surface) (Figure A1, Appendix A) and therefore saturated soil water conditions in the lysimeter. Between 3rd and 19th of March a drop of the WT from 13 cm down to 64 cm below surface was recorded. The rate of WT lowering (51 cm WT decline within 408 h, i.e., 10 cm every 80 h) was slow enough to allow for a sufficient drainage of the soil profile in the vadose zone. During the period small amounts of precipitation (7.8 mm in sum) and evapotranspiration (12.8 mm in sum) occurred (Figure A2, Appendix A). To only account for mass changes created by the drainage outflow, we corrected the lysimeter mass measurements by subtracting the hourly values of P and adding the hourly values of ETa. At the start and the end of the used period, the resulting corrected lysimeter mass (mLycorr) did not change (Figure A1) and drainage outflow ceased (Figure A2).
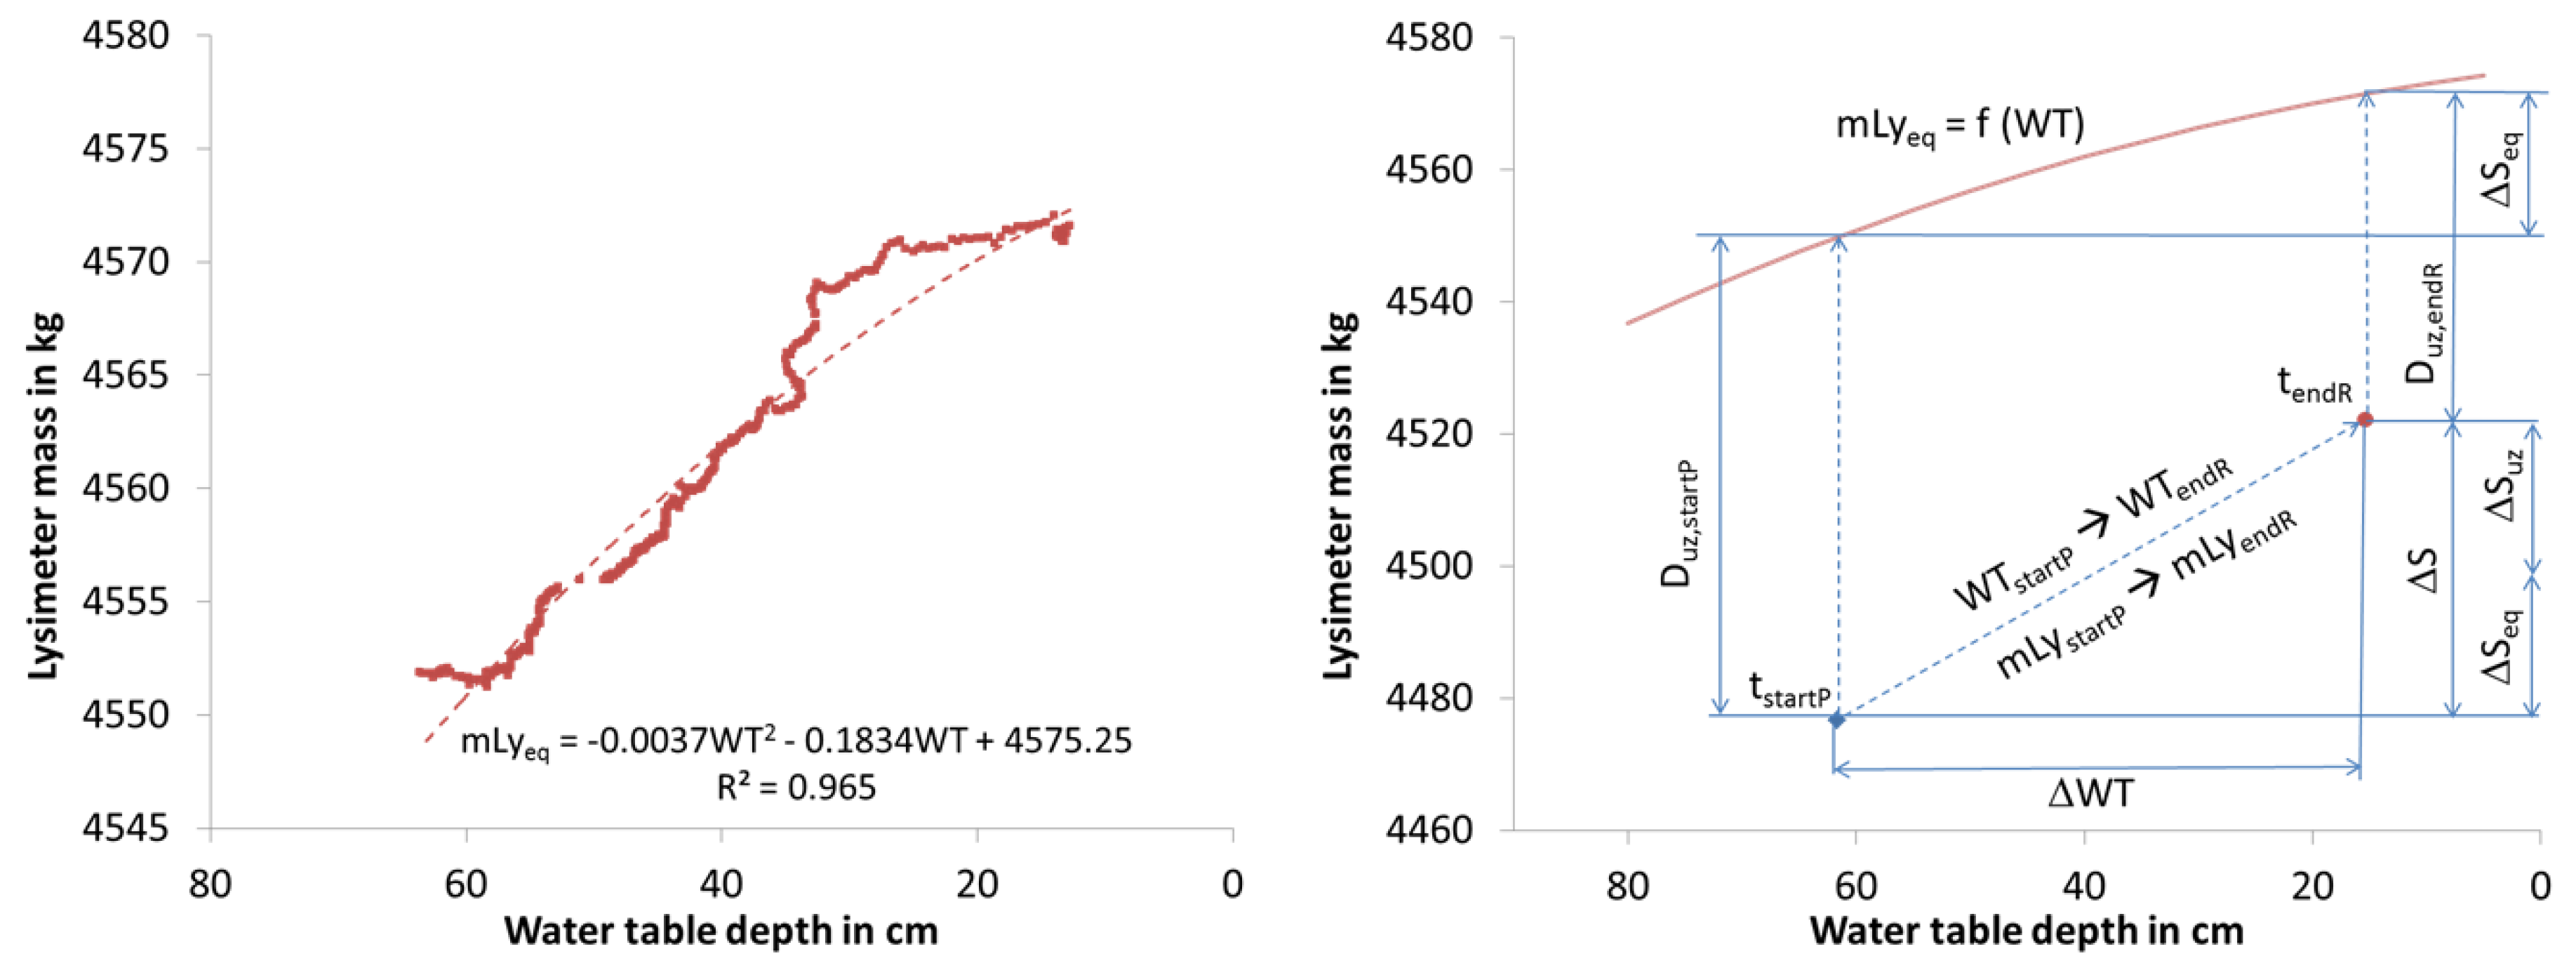
Given the slow drawdown and the limited extent of P and ETa, which were explicitly considered by using mLycorr, we assumed that during the selected period in March 2012 soil water conditions in the lysimeter were close to equilibrium and storage change was entirely attributable to WT change (ΔS = ΔSeq). A polynomial function fitted to the hourly data of mLycorr and the corresponding WTs, therefore, served as approximation of the drainage water storage curve under quasi-equilibrium conditions (Figure 3, left):
where WT is the water table depth in cm and mLyeq (in kg) is the mass of the lysimeter under quasi-equilibrium conditions. Note that we use the term “quasi-equilibrium” since equilibrium conditions may only be reached after a redistribution period of days without any flux.
The example in Figure 3 (right) shows that the absolute mass of the soil monolith at the start and end of the runoff process can be far below the mass observed under quasi-equilibrium conditions (mLyeq), indicating that the unsaturated zone is depleted. Soil moisture depletion in the unsaturated zone typically results from depletion by ETa in the time before the rainfall. If the rainfall amount is not sufficient to completely refill the unsaturated zone or the time is not sufficient to redistribute the soil moisture, soil moisture depletion can even prevail after the runoff has ceased (as shown in Figure 3, right).
Assuming that quasi-equilibrium conditions would have prevailed, the amount of water that could have been stored due to the increase of WT between tstartP and tendR can be calculated by the difference in mLyeq for WTendR and WTstartP. The result is the water storage change under quasi-equilibrium conditions ΔSeq:
The total storage change (ΔS) between the start of the rainfall and the end of the runoff process is derived from the values of the lysimeter’s cumulated storage curve (Figure 2) as
The rainfall stored in the unsaturated zone by refilling the depleted zone is then the remaining part of the storage change [48]:
In other words, ΔSuz is the replenishment of the soil moisture due to the rainfall which does not result in a WT change.
The soil moisture depletion of the unsaturated zone Duz at the start and end of the rainfall event was calculated as the difference in the lysimeter mass under actual and quasi-equilibrium conditions at tstartP and tendR, respectively.
2.6. Runoff Estimation under the Assumption of Quasi-Equilibrium Soil Moisture Conditions
In many paired field studies, ETa is calculated as a residuum of the water budget [17,25,33]. Precipitation and runoff are measured; the storage change is estimated based on soil analyses or soil moisture measurements and the assumption of equilibrium conditions. We invert the approach and estimate the effect of the assumed equilibrium conditions by comparing the runoff estimate under assumed quasi-equilibrium conditions (Req) against the runoff measured under dynamic soil moisture conditions (Rtot).
Based on measured values of P and ETa as well as the estimated ΔSeq, Req results as a residuum of the water budget:
The error resulting from assuming quasi-equilibrium soil moisture conditions in the unsaturated zone follows as the difference between the measured Rtot and calculated Req
3. Results
3.1. Selected Rainfall Events and Boundary Conditions
Between the beginning of May 2010 and the end of November 2012, a total of 29 rainfall events were selected in accordance with our criteria (raw data see Supplementary Materials). All events fell within the months from April to October. The magnitude of the largest event was 51 mm, the selected events had durations between 1 and 64 h and the highest hourly intensity recorded was 41 mm h−1.
Two conditions can be distinguished with respect to the relationship between the WT and DWL: drainage and sub-irrigation. Drainage occurs when WTs exceed DWLs (as in Figure 2) and groundwater flows from the field to the ditches. No overland flow occurred since the ditch bank’s elevation was higher than the elevation of the area (Figure 1, bottom right and Figure 4). So, drainage water always flows slowly through the soil and the aquifer to the ditch. In contrast, sub-irrigation takes place when the DWLs are higher than the WTs and the ditches provide water for the adjacent area. Here the water flows in the opposite direction from the ditch to the aquifer.
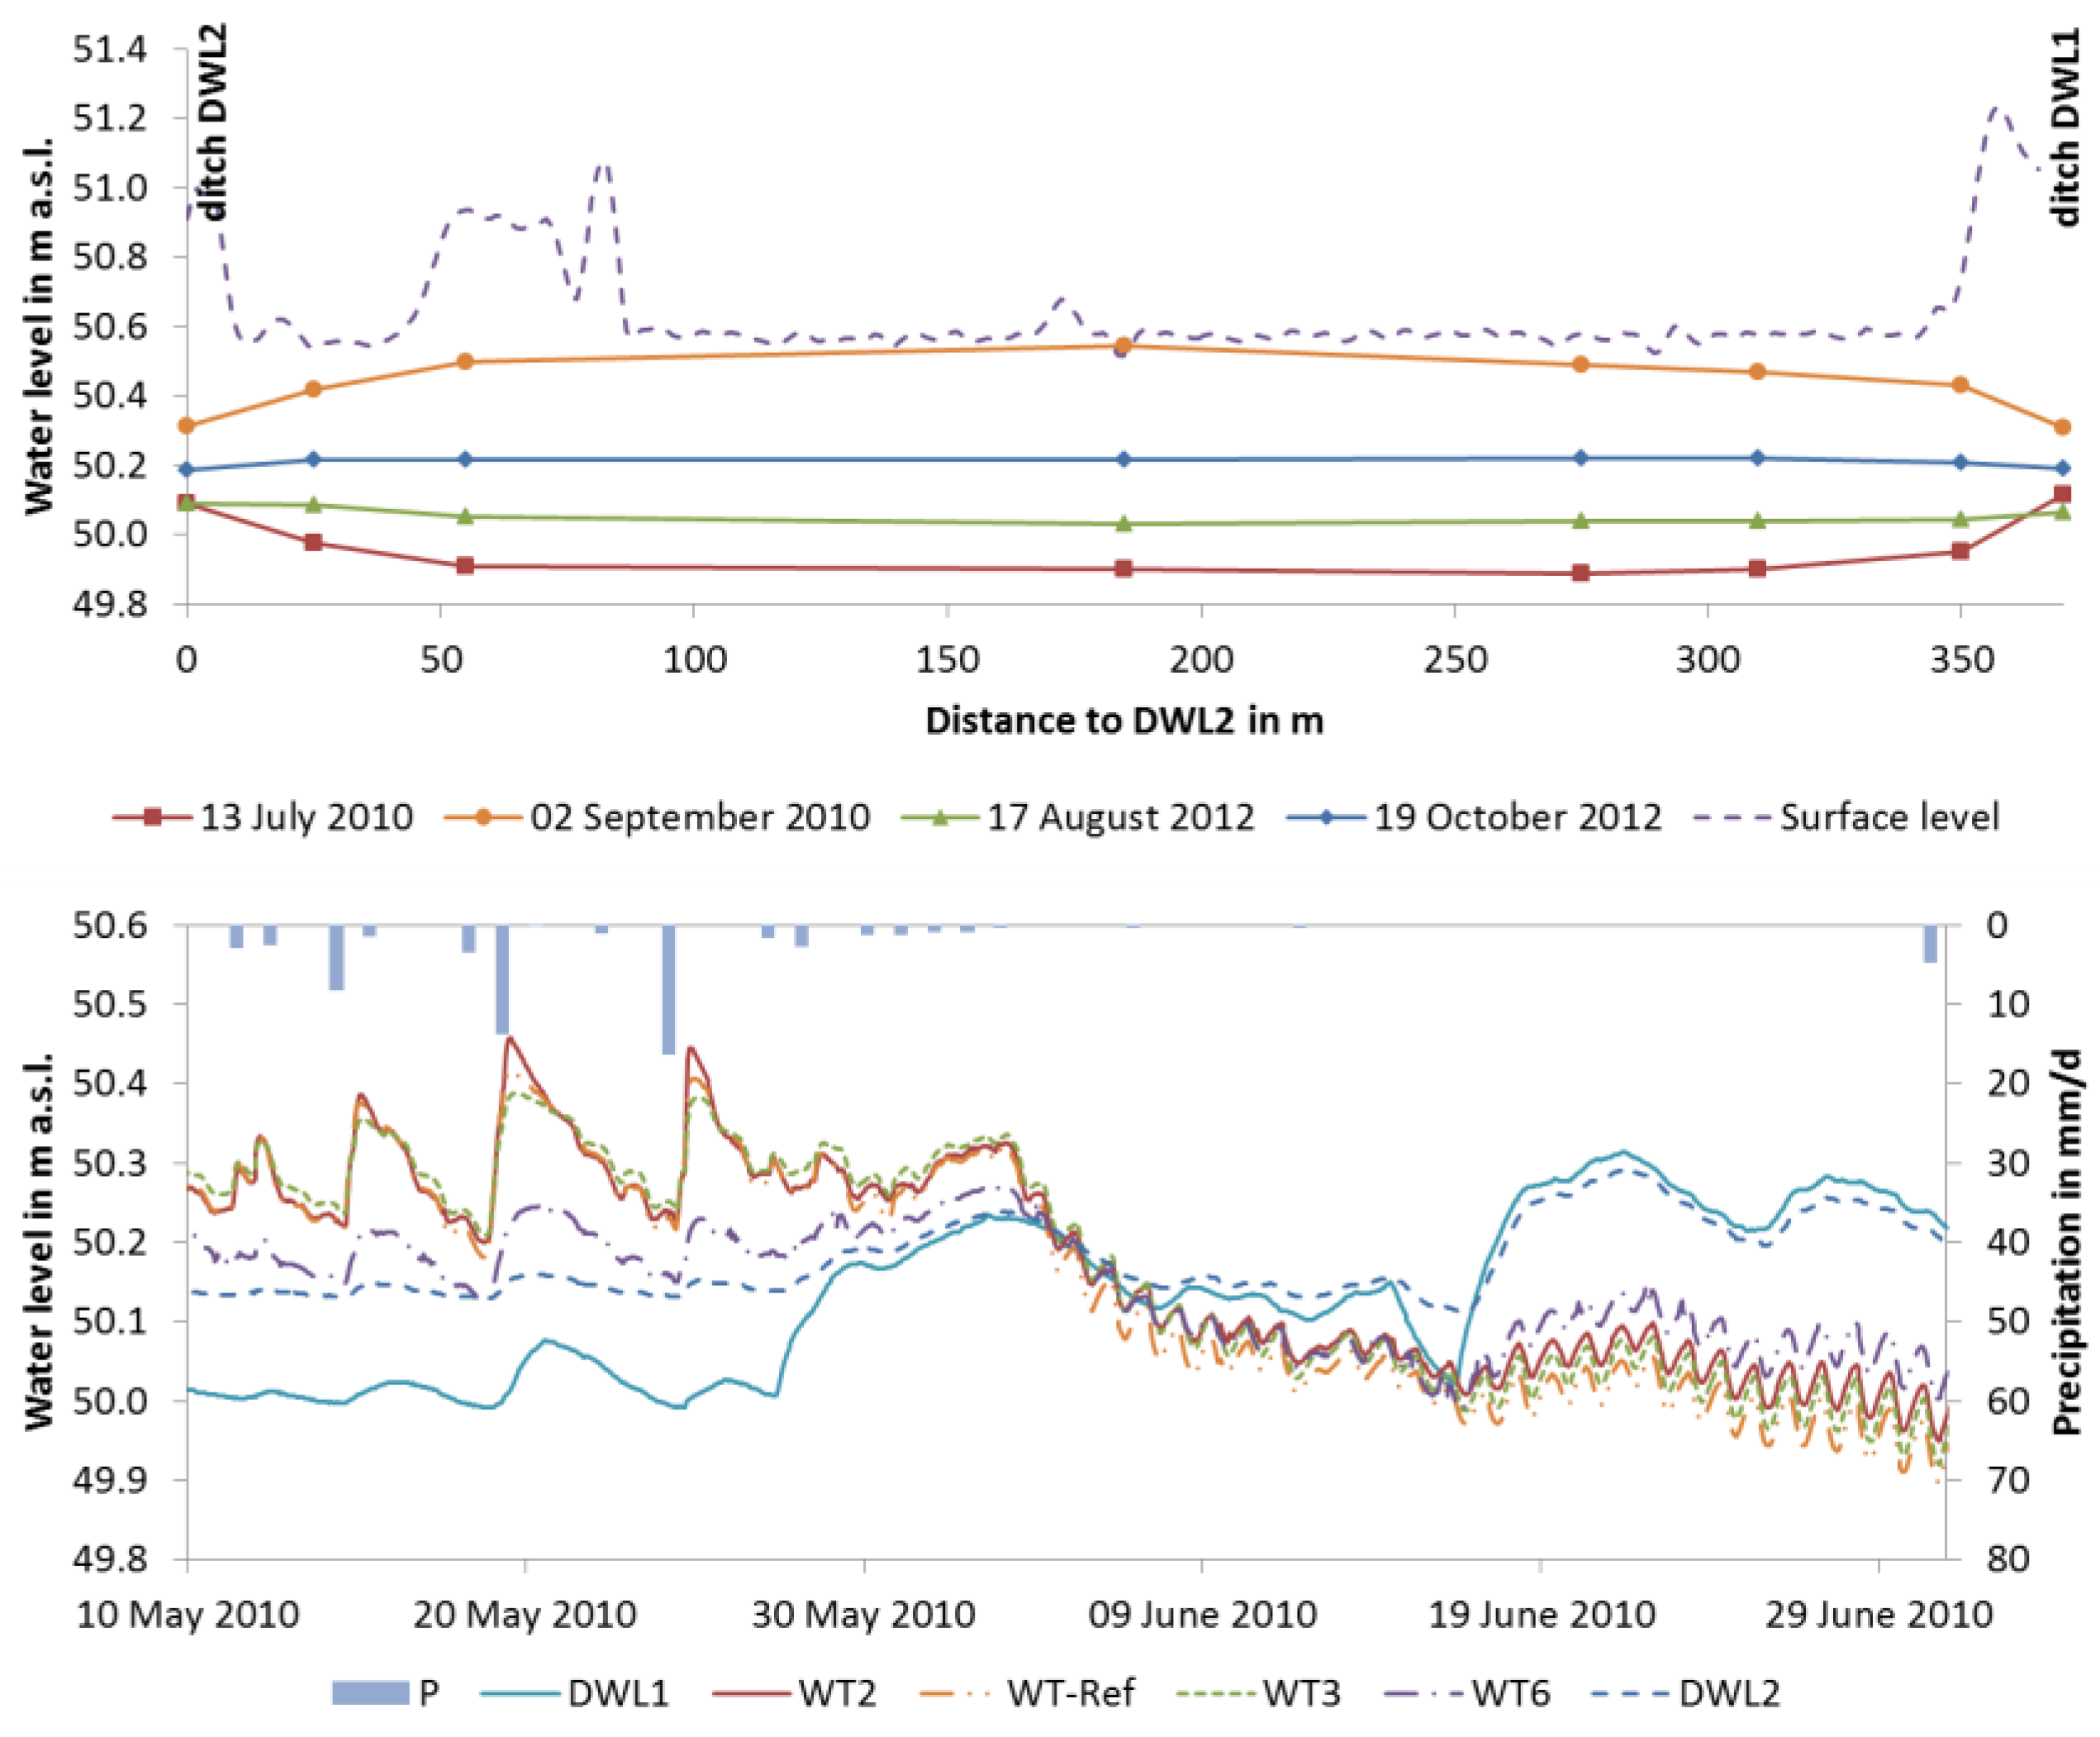
Examples of both situations are shown in the upper part of Figure 4, presenting WTs measured at the groundwater transect. Only small gradients between WTs and DWLs were present on 17 August 2012 and 19 October 2012. Differences of about 20 cm between the field centre and ditch were observed on 13 July 2010 in a dry period (sub-irrigation) and on 2 September 2010 after a wet period (drainage). Nevertheless, the shallow phreatic surface was relatively flat, and a pronounced slope was only discernible in the vicinity of the ditches.
The change from wet to dry conditions and thus from drainage to sub-irrigation can be seen in Figure 4 (bottom) for the period from May to June 2010. On 16 June 2010, the water inflow to the ditch system and hence the ditch water level was increased to extend the water supply to the shallow water table site and to decelerate the rate of WT recession. The WTs also rose after rainfall events and showed diurnal fluctuations on dry days. Groundwater levels in the monitored wells all behaved similarly. Hence, the observation well in the centre of the field (WT-Ref) was able to represent the characteristics of the whole study site and was used as a reference for the lysimeter.
The WT of the lysimeter mimicked the reference WT almost perfectly, which is a key precondition to ensure that the lysimeter correctly represents the water balance [46]. During most of the vegetation period, the area of the study site received an inflow (R > 0). Subsurface drainage (here R < 0) occurred only after some rainfall events, when WTs had already been high.
All data and the SQL-Code of the analyses are available in [49].
3.2. Hydrological Response to the Selected Rainfall Events
The hydrological reactions to the rainfall events were diverse and depended on the actual status of the wetland and multiple influencing variables. On average, WTs rose about 21 cm due to P (ΔWTmaxWT = WTmax − WTstartP) but fell 6 cm from reaching the maximum WT until the end of the drainage process. The same behaviour was noticed for DWLs, though the magnitudes of the rise (11 cm) and subsequent fall (4 cm) were lower. Hence, hydraulic conditions often reversed from sub-irrigation to drainage during the rainfall event. Out of the 15 cases where sub-irrigation was registered at the beginning of the rainfall event (∆WTDWLstartP < 0), sub-irrigation still prevailed in only three events at the time of the maximum WT.
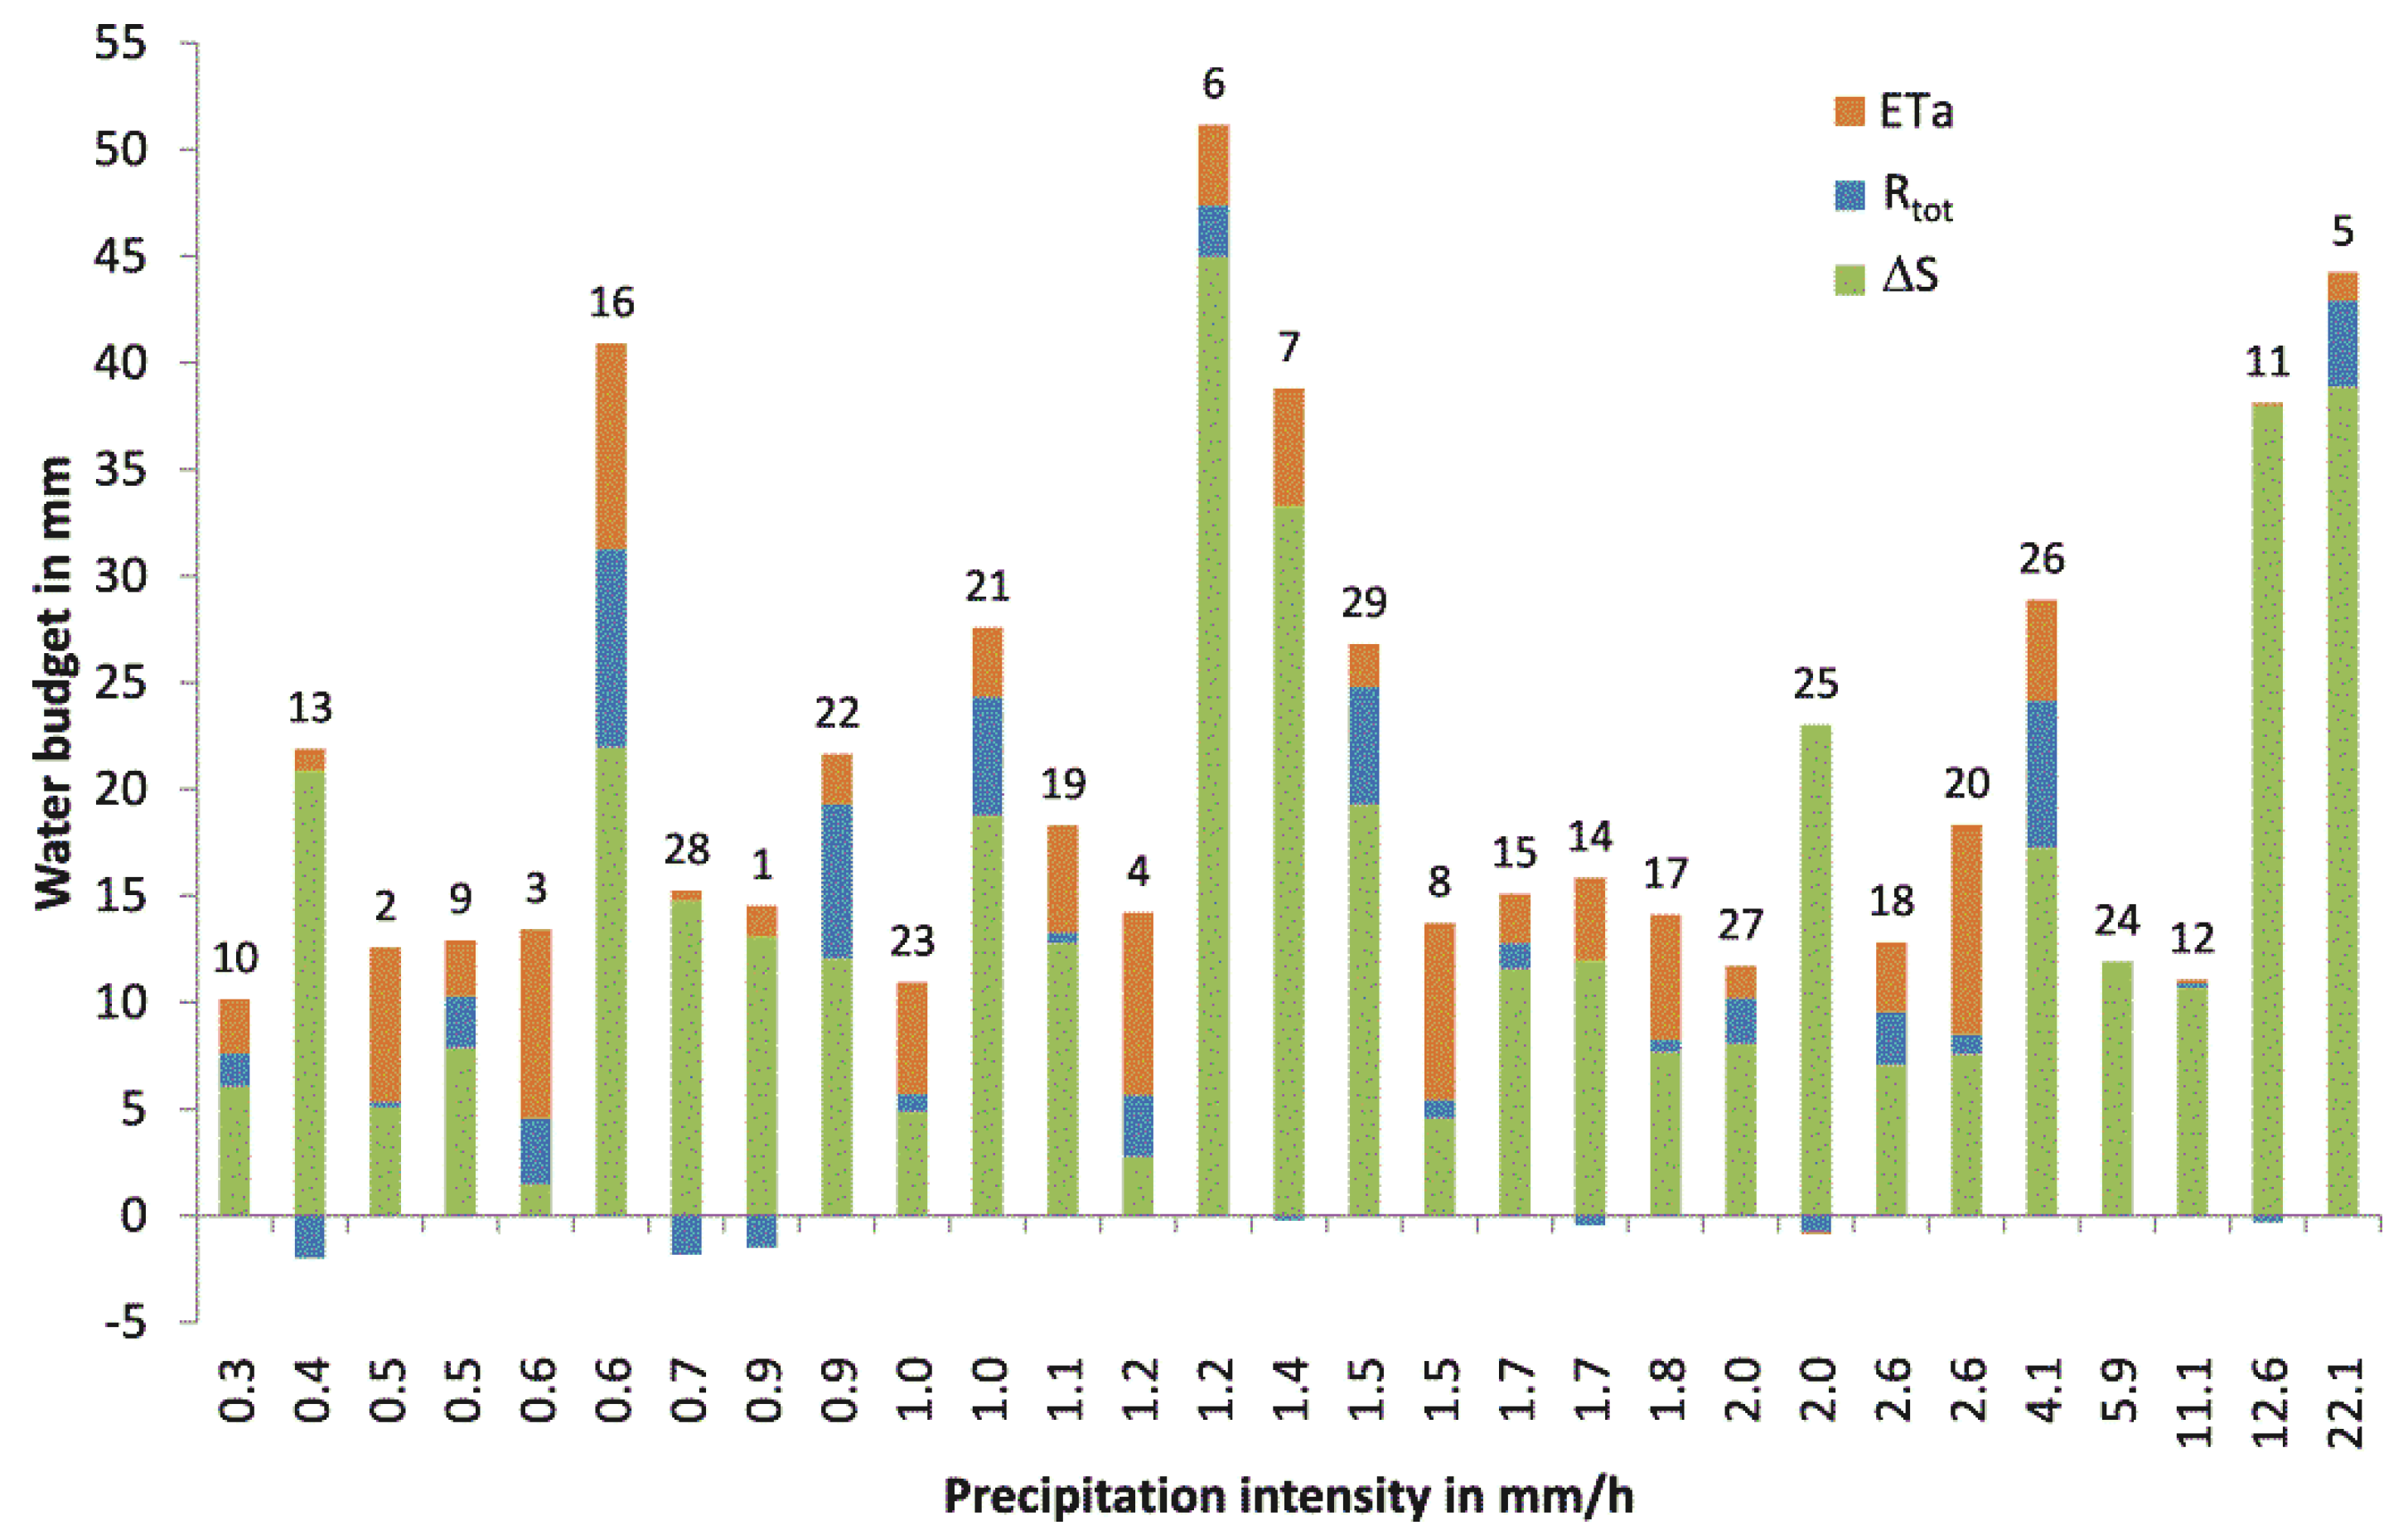
Like the rainfall events, the corresponding runoff processes also differed to a great extent in their magnitude and duration. Sometimes no Rout was generated, another time it only ceased after 152 h. Moreover, the partitioning of P into the water budget components was unique for every event (Figure 5). Sometimes ΔS was predominant, especially when the rainfall followed a dry period, as in the summer of 2010 (events 5 to 7) or the early summer of 2011 (events 11 to 13). In contrast, during wet periods a larger share was converted into Rtot (e.g., events 16, 21 and 22) while most of the rainfall was nevertheless stored. In other cases, ETa dissipated most of the rainfall (e.g., events 3 and 4). Yet Figure 5 suggests that neither the amount of P nor its mean intensity had a decisive impact on the partitioning into the water budget components.
For some rainfall events or certain periods of those events, P was not the only means of providing water for distribution to other water balance components. For example, in 15 cases (52%) sub-irrigation was observed at the beginning of the rainfall and Rin was measured during parts of the rainfall. In most cases, Rin switched to Rout at some stage of the rainfall event.
During the rainfall events, nearly all the water was initially stored in the soil profile as the runoff process started with a time delay. For 14 events, Rtot was lower than 5% of P and in 8 cases Rin even exceeded Rout. Only during wet periods did runoff already start during the rainfall, but Rtot never surpassed 33% of the rainfall.
On average, more than two thirds of the rainfall water was stored during the period from the start of the rainfall to the end of the runoff process, while more than one fifth was either transpired or evaporated and just less than one tenth was Rtot (Table 1). Still, this partitioning differed strongly depending on the hydrological boundary conditions. When drainage conditions prevailed at the beginning of the rainfall event (14 events), the share of water stored at the end of the runoff process (tendR) was much lower than in times of sub-irrigation at tstartP (51% vs. 83%). Independent of the hydraulic conditions, more water was dissipated by ETa than removed by Rtot. Results might have been influenced by the fact that events starting with sub-irrigation received on average more rainfall (21.9 mm vs. 16.3 mm), but other meteorological and hydrological conditions also played an important role (Table 2).
Table 2 shows that only the boundary condition Duz,startP was positively correlated with ΔS and negatively correlated with ETa and runoff. All other boundary conditions were negatively correlated with ΔS and positively with ETa and Rtot. Hence, conditions leading to a higher share of rainfall to be stored led to a reduction in the shares of both ETa und Rtot (and vice versa). There was no influencing factor benefitting only runoff without causing a higher share of ETa at the same time.
To estimate the partitioning of the rainfall via a regression, the best indicator would be the duration of the runoff process (tR). For each of the three water budget components, this yielded the highest correlation value of all boundary conditions. The longer the runoff process lasted, the more time the initially stored water had to run off or to be transpired or evaporated. Yet tR is not a suitable indicator, as it is not easy to measure and could only be determined after the runoff process ended. The same problem applies to ttot, which itself was highly correlated to tR. In contrast, no relationship was found between the easy-to-measure rainfall duration (tP) and the partitioning of the water balance.
Correlations confirmed the findings of Table 1 that a higher percentage of rainfall was stored when sub-irrigation occurred, i.e., ΔWTDWLstartP < 0. The prevalence of low WTs was even more crucial, especially for the share of rainfall dissipated by evapotranspiration. However, the average evaporative demand had only a slight impact on the share of rainfall attributed to ETa.
The analysis showed that the share of the runoff was particularly difficult to predict. Most correlations calculated were low, even for tR. Out of the remaining variables, Duz had the highest correlation, indicating that it would be better suited to predict the runoff share than WTstartP and ΔWTDWLstartP. It was also a good indicator to estimate the other water balance components, yet not better suited than WTstartP.
3.3. Water Storage Separation
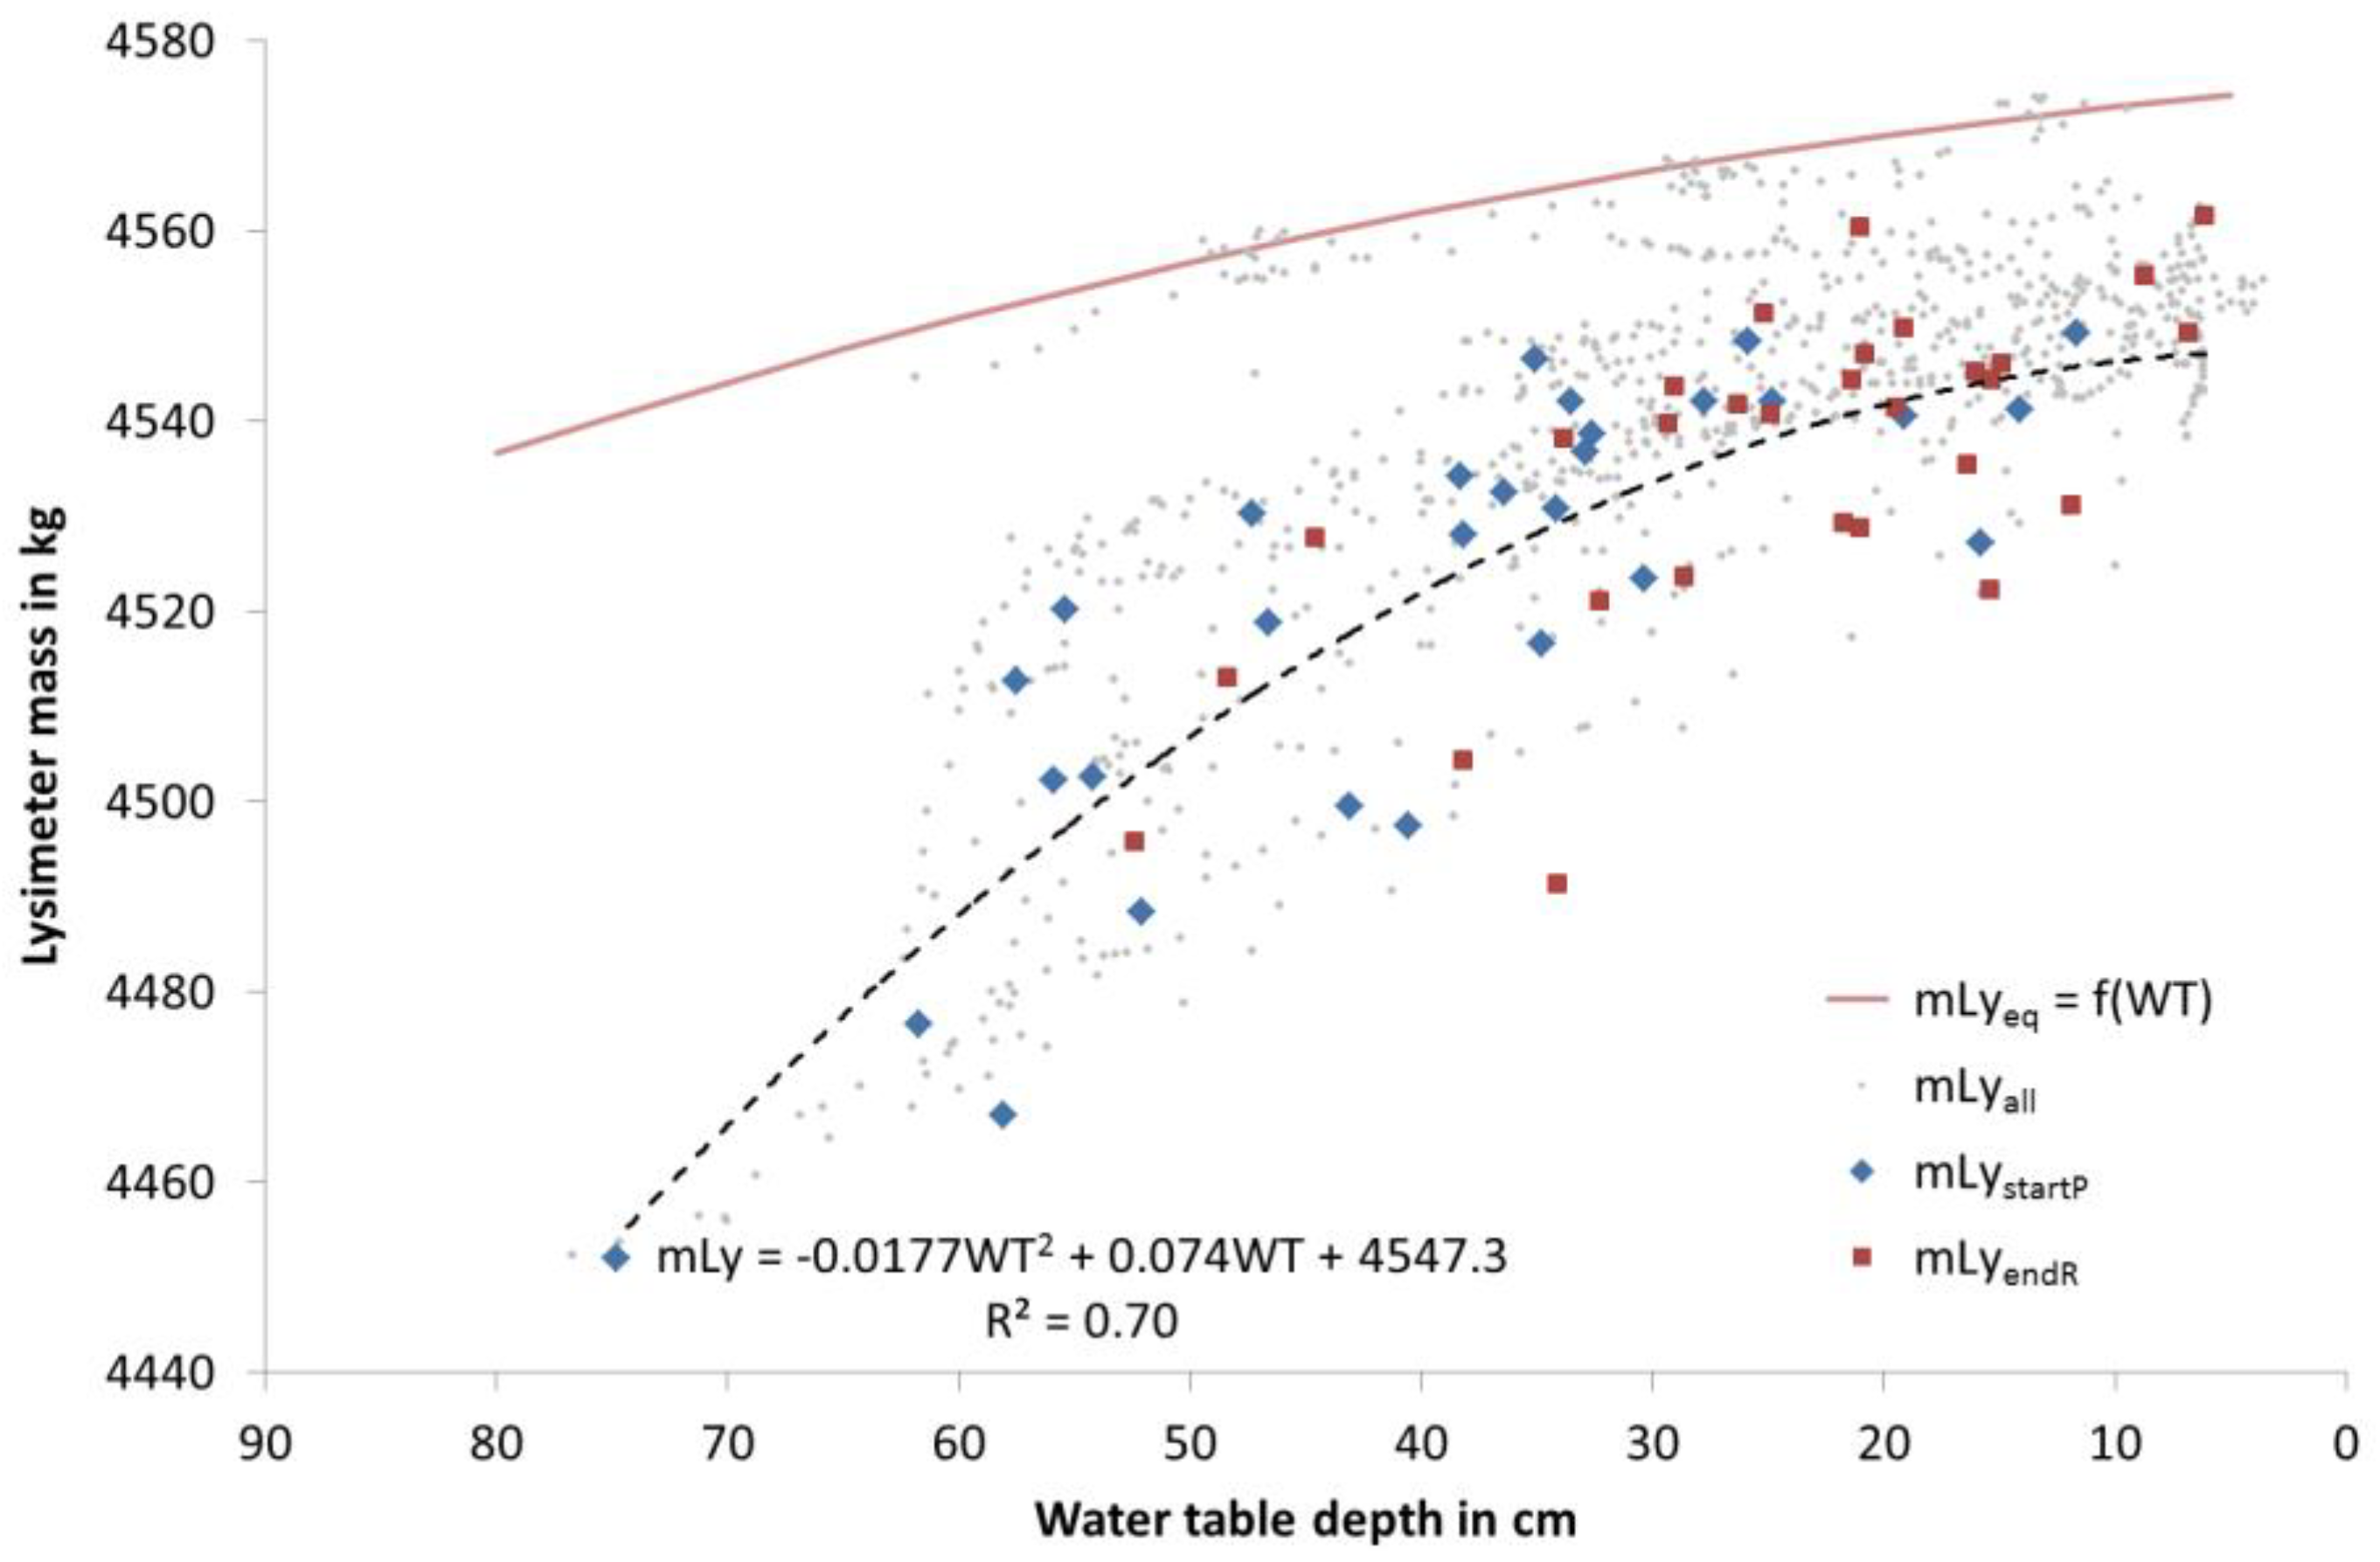
In most cases, the measured mass of the lysimeter deviated strongly from mLyeq (Figure 6). Hence, soil moisture depletion in the unsaturated zone was common, with a clear tendency of higher depletion during times of low WTs. This implies that during substantial parts of the year (note that in Figure 6 periods with frozen soil and snow cover are not included) the capillary rise in the vadose zone was too slow to replenish the losses from ETa, leading to prolonged times of soil moisture depletion and disequilibrium. In contrast, for some few WTs, water stored in the soil exceeded the mass under quasi-equilibrium conditions. These situations mainly occurred during winter times.
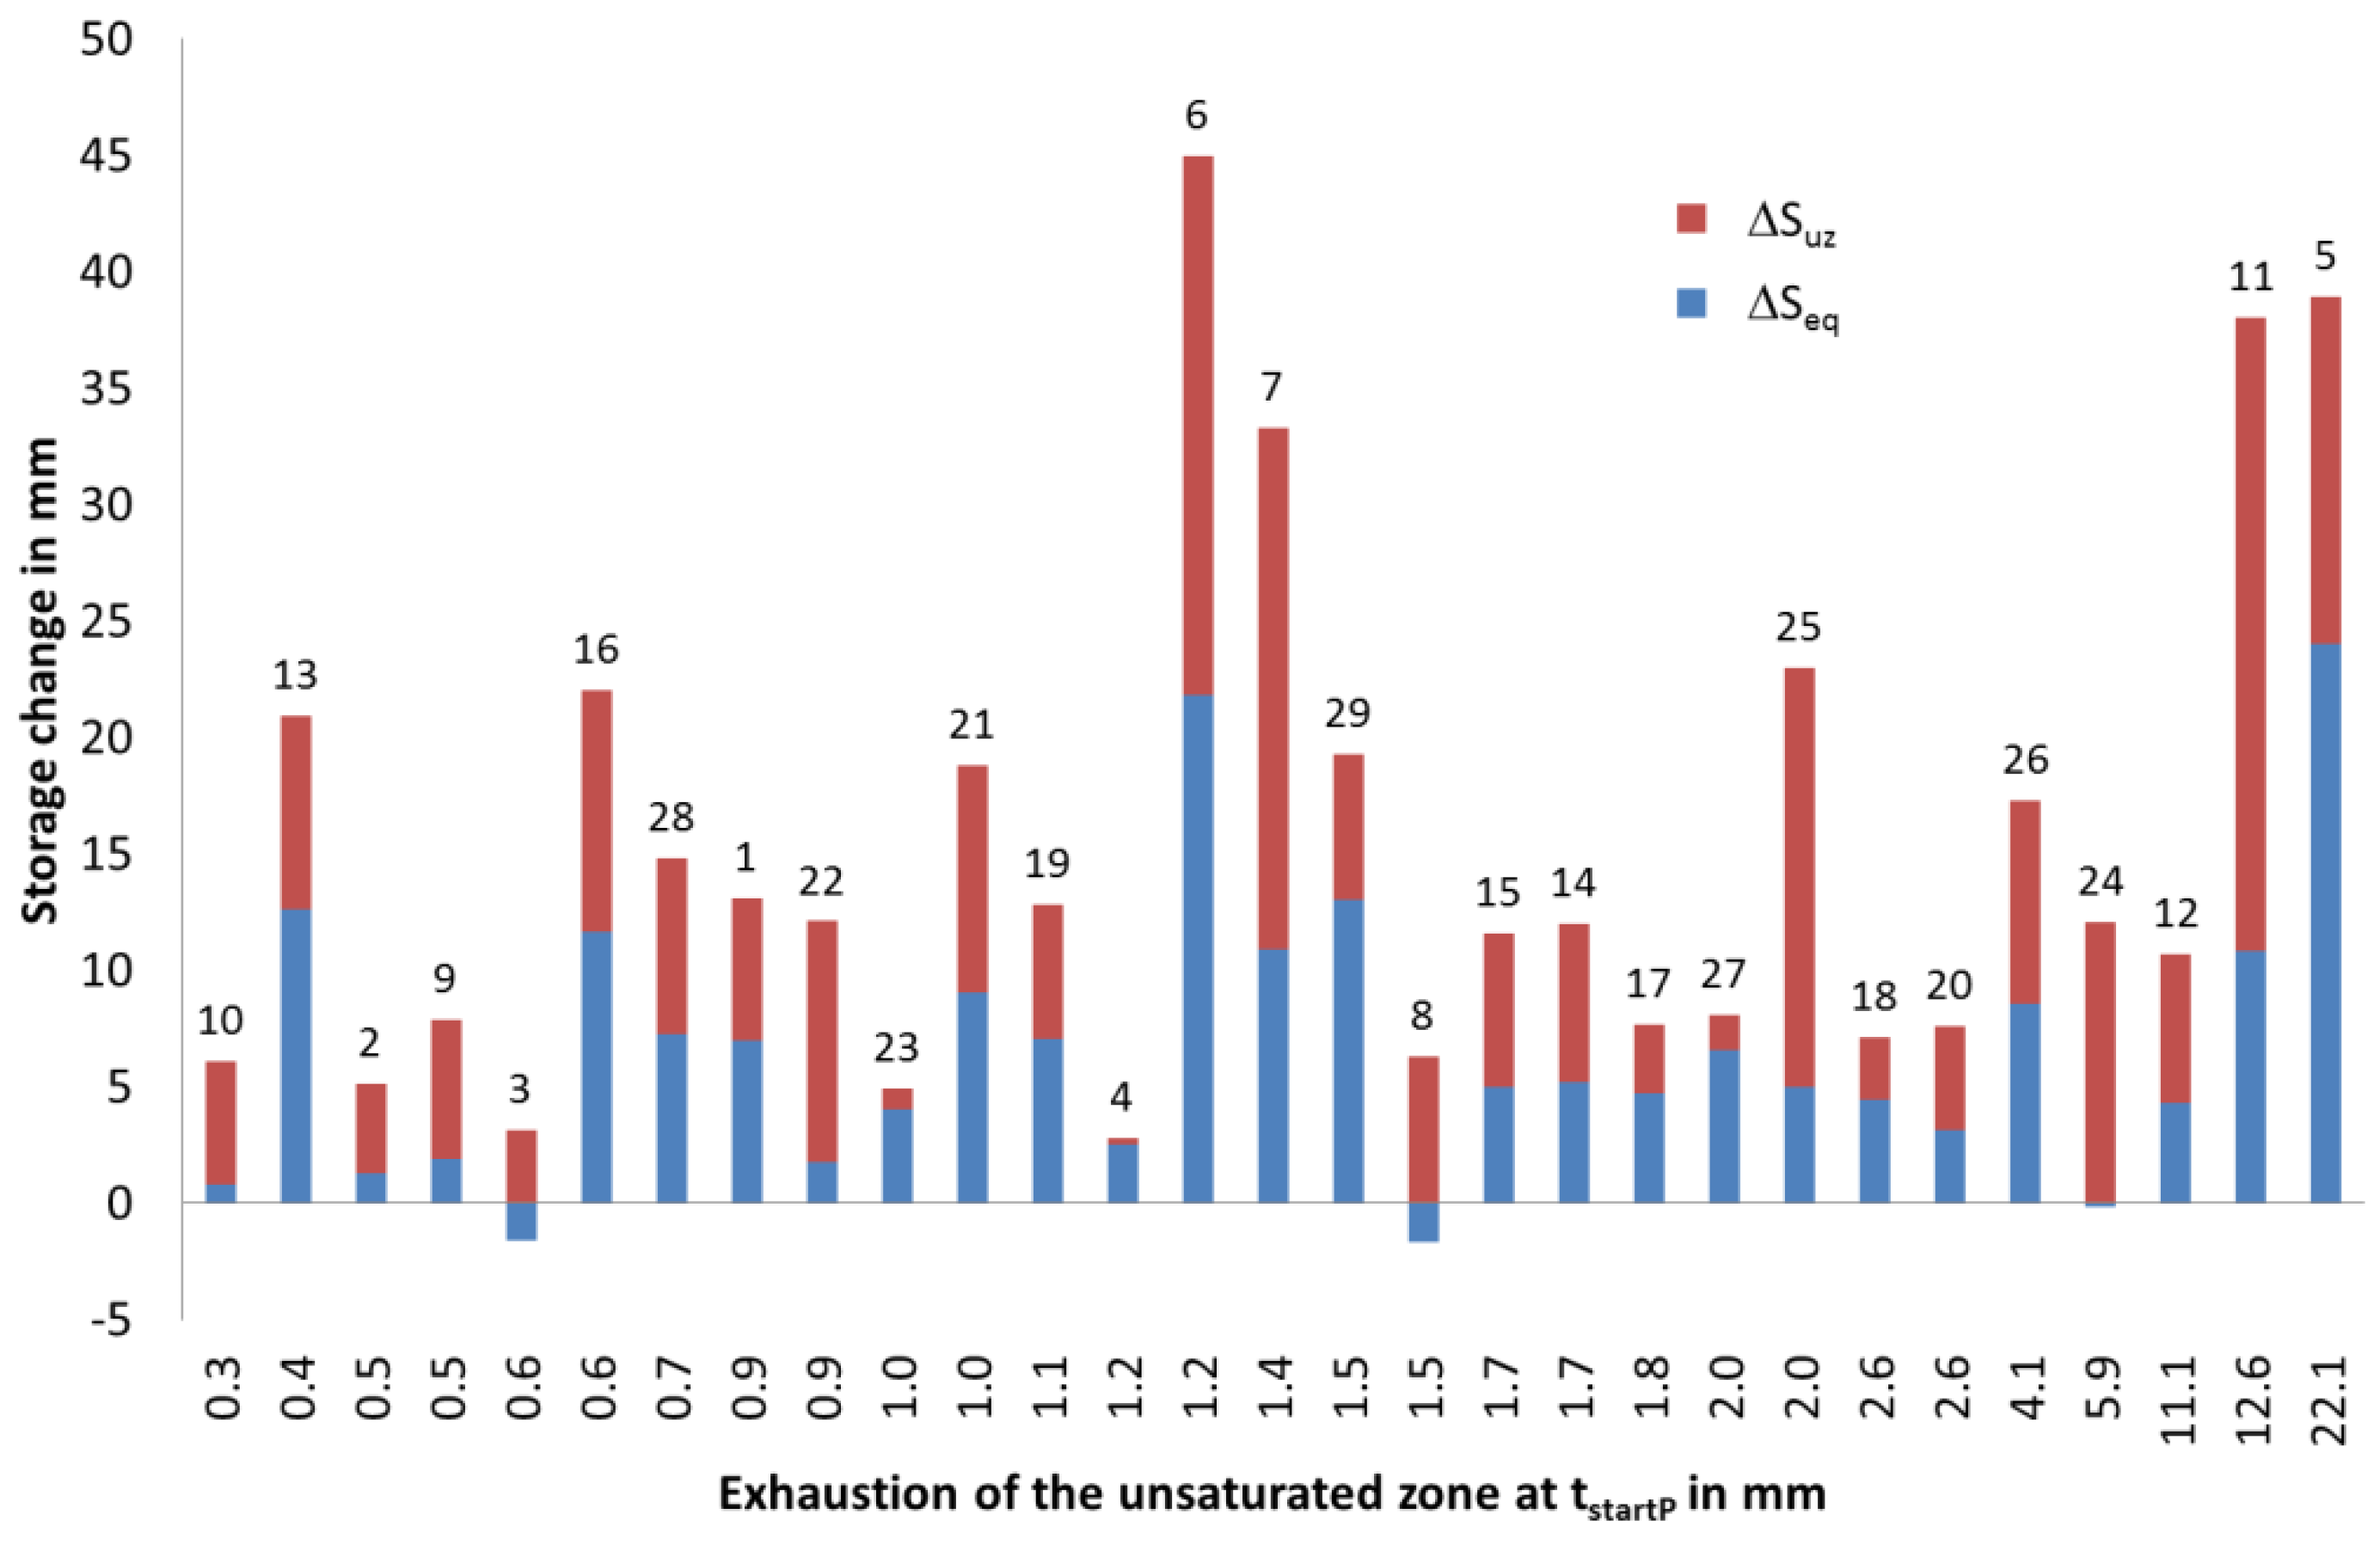
The unsaturated zone was important for the storage of rainfall. As shown by the separation of ΔS into ΔSeq and ΔSuz for the investigated rainfall events (Figure 7), ΔSeq often accounted for less than half of the actual water stored. The mean share of ΔSuz of all events was 62%, respectively 38% for ΔSeq. The median share of ΔSuz was 52%, respectively 48% for ΔSeq. For the events 3, 8 and 24, the WT was deeper at the end of the runoff process than at the start of the rainfall, leading to negative values of ΔSeq.
3.4. Runoff under the Assumption of Quasi-Equilibrium Soil Moisture Conditions
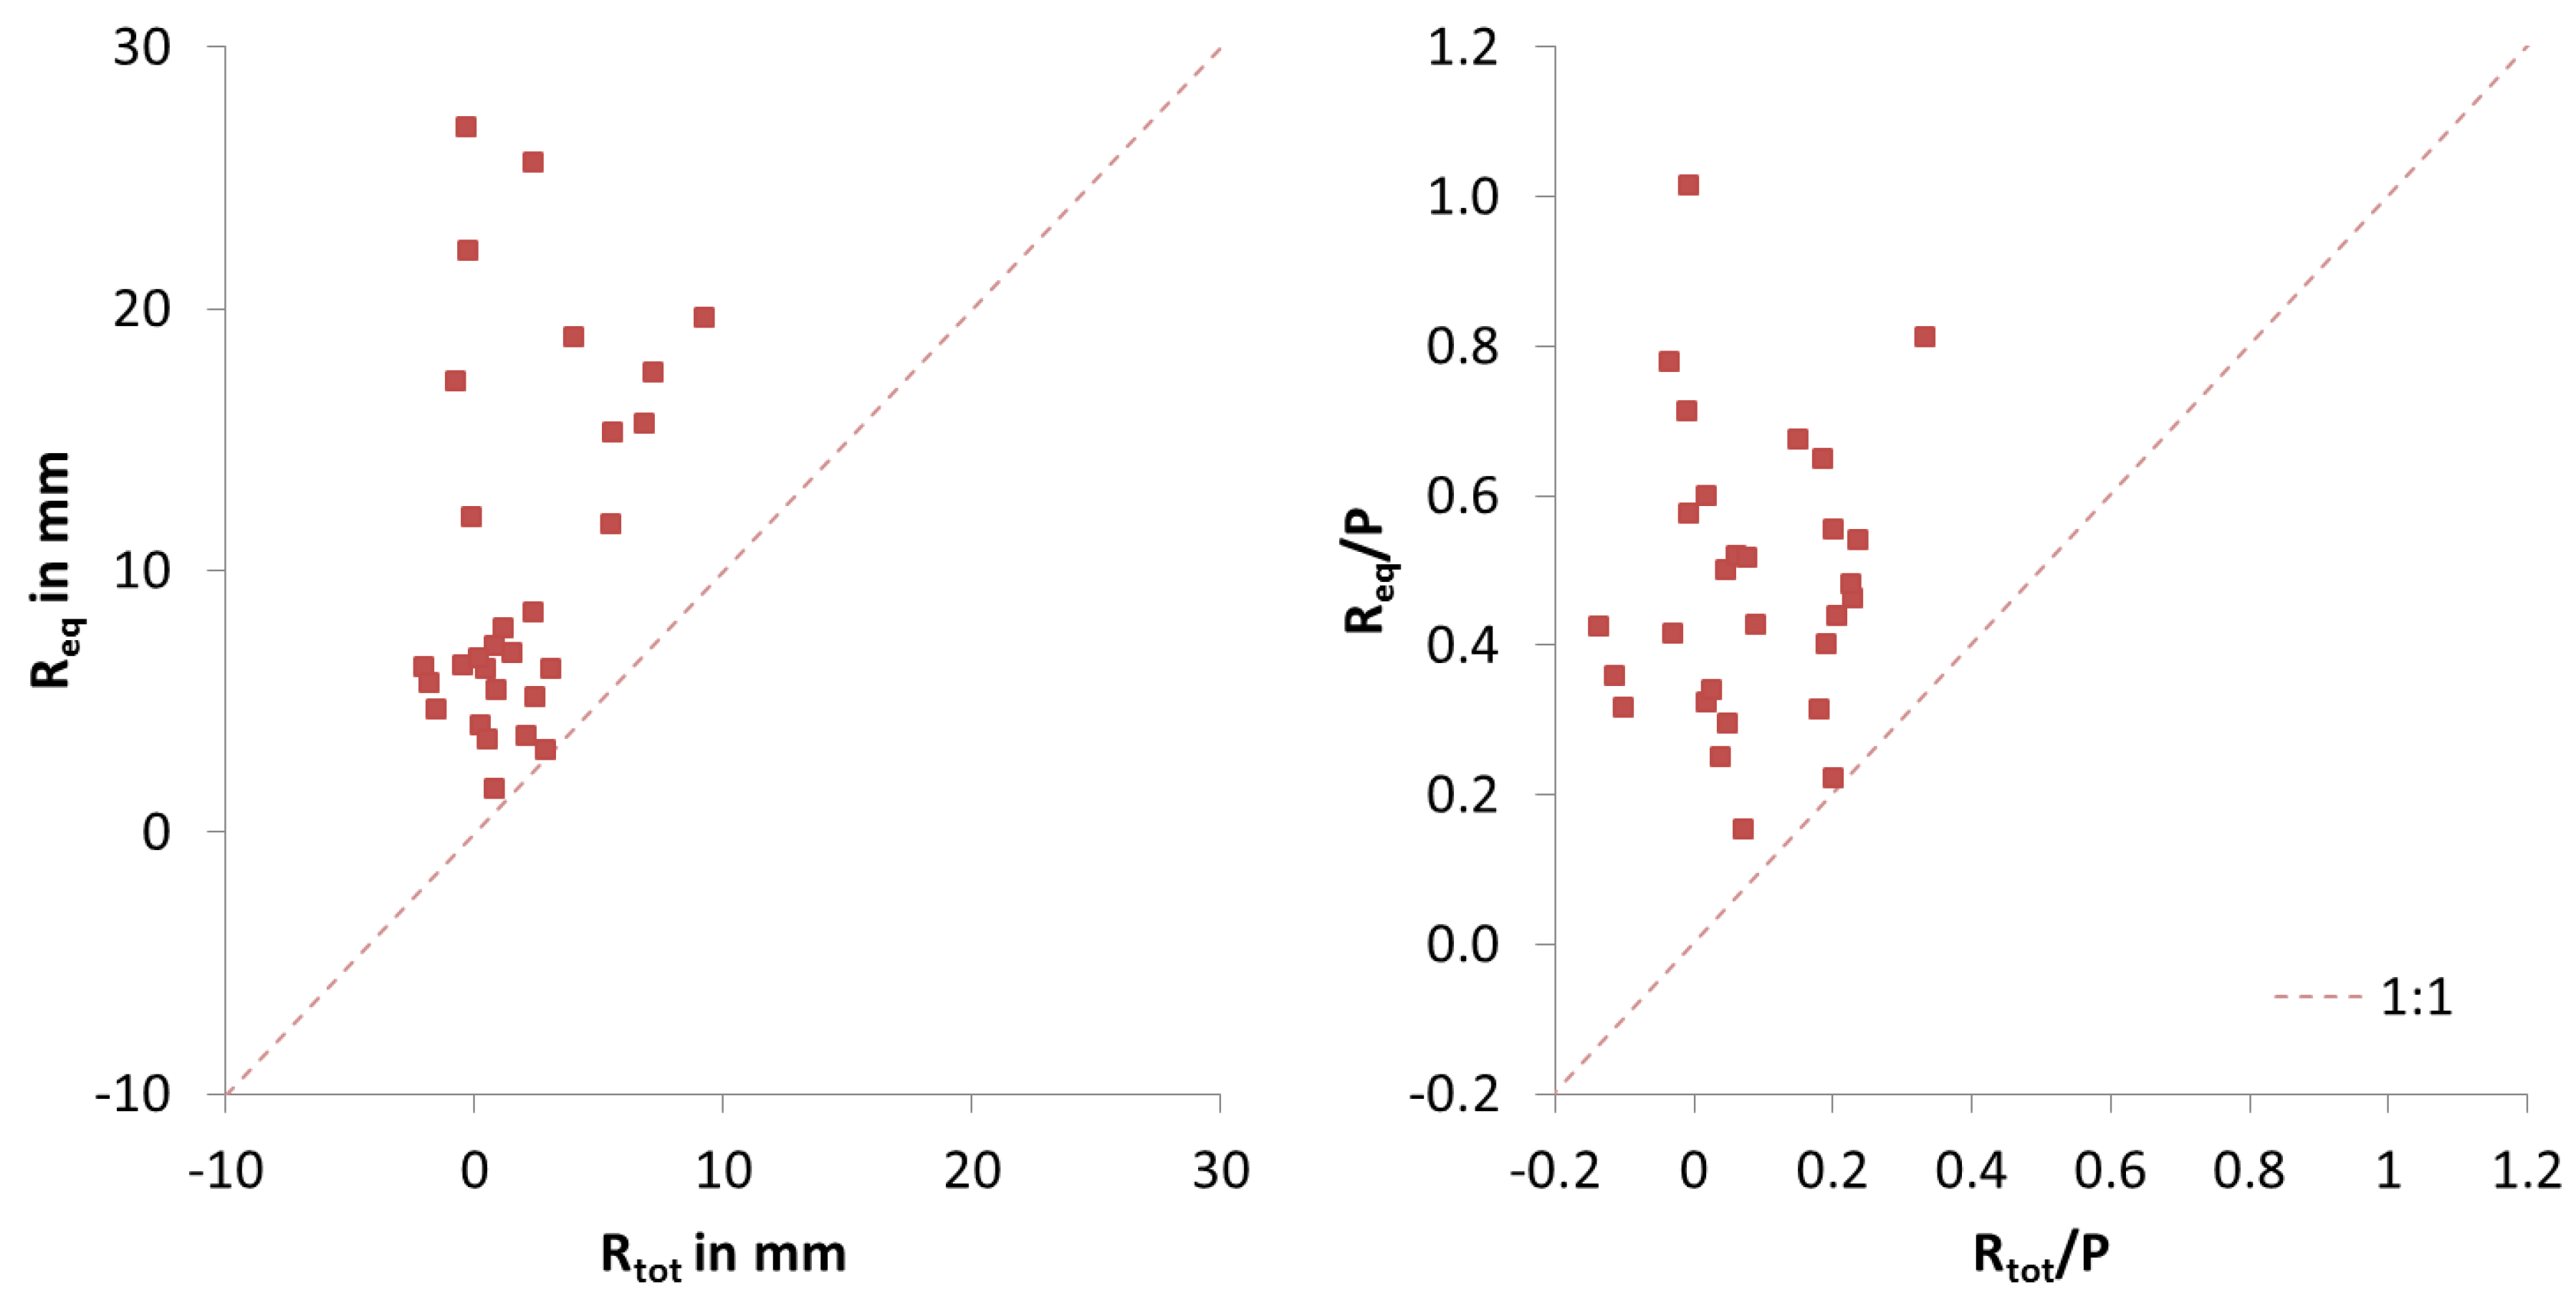
The mean measured Rtot value of the 29 selected rainfall events was 1.8 mm (standard deviation 2.76 mm). This corresponded to 8% of the average precipitation, ranging between −14% and 33% of the precipitation of the events (Figure 8, right). Negative Rtot values correspond to events where more water was supplied to the area than was drained to the ditches between tstartP and tendR. The mean estimated Req value was 10.4 mm (standard deviation 7.05 mm). This means that if quasi-equilibrium soil moisture conditions were assumed for the unsaturated zone, the runoff would take a share of 48% of the rainfall. For the single events, the share of Req ranged between 15% and 100%. The estimated Req strongly exceeded the measured Rtot because the water storage capacity of the unsaturated zone was underestimated. Events with small WT changes, in particular, had large errors in the estimated runoff. The root mean square error was 10.8 mm.
Comparing Req with Rtot, the error ε was always negative, meaning that the runoff was overestimated when assuming quasi-equilibrium conditions for every single event (Figure 8, left). This was expected because, according to our approach (Equation (8) and Equation (11)), Req could only be smaller than Rtot when ΔSeq > ΔS, i.e., when water would rather be released from than stored in the vadose zone (i.e., ΔSuz < 0).
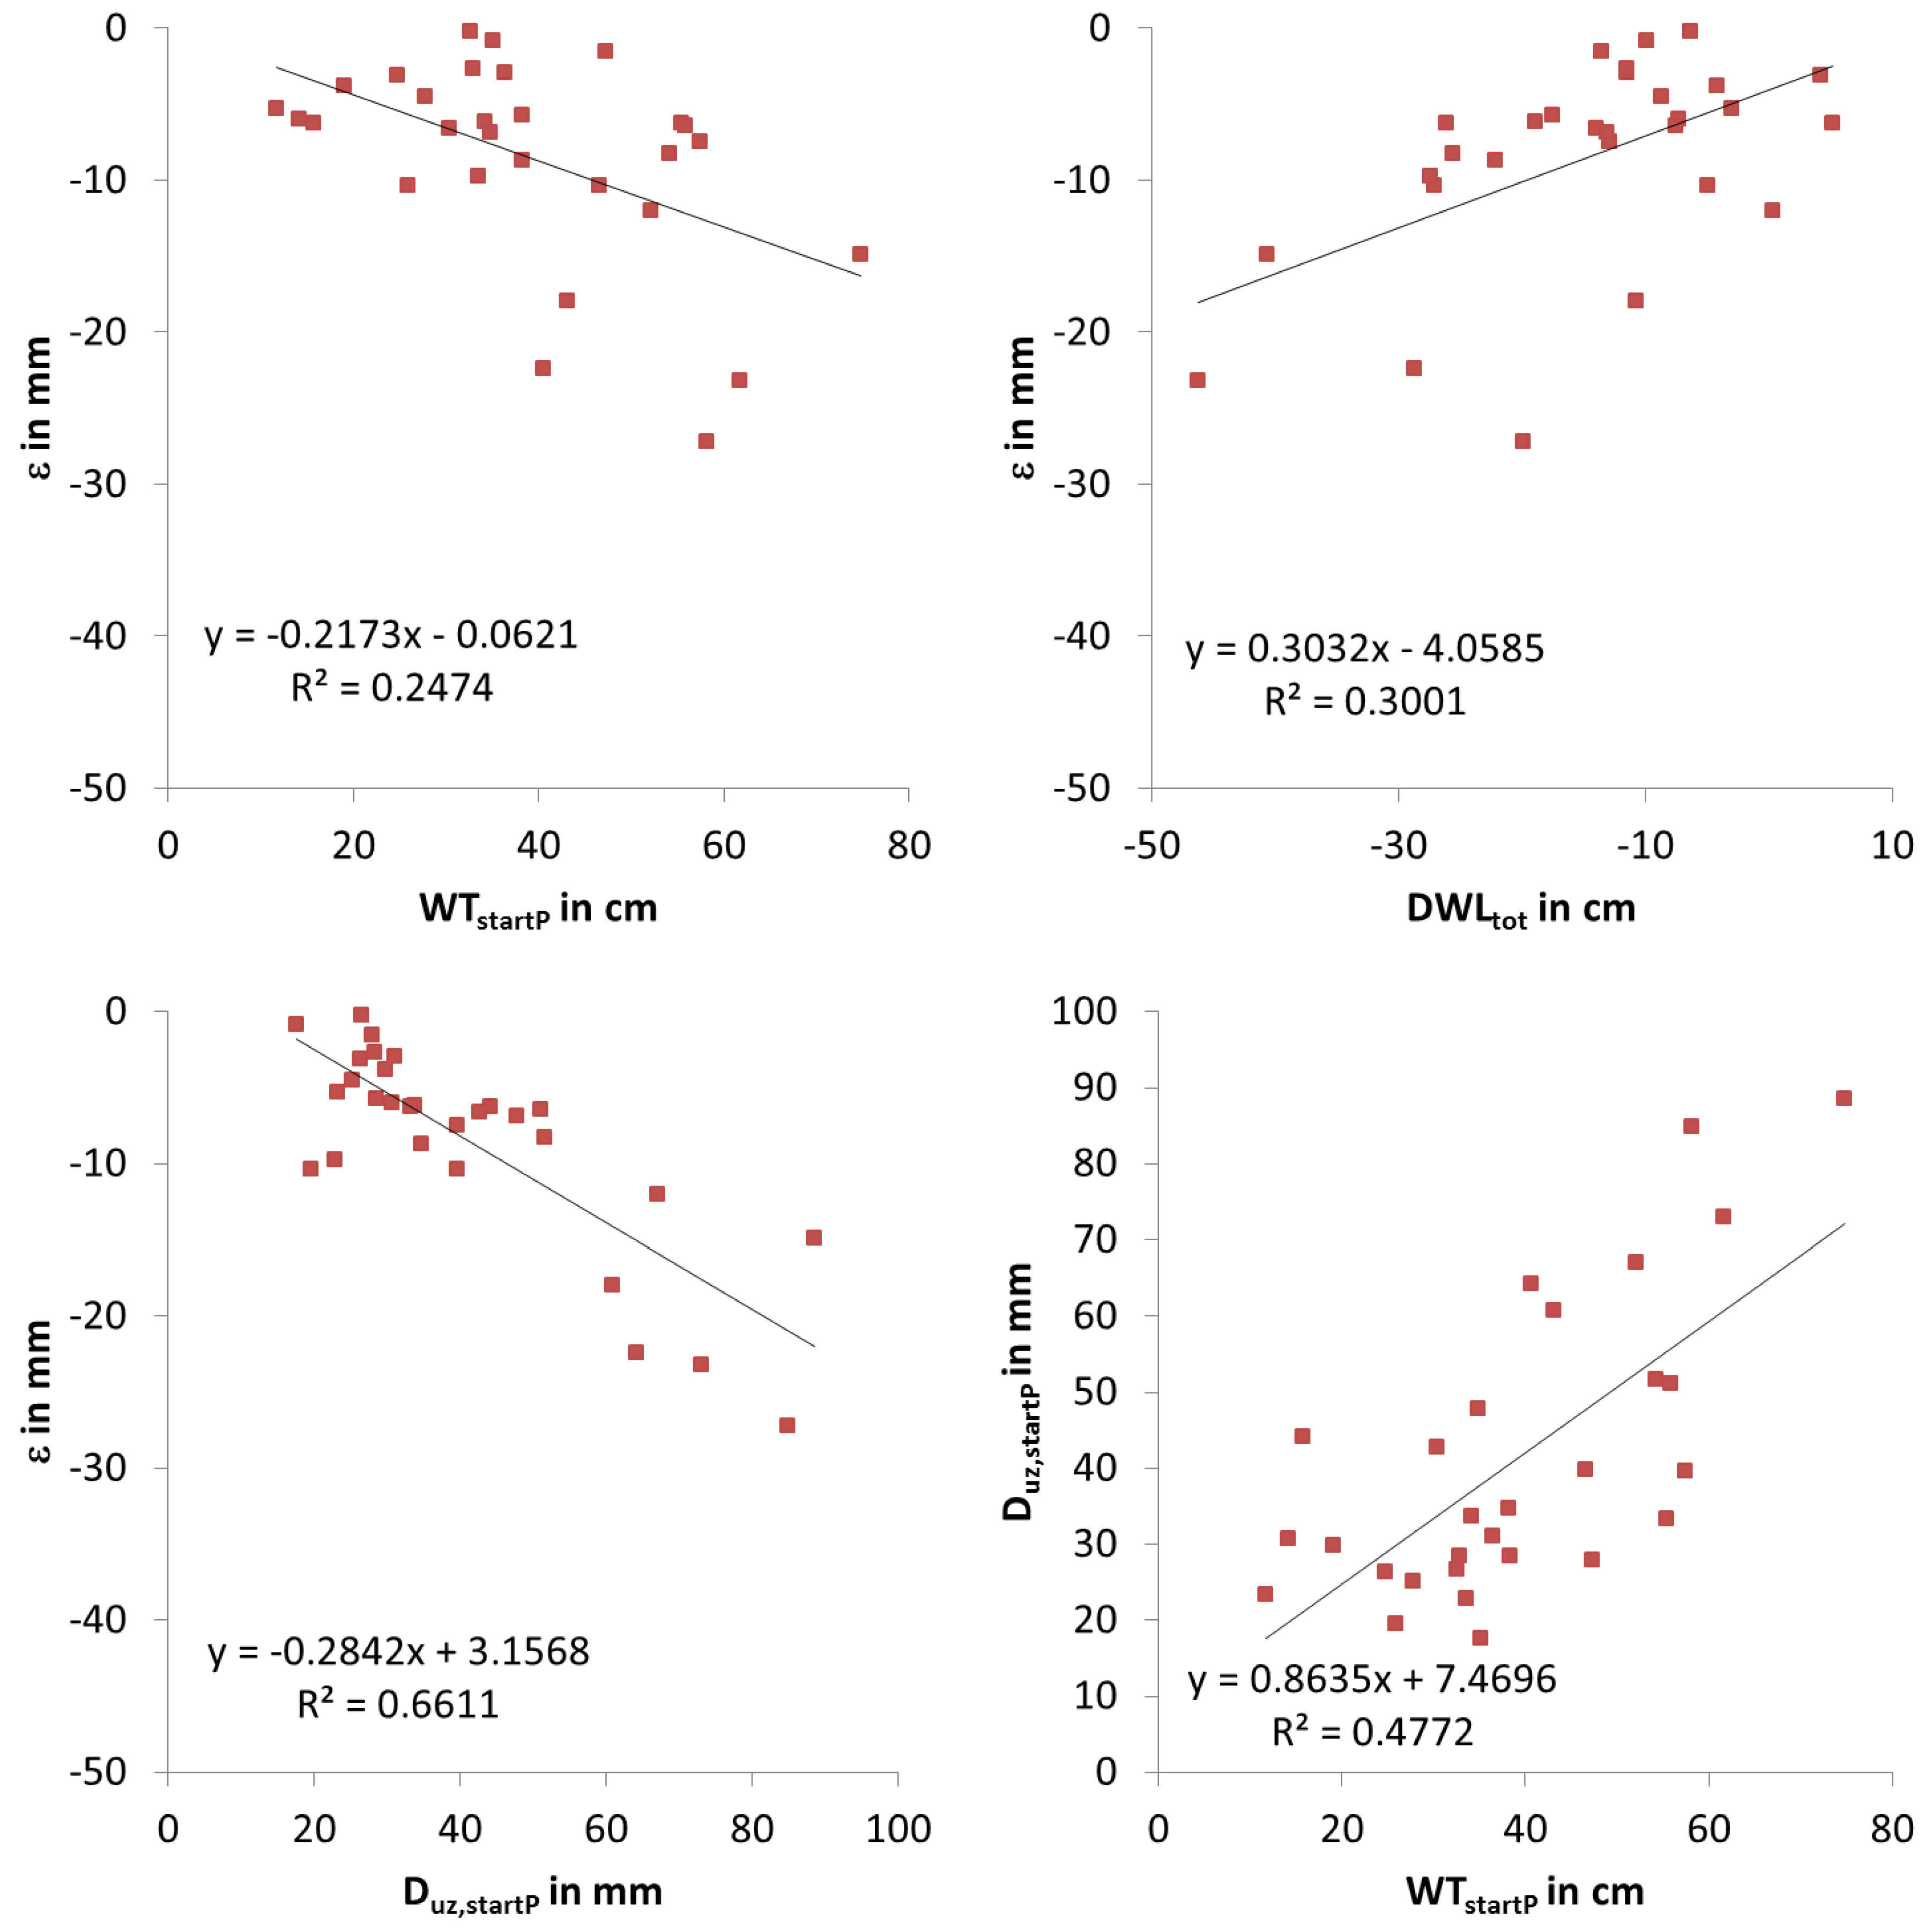
The error ε was positively correlated with the WT change between tstartP and tendR (Figure 9, top right). This is hardly surprising as the calculation of ΔSeq is based on ΔWTtot (Equation (6)) and subsequently Req is estimated using ΔSeq (Equation (11)). Note that negative ΔWTtot values reflect events where WTendR was deeper than WTstartP.
The error ε increased for deeper WTs (Figure 9, top left) and when depletion of the unsaturated zone was high (Figure 9, bottom left). Hence, the unsaturated zone becomes more relevant for runoff estimation when its thickness and depletion increases. Both factors are correlated as higher depletion of the unsaturated zone is generally observed when the zone is extremely thick (Figure 6 and Figure 9, bottom right).
4. Discussion
The investigation demonstrated the high retention potential of our agriculturally used shallow water table site. For the majority of the rainfall events investigated, most rainfall was stored (on average 69%). Runoff from the field to the ditches was of minor importance at our site (Figure 5). The flat surface and the low gradients between the shallow phreatic surface and DWL (Figure 4, top) in connection with the ditches’ very limited potential to discharge water by gravity are the main reasons for the limited amount of runoff observed. Often only little or no runoff at all was generated. The R/P ratio (0.08 ± 0.11) was smaller than the ratios which Torres, et al. [18] found for different moisture conditions in South Carolina (0.21 to 0.33) or which Sun, et al. [17] measured in Florida (0.13 to 0.30). In our case, ETa played a more important role than runoff in lowering the WT, not only during the runoff process but also in periods without rain. During the latter periods, diurnal WT fluctuations (Figure 4, bottom) were observed, which are caused by the interplay of all water balance components [50] and are typical for areas with shallow water tables.
The retention of the rainfall depended on ΔWTDWLstartP, indicating whether sub-irrigation or drainage conditions prevailed, and WTstartP, representing the thickness of the unsaturated zone. This is in line with the results of studies dealing with the effects of controlled drainage [14,26,51]. At our site, retention was much higher for rainfall events with sub-irrigation conditions at tstartP (on average 83%) than for events with drainage conditions at tstartP (51%), which reflected the possible influence that water management can have. These results are comparable to those gained in south-eastern USA by Amatya, et al. [14] and in China by Han, et al. [16], though these were obtained using different methods.
Still, the available water storage capacity of our wetland did not depend on WTstartP and ΔWTDWLstartP alone. Rather, the soil moisture depletion of the unsaturated zone (expressed by Duz,startP), which was correlated to the zone’s thickness (represented by WTstartP, Figure 9, bottom right, also Figure 6), was a decisive factor. Due to the depletion, more water could be stored than could be expected when assuming hydrostatic (equilibrium) soil moisture conditions. In the latter case, the unsaturated zone would be close to saturation for shallow WTs due to capillary rise, and storage capacity would be minimal (see Figure 2 in Childs [52]). Yet by separating water storage into one share attributed to the water storage change that would have occurred under quasi-equilibrium conditions (ΔSeq) and another share attributed to water storage change under dynamic soil moisture conditions (ΔSuz), we showed that on average 62% of ΔS was stored as ΔSuz (median share of 52%). That means more than half of the precipitation received was used to replenish the depleted unsaturated zone without causing any WT change. Storage capacity was high despite the shallow WTs and, therefore, the thin thickness of the unsaturated zone of less than 70 cm. These results underline the fact that dynamic conditions must be considered, instead of assuming equilibrium conditions, when quantifying the water storage of shallow water table sites, as Acharya, et al. [37], Laio, et al. [38] and Nachabe, et al. [39] previously emphasized. Nachabe [31] remarked that the hydrostatic assumption is common in many approaches to estimate the specific yield and the ΔS based on WT variations, as WTs are one of the most easily measurable variables at shallow water table sites. In general, our results comply with the notion that for soil-moisture close to equilibrium conditions, storage is relatively low at shallow water table sites. This results in high runoff [11,12,13], which in our case was shown by Req strongly exceeding the actually measured runoff. In Central Europe, such conditions close to equilibrium are common during the winter. The storage capacity increases with the increasing depletion of the unsaturated zone, typically occurring at drained wetlands during summer—the time when heavy rainfall events are more common. At our site, replenishment of the vadose zone by capillary rise tended to be too slow to keep up with the water extraction caused by ETa due to the prevalence of loamy soil layers in the uppermost parts of the soil. While depletion of the vadose zone was common at our site (grey points in Figure 6 are below the quasi-equilibrium line), the extent of depletion might be limited at sites with coarser soils. The prevailing soils, therefore, determine the influence that the depletion of the vadose zone has on runoff generation and water storage and whether the assumption of hydrostatic conditions is valid or not.
The partitioning of the rainfall into the water budget components at our site was a complex process that would be hard to predict. While rainfall characteristics had no discernible influence (Figure 5), correlations with other boundary conditions were also rather low (Table 2), especially concerning the share of Rtot/P. Still, the intercorrelated variables Duz,startP, WTstartP and ΔWTDWLstartP had an influence on the share of rainfall retained and evapotranspired. In sum, the analysis indicated that the runoff process was governed by a variety of overlapping influences. Torres, et al. [18] came to the same conclusion because of significant but weak relationships between precipitation and runoff. In our case, there was a significant correlation between Rtot/P and Duz,startP but not WTstartP. However, the correlation coefficient was low.
An estimation of runoff under the assumption of quasi-equilibrium conditions (Req) resulted in large errors, which were a consequence of the underestimation of the storage capacity under such conditions. The estimated share of rainfall discharged exceeded the measured 8% average by far (average Req/P was 48%). Absolute errors were higher for lower WTs and higher Duz,startP. Since the analysed rainfall events mostly occurred under summer conditions, it can be assumed that the error should be smaller under winter conditions since WTs are higher and the soil moisture in the unsaturated zone is close to hydrostatic equilibrium. If the ETa were estimated in a similar way to Req as the residual of the water balance (which is a common approach), the ETa would also be overestimated. Hence, estimations based on the residual of the water budget should only be done under conditions when ΔS is negligible, e.g., for long periods with similar initial and end conditions.
Our findings are in agreement with many other studies that the antecedent conditions (expressed by the soil moisture depletion) are important with respect to a wetland’s potential to store water and produce runoff in response to rainfall. In terms of ΔS, the behaviour of the agriculturally used, drained shallow water table site was similar to those of other types of wetlands, including natural ones. Wet antecedent conditions with WTs close to the surface reduce the retention capacity for rainfall and increase the runoff ratio [12,28]. Dry antecedent conditions with deeper WTs increase the share of the storage. In this case, the runoff process is also prolonged since the gradients between WT and DWL are directed from the ditch to the shallow water table area at tstartP and have to be switched towards the ditch before Rout starts. This makes the ETa more important during dry conditions due to the longer duration of the runoff process and, to a certain extent, the higher evaporative demand in such periods. Yet the latter also depends in a complex manner on the vegetation, its growth and adaptation to the current water tables as shown by Dietrich and Kaiser [53]. Our results underline the conclusions by Bacon, et al. [5] regarding the common perception that peatlands act like as sponges. While peatlands can store high amounts of water, they release only small amounts of water and poorly sustain river flows whenever they are not saturated.
Most of the studies cited drew their conclusions from measurements of P, Rout, and WTs. Water storage was either not considered because of the studies’ focus on runoff [14,15,16,25], or calculated ΔS based on WT and soil properties [13,27,33,54] or as residual of the water budget [55,56]. In contrast, using the groundwater lysimeter allowed ΔS to be measured directly, while the typically neglected ETa was calculated as residual. Since the WT in the lysimeter was adjusted with high accuracy to the WT of the surrounding field, the most important pre-condition for transferring the lysimeter results to the shallow water table site was fulfilled [45]. Discharge measurements in the ditches would have been a good supplement to the lysimeter data, but they would have been error-prone due to the very low slopes and velocities or would have required measuring-weir solutions with an elaborate design.
The derived water storage curve (Equation (5)) was based on the assumption that the soil mass of the monolith was constant. Yet vegetation growth might have changed the mass of the monolith with time. However, the effect was believed to be small. Another uncertainty results from the assumption of quasi-equilibrium conditions during the estimation of the storage curve in March 2012. The comparison of the storage curve with all daily average lysimeter mass values of the whole investigation period, except for days with snow or frozen soil, shows that during the period in March 2012 soil water saturation prevailed (Figure 6, nearly all grey points are below the curve mLyeq). However, despite the very slow lowering of the water level, water redistribution within the vadose zone might have occurred. The no-flow-conditions at the beginning and end of the period still indicate that during the period the conditions were at least close to equilibrium. The water storage curve was a valid approximation, while uncertainties remained, for example, due to effects like hysteresis.
Overall, the data gathered proved ΔS’s importance when investigating the response of shallow water table sites to rainfall [57]. Such studies have to consider the actual conditions and soil moisture depletion of the unsaturated zone, as mere concentration on changes in WT can cause tremendous errors.
Knowing how ΔS depends on the unsaturated zone’s thickness and soil moisture depletion can help water managers better understand the possibilities and limitations of their operating systems. On the one hand, separating ΔS into ΔSeq and ΔSuz illustrates the limited possibilities of short-term WT changes to store water or to release water from the soil storage to stabilize the river flow downstream. WT changes initiated by changes of DWL mainly affect ΔSeq, which is relatively small when WT is close to the surface and ΔWT is only a few centimetres high. Still, an increase or decrease in DWL of more than 10 or 20 cm is often not possible because of the low slopes in the drainage systems and different aims of the interest groups. On the other hand, a depleted unsaturated zone can provide a large storage capacity. Even drained shallow water table sites can store a large share of large rainfall events in the summer months, the time when such events typically occur in Central Europe. Yet as the soil moisture depletion of the unsaturated zone depends foremost on the meteorological conditions in the pre-rainfall period, it can only be influenced to a limited degree by water management options. Still, it was shown that depletion and WTs are correlated, and that retention capacity depended on the present hydraulic conditions (sub-irrigation or drainage). Sub-irrigation and drainage can be actively manipulated by changing DWLs.
Unfortunately, our evaluation of the runoff process did not consider any winter rainfall events, since none of them met the defined criteria. Generally, heavy rainfall events are rare during winter. Water tables are close to or above the surface most of the time. An unsaturated zone, which was the focus of the study, does not really exist. Water retention, at least at our site with its restriction of overland flow, then occurs mainly in ponded depressions. However, simulating such conditions was beyond the technical capabilities of our lysimeter station. Future research should be dedicated to modifying the lysimeter design so as to allow corresponding conditions and events to be taken into consideration.
5. Conclusions
The aim of this study was to explain the response of a drained wetland site to rainfall events, especially concerning the relevance of the unsaturated zone on the storage-runoff dynamics. A weighable groundwater lysimeter, installed in situ at a drained wetland site with shallow water tables, enabled ΔS, P and Rtot to be measured directly, while determining the ETa as a residual of the water budget. Despite being drained, the shallow water table site provided a high retention capacity due to its setting with very low surface slopes. On average, Rtot accounted for less than 10% of the P. ETa was more important for lowering WTs, as more than twice as much water (23%) was dissipated by ETa by the end of the runoff process. The remaining rainfall was stored in the soil column (around 70%). The partitioning of P into the water budget components varied for the different rainfall events and would be hard to predict as correlations with potential influencing factors were rather low, especially concerning the share of Rtot. Still, runoff was generally higher when drainage prevailed at the beginning of the rainfall, instead of sub-irrigation conditions.
A methodology was developed to separate ΔS into two shares, one assigned to quasi-equilibrium conditions (ΔSeq) and one to the replenishment of the unsaturated zone without WT change (ΔSuz). ΔSeq was derived on the basis of water table changes and a storage curve that was derived from data of a period with continuous WT lowering in early spring 2012. As the period started from saturated soil moisture conditions and influences from P and ETa were low, we assumed that quasi-equilibrium conditions prevailed. On the other hand, ΔSuz was calculated as the difference between ΔS and ΔSeq. This replenishment of the unsaturated zone dominated the process of water retention during the prevailing summer conditions—on average, ΔSuz accounted for 62% of the stored water.
Our findings suggest that the water table alone is not a sufficient indicator for the available water storage capacity of a shallow water table site. Instead, the current conditions of the unsaturated zone, especially its soil moisture depletion by evapotranspiration, has to be considered. Neglecting these dynamics and assuming that conditions are hydrostatic can lead to a tremendous underestimation of a wetland’s potential to store water and, consequently, to an overestimation of the runoff from wetland areas. Still, the hydrostatic assumption remains common in models and to theoretically derive the specific yield. The results of this study help understand why measured values of the specific yield often vary within a wide range (e.g., Logsdon, et al. [58]). However, due to the complexity of the processes involved, even a knowledge of the soil moisture depletion is only one element in understanding how the shallow water table site responds to rainfall. The complexity makes predictive modelling difficult, though it would support the management and mitigation of the negative effects of heavy rainfalls at drained shallow water table sites.
Supplementary Materials
The raw data and the result data have been published in the ZALF Open Research Data Portal (DOI:10.4228/ZALF.DK.81).
Author Contributions
O.D. was responsible for design and implementation of the lysimeter experiments. He processed and analyzed the data, wrote the original draft and designed most of the tables and figures. M.F. made the statistical analyses, wrote parts of text, reviewed and edited the manuscript. J.S. was involved in the data processing and gave important input to the manuscript.
Funding
The research was done as part of the INKA BB research project. It was sponsored by the German Federal Ministry of Education and Science for sponsoring (FKZ: 01LR0803A).
Acknowledgments
We would like to thank the Authority of Environment, Health and Consumer Protection of the Federal State of Brandenburg and the local water board “Oberland Calau” for supporting our work. We would especially like to thank our colleagues at UGT GmbH for the development and installation of the lysimeter station, our colleagues Ute Appel and Ralph Tauschke for their field work and Evelyn Wallor for the soil evaluation. We like to thank the reviewers for their detailed comments that helped us to improve the manuscript.
Conflicts of Interest
The authors declare no conflict of interest.
Abbreviations
| Parameter | Description | Unit |
| Duz | Soil moisture depletion in the unsaturated zone | mm |
| DWL | Ditch water level | m a.s.l. |
| ETa | Actual evapotranspiration | mm/h |
| ETp | Potential evapotranspiration (calculated as FAO grass reference evapotranspiration) | mm/h |
| GWi | Groundwater observation well | |
| Ly | Lysimeter | |
| mLy | Lysimeter mass | kg |
| mLyendR | Mass of the lysimeter at tendR | kg |
| mLyeq | Mass of the lysimeter under quasi-equilibrium conditions | kg |
| mLystartP | Mass of the lysimeter at tstartP | kg |
| P | Precipitation | mm/h |
| R | Runoff (inflow, outflow) | mm/h |
| Ref | Reference station | |
| RendR | Value of the cumulated runoff curve at tendR | mm |
| Req | Runoff under the assumption of hydrostatic conditions | mm |
| Rin | Inflow | mm |
| Rout | Outflow | mm |
| RstartR | Value of the cumulated runoff curve at tstartR | mm |
| Rtot | Runoff between tstartP and tendR | mm |
| S | Water storage | mm |
| tendP | Time at the end of the rainfall | dd.mm.yyyy hh:mm |
| tendR | Time of the lower reversal point of the cumulated runoff curve | dd.mm.yyyy hh:mm |
| tP | Rainfall duration | h |
| tR | Duration of the runoff process | h |
| tstartP | Time at the beginning of the rainfall | dd.mm.yyyy hh:mm |
| tstartR | Time of the upper reversal point of the cumulated runoff curve | dd.mm.yyyy hh:mm |
| WT | Water table depth in the lysimeter | cm |
| WTendR | Water table depth in the lysimeter at tendR | cm |
| WTmax | Maximum water table depth during a rainfall | cm |
| WTstartP | Water table depth in the lysimeter at tstartP | cm |
| ΔSuz | Water storage change of the unsaturated low moisture zone under dynamic soil moisture conditions | mm |
| ΔS | Water storage change between tstartP and tendR | mm |
| ΔSeq | Water storage change under assumption of quasi-equilibrium conditions | mm |
| ΔWTmaxWT | Difference between WTstartP and WTmax | cm |
| ΔWTtot | Difference between WTstartP and WTendR | cm |
| ΔWTDWLstartP | Difference between WT and DWL at tstartP | cm |
Appendix A. Additional Figures for Selection of Quasi-Equilibrium Water Storage Curve
Figure A1.
Water table (WT), lysimeter mass (mLy) and corrected lysimeter mass (mLycorr = mLy − P + ETa) in March 2012. The data served as basis for estimation of quasi-equilibrium water storage curve.
Figure A1.
Water table (WT), lysimeter mass (mLy) and corrected lysimeter mass (mLycorr = mLy − P + ETa) in March 2012. The data served as basis for estimation of quasi-equilibrium water storage curve.

Figure A2.
Daily water budget components during the period in March 2012 that was used to estimate the quasi-equilibrium water storage curve (P—precipitation, ETa—evapotranspiration, R—inflow/outflow, ΔS—water storage change).
Figure A2.
Daily water budget components during the period in March 2012 that was used to estimate the quasi-equilibrium water storage curve (P—precipitation, ETa—evapotranspiration, R—inflow/outflow, ΔS—water storage change).

References
- Succow, M.; Jeschke, L. Moore in der Landschaft; Verlag Harri Deutsch: Frankfurt, Germany, 1990; p. 268. [Google Scholar]
- Joosten, H.; Clarke, D. Wise Use of Mires and Peatlands; International Mire Conservation Group and International Peat Society: Saarijärvi, Finland, 2002; p. 304. [Google Scholar]
- Joosten, H.; Tanneberger, F.; Moen, A. Mires and Peatlands of Europe: Status, Distribution and Conservation; Schweizerbart Science Publishers: Stuttgart, Germany, 2017; p. 730. [Google Scholar]
- Bullock, A.; Acreman, M. The role of wetlands in the hydrological cycle. Hydrol. Earth Syst. Sci. 2003, 7, 358–389. [Google Scholar] [CrossRef] [Green Version]
- Bacon, K.L.; Baird, A.J.; Blundell, A.; Bourgault, M.A.; Chapman, P.J.; Dargie, G.; Dooling, G.P.; Gee, C.; Holden, J.; Kelly, T.; et al. Questioning ten common assumptions about peatlands. Mires Peat 2017, 19, 1–23. [Google Scholar] [CrossRef]
- Branfireun, B.A.; Roulet, N.T. The baseflow and storm flow hydrology of a precambrian shield headwater peatland. Hydrol. Process. 1998, 12, 57–72. [Google Scholar] [CrossRef]
- Roulet, N.T.; Woo, M.K. Runoff generation in a low Arctic drainage basin. J. Hydrol. 1988, 101, 213–226. [Google Scholar] [CrossRef]
- Roulet, N.T.; Woo, M.K. Hydrology of a wetland in the continuous permafrost region. J. Hydrol. 1986, 89, 73–91. [Google Scholar] [CrossRef]
- Waddington, J.M.; Roulet, N.T.; Hill, A.R. Runoff mechanisms in a forested groundwater discharge wetland. J. Hydrol. 1993, 147, 37–60. [Google Scholar] [CrossRef]
- McKillop, R.; Kouwen, N.; Soulis, E.D. Modeling the rainfall-runoff response of a headwater wetland. Water Resour. Res. 1999, 35, 1165–1177. [Google Scholar] [CrossRef]
- Daniels, S.M.; Agnew, C.T.; Allott, T.E.H.; Evans, M.G. Water table variability and runoff generation in an eroded peatland, South Pennines, UK. J. Hydrol. 2008, 361, 214–226. [Google Scholar] [CrossRef]
- Martin, J.E. Hydrologic response of a small forested swamp complex, Seymour Valley, British Columbia. Can. Geogr. 2011, 55, 457–469. [Google Scholar] [CrossRef]
- Glenn, M.S.; Woo, M.K. Spring and summer hydrology of a valley-bottom wetland, Ellesmere Island, Northwest Territories, Canada. Wetlands 1997, 17, 321–329. [Google Scholar] [CrossRef]
- Amatya, D.M.; Gregory, J.D.; Skaggs, R.W. Effects of controlled drainage on storm event hydrology in a loblolly pine plantation. J. Am. Water Resour. Assoc. 2000, 36, 175–190. [Google Scholar] [CrossRef]
- Epps, T.H.; Hitchcock, D.R.; Jayakaran, A.D.; Loflin, D.R.; Williams, T.M.; Amatya, D.M. Characterization of Storm Flow Dynamics of Headwater Streams in the South Carolina Lower Coastal Plain. J. Am. Water Resour. Assoc. 2013, 49, 76–89. [Google Scholar] [CrossRef]
- Han, S.; Xu, D.; Wang, S. Runoff formation from experimental plot, field, to small catchment scales in agricultural North Huaihe River Plain, China. Hydrol. Earth Syst. Sci. 2012, 16, 3115–3125. [Google Scholar] [CrossRef] [Green Version]
- Sun, G.; McNulty, S.G.; Amatya, D.M.; Skaggs, R.W.; Swift, L.W.; Shepard, J.P.; Riekerk, H. A comparison of the watershed hydrology of coastal forested wetlands and the mountainous uplands in the Southern US. J. Hydrol. 2002, 263, 92–104. [Google Scholar] [CrossRef]
- Torres, I.B.L.T.; Amatya, D.M.; Sun, G.; Callahan, T.J. Seasonal rainfall-runoff relationships in a lowland forested watershed in the southeastern USA. Hydrol. Process. 2011, 25, 2032–2045. [Google Scholar] [CrossRef]
- Brown, R.G. Effects of wetland channelization on runoff and loading. Wetlands 1988, 8, 123–133. [Google Scholar] [CrossRef]
- Robinson, M.; Gannon, B.; Schuch, M.A.X. A comparison of the hydrology of moorland under natural conditions, agricultural use and forestry. Hydrol. Sci. J. 1991, 36, 565–577. [Google Scholar] [CrossRef]
- Dunn, S.M.; Mackay, R. Modelling the hydrological impacts of open ditch drainage. J. Hydrol. 1996, 179, 37–66. [Google Scholar] [CrossRef]
- Holden, J.; Evans, M.G.; Burt, T.P.; Horton, M. Impact of Land Drainage on Peatland Hydrology. J. Environ. Qual. 2006, 35, 1764–1778. [Google Scholar] [CrossRef]
- Prévost, M.; Plamondon, A.P.; Belleau, P. Effects of drainage of a forested peatland on water quality and quantity. J. Hydrol. 1999, 214, 130–143. [Google Scholar] [CrossRef]
- Iritz, L.; Johansson, B.; Lundin, L. Impacts of forest drainage on floods. Hydrol. Sci. J. 1994, 39, 637–661. [Google Scholar] [CrossRef] [Green Version]
- Amatya, D.M.; Skaggs, R.W. Long-term hydrology and water quality of a drained pine plantation in North Carolina. Trans. ASABE 2011, 54, 2087–2098. [Google Scholar] [CrossRef]
- Wesstrom, I.; Ekbohm, G.; Linner, H.; Messing, I. The effects of controlled drainage on subsurface outflow from level agricultural fields. Hydrol. Process. 2003, 17, 1525–1538. [Google Scholar] [CrossRef]
- Ketcheson, S.J.; Price, J.S. The impact of peatland restoration on the site hydrology of an abandoned block-cut bog. Wetlands 2011, 31, 1263–1274. [Google Scholar] [CrossRef]
- Shantz, M.A.; Price, J.S. Characterization of surface storage and runoff patterns following peatland restoration, Quebec, Canada. Hydrol. Process. 2006, 20, 3799–3814. [Google Scholar] [CrossRef]
- Wilson, L.; Wilson, J.; Holden, J.; Johnstone, I.; Armstrong, A.; Morris, M. Recovery of water tables in Welsh blanket bog after drain blocking: Discharge rates, time scales and the influence of local conditions. J. Hydrol. 2010, 391, 377–386. [Google Scholar] [CrossRef]
- Wilson, L.; Wilson, J.; Holden, J.; Johnstone, I.; Armstrong, A.; Morris, M. The impact of drain blocking on an upland blanket bog during storm and drought events, and the importance of sampling-scale. J. Hydrol. 2011, 404, 198–208. [Google Scholar] [CrossRef]
- Nachabe, M.H. Analytical expressions for transient specific yield and shallow water table drainage. Water Resour. Res. 2002, 38, 1193. [Google Scholar] [CrossRef]
- Amatya, D.M.; Skaggs, R.W.; Gregory, J.D. Effects of controlled drainage on the hydrology of drained pine plantations in the North Carolina coastal plain. J. Hydrol. 1996, 181, 211–232. [Google Scholar] [CrossRef]
- Harder, S.V.; Amatya, D.M.; Callahan, T.J.; Trettin, C.C.; Hakkila, J. Hydrology and water budget for a forested Atlantic coastal plain watershed, South Carolina. J. Am. Water Resour. Assoc. 2007, 43, 563–575. [Google Scholar] [CrossRef]
- Soylu, M.E.; Istanbulluoglu, E.; Lenters, J.D.; Wang, T. Quantifying the impact of groundwater depth on evapotranspiration in a semi-arid grassland region. Hydrol. Earth Syst. Sci. 2011, 15, 787–806. [Google Scholar] [CrossRef] [Green Version]
- Ridolfi, L.; D’Odorico, P.; Laio, F.; Tamea, S.; Rodriguez-Iturbe, I. Coupled stochastic dynamics of water table and soil moisture in bare soil conditions. Water Resour. Res. 2008, 44, W01435. [Google Scholar] [CrossRef]
- Vervoort, R.W.; Van Der Zee, S. Stochastic soil water dynamics of phreatophyte vegetation with dimorphic root systems. Water Resour. Res. 2009, 45, 13. [Google Scholar] [CrossRef]
- Acharya, S.; Jawitz, J.W.; Mylavarapu, R.S. Analytical expressions for drainable and fillable porosity of phreatic aquifers under vertical fluxes from evapotranspiration and recharge. Water Resour. Res. 2012, 48, W11526. [Google Scholar] [CrossRef]
- Laio, F.; Tamea, S.; Ridolfi, L.; D’Odorico, P.; Rodriguez-Iturbe, I. Ecohydrology of groundwater-dependent ecosystems: 1. Stochastic water table dynamics. Water Resour. Res. 2009, 45, W05419. [Google Scholar] [CrossRef]
- Nachabe, M.; Masek, C.; Obeysekera, J. Observations and modeling of profile soil water storage above a shallow water table. Soil Sci. Soc. Am. J. 2004, 68, 719–724. [Google Scholar] [CrossRef]
- Grünewald, U. Water resources management in river catchments influenced by lignite mining. Ecol. Eng. 2001, 17, 143–152. [Google Scholar] [CrossRef]
- Dietrich, O.; Redetzky, M.; Schwärzel, K. Wetlands with controlled drainage and sub-irrigation systems—Modelling of the water balance. Hydrol. Process. 2007, 21, 1814–1828. [Google Scholar] [CrossRef]
- HAD. Hydrological Atlas of Germany; Bundesanstalt für Gewässerkunde: Koblenz, Germany, 1998. [Google Scholar]
- BÜK300. Bodenübersichtskarte Brandenburg 1:300 000 (Soil Map Federal State of Brandenburg 1:300 000); Landesamt für Bergbau, Geologie und Rohstoffe Brandenburg: Kleinmachnow, Germany, 2007.
- Meissner, R.; Rupp, H.; Seyfarth, M. Advances in out door lysimeter techniques. Water Air Soil Pollut. Focus 2008, 8, 217–225. [Google Scholar] [CrossRef]
- Bethge-Steffens, D.; Meissner, R.; Rupp, H. Development and practical test of a weighable groundwater lysimeter for floodplain sites. J. Plant Nutr. Soil Sci. 2004, 167, 516–524. [Google Scholar] [CrossRef]
- Dietrich, O.; Fahle, M.; Seyfarth, M. Behavior of water balance components at sites with shallow groundwater tables: Possibilities and limitations of their simulation using different ways to control weighable groundwater lysimeters. Agric. Water Manag. 2016, 163, 75–89. [Google Scholar] [CrossRef]
- Allen, R.G.; Pereira, L.S.; Raes, D.; Smith, M. Crop Evapotranspiration: Guidelines for Computing Crop Water Requirements; FAO: Rome, Italy, 1998; pp. 1–300. [Google Scholar]
- Shah, N.; Ross, M. Variability in Specific Yield under Shallow Water Table Conditions. J. Hydrol. Eng. 2009, 14, 1290–1298. [Google Scholar] [CrossRef]
- Dietrich, O. Effects of Rainfall Events on the Water Storage Characteristic of a Shallow Water Table Site—Lysimeter Data; ZALF: Müncheberg, Germany, 2018. [Google Scholar] [CrossRef]
- Gribovszki, Z.; Szilágyi, J.; Kalicz, P. Diurnal fluctuations in shallow groundwater levels and streamflow rates and their interpretation—A review. J. Hydrol. 2010, 385, 371–383. [Google Scholar] [CrossRef]
- Bonaiti, G.; Borin, M. Efficiency of controlled drainage and subirrigation in reducing nitrogen losses from agricultural fields. Agric. Water Manag. 2010, 98, 343–352. [Google Scholar] [CrossRef]
- Childs, E.C. The Nonsteady State of the Water Table in Drained Land. J. Geophys. Res. 1960, 65, 780–782. [Google Scholar] [CrossRef]
- Dietrich, O.; Kaiser, T. Impact of groundwater regimes on water balance components of a site with a shallow water table. Ecohydrology 2017, 10, e1867. [Google Scholar] [CrossRef]
- Oswald, C.J.; Richardson, M.C.; Branfireun, B.A. Water storage dynamics and runoff response of a boreal Shield headwater catchment. Hydrol. Process. 2011, 25, 3042–3060. [Google Scholar] [CrossRef]
- Evans, M.G.; Burt, T.P.; Holden, J.; Adamson, J.K. Runoff generation and water table fluctuations in blanket peat: Evidence from UK data spanning the dry summer of 1995. J. Hydrol. 1999, 221, 141–160. [Google Scholar] [CrossRef]
- Proulx-McInnis, S.; St-Hilaire, A.; Rousseau, A.N.; Jutras, S.; Carrer, G.; Levrel, G. Seasonal and monthly hydrological budgets of a fen-dominated forested watershed, James Bay region, Quebec. Hydrol. Process. 2013, 27, 1365–1378. [Google Scholar] [CrossRef]
- Brauer, C.C.; Teuling, A.J.; Overeem, A.; Van Der Velde, Y.; Hazenberg, P.; Warmerdam, P.M.M.; Uijlenhoet, R. Anatomy of extraordinary rainfall and flash flood in a Dutch lowland catchment. Hydrol. Earth Syst. Sci. 2011, 15, 1991–2005. [Google Scholar] [CrossRef] [Green Version]
- Logsdon, S.D.; Schilling, K.E.; Hernandez-Ramirez, G.; Prueger, J.H.; Hatfield, J.L.; Sauer, T.J. Field estimation of specific yield in a central Iowa crop field. Hydrol. Process. 2010, 24, 1369–1377. [Google Scholar] [CrossRef]
Figure 1.
Map of the stream network of the Spreewald wetland with weirs (left), study site with ditches, small weirs and land use types (top right) and surface elevation of the study site with monitoring system consisting of groundwater observation wells, ditch gauges, lysimeter and weather station (bottom right).

Figure 2.
Illustration of variables determined for each rainfall event (WT—water table below surface, DWL—ditch water level (adjusted to surface elevation of WT measurement point), P—precipitation, R—cumulated outflow/inflow, S—water storage, t—time, Ly—lysimeter, Ref—reference station).
Figure 2.
Illustration of variables determined for each rainfall event (WT—water table below surface, DWL—ditch water level (adjusted to surface elevation of WT measurement point), P—precipitation, R—cumulated outflow/inflow, S—water storage, t—time, Ly—lysimeter, Ref—reference station).

Figure 3.
Hourly values of lysimeter mass corrected by precipitation and evapotranspiration (mLycorr) and water table (WT) for the selected drainage period in March 2012, regression curve representing the shape of the lysimeter’s water storage characteristic under quasi-equilibrium conditions (Seq) (left). Illustration of the calculation of different storage shares for a single precipitation event depending on the measured mLy and WT as well as calculated ΔSeq under quasi-equilibrium conditions (Equations (5) and (6)) at the times tstartP and tendR (right, ΔWT—change in water table, ΔS—measured water storage change, ΔSeq—calculated water storage change under quasi-equilibrium conditions, ΔSuz—replenishment of unsaturated zone without WT change, Duz—soil moisture depletion in the unsaturated zone, mLyeq is based on the regression curve of the left figure).

Figure 4.
Water levels of the transect of ditch and groundwater gauges for different drainage/sub-irrigation situations for selected dates (top) and as a time series (bottom).
Figure 4.
Water levels of the transect of ditch and groundwater gauges for different drainage/sub-irrigation situations for selected dates (top) and as a time series (bottom).

Figure 5.
Water budget (ETa—actual evapotranspiration, Rtot—runoff, ΔS—water storage change) for all selected rainfall events between start of precipitation and end of drainage (event ID above bar).
Figure 5.
Water budget (ETa—actual evapotranspiration, Rtot—runoff, ΔS—water storage change) for all selected rainfall events between start of precipitation and end of drainage (event ID above bar).

Figure 6.
Absolute mass of the lysimeter under quasi-equilibrium conditions (mLyeq = f(WT)) and under dynamic conditions at the beginning of the rainfall events (mLystartP) and at the end of runoff processes (mLyendR). The regression curve mLy is based on the data containing both mLystartP and mLyendR. The small grey dots are mean daily lysimeter mass on days not selected for this investigation (mLyall).

Figure 7.
Separation of ΔS into ΔSeq and ΔSuz for the rainfall events (event ID above bar).

Figure 8.
Comparison of runoff estimated under the assumption of quasi-equilibrium soil moisture conditions (Req) with the measured runoff Rtot in absolute values (left) and in relation to the precipitation of the rainfall event (right).
Figure 8.
Comparison of runoff estimated under the assumption of quasi-equilibrium soil moisture conditions (Req) with the measured runoff Rtot in absolute values (left) and in relation to the precipitation of the rainfall event (right).

Figure 9.
Comparison of the runoff estimation error due to the quasi-equilibrium assumption (ε) with the groundwater level (WTstartP, top left), depletion of the unsaturated zone at tstartP (Duz,startP, bottom left) and the ditch water table during ttot (ΔWLtot, top right). The relationship between the thickness of the unsaturated zone (WTstartP) and depletion of the unsaturated zone (Duz,startP) is shown at the bottom right. All correlations are significant (p > 0.01).


Table 1.
Average partitioning of P into water budget components ΔS, Rtot and ETa for the period Δttot.
Table 1.
Average partitioning of P into water budget components ΔS, Rtot and ETa for the period Δttot.
| Hydraulic Conditions at tstartP | ΔS/P | Rtot/P | ETa/P |
|---|---|---|---|
| All conditions | 69.2% | 8.3% | 22.5% |
| Sub-irrigation | 83.1% | 6.3% | 10.6% |
| Drainage | 51.3% | 12.6% | 36.1% |
Table 2.
Kendall’s τ between the ratios of the water budget components to P (ΔS/P, Rtot/P, ETa/P) and the boundary conditions during the evaluated periods. Values refer to the period Δttot or the time indicated (*: p > 0.05, **: p > 0.01).
Table 2.
Kendall’s τ between the ratios of the water budget components to P (ΔS/P, Rtot/P, ETa/P) and the boundary conditions during the evaluated periods. Values refer to the period Δttot or the time indicated (*: p > 0.05, **: p > 0.01).
| ΔS/P | Rtot/P | ETa/P | |
|---|---|---|---|
| ETp/ttot | −0.26 | 0.17 | 0.29 * |
| WTstartP | −0.49 ** | 0.25 | 0.52 ** |
| ΔWTDWLstartP | −0.41 ** | 0.27 * | 0.36 ** |
| Duz,startP | 0.46 ** | −0.36** | −0.42 ** |
| tP | −0.08 | 0.07 | 0.10 |
| tR | −0.58 ** | 0.37 ** | 0.53 ** |
| ttot | −0.42 ** | 0.24 | 0.43 ** |
© 2019 by the authors. Licensee MDPI, Basel, Switzerland. This article is an open access article distributed under the terms and conditions of the Creative Commons Attribution (CC BY) license (http://creativecommons.org/licenses/by/4.0/).
Share and Cite
MDPI and ACS Style
Dietrich, O.; Fahle, M.; Steidl, J. The Role of the Unsaturated Zone for Rainwater Retention and Runoff at a Drained Wetland Site. Water 2019, 11, 1404. https://doi.org/10.3390/w11071404
AMA Style
Dietrich O, Fahle M, Steidl J. The Role of the Unsaturated Zone for Rainwater Retention and Runoff at a Drained Wetland Site. Water. 2019; 11(7):1404. https://doi.org/10.3390/w11071404
Chicago/Turabian StyleDietrich, Ottfried, Marcus Fahle, and Jörg Steidl. 2019. "The Role of the Unsaturated Zone for Rainwater Retention and Runoff at a Drained Wetland Site" Water 11, no. 7: 1404. https://doi.org/10.3390/w11071404
Note that from the first issue of 2016, this journal uses article numbers instead of page numbers. See further details here.