Evapotranspiration and its Components in the Nile River Basin Based on Long-Term Satellite Assimilation Product
by
 , , and
Isaac Kwesi Nooni
1,2 ,
,
Guojie Wang
1,2,*, 
Daniel Fiifi T. Hagan
1,2 ,
,
Jiao Lu
1,2,
Waheed Ullah
1,2 and
Shijie Li
1,2 1
Collaborative Innovation Center on Forecast and Evaluation of Meteorological Disasters, Nanjing University of Information Science & Technology, Nanjing 210044, China
2
School of Geographical Sciences, Nanjing University of Information Science & Technology, Nanjing 210044, China
*
Author to whom correspondence should be addressed.
Water 2019, 11(7), 1400; https://doi.org/10.3390/w11071400
Submission received: 2 June 2019
/
Revised: 28 June 2019
/
Accepted: 5 July 2019
/
Published: 8 July 2019
(This article belongs to the Section Hydrology)
Abstract
:Actual evapotranspiration (ET) and its individual components’ contributions to the water–energy nexus provide insights into our hydrological cycle in a changing climate. Based on long-term satellite ET data assimilated by the Global Land Evaporation Amsterdam Model (GLEAM), we analyzed changes in ET and its components over the Nile River Basin from 1980 to 2014. The results show a multi-year mean ET of 518 mm·year–1. The long-term ET trend showed a decline at a rate of 18.8 mm·year–10. ET and its components showed strong seasonality and the ET components’ contribution to total ET varied in space and time. ET and its components decreased in humid regions, which was related to precipitation deficits. ET increases in arid-semiarid regions were due to water availability from crop irrigation fields in the Nile Plain. Precipitation was the dominant limiting driver of ET in the region. Vegetation transpiration (an average of 78.1% of total ET) dominated the basin’s water fluxes, suggesting biological fluxes play a role in the regional water cycle’s response to climate change. This analysis furthers our understanding of the water dynamics in the region and may significantly improve our knowledge of future hydrological modelling.
1. Introduction
Terrestrial evapotranspiration (ET) is water transferred from the land surface to the atmosphere. ET is an essential process that regulates the terrestrial water budget and surface energy exchanges. ET, as a climate change variable, accounts for nearly 60% of global land precipitation (P) and uses up to 50% of all net radiation (Rn) available on land [1]. Therefore, in a changing climate, understanding the contribution of trends and changing patterns in water and energy supply to ET is important for efficient water resource management [2]. However, actual information about ET is not fully understood in the global hydrological cycle because terrestrial ET is highly variable in space and time and is possibly the most difficult and complicated component to measure in the hydrological cycle [3]. The ability to quantify and accurately predict ET variability and its possible causes would provide a valuable contribution to water resource planning and irrigation development, particularly in water-scarce basins, and may further our knowledge of global and regional climate change impacts on the terrestrial water–energy nexus.
Estimating land ET and its components can be computed using many different methods. Most studies and reviews have focused on trends in pan evaporation, empirical equations, and land models [1,4,5]. However, these methods have some inherent limitations and the most common issues raised in the literature are as follows: though the interpretation of pan evaporation is indirectly related to actual ET, this indirect method fails to consider or ignores biophysical mechanisms that influence ET. Land surface models (LSMs) and empirical calculations have been developed to resolve this limitation. However, LSMs produce uncertainties that are difficult to quantify [6,7]. In most cases, these uncertainties degrade the quality of the models for water resources planning, particularly in regions where inconsistent monitoring and measuring direct observation data tend to conflict with hypotheses relating to the main drivers of ET and the direction of trends [8,9,10,11]. It is therefore useful and important to consider an approach that can fill these gaps, especially in water-scarce basins with huge agricultural and hydropower potential.
Remote sensing technology provides another valuable tool to produce ET estimates on different temporal and spatial scales [1]. The Global Land Evaporation Amsterdam Model for ET (GLEAM ET) has been developed based on remote sensing dataset inputs. The following references provide in-depth information about GLEAM products [3,12,13,14]. Numerous benefits in terms of added value exist when using long-term GLEAM products to evaluate the critical role ET plays in ecological and hydrological processes. The first benefit is that the GLEAM product provides long-term direct estimates of actual global ET compared to other previous remote sensing products [12,13,14]. The second benefit is that GLEAM products include individual ET components that can be used to identify and quantify the general characteristic of each component’s variability on different time scales (i.e., from diurnal, seasonal, and annual to interdecadal). The third benefit is that GLEAM, apart from using surface soil moisture and multiple sources of precipitation data to constrain atmospheric demand, includes vegetation optical depth (VOD). The VOD determines both green and non-green vegetation constraints on evaporation and important complementary information on the state and temporal variabilities of vegetation features, in particular regarding aboveground biomass (AGB) dynamics [3,12,13,14,15,16].
This is not the case for some previous remote sensing products which used normalized difference vegetation index (NDVI) as a proxy to determine vegetation dynamics, an approach that is affected by saturation effects in greener parts of dry and semi-arid areas where vegetation is sensitive to interannual P variations [17,18]. This is of valuable interest to improve our understanding of interannual variabilities of ET. GLEAM products are not only used to study the climate but also to investigate which factors drive trends in ET and its components under a wide range of eco-climatic regions on a regional scale (but with global implications). As Teuling et al. [19] have suggested, regional trends in ET are most likely induced by trends in the limiting driver.
Jung et al. [20] have demonstrated that the increase in ET trends in the Northern Hemisphere (HM) and subsequent declines in the Southern Hemisphere (SM) highlight the need for a rigorous evaluation of the terrestrial ET at basin scales, especially for basins that straddle the equator as a large positive (negative) effect for HM (SM) may offset many small negative (positive) effects that occur in SM (HM), thereby influencing the overall combined effects that may alter the signs of trends.
The Nile River Basin, in terms of water resources, is one of the most important water sources serving 11 riparian countries in Africa. The basin supplies water to 25% of Africa’s population, sustains functions of biodiversity and other biomes such as the Sudd (tropical wetland) and the Nile Delta, and provides water to sustain industries, agriculture, navigation, tourism, and hydropower production. The changing surface water balance, as a result of the changing climate, impacts the amount of water available for human use and to maintain the basin’s hydrologic processes [21,22,23]. Such changes have profound implications in the Nile Basin, which is already suffering from water deficits, high population growth, and uncontrolled land use changes [22,24,25].
Reports show that high uncertainty surrounding water resources availability has intensified tension among some Nile countries [26]. This makes water a limited resource in the region, and, by extension, affects agricultural production, challenges socio-economic systems, and threatens environmental sustainability. Thus, it is necessary to explore the magnitude, variability, and trends in GLEAM ET and its components in the Nile Basin, which has huge agricultural and hydropower potential.
We focused on GLEAM ET and its components’ effects on trends in solar radiation, precipitation, and vegetation cover. Previous literature that has analyzed the interaction of regional land surface climate and ET in the Nile Basin has focused on the link between climate, vegetation, and terrestrial ET but has not included the contribution and trends of individual ET components. Most findings were based on short-term datasets from remote sensing or surface climate reanalysis sources, which, due to differences in methodologies and lengths of study periods, should be interpreted cautiously [8,24,27,28,29]. We thus conducted a basin-wide analysis of this relationship with long-term remote sensing data of ET and its components, which had remained unexplored in the Nile River Basin. Here, long-term GLEAM ET over the period 1980–2014 was used to achieve the following objectives: (1) to quantify and analyze long-term variations in ET and its components in the Nile Basin and (2) to investigate the main controlling driver(s) of ET and its components. To the best of our knowledge, little information is available on the estimates of ET components and their contributions to terrestrial ET in this region [8,24,28]. Also, the influence of the driving factors to changes in total ET over the Nile Basin is still being explored.
2. Materials and Methods
2.1. Study Area: The Nile River Basin
The Nile River Basin (4°0’0” S–35°0’0” N, 23°0’0” E–40°0’0” E), located in Northeastern Africa, is a major river basin, drained by the longest river in the world, which is about 6853 km long. It has a total drainage area of 2.9 × 10⁶ km2 and is home to almost one-quarter of Africa’s current population [30]. The basin is divided into eight climate zones according to the Köppen climate classification system [31]. Two major tributaries, the White Nile (sourced from the equatorial lakes) and the Blue Nile (sourced from the Ethiopia Highlands), join at Kharthoum in Sudan and flow northward through the desert to form the Nile Delta in Egypt before discharging into the Mediterranean Sea.
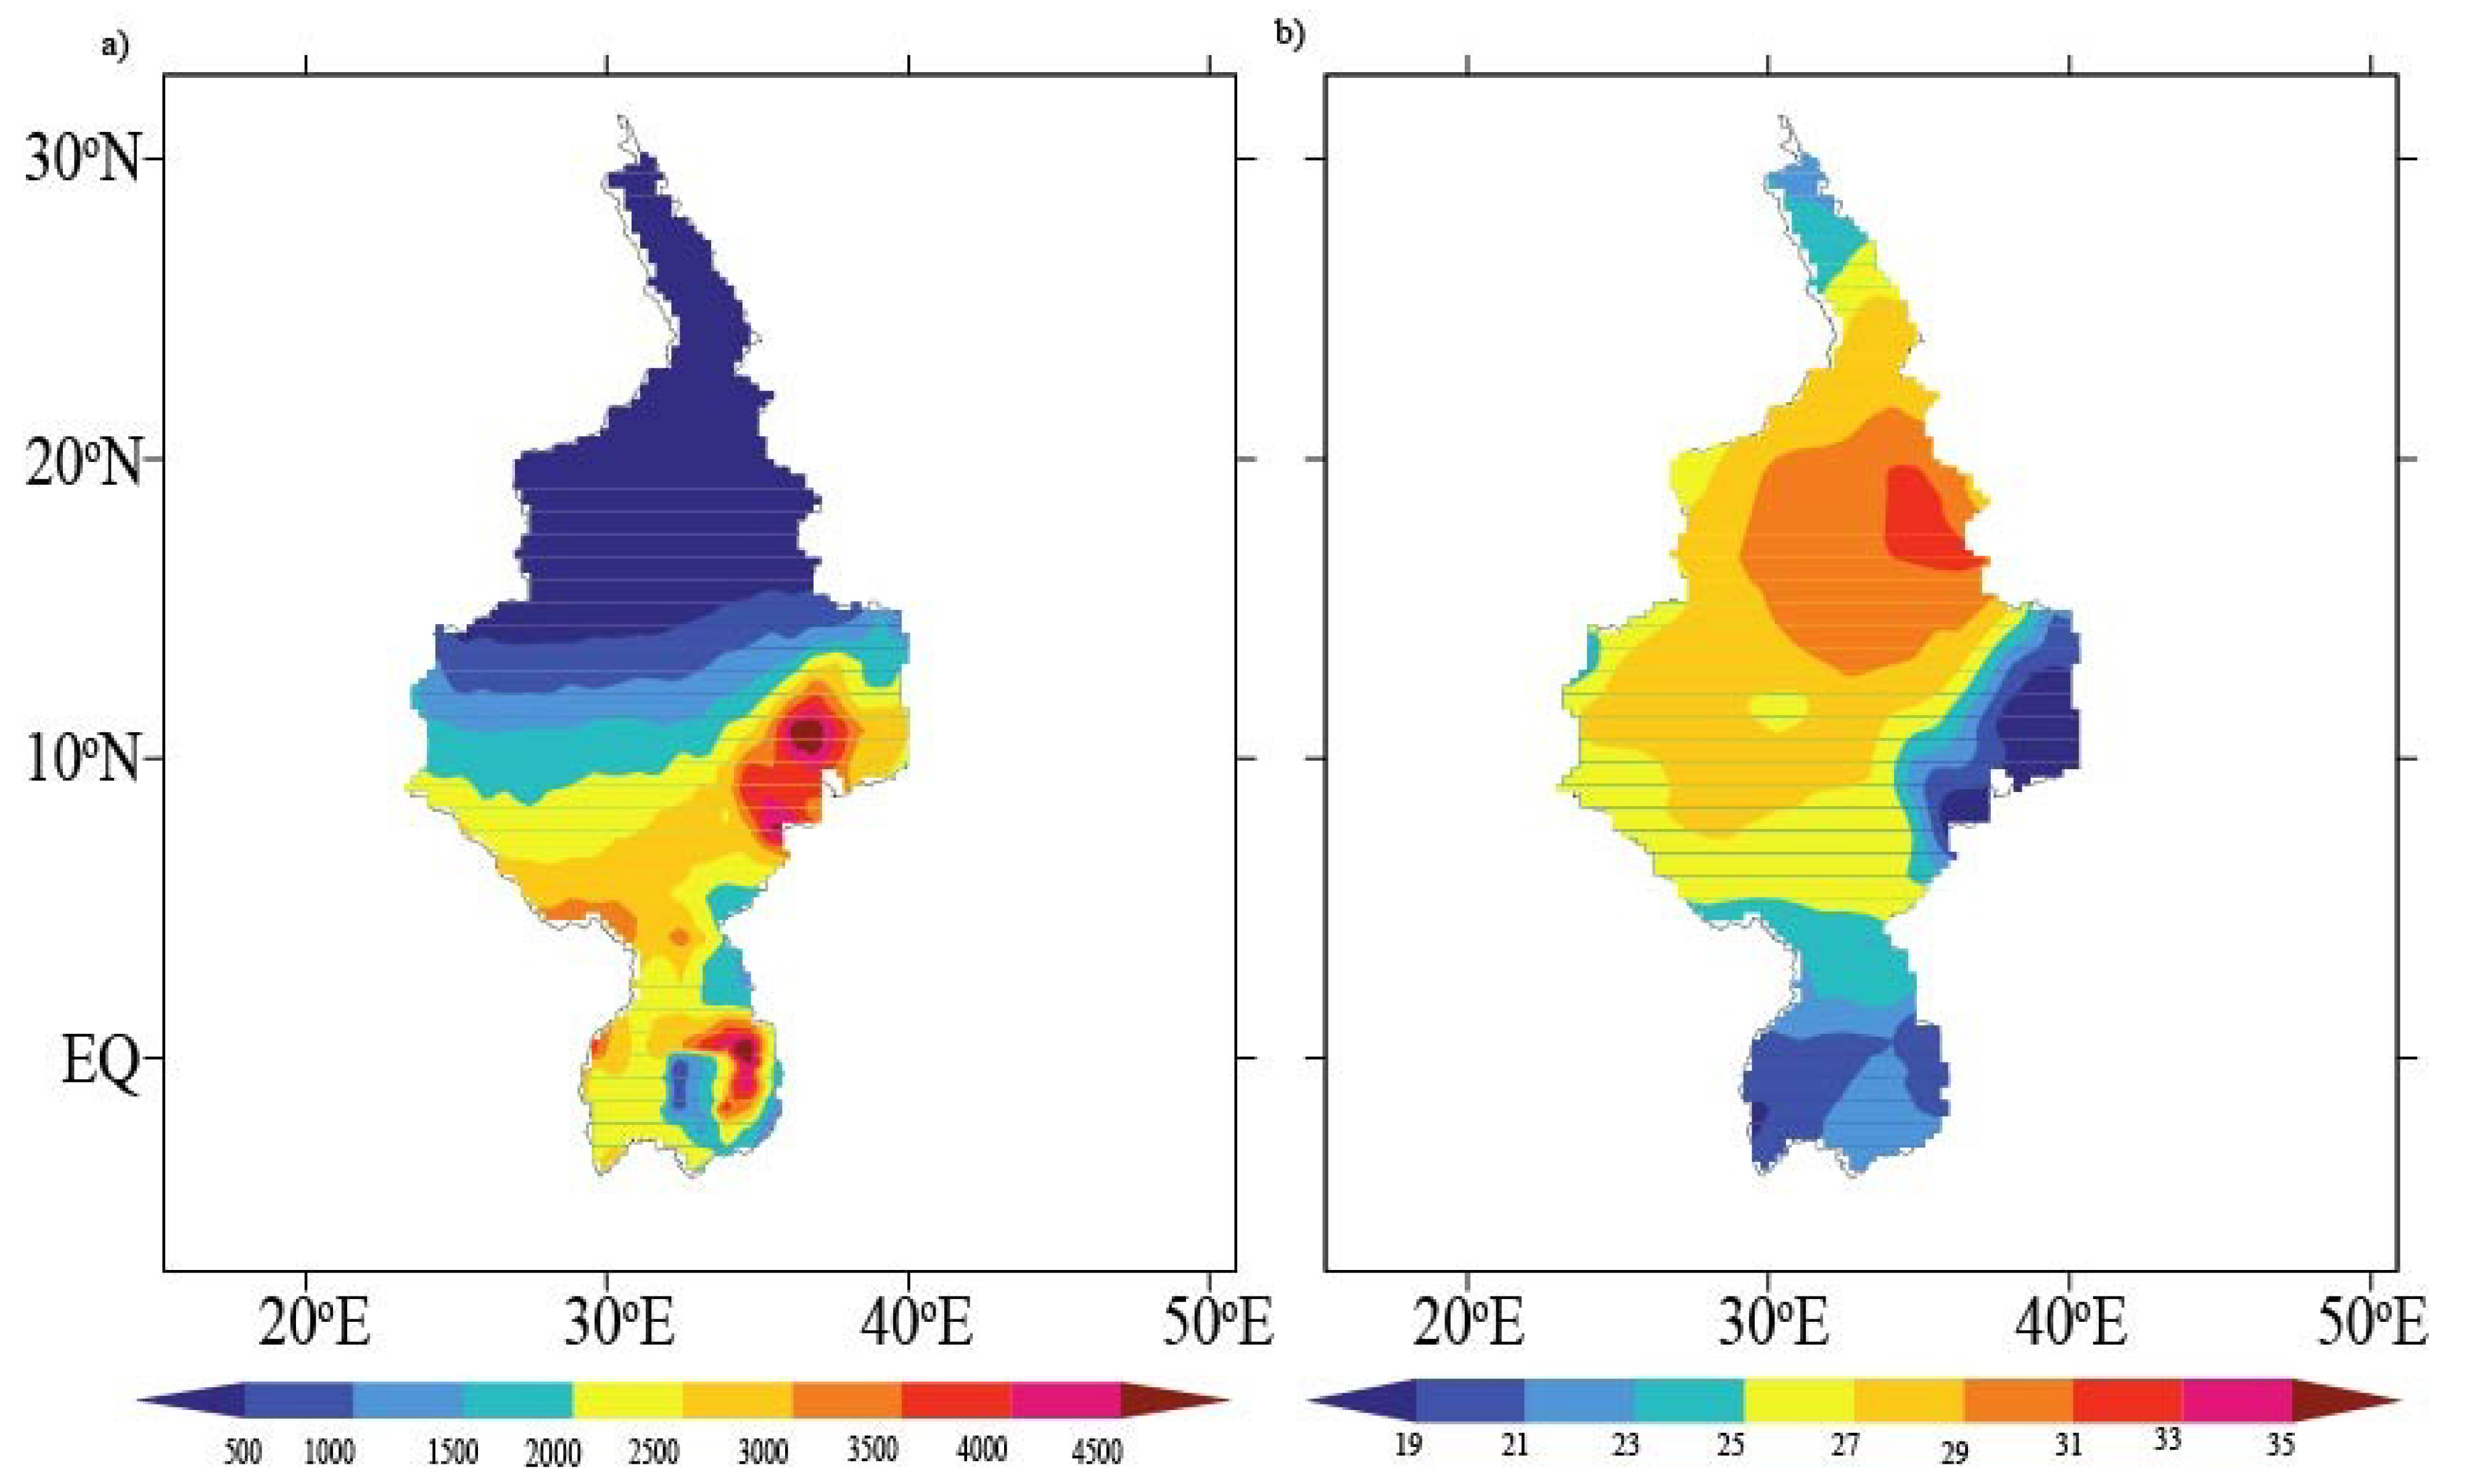
Based on European Center for Medium-Range Weather Forecasts (ECMWF) reanalysis (ERA-40 precipitation and temperature) datasets from 1980–2014, the average annual precipitation for this period was 500 mm and the mean annual temperature was 27 °C. However, due to the oscillation of the inter-tropical convergence zone (ITCZ), the amount, duration, and intensity of rainfall in the basin vary significantly (2000–4500 mm year−1 in the equatorial region and the Ethiopian highlands and ≤100 mm in the Saharan desert) (Figure A1). The geography of the Nile basin may be divided into three reaches based on latitudinal extent: the upper reach (4°0’0” S–5°0’0” N), the middle reach (5°0’0” N–15°0’0” N), and the lower reach (15°0’0” N–32°0’0” N) [32].
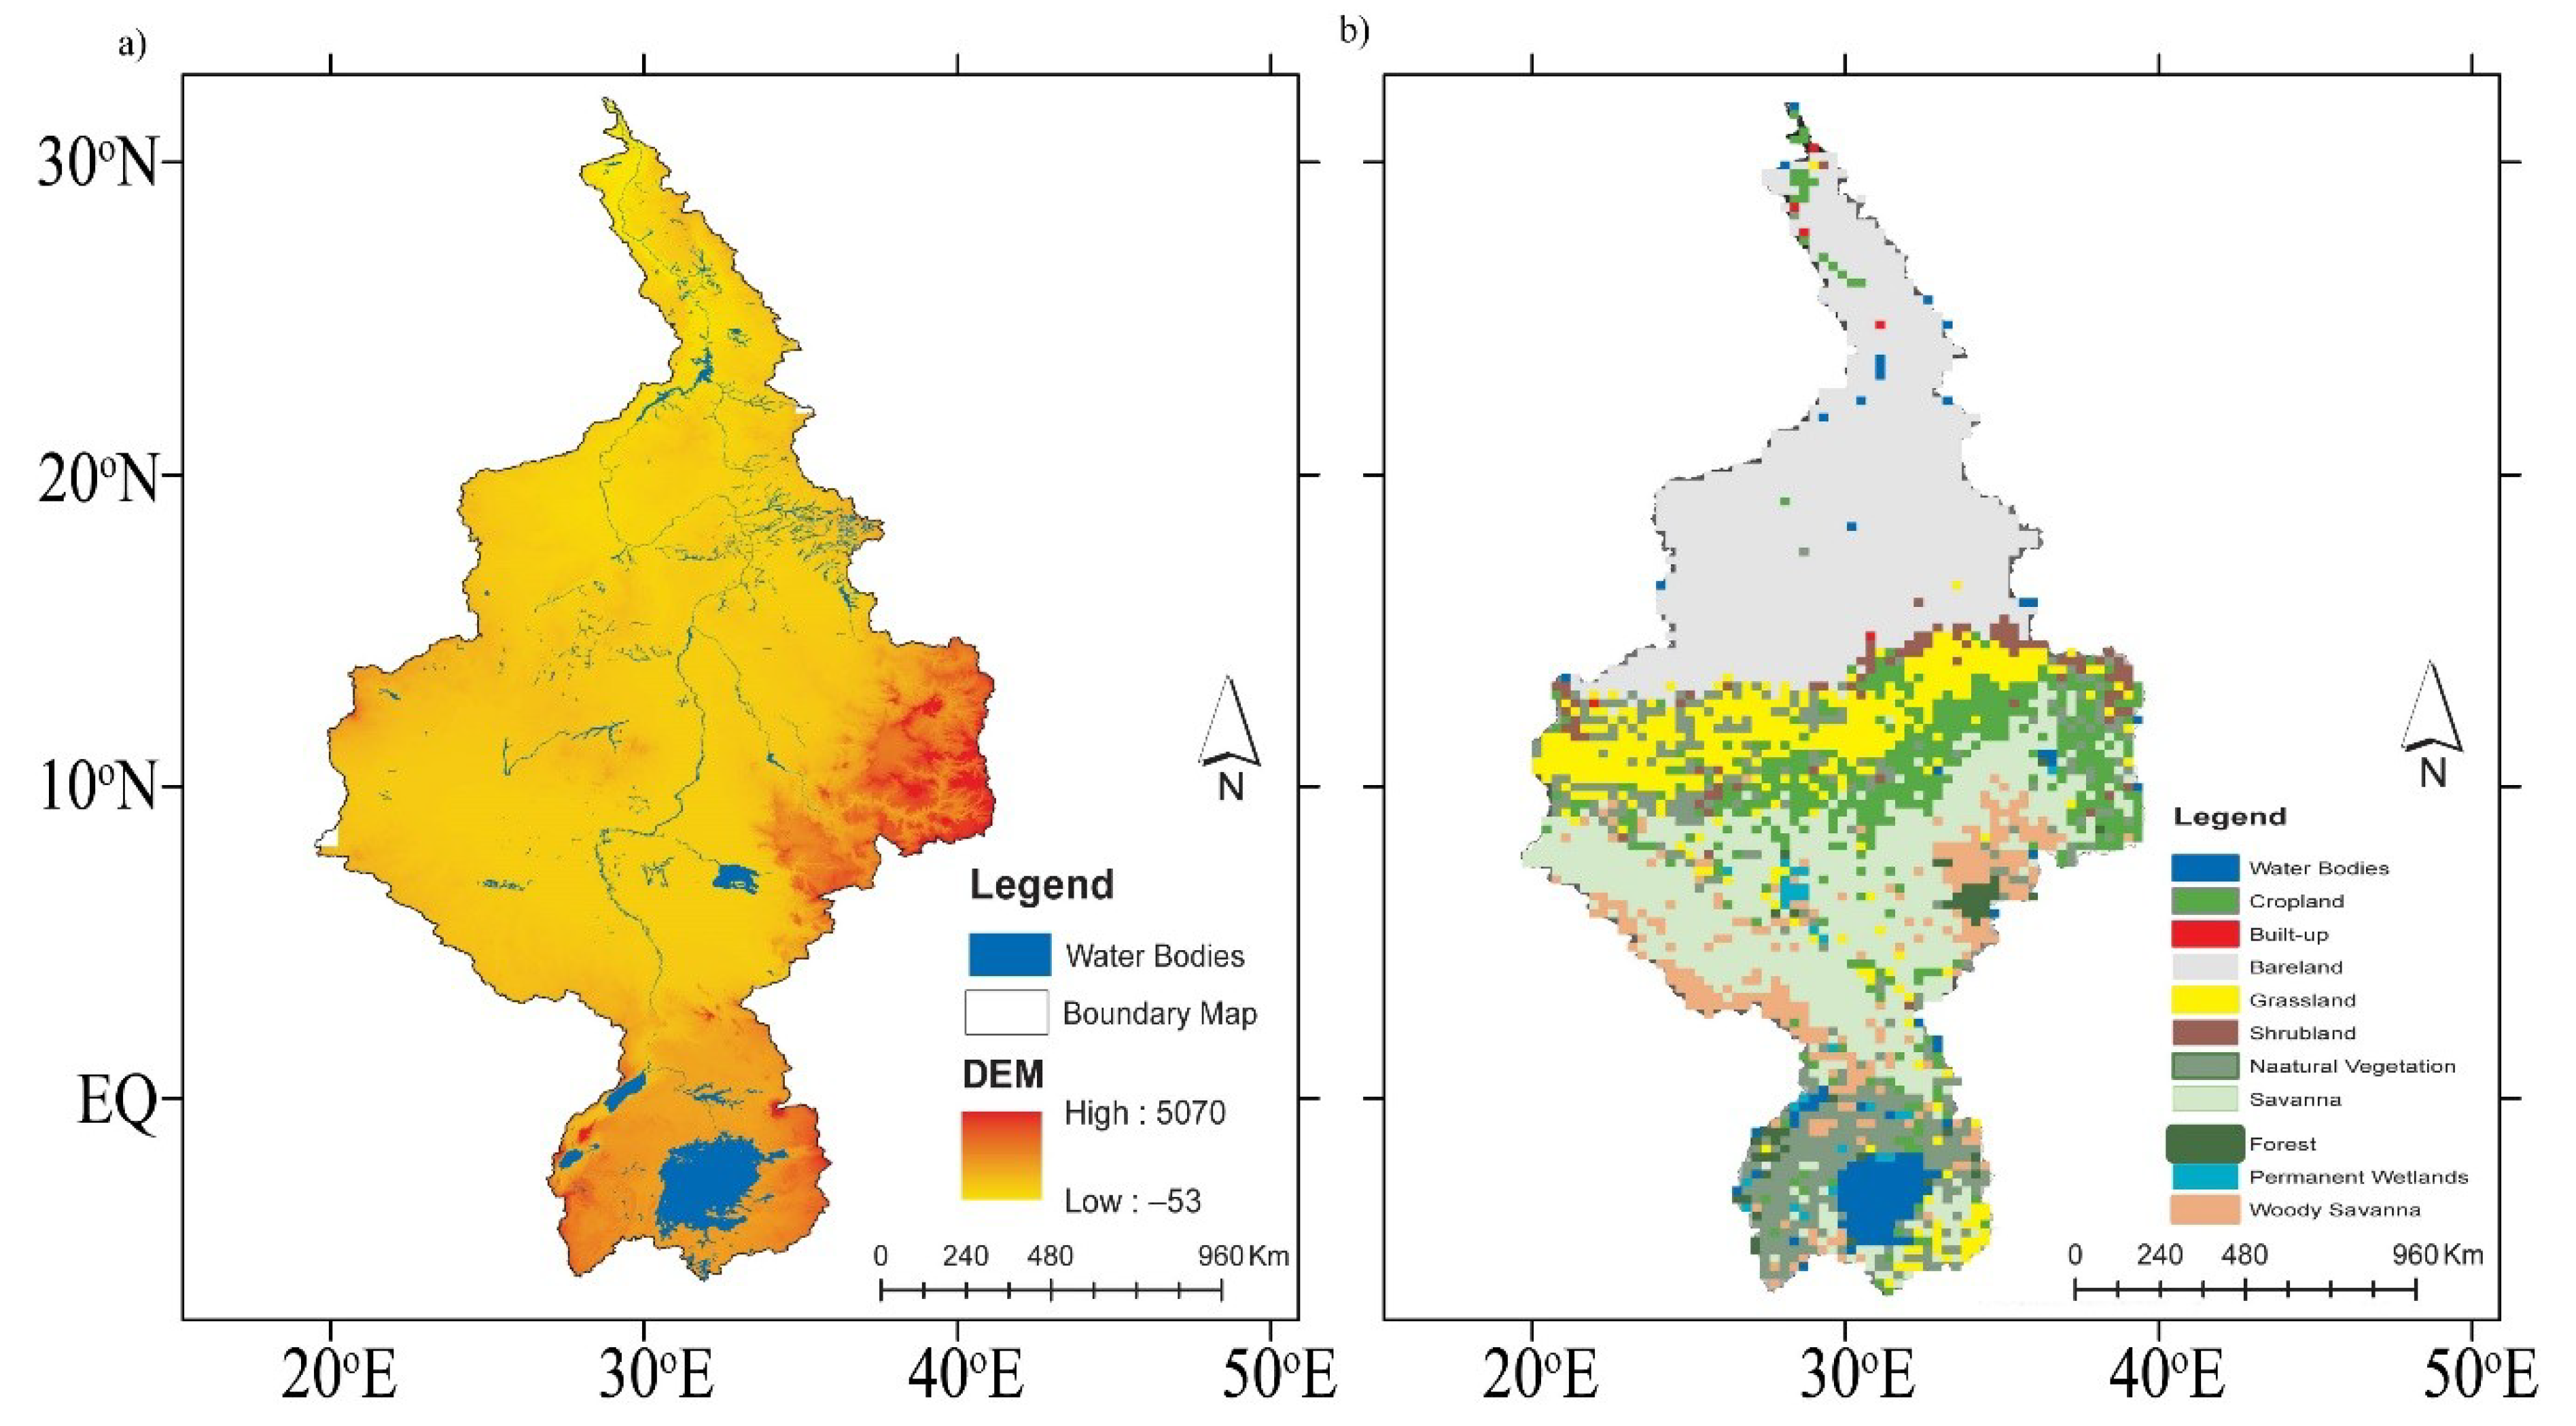
The lower reach is characterized by vast flood plains along the Nile Delta, whereas the upper and part of the middle reach are mountain ranges from east to west and south with river valleys interleaved. The highest point in the Nile River Basin is the Ethiopian highlands, with an altitude of 5070 m (Figure 1a). The predominant landcover types are shown in Figure 1b.
2.2. Data Description
2.2.1. GLEAM Data
GLEAM has a daily, quasi-global (50° N–S and 180° W–E) basis [12,13,14]. The GLEAM dataset has been rigorously validated and the estimates were found to correlate well with in situ stations’ annual cumulative evaporation data [14]. Despite some reported regional differences in the GLEAM ET estimations owing to the sparse network of in situ stations’ data during the validation process, GLEAM has been found to effectively quantify actual ET and its components in various regions across the globe [13,14].
GLEAM differentiates between bare soil evaporation (Eb), transpiration from short and tall vegetation (Et), snow sublimation (Es), open-water evaporation (Ew), and interception loss (Ei) from tall vegetation. Ei is independently calculated based on the Gash analytical model using observations of P [34,35]. The components of ET are based on a formulation made by Priestley and Taylor [36]. The version of the GLEAM dataset used in this study (GLEAM_v3.1a) has a daily temporal resolution of 35 years and is gridded at a spatial resolution of 0.25°, and was acquired from the GLEAM website [12,13,37].
2.2.2. ECMWF Reanalysis Datasets
Gridded daily ECMWF reanalysis (ERA-interim) P and Rn data aggregated at 0.25 × 0.25° latitude/longitude resolution provided by the European Center for Medium-Range Weather Forecasts (ECMWF) were acquired. We used the data to investigate the important role these variables play in regulating ET on diurnal to interannual time scales across the Nile Basin. The ERA-interim is a global atmospheric reanalysis product available from 1979 to the present and can be downloaded from the ECMWF website [38]. The full description of the model and assimilation system is available online on the ECMWF website. The detailed P and Rn data estimation procedure, data usage, and quality control have been described by Uppala et al. [39] and Dee et al. [40], respectively. Daily P and Rn data were obtained for the period of 1980 to 2014 and aggregated to monthly and annual values.
2.2.3. FLUXNET Data
FLUXNET provides continuous measurements of carbon and water flux data for many parts of the world and can be obtained from the FLUXNET website [41]. We retrieved the Level 4 measured daily time series of latent heat flux (LE) data from three sparsely distributed AFRIFLUX eddy covariance tower sites situated in the study area and operated in an open path eddy covariance system (Table 1). Note that two of the sites located outside of the Nile Basin boundary were included because of the local similarity in vegetation types and climate. A similar approach was used by Li et al. due to an insufficient number of sites [42].
The sites are equipped with similar eddy covariance equipment. Details about the instrumentation for each site are provided in the literature [42,43,44,45,46]. T and P denote mean annual near surface temperature and mean annual precipitation, respectively. Due to the different horizontal resolutions of the GLEAM ET and the FLUXNET datasets, we completed a coordinate matching process for each tower station using their recorded date and Universal Transverse Mercator (UTM) coordinates of each tower station to select the appropriate intersection point. We then compared each intersection point with the location coordinates of the GLEAM datasets. Then, we chose the closest intersection point when an intersection point overlaid the latitude-longitude 0.25° × 0.25° quadrangle.
2.2.4. Supplementary Data
The International Geosphere-Biosphere Program (IGBP) 16-class Moderate Resolution Imaging Spectroradiometer (MODIS) Type 3 global land cover map available at a 0.05° resolution was masked with the Nile Basin shapefile to obtain the Nile Basin land cover map (Figure 1b) [33]. The 16-class land cover map was aggregated into four predominant vegetation types, namely, forest (8%), savanna (36.8%), cropland (7.5%), and grassland (13.5%), and resampled to 0.25° resolution for the purpose of this study. The data were downloaded from the National Aeronautical and Space Agency (NASA) webpage [47]. The four different vegetation types cover about 66% of the total land area of the basin. Although the basin has experienced significantly intensive human interference over the last 35 years, the MODIS 2000 land cover product was used to represent the average vegetation condition for the whole time period.
The study obtained the 30 m Shuttle Radar Topography Mission (SRTM) digital elevation map (DEM) downloaded from the NASA (SRTM)/website [48]. NASA (SRTM) datasets have resulted from a collaborative effort by NASA and the National Geospatial-Intelligence Agency (NGA) as well as German and Italian space agencies. The SRTM DEM mission was launched February 11, 2000 and flew for 11 days over the earth landmass between 60° N and 56° S latitude. For detailed information visit NASA (SRTM).
2.3. Methods
2.3.1. Calculation of Tower ET
Each site measures latent heat (water vapor) fluxes by eddy covariance (EC) in half-hourly intervals all year round. The half-hourly flux data were aggregated by us into daily, monthly, and annual sets. For each site, we estimated the ET from the tower-measured LE based on the equation
where λ is the latent heat of vaporization (2.43 × 10⁶ J·kg−1). Only sites with at least one year of continuous flux measurements were used in this study (Table 1).
2.3.2. GLEAM Data Evaluation Techniques
To evaluate GLEAM ET, we used FLUXNET data from three sites within/near the Nile Basin (Table 1). Four commonly used performance indicators, the coefficient of determination (R2), bias (mm·month−1), the BIAS, the (MAE), and the root mean square error (RMSE, mm·month−1) in Equations (2)–(5), mean absolute error respectively, were used in the evaluation. The root mean square difference (RMSD), BIAS, and MAE describe biases and errors, and were here used to quantify the differences between the two datasets. R2 describes the degree of collinearity between the reference FLUXNET ET data and GLEAM ET product. R2 describes the agreement between two datasets.
where n represents the number of months of each site period and Gi and Fi represent the monthly GLEAM ET product and the FLUXNET ET data at time i, respectively.
2.3.3. Mann–Kendall Trend Test
Trends in ET and its components were calculated using the Mann–Kendall (τ) nonparametric technique. This approach is widely used for hydro-meteorological time series [11]. The tests were calculated based on Equations (6)–(8).
where S is the rating score (called the Mann–Kendall sum), x is the data value, i and j are counters, n represents the number of data values in the series, and sgn is a function shown in Equation (7). A positive value of S indicates an increasing trend, and a negative value indicates a decreasing trend.
The variance is calculated as
S is standardized as shown in Equation (8) by subtracting its expectation (zero) divided by its standard deviation ().
where signifies that the time series data show a significant trend. A positive (negative) value denotes a significant increasing (decreasing) trend; is the significance level. We set the significance level to 0.05, corresponding to . Thus, when the time series data produce there is a significantly increasing or decreasing trend.
2.3.4. Theil–Sen Formula Slope
We used the Theil–Sen formula, a non-parametric method, to estimate and characterize the linear trend slopes of annual ET and its components [49]. This approach is popular and unaffected by outliers or extreme values (Equation (8)).
where is the slope between two data points in the time series, median is a function, and xj and xk are the data values for time points j and k (j > k), respectively. If > 0, the trend is increasing; if < 0, the trend is decreasing.
Pearson correlation coefficients (R2) (Equation (2)) and partial correlation coefficients (r2) (Equation (10)) were used examine the neutralized effects of either P or Rn on ET and its components:
3. Results
3.1. Validation of GLEAM ET
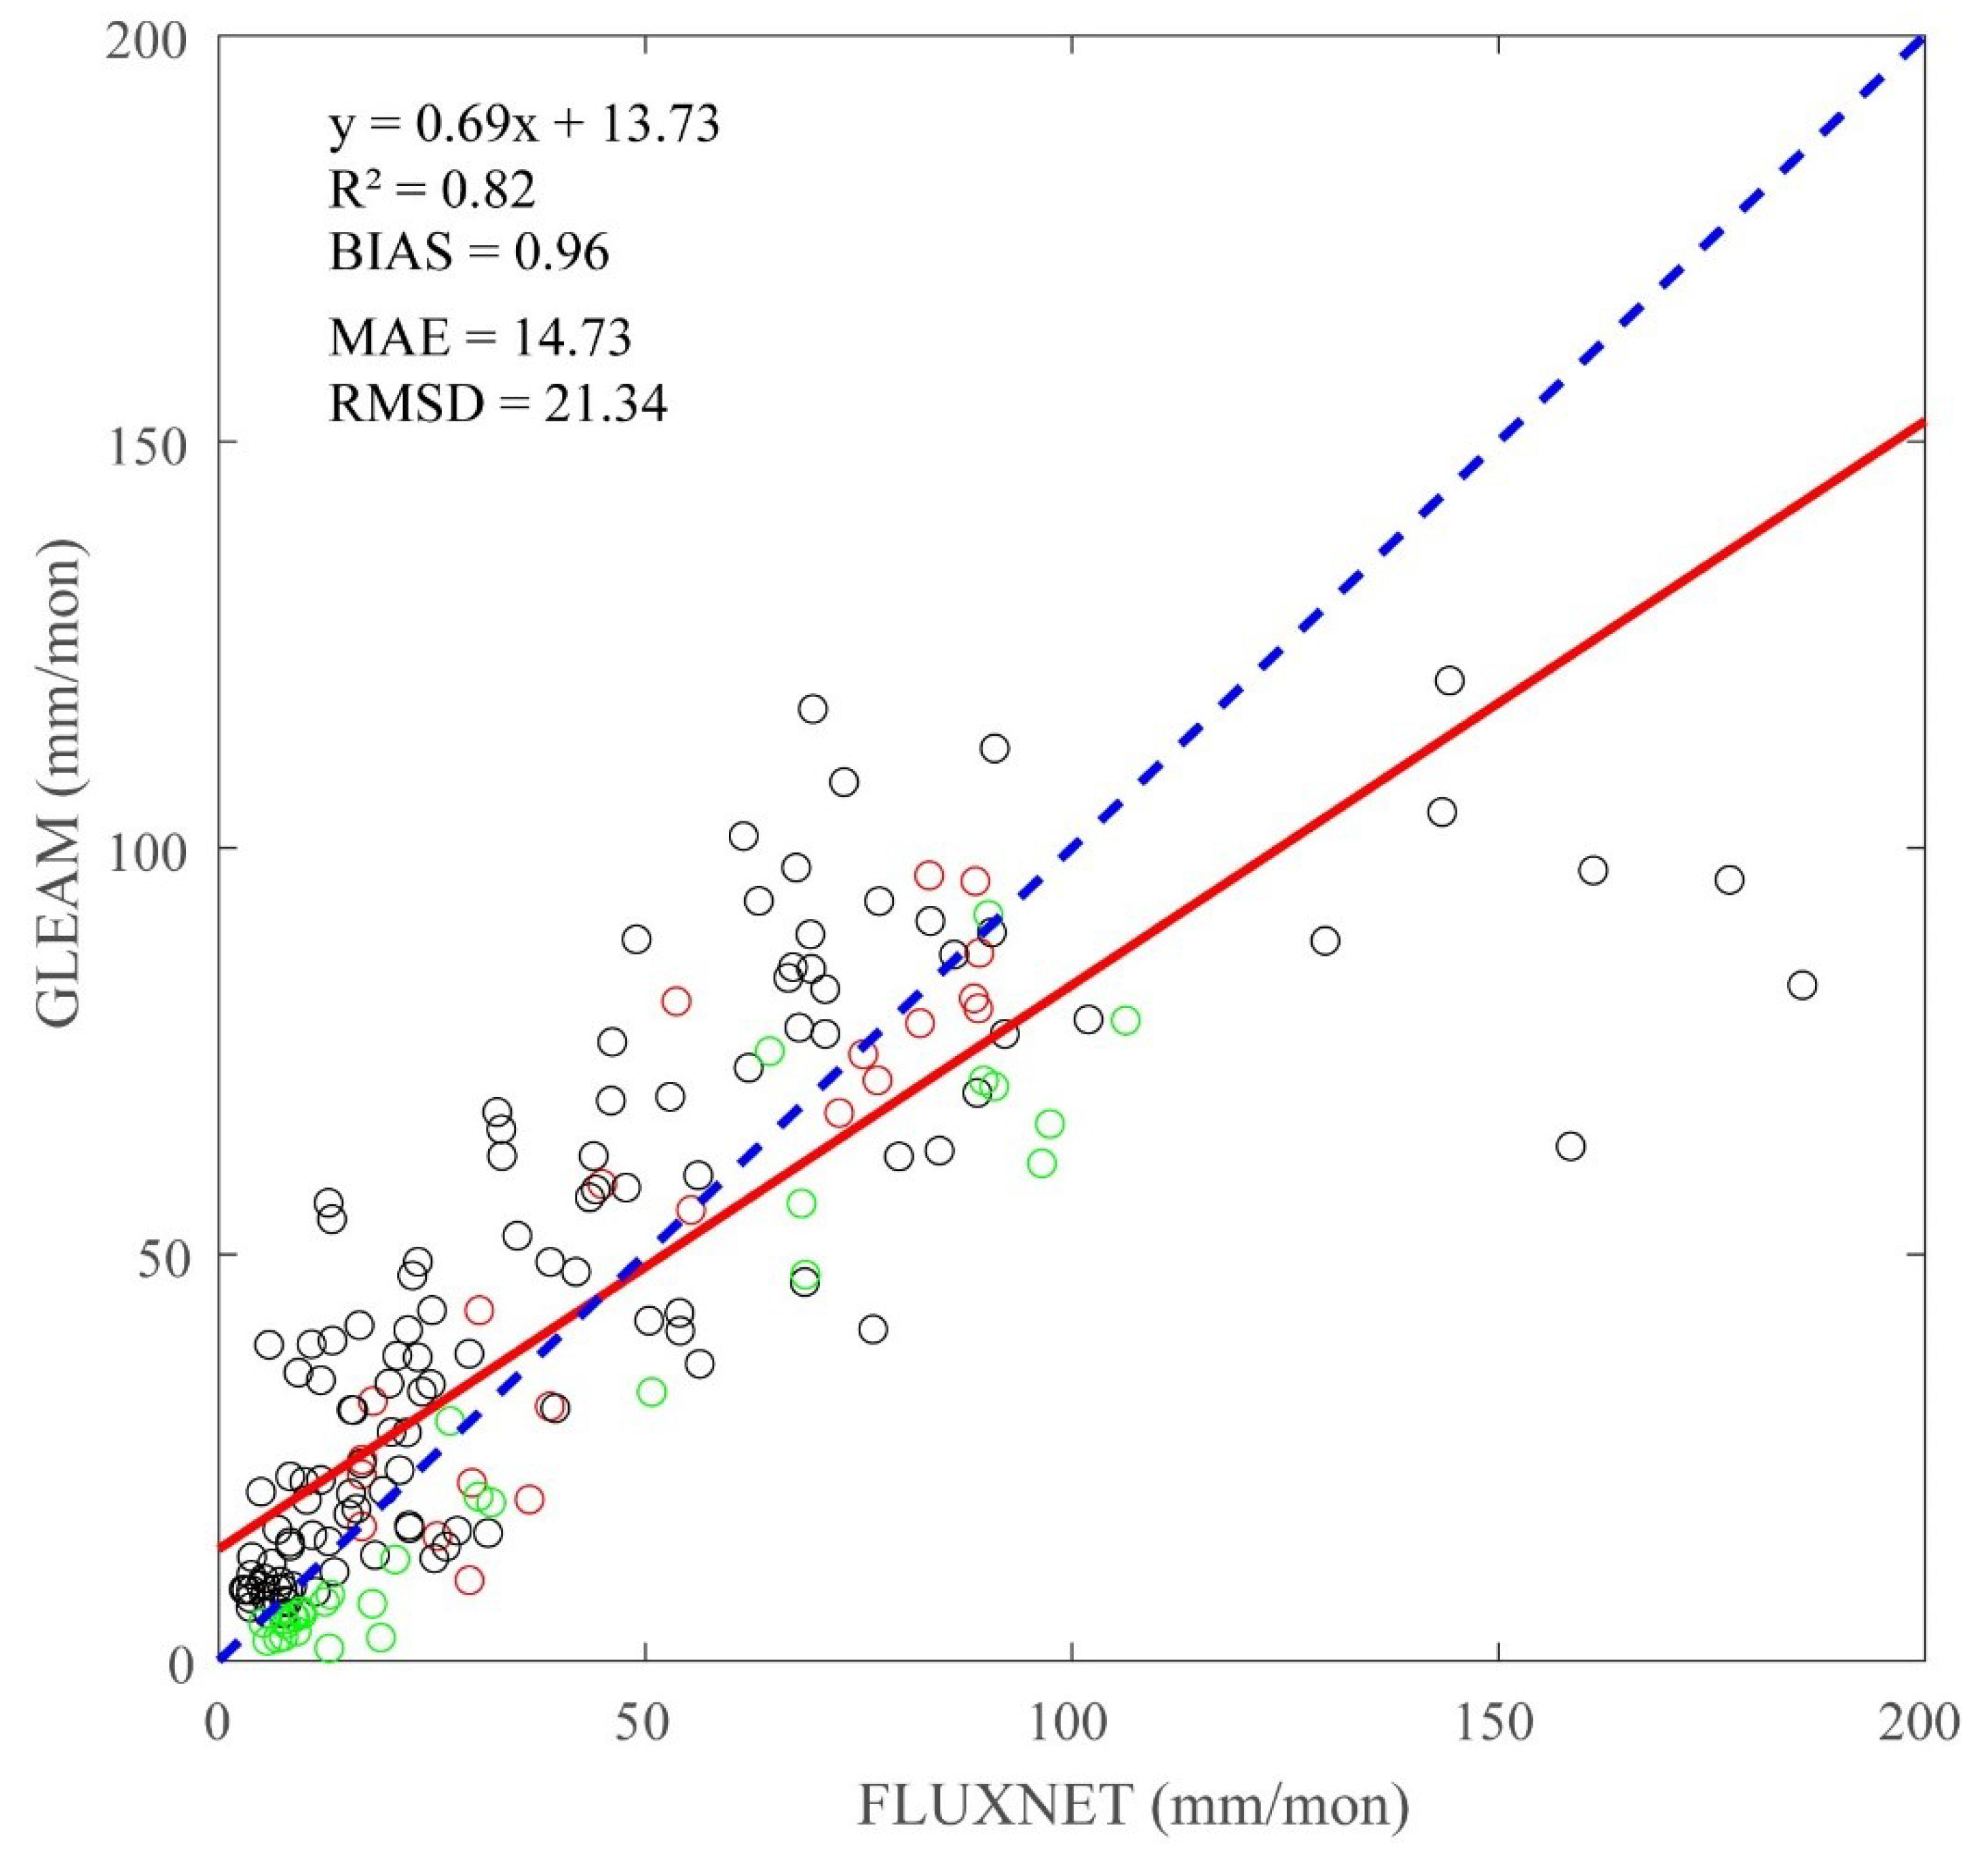
We used FLUXNET as a reference dataset to evaluate the GLEAM ET values. The daily values of GLEAM ET and the daily FLUXNET ET observations at the three flux tower sites were aggregated into monthly averages before evaluation. Due to unavailability of a runoff dataset (at the time of this study) and the extremely low number of FLUXNET sites in the study region, two FLUXNET sites located in Zambia and South Africa were selected based on their similarity in climate and vegetation characteristics. Selecting these two FLUXNET sites allowed us to use reliable, consistent, and relatively long-term FLUXNET ET data to evaluate the GLEAM ET estimates. For this purpose, data of unequal lengths at the three sites were used for the metric performance test. Figure 2 shows a significantly positive linear trend (y = 0.69x + 13.73) between GLEAM ET and FLUXNET ET. Our validation results indicate that GLEAM ET accuracy is reasonable (R2 = 0.82 and RMSD = 21.33 mm·year−1), despite slight overestimations (MAE, 14.73 mm·year−1 and BIAS, 0.96 mm·year−1).
3.2. Variations in Land ET
3.2.1. Seasonal Variations
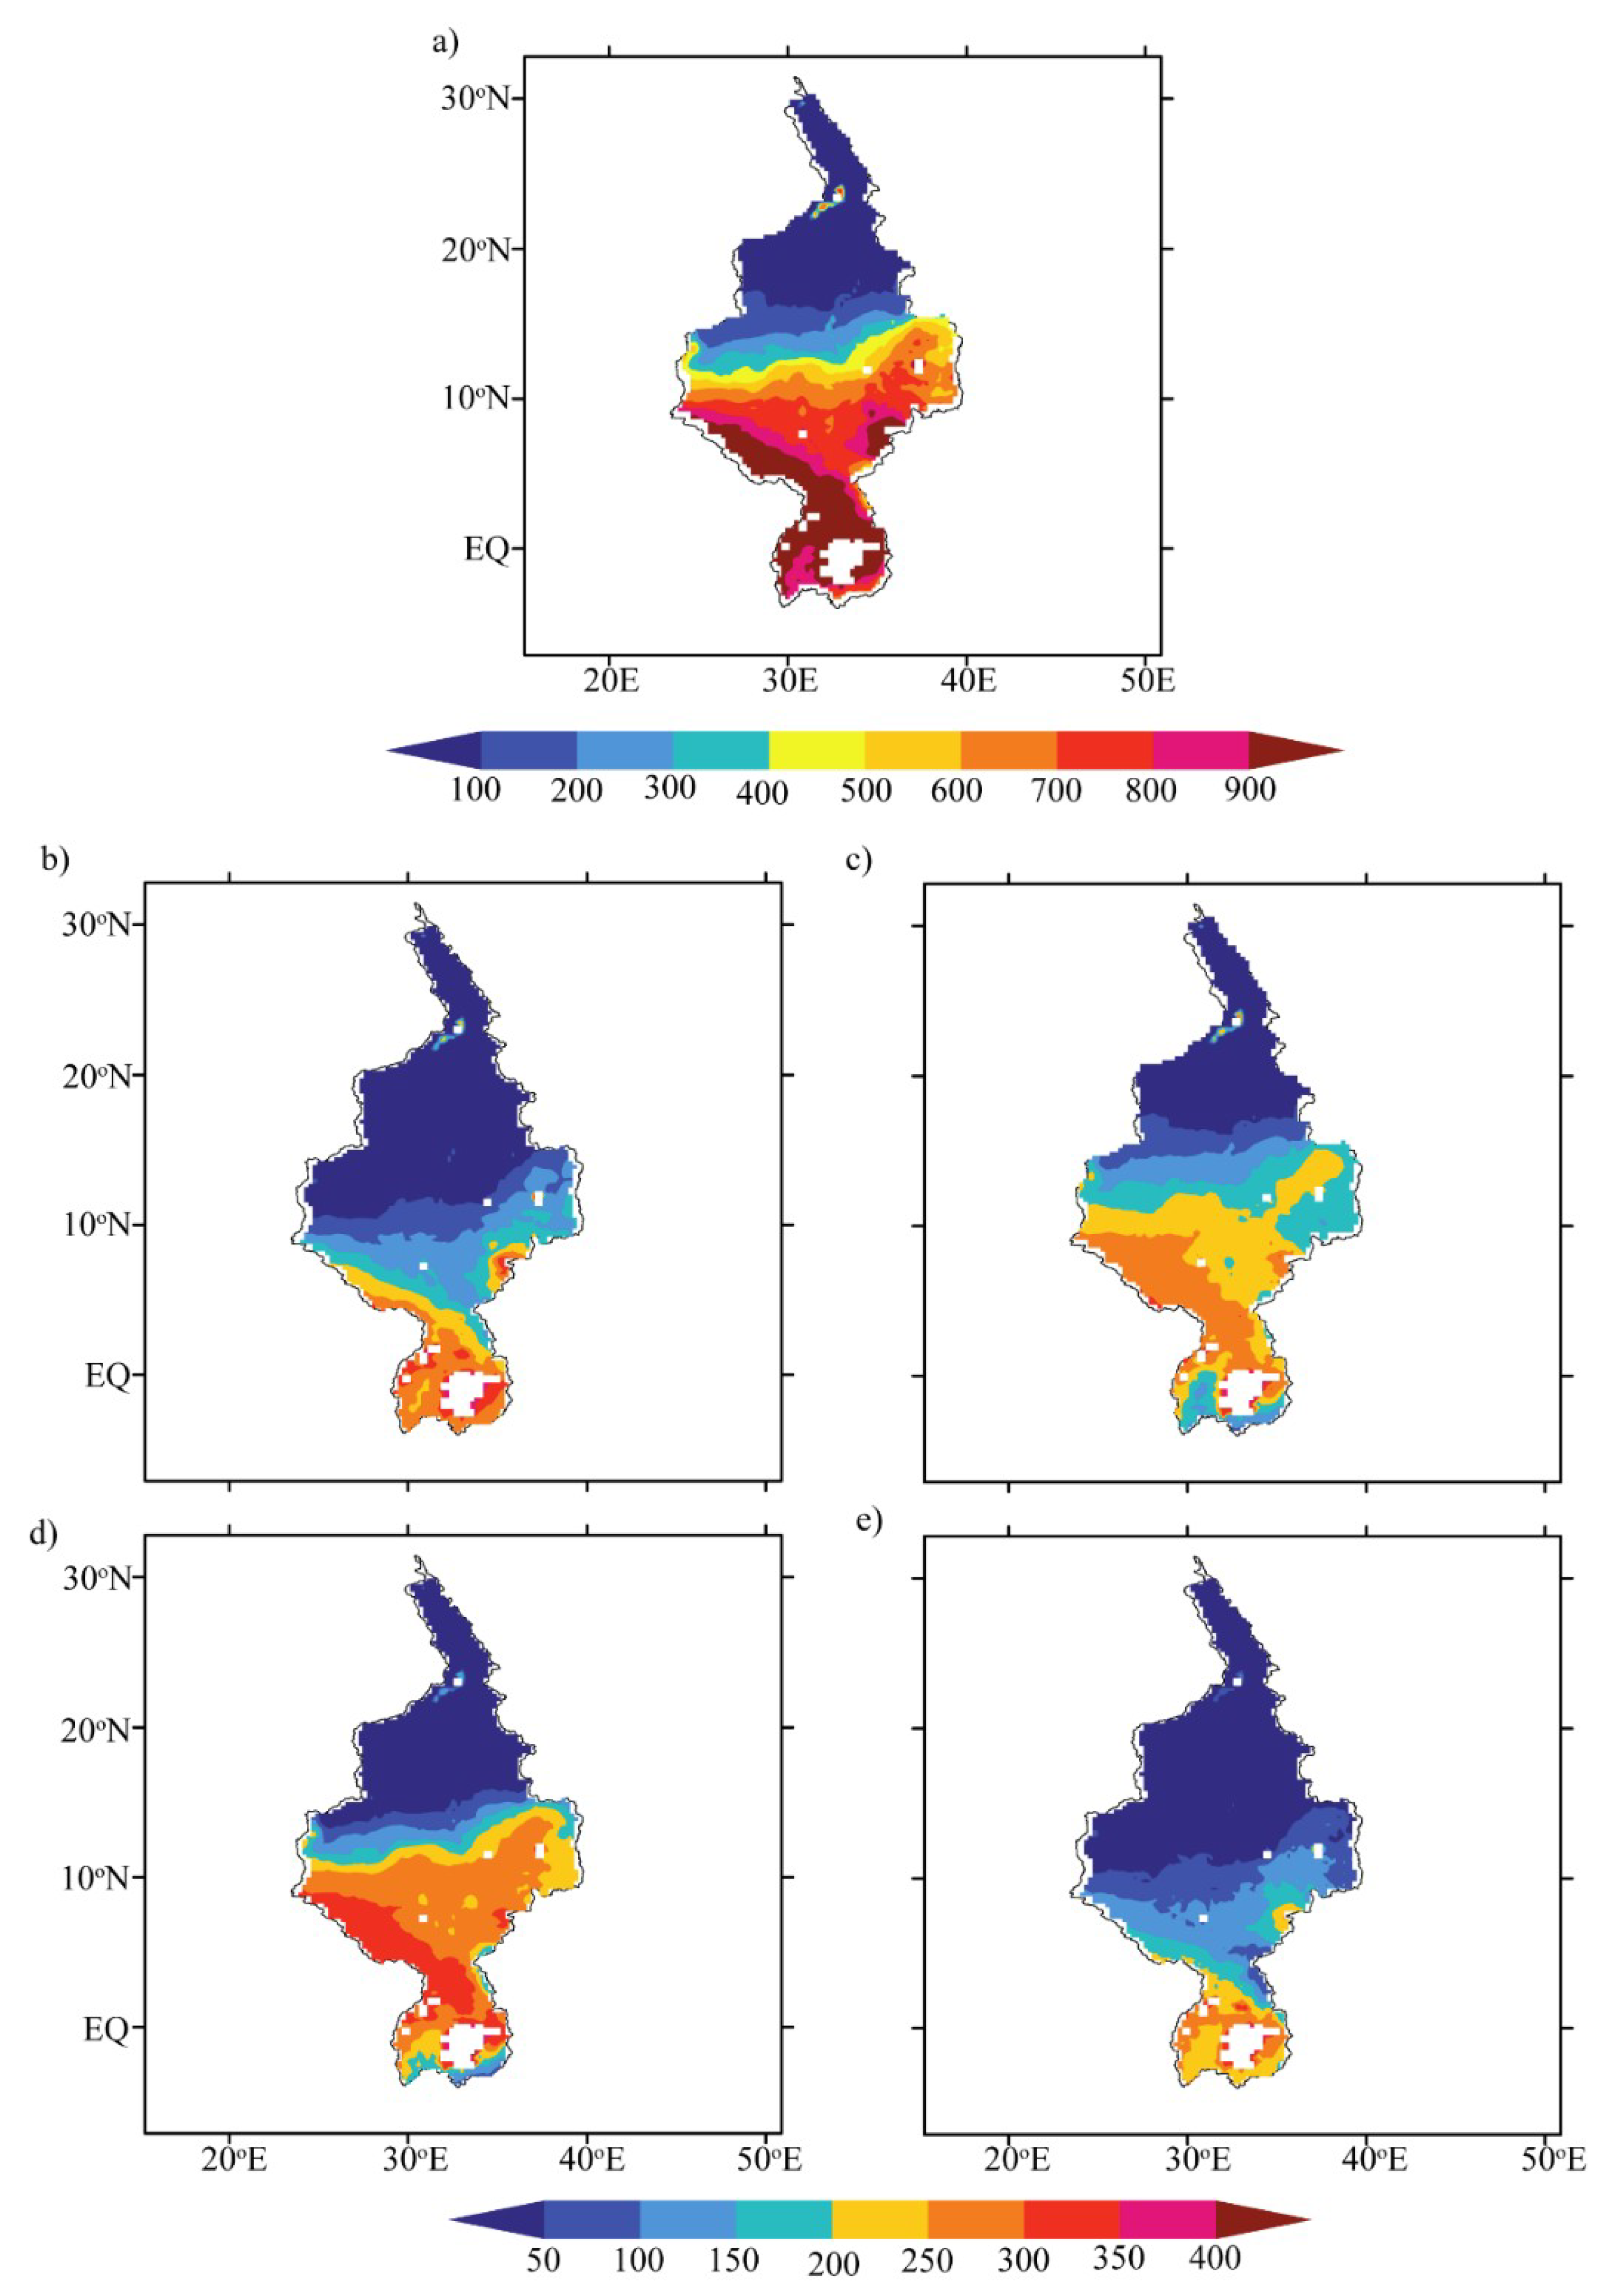
To understand their seasonality and quantify their relative contribution to the hydrological budget, the interannual and seasonal variations in ET over the Nile River Basin were computed. The daily GLEAM data over 1980–2014 were aggregated to monthly and annual values for analysis. Figure 3 shows the long-term (1980–2014) annual (top panel) and seasonal (bottom panel) variations in terrestrial ET. Figure 3a shows the annual ET and Figure 3b–e show those for spring, summer, autumn, and winter, respectively. The Sahelian belt (i.e., the middle reach) showed a spatially distinct pattern of mean annual ET (200–600 mm), gradually increasing toward the equatorial region (from ≥700 mm·year−1 to ≥900 mm·year−1 in the southwestern part of upper reach). In the lower reaches, the annual ET amounts to ≤200 mm·year−1.
Figure 3b–e present strong seasonal variations in annual mean values for each season. For all seasons, we observed similar spatial distinct patterns in ET to annual ET with high values observed in boreal summer and autumn seasons. In all seasons, the lower reaches recorded ET values of ≤50 mm. In winter and spring, the high ET in most parts of the upper basin, at 250–300 mm, may be explained by wet winters (dry summers) in those regions in the Southern Hemisphere.
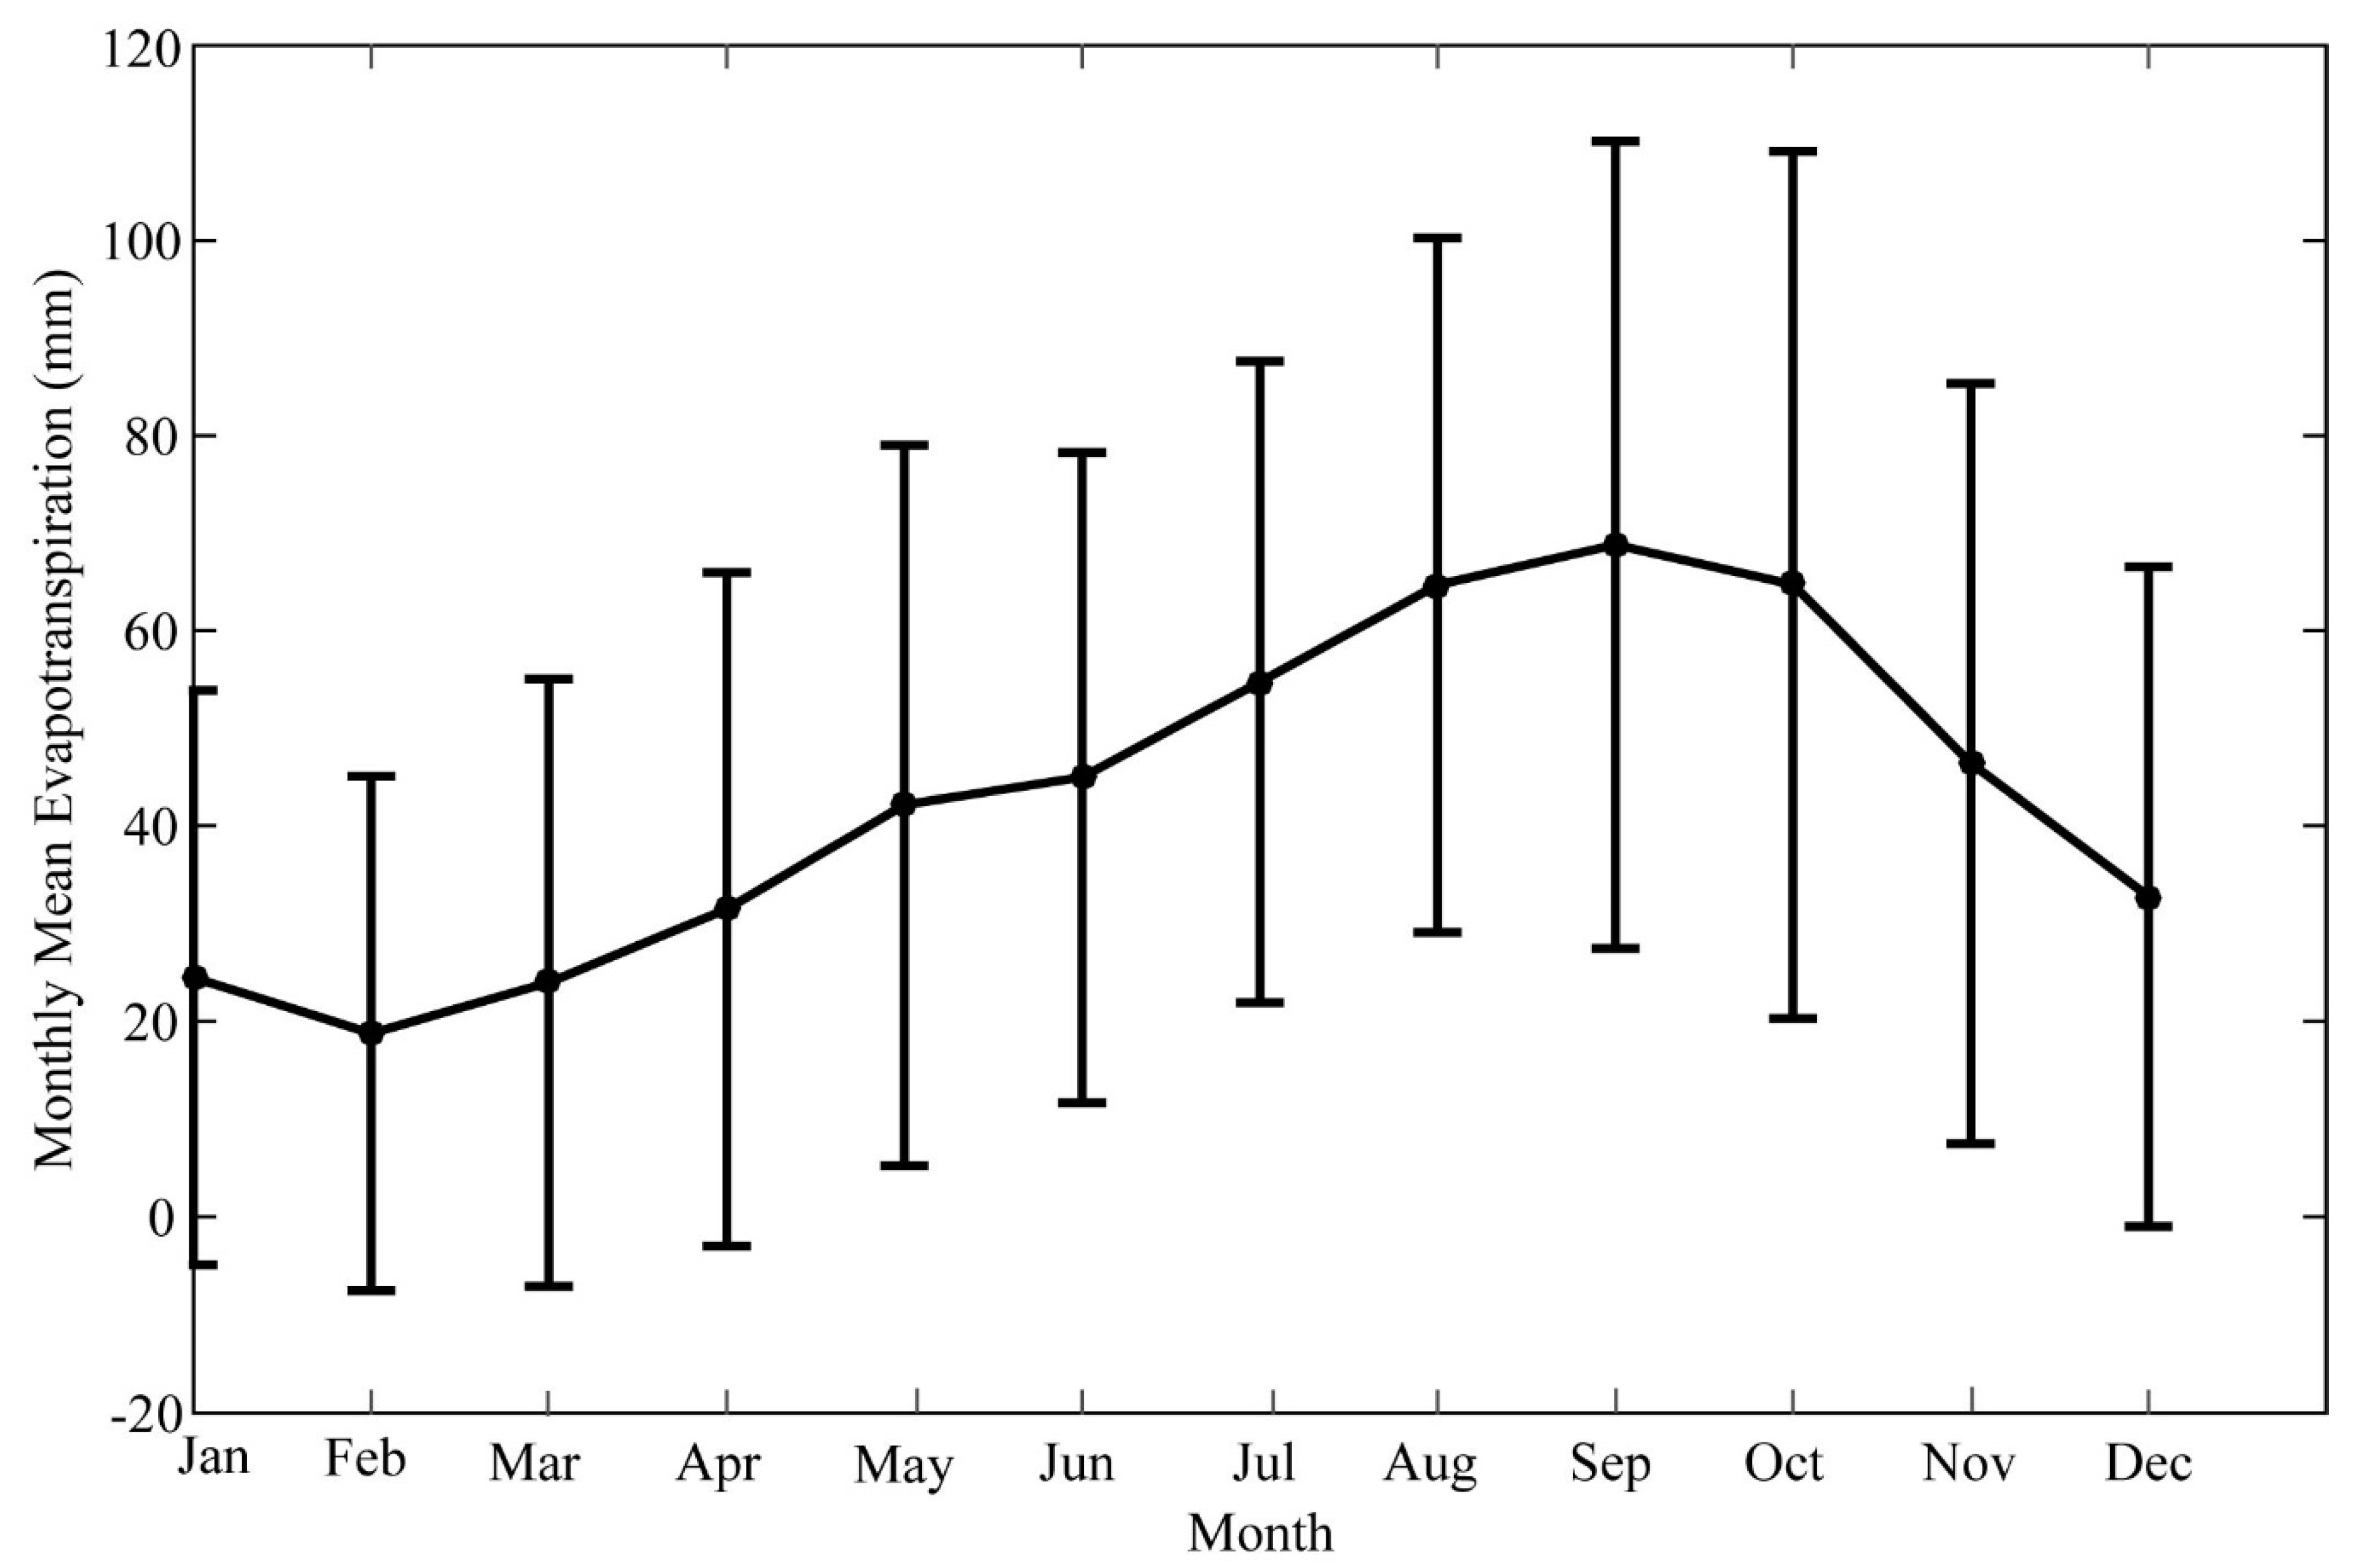
The temporal distribution over the Nile River Basin was investigated. The monthly mean ET climatology was computed for the period 1980–2014 to explain the seasonal changes (Figure 4). The resulting strong temporal variations (19–69 mm·month−1) over the entire basin can be largely explained by trends in P for the basin. The low ET values in February (19 mm) and peak in September (69 mm) are consistent with tower-based eddy-covariance-measured ET in the region (not shown). The peak in September is most probably linked to how vegetation assimilates available energy and water across the different climate regions in the basin (Figure A1).
3.2.2. Long-Term Trends
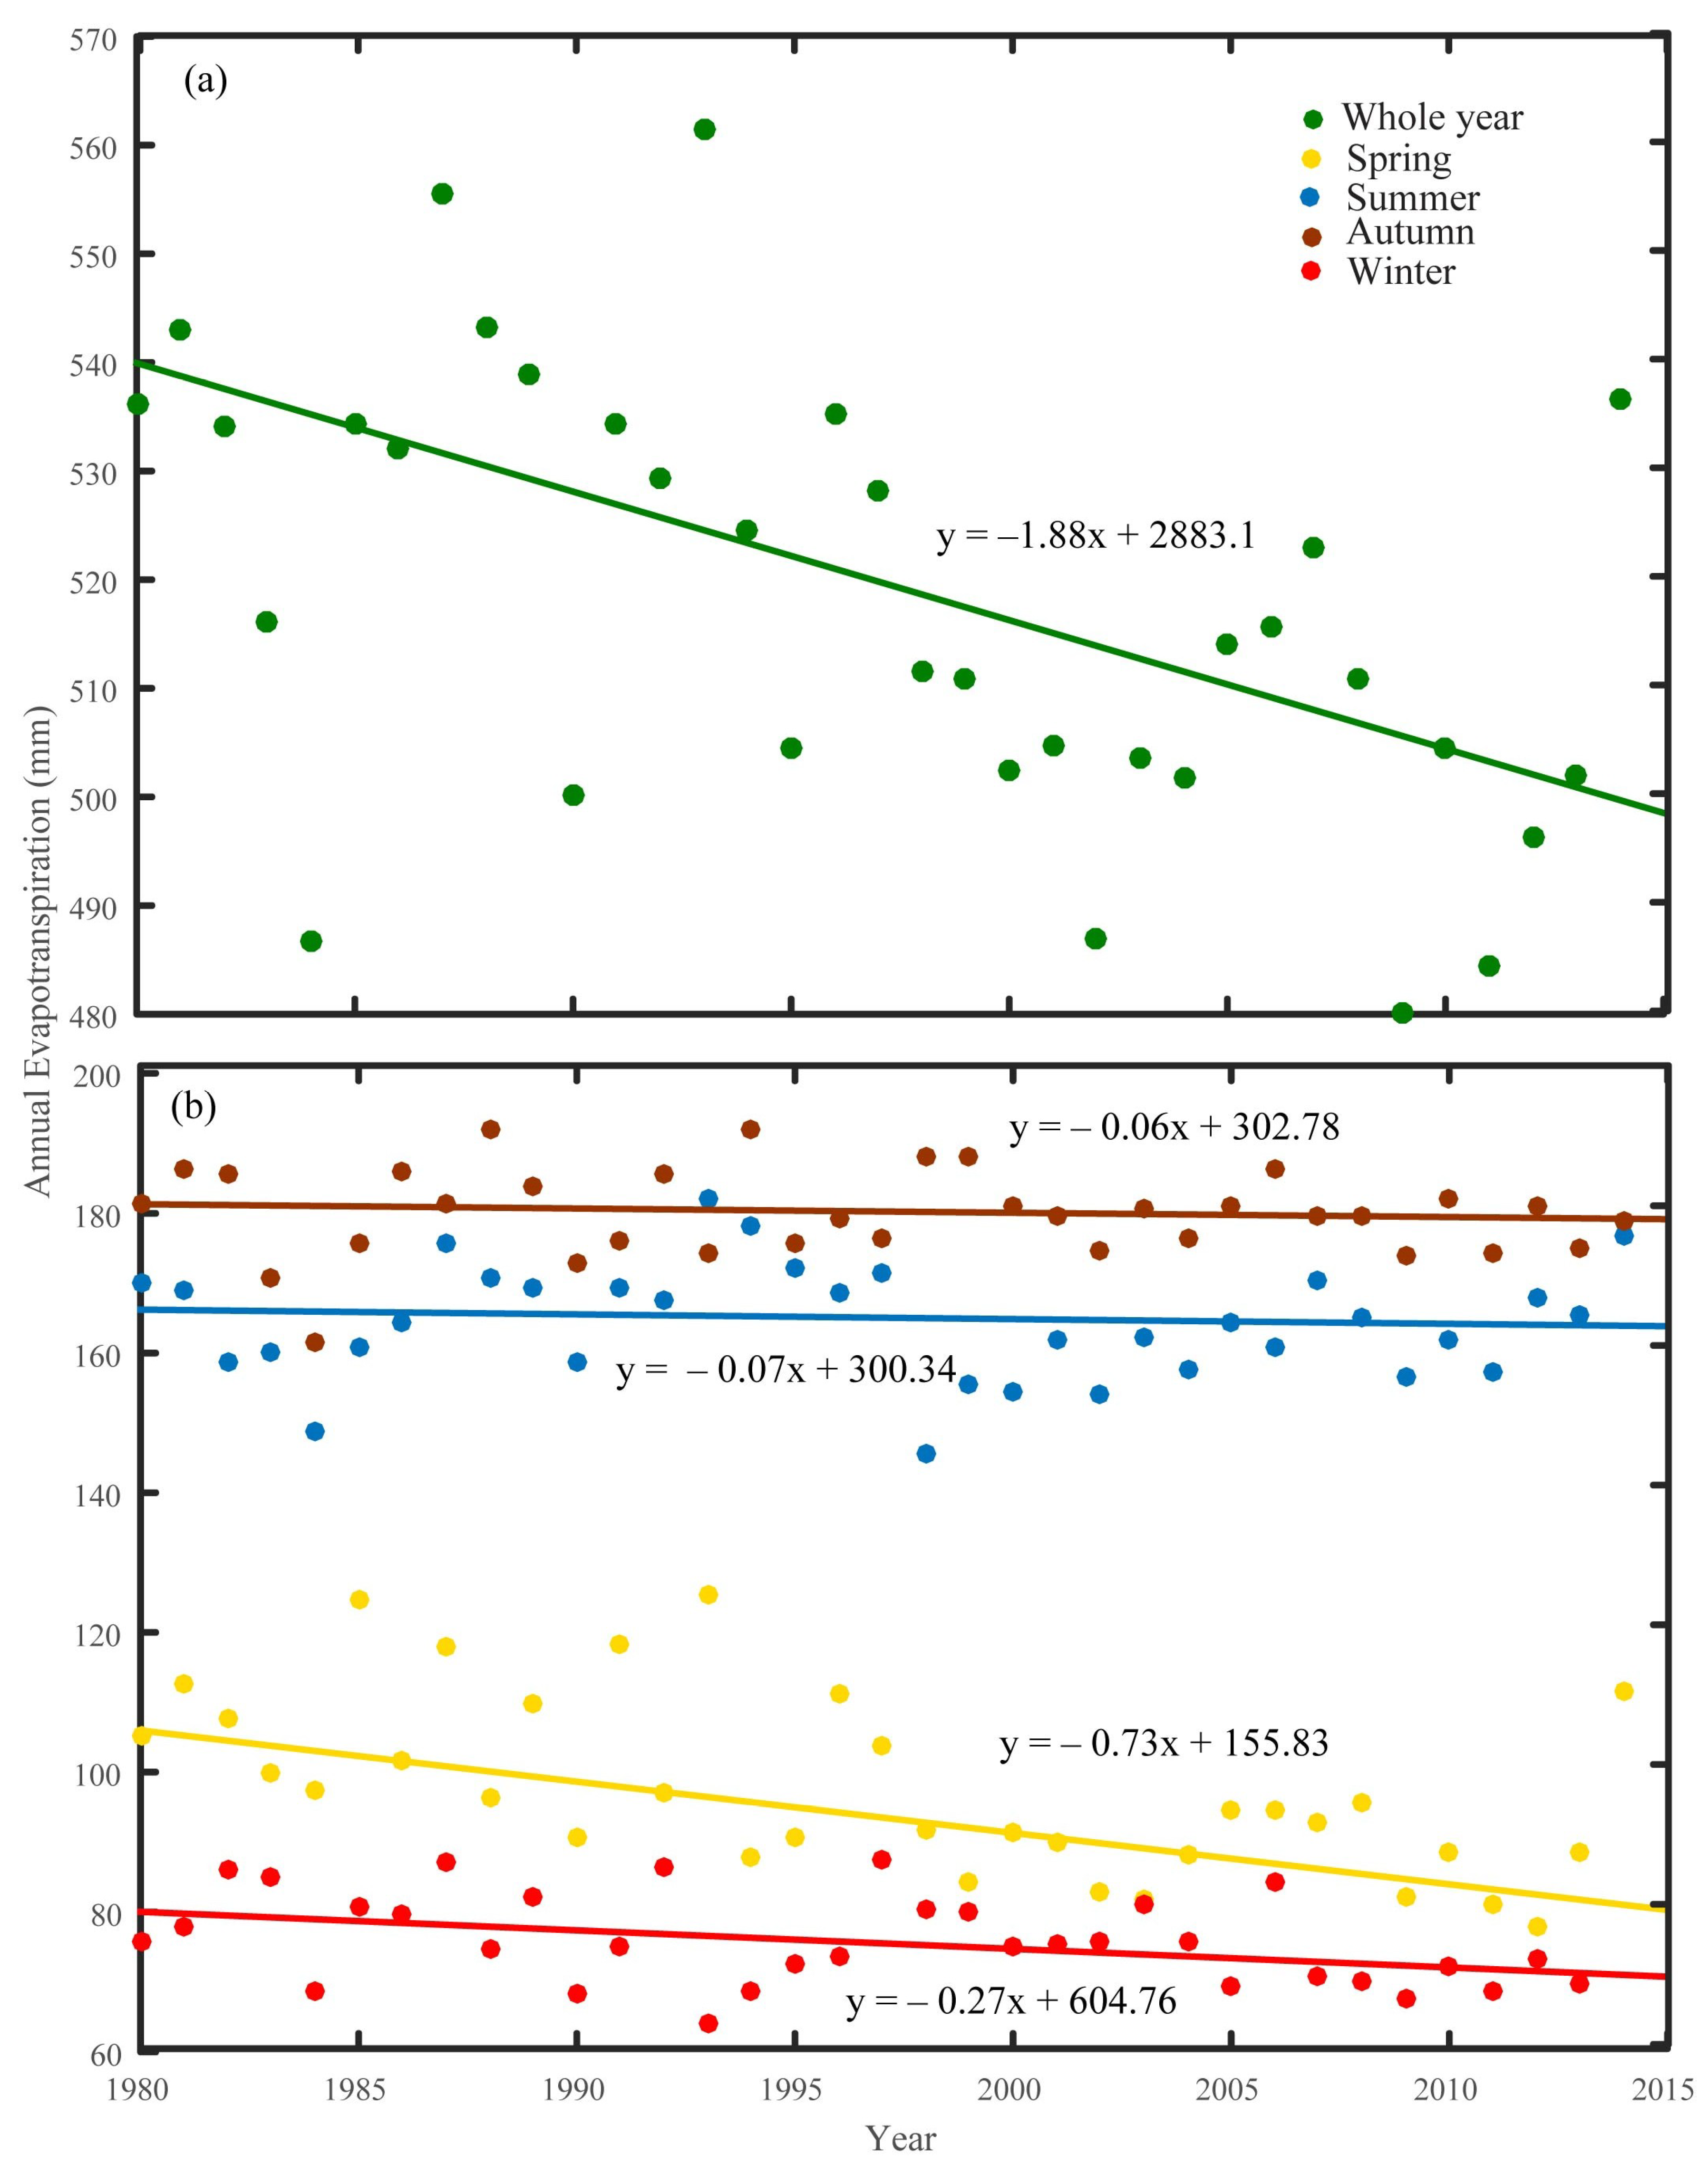
We analyzed the interannual and linear trends in terrestrial ET and its components over the Nile Basin. This analysis helped us to understand the implication of its changes in response to a warming climate. Figure 5 presents the interannual variations in ET for the whole year and all seasons (for the period 1980–2014). Figure 5a (green) shows the annual estimated ET with a multi-year average of 518 mm (range: 480 to 555 mm). The magnitude of the multi-year average agrees with LSM output [9]. The multi-decade trend (1980–2014) in ET from the Thiel–Sen slope method is negative (this indicates a decreasing rate at 18.8 mm/10 years). These results indicate that ET in the Nile basin generally decreased over the period of 35 years considered. This is in agreement with previous studies in the region [8,24,28].
The annual ET trends for each season and their contribution to the land ET trend were also investigated (Figure 5b). Our results showed that ET displayed a negative trend in all four seasons. Figure 5 shows that dry season ET showed a higher negative trend than wet seasons, although with varying magnitudes. We observed that spring and winter ET showed the strongest decreasing trend (7.3 and 2.7 mm/10 years, respectively) as compared with summer and autumn (0.7 and 0.6 mm/10 years, respectively). This indicates that the average dry season increases in ET are consistent with some model studies [50]. The negative trend in dry seasons may be explained by trends in P, suggesting that water availability may be a limiting factor for ET during dry seasons and vice versa.
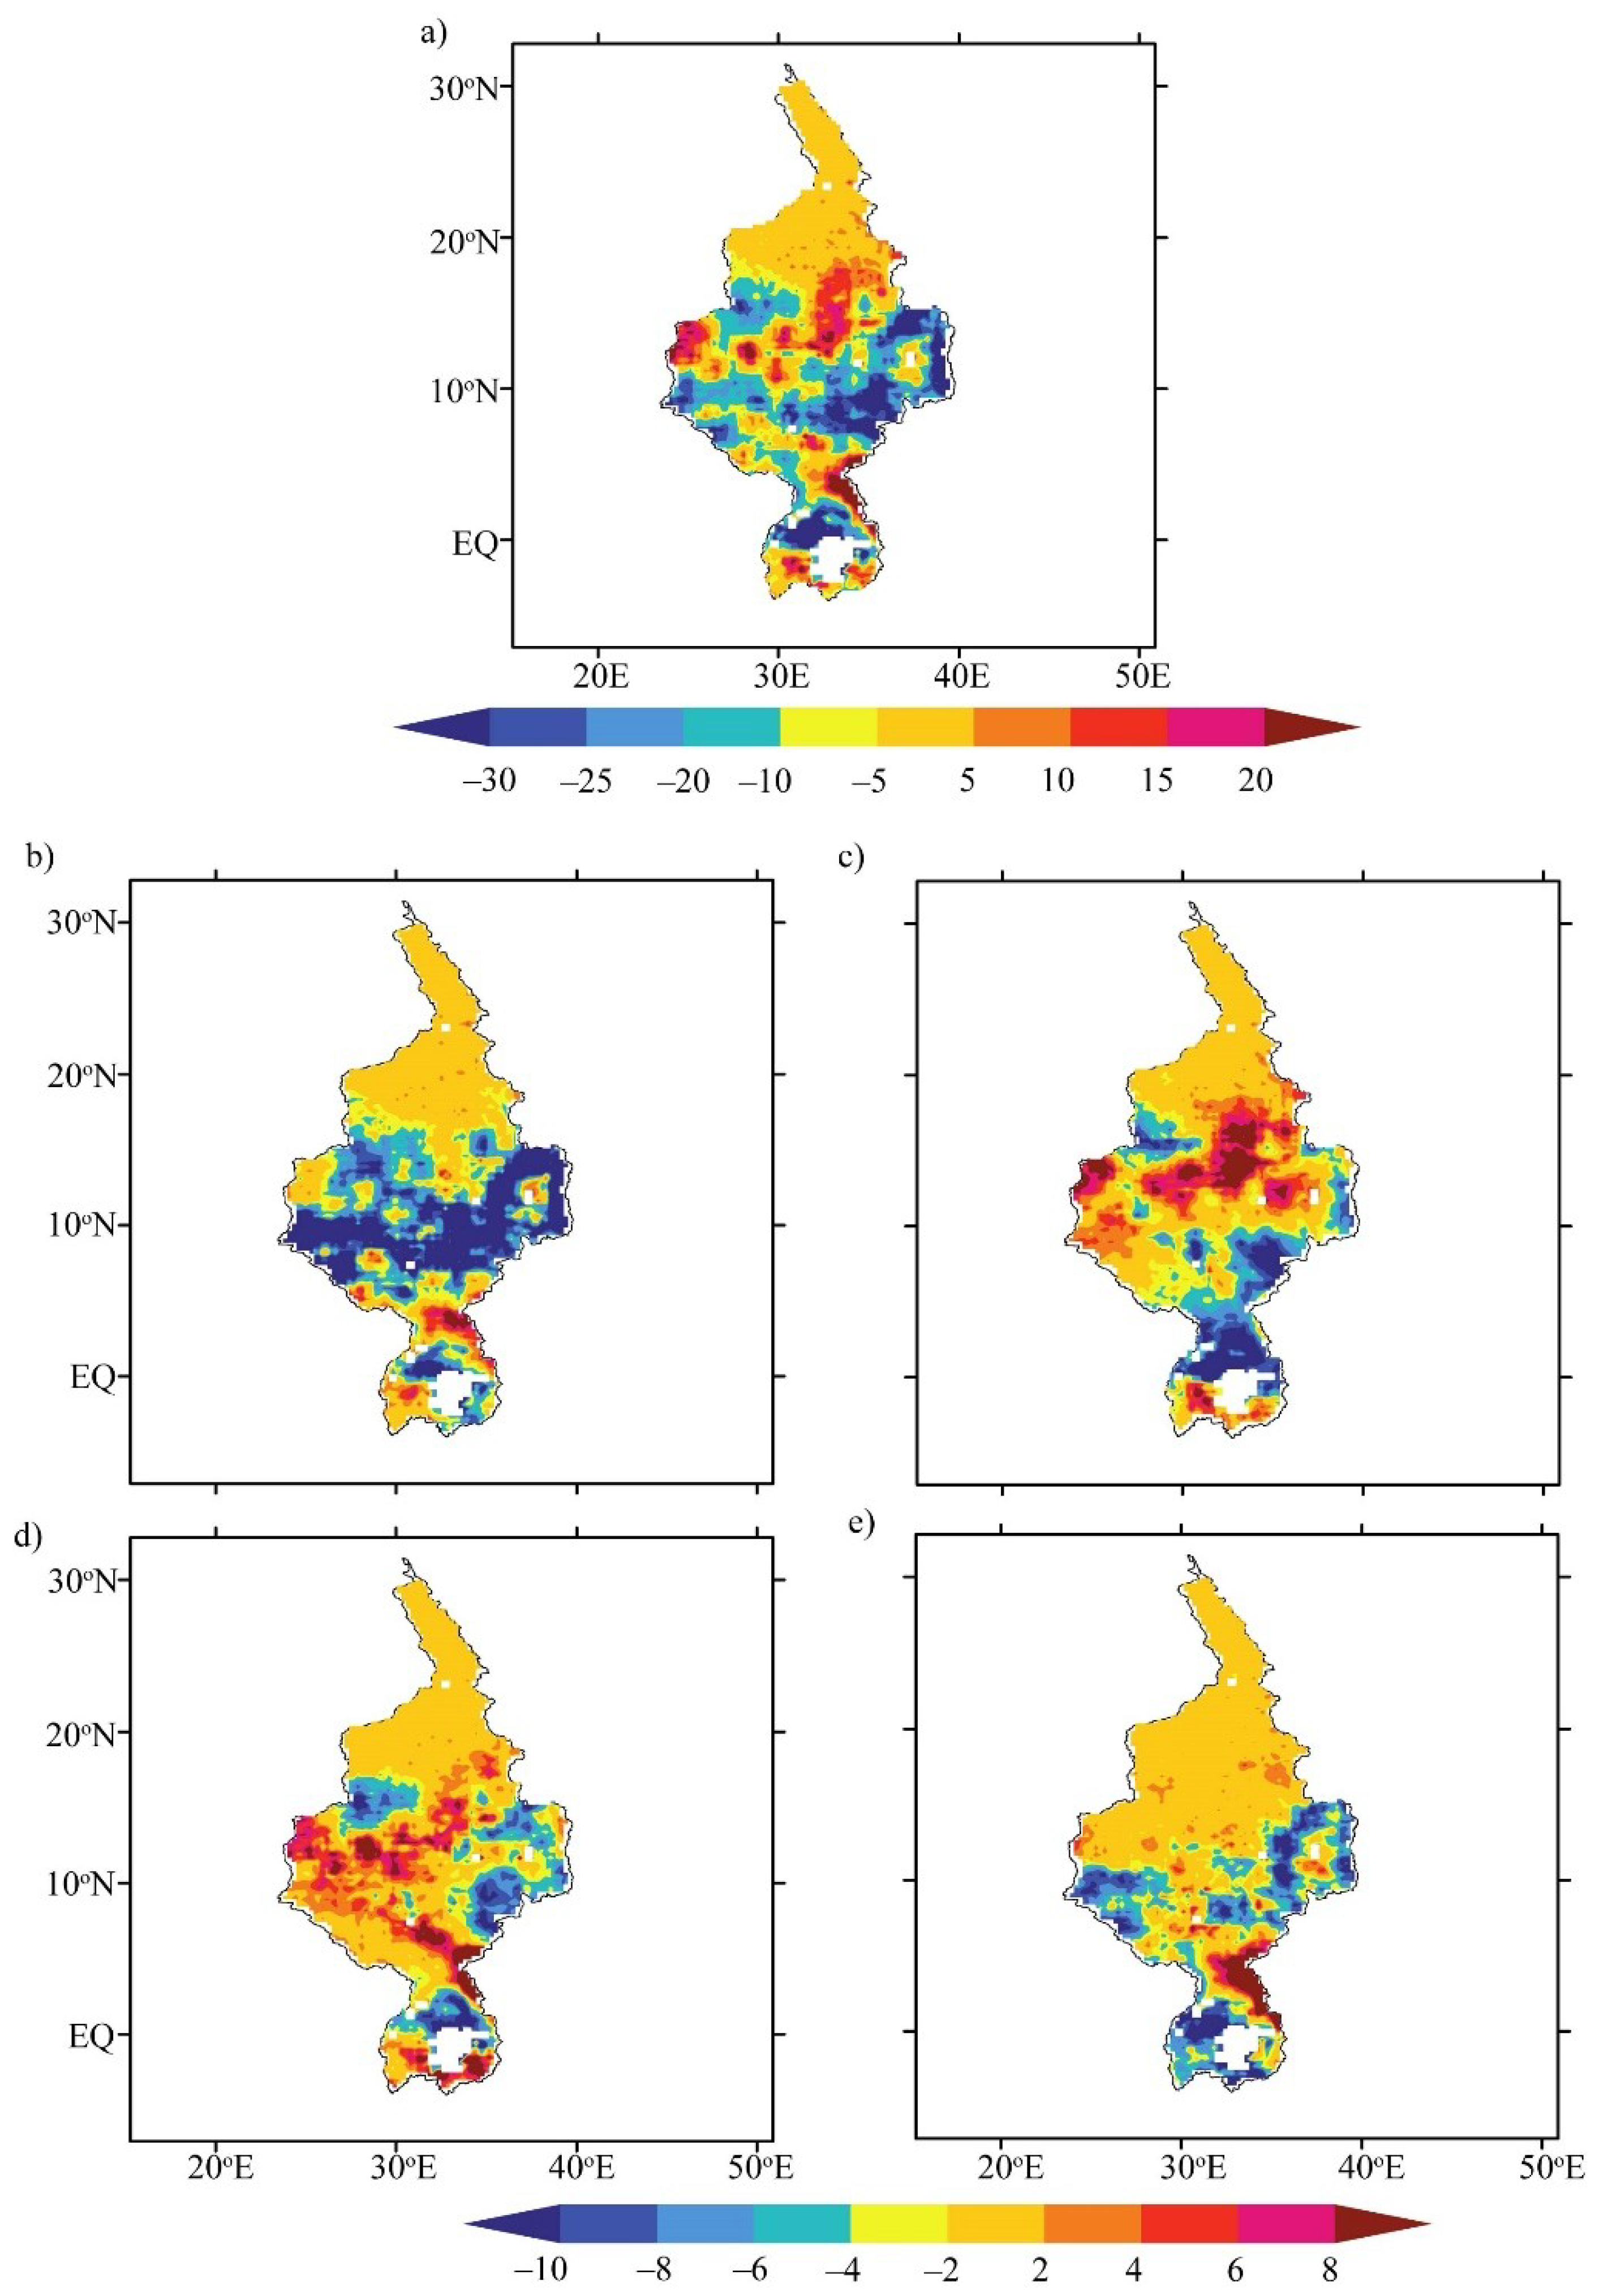
Figure 6 shows significant spatiotemporal distribution in the linear trends in annual ET in the Nile Basin (at the 5% significance level). These results helped us to understand the spatial distributions of pixel-wise linear trends in the ET in the Nile Basin for the period 1980–2014 (Figure 6a). We observed a significantly decreasing linear trend at a rate of 20–30 mm/10 years in wet/humid areas in central and eastern regions, small pockets in western regions of the middle reach, and areas north of Lake Victoria. Similarly, increasing annual ET trends (>5 mm/10 years) in areas of the lower reach were due to widespread irrigation and reservoirs to support crop expansion increasing the water availability for ET [51,52].
Figure 6b–e show pixel-wise linear trends in the annual ET for individual seasons. Overall, the spatial patterns for summer and autumn were similar and the patterns for winter and spring were similar despite differences in their relative magnitudes for the trend values. In spring, the ET showed significantly decreasing trends (at a rate of 8–10 mm/10 years) in most areas from 5° to 15° N (middle reach) compared with other seasons, whereas summer and autumn showed similar spatial patterns but significant variations in the magnitude of linear trends in ET. The interannual variations in ET in winter appear distinctly different from other seasons.
The role of vegetation was investigated to provide us with a better understanding of its effect on interannual ET variability. Figure 7 shows the multiyear mean of ET for the four major biomes over the region. Forest regions showed the highest annual ET (average of 1045 mm·year–1; annual range of 980 to 1100 mm) followed by savanna (annual average of 750 mm; range 700 to 800 mm) and cropland (annual average 550 mm; range 490 to 610 mm). Grassland showed the lowest amount of land ET (average 380 mm; range from 250 to 410 mm). The multiyear mean variations were consistent with those reported by Oliveira et al. [53] for forest, savanna, and cropland in Brazil and Ryu et al. [54] for grassland in the U.S. [53,54]. Tropical forest and Savanna are biomes where a significant amount of ET occurs [13].
All four major vegetation types showed negative ET trends (suggesting a decline in ET). Forest showed the greatest decline in ET (31 mm/10 years) followed by savanna (16 mm/10 years), cropland (13 mm/10 years), and grassland (7 mm/10 years) for the period 1980–2014. Forest and savanna, as noted by Sterling et al., have been classified as hotspots for reducing ET [51]. The magnitude of decline may be explained by the response of each biome type to different transpiration rates (i.e., stomatal resistance) to minimize water stress (or loss) in a regional warming climate [55].
3.3. Variations in Different ET Components
3.3.1. Seasonal Variations
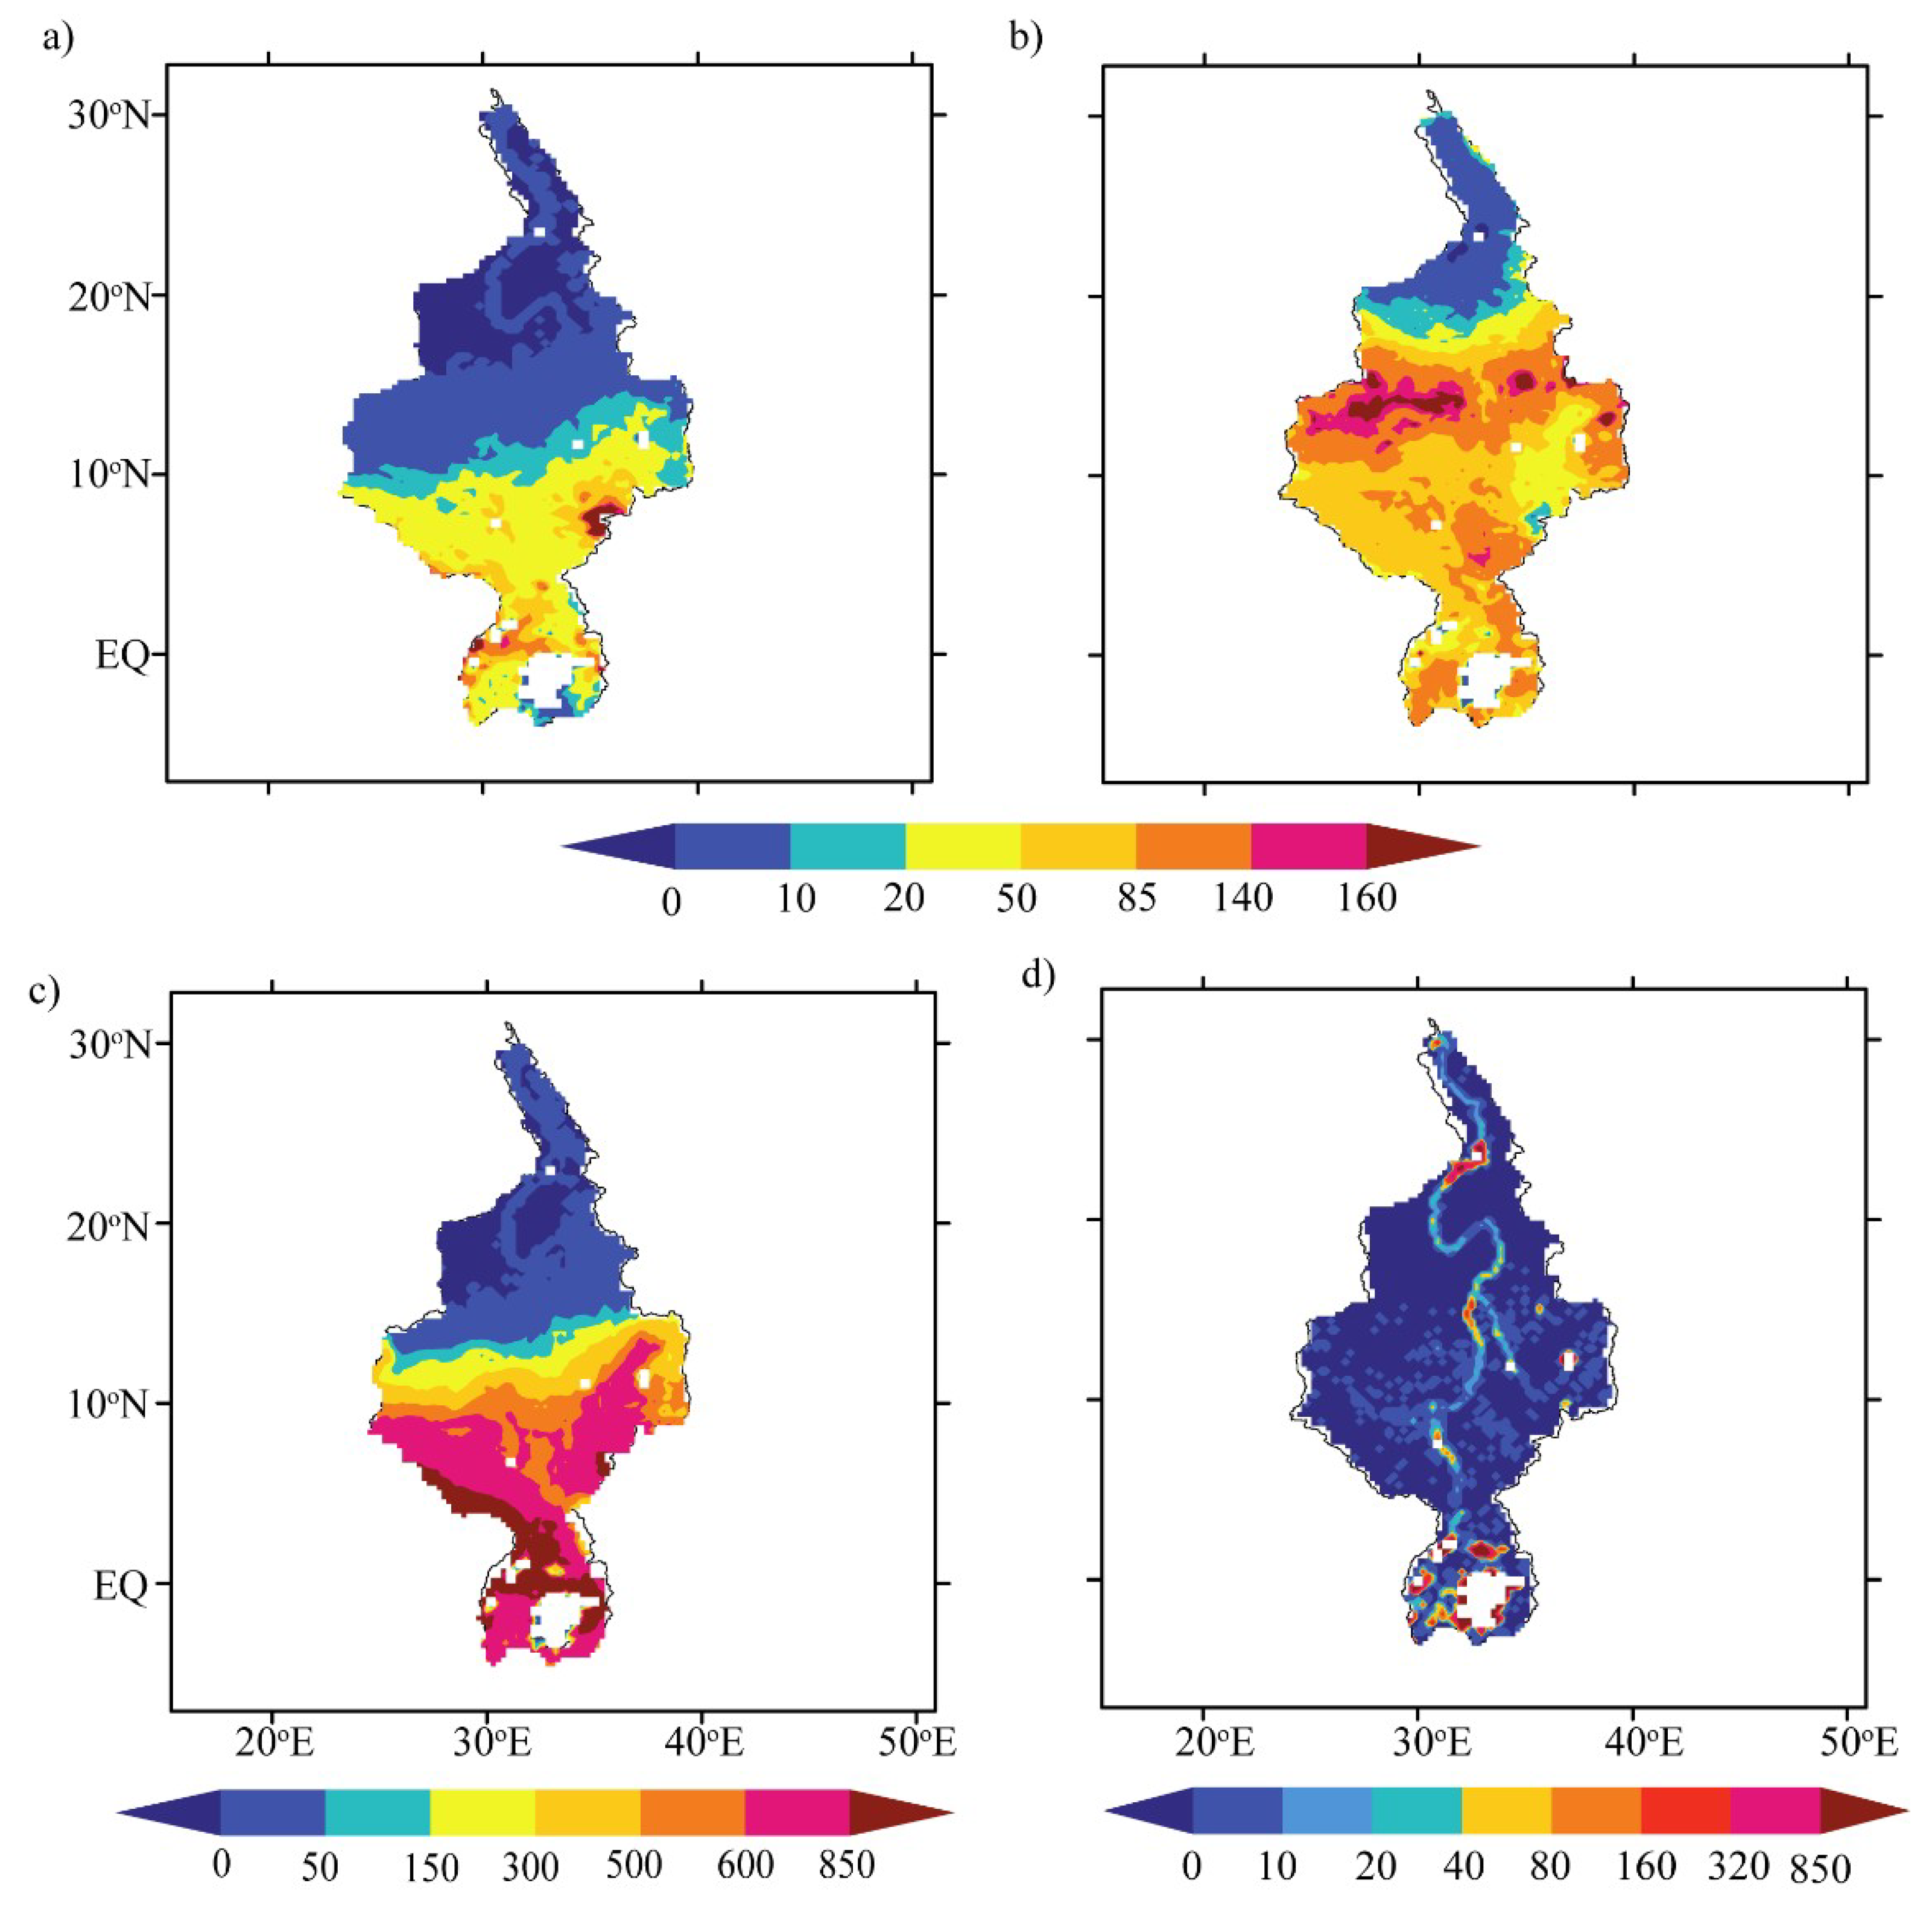
Spatial land ET distribution is associated with variations in the different ET components. Thus, examining variations in the different ET components provides a better understanding of their seasonality and quantifies their relative contributions to land ET and the underlying dynamics of ET changes. Figure 8 shows the annual amounts of each component of ET in the Nile Basin, including transpiration (Et), canopy interception (Ei), bare-soil evaporation (Eb), and open-water evaporation (Ew). We estimated the annual amount of each ET component based on the multiple-year average of 35 years.
Eb (Figure 8a) shows a complex spatial pattern. Eb is mainly controlled by factors such as Rn, P, vegetation density, and canopy cover. We observed the highest Eb loss (>50 mm·year–1) for the areas below the Sahelian belt toward the equatorial regions. Ei loss (Figure 8b) was generally influenced by types of tree species (or canopy cover) and P distribution. We observed high and varying annual amounts of Ei (85–160 mm·year–1) in the Sahelian belt (10–15° N) as well toward the equatorial regions. In areas slightly above the Sahelian belt to the arid region, we observed a distinct layer of Ei, as sparse vegetation was prevalent and negligible P showed the least annual Ei loss (<50 mm).
Figure 8c shows that the interannual variations in vegetation transpiration (Et) had similar spatial heterogeneity to total ET. Generally, Et is controlled by soil water contents (essentially due to P), vegetation, and Rn. We observed high Et loss in the middle and upper reaches, particularly in southwestern areas in the middle-upper reaches, which had annual maximum P and vegetation greenness. The lower reach shows that annual Et amounts of <50 mm·year–1 are consistent with the annual P amount. There was little Ew in the region (Figure 8d) except for distinctly open water bodies and the channel of the Nile River Basin.
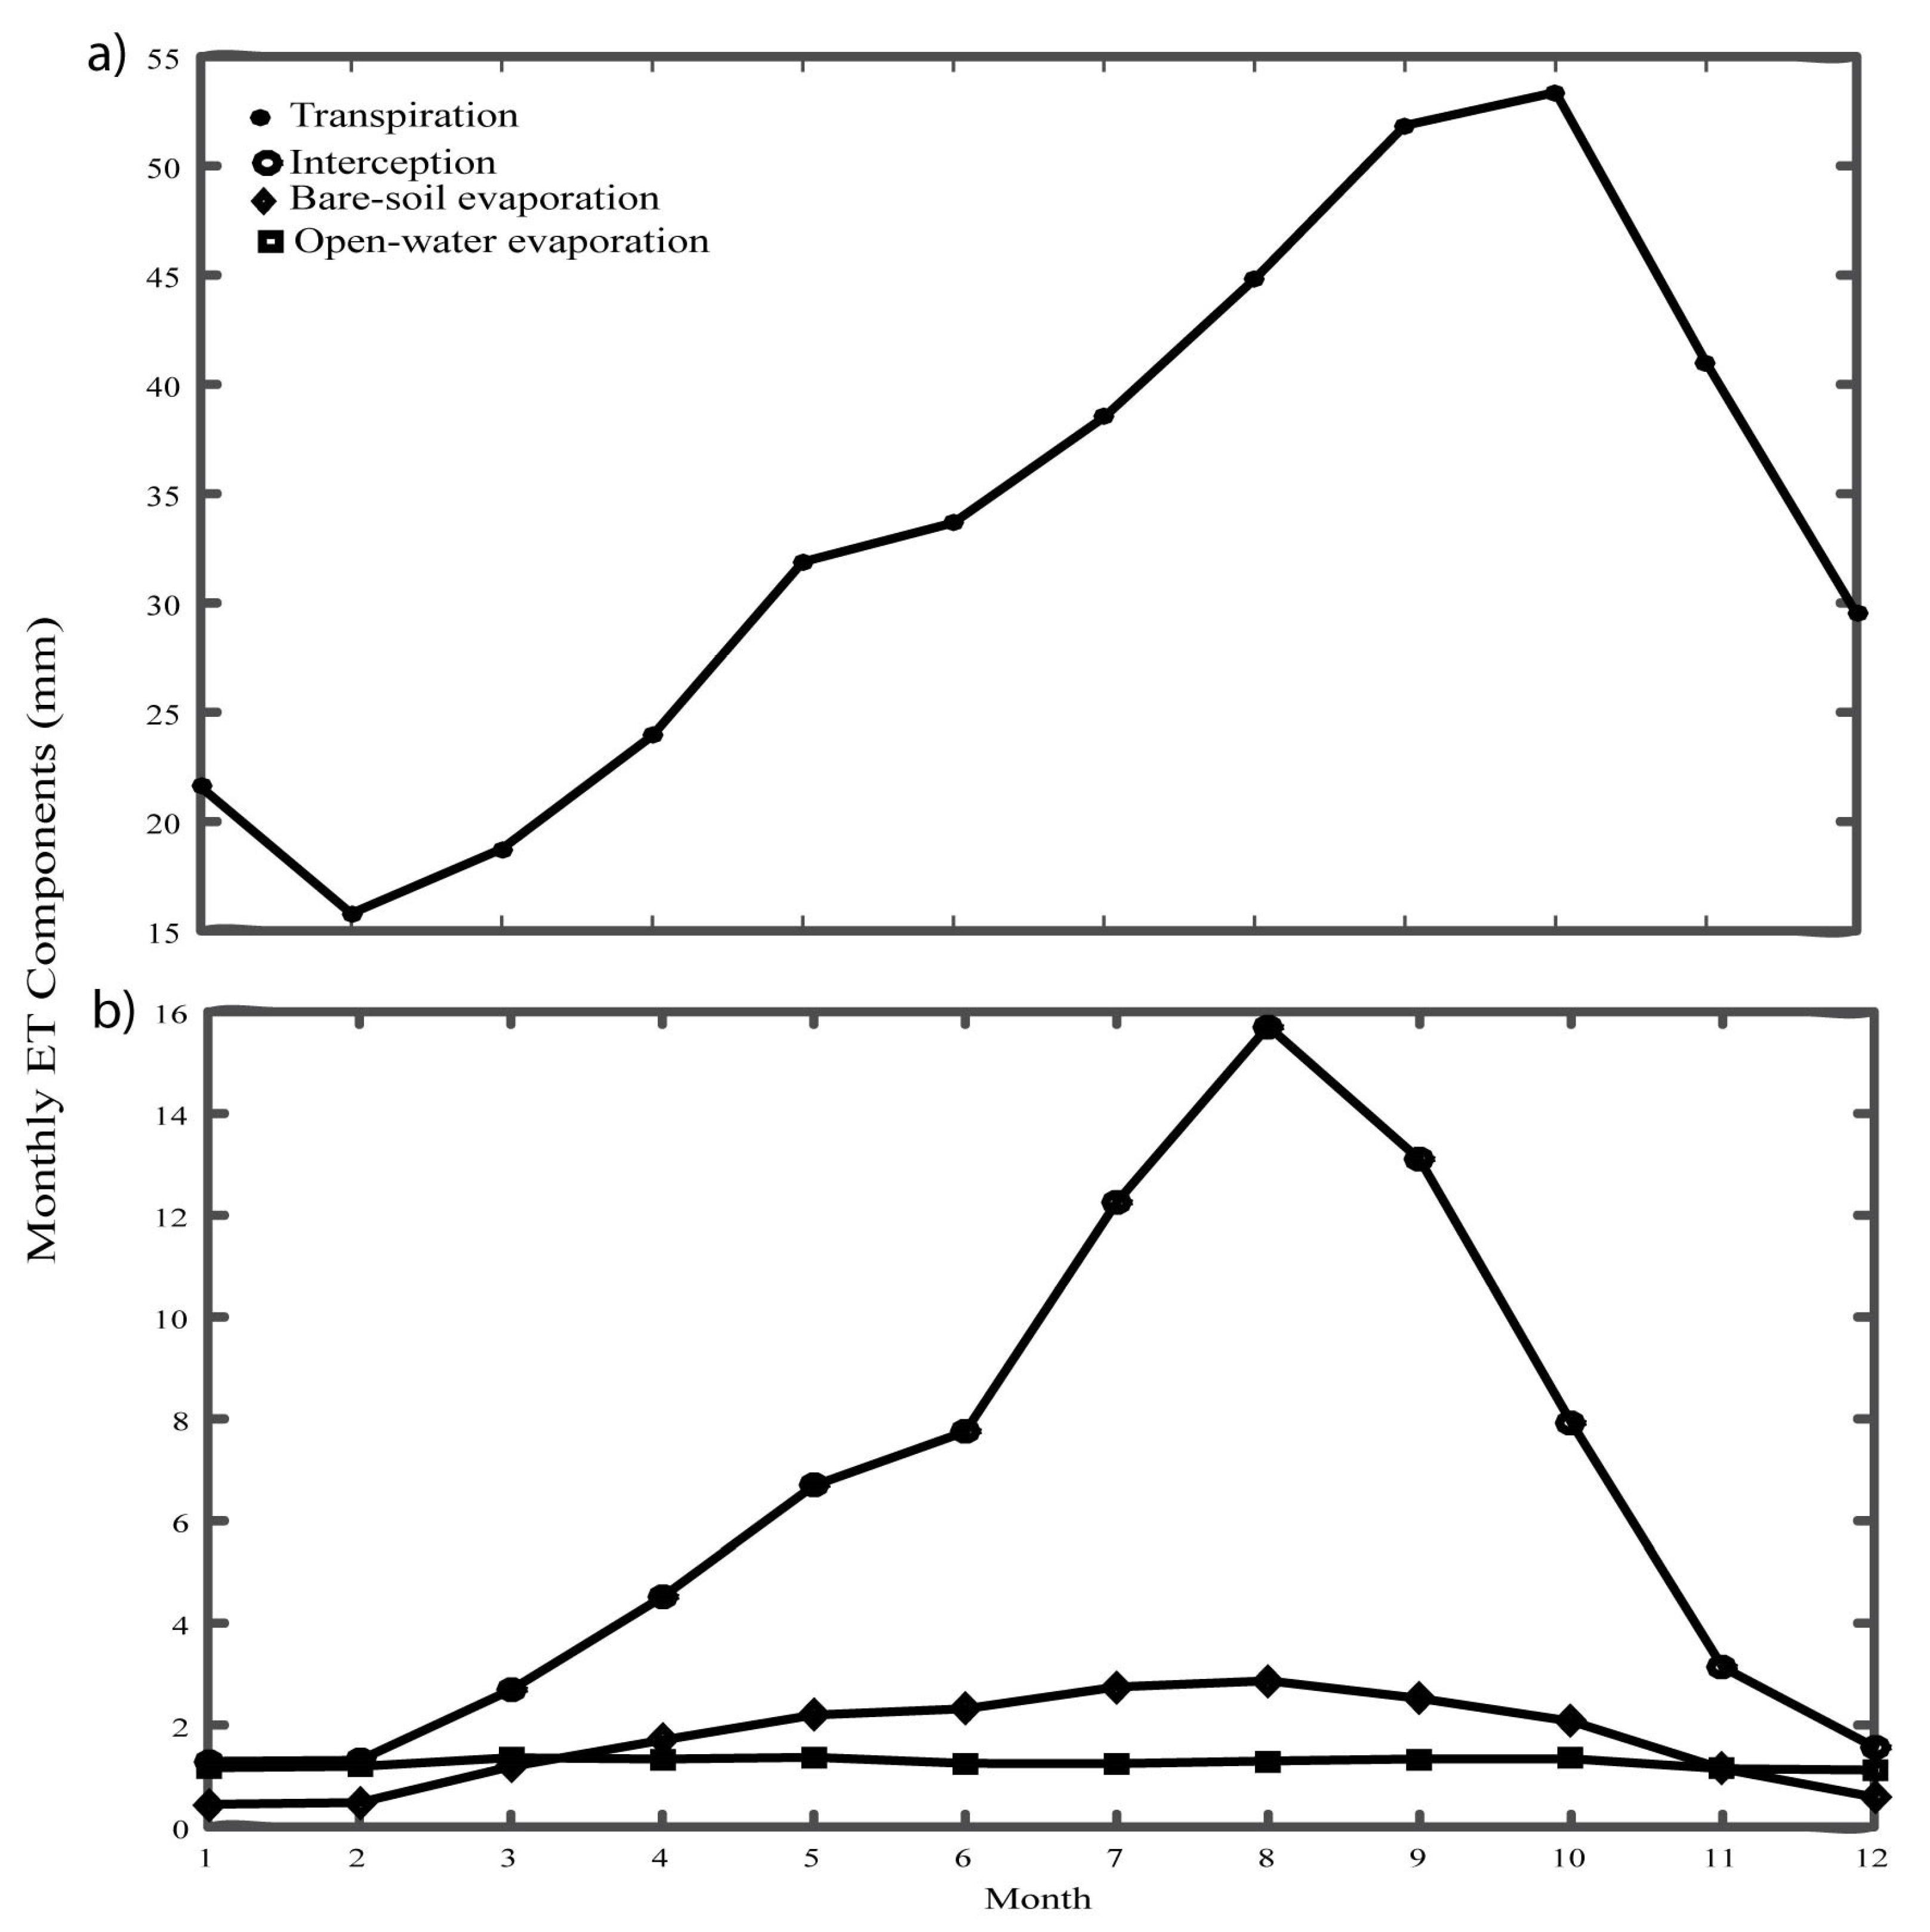
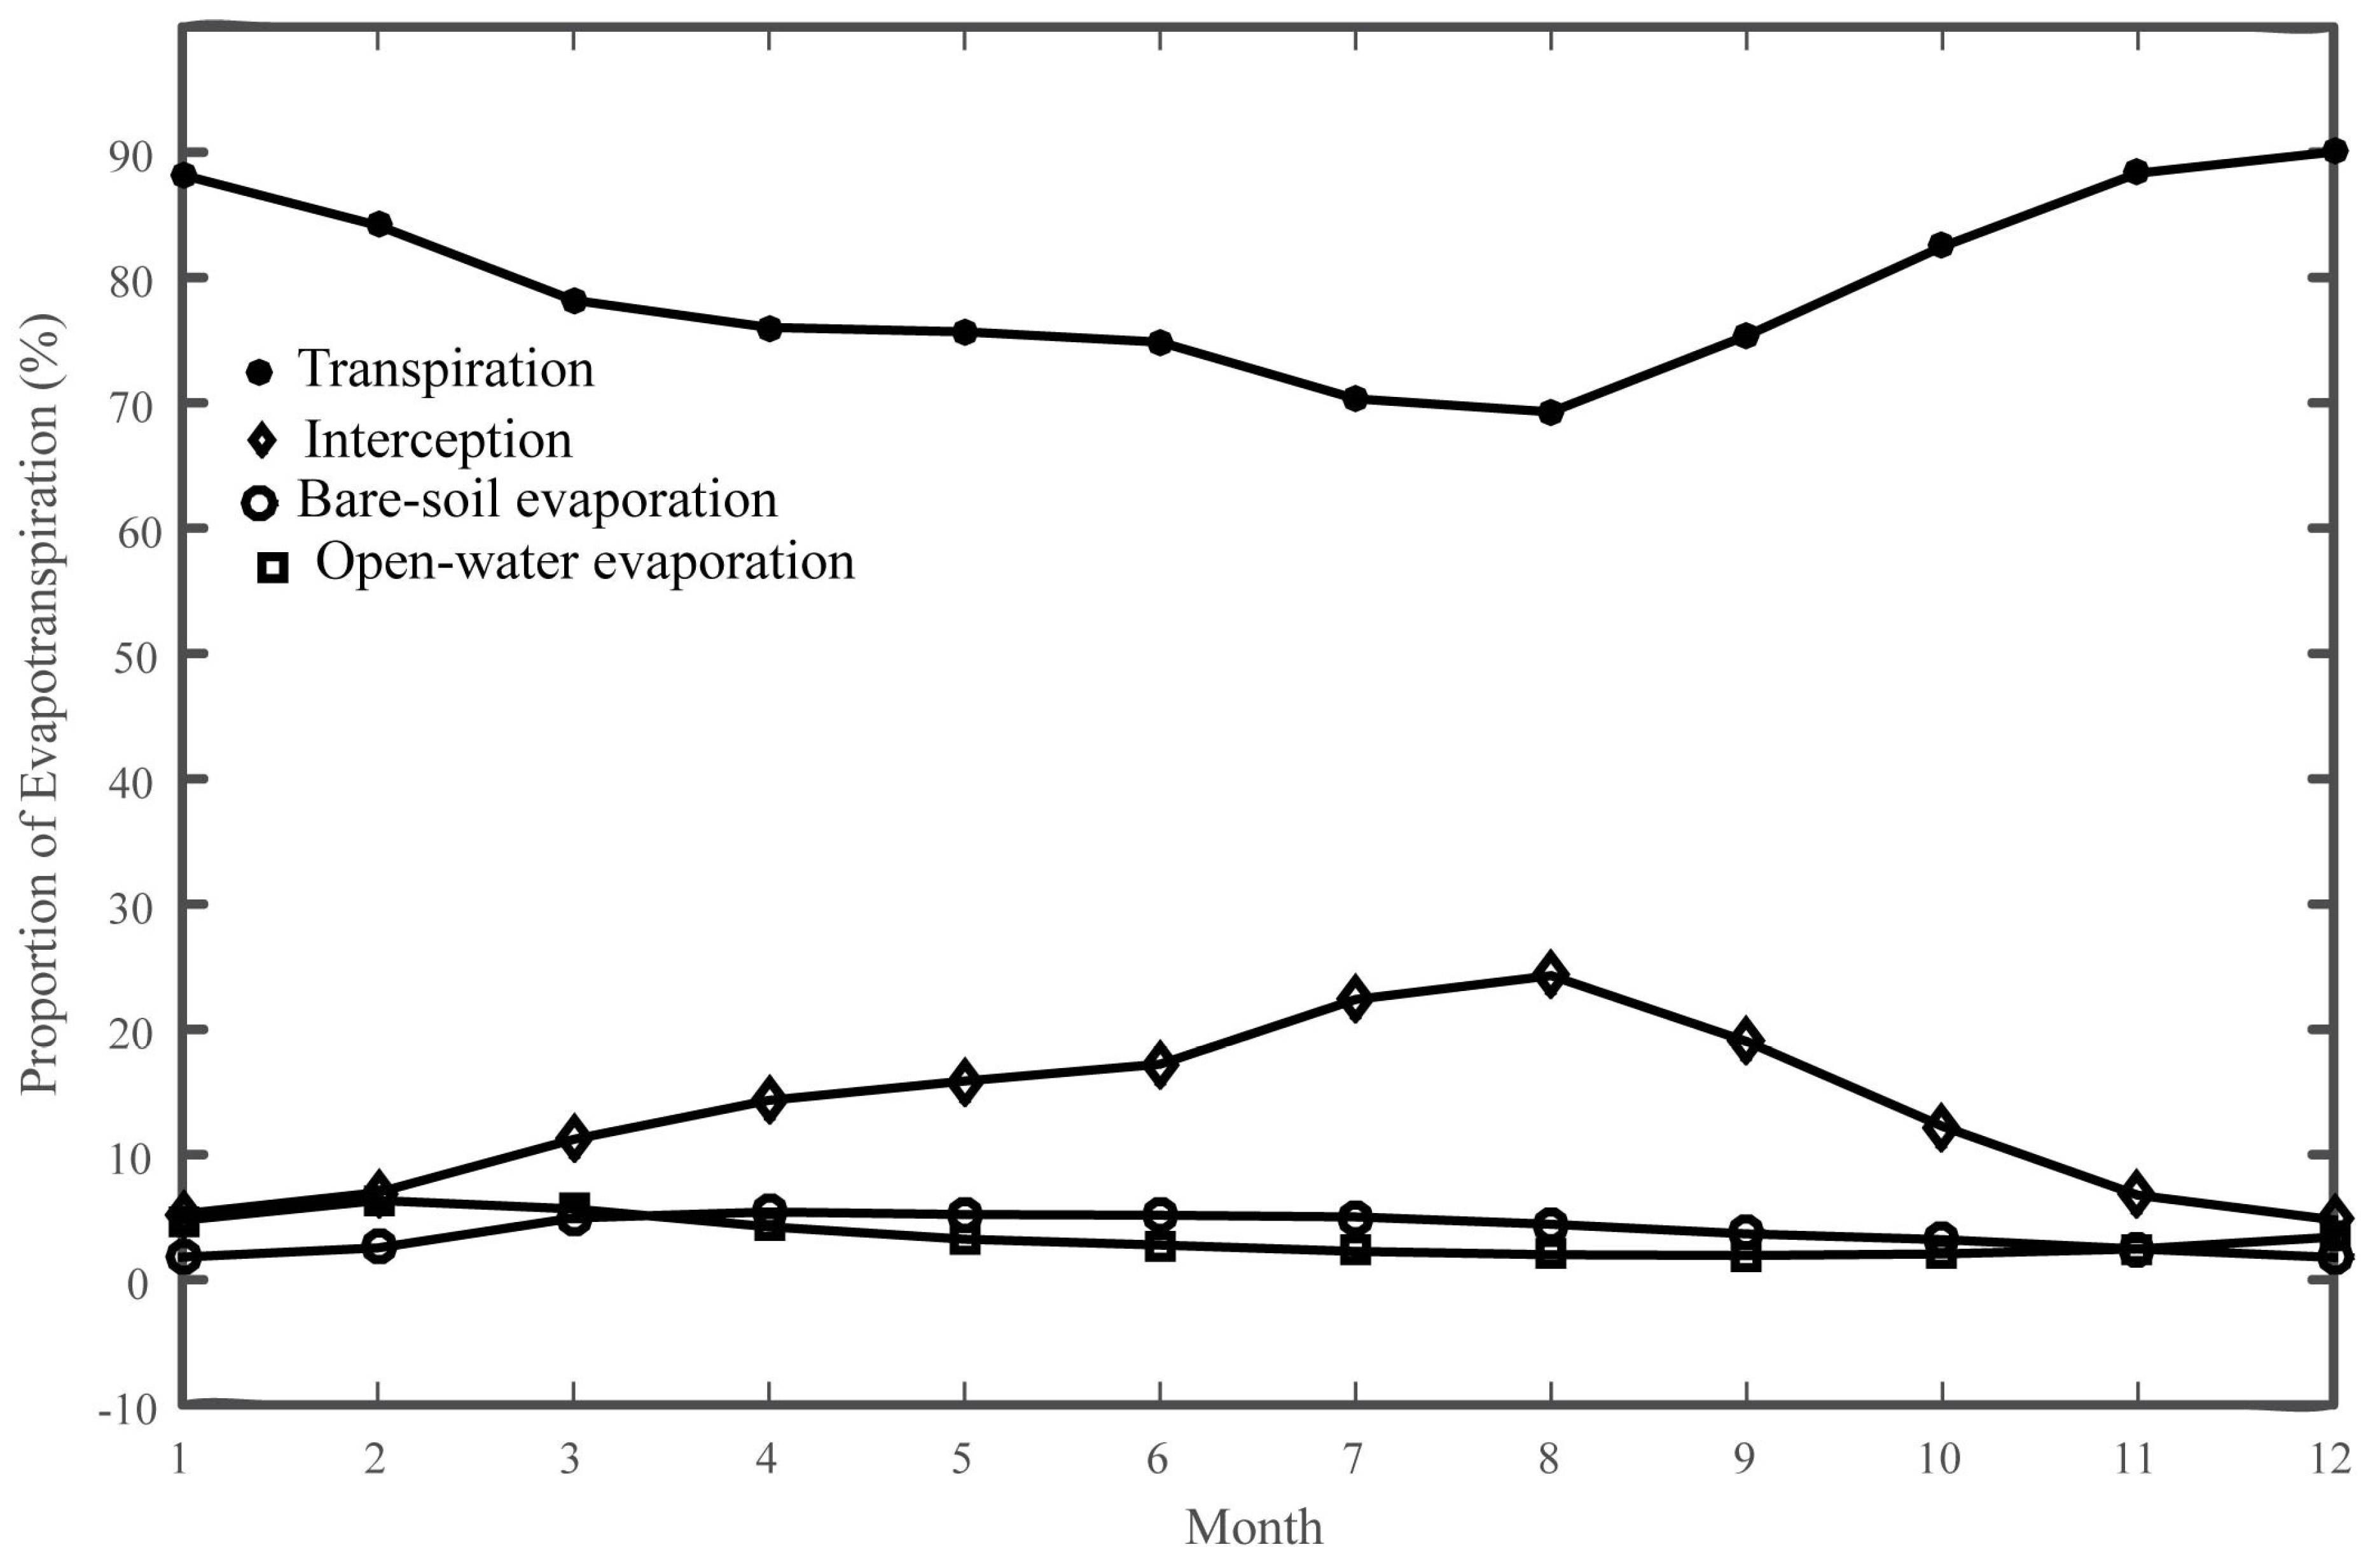
Next, we computed the climatological monthly amounts of the different ET components for the seasons to understand their long-term seasonal variations. Figure 9 shows the monthly amount of different ET components in the basin for 1980–2014. Et showed a strong seasonality, gradually increasing from February to a peak in September. However, the remaining components showed different temporal patterns in magnitude and peak periods (i.e., in August). Similarly, Ei showed a strong seasonality gradually increasing from February to a peak in August. Eb and Ew showed relatively small variations and weak seasonality, respectively.
3.3.2. Long-Term Trends
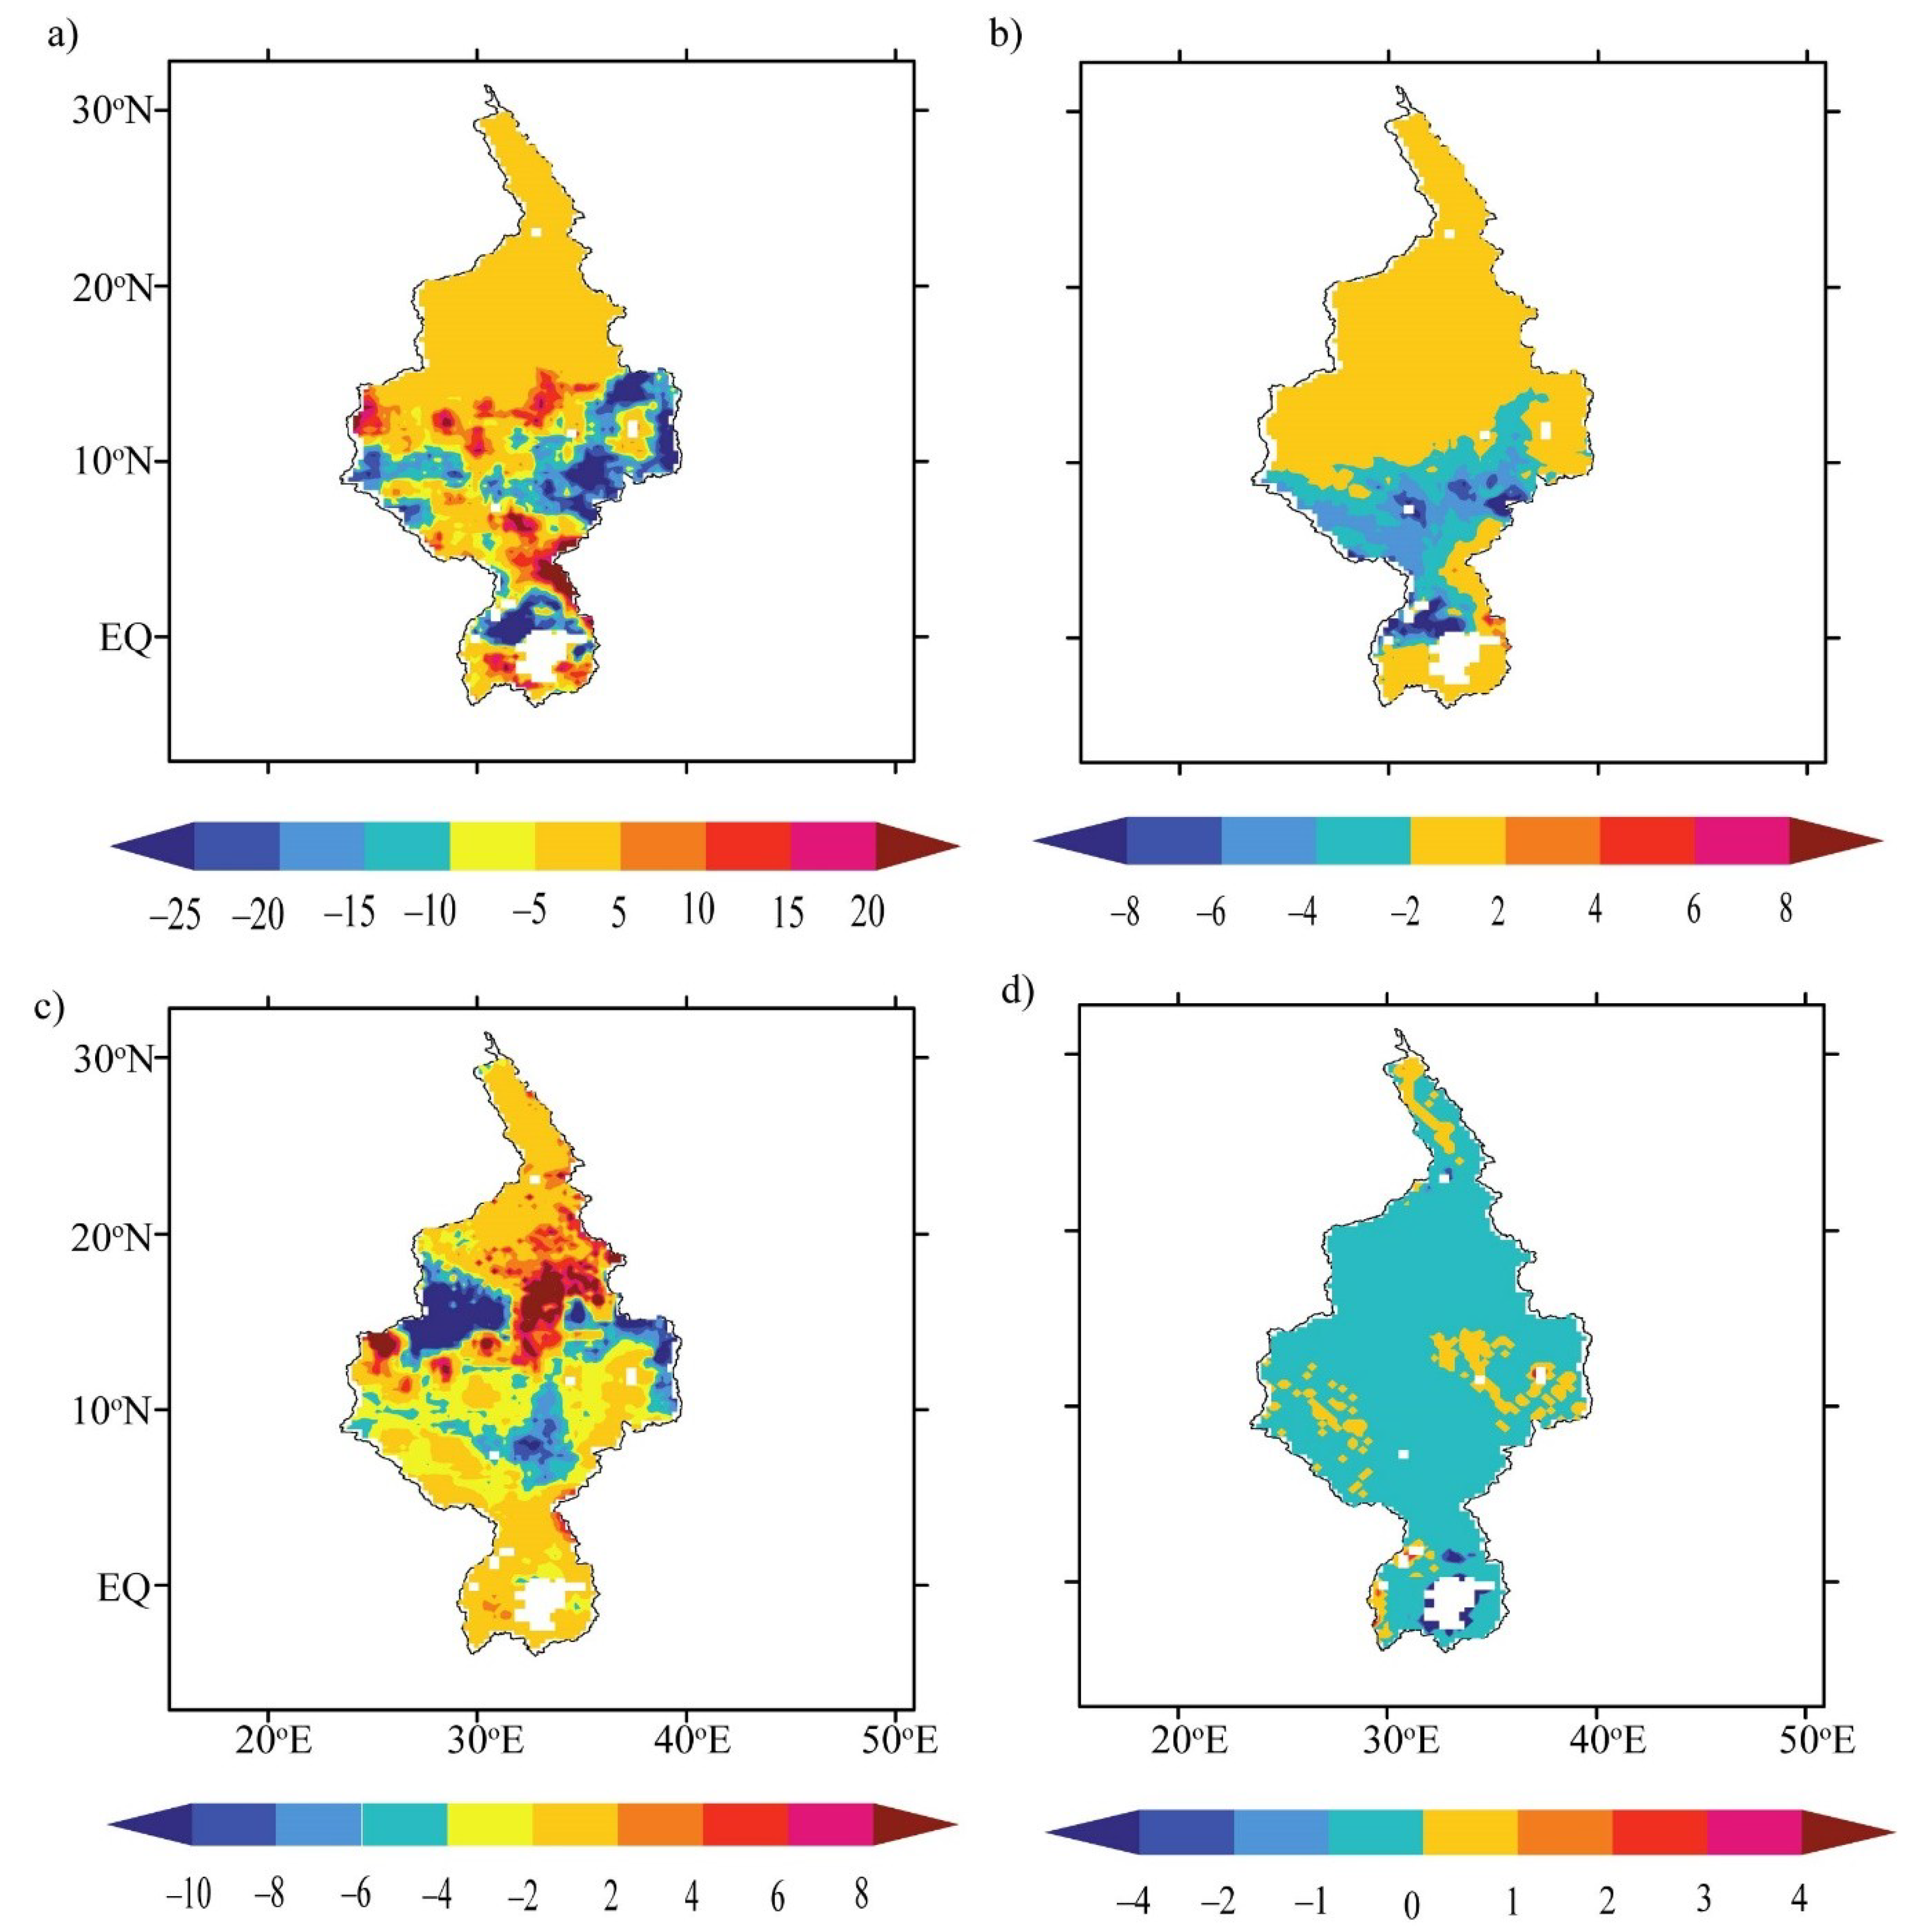
Figure 10 shows the spatial distributions of the linear trends of each ET component in the region for the period 1980–2014 (expressed in unit mm/10 years). Generally, significant differences were observed in spatiotemporal trends in each ET component. Figure 10a shows the trend in Et was observed in most parts (at an increasing rate of 5 mm/10 years) and few areas showed increasing trends ≥15 mm/10 years (in the middle and upper regions).
Eb showed a slight increasing trend (2 mm/10 years), mostly in the lower reaches of the basin, Northern Sudan, and portions of the middle and upper reaches (Figure 10b). However, a relatively high decreasing trend was found in the southwestern part of the middle reach at a rate of 6 mm/10 years (3–9 mm/10 years). Ei showed a complex and mixed pattern of trend in the upper and middle reaches with a decreasing trend, while the lower reach showed an increasing trend (>2–8 mm/10 years) (Figure 10c). Ew generally showed a significantly constant decrease (at a rate of −4 mm/10 years) in the entire basin except for areas with open water bodies, which showed increases of 1 mm/10 years (Figure 10d).
3.4. Proportions of Each Component
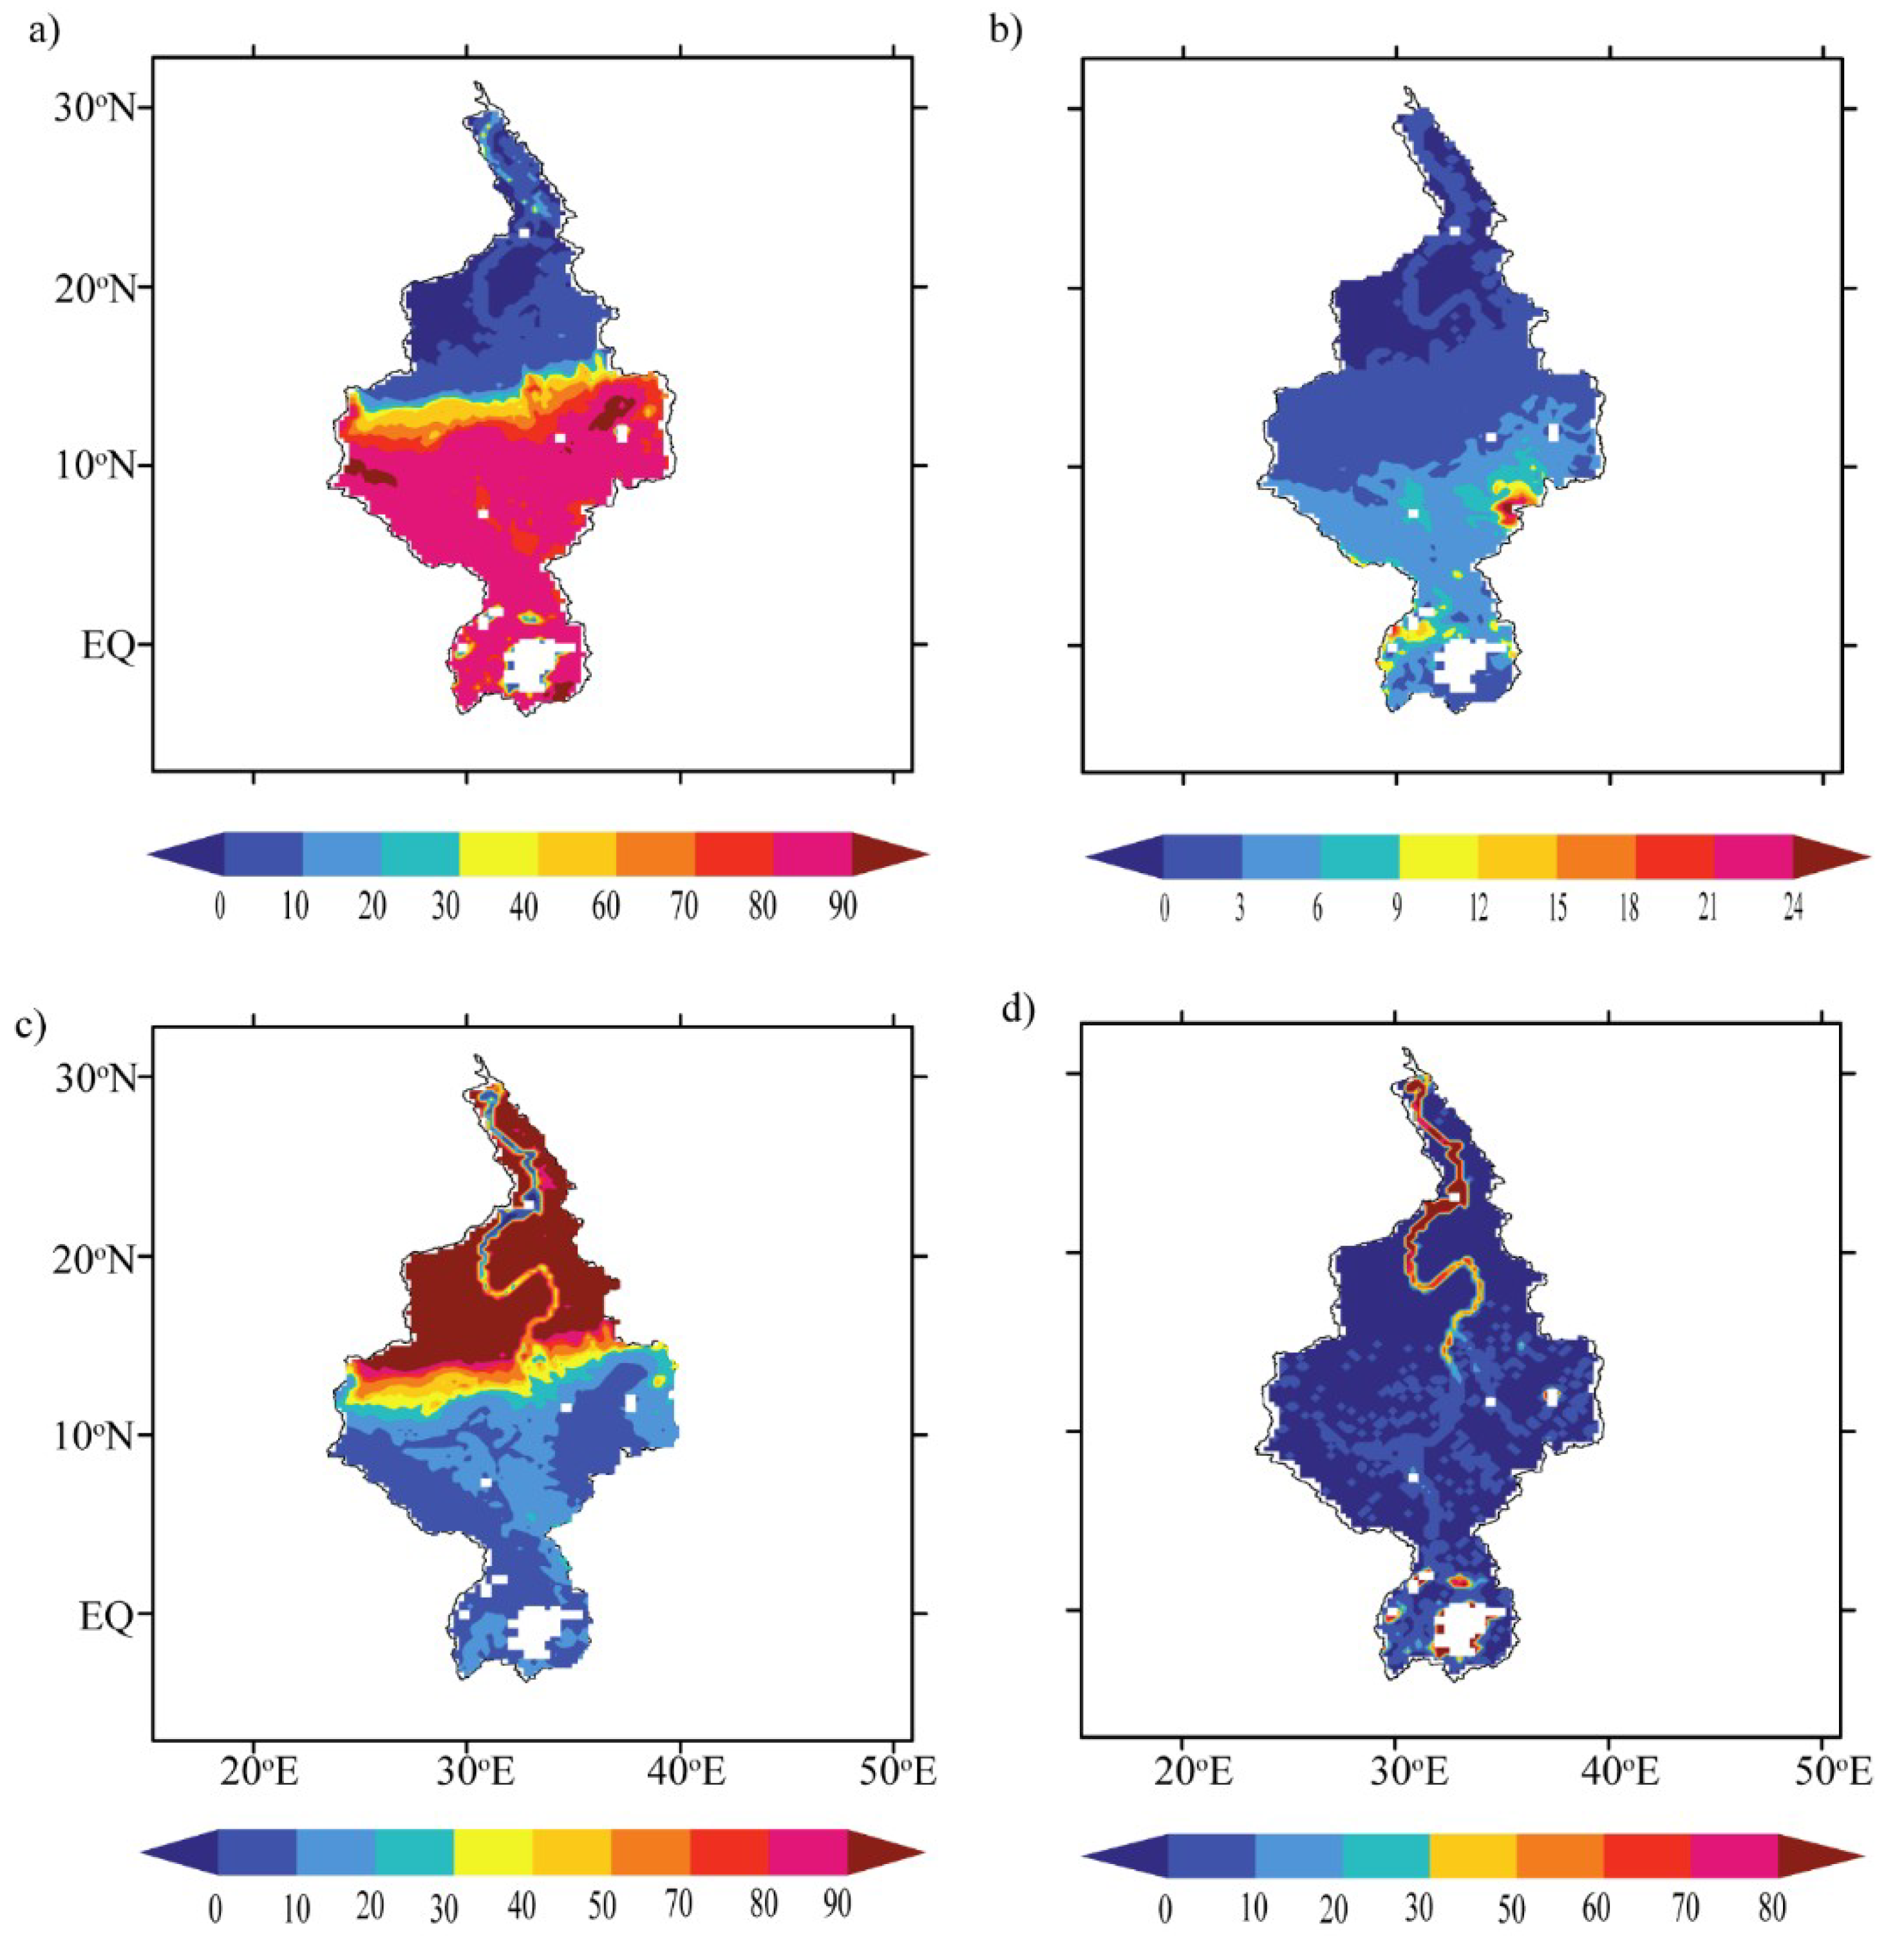
We quantified the proportions of the different ET components to determine their respective contributions to the terrestrial water cycle. This was able to improve our understanding of the contribution amount of each component and the extent to which each component changes in space (Figure 11) and time (Figure 12). Figure 11 shows the seasonal amount of the different ET components in the region. The proportion of Et appears to be very high in areas below the Sahelian region toward the equatorial region and has low values in arid areas (Figure 11a).
The proportions of the Ei spatial contribution were generally low across the entire basin, except for small patches in the basin (Figure 11b). The proportions of Eb (Figure 11c) were very high in bare soil areas in arid areas and very low in forested areas in the middle and upper reaches (Figure 11c). The proportions of Ew were limited to large open water bodies and channels but had generally very low contributions to total ET in the remaining basin (Figure 11d).
Figure 12 shows the monthly proportions of each component’s contribution to total ET in the region. The proportions of Et appeared to dominate, with an average of 78.1% (68%–89%), and exhibited strong seasonality. We observed a seasonal variation in Ei with a steady increase from 9.8% to 21% in the summer months (with an average of 15.1%). The remaining proportion of ET components (Eb and Ew) showed an average contribution of 3.9% and 2.9%, respectively. We further examined the magnitude of each component’s contribution to total ET and their rate of change (1980–2014) in the Nile Basin.
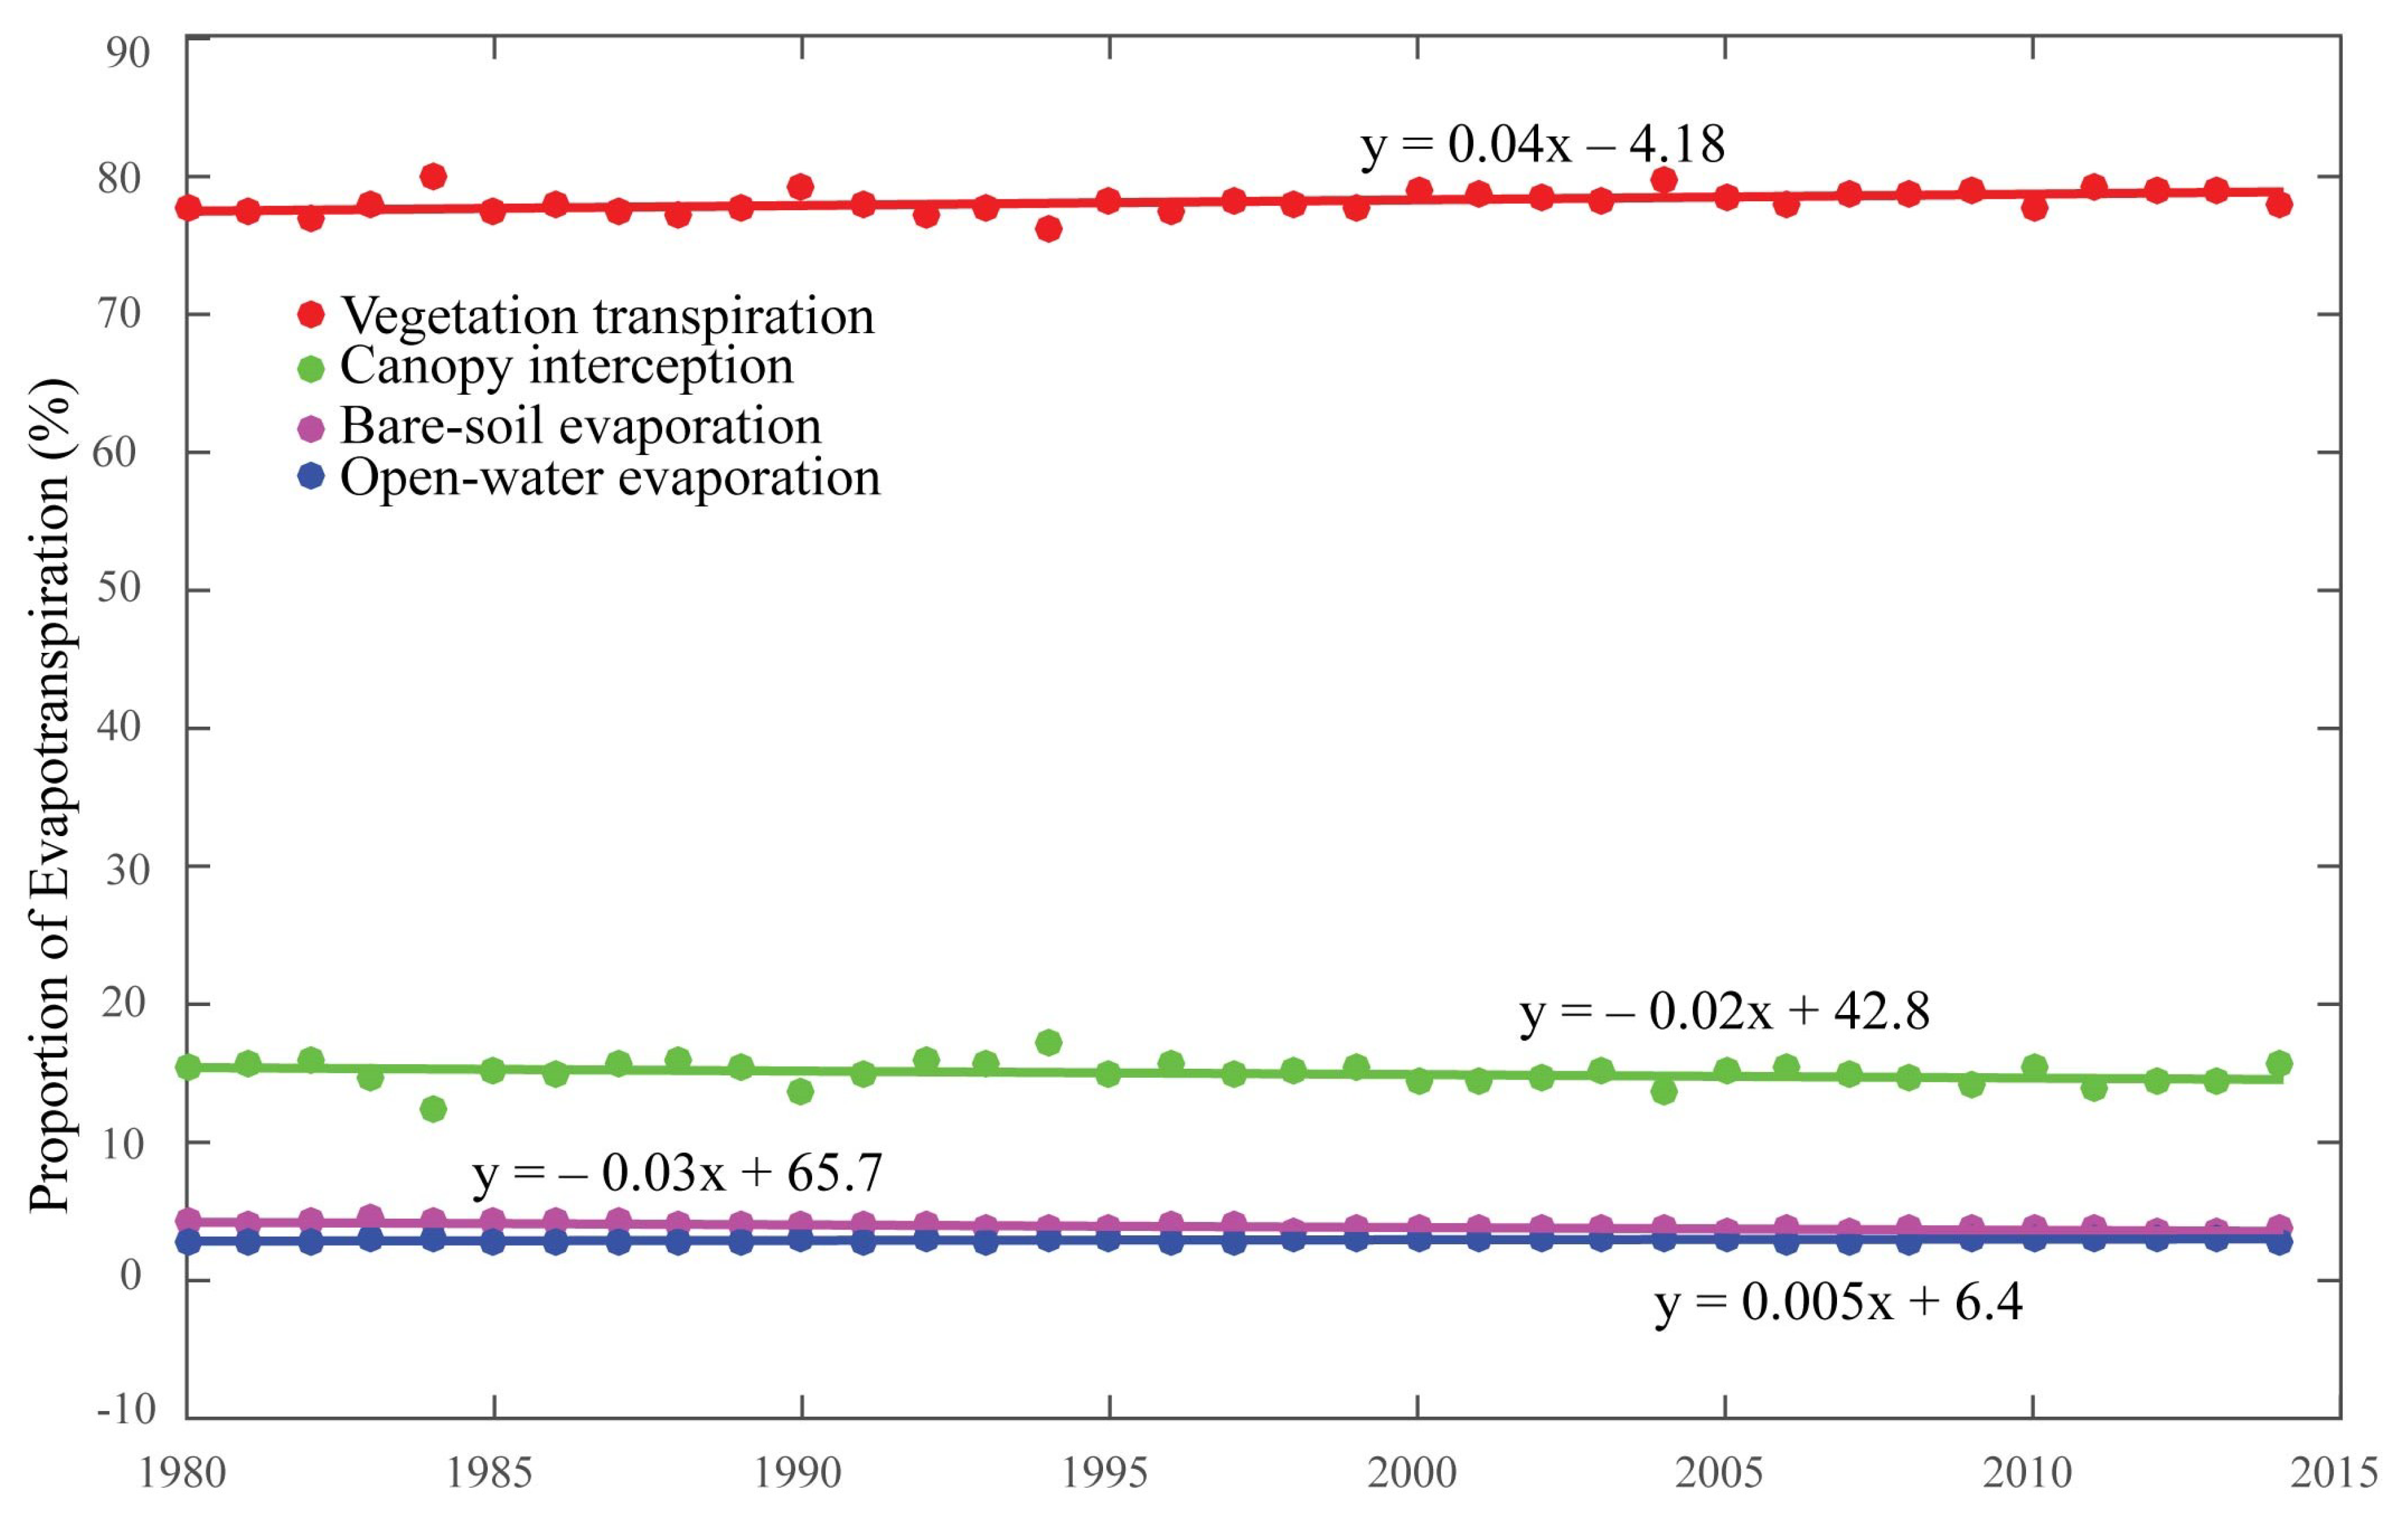
Figure 13 shows the interannual variations in ET and its components’ contributing proportions to land ET for the period 1980–2014 over the Nile Basin. The proportions of Et and Ew showed a slightly increasing trend for the 35-year period. By contrast, proportions of Ei and Eb revealed a slightly decreasing trend over the same period. Et was the largest contributor to terrestrial ET, followed by Ei, Eb, and Ew.
3.5. Dynamic Mechanism
Environmental and biophysical controls play important roles in regulating terrestrial ET on diurnal to interannual time scales. Often characterized by climatic variables of precipation and net solar radiation, ET varies significantly with land surface variables [54]. Thus, to examine the underlying factors that contribute to these variations in ET and its components, we investigated the relationship between ET and climatic factors such as P and Rn. Here, we present two kinds of analysis. First, we studied the influence of P and Rn on the spatial pattern of ET and its components. For this purpose, we analyzed the correlation between ET, its components, and the two climatic variables to understand the spatial dynamics. To achieve this, P, Rn, ET, and its components’ data were contructed with the multi-year mean on each pixel, upon which correlation analysis was performed. Since P and Rn interactions with each other may lead to compounding effects, we also used partial correlation analysis to eliminate these effects. Secondly, we performed pixel-wise correlation with each variable on an annual scale to understand the temporal dynamics.
The correlation analysis (R) of ET and its components with P and Rn is presented in Table 2. Overall, terrestrial total ET variability was mainly explained by changes in P in the region as the P relationship accounted for 0.91 of ET variability (Table 2). This result is consistent with findings of Zhang et al., who reported an R value of 0.85 [56].
Rn versus ET and its components was significant (p ≤ 0.05); however, their relationship was considerably weaker (R ≤ 0.22) (Table 2). This indicates that Rn was not a limiting driver of ET variability in the region. The negative correlation of Rn with ET occurred because of lower radiation due to frequent cloud cover associated with wet seasons.
The correlation analysis of the ET components with P and Rn are presented in Table 2. Et and Ei had a significant positve correlation coefficient (R) with P as they accounted for 0.92 and 0.74, respectively. This results agrees well with Donohue et al.’s [57] findings that vegetation cover controls and is correlated with interannual variability in ET in some regions of the world.
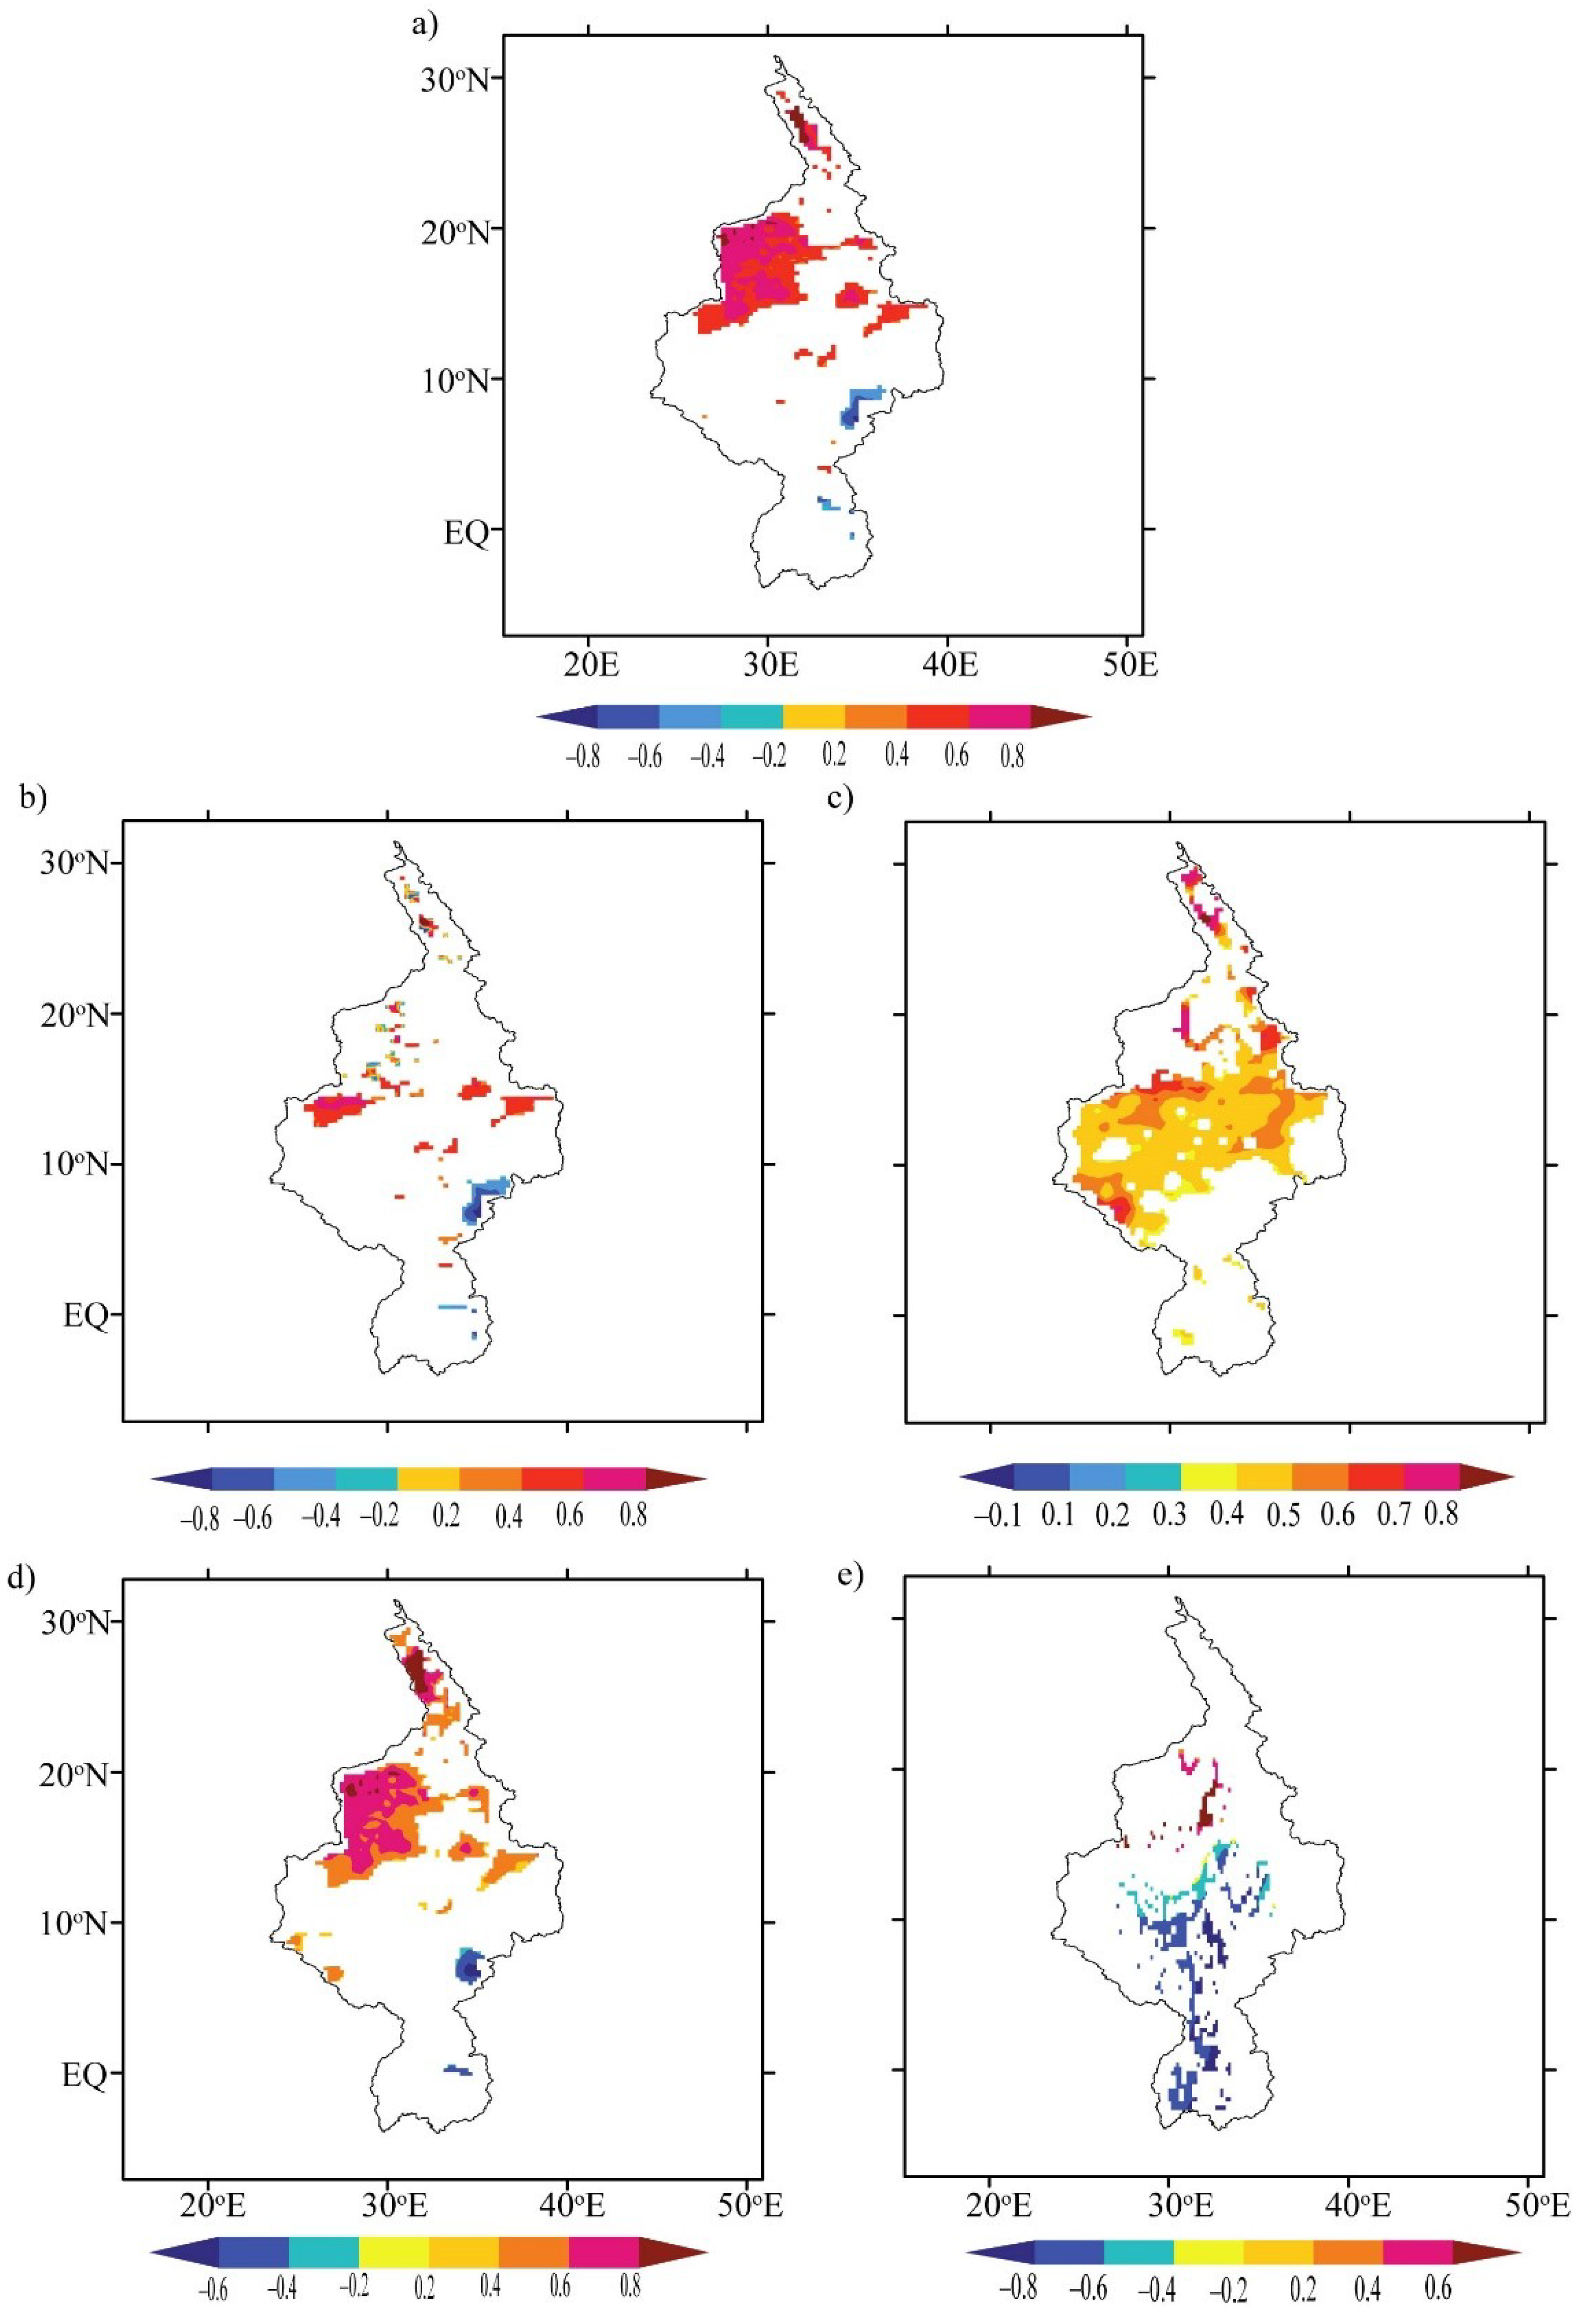
We also computed the pixel-wise correlation coefficients with P and Rn using annual values over the study period to understand the temporal dynamics of total ET and its components. Figure 14 and Figure 15 graphically illustrate the pixel-wise correlation and significance between ET and the environmental factors P and Rn. In Figure 14, the spatial correlations of P with ET and its components were positive and significant (R ≥ 0.5, p < 0.05), mainly in the arid and semi-arid climates where P is a limiting factor. Correlation coefficient values for Et and Eb with P were positive and significant (R ≥ 0.5). Soil moisture availability in these dry regions mainly occurs due to irrigated crop fields and frequent small rainfall. This result is consistent with Douglas et al. [58] who found that intensive irrigation in the dry regions (in arid and semi-arid areas) introduces significant latent heat from transpiration Et and physical evaporation from the adjacent bare soil. Positive and significant R values for Ei due to increased foliage are consistent with the trend of greening in the Sahel region and arid climatic zones and increased CO2 fertilization effects [57].
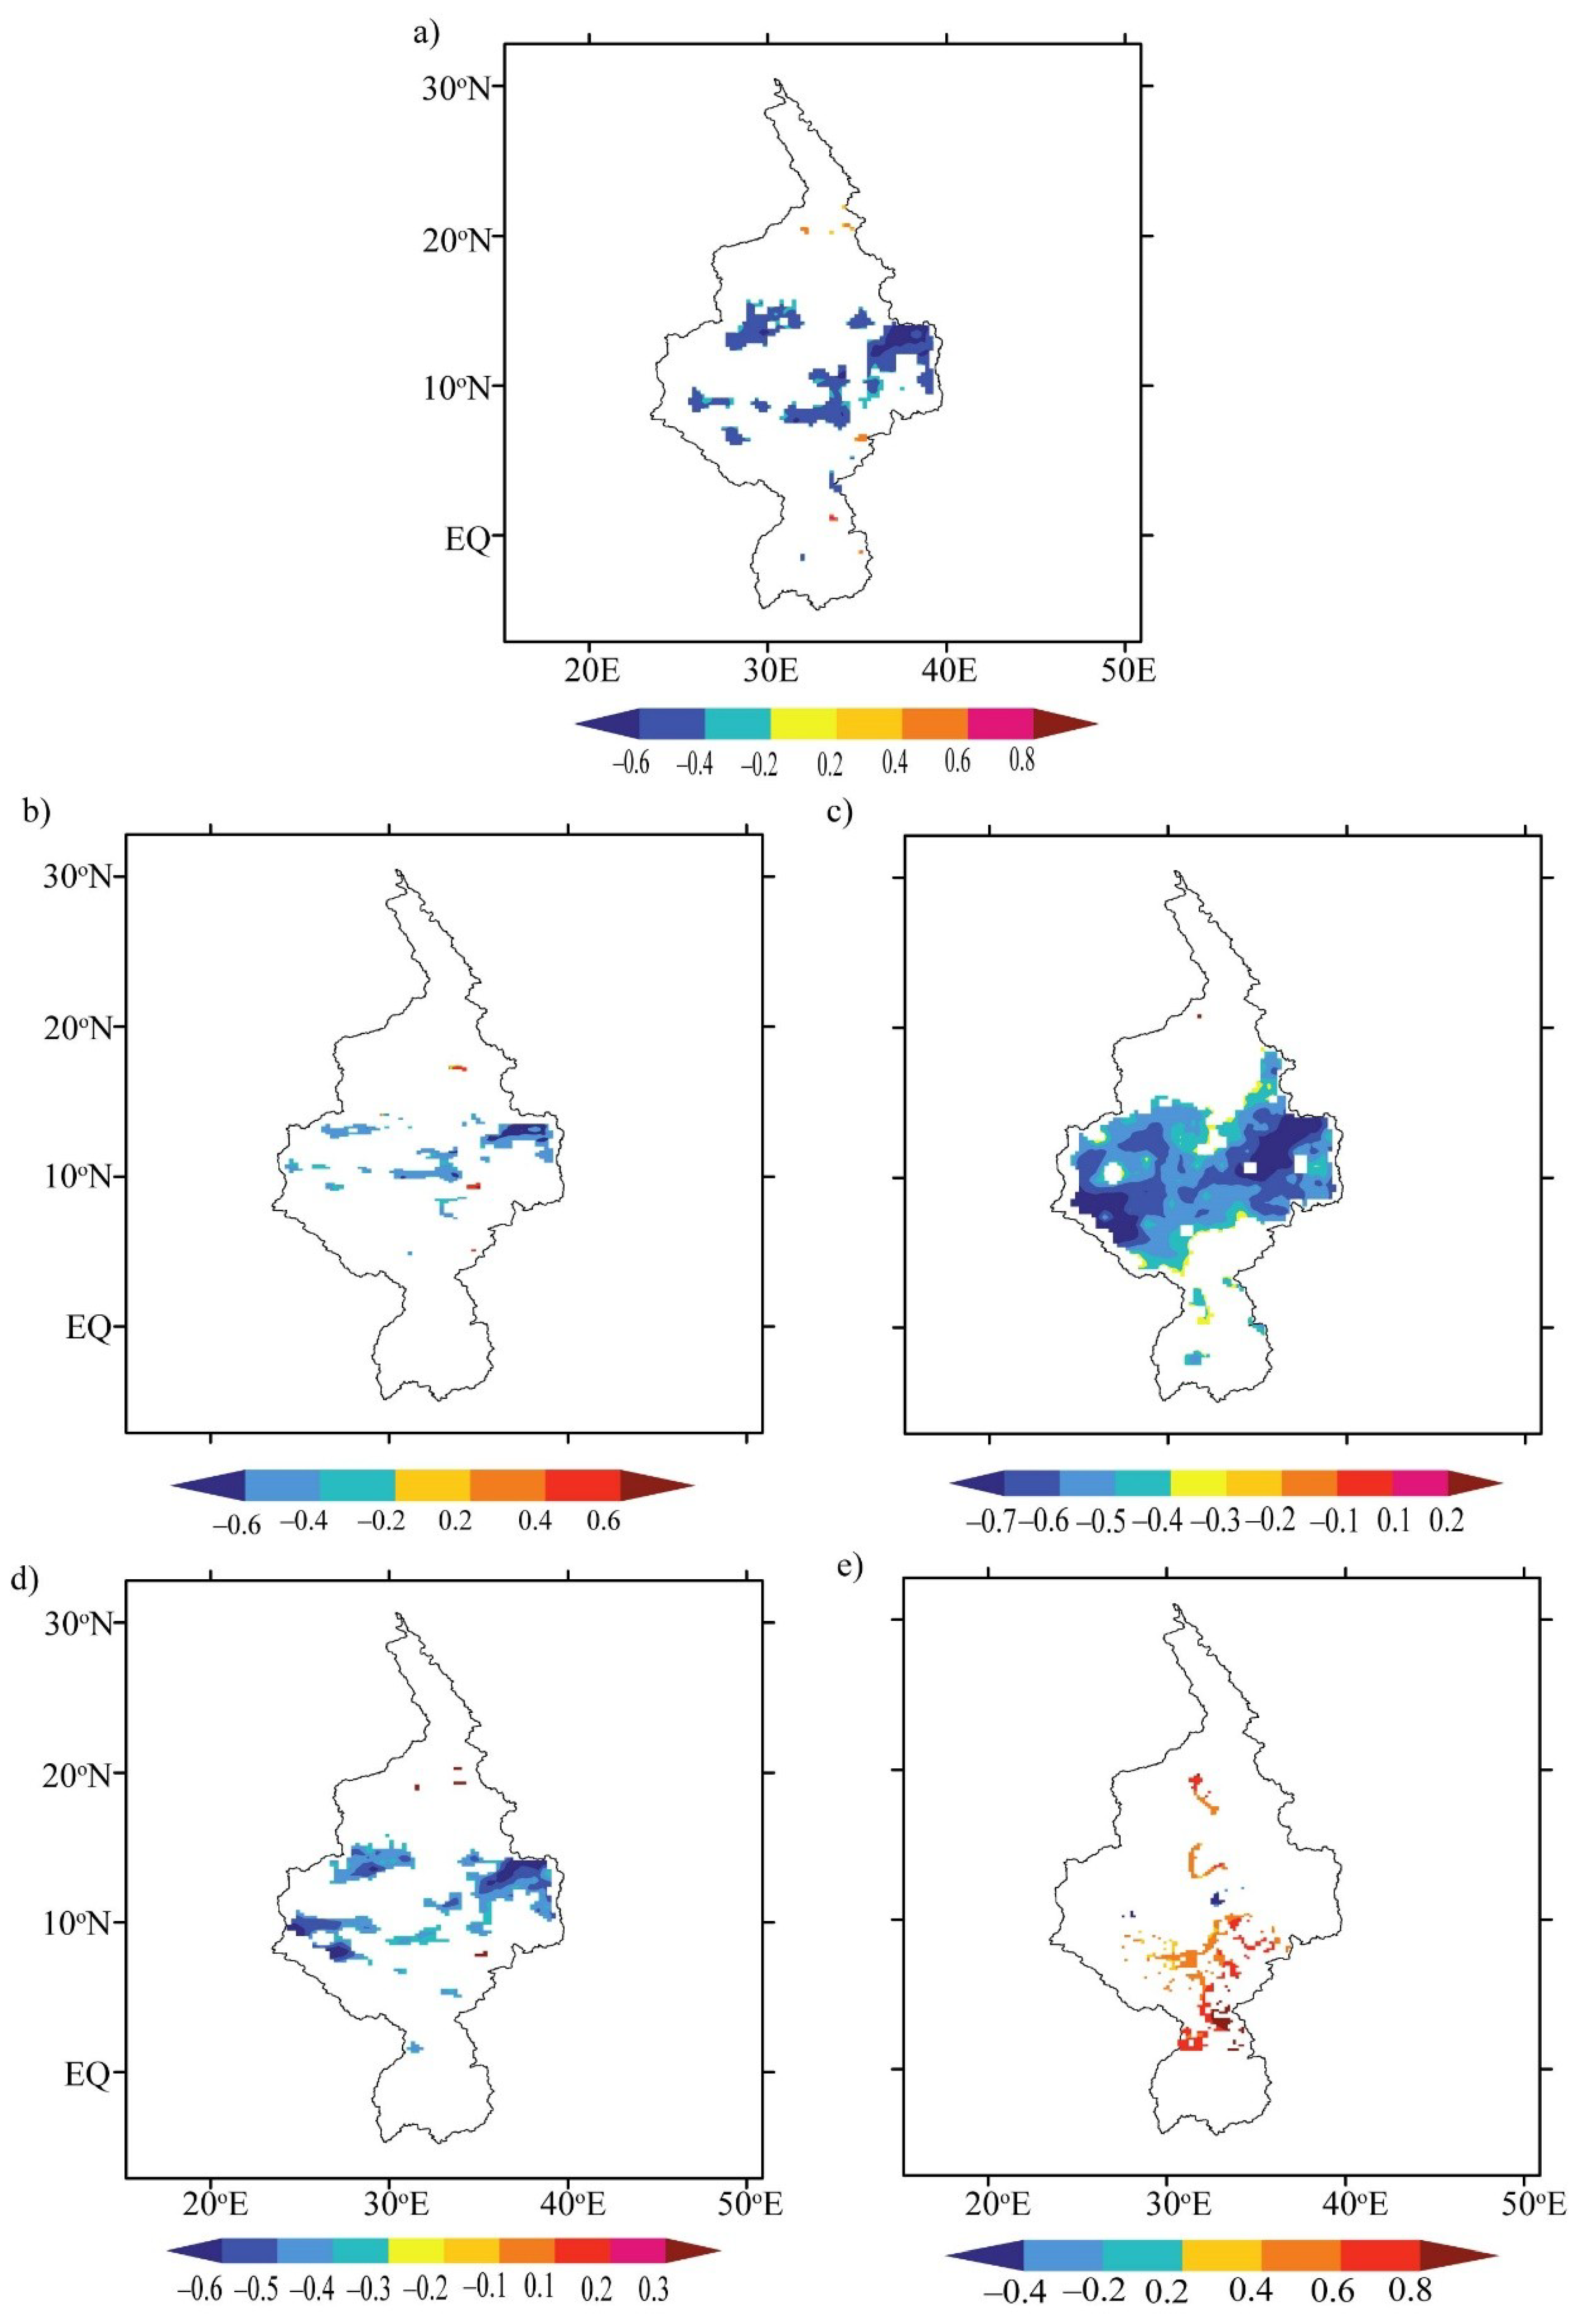
The humid regions (i.e., the upper reach) showing insignificant correlations with P was expected as P plays a slightly weaker role in controlling ET variability. Conversely, in Figure 15, Rn shows a similar magnitude but a negative correlation coefficient (R ≥ −0.5, p < 0.05) with ET and its components’ variability except for Ew (Figure 15e) in arid and semi-arid conditions. These results are consistent with eco-climatic conditions where the hydrologic cycle is dominated by the water supply [59,60].
Rn was expected to exert strong control on ET in the upper reach, that is, the humid/wet regions. However, the results, which showed no correlation with Rn, are most probably explained by increased cloud cover associated with wet years in the upper reach where radiation is strongly reduced in wet seasons, as noted by Ukkola and Prentice [60].
4. Discussion
In this work, we used the state-of-the-art process-based GLEAM ET product to analyze long-term spatiotemporal variations in land ET and its components in the Nile River Basin. The introduction of GLEAM v3a provided added value and highlights the importance of how updates in model assumptions and different forcing input data impact models’ ability to represent the spatial and temporal variability in ET and its components. Although this section does not seek to compare GLEAM v3a with other GLEAM versions as that is beyond the scope of this paper, we highlight some of these modifications in model assumptions and different forcing data inputs.
Here, we have examined terrestrial ET and its components over the Nile River Basin to understand their long-term variations and their relative contributions to the hydrological budget. We validated GLEAM ET with FLUXNET as a reference dataset. Our validation results indicate that GLEAM ET accuracy is reasonable (R2 = 0.82 and RMSD = 21.33 mm/year) despite a slight overestimation in GLEAM ET (MAE, 14.73 mm/year and BIAS, 0.96 mm/year) (Figure 2).
Interannual variability analysis revealed that the magnitude and temporal variation are reasonable and consistent with mean annual P over the region [9,24]. ET and its components in the Nile River Basin followed a distinct seasonal cycle, with ET peaking in wet seasons and minima occurring in dry seasons [24,28]. The ET peak in September, falling to the minimum in winter (February), explains the distinct ET climatology of the region and indicates how different vegetation species assimilate available energy and water across the various climatic regions [61]. Trend analysis (Figure 5) showed ET decreases by 18.8 mm·year–10 for 1980–2014.
This decreasing trend is related to interannual P variability and agrees with previous studies in the region [24,27,62]. Also, areas with slight increases in ET trends were mainly located in arid regions and some parts of semi-arid regions (Figure 6a) where water availability is affected by large-scale irrigation fields. The trajectories of spatially averaged ET with the four main vegetation covers in the region (Figure 7) showed that high ET occurs in tropical forests, savanna, and cropland, with the least amount of ET in grassland, which is consistent with Miralles et al. [13].
All four major vegetation types showed a decadal decrease in ET with forest and savanna showing the largest ET decline. This agrees well with Sterling et al. [51], who concluded that tropical forest and savanna are hotspots for decreasing ET. On an annual (Figure 8) and seasonal (Figure 9) basis, the different ET components responded differently in the amount of ET to different environmental and biological (vegetation) conditions. The different ET components showed strong seasonality over the region, with high monthly values in wet seasons compared with dry seasons (Figure 9) across the different climatic regions (Figure 10). The ET regime is a complex of both biological and physical fluxes.
Et in the humid-semi-humid areas largely depended on plant phenology and water use efficiency, whereas Ei’s contribution was high in parts of humid regions with higher frequency rainfall and type of vegetation species (Figure 11a,b). Eb in arid and semi-arid regions (Figure 11c) was mostly driven by atmospheric demand for vapor, the amount of water in the soil, and vegetation cover.
Our analysis of ET components showed that Et accounted for 78.1% of ET, Ei for 15.1%, Eb for 3.9%, and Ew for 2.9% (Figure 12). Et was a major contributor of total ET (78%) and its peak in September provides insight into the total ET climatology of the region (Figure 4). These findings are consistent with the literature that has reported Et dominance in terrestrial water fluxes [63,64] and indicates the important role of biological processes in the water cycle response to climate change. These findings further our understanding of Nile River Basin water dynamics and implications for future development of hydrological models in the region.
The model artifacts and updates in forcing inputs may explain our findings from this study. GLEAM v3a provides the added value of using multiple soil moisture and P input data and detailed specification of vegetation phenology using VOD compared to older GLEAM versions [12,65]. The quality of the soil moisture data applies both the improved drainage formulation and the optimized data assimilation algorithm. Using VOD to quantify changes in vegetation phenology of both short and tall vegetation improves the information from phenological controls of vegetation under cloudy conditions. Vegetation phenology is a function of the stress function calculated from VOD, where a high VOD range implies tall vegetation and a small value implies short vegetation.
Many studies have identified water (i.e., P) and energy supply (i.e., Rn) as two key variables that limit ET variability. Therefore, the distribution of these variables in both space and time, together with their strength of correlation with ET and its components, may significantly improve our understanding of the annual and seasonal dynamics of ET in the Nile Basin. The results show that the variability in ET and its components is closely controlled by variability in P (R2 = 0.91). This finding supports Teuling et al.’s [19] hypotheses and agrees with previous studies that P is the main limiting driver of ET variability in a region [24,62], except for Ew (Table 2).
In most parts of the basin, the variability in ET and its components is explained by P dynamics (0.5 ≤ R2 ≤ 0.8), especially in arid and semi-arid regions of the basin that experience either occurrences of short rainfall events or water availability from nearby irrigated crop fields in the Nile plain area (Figure 14). This characteristic of the region (i.e., that the area is essentially driven by P) was possibly more highlighted in the model due to the multiple satellite soil moisture inputs used, as these are sensitive to precipitation events. The choice of VOD as a proxy for vegetation dynamics as input data may further explain the results in semi-arid areas due to its superiority over NDVI as NDVI is prone to saturation effects in areas where vegetation is sensitive to interannual P variations, specifically in semi-arid areas. This finding complements previous studies in the region on the reliability, confidence, and usefulness of updating remote sensing data products. Also, this information may provide water resource planners or irrigation managers with two useful pieces of information: firstly, how to quantify these changes, and, secondly, how these changes translate into long-term changes in ET and its components.
Conversely, Rn was often found to be weakly and negatively correlated with ET and its components (Table 2). This was expected as the basin lies in a region with a relatively ample and stable energy supply with P changes determined by the movement of the ITCZ (Figure 15). Overall, this study complements previous studies that have analyzed long-term annual and seasonal ET variations in the area and provides a further extension with which to include and analyze ET components, which improves our understanding of their relative importance in the total land ET as well as their trends in a warming climate.
5. Conclusions
In this study, computed GLEAM ET estimates were successfully validated against eddy covariance flux tower ET (FLUXNET ET) data with most places largely overestimating ET. The process-based GLEAM product was used to produce a map of ET and its components in the Nile Basin. On annual and seasonal bases, ET and its components showed strong variability in the region. The multi-year mean ET was 500 mm·year–1 with a range of 200 to >900 mm·year–1, which agrees closely with the values reported in the literature. The analysis showed strong seasonal and spatial ET variations, with lowest values (19 mm) in winter and the highest (69 mm) in autumn.
GLEAM ET components showed that Et is a major contributor to total ET (78.1% of ET), with the remaining accounting for 15.1% for Ei, 3.9% for Eb, and 2.9% for Ew. Et was shown to peak in autumn, similarly to total ET, indicating how vegetation assimilates available energy and water in the region. The long-term ET significantly decreasing at 18.8 mm·year–10 over the region probably suggests water stress (a P deficit). The relative contribution of Et to ET is dominant, suggesting the significant role played by biological fluxes in the region’s water dynamics.
Our analysis of the effects of ET indicated a significant relationship with P rather than Rn in the region. High long-term mean annual ET values were found in forests, savanna, and cropland, signaling the role of vegetation cover in ET trajectory. Variations in annual ET and its components showed a negative trend with vegetation cover, indicating ET loss from vegetation. These findings further our understanding of the water dynamics in the region and have important implications for future regional water resources planning under the influence of both climatic and anthropogenic factors. The design of GLEAM v3a experiments and using several static input data sets for describing the soil properties and land cover suggest that the quality of input static data sets improves when optimized.
We have here demonstrated that ET and its components are important parts of the water balance in the region, which complements previous studies on this area. Our analysis contributes information on the reliability, confidence, and usefulness of remote sensing data products in capturing the water dynamics of a region. Water resources planners may rely with confidence on remote sensing data for hydrological modelling and water resource management strategies at a basin scale.
Author Contributions
Conceptualization, I.K.N. and G.W.; data curation, I.K.N., G.W. and J.L.; methodology, I.K.N., G.W., and J.L.; resources, G.W.; supervision, G.W. and D.F.T.H; validation, D.F.T.H. and S.L.; visualization, W.U. and D.F.T.H.; writing—original draft, I.K.N.; writing—review and editing, I.K.N., G.W., D.F.T.H. and W.U.
Funding
This research was funded by the National Natural Science Foundation of China (41875094), the National Key Research and Development Program of China (2017YFA0603701), and the Sino-German Cooperation Group Project (GZ1447).
Acknowledgments
We extend our special gratitude to the developers, managers, and funding agencies of GLEAM data (https://www.gleam.eu), ECMWF ERA-interim data (http://apps.ecmwf.int/), FLUXNET eddy covariance data (http://fluxnet.fluxdata.org), NASA MODIS land cover/use products (https://lpdaac.usgs.gov/), and SRTM3 digital elevation data (http://srtm.csi.cgiar.org/index.asp) for granting access to these essential datasets in accordance with their specific data use and citation policies.
Conflicts of Interest
The authors declare no conflict of interest.
Appendix A
Figure A1.
Nile Basin: (a) Mean Precipitation for the Nile based on European Center for Medium-Range Weather Forecasts (ECMWF) reanalysis (ERA-40) estimates (b) Annual mean Temperature distribution over the Nile River Basin based on European Center for Medium-Range Weather Forecasts (ECMWF) reanalysis (ERA-40) estimates.

References
- Wang, K.; Dickinson, R.E. A review of global terrestrial evapotranspiration: Observation, modeling, climatology, and climatic variability. Rev. Geophys. 2012, 50. [Google Scholar] [CrossRef]
- Verstaeten, W.; Veroustraete, F.; Feyen, J. Assessment of evapotranspiration and soil moisture content across different scales of observation. Sensors 2008, 8, 70–117. [Google Scholar] [CrossRef] [PubMed]
- Yang, X.; Yong, B.; Ren, L.; Zhang, Y.; Long, D. Multi-scale validation of gleam evapotranspiration products over china via chinaflux et measurements. Int. J. Remote Sens. 2017, 38, 5688–5709. [Google Scholar] [CrossRef]
- Roderick, M.L.; Farquhar, G.D. The cause of decreased pan evaporation over the past 50 years. Science 2002, 298, 1410–1411. [Google Scholar] [PubMed]
- Senay, G.B.; Gowda, P.H.; Bohms, S.; Howell, T.A.; Friedrichs, M.; Marek, T.H.; Verdin, J.P. Evaluating the ssebop approach for evapotranspiration mapping with landsat data using lysimetric observations in the semi-arid texas high plains. Hydrol. Earth Syst. Sci. Discuss. 2014, 11, 723–756. [Google Scholar] [CrossRef]
- Brutsaert, W. Indications of increasing land surface evaporation during the second half of the 20th century. Geophys. Res. Lett. 2006, 33, L20403. [Google Scholar] [CrossRef]
- Hobbins, M.T.; Dai, A.; Roderick, M.L.; Farquhar, G.D. Revisiting the parameterization of potential evaporation as a driver of long-term water balance trends. Geophys. Res. Lett. 2008, 35. [Google Scholar] [CrossRef] [Green Version]
- Alemayehu, T.; Griensven, A.v.; Senay, G.B.; Bauwens, W. Evapotranspiration mapping in a heterogeneous landscape using remote sensing and global weather datasets: Application to the mara basin, east africa. Remote Sens. 2017, 9, 390. [Google Scholar] [CrossRef]
- Mueller, B.; Seneviratne, S.I.; Jimenez, C.; Corti, T.; Hirschi, M.; Balsamo, G.; Ciais, P.; Dirmeyer, P.; Fisher, J.B.; Guo, Z.; et al. Evaluation of global observations-based evapotranspiration datasets and ipcc ar4 simulations. Geophys. Res. Lett. 2011, 38. [Google Scholar] [CrossRef]
- Seneviratne, S.I.; Corti, T.; Davin, E.L.; Hirschi, M.; Jaeger, E.B.; Lehner, I.; Orlowsky, B.; Teuling, A.J. Investigating soil moisture–climate interactions in a changing climate: A review. Earth Sci. Rev. 2010, 99, 125–161. [Google Scholar] [CrossRef]
- Zhang, Y.; Kang, S.; Ward, E.J.; Ding, R.; Zhang, X.; Zheng, R. Evapotranspiration components determined by sap flow and microlysimetry techniques of a vineyard in northwest china: Dynamics and influential factors. Agric. Water Manag. 2011, 98, 1207–1214. [Google Scholar] [CrossRef]
- Martens, B.; Miralles, D.G.; Lievens, H.; van der Schalie, R.; de Jeu, R.A.M.; Fernández-Prieto, D.; Beck, H.E.; Dorigo, W.A.; Verhoest, N.E.C. Gleam v3: Satellite-based land evaporation and root-zone soil moisture. Geosci. Model Dev. 2017, 10, 1903–1925. [Google Scholar] [CrossRef]
- Miralles, D.G.; De Jeu, R.A.M.; Gash, J.H.; Holmes, T.R.H.; Dolman, A.J. Magnitude and variability of land evaporation and its components at the global scale. Hydrol. Earth Syst. Sci. 2011, 15, 967–981. [Google Scholar] [CrossRef] [Green Version]
- Miralles, D.G.; Holmes, T.R.H.; De Jeu, R.A.M.; Gash, J.H.; Meesters, A.G.C.A.; Dolman, A.J. Global land-surface evaporation estimated from satellite-based observations. Hydrol. Earth Syst. Sci. 2011, 15, 453–469. [Google Scholar] [CrossRef] [Green Version]
- Yang, X.; Wang, G.; Pan, X.; Zhang, Y. Spatio-temporal variability of terrestrial evapotranspiration in china from 1980 to 2011 based on gleam data. Trans. Chin. Soc. Agric. Eng. 2015, 31, 132–141. [Google Scholar]
- Miralles, D.G.; van den Berg, M.J.; Gash, J.H.; Parinussa, R.M.; de Jeu, R.A.M.; Beck, H.E.; Holmes, T.R.H.; Jiménez, C.; Verhoest, N.E.C.; Dorigo, W.A.; et al. El niño–la niña cycle and recent trends in continental evaporation. Nat. Clim. Chang. 2013, 4, 122–126. [Google Scholar] [CrossRef]
- Camberlin, P.; Martiny, N.; Philippon, N.; Richard, Y. Determinants of the interannual relationships between remote sensed photosynthetic activity and rainfall in tropical africa. Remote Sens. Environ. 2007, 106, 199–216. [Google Scholar] [CrossRef]
- Philippon, N.; Jarlan, L.; Martiny, N.; Camberlin, P.; Mougin, E. Characterization of the interannual and intraseasonal variability of west african vegetation between 1982 and 2002 by means of noaa avhrr ndvi data. J. Clim. 2007, 20, 1202–1218. [Google Scholar] [CrossRef]
- Teuling, A.J.; Hirschi, M.; Ohmura, A.; Wild, M.; Reichstein, M.; Ciais, P.; Buchmann, N.; Ammann, C.; Montagnani, L.; Richardson, A.D.; et al. A regional perspective on trends in continental evaporation. Geophys. Res. Lett. 2009, 36. [Google Scholar] [CrossRef] [Green Version]
- Jung, M.; Reichstein, M.; Margolis, H.A.; Cescatti, A.; Richardson, A.D.; Arain, M.A.; Arneth, A.; Bernhofer, C.; Bonal, D.; Chen, J.; et al. Global patterns of land-atmosphere fluxes of carbon dioxide, latent heat, and sensible heat derived from eddy covariance, satellite, and meteorological observations. J. Geophys. Res. 2011, 116. [Google Scholar] [CrossRef] [Green Version]
- Di Baldassarre, G.; Elshamy, M.; van Griensven, A.; Soliman, E.; Kigobe, M.; Ndomba, P.; Mutemi, J.; Mutua, F.; Moges, S.; Xuan, Y.; et al. Future hydrology and climate in the river nile basin: A review. Hydrol. Sci. J. 2011, 56, 199–211. [Google Scholar] [CrossRef]
- Hoscilo, A.; Balzter, H.; Bartholomé, E.; Boschetti, M.; Brivio, P.A.; Brink, A.; Clerici, M.; Pekel, J.F. A conceptual model for assessing rainfall and vegetation trends in sub-saharan africa from satellite data. Int. J. Climatol. 2015, 35, 3582–3592. [Google Scholar] [CrossRef]
- Liebmann, B.; Hoerling, M.P.; Funk, C.; Bladé, I.; Dole, R.M.; Allured, D.; Quan, X.; Pegion, P.; Eischeid, J.K. Understanding recent eastern horn of africa rainfall variability and change. J. Clim. 2014, 27, 8630–8645. [Google Scholar] [CrossRef]
- Alemu, H.; Kaptué, A.; Senay, G.; Wimberly, M.; Henebry, G. Evapotranspiration in the nile basin: Identifying dynamics and drivers, 2002–2011. Water 2015, 7, 4914–4931. [Google Scholar] [CrossRef]
- Pricope, N.G.; Husak, G.; Lopez-Carr, D.; Funk, C.; Michaelsen, J. The climate-population nexus in the east african horn: Emerging degradation trends in rangeland and pastoral livelihood zones. Glob. Environ. Chang. 2013, 23, 1525–1541. [Google Scholar] [CrossRef]
- Swain, A. Challenges for water sharing in the nile basin: Changing geo-politics and changing climate. Hydrol. Sci. J. 2011, 56, 687–702. [Google Scholar] [CrossRef]
- Marshall, M.; Funk, C.; Michaelsen, J. Examining evapotranspiration trends in africa. Clim. Dyn. 2012, 38, 1849–1865. [Google Scholar] [CrossRef]
- Allam, M.M.; Jain Figueroa, A.; McLaughlin, D.B.; Eltahir, E.A.B. Estimation of evaporation over the upper blue nile basin by combining observations from satellites and river flow gauges. Water Resour. Res. 2016, 52, 644–659. [Google Scholar] [CrossRef]
- Kiptala, J.K.; Mohamed, Y.; Mul, M.L.; Van der Zaag, P. Mapping evapotranspiration trends using modis and sebal model in a data scarce and heterogeneous landscape in eastern africa. Water Resour. Res. 2013, 49, 8495–8510. [Google Scholar] [CrossRef]
- Odada, E.O.; Olago, D.O. Holocene climatic, hydrological and environmental oscillations in the tropics with special reference to africa. In Climate Change and Africa; Low, P.S., Ed.; Cambridge University Press: Cambridge, UK, 2005. [Google Scholar]
- Eldaw, A.K.; Salas, J.D.; Garcia, L.A. Long range forecasting of the nile river flows using climatic forcing. J. Appl. Meteorol. 2003, 42, 890–904. [Google Scholar] [CrossRef]
- Nepal, S.; Flugel, W.-A.; Shrestha, A.B. Upstream-downstream linkages of hydrological processes in the himalayan region. Ecol. Process 2014, 3, 1–16. [Google Scholar] [CrossRef]
- Friedl, M.A.; Sulla-DMenashe, D.; Tan, B.; Schneider, A.; Ramankutty, N.; Sibley, A.; Huang, X. Modis collection 5 global land cover: Algorithm refinements and characterization of new datasets. Remote Sens. Environ. 2010, 114, 168–182. [Google Scholar] [CrossRef]
- Miralles, D.G.; Gash, J.H.; Holmes, T.R.H.; de Jeu, R.A.M.; Dolman, A.J. Global canopy interception from satellite observations. J. Geophys. Res. 2010, 115. [Google Scholar] [CrossRef]
- Gash, J.H.C. An analytical model of rainfall interception by forests. Q. J. R. Meteorol. Soc. 1979, 105, 43–55. [Google Scholar] [CrossRef]
- Priestley, C.H.B.; Taylor, R.J. On the assessment of surface heat flux and evaporation using large-scale parameters. Mon. Weather Rev. 1972, 100, 81–92. [Google Scholar] [CrossRef]
- Global Land Evaporation Amsterdam Model Home Page. Available online: www.gleam.eu (accessed on 10 October 2017).
- European Center for Medium-Range Weather Forecasts (ECMWF) Home Page. Available online: http://apps.ecmwf.int/datasets/data/interim-full-daily/levtype=sfc/ (accessed on 10 October 2017).
- Uppala, S.M.; KÅllberg, P.W.; Simmons, A.J.; Andrae, U.; Bechtold, V.D.C.; Fiorino, M.; Gibson, J.K.; Haseler, J.; Hernandez, A.; Kelly, G.A.; et al. The era-40 re-analysis. Q. J. R. Meteorol. Soc. 2005, 131, 2961–3012. [Google Scholar] [CrossRef]
- Dee, D.P.; Uppala, S.M.; Simmons, A.J.; Berrisford, P.; Poli, P.; Kobayashi, S.; Andrae, U.; Balmaseda, M.A.; Balsamo, G.; Bauer, P.; et al. The era-interim reanalysis: Configuration and performance of the data assimilation system. Q. J. R. Meteorol. Soc. 2011, 137, 553–597. [Google Scholar] [CrossRef]
- FLUXNET Home Page. Available online: http://fluxnet.fluxdata.org (accessed on 10 October 2017).
- Li, L.; Chen, X.; van der Tol, C.; Luo, G.; Su, Z. Growing season net ecosystem co2 exchange of two desert ecosystems with alkaline soils in kazakhstan. Ecol. Evol. 2014, 4, 14–26. [Google Scholar] [CrossRef] [PubMed]
- Scanlon, T.M.; Albertson, J.D. Canopy scale measurements of co2 and water vapor exchange along a precipitation gradient in southern africa. Glob. Chang. Biol. 2004, 10, 329–341. [Google Scholar] [CrossRef]
- Merbold, L.; Ardö, J.; Arneth, A.; Scholes, R.J.; Nouvellon, Y.; Grandcourt, A.; de, A.S.; Bonnefond, J.M.; Boulain, N.; Brueggemann, N.; et al. Precipitation as driver of carbon fluxes in 11 african ecosystems. Biogeosciences 2009, 6, 1027–1041. [Google Scholar] [CrossRef]
- Sjöström, M.; Ardö, J.; Eklundh, L.E.-T.; El-Khidir, A.B.; El-Khidir, H.A.M.; Hellström, M.; Pilesjö, P.; Seaquist, J. Evaluation of satellite based indices for gross primary production estimates in a sparse savanna in the sudan. Biogeosciences 2009, 6, 129–138. [Google Scholar] [CrossRef]
- Kutsch, W.L.; Hanan, N.; Scholes, R.J.; McHugh, I.; Kubheka, W.; Eckhardt, H.; Williams, C. Response of carbon fluxes to water relations in a savanna ecosystem in south africa. Biogeosciences 2008, 7, 1797–1808. [Google Scholar] [CrossRef]
- National Aeronautics and Space Administration Home Page. Available online: https://search.earthdata.nasa.gov/granules/download.html?project=0687592433&collection=C200106111-LPDAAC_ECS (accessed on 10 October 2017).
- National Aeronautics and Space Administration (NASA) Shuttle Radar Topography Mission (SRTM) Home Page. Available online: https://lpdaac.usgs.gov/products/srtmgl1v003/ (accessed on 10 October 2017).
- Sen, P.K. Estimates of the regression coefficients based on kendall’s tau. J. Am. Stat. Assoc. 1968, 63, 1379–1389. [Google Scholar] [CrossRef]
- Harper, A.; Baker, I.T.; Denning, A.S.; Randall, D.A.; Dazlich, D.; Branson, M. Impact of evapotranspiration on dry season climate in the amazon forest. J. Clim. 2014, 27, 574–591. [Google Scholar] [CrossRef]
- Sterling, S.M.; Ducharne, A.; Polcher, J. The impact of global land-cover change on the terrestrial water cycle. Nat. Clim. Chang. 2012, 3, 385. [Google Scholar] [CrossRef]
- Phalan, B.; Bertzky, M.; Butchart, S.H.; Donald, P.F.; Scharlemann, J.P.; Stattersfield, A.J.; Balmford, A. Crop expansion and conservation priorities in tropical countries. PLos ONE 2013, 8, e51759. [Google Scholar] [CrossRef]
- Oliveira, T.; Nearing, M.; Moran, M.; Goodrich, D.; Wendland, E. Trends in water balance components across the brazilian cerrado. Water Resour. Res. 2014, 50, 7100–7114. [Google Scholar] [CrossRef]
- Ryu, Y.; Baldocchi, D.D.; Ma, S.; Hehn, T. Interannual variability of evapotranspiration and energy exchange over an annual grassland in california. J. Geophys. Res. 2008, 113. [Google Scholar] [CrossRef]
- Williams, C.A.; Reichstein, M.; Buchmann, N.; Baldocchi, D.; Beer, C.; Schwalm, C.; Wohlfahrt, G.; Hasler, N.; Bernhofer, C.; Foken, T.; et al. Climate and vegetation controls on the surface water balance: Synthesis of evapotranspiration measured across a global network of flux towers. Water Resour. Res. 2012, 48. [Google Scholar] [CrossRef]
- Zhang, Y.; Leuning, R.; Chiew, F.H.S.; Wang, E.; Zhang, L.; Liu, C.; Sun, F.; Peel, M.C.; Shen, Y.; Jung, M. Decadal trends in evaporation from global energy and water balances. J. Hydrometeorol. 2012, 13, 379–391. [Google Scholar] [CrossRef]
- Donohue, R.J.; Roderick, M.L.; McVicar, T.R.; Farquhar, G.D. Impact of co2 fertilization on maximum foliage cover across the globe’s warm, arid environments. Geophys. Res. Lett. 2013, 40, 3031–3035. [Google Scholar] [CrossRef]
- Douglas, E.M.; Niyogi, D.; Frolking, S.; Yeluripati, J.B.; Pielke, R.A.; Niyogi, N.; Vörösmarty, C.J.; Mohanty, U.C. Changes in moisture and energy fluxes due to agricultural land use and irrigation in the indian monsoon belt. Geophys. Res. Lett. 2006, 33. [Google Scholar] [CrossRef]
- Zhan, C.; Yin, J.; Wang, F.; Dong, Q. Regional estimation and validation of remotely sensed evapotranspiration in china. Catena 2015, 133, 35–42. [Google Scholar] [CrossRef]
- Ukkola, A.M.; Prentice, I.C. A worldwide analysis of trends in water-balance evapotranspiration. Hydrol. Earth Syst. Sci. 2013, 17, 4177–4187. [Google Scholar] [CrossRef] [Green Version]
- Hasler, N.; Avissar, R. What controls evapotranspiration in the amazon basin? J. Hydrometeorol. 2007, 8, 380–395. [Google Scholar] [CrossRef]
- Jung, M.; Reichstein, M.; Ciais, P.; Seneviratne, S.I.; Sheffield, J.; Goulden, M.L.; Bonan, G.; Cescatti, A.; Chen, J.; de Jeu, R.; et al. Recent decline in the global land evapotranspiration trend due to limited moisture supply. Nature 2010, 467, 951. [Google Scholar] [CrossRef] [PubMed]
- Jasechko, S.; Sharp, Z.D.; Gibson, J.J.; Birks, S.J.; Yi, Y.; Fawcett, P.J. Terrestrial water fluxes dominated by transpiration. Nature 2013, 496, 347. [Google Scholar] [CrossRef]
- Wang, P.; Yamanaka, T.; Li, X.-Y.; Wei, Z. Partitioning evapotranspiration in a temperate grassland ecosystem: Numerical modeling with isotopic tracers. Agric. For. Meteorol. 2015, 208, 16–31. [Google Scholar] [CrossRef]
- McCabe, M.F.; Ershadi, A.; Jimenez, C.; Miralles, D.G.; Michel, D.; Wood, E.F. The gewex landflux project: Evaluation of model evaporation using tower-based and globally gridded forcing data. Geosci. Model Dev. 2016, 9, 283–305. [Google Scholar] [CrossRef]
Figure 1.
Nile Basin: (a) 30 m Shuttle Radar Topography Mission (SRTM) Digital Elevation Data (DEM) along with the major water bodies found in the basin (b) Moderate Resolution Imaging Spectroradiometer (MODIS) land cover map (MCD12Q1, International Geosphere-Biosphere Programme (IGBP) scheme) for the year 2000 showing the different and major landscapes found in the Nile Basin [33]. Both DEM and MODIS land cover were acquired in the year 2000 by their respective organizations.

Figure 2.
Comparisons of mean monthly ET observations between FLUXNET ET (mm/year) and GLEAM ET for selected sites in Eastern and Southern Africa. The 1:1 line is depicted by a dashed blue line. Red (SD-Dem), green (ZA-Kru), and black (ZM-Mon) dots represent scatterplots of monthly ET for GLEAM and FLUXNET at selected FLUXNET locations.

Figure 3.
The multiple-year annual and seasonal mean terrestrial ET from the period of 1980 to 2014 in the Nile Basin (unit: mm): (a) whole year, (b) spring, (c) summer, (d) autumn, and (e) winter. The GLEAM_v3.1a. GLEAM ET climatology data presented are based on annual and monthly values.
Figure 3.
The multiple-year annual and seasonal mean terrestrial ET from the period of 1980 to 2014 in the Nile Basin (unit: mm): (a) whole year, (b) spring, (c) summer, (d) autumn, and (e) winter. The GLEAM_v3.1a. GLEAM ET climatology data presented are based on annual and monthly values.

Figure 4.
Monthly ET climatology over the period 1980–2014 in the Nile Basin. Error bars represent one standard deviation of uncertainty. The computation is based on the monthly mean distribution of ET over the period. Data are based on GLEAM_v3.1a.
Figure 4.
Monthly ET climatology over the period 1980–2014 in the Nile Basin. Error bars represent one standard deviation of uncertainty. The computation is based on the monthly mean distribution of ET over the period. Data are based on GLEAM_v3.1a.

Figure 5.
Interannual variations in total ET for (a) the whole year and (b) four seasons for the period 1980–2014 in the Nile Basin: a positive (negative) sign indicates an upward (downward) trend.
Figure 5.
Interannual variations in total ET for (a) the whole year and (b) four seasons for the period 1980–2014 in the Nile Basin: a positive (negative) sign indicates an upward (downward) trend.

Figure 6.
Spatial distributions of linear trends of total ET in the Nile Basin for the period 1980–2014: (a) whole year, (b) spring, (c) summer, (d) autumn, and (e) winter. The unit is mm/10 years. Positive (negative) values indicate increasing (decreasing) trends in ET.
Figure 6.
Spatial distributions of linear trends of total ET in the Nile Basin for the period 1980–2014: (a) whole year, (b) spring, (c) summer, (d) autumn, and (e) winter. The unit is mm/10 years. Positive (negative) values indicate increasing (decreasing) trends in ET.

Figure 7.
Interannual variations in total ET during 1980–2014 in four vegetation types of the Nile River Basin. Positive (negative) signs indicates an increasing (decreasing) trend.
Figure 7.
Interannual variations in total ET during 1980–2014 in four vegetation types of the Nile River Basin. Positive (negative) signs indicates an increasing (decreasing) trend.

Figure 8.
Annual amounts of different components of total ET in the Nile Basin for the period 1980–2014 (unit: mm): (a) bare-soil evaporation (Eb), (b) canopy interception (Ei), (c) vegetation transpiration (Et), and (d) open-water evaporation (Ew).
Figure 8.
Annual amounts of different components of total ET in the Nile Basin for the period 1980–2014 (unit: mm): (a) bare-soil evaporation (Eb), (b) canopy interception (Ei), (c) vegetation transpiration (Et), and (d) open-water evaporation (Ew).

Figure 9.
Monthly amounts of different ET components in the Nile Basin during the study period of 1980–2014: (a) Et, and (b) Ei, Eb, and Ew.
Figure 9.
Monthly amounts of different ET components in the Nile Basin during the study period of 1980–2014: (a) Et, and (b) Ei, Eb, and Ew.

Figure 10.
Spatial distributions of linear trends of each ET component in the Nile Basin for the period 1980–2014: (a) Eb, (b) Ei, (c) Et, and (d) Ew.
Figure 10.
Spatial distributions of linear trends of each ET component in the Nile Basin for the period 1980–2014: (a) Eb, (b) Ei, (c) Et, and (d) Ew.

Figure 11.
Seasonal amounts of different components of total ET in the Nile Basin for the period 1980–2014 (unit: mm): (a) Et, (b) Ei, (c) Eb, and (d) Ew.
Figure 11.
Seasonal amounts of different components of total ET in the Nile Basin for the period 1980–2014 (unit: mm): (a) Et, (b) Ei, (c) Eb, and (d) Ew.

Figure 12.
Monthly contribution proportions of different components to land ET averaged in the Nile Basin for 1980–2014.
Figure 12.
Monthly contribution proportions of different components to land ET averaged in the Nile Basin for 1980–2014.

Figure 13.
The interannual variations of each component’s proportion to land ET during the 1980–2014 period in the Nile Basin.
Figure 13.
The interannual variations of each component’s proportion to land ET during the 1980–2014 period in the Nile Basin.

Figure 14.
Pixel-wise correlation coefficients between total ET and its components with P in the Nile River Basin for 1980–2014: (a) total ET, (b) transpiration, (c) canopy interception, (d) bare-soil evaporation, and (e) open-water evaporation. The shaded areas denote areas where the tests were significant at the 5% level.

Figure 15.
Pixel-wise correlation coefficients between total ET and its components and Rn observed in the Nile Basin for 1980–2014: (a) total ET, (b) transpiration, (c) canopy interception, (d) bare-soil evaporation, and (e) open-water evaporation. The shaded areas denote areas where the tests were significant at the 5% level.


Table 1.
Site names and available number of years of the study sites used for evapotranspiration (ET) validation.
Table 1.
Site names and available number of years of the study sites used for evapotranspiration (ET) validation.
| Site Name | ID | Longitude | Latitude | Temperature (T) | Precipitation (P) | Vegetation Type | Time Span Used | Flux (ET) (mm/year) | GLEAM (ET) (mm/year) | Reference |
|---|---|---|---|---|---|---|---|---|---|---|
| Demokeya | SD-Dem | 30.478 | 13.283 | 26 | 320 | Savanna | 2008–2009 | 388.1 | 271.2 | [42] |
| Skukuza | ZA-Kru | 31.497 | –25.012 | 22 | 547 | Savanna | 2000–2010 | 496.9 | 609.5 | [43] |
| Mongu | ZM-Mon | 112.150 | 32.031 | 25 | 945 | Deciduous broadleaf forest | 2008–2009 | 598.8 | 688.2 | [40] |
Legend: GLEAM, Global Land Evaporation Amsterdam Model; SD-Dem, Sudan-Demokeya, ZA-Kru, South Africa-Skukuza; ZM-Mon, Zambia-Mongu (these latter three represent FLUXNET station codes).
Table 2.
Correlation coefficients and partial correlation coefficients between Et (and its components) and P and net radiation (Rn) for 1980–2014.
Table 2.
Correlation coefficients and partial correlation coefficients between Et (and its components) and P and net radiation (Rn) for 1980–2014.
| Statistical Indices | Variable | P | Rn |
|---|---|---|---|
| R | ET | 0.9135** | −0.2185** |
| Et | 0.9146** | −0.2146** | |
| Ei | 0.7415** | −0.4385** | |
| Eb | 0.1420** | 0.1802** | |
| Ew | 0.0829** | −0.0161** | |
| PR | ET | 0.9182** | 0.3298** |
| Et | 0.9177** | 0.2767** | |
| Ei | 0.7540** | −0.2855 | |
| Eb | 0.1676** | 0.2478** | |
| Ew | 0.0861** | 0.0138 |
Note: ** denotes significance at the 0.05 level. PR = Partial correlation.
© 2019 by the authors. Licensee MDPI, Basel, Switzerland. This article is an open access article distributed under the terms and conditions of the Creative Commons Attribution (CC BY) license (http://creativecommons.org/licenses/by/4.0/).
Share and Cite
MDPI and ACS Style
Nooni, I.K.; Wang, G.; Hagan, D.F.T.; Lu, J.; Ullah, W.; Li, S. Evapotranspiration and its Components in the Nile River Basin Based on Long-Term Satellite Assimilation Product. Water 2019, 11, 1400. https://doi.org/10.3390/w11071400
AMA Style
Nooni IK, Wang G, Hagan DFT, Lu J, Ullah W, Li S. Evapotranspiration and its Components in the Nile River Basin Based on Long-Term Satellite Assimilation Product. Water. 2019; 11(7):1400. https://doi.org/10.3390/w11071400
Chicago/Turabian StyleNooni, Isaac Kwesi, Guojie Wang, Daniel Fiifi T. Hagan, Jiao Lu, Waheed Ullah, and Shijie Li. 2019. "Evapotranspiration and its Components in the Nile River Basin Based on Long-Term Satellite Assimilation Product" Water 11, no. 7: 1400. https://doi.org/10.3390/w11071400
Note that from the first issue of 2016, this journal uses article numbers instead of page numbers. See further details here.