Simulation and Analysis of the Water Balance of the Nam Co Lake Using SWAT Model
by
 , , and
Muhammad Adnan
1,2 ,
,
Shichang Kang
1,2,3,*,
Guoshuai Zhang
4,
Muhammad Saifullah
5,6,
Muhammad Naveed Anjum
1,7 and
Ayaz Fateh Ali
1,2 1
State Key Laboratory of Cryospheric Science, Northwest Institute of Eco-Environment and Resources, Chinese Academy of Sciences (CAS), Lanzhou 730000, China
2
University of Chinese Academy of Sciences, Beijing 100049, China
3
CAS Centre for Excellence in Tibetan Plateau Earth Sciences, Beijing 100101, China
4
Key Laboratory of Tibetan Environment Changes and Land Surface Processes, Institute of Tibetan Plateau Research, Chinese Academy of Sciences, Beijing 100085, China
5
Institute of International Rivers and Eco-Security, Yunnan University, Kunming 650000, China
6
Department of Agricultural Engineering, Muhammad Nawaz Shareef University of Agriculture, Multan 66000, Pakistan
7
Division of Hydrology Water-Land Resources in Cold and Arid Regions, Northwest Institute of Eco-Environment and Resources, Chinese Academy of Sciences, Lanzhou 730000, China
*
Author to whom correspondence should be addressed.
Water 2019, 11(7), 1383; https://doi.org/10.3390/w11071383
Submission received: 26 May 2019
/
Revised: 27 June 2019
/
Accepted: 3 July 2019
/
Published: 5 July 2019
(This article belongs to the Section Hydrology)
Abstract
:Rapid change of alpine lakes in the Tibetan Plateau (TP) is a clear manifestation of regional-scale climate variability that can be investigated by quantifying the regional hydrological cycle. The degree-day model (DDM) coupled with the Soil and Water Assessment Tool (SWAT) model were used to quantify the water budget of the Nam Co Lake over the period of 2007 to 2013. Driven by local observed meteorological data, the coupled model was successfully validated with the observed lake levels (with R2 = 0.65, NSE = 0.61, and PBIAS = −2.26). Analysis of the water balance revealed that rapid enlargement of the Nam Co Lake was primarily associated with precipitation increase while glacier melt played its role as the potential secondary driver in lake expansion. However, temporal analysis of lake expansion displayed that supremacy of precipitation and glacier melt interchanged between the years. It was found that average annual relative contributions of the precipitation, including direct precipitation on the lake, and glacier melt to the lake were 57% (or 667 mm), and 43% (or 502 mm), respectively. Besides, it was observed that annual values of actual evapotranspiration (ET) from the lake, glaciated, and non-glaciated subbasins were 615 mm, 280 mm, and 234 mm respectively. The average annual glacier mass balance (GMB) of the Nam Co basin was −150.9 millimeter water equivalent (mm w.e.). The relatively high amount of glacier melt was a consequence of the substantial increase in annual temperature in the lake basin. This work is of importance for understanding the rapid water cycle in the TP under global warming. Moreover, this work will also be helpful in monitoring and sustaining the local ecosystem and infrastructure, which is under risk due to rapid lake expansion as a result of climate change in the TP.
1. Introduction
Mountains and highlands are ultra-sensitive to climate change and are regarded as the amplifiers of regional and global climate change [1,2,3]. The Tibetan Plateau, the highest plateau on our planet with an average elevation of over 4000 m, encompasses the largest number of lakes (among them 1055 lakes have an area greater than 1 km2), accounting for 39% of lakes in China [4]. Lakes are vital resources of fresh water and are a sensitive indicator of local or regional climate change [5,6]. Climate change and anthropogenic activities have profoundly affected the physical properties of Chinese Lakes over the past few years [7]. Changes in the volumes of the lakes provide information about in situ variations in the meteorological elements such as precipitation, temperature, humidity, and solar radiation, while disturbance in the regional water resources provides an indication of climate change on a broader scale [8,9,10,11]. Understanding how climate change influences the lakes in the Tibetan Plateau is vital for sustainable management of regional water resources [12].
Several researchers have investigated the changes in the lakes situated in the TP, particularly Nam Co Lake [12,13]. The previous investigation revealed that growth in the size of the Nam Co Lake is associated with the increase in total precipitation, and runoff, particularly, contributing in the form of glacier melt [12]. Furthermore, several investigations revealed that the expansion in the lake might also be associated with the decrease in the evaporation along with precipitation increase in central Tibet, in addition to the glacial meltwater contribution [14,15]. A study of the water balance in the TP revealed that the increased precipitation and runoff, while decreasing evaporation, were the major causes of the lake growth, including Nam Co Lake [16]. The main causes of expansion in the lake water levels in the TP are not well understood yet, particularly the influences of uncertain regional behaviors of precipitation, evaporation, and glacial melt contributions as a consequence of temperature rise in lake expansions in the 2000s.
Previously, Zhu et al. [15] have quantified the long term water balance of the Nam Co Lake using GIS technologies and statistical analysis in the absence of observed data; instead, they used bathymetric data of the lake and 17 meteorological stations data in the proximity of the Nam Co Lake Similarly, Liu et al. [17] investigated the long term growth of the Nam Co Lake using satellite imagery and observed data of nearby station of the Nam Co basin. They used Lhasa River streamflows data, which has no direct connection with the Nam Co Lake to study the hydrological response of the Nam Co Lake. Zhou et al. [18] investigated the subsurface water seepage of the Nam Co Lake based on observed lake levels and streamflow of three gauging stations of the Nam Co Lake. The lake water balance analysis was performed for the year 2008 based on three streamflows gauging stations, and they did not use the hydrological modeling or remote sensing techniques to study in depth lake water balance analysis. Moreover, a degree-day model was coupled with the J2000 hydrological model to simulate the water balance of the Nam Co Lake by Gao et al. [19]. The model was forced by the downscaled GCM data without using observed data of stations located in the Nam Co basin. So the outcomes of their study may be uncertain. Biskop et al. [20] studied the differences in water balance components of four TP lakes, including Nam Co Lake by using modified J2000g model. The model was forced by High Asia Refined analysis (HAR) data at 10 km resolution. They used satellite-derived lake-volume changes to calibrate the model. They compared the observed lake levels with the simulated lake levels from 2006 to 2010 and found reasonable results. Several hydrological studies on the Nam Co basin were limited to the subbasin scale—i.e., [19,21,22,23,24,25]—and they studied the hydrological characteristics and glacier mass balance at a small scale (subbasin) with a short time period. Therefore, we conclude that most of the past water balance studies on Nam Co Lake have deficiencies due to lack of long term observed data and absence of hydrological modeling. Moreover, long term comprehensive investigations of the Nam Co Lake water levels and water budget were also missing.
Our previous study, i.e., Adnan et al. [26], focused on the evaluation of the SWAT model coupled with DDM [27,28] on gauged subbasins of the Nam Co basin. We successfully calibrated and validated the coupled model on two gauged subbasins, i.e., Qugaqie (glaciated), and Niyaqu (non-glaciated) located on the south and east side of the Nam Co Lake, respectively. The current study is the extension of our past study [26]. The primary objective of our previous study was to get the calibrated parameters for the two gauged subbasins of the Nam Co Lake which were chosen to represent the whole Nam Co basin because the topographic and climatic features of these two subbasins are similar to whole Nam Co basin. Calibrated parameters obtained from the gauged subbasins were upscaled to whole Nam Co basin. Our previous study was a baseline and provided necessary inputs to conduct this study. The present work fulfilled the gaps of the previous studies and presented detailed water balance of the Nam Co Lake by using a coupled hydrological model forced with long term observed data of the Nam Co basin as compared to the previous studies. This study provides detailed long term spatiotemporal changes in water budget, GMB, and relative input of streamflow to Nam Co Lake (using the coupled model) at basin scale which was missing in the past studies. Furthermore, this study examined the relatively long term variations in the hydrological regimes of the Nam Co Lake, which were missing in the previous investigations. The DDM used is capable of distinguishing snow and ice on the surface of the glacier, and it can also consider precipitation during the ablation period. The outcomes of this study will be helpful to understand the main causes of lakes growth in the TP, and also to monitor its future consequences in terms of lake outburst floods and deterioration of the local ecological system.
2. Materials and Methods
2.1. Study Area
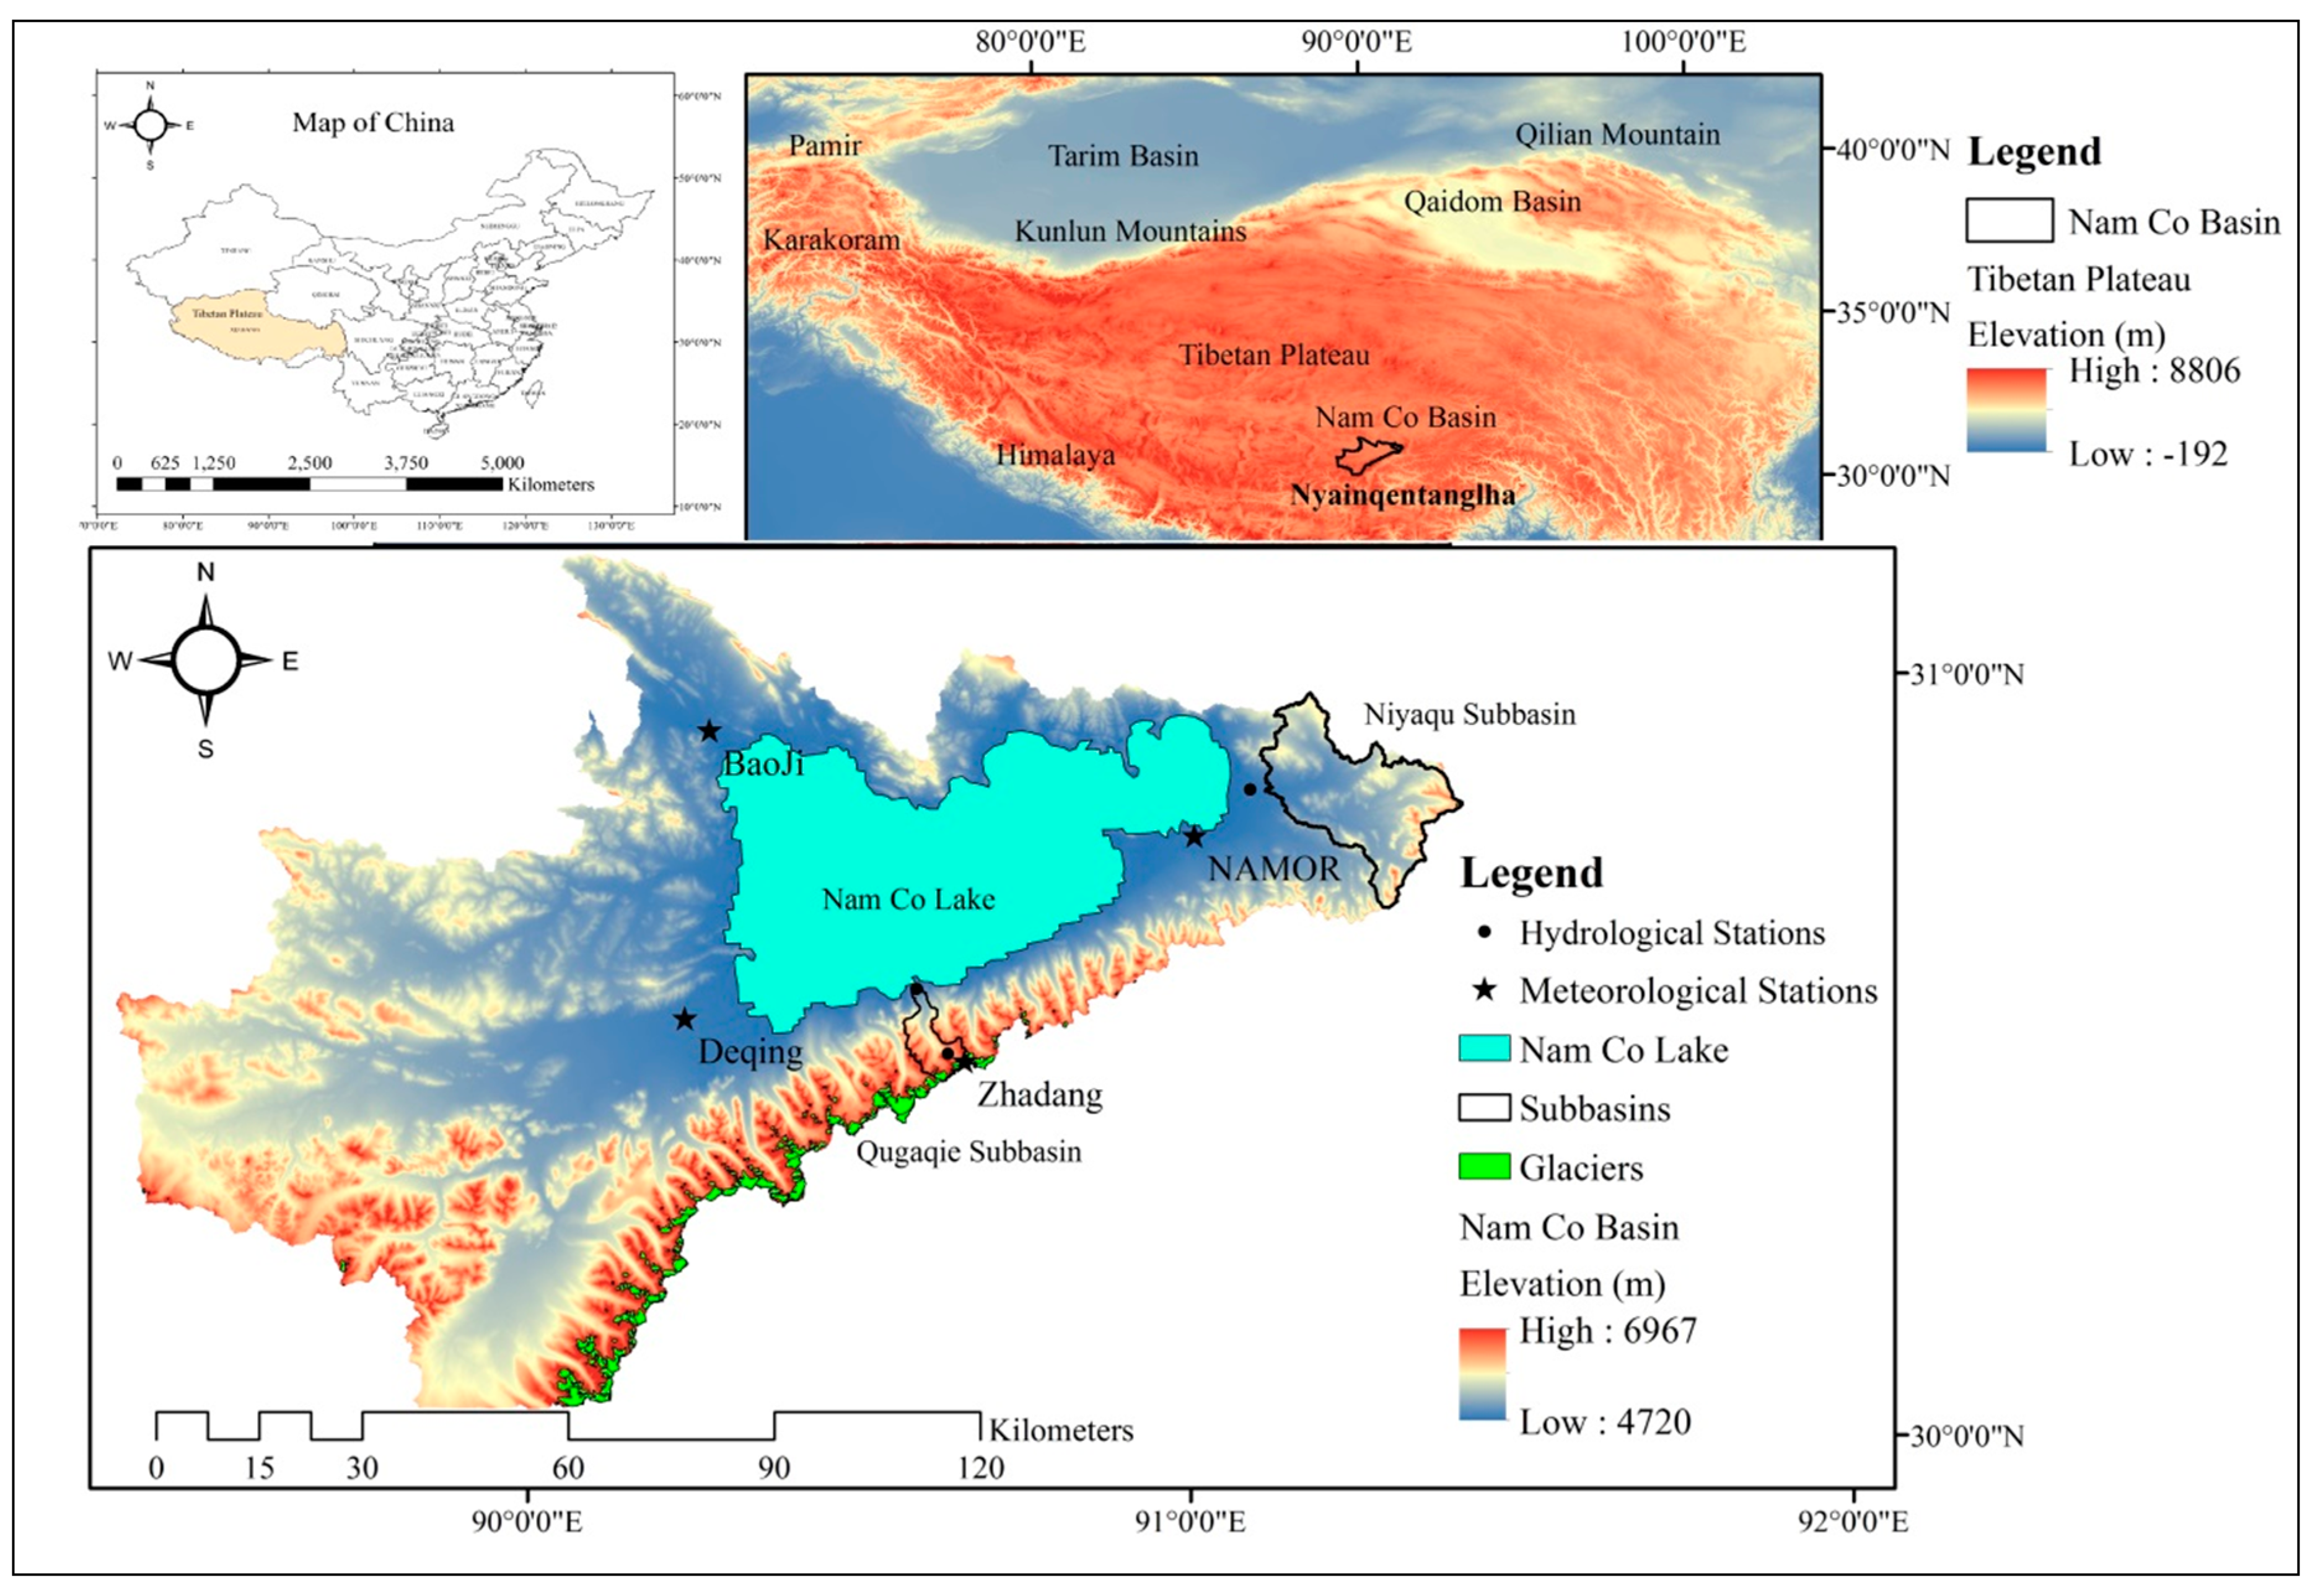
Nam Co Lake, nested in the western part of the Nyainqentanglha Mountains, is the highest and second largest lake in the TP.
The estimated surface and drainage areas of the lake are about 2000 km2 and 11,000 km2, respectively [29]. The western range of Nyainqentanglha lies in the center of the plateau and stretches in the NE–SW direction (Figure 1). The average elevation of the western Nyainqentanglha range is about 5500 m and maximum elevation in the range reaches about 7111 m [30]. The maximum depth of the lake is about 100 m [31]. There are 224 glaciers in the Nam Co basin and the estimated area (in this study) covered by these glaciers is about 137.2 km2. Due to the distinct physiographic conditions, there is no influence of human activities on the Nam Co Lake and, therefore, changes in its water level are a good indicator of regional climate change [12].
The major tributaries contributing to the lake water are situated in the western and eastern mountains while dominant glacier meltwater contribution is from the tributaries in the southern part of the lake, i.e., from the Nyainqêntanglha Mountains. Geographically, Nam Co Lake is situated at the interaction of two climatic systems, i.e., westerlies and Indian summer monsoon [32]. The average annual precipitation over the Nam Co Lake basin is about 417 mm, and monsoon (June to September) is the main rainy season. The amount of average annual precipitation (for the period of 2007 to 2013) at the NAMOR (Nam Co Station for Multisphere Observation and Research), Zhadang, Baoji, and Deqing stations is 450 mm, 499 mm, 354 mm, and 365 mm, respectively. The estimated amounts of average annual evaporations of the lake and the entire basin are about 790 mm 320 mm, respectively [33]. In the Nam Co Basin, the average annual temperature (for the period of 2007 to 2013) is about −2 to 0 °C, with a large diurnal and seasonal variability. The highest monthly temperature at the NAMOR station is about 10 °C (in July) and the lowest around −12 °C (in January). Spatial variations of the annual temperature and precipitation in the Nam Co basin are shown in Figure S1. Moreover, there are two gauged subbasins located on south and east side of the Nam Co Lake basin (Figure 1). These two subbasins have long term hydro-meteorological records and represent the topographic features of the whole Nam Co basin as discussed in our previous study [26].
2.2. SWAT Model
The Soil and Water Assessment Tool (SWAT), a physically-based and semi-distributed hydrological and water quality model, is capable of computing and routing runoff, sediments, and contaminants from individual drainage units (sub-basins) in a river basin towards its outlet [34]. In Arc SWAT model, a catchment is subdivided into different interconnected subbasins [35]. On the basis of soil type, land use, and slope, each subbasin is further divided into different Hydrological Response Units (HRUs). First, it computes the water level at the HRU scale which then integrates at the subbasin scale [35]. Total water balance, computed by HRUs, is based on four water reservoirs: snow, soil, deep aquifer, and shallow aquifer [36]. Hydrological processes simulated by the model include surface flow, lateral flow, base flow, percolation, evapotranspiration, snowmelt, and so forth [37]. The outputs of the SWAT model are assessable at HRUs and sub-catchments scales [38].
The SWAT uses the following equation to simulate the hydrological processes:
where denotes the final soil water content, denotes the initial soil water content, denotes the amount of precipitation, denotes the amount of ET, Qs(mm) denotes the amount of surface runoff, denotes the amount of water entering the vadose zone, denotes the amount of return flow, and t (days) denotes the time duration
SWAT Snowmelt Algorithm
For its water budget, SWAT separates solid and liquid precipitation based on near-surface air temperature. It compares the snowfall temperature parameter (SFTMP) with the mean daily air temperature at the subbasin scale; if it is lower than SFTMP then the precipitation is considered as snowfall. The considered snowfall is accumulated until snowmelt [36]. SWAT uses a temperature index approach to estimate the snowmelt runoff generated by melting of snowpack [39,40]. The mass balance equation for snowpack is
where is the water content of the snowpack on a given day i (mm H2O), is the water content of the snowpack on a given day i (mm H2O), is the amount of precipitation on a given day (added only if , where is the average daily temperature) (mm H2O), is the amount of sublimation on a given day (mm H2O), and is the amount of snowmelt on a given day (mm H2O).
Snowmelt is mainly controlled by the air and snowpack temperature along with the daylight hours. Water volume generated by snowmelt process over a sub-watershed also depends on the extent of the snow cover. In SWAT, snowfall, snowpack, and snowmelt processes are always computed by the model as soon as the temperature falls below the threshold of snowfall temperature [23].
2.3. Dataset
2.3.1. Hydro-Meteorological Data
In this study, the daily meteorological data of four automatic weather stations (AWSs) named Baoji, Zhadang, NAMOR, and Deqing was used to run the SWAT model. Figure 1 showed the geographical locations of considered AWSs. For the Nam Co Lake, the water level observations were not available for the winter season. The available water level observations for the warm season (May to October) also had some missing values. The daily observations of water levels of the Nam Co Lake for the warm season with minimum missing values were available for the period of 2007 to 2013; therefore, the present analysis was done for the same period. The daily streamflow observations of two hydrological stations (Qugaqie and Niyaqu, Figure 1) were used to calibrate the SWAT model. The datasets used in the present study were acquired from the Third Pole Environment and the Institute of Tibetan Plateau, Chinese Academy of Sciences (TPE, ITP CAS), Beijing (Table 1). Long term meteorological records at the NAMOR were available since 2005. The driving data for the model include the daily maximum and minimum temperature, solar radiation, relative humidity, wind speed, and precipitation.
The observed meteorological station’s data was available from 2007–2015 (e.g., NAMOR) (Table 1), and other stations have missing records that were filled using linear regression analysis and reanalysis data. Temperature data at the Zhadang station was estimated by using the observations at the NAMOR AWS, linear regression was used for this purpose. The value of the coefficient of determination (R2) between NAMOR and reconstructed data at the Zhadang station was 0.96. Missing temperature data at the other meteorological stations were filled by reanalysis data. The precipitation estimates from the gauge adjusted Tropical Rainfall Measuring Mission (TRMM) satellite-based product (TRMM-3B42V7) were used to fill the missing values at the Zhadang, Baoji, and NAMOR stations. Before its application in the SWAT model, the daily precipitation estimates from the TRMM-3B42V7 product were compared with the gauge-based observations in the study domain. TRMM product showed acceptable results, except for the Deqing. With reference to the gauge-based data, the bias (%) at the Baoji, Zhadang, and NAMOR AWS were −3.77%, 5.47%, and 5.41%, respectively. The TRMM-based data showed considerable overestimation (more than 10%) at the Deqing meteorological station, which was corrected by a statistical relation presented by Sperna et al. [41] as given in Equation (3).
where and denote the mean observed and modeled precipitation, respectively, and represents daily modeled precipitation for the study period.
Missing data records of solar radiation, wind speed, and relative humidity were filled by using Era-Interim reanalysis data. The reanalysis datasets with a resolution of 0.125° were acquired from the website: (http://apps.ecmwf.int/datasets/data/interim-full-daily). Reanalysis data of temperature was bias corrected before using for the present analysis. Bias correction was done by a statistical relationship presented by Cheng and Steenberg [42] as given in Equation (4).
where denotes the corrected temperature, and denotes observed and modeled daily temperatures, respectively, denotes the mean daily modeled temperature while denotes the mean daily observed temperature. The correlations between the observed (i.e., Nam Co) and reanalysis data for the period of 2006 to 2015 were reasonable (i.e., NSE = 0.72 and 0.69; PBIAS = −9.7 and −13.1; and R2 = 0.81 and, 0.90 for the minimum and air maximum temperatures, respectively).
2.3.2. Land Use and Glacier Data
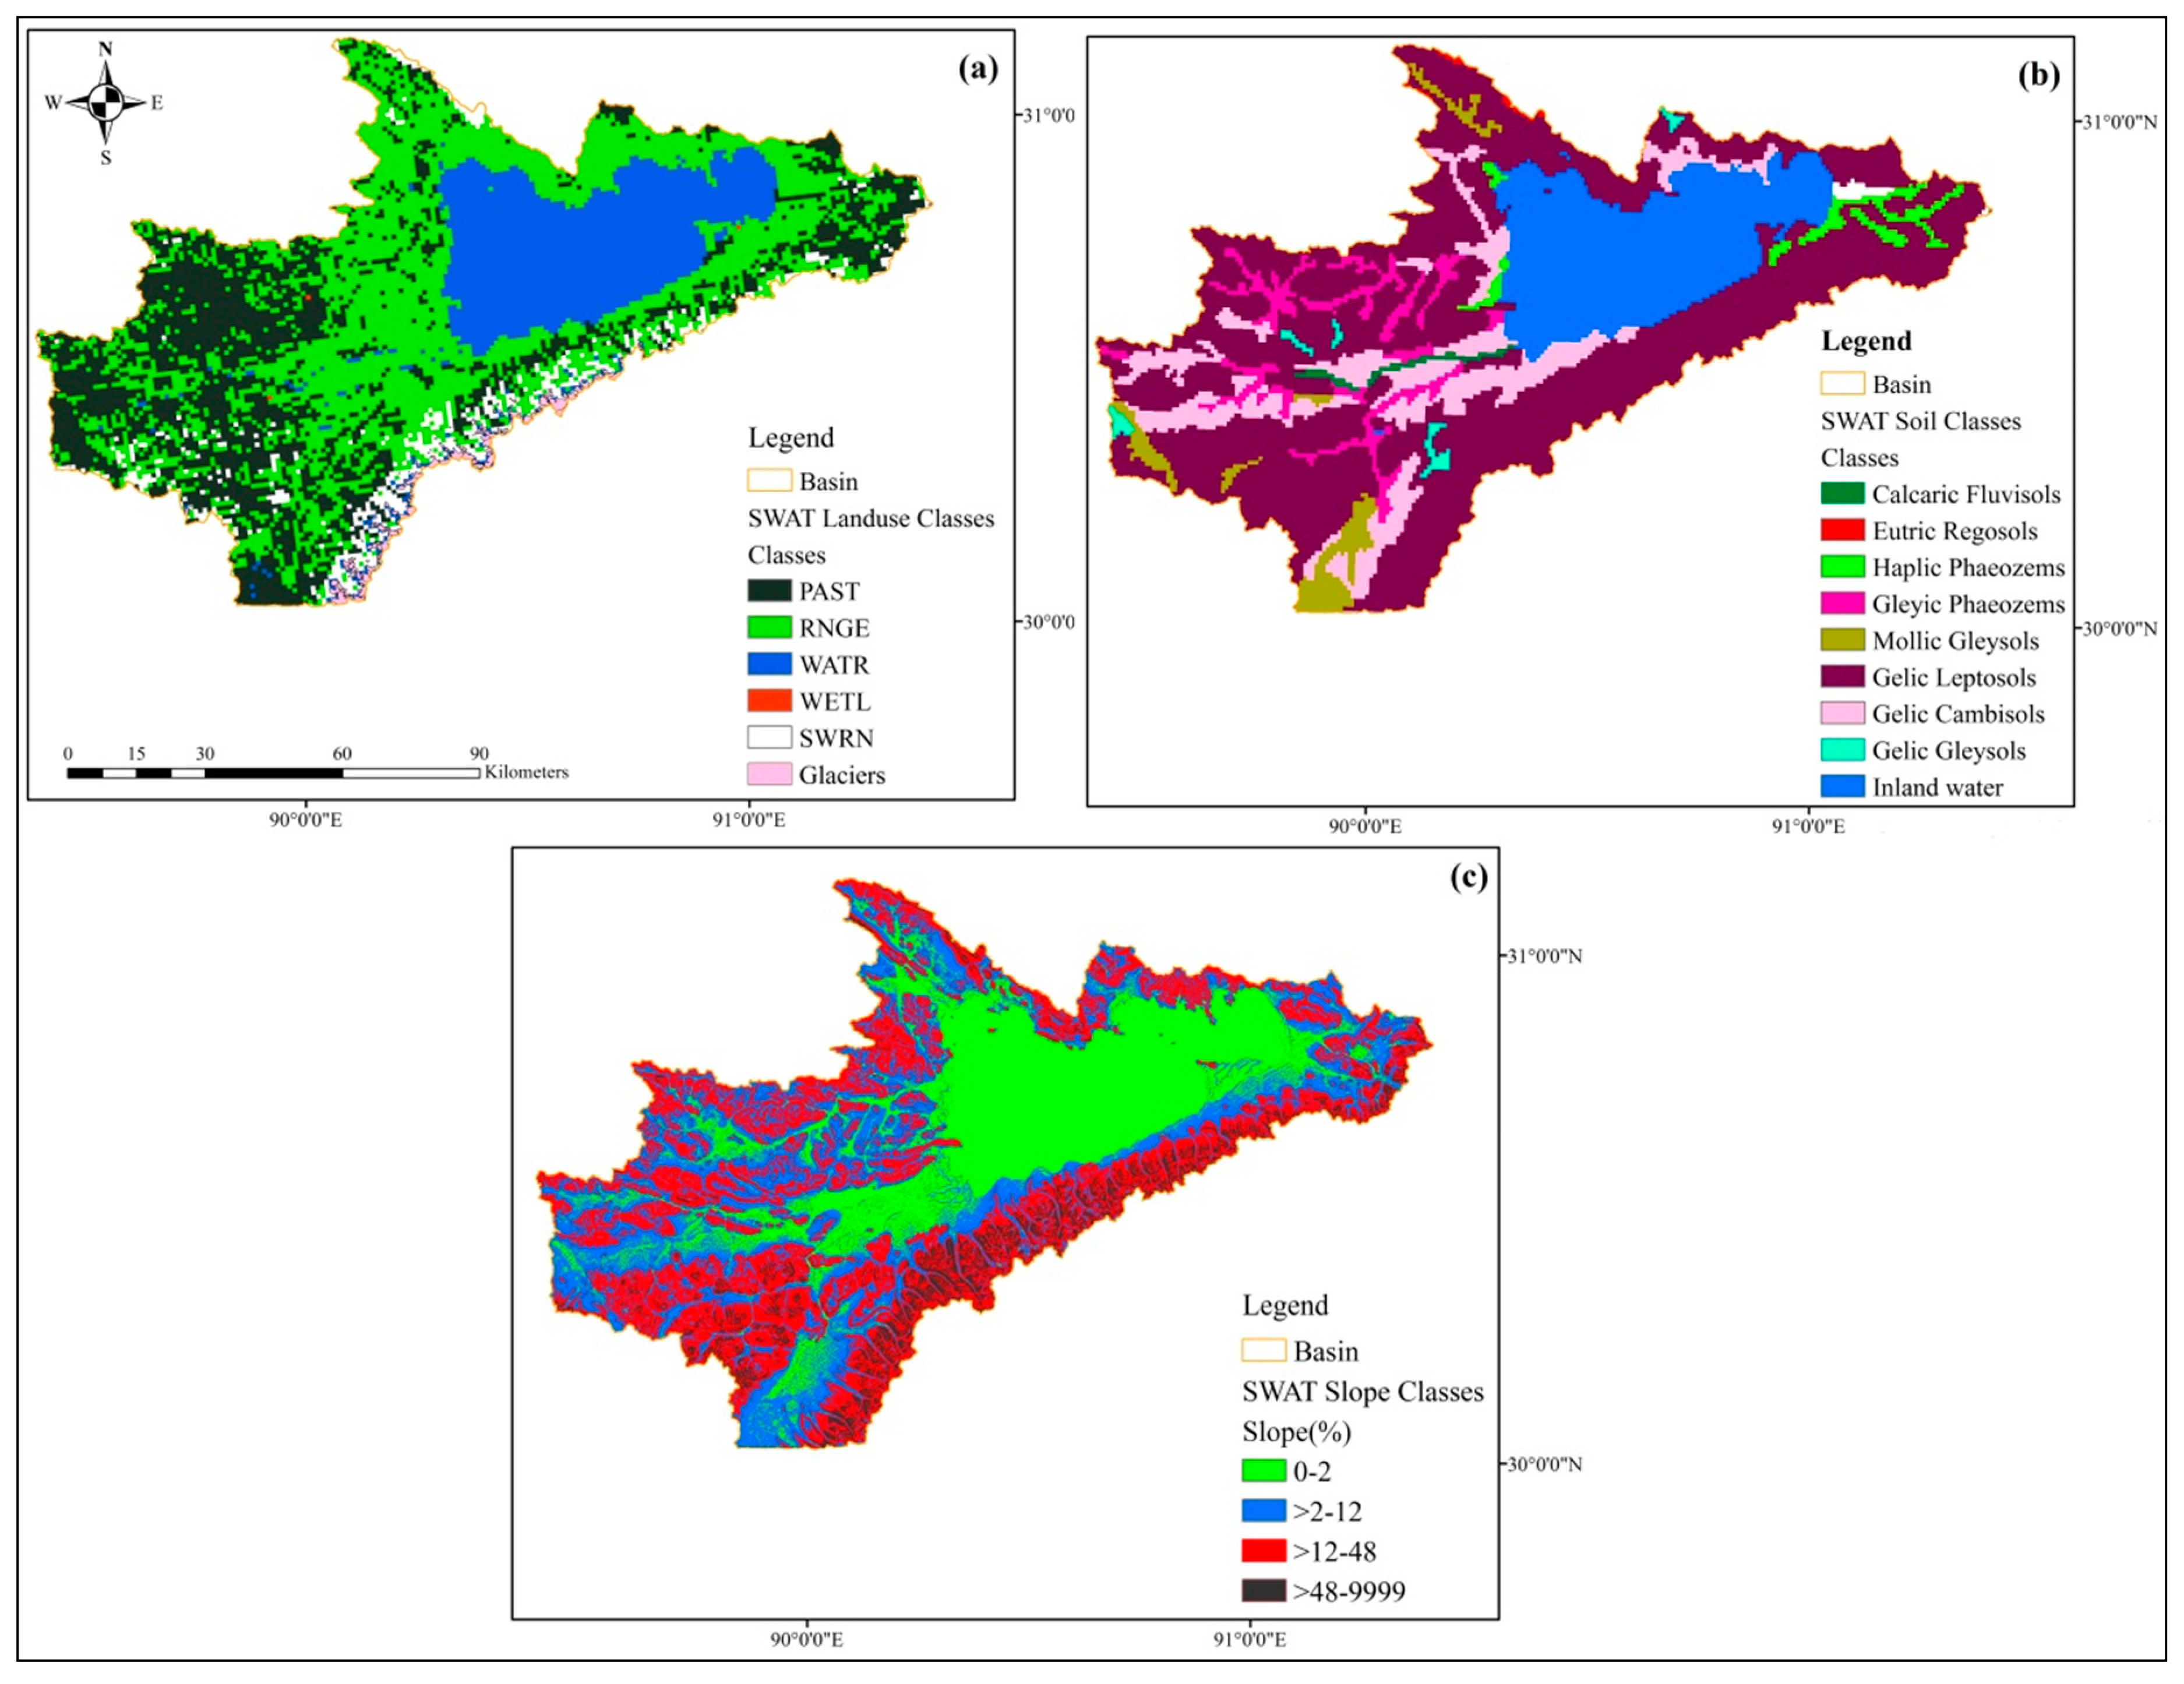
The land use data for 2005 with a spatial resolution of 1 × 1 km was downloaded from the website, http://www.igsnrr.ac.cn. The major land-use classes identified for the Nam Co basin were grassland (RNGE), pasture (PAST), southwestern range + bare rocks (SWRN), and inland water (WATR). The areas of identified land-use classes were 41.95%, 31.31%, 6.05%, and 20.64%, respectively (Figure 2a). While the area covered by the wetlands (WETL) was very small (only 0.03% of the total area of the basin). In 2014, Cold and Arid Regions Science Data Centre released its second glacier inventory data for China [43], which was used to identify the glaciers and their areas in the study domain.
2.3.3. Soil Data
The soil data, with a spatial resolution of 90 m, was acquired from the website of Harmonized World Soil Database V 1.2 (HWSD): http://webarchive.iiasa.ac.at/Research/LUC/External-World-soil-database. The soil map for the Nam Co basin was prepared from the downloaded HWSD-based maps. The parameters obtained from the soil data that were directly used in the SWAT soil database include bulk density, organic carbon, electrical conductivity, depth, and texture. Soil-plant-atmosphere-water (SPAW) model was employed to estimate the remaining parameters, for instance, available water, wilting point, saturated hydraulic conductivity, and field capacity on the basis of soil texture. The soil data extracted for the Nam Co basin comprised of 10 soil types. The major classes of soil were Gelic Leptosols, inland water and, Gelic Cambisols which account for 58.12%, 18.37%, and 11.94% of the total area of the basin, respectively (Figure 2b). Due to the uneven topography, the study area was classified into four SWAT slope classes i.e., 0–2%, >2–12%, >12–48%, and >48%. About 94.39% area of the basin lies between slopes of 0–48%, while the only 5.61% area of Nam Co basin was greater than the slope of 48% (Figure 2c).
2.4. Model Setup
The detailed description of SWAT model setup is provided in our previous study [26]. The input data of the SWAT model, which include meteorological data, digital elevation model (DEM), land use, and soil data, was prepared before model setup. In the Arc SWAT model, the Nam Co basin was divided into 30 sub-catchments, based on the stream networks as shown in Figure S2. Figure S2 shows the number assigned to each subbasin. The number of subbasins which contain glaciers is 12 while the rest of 18 subbasins are non-glaciated. Furthermore, on the basis of topography, each sub-catchment was divided into 10 elevation bands. Soil Conservation Service (SCS) curve number method [44] was selected for computation of surface runoff volume in Arc SWAT, while evapotranspiration was computed by the Penman-Monteith technique [45,46]. The simulations of the SWAT model were done both at daily and monthly time scales. Warm-up period for the model was selected from 2002 to 2006, while the validation period for the model was 2007 to 2013 [26]. Due to data and model limitations, SWAT model could not be directly calibrated and validated over the Nam Co basin. So, in the initial phase, the SWAT model was calibrated on two gauged subbasins of the Nam Co Lake, i.e., Qugaqie subbasin (glaciated) and Niyaqu subbasin (non-glaciated). Because these two subbasins are located on the south and east sides of the Nam Co basin, respectively, and having nearly similar climatic characteristics, so we supposed that the calibrated parameters of these subbasins were representative of the whole Nam Co basin. Moreover, the topographic features-such as land use, soil, and slope—of these two subbasins were similar to the Nam Co basin, which we studied in our previous work. The purpose of calibration over two gauged subbasins was to achieve the calibrated parameters from both the subbasins for future simulation of the coupled model over the whole Nam Co basin. Because the Nam Co Lake basin has 12 glaciated, and 18 non-glaciated subbasins which were determined from the analysis of glacier data obtained from China Second Glacier Inventory [43] in ARC SWAT model. So the calibrated parameters obtained from the Niyaqu subbasin were assigned to the non-glaciated subbasins, and the calibrated parameters obtained from the Qugaqie subbasin were assigned to the glaciated subbasins of the Nam Co basin. After that, the coupled model was run over the whole Nam Co basin and simulated outflows which were the sum of glaciated and non-glaciated subbasins were validated with the observed lake levels from 2007–2013. Monthly observed lake levels used in the analysis were obtained by adding up daily rise in lake levels separately for each month (from May–October).
The sensitivity-uncertainty analysis was performed in our previous study [26]. About 22 sensitive parameters were sorted out on the basis of sensitivity analysis and from the previous studies that were conducted on the alpine catchments [47,48,49,50] to calibrate and validate the SWAT model on gauged subbasins. Table 2 describes the sensitive parameters considered for the present analysis. The detailed description of the calibrated parameters was explained in our previous study, i.e., [26].
2.5. Degree-Day Model (DDM)
The SWAT model is incapable of dealing with glacier melt processes, but it uses a temperature index approach to simulate snowmelt runoff [39]. To overcome this deficiency, a degree-day melt model [27,28] was used in conjunction with the SWAT model for the estimation of glacier melt dynamics and its proportional input in streamflow to the Nam Co Lake.
The degree-day model can differentiate between glacier surface snow and ice and separates precipitation into rainfall, snowfall, and a mixture of snowfall and rainfall on the basis of threshold values of mean air temperature. Snow and ice melt in the study area were computed separately using different degree-day factors (DDF). DDF values used in the current study were taken from our previous study [26]. Moreover, the model also deals with the snowfall during the ablation period and converts it into snowmelt with snow DDF [26]. In DDM, each glacier was divided into maximum 10 elevation bands with 100 meter band interval. Monthly (from January–December) temperature and precipitation lapse rates (°C and mm/100 m, respectively) were calculated for DDM by using meteorological observations at the NAMOR, Zhadang, and Baoji stations for the period of 2007–2015 (Table 3). DDM was used to simulate snow and ice melt, and accumulation in each glacier band. Dual threshold method, presented by Kang et al. [51], was used to distinguish solid and liquid precipitation in each glacier elevation band. Equation (5) was used in the DDM for calculation of solid precipitation (mm/day)
where and are the mean daily air temperature (°C) and precipitation (mm), respectively, in the glacier elevation band. While is the minimum temperature at which rainfall can occur, and is the maximum temperature at which snowfall occurs in the glacier elevation band. The liquid precipitation in the glacier band was calculated by the model using Equation (6), which is
The daily accumulated snow water equivalent on the glacier surface was calculated by the model using Equation (7)
where is the time interval (. The temperature above which snow and ice start melting is regarded as threshold temperature (), usually, it is selected as 0 °C [28].
The potential snowmelt in the glacier elevation band was calculated using Equation (8)
where (mm °C−1 day−1) denotes the degree-day factor for snow. In DDM, the variable is compared with which is the accumulated snow water equivalent. If > then only snow, that was accumulated in the specific time interval, will melt. If there is insufficient snow then the remaining positive degree-days (PDDs) will be used for melting of ice in glacier elevation band as shown in Equation (9).
where denotes degree-day factor for ice and denotes the sum of snow and ice melt (mm) in each glacier band.
The main degree-day equation used in the DDM for the calculation of total melt of snow/ice (mm) for the glacier i is
where is the total melt of snow/ice (mm) for glacier i in the glacier band; is the degree-day factor for snow and ice (mm C−1 day−1), is the factor that measures the aspect dependence of and is the main cosine of the surface aspect for glacier i in the glacier band. The parameters used in DDM, which were selected from the past studies and observed data, are given in Table 3.
2.6. Equilibrium Line Altitude (ELA)
The ablation and accumulation zones of a glacier are separated by a line known as Equilibrium Line Altitude (ELA). It is an average elevation where annual ablation and accumulation are equal and mass balance is zero [52]. The ELA for Zhadang and all other glaciers in the Nam Co basin was calculated using Area Elevation Band Ratio (AEBR) method. AEBR method, proposed by [53], is widely applied for ELA calculation [54,55]. It takes into account both the glacier hypsometry [56] and mass balance gradients [57] and this method is more robust compared to other methods. The ELA for whole Nam Co basin and Zhadang glacier is shown in Figure S3a,b. The ELAs for the Zhadang glacier and for all other glaciers in the Nam Co basin were 5721 m and 5855 m, respectively. The ablation (accumulation) areas calculated for Zhadang and an average of all Nam Co basin glaciers were 1.12 km2 (0.92 km2) and 86.089 km2 (60.38 km2), respectively.
2.7. Glacier Mass Balance (GMB)
Glacier mass balance (GMB) is the ratio of the difference between accumulation and ablation and the total glacier area. The GMB is usually expressed in meter water equivalent (m w.e.). For the calculation of GMB, the Zhadang glacier was divided into six elevation belts. Observed mean air temperature and precipitation data were extrapolated in all elevation belts using temperature lapse rate (TLAPS) and precipitation lapse rate (PLAPS).
The same procedure was adopted to calculate the GMB of Nam Co basin glaciers. For this purpose, the glacier area was divided into 10 elevation belts (given in Table S1). GMB was calculated on annual and elevation bases. The hydrological year for calculation of GMB starts from November and ends in next October for each year. The GMB of Zhadang and Nam Co basin glaciers was calculated for the period of 2007 to 2014.
2.8. Lake Water Balance
Lake water levels are dynamic and changes in water levels are controlled by the difference between the input and output fluxes, which are mainly controlled by the local hydrological processes [58]. The lake water balance equation is given below
where, is the sum of all input fluxes expressed in m3d−1 and is the sum of all output fluxes expressed in m3d−1. A is the surface area (m2) of lake and is the rate of change of lake water level (h) which is expressed in (m d−1). Lake surface area is dependent on lake levels, higher the lake levels greater will be the surface area of the lake. As the Nam Co is a closed lake so its input fluxes may include direct precipitation on the lake, groundwater inflow, snow drift, snowpack and glacier melt, and perennial and intermittent streams. The output fluxes may include evaporation from the lake, leakage from the bottom and the ground water outflow. Equation (11) was used to estimate the temporal changes in the water balance during the summer season (May–October) from 2007–2013.
2.9. Evaluation of SWAT Model
The basin-wide performance of the SWAT model was assessed with reference to the observed Nam Co Lake levels for the period of 2007 to 2013. Performance of the simulated streamflows was assessed using Nash–Sutcliffe efficiency (NSE), Percent Bias (PBIAS) [59], and Coefficient of Determination indices (. The equations of these metrics are
where Q denotes the discharge, denotes the coefficient of determination, and i stands for simulated and measured data.
where , and stand for observed flow, simulated flow, and mean daily flow, respectively, while n represents the total number of the daily flow. NSE is a normalized statistic that defines the relative magnitude of the residual variance compared to the measured data variance [60].
3. Results
3.1. Calibration and Validation of SWAT Model at the Gauged Subbasins
The SWAT model was successfully calibrated and validated on the Niyaqu and Qugaqie subbasins at daily time scale (Figure S4). Statistical analysis showed that the SWAT model performed fairly well at the Niyaqu stream gauging station with NSE 0.93 and 0.95 for calibration and validation periods, respectively. The values of coefficient of determination (R2) for the calibration and validation periods (0.81 and 0.82, respectively) advocated that the agreements between observed and simulated streamflows for both periods were strong (Figure S4). The PBIAS values (i.e., 2.37% and −8.80% for the calibration and validation periods, respectively) indicated that the model slightly overestimated the flow during calibration and underestimated the flow during validation with reference to the gauge-based observations.
Regardless of using snow related parameters as input during calibration and validation of SWAT model on Qugaqie subbasin, it still underestimated the simulated streamflows compared to the observed streamflows in the Qugaqie subbasin due to the incapability of SWAT model to simulate the glacier melt contribution (Figure S4). While the coupled model performed fairly well with NSE 0.82 for calibration and 0.83 for the validation period. The coefficient of determination (R2) values i.e., 0.87, and 0.84 for calibration and validation periods, respectively showed a strong correlation between the observed and simulated outflow. Moreover, biases were largely reduced during calibration and validation periods. The performance evaluation of the coupled model at gauged subbasins displayed that the model can be further applied over the whole Nam Co Lake basin confidently by using the calibrated parameters used at the subbasin scale.
3.2. Validation of the SWAT Model with Observed Lake Levels
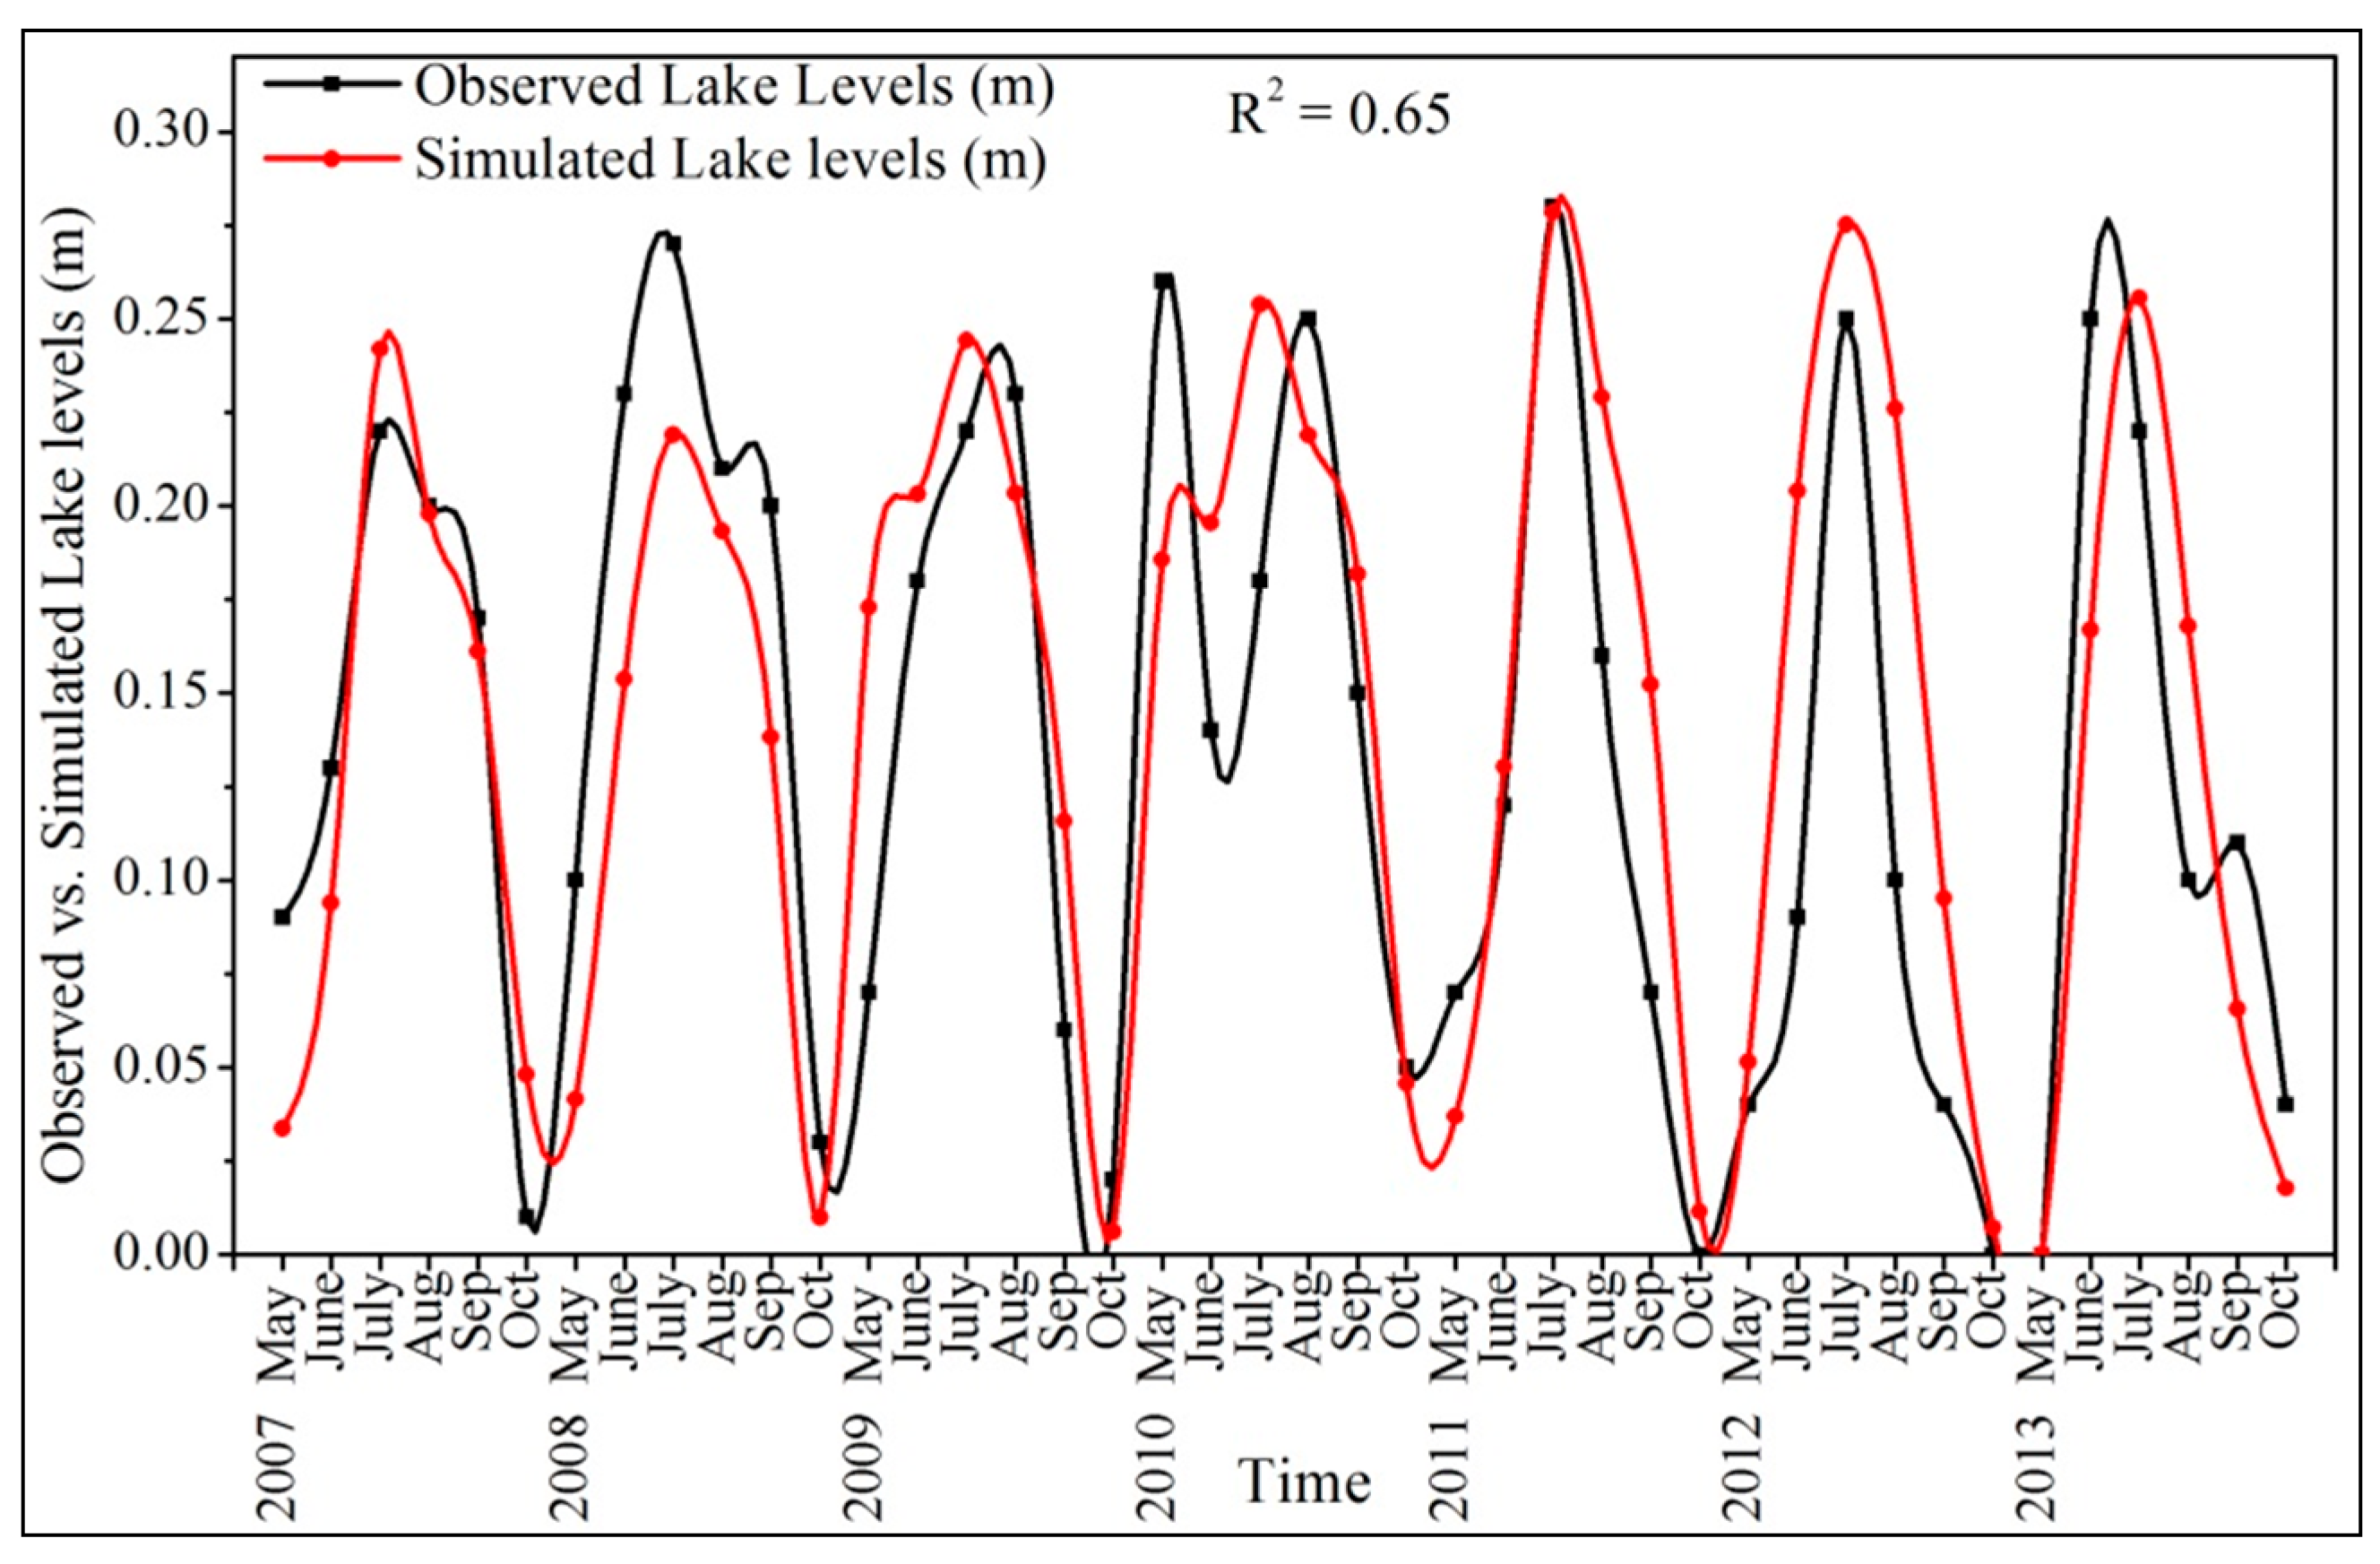
The calibrated SWAT model at gauged subbasins was further applied over the whole Nam Co Lake basin. The coupled model was successfully validated with the observed levels of the Nam Co Lake from 2007 to 2013, as shown in Figure 3. Simulated lake levels were produced by coupling DDM with the SWAT model, and the results showed that the model performed fairly well over Nam Co basin. The R2, NSE, and correlation coefficient (CC) values were 0.65, 0.61, and 0.82, respectively. The PBIAS value (2.26) advocated that the simulated lake levels were underestimated especially in 2008 at some points compared to the observed lake levels, but overall performance was good. High precipitation and low summer temperature, which may not be well captured by the DDM, were considered responsible for underestimation of simulated lake levels in 2008 [61].
Moreover, the high elevated glacier fed Lakes hydrology is very complex, and uncertainties could produce in the outputs due to the processes of snow drifting by wind and orographic precipitation that may further produce uncertainties in the model’s outputs.
3.3. Hydrology of the Nam Co Basin
The overall hydrology of the Nam Co basin can be visualized after simulation by running SWAT Error Checker from 2007 to 2015, as shown in Figure S5. Figure S5 showed the basin-wide average values of hydrology components of the Nam Co basin. It was found that the ratio of precipitation to the total streamflow was 0.37, while baseflow to the total flow was 0.31. This showed that 69% runoff flowing towards Nam Co Lake was surface runoff while 31% contribution was from baseflow. The ratio of percolation to precipitation was 0.13 while deep recharge to precipitation was 0.02. However, the ratio of ET to precipitation was 0.48, which showed that a significant amount of precipitation falling on the Nam Co basin was lost in terms of ET.
3.4. Spatial Variations of Water Balance Components at the Subbasin Level
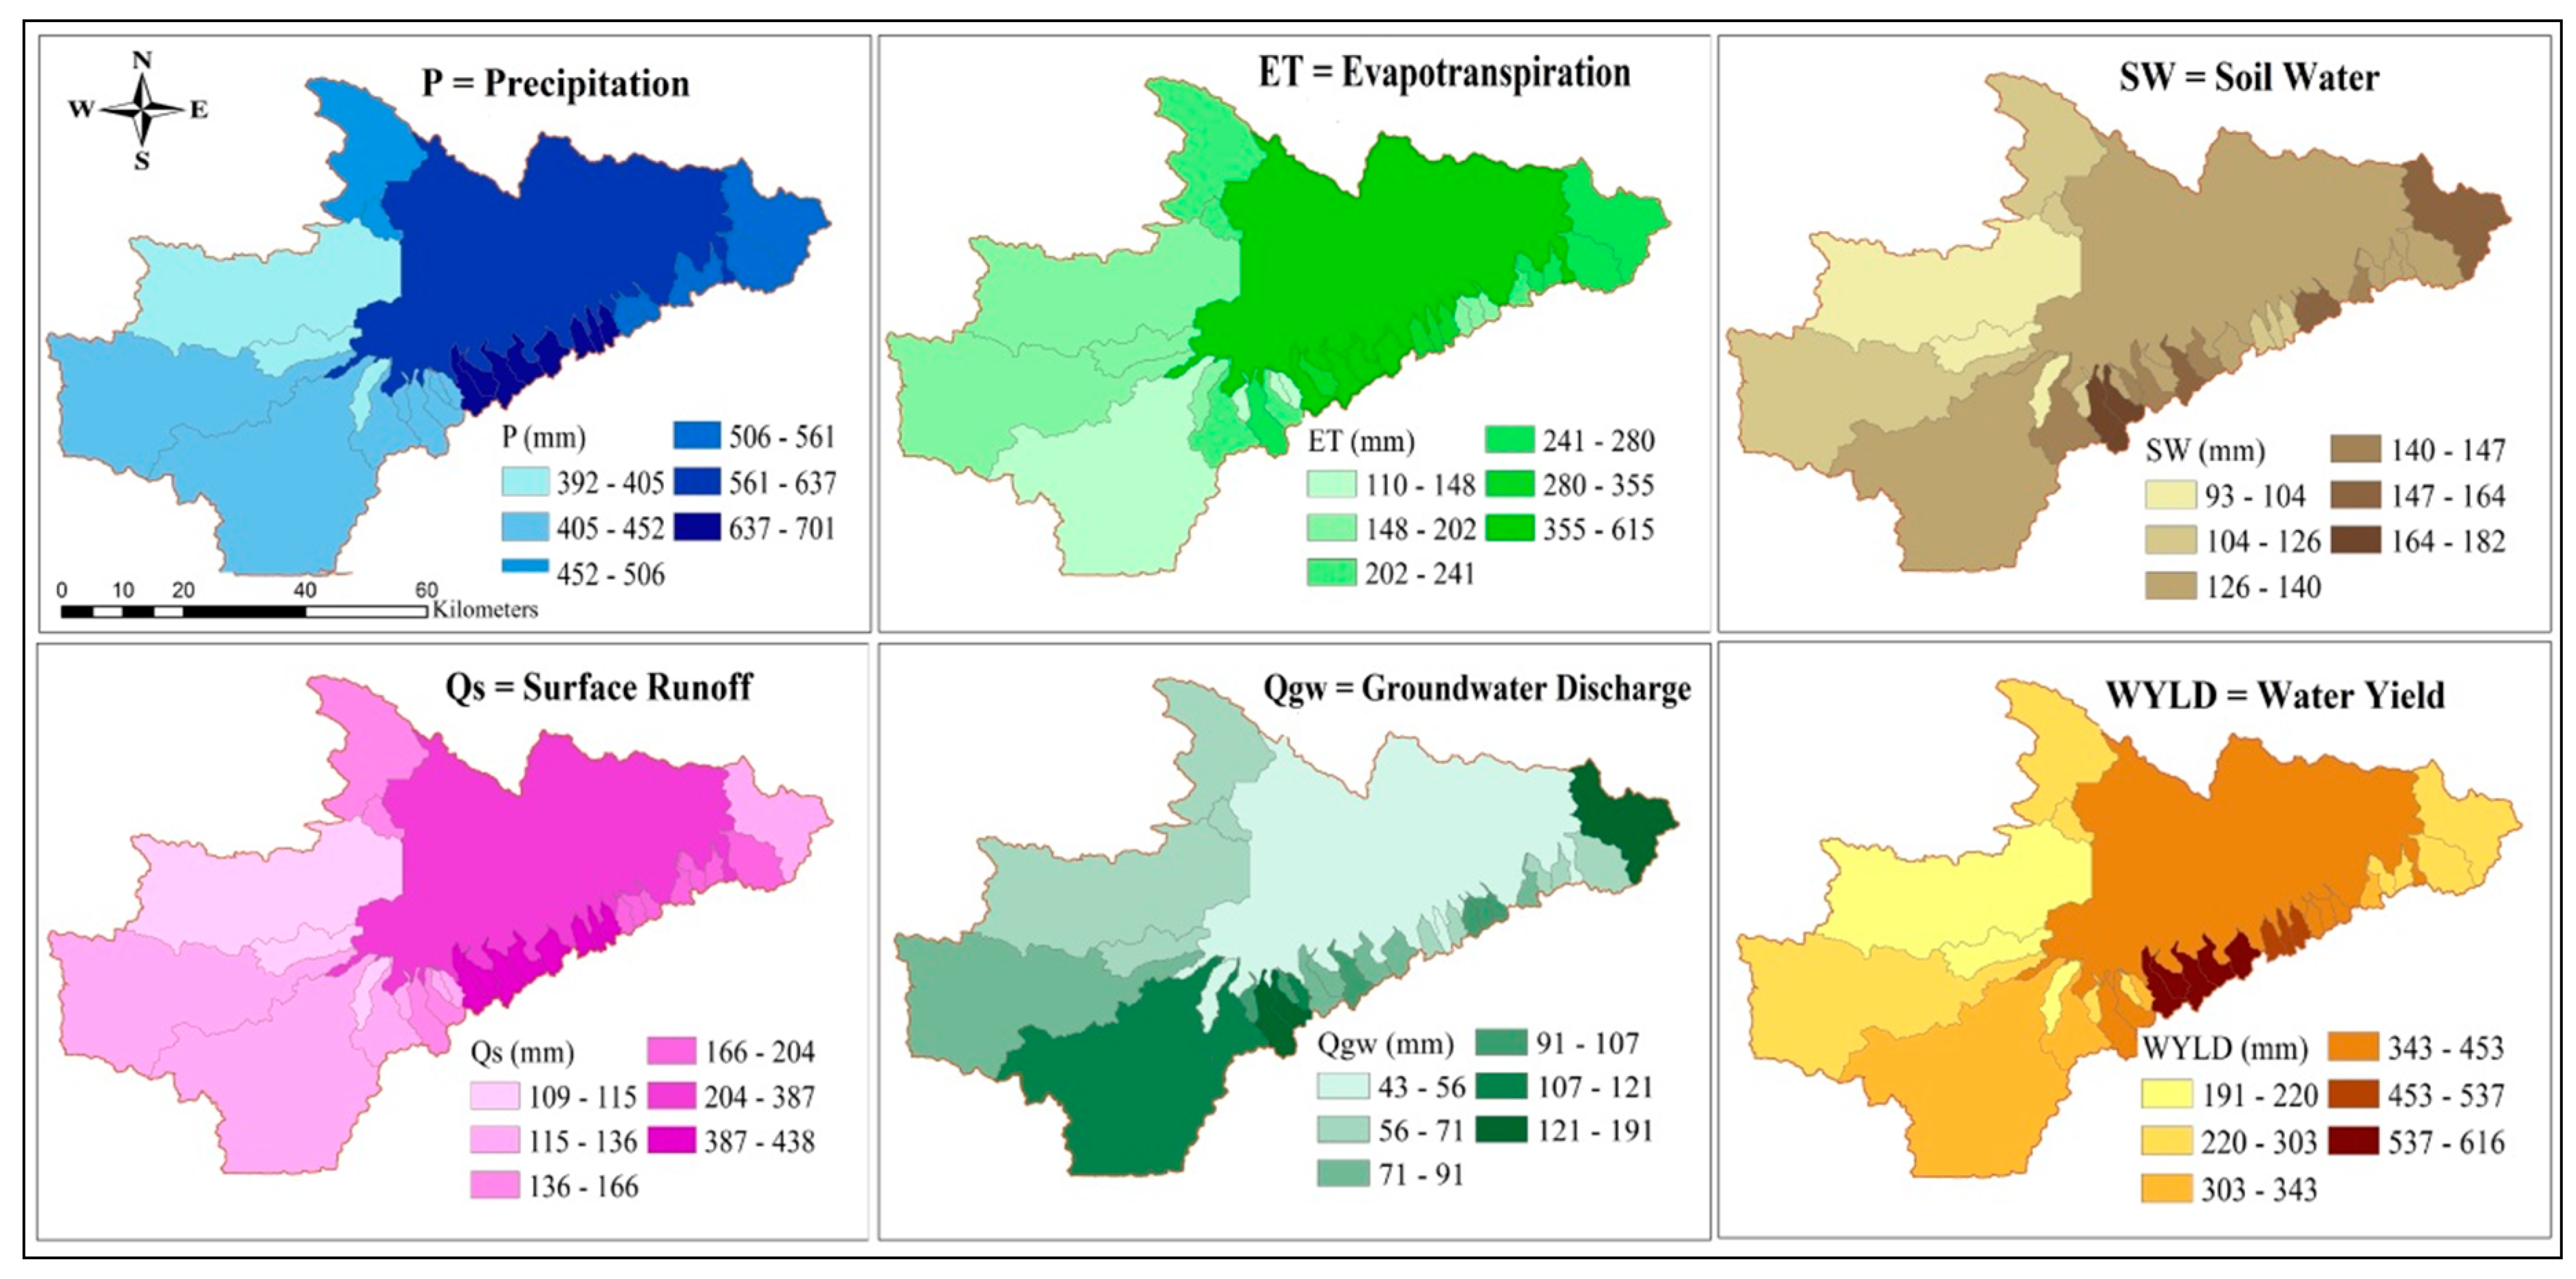
Figure 4 displays the variations in the annual water balance components. At the subbasin scale, the annual precipitation (P) in the Nam Co basin varied from 392 to 701 mm. The amount of precipitation falling on the lake area and glaciated subbasins was more than that on the non-glaciated subbasins. The annual ET at subbasin scale varied from 110 to 615 mm, and likewise precipitation, the value of ET was high on lake area as well as on the glaciated subbasins. The soil water (SW) varied from 93 to 182 mm at subbasin scale with the lowest value in the west side of the Nam Co basin. The reason behind the lowest SW in the west side of the basin was the low precipitation on that side of the Nam Co basin, as shown in Figure 4. The subbasin scale annual surface runoff (Qs) varied from 109 mm to 438 mm, and the highest amount of surface runoff was generated in the glaciated subbasins located on the southern side of the Nam Co basin due to the combined contribution of snow/ice melt and precipitation. The changes in the lake area also exhibited a high value of surface runoff because almost all of the surface runoff flowed towards the Nam Co Lake. The annual values of groundwater (Qgw) varied from 43 to 191 mm at subbasin scale in the Nam Co basin. The groundwater values were high in the subbasins which were located in the southern and eastern sides of the lake, while relatively lower values were found on the lake area and northern side of the Nam Co Lake basin. The amount of water contributed to streamflow after losses from the tributary channels in the HRU is called as water yield (WYLD). WYLD at the subbasin scale of the Nam Co basin varied from 191 to 616 mm. Likewise precipitation, higher WYLD was found on the glaciated subbasins compared to the non-glaciated subbasins.
3.5. Variations in the Water Balance of Nam Co Lake at a Temporal Scale
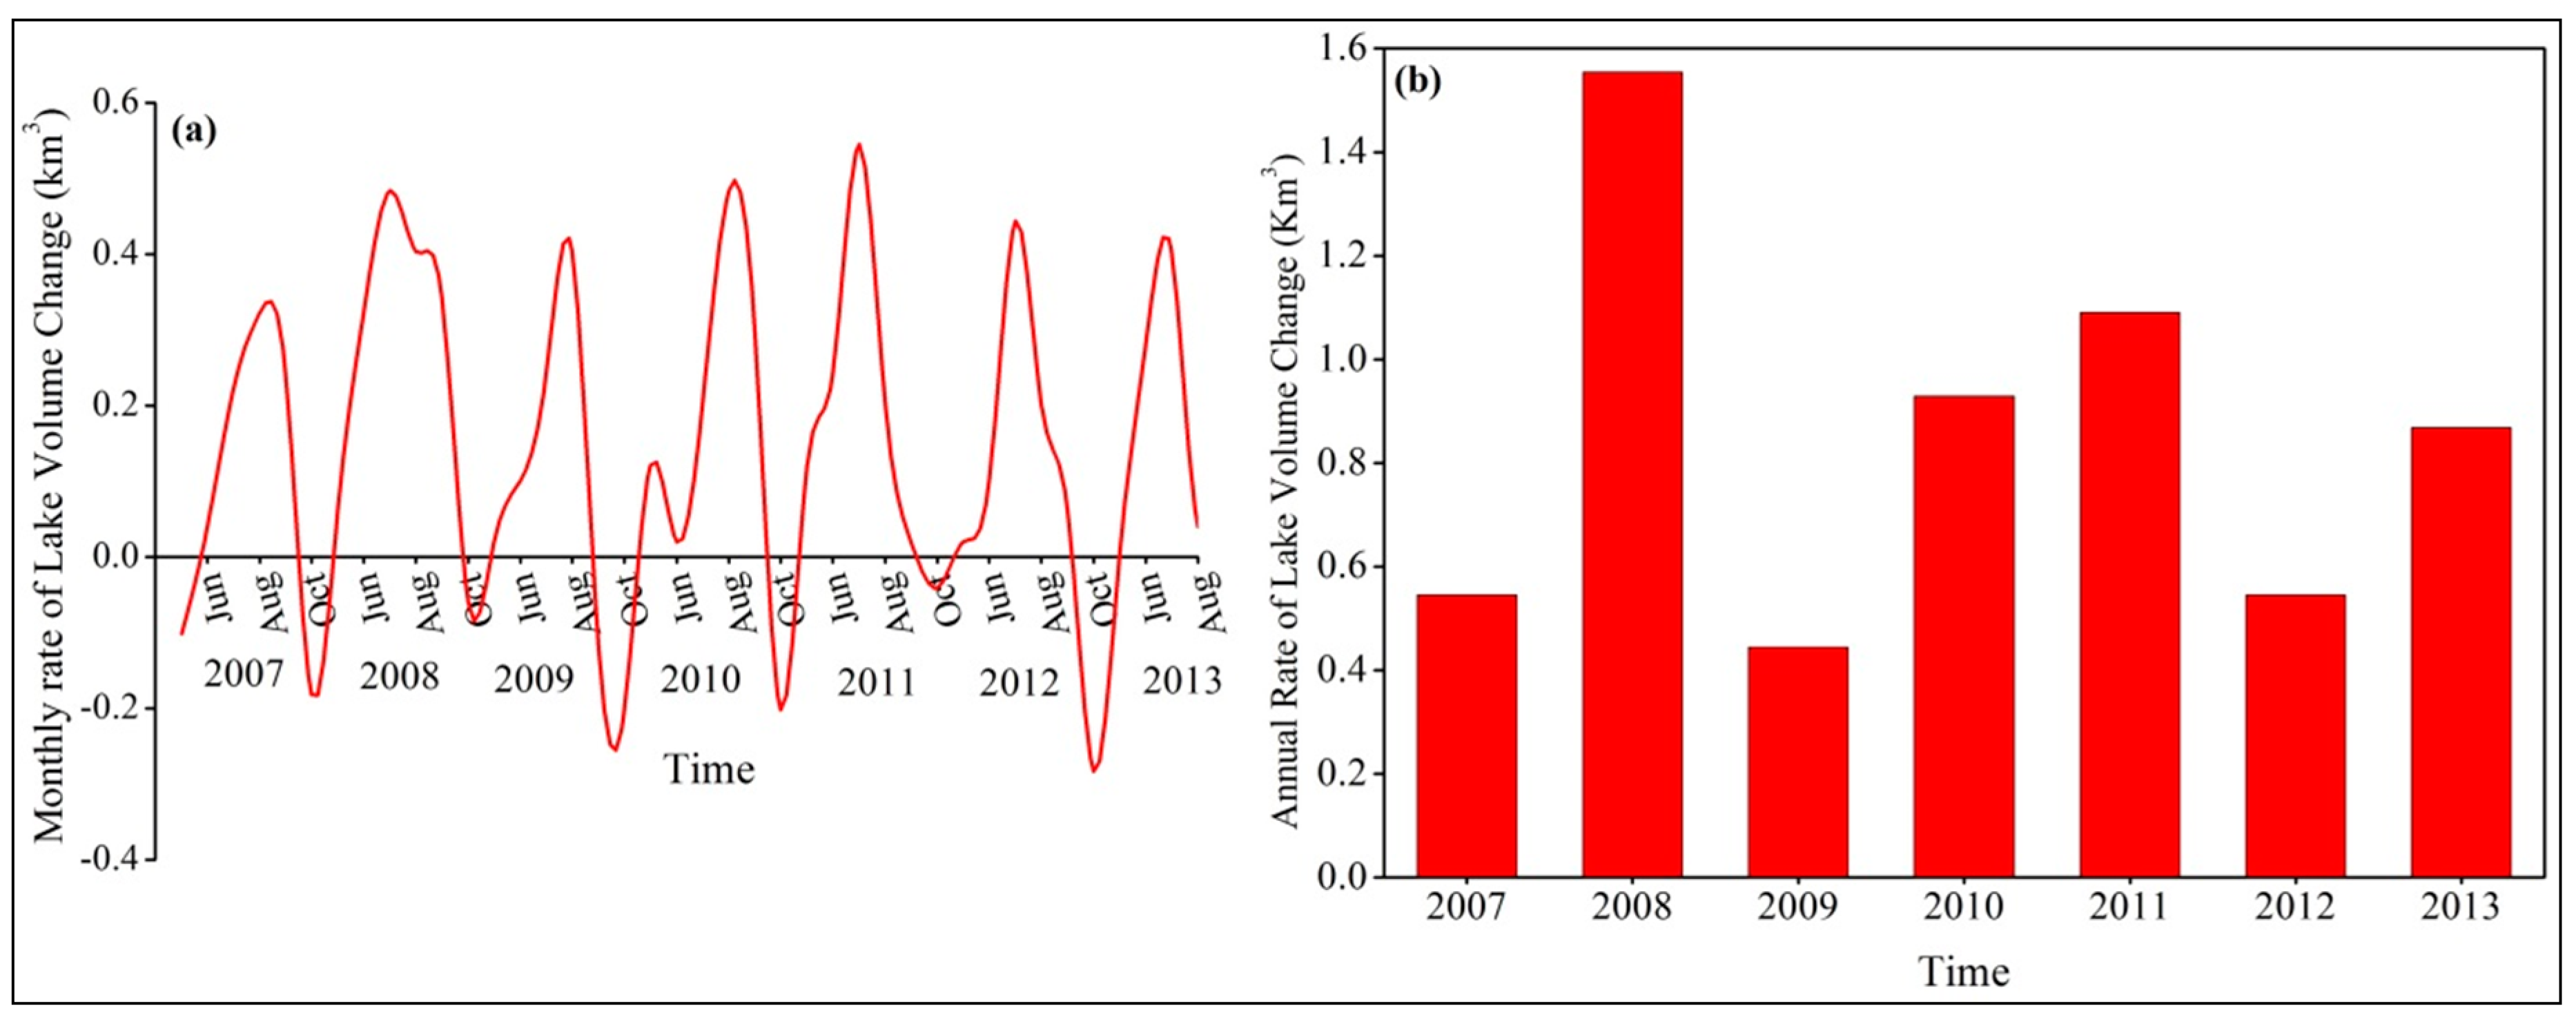
Figure 5a shows the summer (i.e., from May–October) water balance of the Nam Co Lake for the period of 2007 to 2013. In May and October 2007, the water balance was negative, which indicated water addition into the lake was lower than water loss from the lake. Conversely, water balance of the Nam Co Lake was positive from June to September, which indicated water addition into the lake was greater than that of water loss. The reason for the positive water balance from June to September might be the increased precipitation and glacier melting and decreased evaporation. The negative water balance might be associated with increased evaporation and decreased glacier melting and precipitation. Overall, the highest positive water balance was observed in July 2011 due to high monthly precipitation while the highest negative water balance was observed in October 2012 due to low precipitation on the Nam Co Lake.
The annual water balance of the Nam Co Lake from 2007 to 2013 is presented in Figure 5b. Overall, the water balance of the Nam Co Lake was positive from 2007 to 2013, which indicated an increase in the Nam Co Lake levels and its area. The highest positive lake storage was observed in 2008, i.e., 1.55 km3, while the lowest positive water storage was observed in 2009, i.e., 0.44 km3. The highest storage in 2008 might be due to the high amount of precipitation that occurred during that period. The reason for the lowest positive water balance in 2009 could be the low amount of precipitation, and high value of summer temperature that was observed at the NAMOR station which in turn accelerated evaporation from the Nam Co Lake.
3.6. Temporal Variations of Snow and Glacier Melt
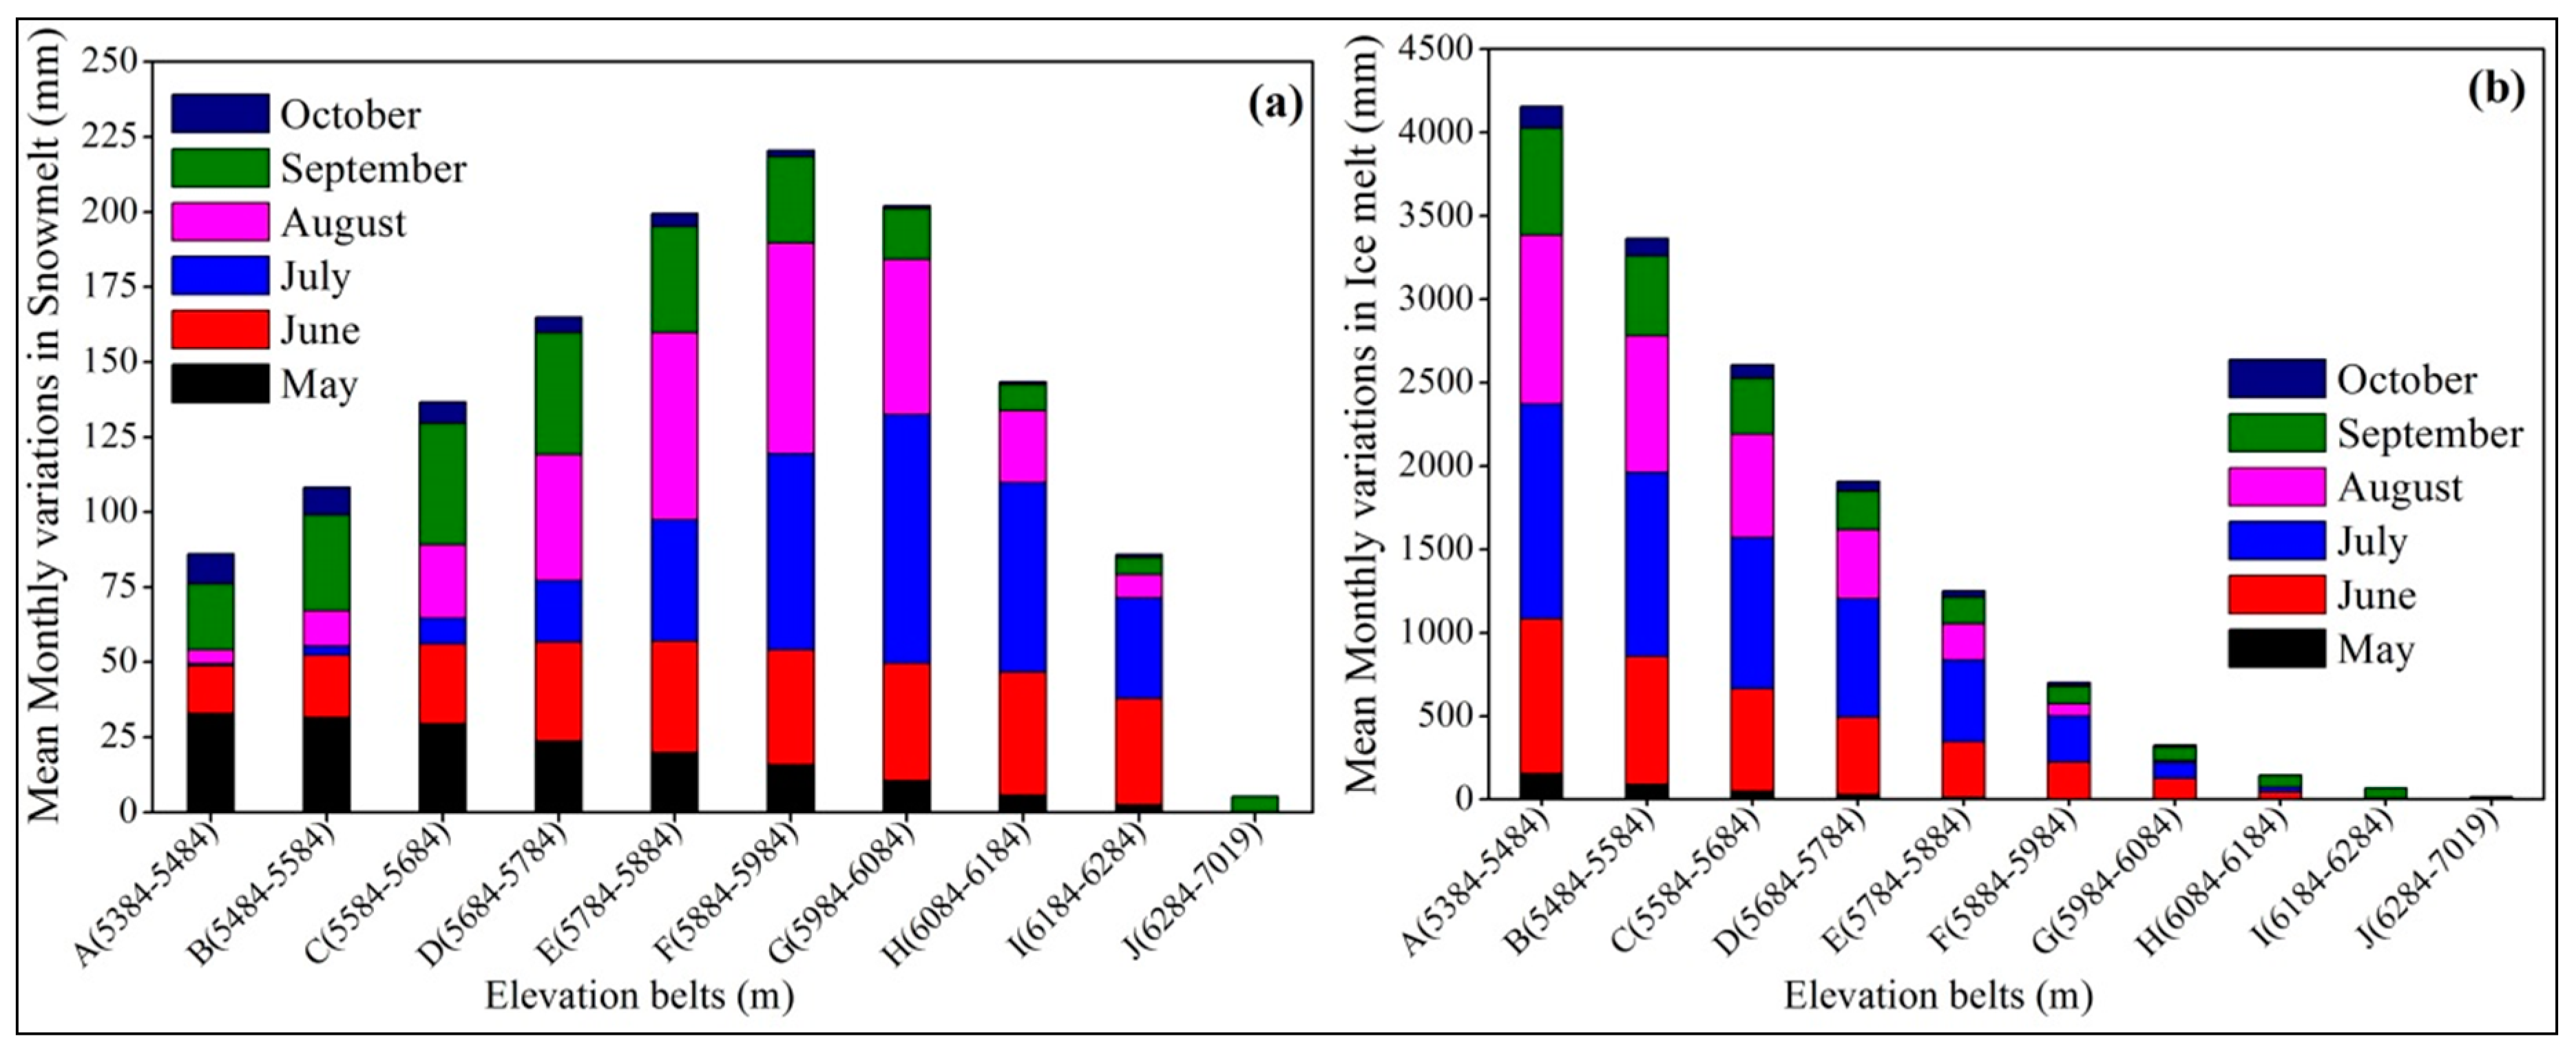
The variations of snow and glacier melt (in mm) in the summer season, from 2007–2014, at different elevations of the Nam Co basin glaciers are presented in Figure 6. High amount of snow melts at the mid-elevation belt, i.e., F (elevation of 5884–5984 m), and the low amount of snow melts at high elevation belt, i.e., J (elevation of 6284–7019 m), in the Nam Co basin was found during the study period, as presented in Figure 6a. The snowmelt gradually increased from the elevation belt A, and it reached to its peak value at mid-elevation belt, i.e., F, and then gradually decreased and reached to its lowest value at high elevation belt, i.e., J. The temporal variations indicated that in May and October, snowmelt was decreased from low to high elevation belts (i.e., A to J) while from June to September snowmelt was increased in low to mid-elevation belts (i.e., from A to F), and then decreased from mid to high elevation belts (i.e., from F to J). The high amount of glacier surface snow melts in July and August at mid-elevation belts (i.e., F and J) as compared to remaining periods.
Figure 6b displayed the temporal variations of glacier melt at different elevation belts of the Nam Co basin. It was found that from May to October glacier melt decreased from low (elevation of 5384–5484 m) to high (elevation of 6284–7019 m) elevation belts of the Nam Co basin due to high temperature at low elevation. Overall, the highest amount of glacier melt was found in July and the lowest was in May. The amount of ice melt at mid-altitude (i.e., 5884–5984 m) was less than that of snowmelt, which was highest at mid-altitude. On the other hand, snow and ice melt was nearly zero at the highest altitude zone, which is known as the accumulation zone.
3.7. Relative Contribution of Precipitation and Glacier Melt to Nam Co Lake
Figure 7 showed that the annual contributions of precipitation and glacier melt to the Nam Co Lake fluctuated between 45 to 65% and 34 to 54%, respectively, for the period of 2007 to 2013. It was observed that major contributor of streamflows to the Nam Co Lake was precipitation in 2008 to 2011 and 2013; while in 2007 and 2012 glacier melt contribution to the lake was found significant as compared to precipitation. Overall, the average annual proportional contribution of precipitation and glacier melt to Nam Co Lake was 57% (or 667 mm), and 43% (or 502 mm), respectively. The results revealed that precipitation was the main cause of the expansion of the Nam Co Lake, followed by glacier melt and decreased lake evaporation. Further analysis unveiled that the mean total amount of water generated during the summer season in the glaciated and non-glaciated subbasins flowing into the Nam Co Lake was 74% and 26%, respectively. However, the number of glaciated and non-glaciated subbasins in the Nam Co basin was 17 and 13, respectively. Therefore, due to the fact of a large number of glaciated subbasins and combined input of glacier melt and precipitation from the glaciated subbasins, the amount of water flowing into the Nam Co Lake was more than that of non-glaciated subbasins.
3.8. Glacier Mass Balance (GMB)
3.8.1. Annual Glacier Mass Balance of the Zhadang Glacier
The comparison of the annual GMB of Zhadang glacier from 2007 to 2014, as presented in Table 4, showed negative GMB of the basin with the lowest value in 2008 (i.e., −0.506 m w.e.) and highest value in 2009 (i.e., −4.45 m w.e.). The high values of negative GMB in 2009 and 2012 were due to high summer temperature which accelerated glacier melting during these years. The lowest values of negative GMB in 2008 and 2011 were associated with the high summer precipitation and low air temperature, which in turn decreased melting of Zhadang glacier.
3.8.2. Annual Glacier Mass Balance of the Nam Co Basin Glaciers
The annual GMB of the Nam Co basin glaciers for the period of 2007 to 2014 is presented in Table 5. The negative values of annual GMB for the study period indicated that almost all of the glaciers in the Nam Co basin were retreating and losing their mass due to an increase in annual temperature. The lowest negative value (−0.072 m w.e.) of GMB was observed in 2008. The high amount of precipitation before the melt season decreased the glacier melting process [61]. The negative GMB in 2009 and 2014 were due to high summer temperature and low precipitation, which accelerated the glacier melt in the Nam Co basin. Mean annual GMB from 2007 to 2014 of the Nam Co basin was −0.151 m w.e..
3.8.3. Elevation Wise Glacier Mass Balance of the Nam Co Basin Glaciers
The elevation wise GMB of the Nam Co basin glaciers for the period of 2007 to 2014 is displayed in Table 6. The GMB values were negative in the elevation belts from A to G, with some positive values in 2007, 2008, 2011, and 2013. For all time periods, the GMB was positive in elevation belt G to onward. The positive value of GMB in elevation belt G showed that ELA was present at an elevation between 5984 to 6084 m. Temporal variations indicated lowest negative GMB (i.e., −2.55 m w.e.) in 2008 and the highest (i.e., −5.90 m w.e.) in 2014 in elevation belt A, while the highest positive GMB was observed in 2007 (which was 0.65 m w.e.) in elevation belt J, as shown in Table 6.
4. Discussion
Our current study is the extension of our previous study, i.e., [26]. In our previous study, we did the calibration, validation, and sensitivity-uncertainty analysis of the SWAT model at gauged subbasins named Niyaqu and Qugaqie subbasins. The SWAT model used in the current study was set up in our previous study [26]. One of the purposes of the calibration of the SWAT model at gauged subbasins was to obtain the calibrated parameters which represent glaciated and non-glaciated subbasins and then to upscale it for the whole Nam Co basin. Because Nam Co basin hydrological regime does not vary much spatially, so, we supposed that the two gauged subbasins located at the north and south sides are representative of the whole Nam Co basin. Moreover, these two subbasins are not far away from each other so it was observed a very slight difference in the range of calibrated parameters between the two subbasins which further indicated that there is not so much diversity in the climatic features of the Nam Co Lake basin. Due to limitations of the input hydrological data and SWAT-CUP structure, calibrated parameters were obtained from the gauged subbasins and were directly used in the coupled model for simulation of total streamflows flowing to Nam Co Lake and compared it with the observed lake levels, so we called it a validation of the Nam Co Lake. Mainly, our current study assessed the performance of the SWAT model in estimating the water balance of the Nam Co Lake. The key objective of the current study was to assess the SWAT model performance over the whole Nam Co Lake basin by validating it with the observed Nam Co Lake levels. A secondary objective was to estimate and analyze the water balance of the Nam Co Lake. Moreover, the tertiary objective was to estimate the GMB at small (single glacier), and large scale (whole Nam Co basin glaciers) of the Nam Co basin. Most of the past studies carried out in the Nam Co basin to investigate the hydrological characteristics and GMB analysis at subbasin scale, i.e., [19,22,23,25], while a few researchers examined the hydrological characteristics at the basin scale [15,29]. However, their studies lead to uncertainties because of using satellite and nearby meteorological stations data as forcing to estimate the water balance of the Nam Co Lake.
To overcome the SWAT model incapability dealing with glaciers, DDM [27,28] was used in conjunction with the SWAT model to simulate the total streamflows including snow/ice melt to Nam Co Lake. The coupled model was applied over the whole Nam Co basin, and the resulted outflow was validated with the observed levels of the Nam Co Lake. Coupled model performed better over the whole Nam Co basin as compared to previous study Krause et al. [29] where the bias between the observed and simulated lake levels was greater compared to our study. The annual spatial variations of the water balance components at the subbasin scale of the Nam Co basin displayed that P, ET, Qs, and WYLD values were high on lake area as well as in glaciated subbasins as compared to non-glaciated subbasins. Besides, it was observed that most of the runoff generated from the south part of the Nam Co basin which comprised of Nyainqêntanglha Mountains and our current study is associated with the study of [32]. It was also explored that direct precipitation falling on the lake area was high compared to land surface area and it had good relation with the study of [15], they also found that amount of precipitation falling on the Nam Co lake was greater than that of land surface areas. Besides, our current study had a good association with the study of [29] regarding spatial variations of precipitation over the Nam Co basin. Moreover, it was observed that the value of annual lake evaporation was 615 mm and it was nearly equal to the study of [29,62], they found it 635 mm and 520 mm, respectively. However, the annual values of ET in the glaciated and non-glaciated subbasins were 280 mm and 234 mm respectively which has a good relationship with the study of [15], they found that annual value of evaporation from the land surface of the Nam Co basin was 273 mm. In comparison with other water balance components, SW and Qgw showed significant values in the east and south side of the Nam Co basin and exhibited nearly the same variations pattern at subbasin scale.
Temporal water balance analysis unveiled that water balance of the Nam Co Lake was positive from 2007 to 2013 which was an evidence of a continuous increase in lake levels, and its area expansion [6,16,30,63]. It was observed that precipitation was responsible in large storage of the Nam Co Lake in 2008, 2009, 2010, 2011, and 2013. However, it was perceived that Nam Co Lake storage was less affected by the precipitation instead by the glacier melt as observed in 2007 and 2012. The present study had good agreement with the study of [25]; they also demonstrated that in 2012 and 2014 streamflows were controlled by the glacier melt while in 2011 and 2013 by the precipitation in the Zhadang basin. Similarly, Biskop et al. [20] also observed that precipitation and associated runoff were responsible for inter-annual lake levels variations. They also found that the water balance of the Nam Co Lake remains positive under ice-free conditions. Moreover, we estimated that the average annual relative contribution of precipitation and glacier melt to Nam Co Lake were 57% (or 667 mm) and 43% (or 502 mm), respectively. This outcome has a good relationship with the studies of [6,15,18,64] they also found that precipitation contribution to Nam Co Lake was higher than that of glacier melt, and both were responsible for the enlargement of the Nam Co Lake. Furthermore, the current study has similar results with [20], they estimated that glacier melt contribution to the Nam Co Lake ranged between 14 and 30% which is less than that of combined runoff of rainfall and snowmelt from the glaciated part of the basin.
The further analysis exposed that the values of annual GMB of the Zhadang and the Nam Co basin glaciers were negative from 2007 to 2014 which was an evidence of accelerated glacier melting in the region and it is considered as a secondary driver of rapid lake area expansion. Zhadang GMB values were compared with the study of Zhang et al. [25] from 2011 to 2014, and results were found quite similar to their study. While the slight difference in GMB found might be due to using different analysis techniques, e.g., DDM and energy balance model (EBM). The negative GMB values showed that the entire glaciers in the Nam Co basin were retreating, and melting extensively. Moreover, it was observed that between 1970 and 2007 the glacier area of the Nam Co basin decreased by 37.1 km2, and at the same time area of Nam Co Lake increased by 72.6 km2 [65]. Furthermore, elevation wise GMB of the Nam Co basin was found negative from the elevation belt A(5384–5484 m) to G(5984–6084 m) after that it was positive which in other term showed that ELA lies between 5984 to 6084 m of elevation.
5. Conclusions
It was very thought-provoking to estimate the long term water balance of the Nam Co Lake under the context of climate change. Due to the lack of observed hydro-meteorological data and complex terrain, it became more challenging for the hydrologist to estimate the water budget of the Nam Co Lake accurately. There was previously very little research on the estimation of the water balance of the Nam Co Lake using hydrological modeling due to limitations of observed data. The present study used the subbasin based calibrated SWAT model forced by four observed meteorological stations data to simulate the outflows of the Nam Co basin from 2007 to 2015. DDM was used in conjunction with the SWAT model to estimate the glacier melt contribution to Nam Co Lake because of the inability of the SWAT model dealing with glaciers dynamics. The present study more practically used the DDM and divided the glacier into elevation belts based on temperature and precipitation lapse rates. Results include the following:
- We conclude that upscaling of calibrated parameters from the subbasin scale to basin scale produced reliable results and this technique could be used where there is a problem of input data scarcity required to force the hydrological model. The limitation of this binary approach is that the two basins or subbasins selected for upscaling should have similar topographic and climatic features to achieve satisfactory results.
- Water balance analysis unveiled that rapid and substantial growth of the Nam Co Lake was associated with precipitation while glacier melt proved as a secondary driver for lake expansion. However, the dominance of precipitation and glacier melt interchanged between the years. Moreover, the average annual relative contributions of precipitation and glacier melt were 57% (or 667 mm), and 42% (or 502 mm), respectively.
- Further analysis disclosed that the mean total summer amount of water generated in glaciated and non-glaciated subbasins flowing into the Nam Co Lake was 74% and 26%, respectively.
- Negative GMB of the Nam Co basin was found from 2007 to 2014 with an average annual value of −150.9 mm w.e. Negative GMB was evidence of accelerated glacier melting which had increased substantially due to rise in average annual temperature of the Nam Co basin.
- All of the analyses showed that rapid lake growth, such as with Nam Co, is a proxy indicator of climate change in the TP. The choice of DDM, along with the SWAT model in data scarce regions could prove reasonable in terms of simulation, water balance, and GMB analyses.
Supplementary Materials
The following are available online at https://www.mdpi.com/2073-4441/11/7/1383/s1.
Author Contributions
S.K. supervised and designed this study. M.A. processed the data and wrote the manuscript. G.Z. helped in the execution of the degree-day model. M.S. helped in the model simulation while M.N.A. assisted in formatting the manuscript. A.F.A. helped in solving modeling issues. All the authors contributed to the finalization of this manuscript.
Funding
This study is supported by National Natural Science Foundation of China (41630754, 41721091), State Key Laboratory of Cryosphere Science (SKLCS-ZZ–2018).
Acknowledgments
We are thankful to the Third Pole Environment (TPE), Institute of Tibetan Plateau, and the Chinese Academy of Sciences for providing us hydro-meteorological data to conduct this study. We also thank the staff of NAMOR station for the field observations.
Conflicts of Interest
The authors declare that there is no conflict of interest.
References
- Hoelzle, M.; Chinn, T.; Stumm, D.; Paul, F.; Zemp, M.; Haeberli, W. The application of glacier inventory data for estimating past climate change effects on mountain glaciers: A comparison between the European Alps and the Southern Alps of New Zealand. Glob. Planet. Chang. 2007, 56, 69–82. [Google Scholar] [CrossRef]
- Genxu, W.; Yuanshou, L.; Yibo, W.; Qingbo, W. Effects of permafrost thawing on vegetation and soil carbon pool losses on the Qinghai-Tibet Plateau, China. Geoderma 2008, 143, 143–152. [Google Scholar] [CrossRef]
- Owen, L.A.; Thackray, G.; Anderson, R.S.; Briner, J.; Kaufman, D.; Roe, G.; Pfeffer, W.; Yi, C. Integrated research on mountain glaciers: Current status, priorities and future prospects. Geomorphology 2009, 103, 158–171. [Google Scholar] [CrossRef]
- Ma, R.H.; Yang, G.S.; Duan, H.T.; Jiang, J.H.; Wang, S.M.; Feng, X.Z.; Li, A.N.; Kong, F.X.; Xue, B.; Wu, J.L.; et al. China’s lakes at present: Number, area and spatial distribution. Sci. China Earth Sci. 2011, 54, 283–289. [Google Scholar] [CrossRef]
- Lehner, B.; Döll, P. Development and validation of a global database of lakes, reservoirs and wetlands. J. Hydrol. 2004, 296, 1–22. [Google Scholar] [CrossRef]
- Wu, Y.; Zheng, H.; Zhang, B.; Chen, D.; Lei, L. Long-Term Changes of Lake Level and Water Budget in the Nam Co Lake Basin, Central Tibetan Plateau. J. Hydrometeorol. 2014, 15, 1312–1322. [Google Scholar] [CrossRef]
- Zhang, G.Q.; Xie, H.J.; Yao, T.D.; Kang, S.C. Water balance estimates of ten greatest lakes in China using ICESat and Landsat data. Chin. Sci. Bull. 2013, 58, 3815–3829. [Google Scholar] [CrossRef] [Green Version]
- Redway, J.W. Oscillations of Lake Levels and Changes of Climate. Ecology 1924, 5, 149–152. [Google Scholar] [CrossRef]
- Hartmann, H.C. Climate change impacts on Laurentian Great Lakes levels. Clim. Chang. 1990, 17, 49–67. [Google Scholar] [CrossRef]
- Jones, R.N.; McMahon, T.A.; Bowler, J.M. Modelling historical lake levels and recent climate change at three closed lakes, Western Victoria, Australia (c.1840-1990). J. Hydrol. 2001, 246, 159–180. [Google Scholar] [CrossRef]
- Nováky, B. Climate change impact on water balance of Lake Balaton. Water Sci. Technol. 2008, 58, 1865–1869. [Google Scholar] [CrossRef] [PubMed]
- Zhang, B.; Wu, Y.; Zhu, L.; Wang, J.; Li, J.; Chen, D. Estimation and trend detection of water storage at Nam Co Lake, central Tibetan Plateau. J. Hydrol. 2011, 405, 161–170. [Google Scholar] [CrossRef]
- Wang, J.; Zhu, L.; Wang, Y.; Ju, J.; Xie, M.; Daut, G. Comparisons between the chemical compositions of lake water, inflowing river water, and lake sediment in Nam Co, central Tibetan Plateau, China and their controlling mechanisms. J. Great Lakes Res. 2010, 36, 587–595. [Google Scholar] [CrossRef]
- Duo, B.; Baciren, B.; Ba, L.; Caiyun, W.; Tao, C. The response of water level of selin co to climate change during 1975–2008. Acta Geogr. Sin. 2010, 65, 313–319. [Google Scholar]
- Zhu, L.P.; Xie, M.P.; Wu, Y.H. Quantitative analysis of lake area variations and the influence factors from 1971 to 2004 in the Nam Co basin of the Tibetan Plateau. Chin. Sci. Bull. 2010, 55, 1294–1303. [Google Scholar] [CrossRef]
- Lei, Y.; Yao, T.; Bird, B.W.; Yang, K.; Zhai, J.; Sheng, Y. Coherent lake growth on the central Tibetan Plateau since the 1970s: Characterization and attribution. J. Hydrol. 2013, 483, 61–67. [Google Scholar] [CrossRef]
- Liu, J.; Kang, S.; Gong, T.; Lu, A. Growth of a high-elevation large inland lake, associated with climate change and permafrost degradation in Tibet. Hydrol. Earth Syst. Sci. 2010, 14, 481–489. [Google Scholar] [CrossRef] [Green Version]
- Zhou, S.; Kang, S.; Chen, F.; Joswiak, D.R. Water balance observations reveal significant subsurface water seepage from Lake Nam Co, south-central Tibetan Plateau. J. Hydrol. 2013, 491, 89–99. [Google Scholar] [CrossRef]
- Gao, T.; Kang, S.; Krause, P.; Cuo, L.; Nepal, S. A test of J2000 model in a glacierized catchment in the central Tibetan Plateau. Environ. Earth Sci. 2012, 65, 1651–1659. [Google Scholar] [CrossRef]
- Biskop, S.; Maussion, F.; Krause, P.; Fink, M. Differences in the water-balance components of four lakes in the southern-central Tibetan Plateau. Hydrol. Earth Syst. Sci. 2016, 20, 209–225. [Google Scholar] [CrossRef] [Green Version]
- Zhou, S.Q.; Kang, S.C.; Gao, T.G.; Zhang, G.S. Response of Zhadang Glacier runoff in Nam Co Basin, Tibet, to changes in air temperature and precipitation form. Chin. Sci. Bull. 2010, 55, 2103–2110. [Google Scholar] [CrossRef]
- Gao, T.; Kang, S.; Lan, C.; Zhang, T.; Zhang, G.; Zhang, Y.; Sillanpää, M. Simulation and analysis of glacier runoff and mass balance in the Nam Co basin, southern Tibetan Plateau. J. Glaciol. 2015, 61, 447–460. [Google Scholar] [CrossRef]
- Li, B.; Yu, Z.; Liang, Z.; Acharya, K. Hydrologic response of a high altitude glacierized basin in the central tibetan plateau. Glob. Planet. Chang. 2014, 118, 69–84. [Google Scholar] [CrossRef]
- Zhang, G.; Kang, S.; Fujita, K.; Huintjes, E.; Xu, J.; Yamazaki, T.; Haginoya, S.; Wei, Y.; Scherer, D.; Schneider, C.; et al. Energy and mass balance of Zhadang glacier surface, central Tibetan Plateau. J. Glaciol. 2013, 59, 137–148. [Google Scholar] [CrossRef] [Green Version]
- Zhang, G.; Kang, S.; Cuo, L.; Qu, B. Modeling hydrological process in a glacier basin on the central Tibetan Plateau with a distributed hydrology soil vegetation model. J. Geophys. Res. 2016, 121, 9521–9539. [Google Scholar] [CrossRef] [Green Version]
- Adnan, M.; Kang, S.C.; Zhang, G.S.; Anjum, M.N.; Zaman, M.; Zhang, Y.Q. Evaluation of SWAT Model performance on glaciated and non-glaciated subbasins of Nam Co Lake, Southern Tibetan Plateau, China. J. Mt. Sci. 2019, 16, 1075–1097. [Google Scholar] [CrossRef]
- Hock, R. Temperature index melt modelling in mountain areas. J. Hydrol. 2003, 282, 104–115. [Google Scholar] [CrossRef]
- Zhao, Q.; Zhang, S.; Ding, Y.J.; Wang, J.; Han, H.; Xu, J.; Zhao, C.; Guo, W.; Shangguan, D. Modeling Hydrologic Response to Climate Change and Shrinking Glaciers in the Highly Glacierized Kunma Like River Catchment, Central Tian Shan. J. Hydrometeorol. 2015, 16, 2383–2402. [Google Scholar] [CrossRef]
- Krause, P.; Biskop, S.; Helmschrot, J.; Flügel, W.A.; Kang, S.; Gao, T. Hydrological system analysis and modelling of the Nam Co basin in Tibet. Adv. Geosci. 2010, 27, 29–36. [Google Scholar] [CrossRef] [Green Version]
- Wang, X.; Gong, P.; Zhao, Y.; Xu, Y.; Cheng, X.; Niu, Z.; Luo, Z.; Huang, H.; Sun, F.; Li, X. Water-level changes in China’s large lakes determined from ICESat/GLAS data. Remote Sens. Environ. 2013, 132, 131–144. [Google Scholar] [CrossRef]
- Wang, J.; Zhu, L. Preliminary study on the field investigation of Nam Co. Annu. Rep. Nam Co Monit. Res. Stn. Multisphere Interact. 2006, 1, 42–46. [Google Scholar]
- Kang, S.; Chen, F.; Ye, Q.; Jing, Z.; Qin, D.; Ren, J. Glacier retreating dramatically on the Mt. Nyainqentanglha during the last 40 years. J. Glaciol. Geocryol. 2007, 29, 869–873. [Google Scholar]
- Dagang, Z.; Xiangang, M.; Xitao, Z.; Zhao-gang, S.; Chao-bin, Y.; Zhi-bang, M.; ZHONG-hai, W.; Jian-ping, W. Evolution and climatic change of nam co of tibet and an ancient large lake in the northern tibetan plateau since the late pleistocene. Geol. China 2004, 31, 269. [Google Scholar]
- Stehr, A.; Debels, P.; ARUMI, J.L.; Romero, F.; Alcayaga, H. Combining the soil and water assessment tool (swat) and modis imagery to estimate monthly flows in a data-scarce chilean andean basin. Hydrol. Sci. J. 2009, 54, 1053–1067. [Google Scholar] [CrossRef]
- Winchell, M.; Srinivasan, R.; Di Luzio, M.; Arnold, J. Arcswat interface for swat 2005. In User’s Guide, Blackland Research Center; Texas Agricultural Experiment Station: Temple, TX, USA, 2007. [Google Scholar]
- Grusson, Y.; Sun, X.; Gascoin, S.; Sauvage, S.; Raghavan, S.; Anctil, F.; Sáchez-Pérez, J.M. Assessing the capability of the SWAT model to simulate snow, snow melt and streamflow dynamics over an alpine watershed. J. Hydrol. 2015, 531, 574–588. [Google Scholar] [CrossRef]
- Neitsch, S.L.; Arnold, J.G.; Kiniry, J.E.A.; Srinivasan, R.; Williams, J.R. Soil and Water Assessment Tool User’s Manual. Version 2000, Blackland Research Center; Texas Agricultural Experiment Station: Temple, TX, USA.
- Gitau, M.W.; Chaubey, I. Regionalization of SWAT model parameters for use in ungauged watersheds. Water 2010, 2, 849–871. [Google Scholar] [CrossRef]
- Luo, Y.; Arnold, J.; Liu, S.; Wang, X.; Chen, X. Inclusion of glacier processes for distributed hydrological modeling at basin scale with application to a watershed in Tianshan Mountains, northwest China. J. Hydrol. 2013, 477, 72–85. [Google Scholar] [CrossRef]
- Anjum, M.N.; Ding, Y.; Shangguan, D. Simulation of the projected climate change impacts on the river flow regimes under CMIP5 RCP scenarios in the westerlies dominated belt, northern Pakistan. Atmos. Res. 2019, 227, 233–248. [Google Scholar] [CrossRef]
- Sperna Weiland, F.C.; Van Beek, L.P.H.; Kwadijk, J.C.J.; Bierkens, M.F.P. The ability of a GCM-forced hydrological model to reproduce global discharge variability. Hydrol. Earth Syst. Sci. 2010, 14, 1595–1621. [Google Scholar] [CrossRef] [Green Version]
- Cheng, W.Y.Y.; Steenburgh, W.J. Strengths and Weaknesses of MOS, Running-Mean Bias Removal, and Kalman Filter Techniques for Improving Model Forecasts over the Western United States. Weather Forecast. 2007, 22, 1304–1318. [Google Scholar] [CrossRef]
- Guo, W.; Xu, J.; Liu, S.; ShangGuan, D.; Wu, L.; Yao, X.; Zhao, J.; Liu, Q.; Jiang, Z.; Li, P.; et al. The second glacier inventory dataset of china (version 1.0). Cold Arid Reg. Sci. Data Cent Lanzhou 2014. [Google Scholar] [CrossRef]
- Neitsch, S.L.; Arnold, J.G.; Kiniry, J.R.; Williams, J.R. Soil and Water Assessment Tool Theoretical Documentation Version 2009; Texas Water Resources Institute: College Station, TX, USA, 2011. [Google Scholar]
- Mukhopadhyay, B.; Dutta, A. A Stream Water Availability Model of Upper Indus Basin Based on a Topologic Model and Global Climatic Datasets. Water Resour. Manag. 2010, 24, 4403–4443. [Google Scholar] [CrossRef]
- Penman, H.L. Natural evaporation from open water, hare soil and grass. Proc. R. Soc. Lond. Ser A. Math. Phys. Sci. 1948, 193, 120–145. [Google Scholar]
- Abbaspour, K.C. SWAT-CUP: SWAT Calibration and Uncertainty Programs-A User Manual, Department of Systems Analysis, Intergrated Assessment and Modelling (SIAM), EAWAG. Swiss Federal Institute of Aqualtic Science and Technology, Duebendorf, Switzerland. User Man. 2015, 100, s00402–s009. [Google Scholar]
- Garee, K.; Chen, X.; Bao, A.; Wang, Y.; Meng, F. Hydrological modeling of the upper indus basin: A case study from a high-altitude glacierized catchment Hunza. Water 2017, 9, 17. [Google Scholar] [CrossRef]
- Rahman, K.; Maringanti, C.; Beniston, M.; Widmer, F.; Abbaspour, K.; Lehmann, A. Streamflow Modeling in a Highly Managed Mountainous Glacier Watershed Using SWAT: The Upper Rhone River Watershed Case in Switzerland. Water Resour. Manag. 2013, 27, 323–339. [Google Scholar] [CrossRef]
- Yin, Z.; Feng, Q.; Zou, S.; Yang, L. Assessing variation in water balance components in mountainous Inland River Basin experiencing climate change. Water 2016, 8, 472. [Google Scholar] [CrossRef]
- Kang, E.; Cheng, G.; Lan, Y.; Jin, H. A model for simulating the response of runoff from the mountainous watersheds of inland river basins in the arid area of northwest China to climatic changes. Sci. China Ser. D 1999, 42, 52–63. [Google Scholar] [CrossRef]
- Cogley, J.G.; Hock, R.; Rasmussen, L.A.; Arendt, A.A.; Bauder, A.; Braithwaite, R.J.; Zemp, M. Glossary of glacier mass balance and related terms, IHP-VII Technical documents in hydrolo. Polar Rec. Gr. Br. 2012, 48, 2012. [Google Scholar] [CrossRef]
- Pellitero, R.; Rea, B.R.; Spagnolo, M.; Bakke, J.; Hughes, P.; Ivy-Ochs, S.; Lukas, S.; Ribolini, A. A GIS tool for automatic calculation of glacier equilibrium-line altitudes. Comput. Geosci. 2015, 82, 55–62. [Google Scholar] [CrossRef]
- Osmaston, H. Models for the estimation of firnlines of present and pleistocene glaciers. In Processes in Physical and Human Geography, Bristol Essays, 218; Peel, R.F., Chisholm, M.D.I., Haggett, P., Eds.; University of Bristol Press: Bristol, UK, 1975; p. 245. [Google Scholar]
- Furbish, D.; Andrews, J. The use of hypsometry to indicate long-term stability and response of valley glaciers to changes in mass transfer. J. Glaciol. 1984, 30, 199–211. [Google Scholar] [CrossRef]
- Osmaston, H. Estimates of glacier equilibrium line altitudes by the Area × Altitude, the Area × Altitude Balance Ratio and the Area × Altitude Balance Index methods and their validation. Quat. Int. 2005, 138–139, 22–31. [Google Scholar] [CrossRef]
- Benn, D.I.; Lehmkuhal, F. Mass balance and equilibrium-line altitudes of glaciers in high-mountain environments. Quat. Int. 2000, 65–66, 15–29. [Google Scholar] [CrossRef]
- Anderson, J.T.; Davis, C.A. Wetland Techniques: Volume 1: Foundations; Springer Science & Business Media: Berlin, Germany, 2013. [Google Scholar]
- Moriasi, D.N.; Arnold, J.G.; Van Liew, M.W.; Bingner, R.L.; Harmel, R.D.; Veith, T.L. Model Evaluation Guidelines for Systematic Quantification of Accuracy in Watershed Simulations. Trans. ASABE 2007, 50, 885–900. [Google Scholar] [CrossRef]
- Nash, J.E.; Sutcliffe, J.V. River flow forecasting through conceptual models part I—A discussion of principles. J. Hydrol. 1970, 10, 282–290. [Google Scholar] [CrossRef]
- Kang, S.; Chen, F.; Gao, T.; Zhang, Y.; Yang, W.; Yu, W.; Yao, T. Early onset of rainy season suppresses glacier melt: A case study on Zhadang glacier, Tibetan Plateau. J. Glaciol. 2009, 55, 755–758. [Google Scholar] [CrossRef]
- Ma, N.; Szilagyi, J.; Niu, G.Y.; Zhang, Y.; Zhang, T.; Wang, B.; Wu, Y. Evaporation variability of Nam Co Lake in the Tibetan Plateau and its role in recent rapid lake expansion. J. Hydrol. 2016, 537, 27–35. [Google Scholar] [CrossRef]
- Kropáček, J.; Braun, A.; Kang, S.; Feng, C.; Ye, Q.; Hochschild, V. Analysis of lake level changes in Nam Co in central Tibet utilizing synergistic satellite altimetry and optical imagery. Int. J. Appl. Earth Obs. Geoinf. 2012, 17, 3–11. [Google Scholar] [CrossRef]
- Wu, Y.; Zhu, L. The response of lake-glacier variations to climate change in Nam Co Catchment, central Tibetan Plateau, during 1970–2000. J. Geogr. Sci. 2008, 18, 177–189. [Google Scholar] [CrossRef]
- Chen, F.; Kang, S.; Zhang, Y.; You, Q. Glaciers and lake change in response to climate change in the nam co basin, tibet. J. Mt. Sci. 2009, 27, 641–647. [Google Scholar]
Figure 1.
Geographical map of the study area and automatic hydro-meteorological stations.

Figure 2.
Maps of (a) land use, (b) soil type, and (c) slope of the Nam Co basin.

Figure 3.
Validation of SWAT model simulated lake levels with the observed levels of the Nam Co Lake.
Figure 3.
Validation of SWAT model simulated lake levels with the observed levels of the Nam Co Lake.

Figure 4.
Spatial variations of the water balance components of the Nam Co basin at the subbasin scale.
Figure 4.
Spatial variations of the water balance components of the Nam Co basin at the subbasin scale.

Figure 5.
(a) Monthly and (b) annual rate of change of the Nam Co Lake volume from 2007–2013.

Figure 6.
Spatial and temporal variations in the (a) snowmelt and (b) glacier melt of the Nam Co basin from 2007–2014.
Figure 6.
Spatial and temporal variations in the (a) snowmelt and (b) glacier melt of the Nam Co basin from 2007–2014.

Figure 7.
The relative contribution of precipitation and glacier melt to the Nam Co Lake.


Table 1.
List of datasets used in this study.
| Data Type | Data Description | Scale and Time Domain | Data Source |
|---|---|---|---|
| DEM | Aster GDEM | 90 × 90 m | ASTER-GDEM from USGS website |
| DEM | DEM vertical standard deviation/Error | 277.15 m | ASTER-GDEM from USGS website |
| Land use | The China Archive | 1 × 1 km (2005) | IGSNRR, http://www.igsnrr.ac.cn |
| Soil | Harmonized World Soil Database v 1.2 | 90 × 90 m | http://webarchive.iiasa.ac.at |
| Meteorological Data | NAMOR, Zhadang, Baoji, Deqing | Daily (2007–2015) | Third Pole Environment, ITP, CAS |
| Discharge | Zhadang, Quqaqie, Niyaqu | Daily (2007–2014) | Third Pole Environment, ITP, CAS |
| Lake Level | Nam Co lake levels (m) | Daily (2007–2013) | Third Pole Environment, ITP, CAS |
| Glacier | Nam Co basin glacier data | 2014 | China Second Glacier Inventory (1.0) |
| Reanalysis Data | Precipitation | Daily (0.25°) | TRMM_3B42RT |
| Reanalysis Data | Temperature, relative humidity, wind speed, solar radiation | Daily (0.125°) | Era-Interim |
Table 2.
Parameters adjusted separately for glaciated and non-glaciated subbasins of the whole Nam Co basin.
Table 2.
Parameters adjusted separately for glaciated and non-glaciated subbasins of the whole Nam Co basin.
| Parameter | Description | Adjusted for Glaciated Subbasins | Adjusted for Non-Glaciated Subbasins |
|---|---|---|---|
| v_CH_K2.rte | Effective hydraulic conductivity | 91.32 | 56.26 |
| v_ALPHA_BNK.rte | Baseflow alpha factor for bank storage | 0.83 | 0.23 |
| r_SOL_BD.sol | Moist bulk density (g/cm−3) | 0.08 | 0.13 |
| r_SOL_K.sol | Saturated hydraulic conductivity (mm/h) | 0.44 | 0.53 |
| r_SOL_AWC.sol | Soil available water capacity (mm H2O/mm soil) | 0.11 | 0.19 |
| v_SMFMN.bsn | Minimum melt rate for snow during the year (occurs on winter solstice) H2O/°C-day) | 2.45 | 3.51 |
| v_SMFMX.bsn | Maximum melt rate for snow during the year (occurs on the summer solstice). (mm H2O/°C-day) | 7.41 | 8.23 |
| v_TIMP.bsn | Snowpack temperature lag factor | 0.299 | 0.52 |
| v_TLPAS.sub | Temperature lapse rate (°C/km) | −5.7 | −5.7 |
| v_SMTMP.bsn | Snow melt base temperature (˚C) | −1.74 | −1.46 |
| v_SFTMP.bsn | Snowfall temperature (°C) | −2.39 | −3.1 |
| v_PLAPS.sub | Precipitation lapse rate (mm H2O/km) | 105.4 | 105.4 |
| v_SNOCOVMX.bsn | Minimum snow water content that corresponds to 100% snow cover | 302.81 | 348 |
| v_SNO50COV.bsn | Snow water equivalent that corresponds to 50% snow cover. | 0.59 | 0.8 |
| v_ESCO.hru | Soil evaporation compensation factor | 0.8 | 0.77 |
| v_CH_N2.rte | Manning’s roughness coefficient | 0.14 | 0.035 |
| v_GW_REVAP.gw | coefficient for groundwater re-evaporation | 0.17 | 0.14 |
| v_GW_DELAY.gw | Groundwater delay (days) | 108.36 | 151.76 |
| v_ALPHA_BF.gw | Base flow alpha factor (days) | 0.52 | 0.45 |
| r_CN2.mgt | Initial SCS runoff curve number for moisture condition II | 0.095 | 0.07 |
| v_GWQMN.gw | Threshold depth in shallow aquifer for return flow (mm) | 0.72 | 0.99 |
| v_RCHRG_DP.gw | Percolation from deep aquifer | 0.28 | 0.15 |
Note: where v denotes that the parameter value is replaced by a given value, while r denotes that the parameter value is multiplied by (1 + a given value).
Table 3.
Parameters used in DDM for the Nam Co basin.
| Model Parameters | Description | Unit | Values | Reference |
|---|---|---|---|---|
| Degree-day factor for snow | mm °C−1 day−1 | 5.06 | [26] | |
| Degree-day factor for ice | mm °C−1 day−1 | 10.30 | [26] | |
| Tmx | Maximum temperature at which snow can fall | °C | 2.0 | [26,28] |
| Tmn | Minimum temperature at which rain can fall | °C | −2.0 | [26,28] |
| F_ASP or | Factor quantifying the aspect | fraction | 0.3 | [28] |
| CWH | Water holding capacity of snow | fraction | 0.1 | [28] |
| CFRC | Refreezing coefficient | fraction | 0.1 | [28] |
| TT | Threshold temperature | °C | 0.0 | [28] |
| RATION_ICE | DDFice/DDFsnow | fraction | 2.04 | Current study |
| RHO_ICE | Ice density | Kg/m3 | 920 | [28] |
| RHOW | Water density | Kg/m3 | 1000 | [28] |
Table 4.
Simulated GMB of the Zhadang glacier and compared with others.
| Year | Zhadang Mass Balance (m w.e.) | Comparison with Other Studies | |
|---|---|---|---|
| 2007 | −2.03 | −0.789 | [61] |
| 2008 | −0.506 | 0.223 | [61] |
| 2009 | −4.45 | ||
| 2010 | −2.826 | ||
| 2011 | −1.106 | −0.98 | [25] |
| 2012 | −3.329 | −2.58 | [25] |
| 2013 | −2.74 | −1.16 | [25] |
| 2014 | −2.16 | −1.69 | [25] |
Table 5.
Mean annual GMB of the Nam Co basin.
| Year | Mean Annual GMB of the Nam Co basin (m w.e.) |
|---|---|
| 2006/2007 | −0.069 |
| 2007/2008 | −0.032 |
| 2008/2009 | −0.104 |
| 2009/2010 | −0.080 |
| 2010/2011 | −0.050 |
| 2011/2012 | −0.102 |
| 2012/2013 | −0.077 |
| 2013/2014 | −0.159 |
| Average | −0.151 |
Table 6.
Elevation wise simulated GMB of the Nam Co basin.
| Year/Elevation Belts | A(5384–5484) | B(5484–5584) | C(5584–5684) | D(5684–5784) | E(5784–5884) | F(5884–5984) | G(5984–6084) | H(6084–6184) | I(6184–6284) | J(6284–7019) |
|---|---|---|---|---|---|---|---|---|---|---|
| 2006/2007 | −4.04 | −3.14 | −2.29 | −1.48 | −0.77 | −0.16 | 0.24 | 0.40 | 0.50 | 0.65 |
| 2007/2008 | −2.55 | −1.80 | −1.14 | −0.58 | −0.13 | 0.11 | 0.29 | 0.36 | 0.40 | 0.42 |
| 2008/2009 | −4.40 | −3.64 | −2.91 | −2.23 | −1.56 | −0.90 | −0.40 | 0.00 | 0.31 | 0.54 |
| 2009/2010 | −3.81 | −3.04 | −2.33 | −1.74 | −1.17 | −0.63 | −0.16 | 0.20 | 0.39 | 0.60 |
| 2010/2011 | −3.43 | −2.64 | −1.89 | −1.16 | −0.45 | 0.10 | 0.39 | 0.53 | 0.60 | 0.62 |
| 2011/2012 | −4.54 | −3.72 | −2.94 | −2.16 | −1.43 | −0.76 | −0.20 | 0.15 | 0.31 | 0.39 |
| 2012/2013 | −3.91 | −3.19 | −2.48 | −1.77 | −1.06 | −0.44 | 0.09 | 0.36 | 0.50 | 0.58 |
| 2013/2014 | −5.90 | −4.99 | −4.08 | −3.20 | −2.32 | −1.49 | −0.85 | −0.43 | −0.17 | 0.27 |
© 2019 by the authors. Licensee MDPI, Basel, Switzerland. This article is an open access article distributed under the terms and conditions of the Creative Commons Attribution (CC BY) license (http://creativecommons.org/licenses/by/4.0/).
Share and Cite
MDPI and ACS Style
Adnan, M.; Kang, S.; Zhang, G.; Saifullah, M.; Anjum, M.N.; Ali, A.F. Simulation and Analysis of the Water Balance of the Nam Co Lake Using SWAT Model. Water 2019, 11, 1383. https://doi.org/10.3390/w11071383
AMA Style
Adnan M, Kang S, Zhang G, Saifullah M, Anjum MN, Ali AF. Simulation and Analysis of the Water Balance of the Nam Co Lake Using SWAT Model. Water. 2019; 11(7):1383. https://doi.org/10.3390/w11071383
Chicago/Turabian StyleAdnan, Muhammad, Shichang Kang, Guoshuai Zhang, Muhammad Saifullah, Muhammad Naveed Anjum, and Ayaz Fateh Ali. 2019. "Simulation and Analysis of the Water Balance of the Nam Co Lake Using SWAT Model" Water 11, no. 7: 1383. https://doi.org/10.3390/w11071383
Note that from the first issue of 2016, this journal uses article numbers instead of page numbers. See further details here.