Hydrogeochemical Model Supporting the Remediation Strategy of a Highly Contaminated Industrial Site


1
Department of Earth Science, Sapienza University of Rome, Piazzale Aldo Moro 5, 00185 Rome, Italy
2
Department of Chemistry, Sapienza University of Rome, Piazzale Aldo Moro 5, 00185 Rome, Italy
*
Author to whom correspondence should be addressed.
Water 2019, 11(7), 1371; https://doi.org/10.3390/w11071371
Submission received: 19 May 2019
/
Revised: 30 June 2019
/
Accepted: 2 July 2019
/
Published: 3 July 2019
(This article belongs to the Special Issue Groundwater and Soil Remediation)
Abstract
:Delineation and understanding the geology and the hydrogeology of a contaminated site, considering its chemical and its biological aspects, are fundamental requirements for successful environmental remediation. The aim of this research is to provide some evidence about the effectiveness of a hydrogeochemical geodatabase to facilitate the integrated management, representation and analysis of heterogeneous data, enabling the appropriate selection, design and optimization of an effective remediation strategy. This study investigates a new technology for the remediation of a dense non-aqueous phase liquid aged source zone, with the aim of enhancing in situ bioremediation by coupling groundwater circulation wells with a continuous production system of electron donors. The technology was verified through a pilot test carried out at an industrial site highly contaminated by chlorinated aliphatic hydrocarbons. The multidisciplinary conceptual model confirmed a complex hydrogeological situation, with the occurrence of active residual sources in low permeability layers. The pilot test results clearly demonstrate a significant mobilization of contaminants from the low permeability zone, and the possibility of favoring the in situ natural attenuation mechanisms based upon biological reductive dechlorination. Different information related to the hydrogeochemical sphere must be integrated and taken into consideration when developing a reliable remediation strategy for contaminated sites.
1. Introduction
1.1. An Overview of Dense Non-Aqueous Phase Liquids
Chlorinated solvents such as trichloroethylene (TCE) and tetrachloroethylene (PCE) are the most common classes of dense non-aqueous phase liquids (DNAPLs) [1]. PCE and TCE are used as degreasers, dry cleaning fluids and solvents in many industrial and commercial processes, and are often released to the subsurface [2]. The physical and chemical properties of DNAPLs, aside from their relatively low solubility [3], high specific gravity [4] and tendency to remain adsorbed to organic and fine-grained materials [5], make DNAPLs difficult to locate and characterize in the subsurface [6], and this can impact the effectiveness of conventional remedial technologies [7]. Upon their release at the ground surface, DNAPLs tend to migrate downwards through the saturated zone [8], and over time they accumulate in layers with lower permeability [3,9], from which they are then difficult to mobilize with traditional pumping systems [10].
1.2. The Combination of Groundwater Circulation Wells and Biological Reductive Dechlorination
In the present work, a new technology was used for the progressive remediation of DNAPL secondary sources—coupling groundwater circulation wells (GCWs), with a production system of electron donors for the stimulation of in situ biological reductive dechlorination [11]. In this case, because of the geochemistry and hydrogeology of the site, the conventional addition methods are not suitable; traditional injection approaches are often limited by the preferential migration of injected fluids through better permeable zones, while delivery through less permeable and contaminated layers is usually limited [12]. On the other hand, GCWs could be considered a strategy for the progressive remediation of the source zone; this remediation technology is designed to create in situ vertical groundwater circulation cells by drawing groundwater from an aquifer through one screened section of a multi-screened well, and discharging it through another screened section [13]. The pressure gradient between the two hydraulically-separated screen sections in the well induces a circulation flow in the aquifer, forcing water to move through a less permeable layer where residual sources of chlorinated aliphatic hydrocarbons (CAHs) are usually located [12]. In situ bioremediation involves the stimulation of microorganisms to metabolize or destroy contaminants through the addition of various amendments (biostimulation) to the subsurface environment [14]. The combined technology is verified through a pilot test (the first of its kind) carried out in an operative industrial site located in the Po plain, which site is heavily contaminated by CAHs. Based on the satisfactory results of the laboratory investigations (microbiological and microcosm tests), which indicated that reductive dechlorination might be successfully enhanced at the considered site [12,15,16,17], the design and execution of a field test was performed as the final step of the evaluation process [11,12,15]. The pilot test aimed to verify the possible mobilization of contaminants trapped in horizons with very low permeability, and the effective distribution of electron donors to stimulate the in situ processes of natural attenuation [15]. The pilot test was designed to optimize the layout and to calibrate the implementation of an optimized full-scale intervention, in order to check its efficiency. The application in the field during the pilot test determined the process efficiency and extent of treatment, which may vary depending upon the site’s subsurface characteristics.
1.3. The Integrated Geodatabase to Support the Remediation Strategy
The selection and deployment of appropriate technologies for the remediation strategy rely on initial characterization activities [18]. In environmental issues, geology-related factors control the migration of contaminant plumes and affect the performance of remediation technologies [19]. The high-resolution characterization of underground geological heterogeneities, and the integration of different information, represent a key element for a remediation design, the optimization of interventions and performance monitoring [20]. The creation of a four-dimensional (4D) geographical database, (which also considers the time factor), enables the integrated management, representation, and analysis of different data (geological, hydrogeological and hydrogeochemical) [21]. Notably, the integration of geological, hydrogeological and chemical data describes the geological–technical characteristics of the subsoil, the hydraulic properties of aquifers that may be possible contamination vehicles and also the potential pollution of environmental matrices [22]. These peculiar aspects, influenced by the local geological architecture, are unique site-specific elements, according to which it is possible to implement a targeted intervention for a remediation purpose [20]. The representation of the geological structure through a 3D model facilitates its understanding and depicts the hydrogeological setting [22]. The dynamics linked to the groundwater flow play a fundamental role in the transport of contaminants [23]. The geolocalization of the concentration data of chemical species provides a complete picture on the trend in time and space of contaminant concentrations. Detailed knowledge of all the aspects mentioned above optimizes the planned remediation and safety measures. Furthermore, a 3D hydrogeochemical model represents the decision support system, which increases the effectiveness of the analysis, as it provides support to all those who must make strategic decisions [24]. In the context of remediation of contaminated sites, the challenge to be faced is to simultaneously integrate the information relating to the hydrogeochemical sphere in all its dimensions [19].
The construction of a multidisciplinary geodatabase and the realization an integrated model achieve this objective. They represent the tools for the management and analysis of multi-source data. 3D visualization, geospatial analysis and the integration of geo-referenced data, contribute to the continuous convergence of different types of geomodeling. This ensures the interchangeability of information in the multidisciplinary nature of the elements involved. Their interaction and the high-resolution characterization of environmental variability support the design of a targeted and effective remediation strategy [19,20]. Holding a significant amount of data, the integrated geodatabase allows useful information for decision-making processes to be extracted in a short time and in a versatile way [20]. The presented work focuses on the essential role of the proper collection, storage, representation and integration of geothematic data from different sources in defining reliable remediation strategies for a contaminated site. The aim of this paper is to provide some evidence about the effectiveness of a single composite geodatabase, which integrates hydrogeochemical data, to act as a “cockpit” in the different phases of remediation strategy development—the definition of a conceptual model, the design of a remediation strategy and the implementation, monitoring and validation of a pilot test.
2. Materials and Methods
A large amount of multithematic data was stored and centralized in an integrated information management and analysis platform. The data cockpit assumed the role of an effective “near real time” decision support system (DSS), able to manage and release data from the characterization to the technique implementation [25]. The collection of hydrogeochemical data was rendered in digital format through the creation of a 4D geodatabase that considered the time factor. The thematic database represented a georeferenced data storage model used for processing and editing [21]. The hydrogeochemical model analysis and the remediation technology selection have been achieved previously using multiscale and multiphase approaches [26]. In the first phase, the main hydrogeochemical characteristics, surrounding the industrial site at full scale, were detected. In the second phase, starting from the hydrogeochemical conceptual model obtained from the first one, the analysis focused on the pilot test area, increasing the observation scale to analyze in detail the effects of geological heterogeneity and chemical peculiarity in the first intervention area. Based on the results of the laboratory investigations (microbiological and microcosm tests), the design and execution of a field test was then performed as the final step of the evaluation process [11,12,15]. The pilot test was designed to optimize the layout of the intervention, to check its efficiency, and to calibrate the full-scale intervention. (The configuration of the pilot experiment will be discussed in Section 3.3.) The advanced geological modeling at both scales followed the reworking of stratigraphic data and their archiving in the geodatabase. In the industrial plant area, 83 stratigraphic logs from boreholes drilled between 2001 and 2014 were available. A further four boreholes were drilled within our activity (2017) for refining the geological model and taking soil samples useful for laboratory tests. Forty-eight particle-size analyses [27], 12 triaxial cell permeability tests, determinations of Atterberg limits [28] and assessments of water content [29], offered the analytical evaluation of the textural and permeability characteristics. The particle-size tests, Atterberg limits determination and permeability definition through the triaxial cells, were performed at the Applied Geology Laboratory of the University of Rome—”La Sapienza”. The data thus acquired were organized according to a lithotechnical criterion, i.e., considering the granulometric and hydraulic conductivity characteristics which are the most influential on groundwater circulation [30]. The related hydrogeological 3D model was reconstructed by means of RockWorks 17 software [31]. This software enabled the acquisition, analysis, visualization and integration of information from geo-referenced data. The data integration and analysis phase involved the interpolation and processing of the geological and hydrochemical parameters [32,33]. The parameters include the characteristics of stratigraphic horizons, groundwater levels and the chemical analysis of water sampled. Data belonging to different scientific spheres were elaborated with the inverse distance weighted geostatistical method [33,34,35] to obtain an integrated multidisciplinary model.
The 3D georeferenced model allows useful information for the decision-making process to be extracted in a short time and in a versatile way [31]. The geo-referencing of previous data and new periodic measurements in 95 piezometers installed inside the plant allowed the realization of the hydrogeological structure modeling and the reconstruction of the groundwater circulation scheme [33,35,36]. The storage, processing and representation of data monitoring in a geographic information system (GIS) environment allowed us to reconstruct the evolution of the groundwater contamination status over time [33,34,37]. Thematic maps, reproducing the groundwater contamination status evolution, were produced based on the chemical analyses of waters sampled in the monitoring network in the period of 2008–2017. This type of representation permitted the visualization of the evolution status of groundwater pollution, the identification of the areas impacted by contamination and the individuation of the intervention area. The spatial overlay of the geological and hydrochemical models has provided important indications on the contamination dynamics [19]. The geological sections, extracted from the 3D solid model, were enriched by the hydrochemical data relating to the concentrations of contaminants detected in the multilevel piezometers [38], which were located in the pilot test area. The hydrochemical profiles that were extrapolated from contamination models that were generated for data referred to monitoring campaigns carried out from 2014 to 2016.
3. Results and Discussion
3.1. Geological and Hydrogeological Settings
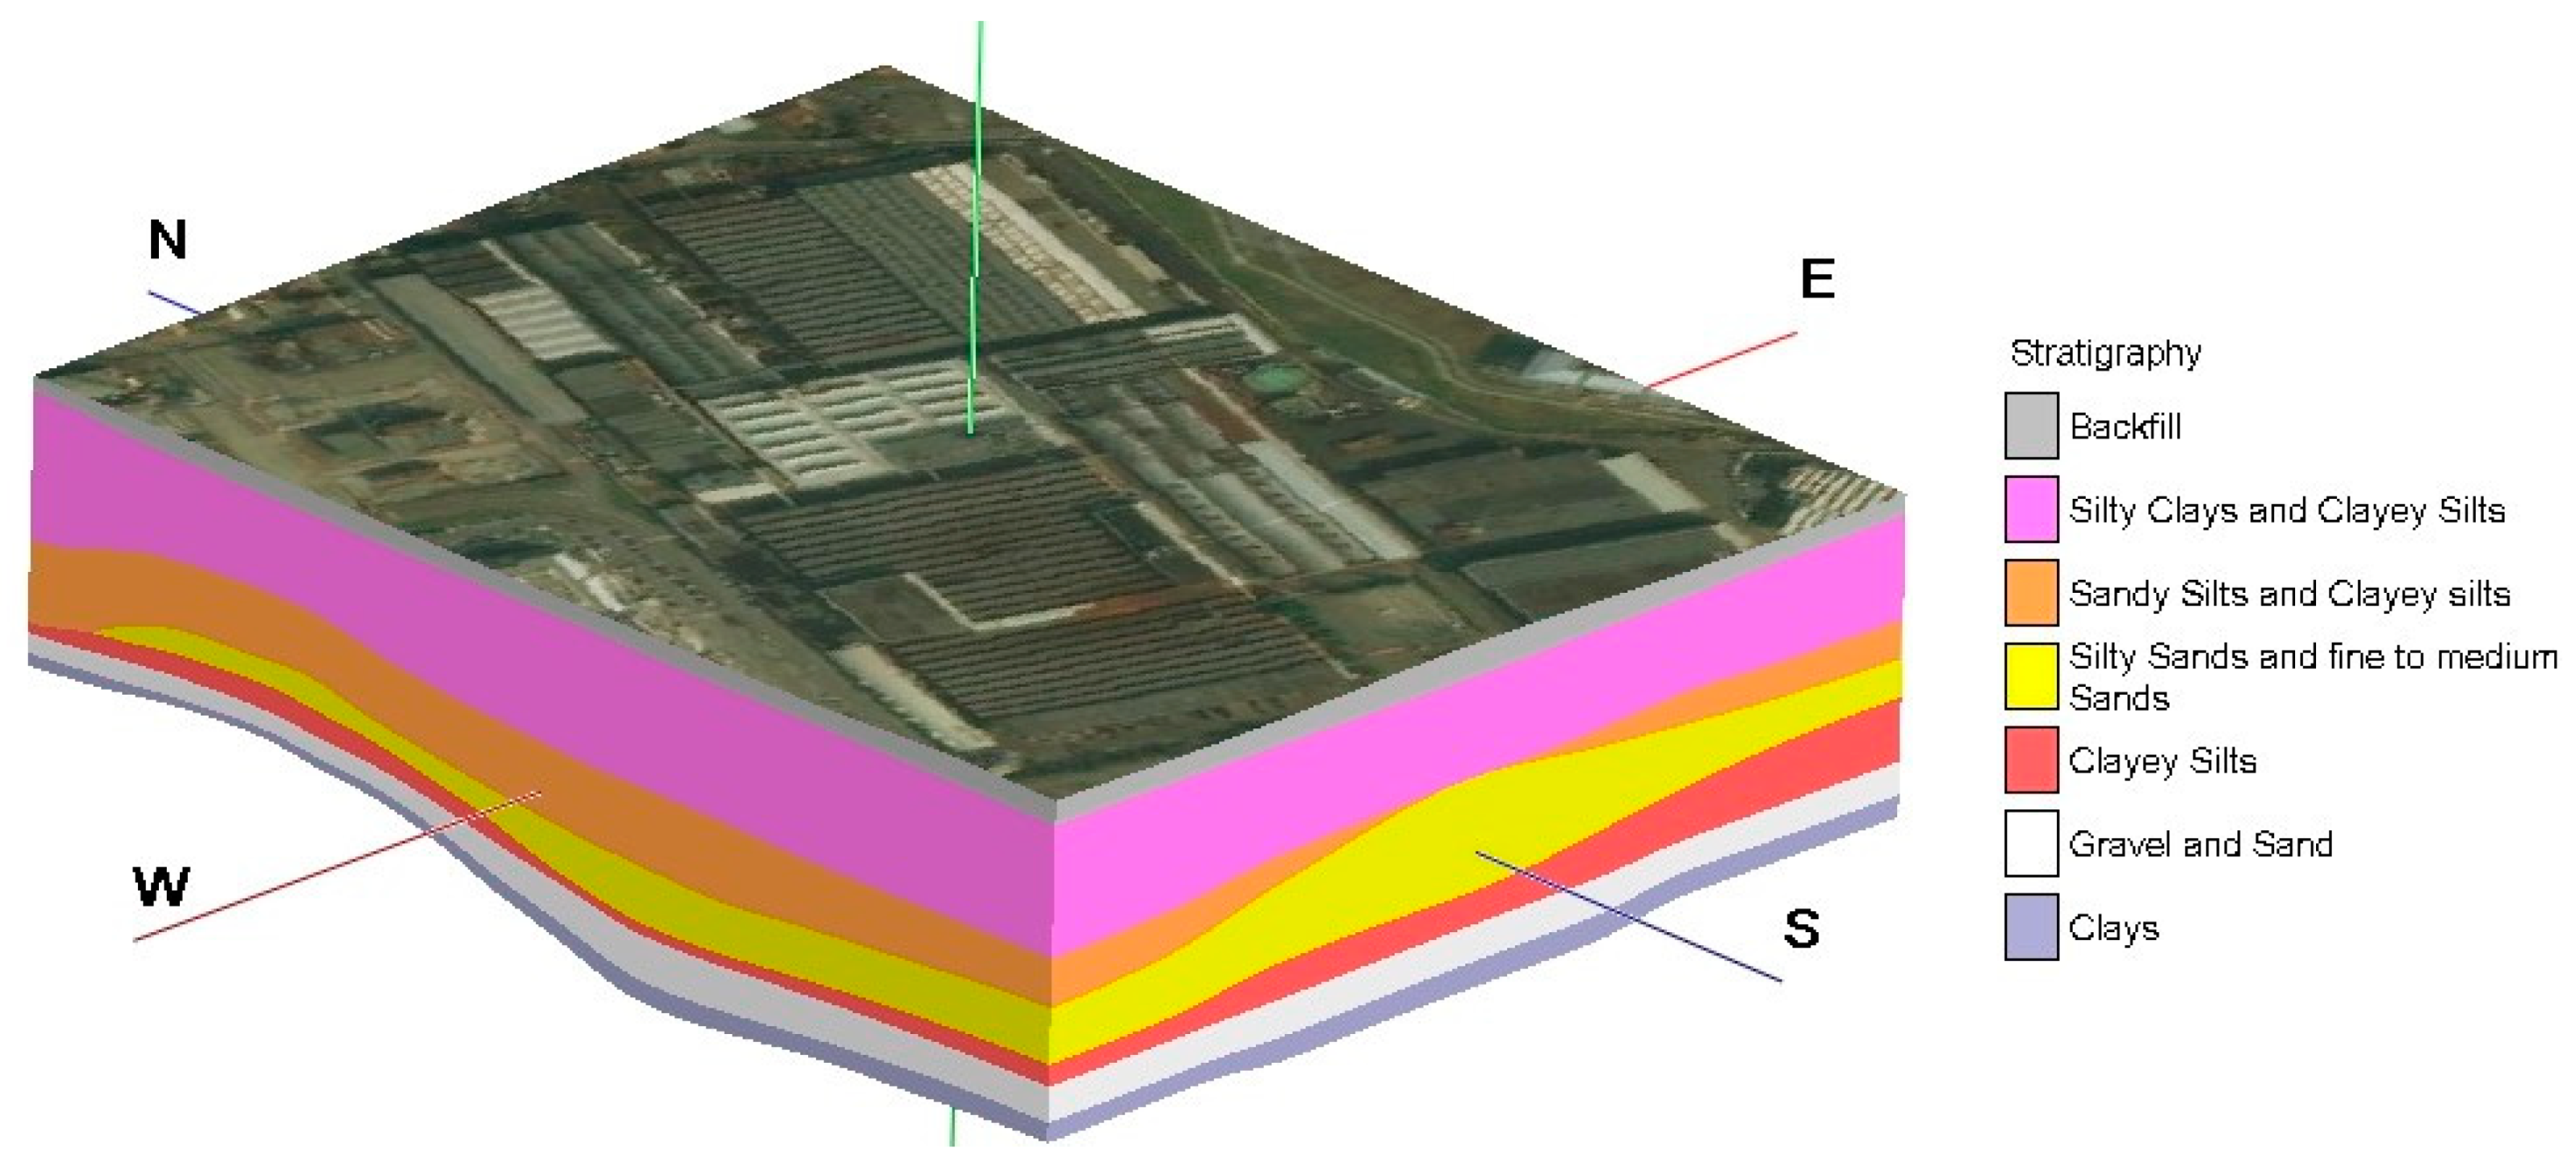
The industrial plant is located in the Po alluvial plain. The Po plain represents the syntectonic sedimentary infill of the Plio–Pleistocene in the Apennine foredeep [39]. The evolution of the Po basin is characterized by the transition from Pliocene open marine deposits to Quaternary marginal marine sediments, which are followed by alluvial deposits [40]. The Quaternary alluvial sequence shows a periodic alternation of coarse-grained (gravel and sand) and fine-grained (silt and clay) deposits; their repeated alternation represents the main feature of the depositional system [41]. In the study area, this setting is clearly recognizable—predominantly gravelly-sandy levels, (characterized by an extremely variable thickness), are separated by silty-clay deposits. The stratigraphic data highlight a very complex geological and hydrogeological situation, which is featured by a marked variability of the subsoil composition, as the different layers are arranged with lenticular geometries. These lithological variations are reflected in the modes of groundwater circulation, resulting in groundwater being divided into aquifer levels with different permeabilities that variously communicate with each other. For this work, the already available stratigraphic data were re-interpreted and homogenized for a hydrogeological perspective, i.e., the various stratigraphic levels were merged or differentiated according to grain size, and therefore, for permeability [42]. The geological structure of the subsoil of the area in question was subdivided with reference to the elaborate underground water circulation scheme. It is possible to recognize several levels in stratigraphic succession from top to bottom as follows:
- Backfill, up to 5 m in depth;
- Silty clays and clayey silts (and sometimes weakly-structured sand) with an average thickness of 8.5 m;
- Sandy silts and clayey silts arranged in a discontinuous level;
- Silty sands and fine-to-medium sands with hydraulic conductivity values between 10−5 and 10−8 m/sec, forming a shallow aquifer with variable thickness—sometimes in continuity with the underlying layer of gravels, and sometimes separated by a low lens permeability;
- A discontinuous level at an average depth of about 20 m, represented by fine-grained, low-permeable silts and clayey silts soils, that acts—where present—as an aquitard;
- A layer of gravels and sands characterized by permeability values in the order of 10−4 m/s and lateral continuity, forming a deep aquifer with a thickness of about 4 m over the entire area;
- A clayey-silty horizon at a depth of about 25 m below the ground level, characterized by lateral continuity and by permeability values in the order of 10−11 m/s, that acts as a basal aquiclude.
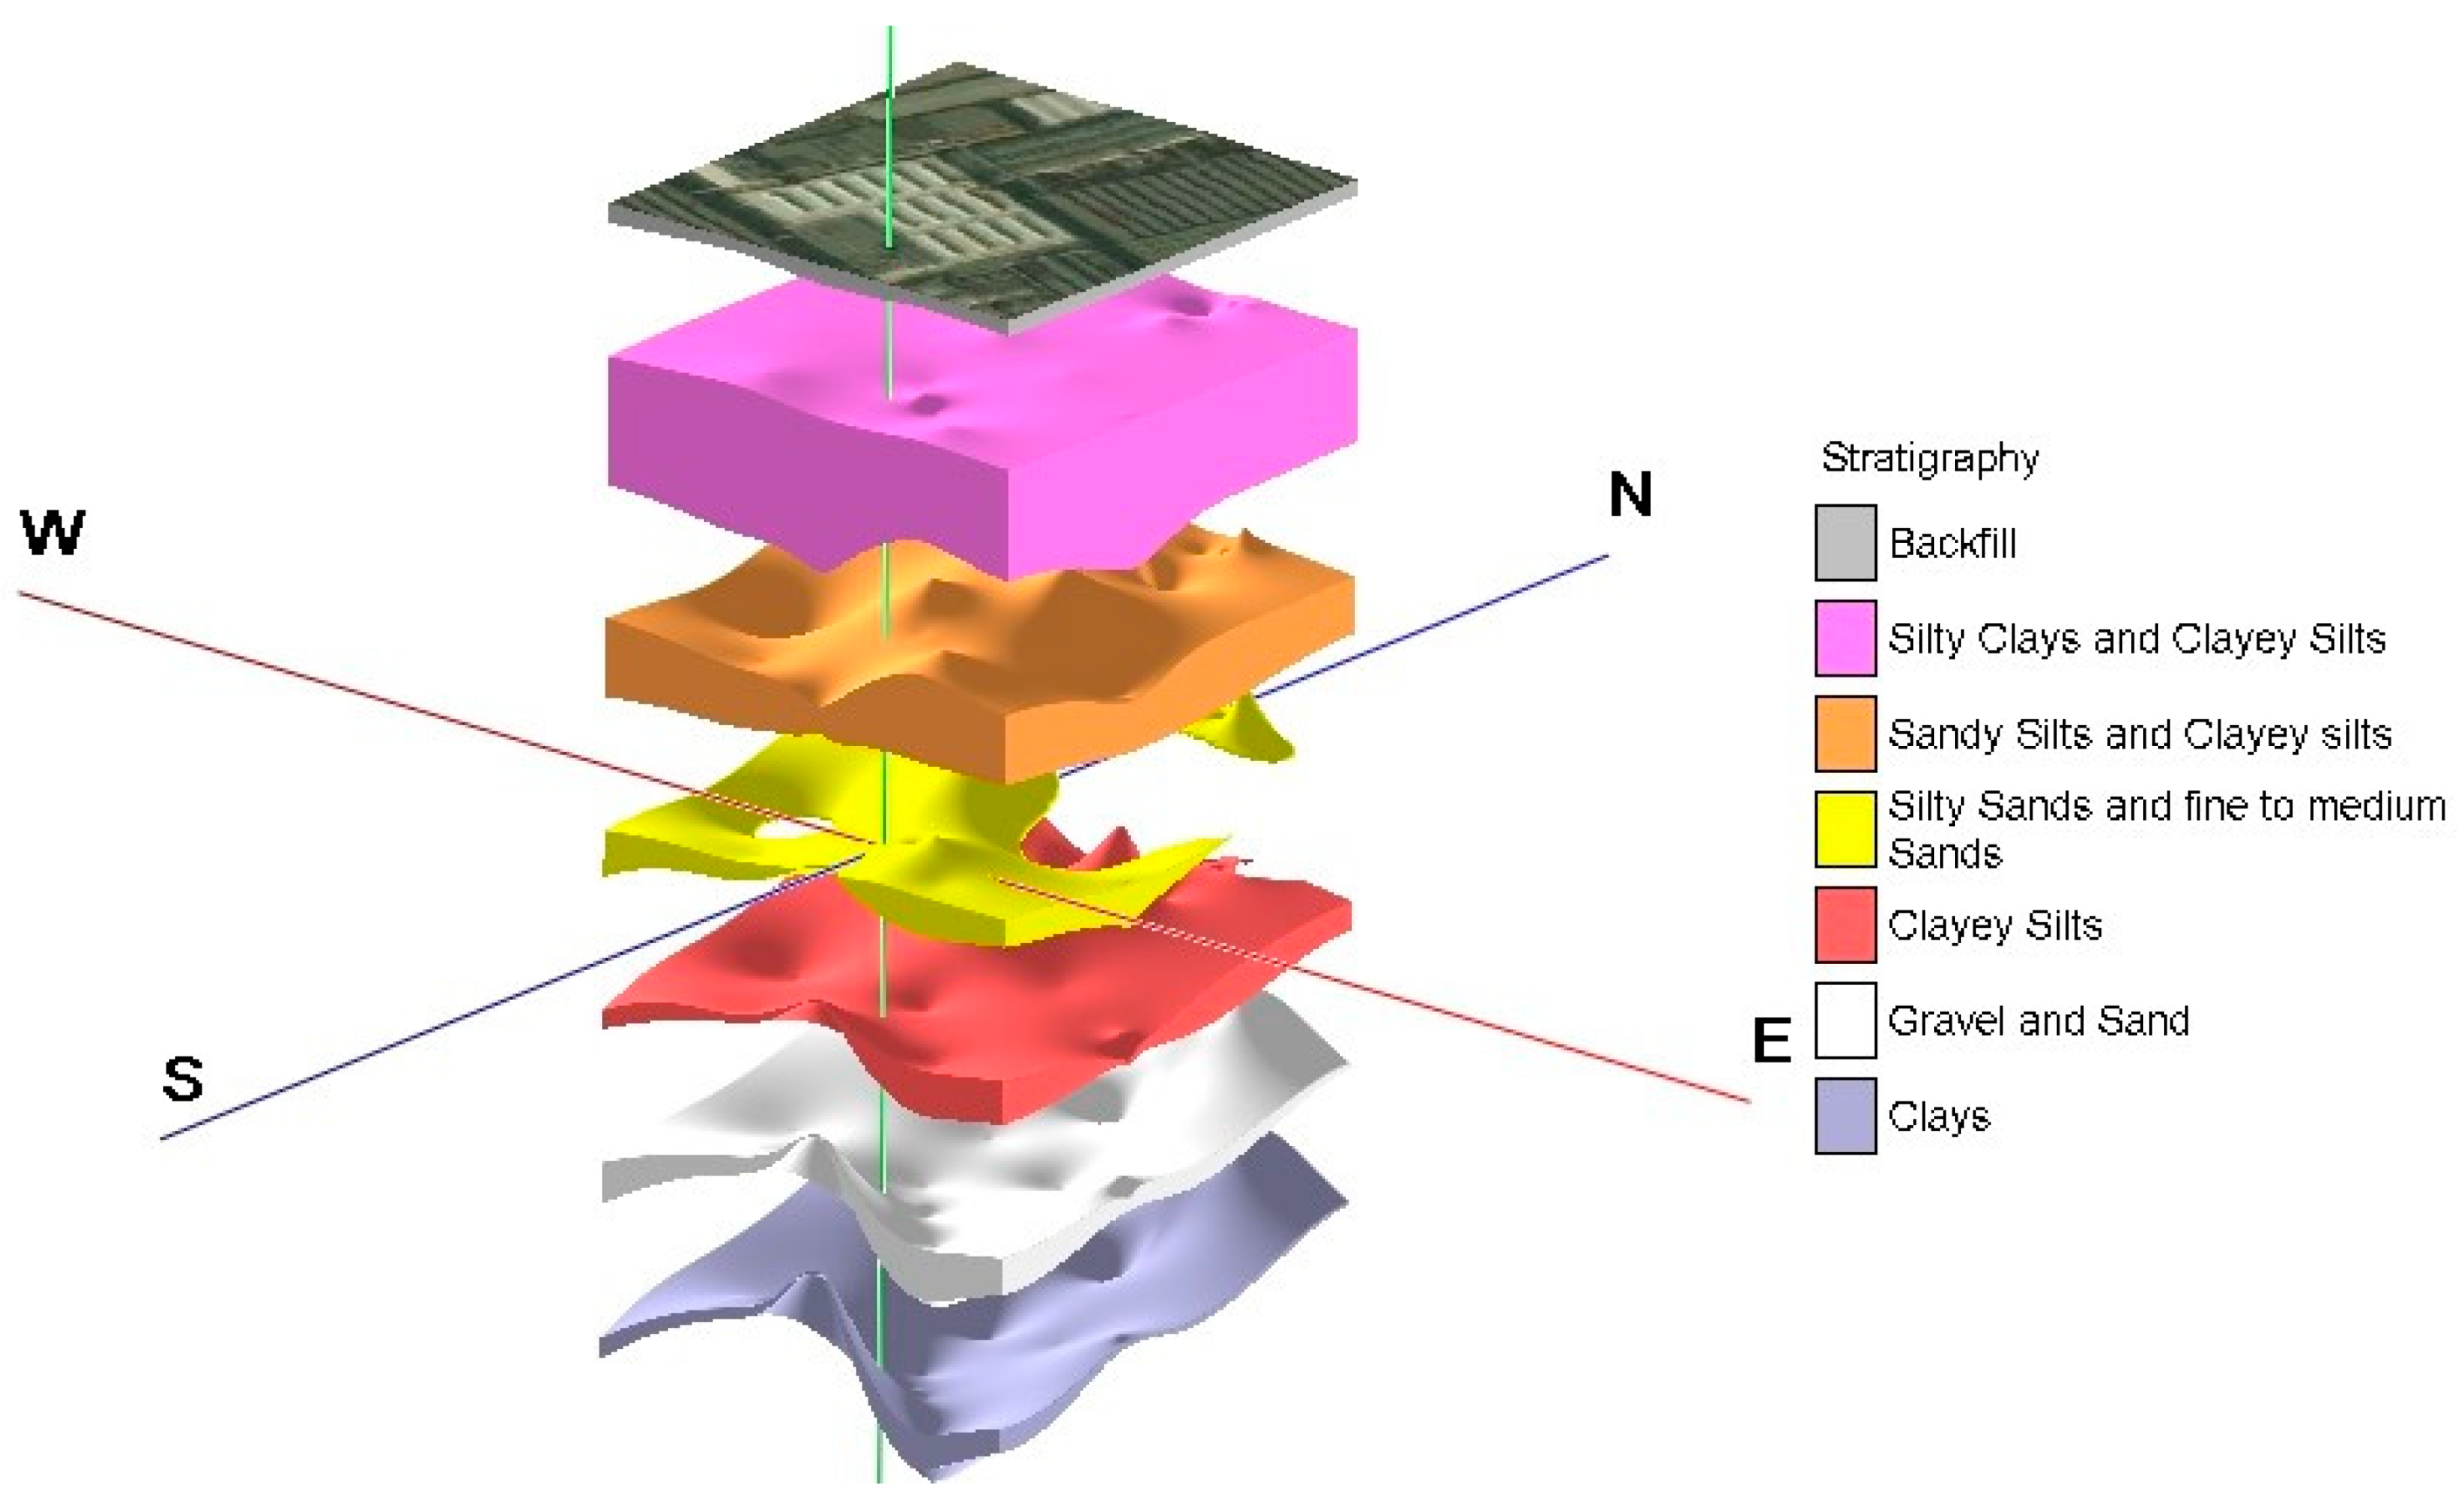
The overall structure of the subsoil is typical of alluvial plains close to the foothill sectors, where the stream energy assumes variations in a way to allow the sedimentation of both fine-grained (lower energy phases) and coarse-grained (higher energy pulses) deposits [41]. The irregularity of the stratigraphic contacts and the lenticular structures that characterize the different horizons are evident in the three-dimensional lithostratigraphic model (Figure 1)—a vertical exaggeration factor was used to mark the lithological steps (that is, illustration not to scale).
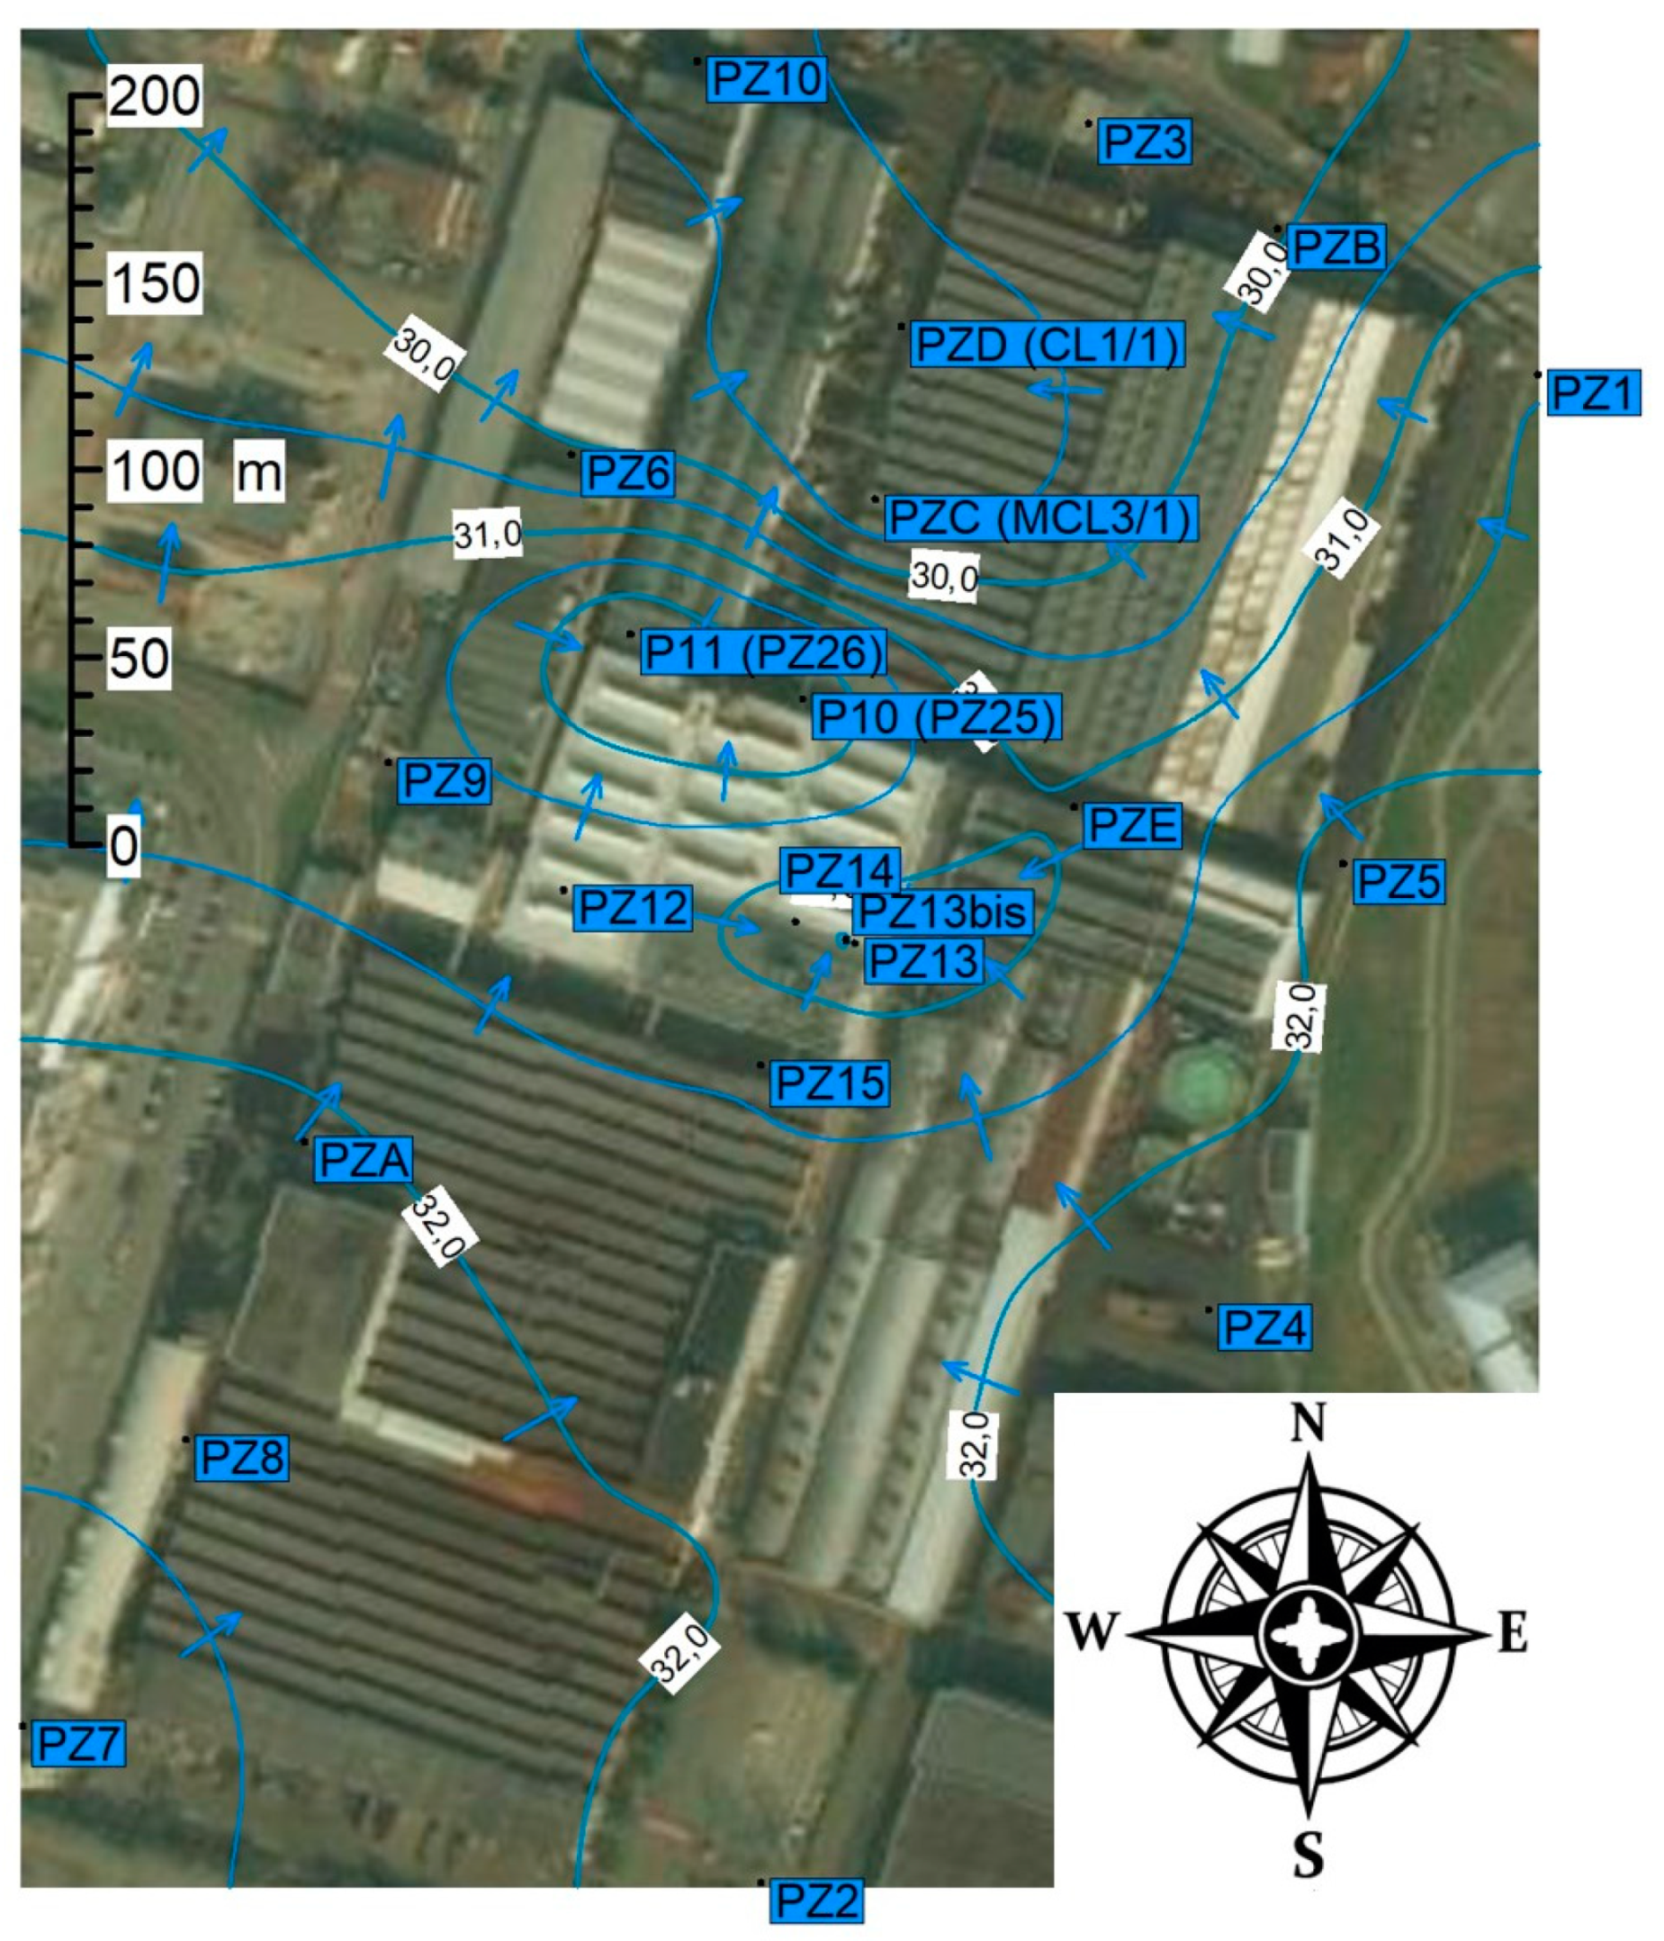
The basal aquifer (deep aquifer) hosted in the gravel and sand layer at a depth of 22 m is the only one with spatial continuity. The water circulation in the shallow aquifer is fragmented in several layers due to the alternation of sandy/sandy-gravelly and clayey-silty horizons. For this reason, the piezometric surface shows local anomalies and relevant differences of piezometric levels referred to piezometers placed at a short distance. Another disturbance factor, which could explain the uneven variations in piezometric levels, is represented by the existence of active wells inside the plant, which—beyond locally induced depressions—may have put the two aquifer levels into communication with each other [43]. In general terms, the shallow aquifer, which has an average depth of 2 m below ground level, is confined due to the presence of the overlying fine layers. From the interpolation of the data coming from the piezometric surveys carried out in the historical monitoring wells, it was possible to produce an isopiezic map (Figure 2).
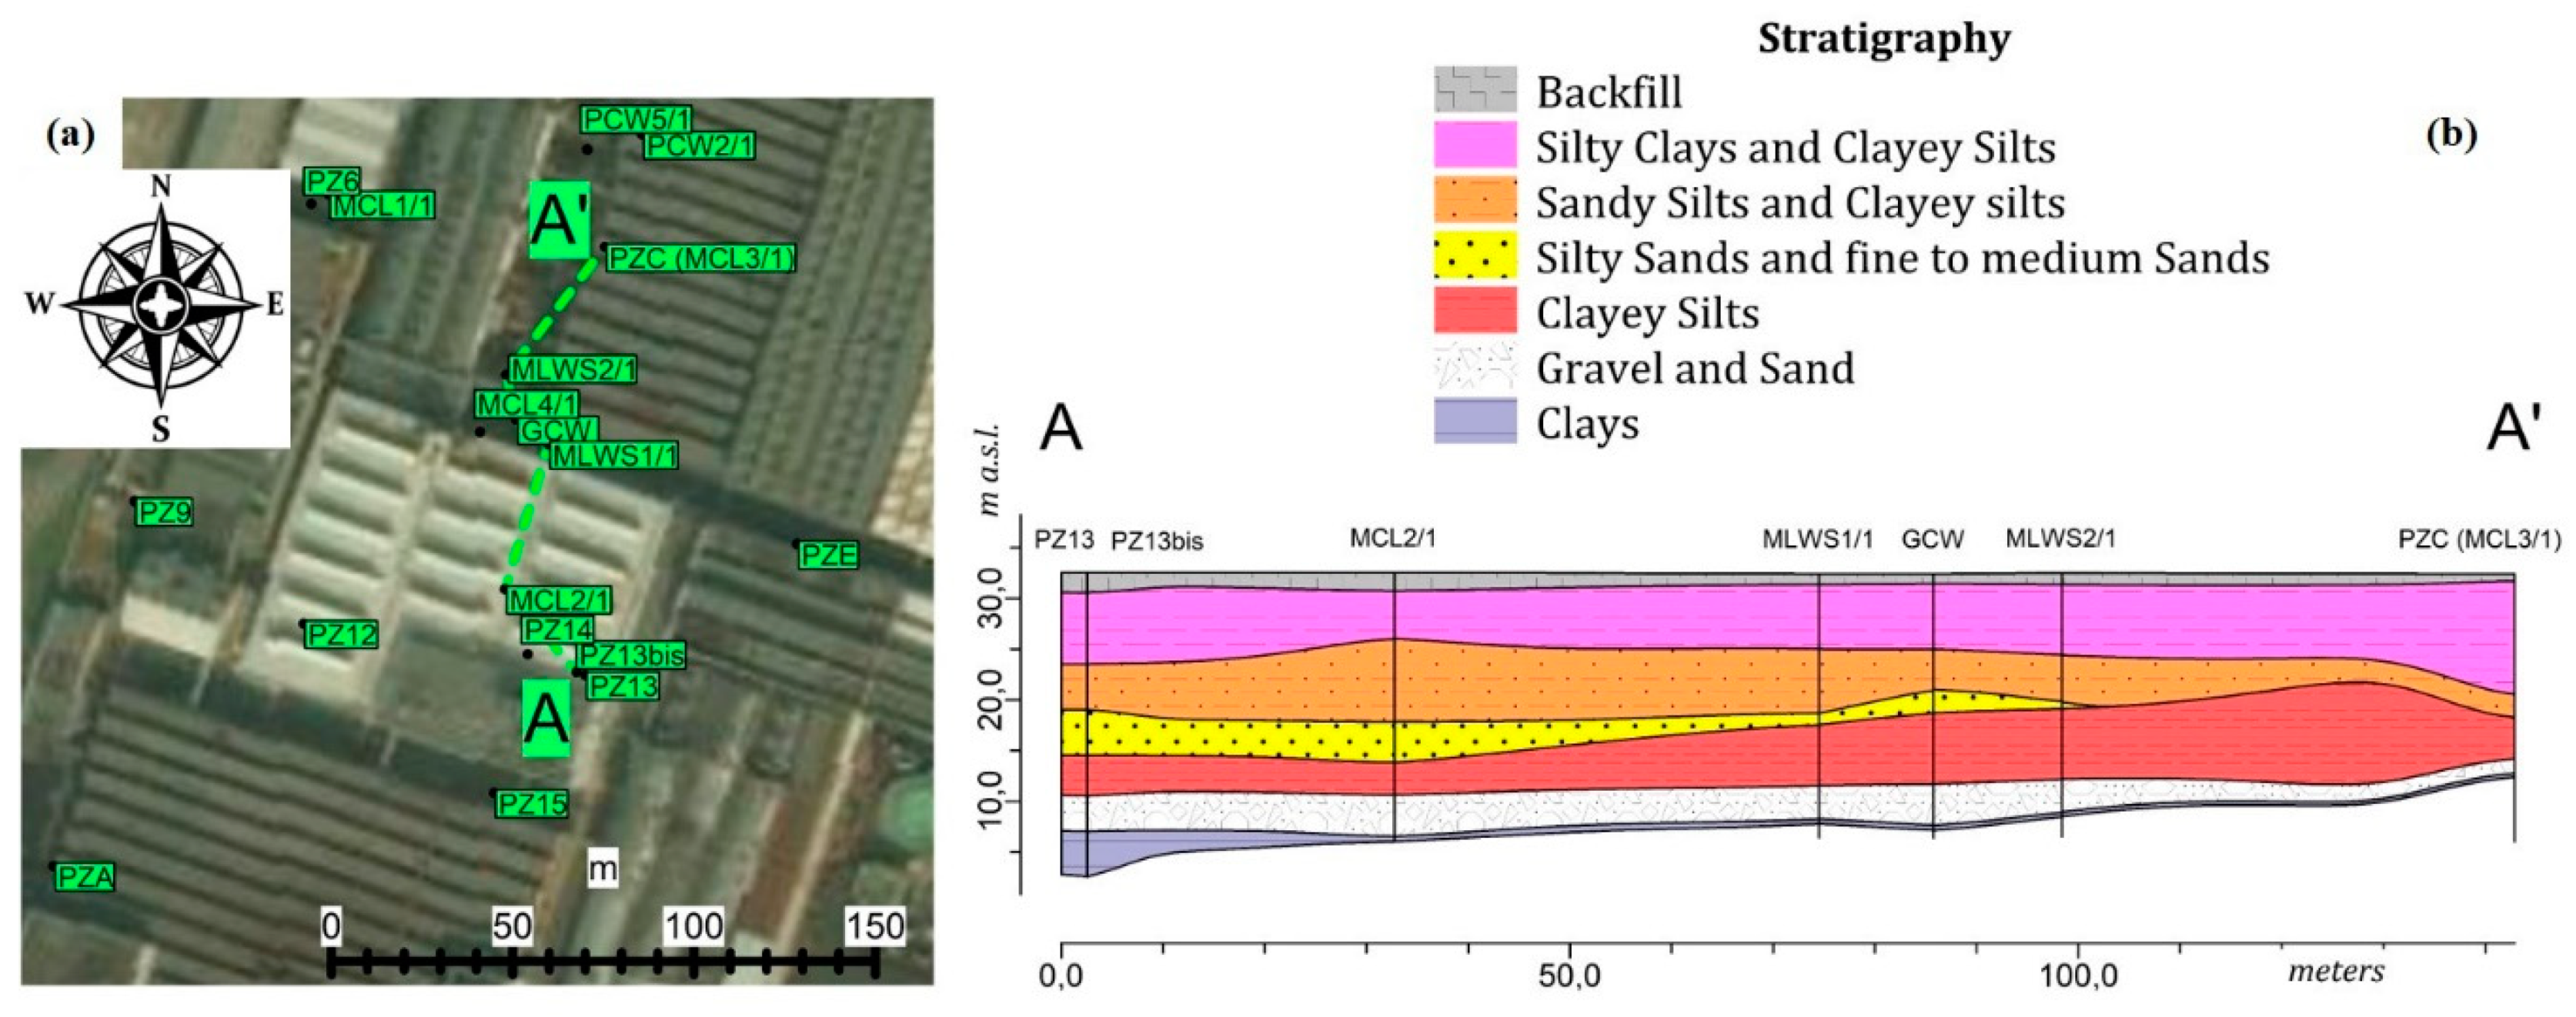
Groundwater showed a prevailing flow direction from S to N, locally disturbed by the presence of pumping wells. The hydraulic gradient is between 1.0% and 1.2%. The velocity of the water flow is approximately 10 m/year. To provide useful information for design purposes, in terms of the sizing and configuration of the remediation intervention [20], attention was focused on the subsoil in the pilot test area. The morphology of the aquifer limits is very articulated, in agreement with what is expected for this depositional environment (Figure 3 and Figure 4). The high-resolution geotechnical parameterization of the different lithostratigraphic horizons captures the geological heterogeneity, which exerts a decisive action on the contaminant transport and adsorption processes [19,44].
3.2. Contamination Status Evolution
The analytical data, which refer to the monitoring campaigns carried out from 2008 to 2017, were used for the construction of some contour maps, which represent the concentrations of the contaminants detected in the historical piezometric network. The thematic maps were produced by considering some key contaminants (vinyl chloride (VC) and 1,2-dicloroethylene (1,2-DCE)), which are correlated with the state of contamination that was previously ascertained [12,15,45]. The concentration values were compared to the Italian threshold limits (CSC)—the limits between each class corresponded to multiples of the CSC value for each contaminant. Each subfigure shows the concentration value at three different time instants (Figure 5).
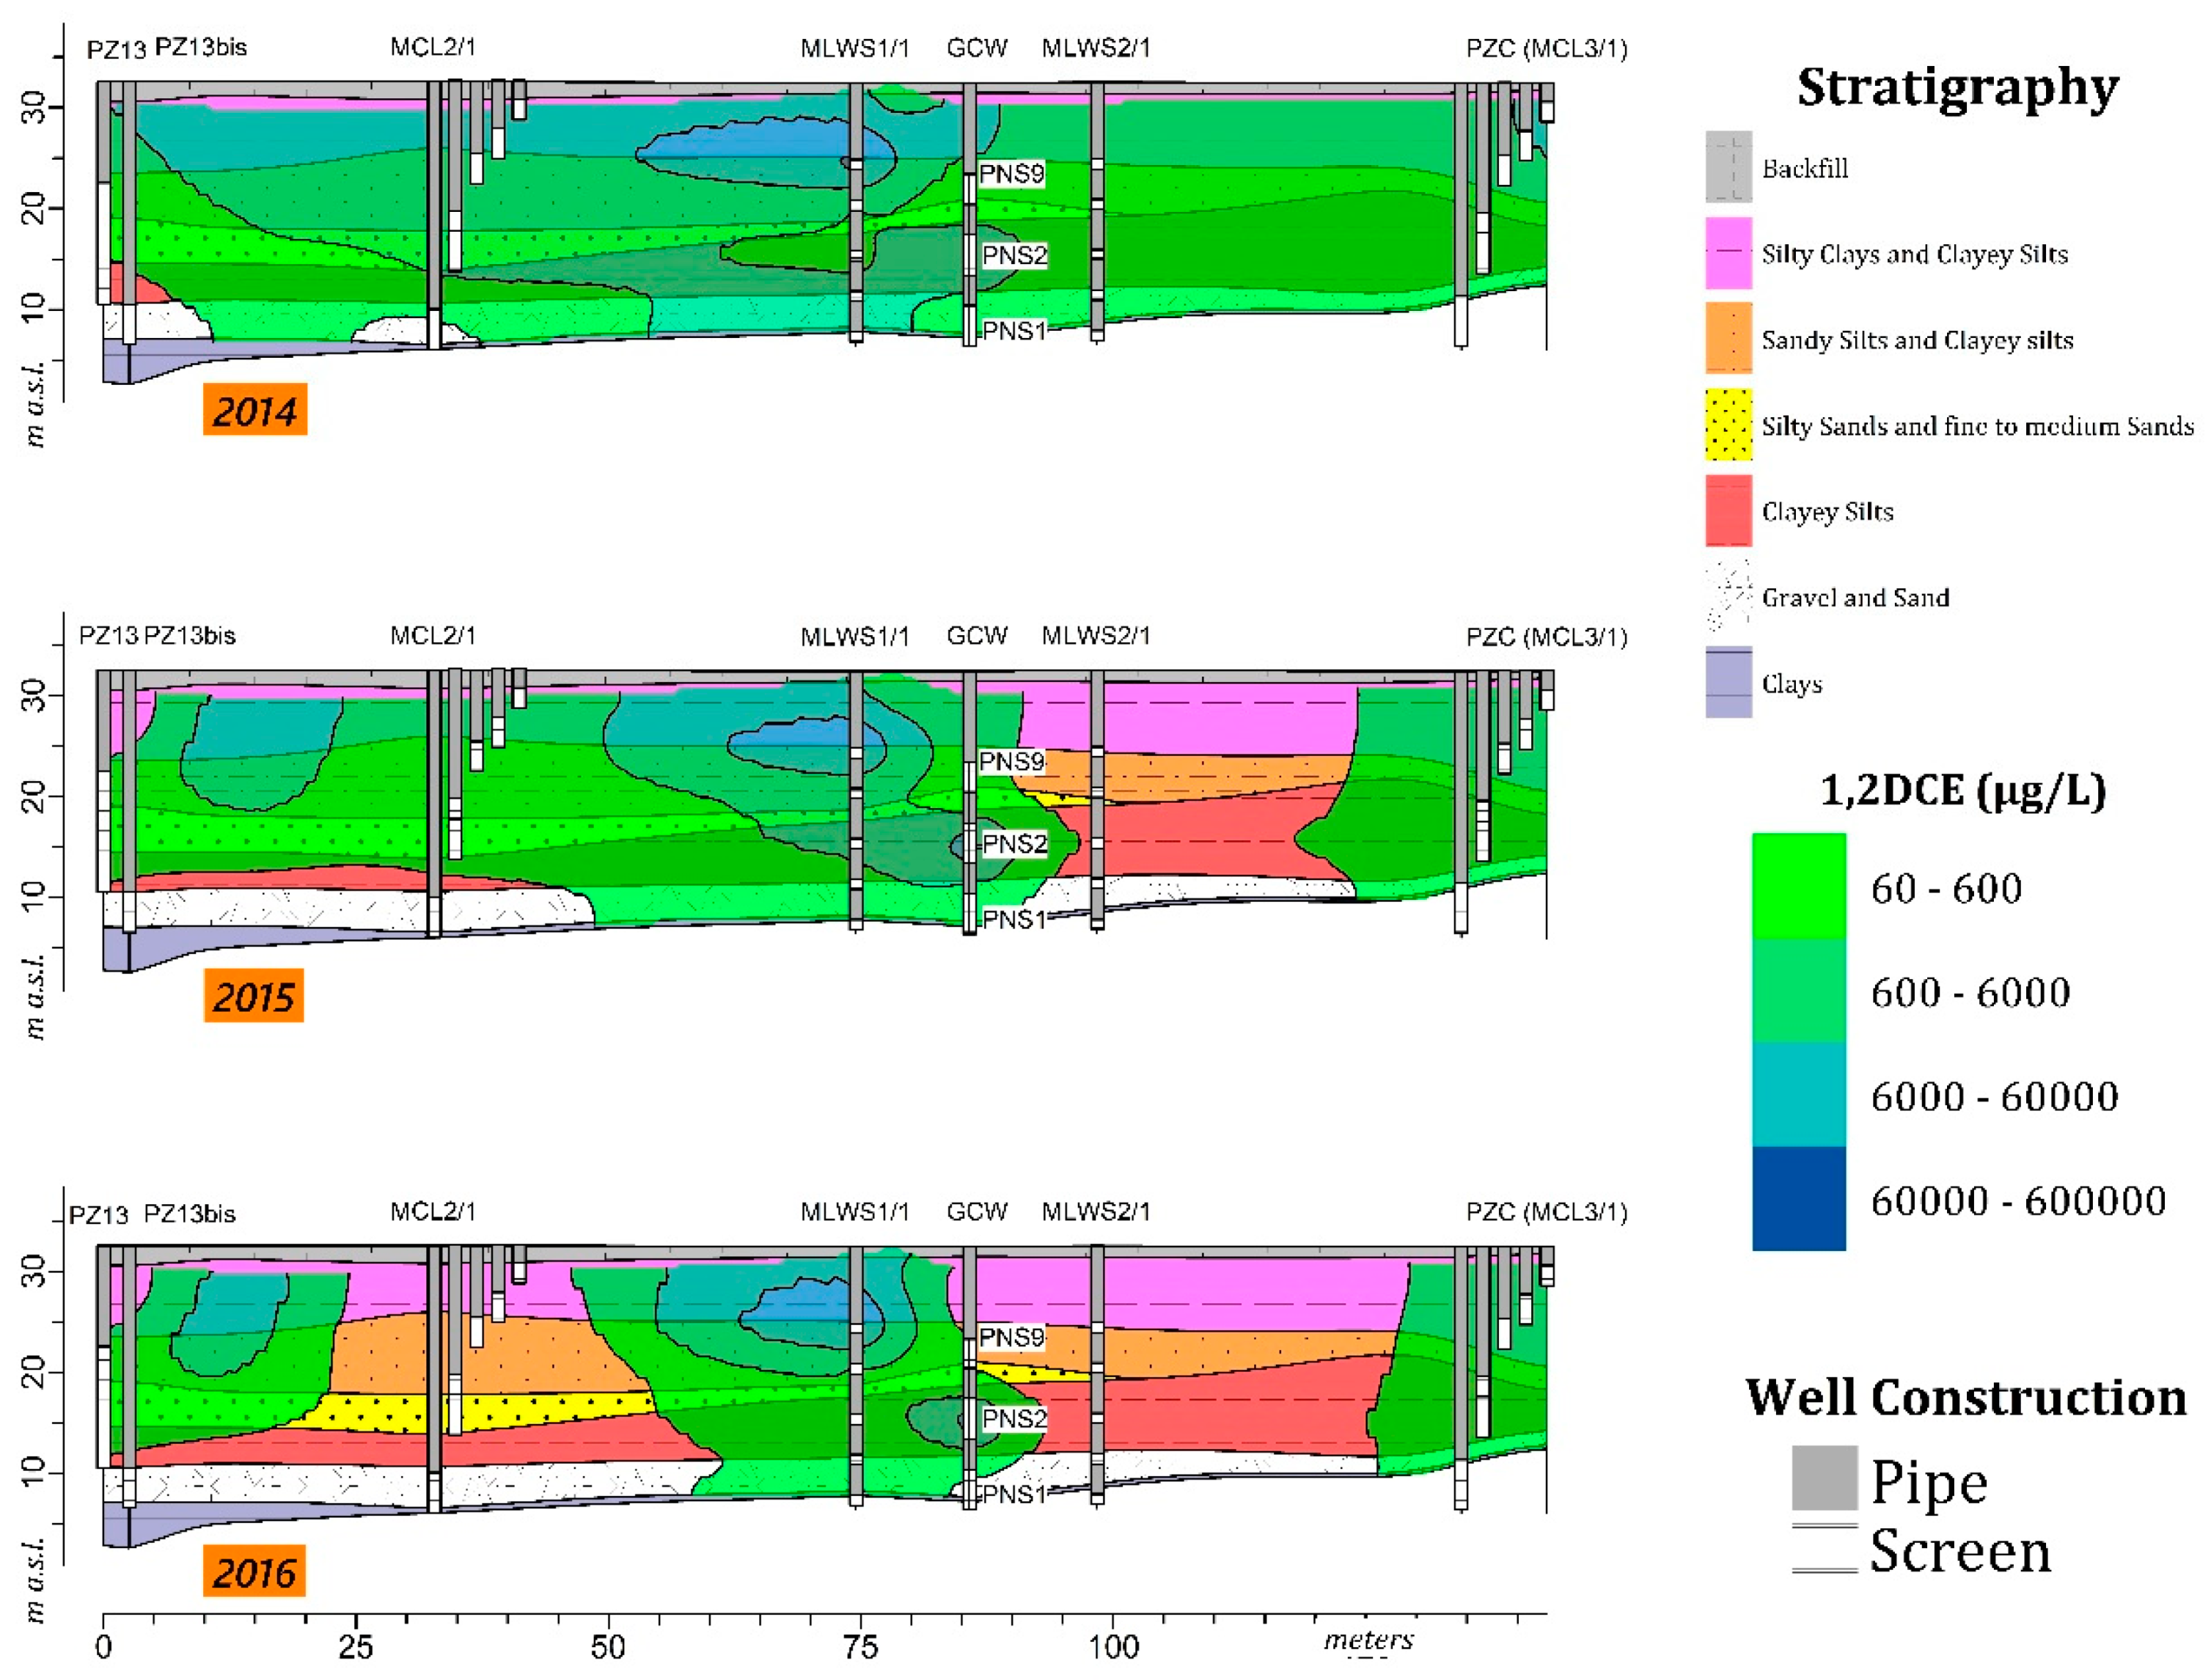
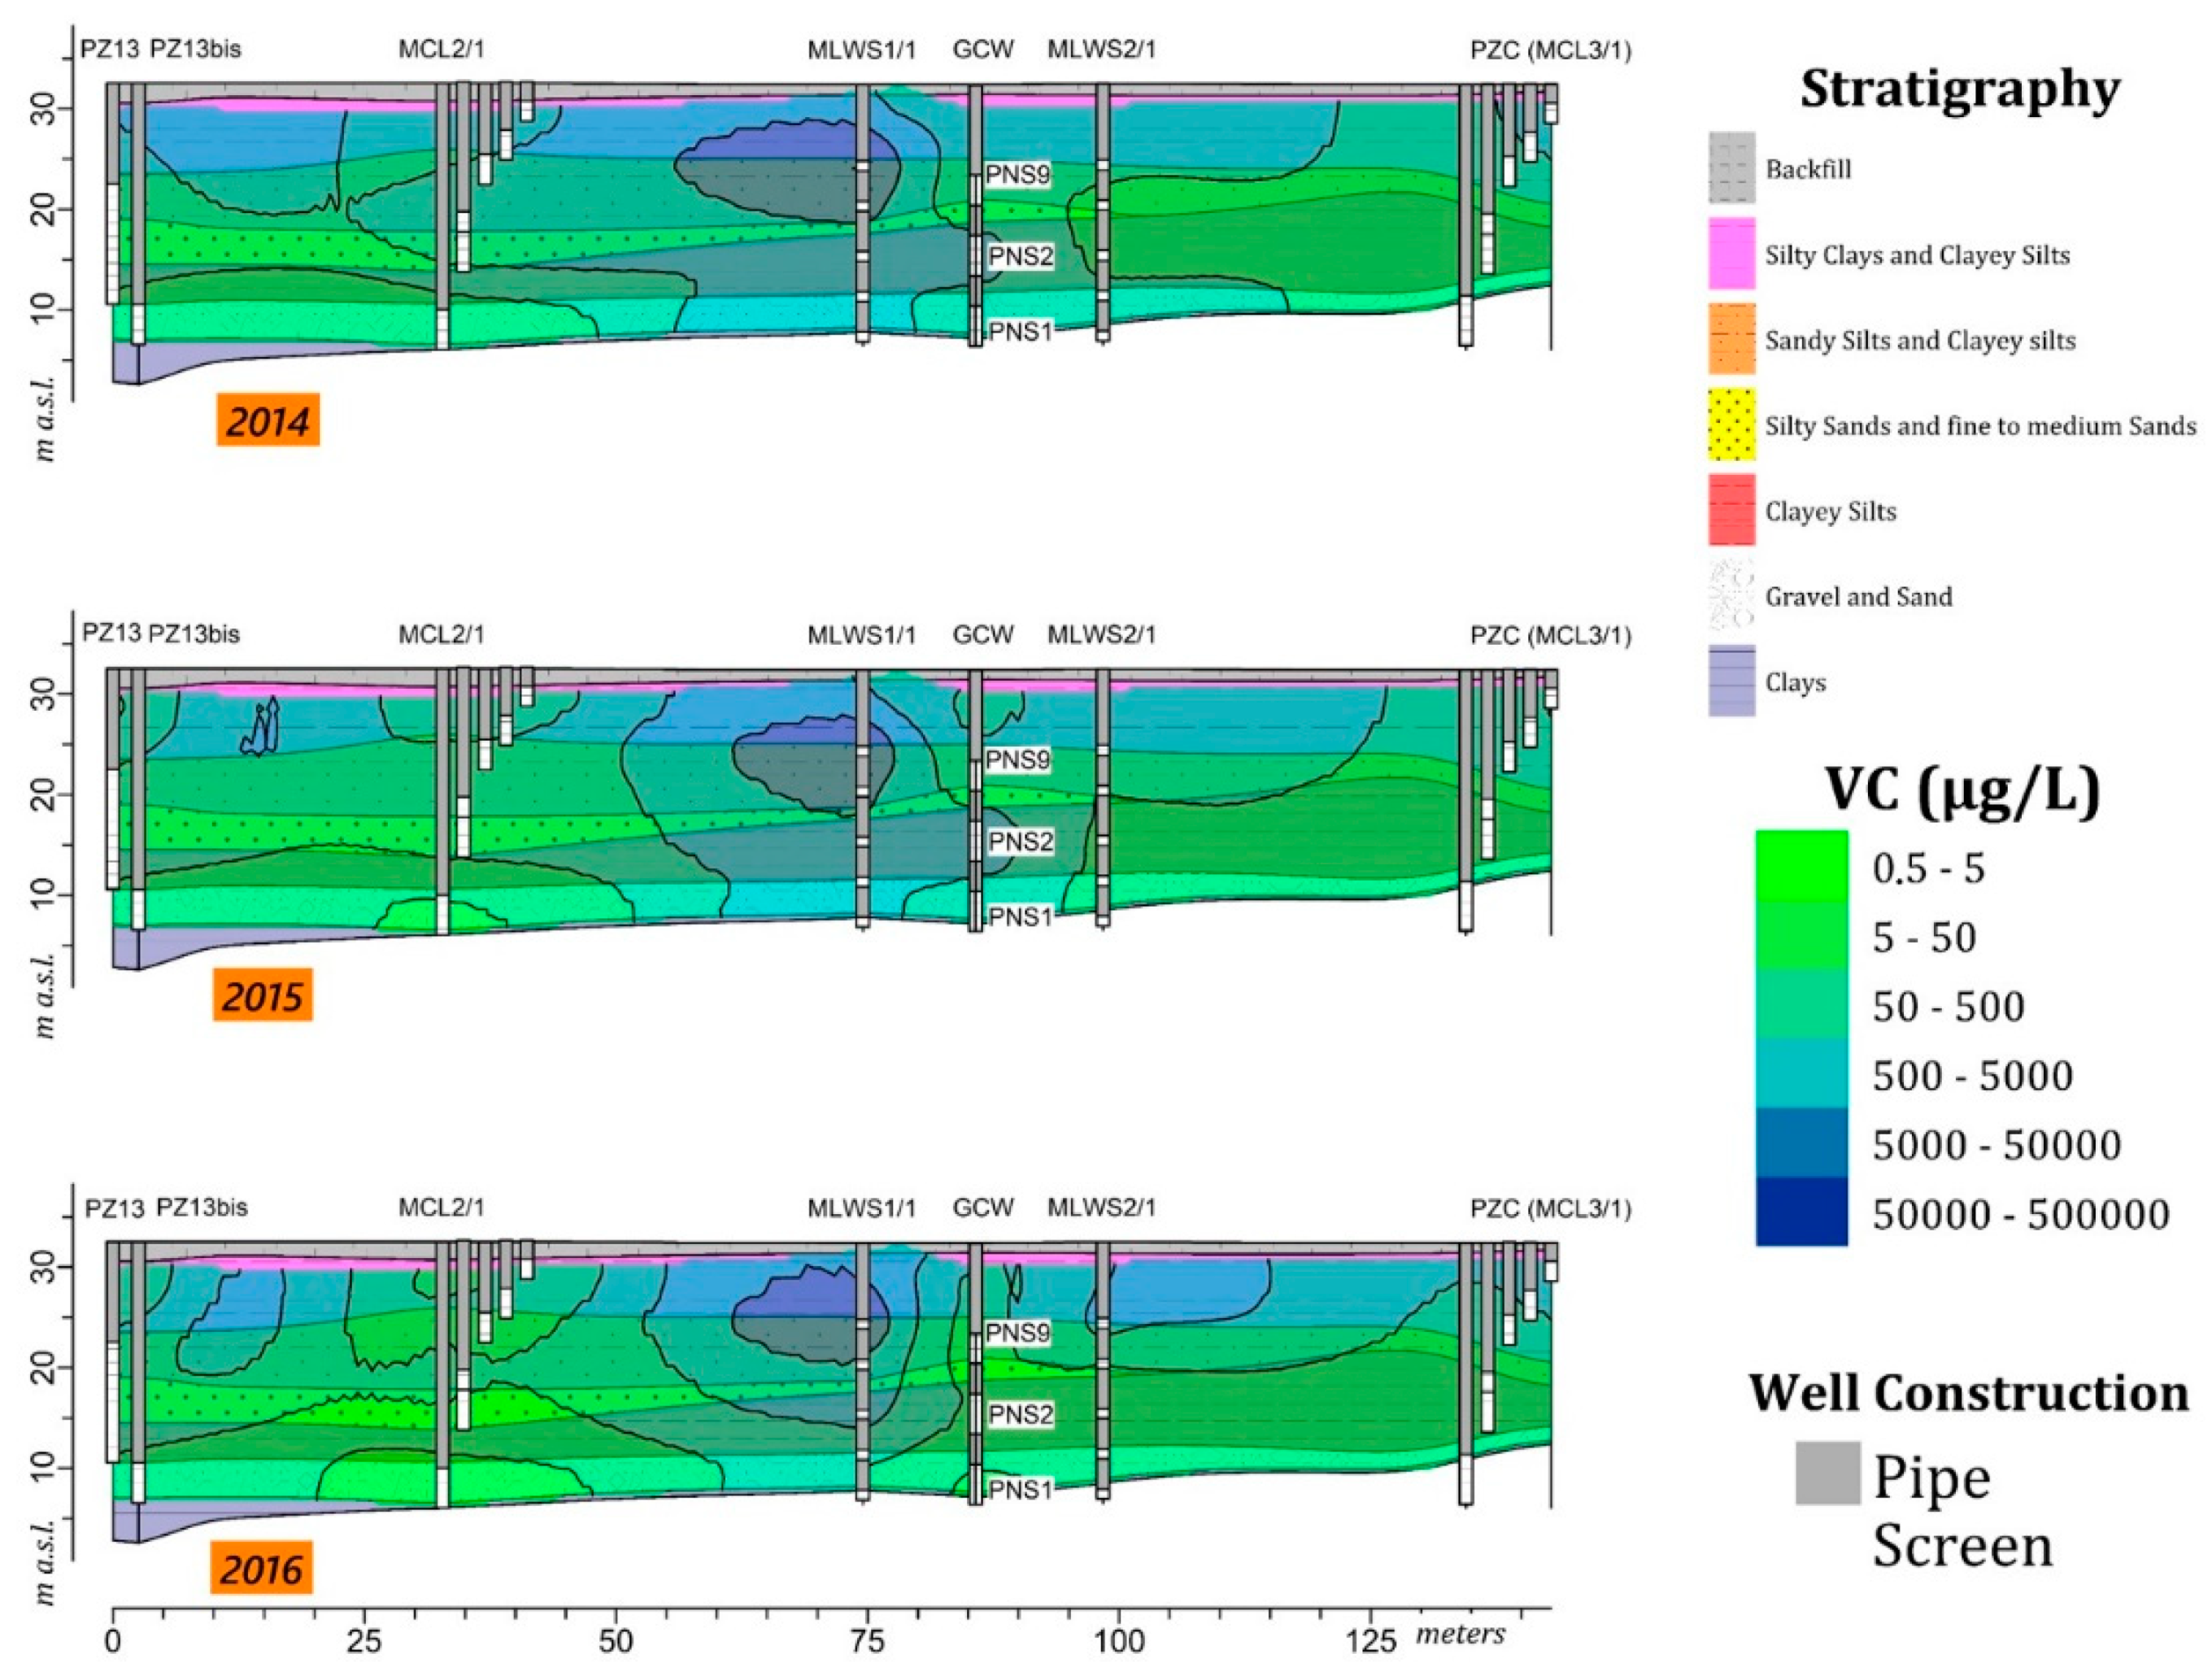
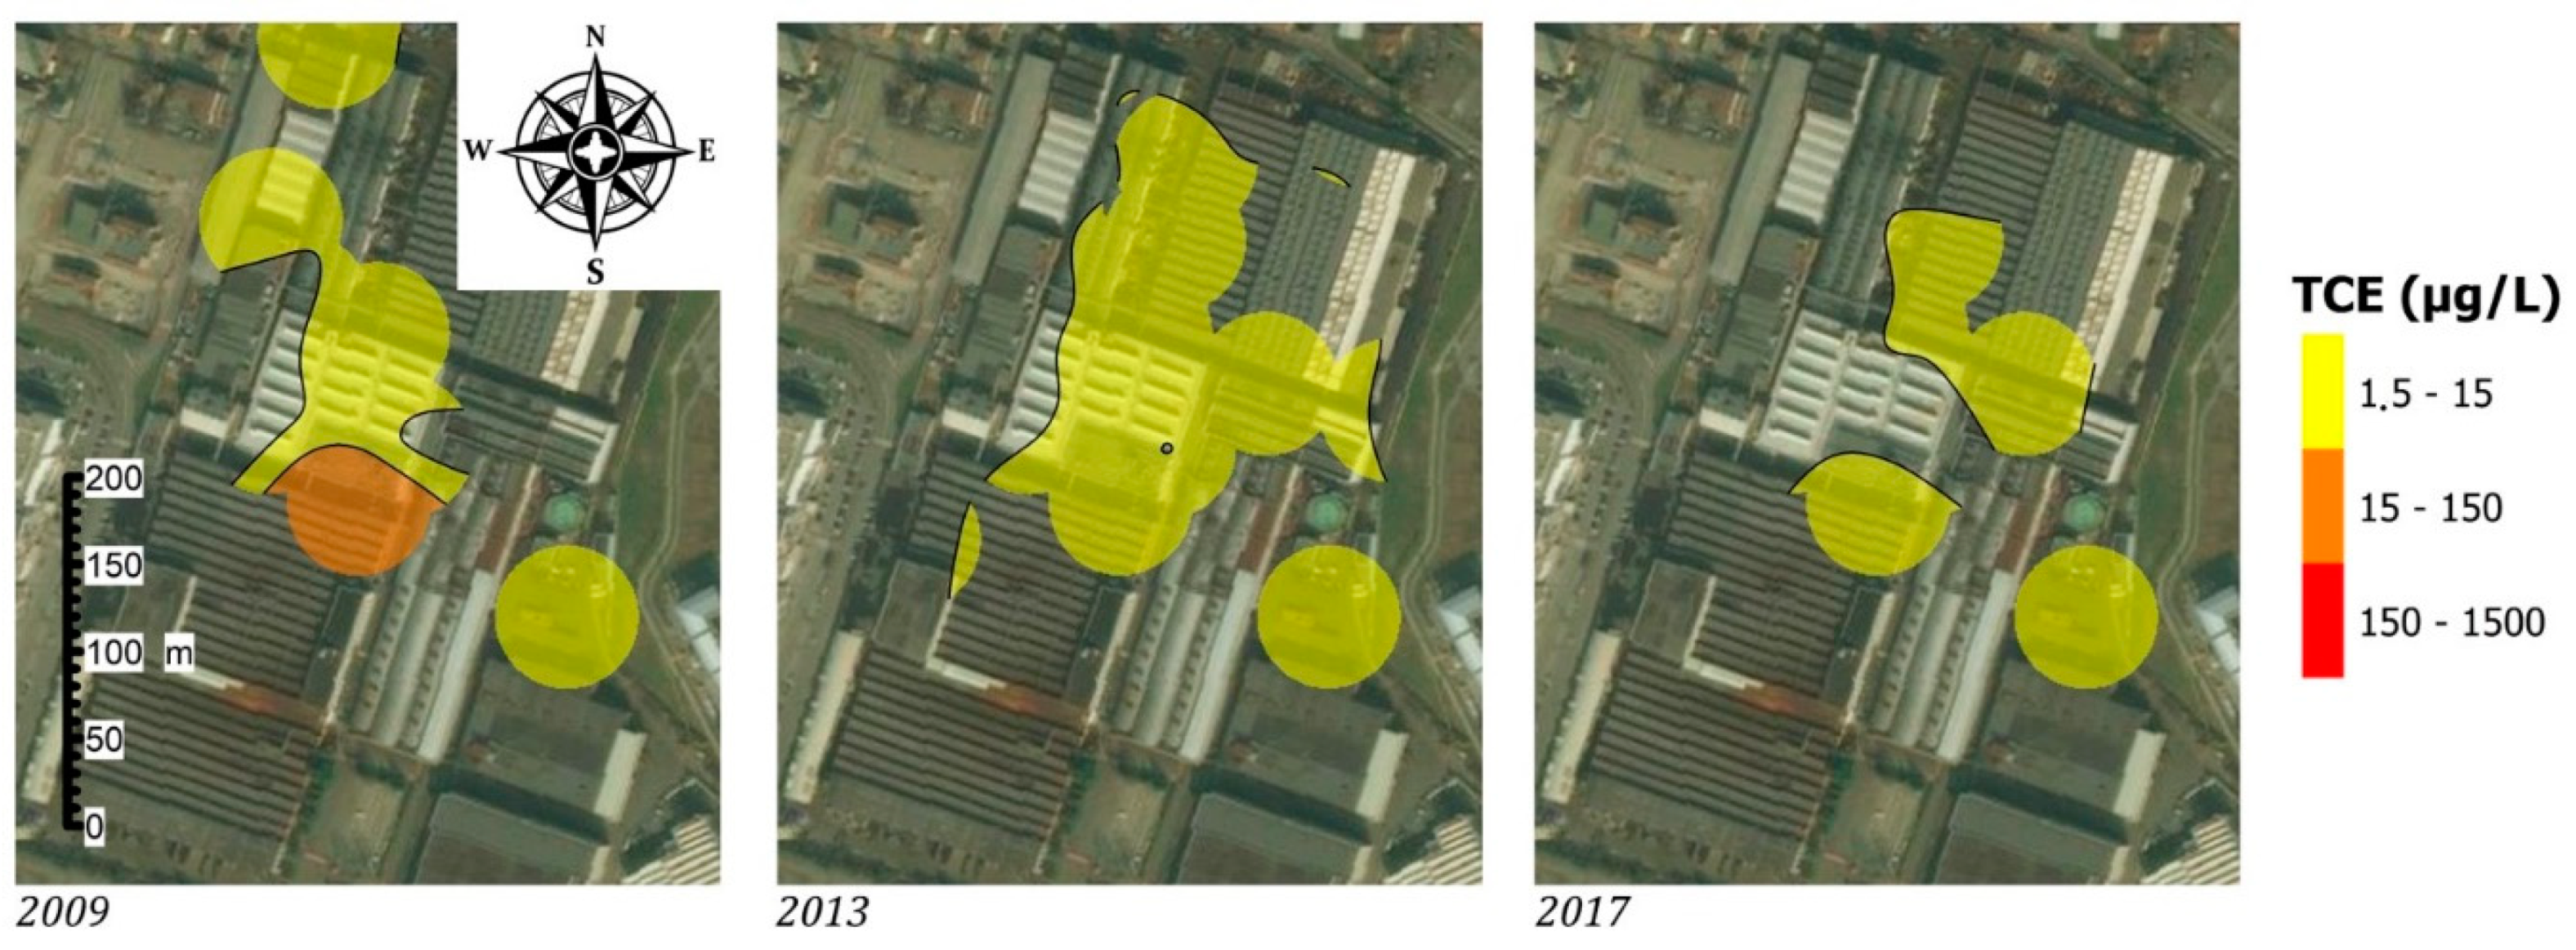
The reduction of 1,2-DCE and the increase of VC over time indicate that natural attenuation is underway at the site. The presence of compounds with a lower degree of chlorination indicates an intense but incomplete microbial dichlorination activity [11,12,14]. The areas most affected by these classes of contaminants are located at the central portion of the plant, at a building that in the past housed two washing machines for the degreasing of mechanical parts. Industrial washing machines, which used organochlorine solvents, potentially represent historical contamination sources. For the reasons set out above, the pilot test was carried out at the central sector of the industrial plant. The extraction of hydrogeochemical data from the geodatabase and their spatial overlap reveals valuable information on the contamination dynamics [19]. The high-resolution hydrogeochemical characterization identifies in detail the subsoil horizons affected by residual phase contamination [46]. The integration of the geological section and the hydrochemical profiles clearly shows that the highest concentrations of contaminants are detected in the low permeability layers (Figure 6 and Figure 7).
The high-resolution characterization, in geological and chemical terms, displays the association of a significant mass of contaminants with lenses of fine materials. These very low permeability layers, in the saturated zone, act as slow-release sources of contaminants [12,15]. 1,2-DCE and VC were the main pollutants of the groundwater. They were detected in concentrations up to 100 mg L−1, and indicate the presence of residual areas of DNAPL, acting as persistent secondary sources. The residual source releases contaminants into the most permeable areas through a slow back-diffusion mechanism [47]. Compounds with a higher chlorination degree were certainly used in the past as industrial solvents, and therefore constitute the primary contaminants [45]. They were detected at significantly lower concentrations, highlighting an intense biological dechlorizing [14] activity (Figure 8).
3.3. Remediation Strategy Design and Pilot Testing
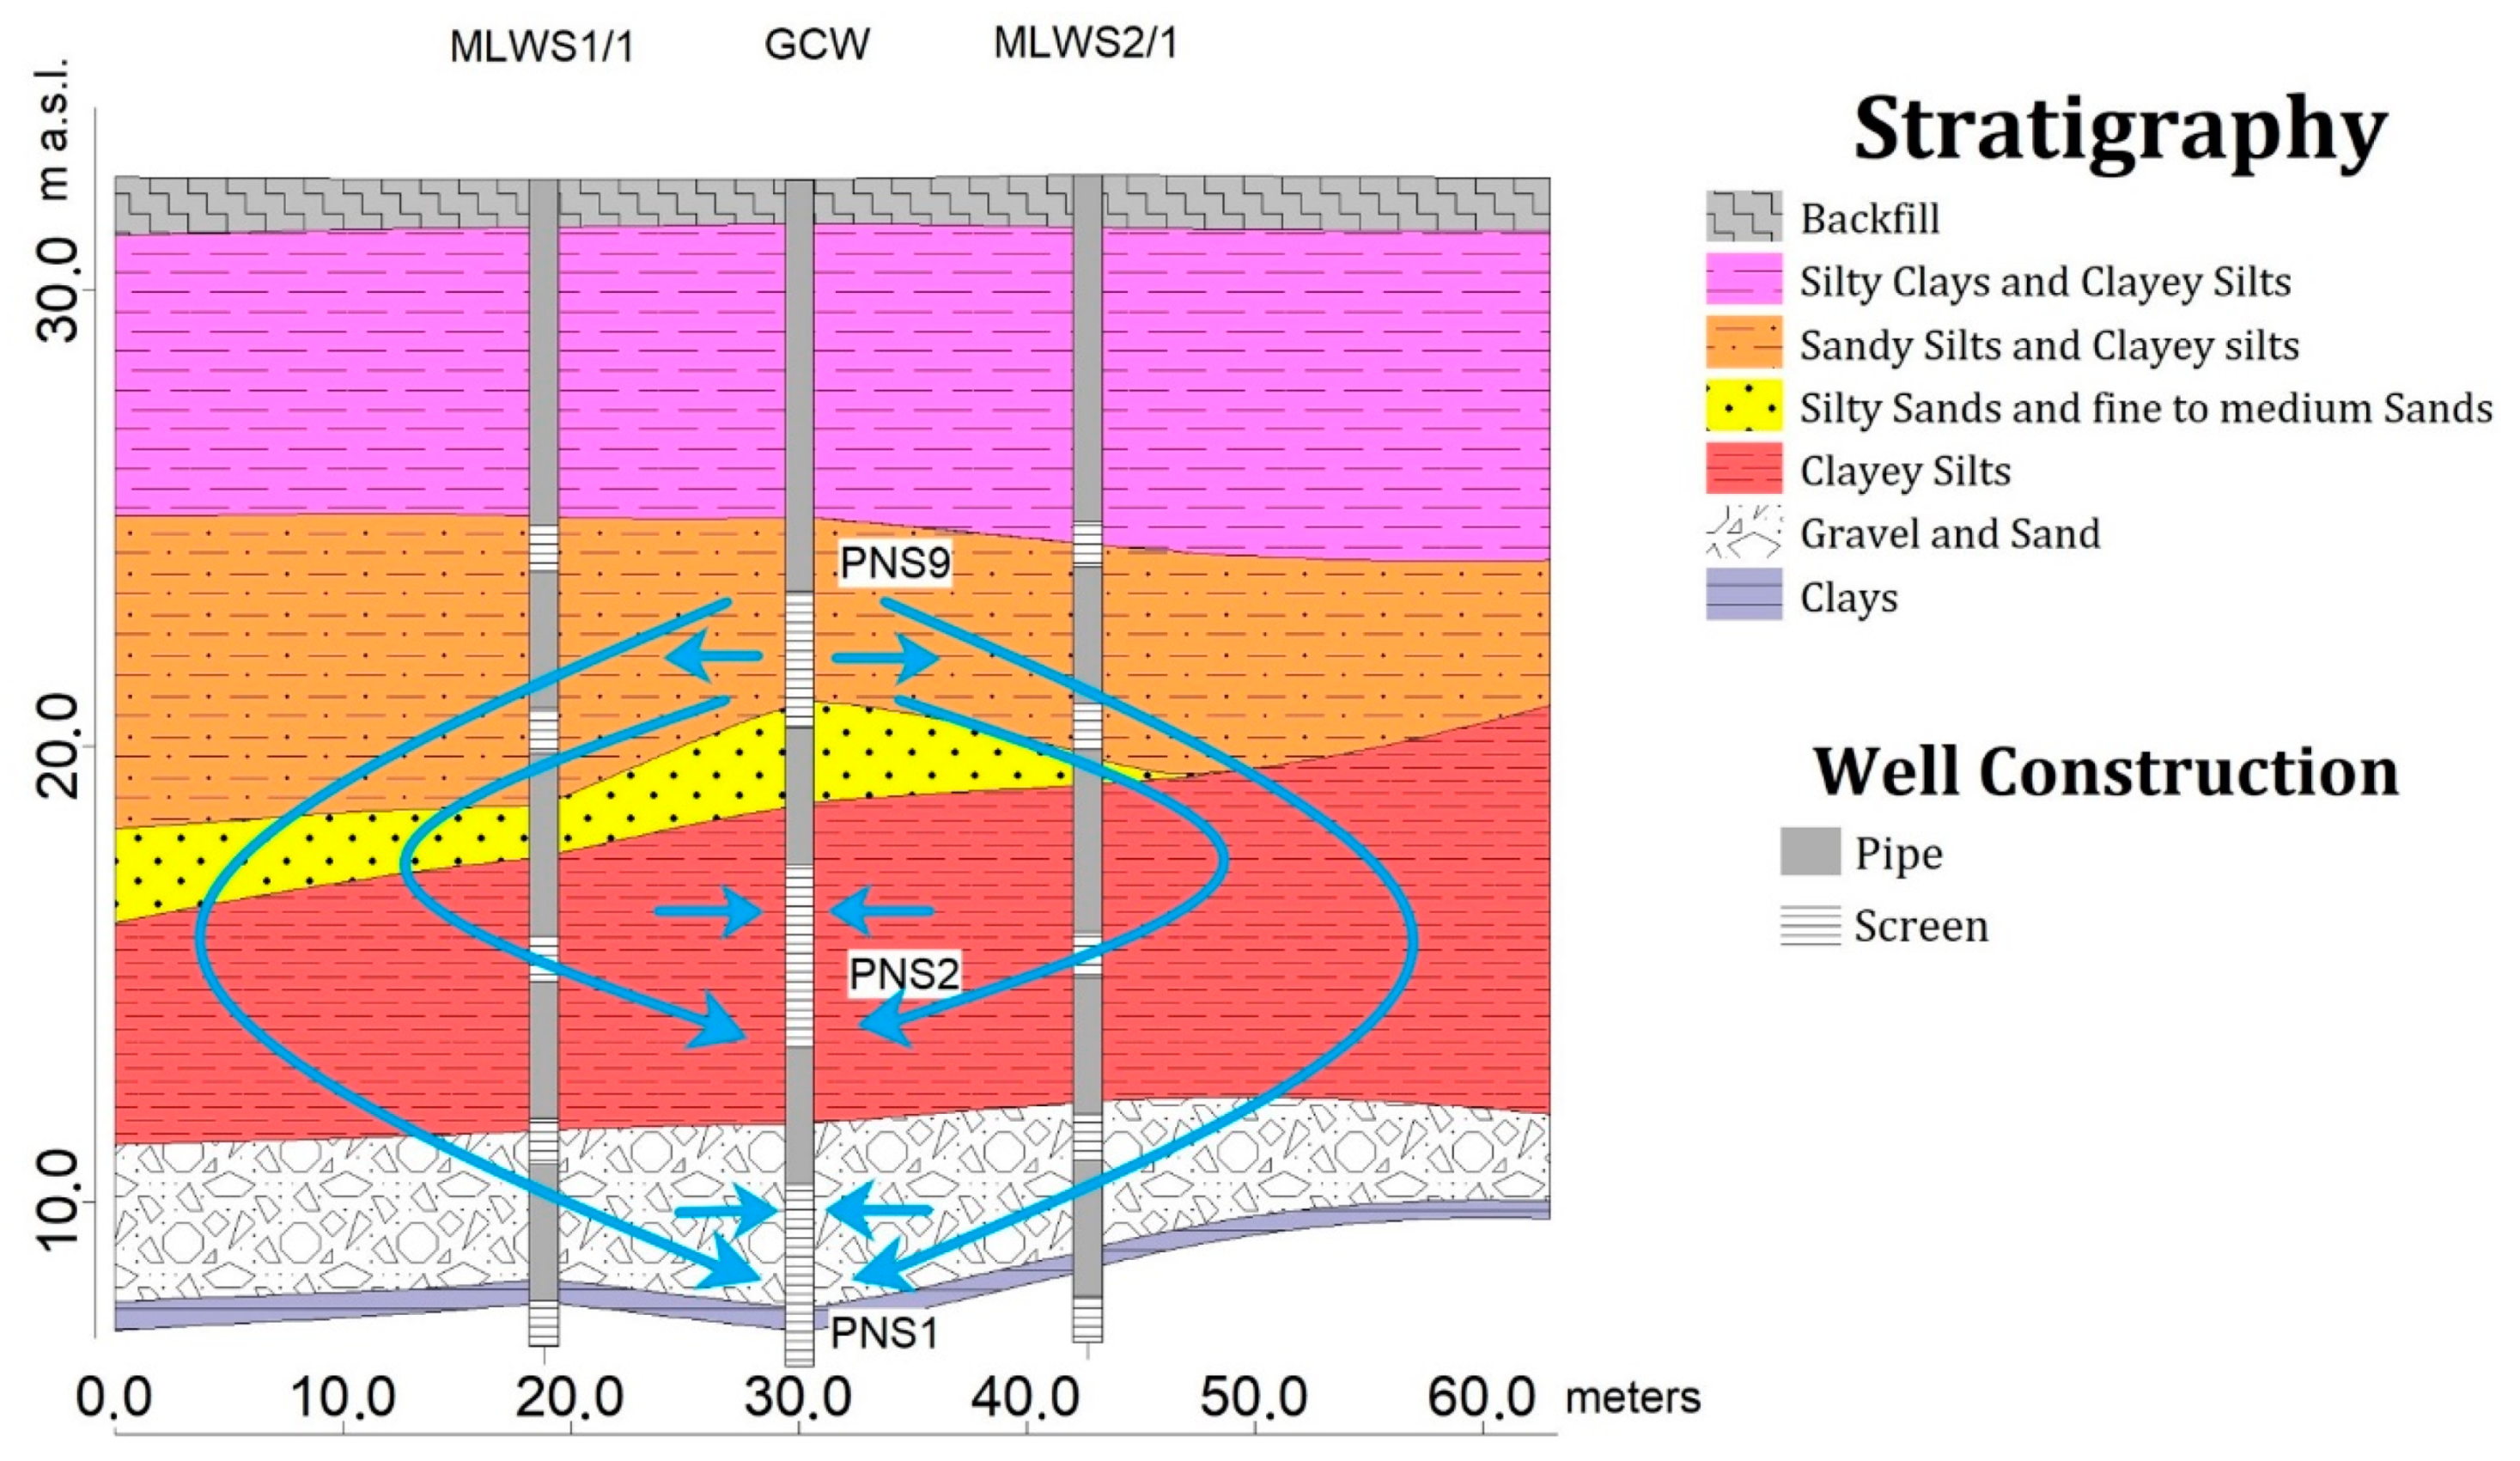
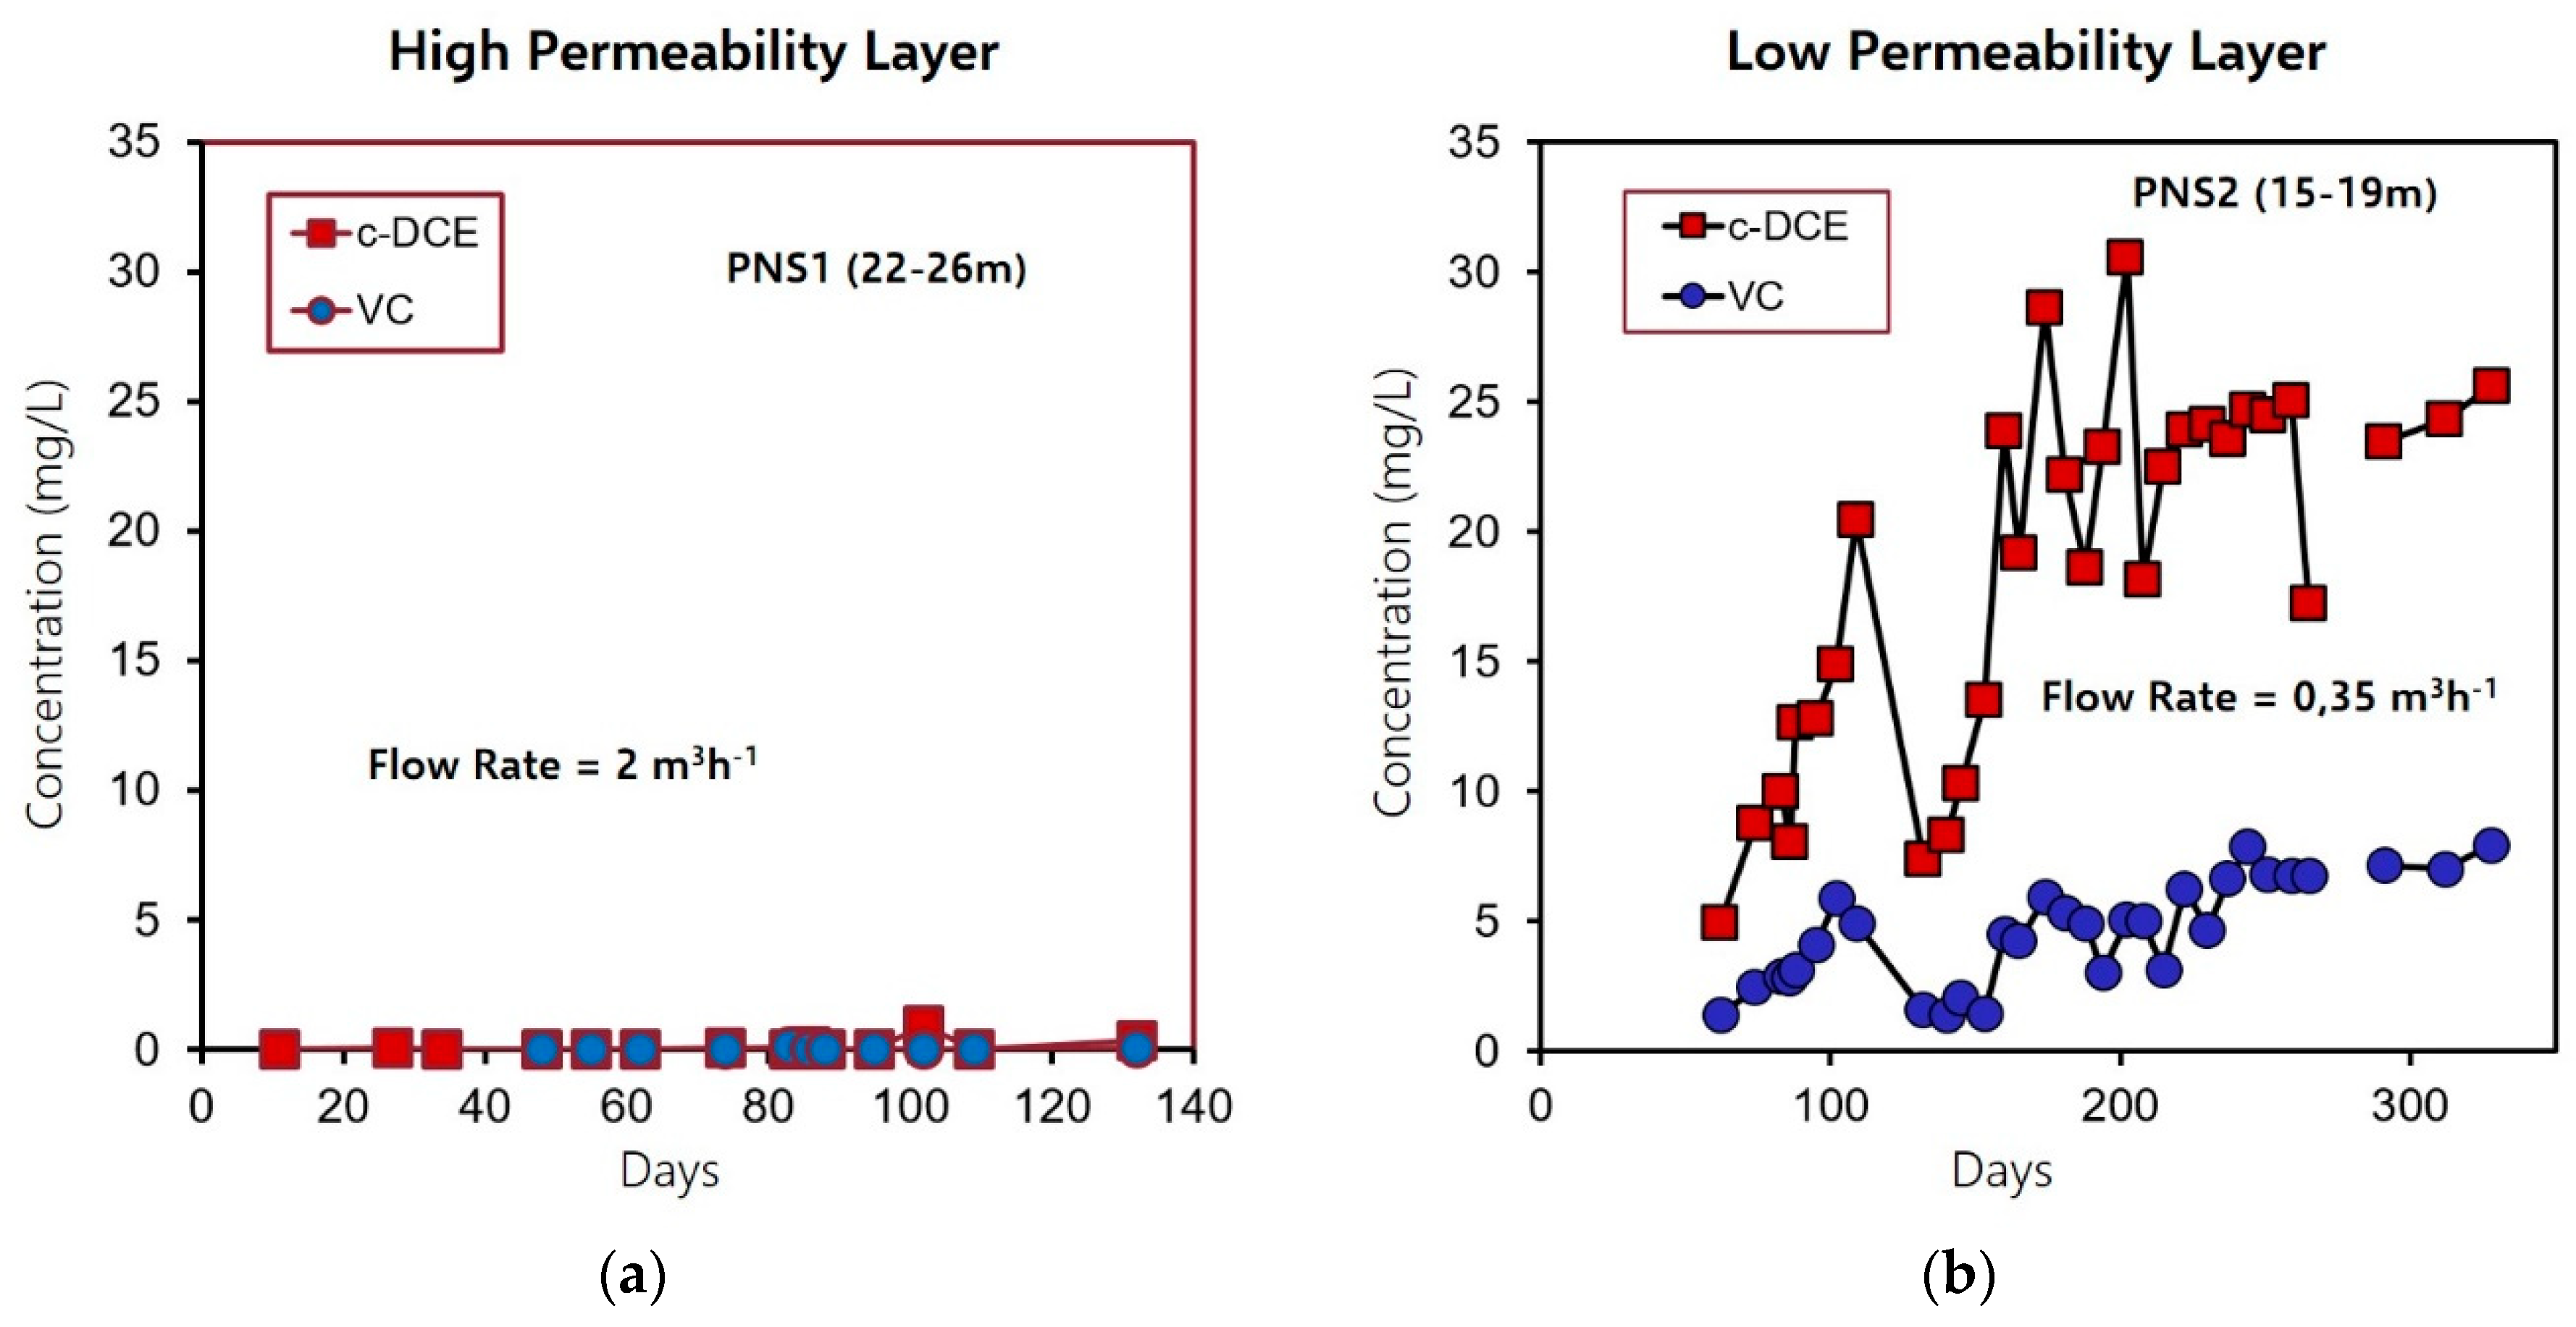
Based on the results obtained from the site characterization, microbiological [15,17], and microcosm [14,16,45] studies (not shown here), a pilot test was designed to optimize the operating conditions at the field scale. Hydrogeochemical modeling and contamination evolution highlighted the presence of active secondary sources in the low permeability layers [12,15]. Microcosm tests (conducted both in natural conditions and in addition to electrons) have shown the possibility of stimulating the biological reductive dechlorination processes up to ethylene [14]. The results of the microcosm experiments provide interesting information on the natural attenuation processes in the contaminated aquifer, and on the possibility of accelerating bioremediation processes, i.e., the biological degradation reaction of the chlorinated solvents by the addition of electron donor amendments [48]. A groundwater circulation well (GCW) [49] was designed and installed at the site to create in situ vertical groundwater circulation cells. The GCW (internal diameter of about 390 mm and external diameter of 400 mm) is at a depth of 26 m from the ground level, and has three fenestrated sections at depths of 8–12 m, 15–19 m, and 22–26 m, separated by packers [11]. The pilot test was carried out in an area characterized by the presence of numerous soil lenses with different textures and permeabilities (between 5 and 20 m below the ground level) and a clayey-silty impermeable horizon (at a depth of 26 m from the ground level), which is characterized by lateral continuity [12]. The GCW was equipped with a pumping system that extracted the groundwater from the filtering sections located between 22–26 m (permeable zone) and 15–19 m from the ground level (low permeability zone). The flow rate of the pump connected to the filtering section located in the permeable area (PNS1) was set to approximately 2 m3h−1, while the flow rate of the pump which recalled the water from the low permeability part of the aquifer (PNS2) was adjusted to around 0.35 m3h−1 [11]. The extracted water was re-introduced through the upper filtering section between 8 and 12 m by using a third pump, after passing through an external treatment unit [12].
The installed GCW operated in the “standard flow” configuration, (groundwater is recirculated from top to bottom), generating, in this specific case, two overlapping ellipsoidal recirculation cells [15]:
- A first circulation zone between the lower fenestration (22–26 m from ground level—suction) and the upper one (8–12 m from ground level—re-introduction);
- A second and smaller circulation zone between the middle fenestration (15–19 m from ground level—suction) and the upper one (8–12 m from ground level—re-introduction).
Figure 9 shows the configuration of the recirculation system in the specific lithostratigraphic situation.
The water coming from the pumping system passes through an external “treatment” module [12] before being re-introduced, to stimulate in situ biological reductive dechlorination processes and to significantly reduce the chlorinated solvent concentration present in the pumped groundwater. The external treatment unit consists of:
- A sand filter for the removal of suspended solids in the groundwater stream pumped before their passage through the successive stages of the treatment;
- A reactor containing poly-3-hydroxybutyrate (PHB) for the continuous production of electron donors [48] dissolved in the recirculated water stream;
- A reactor containing zero-valent iron. Zero-valent iron (ZVI/Fe) is a well-known reactive material widely used to perform the abiotic reductive dechlorination of chlorinated solvents [50];
- Relaunch tank, where the treated water is collected and re-injected into the most superficial part of the aquifer (8–12 m from the ground level), thus closing the circulation circuit, and generating the circulation cells described above.
The use of this technology has underlined the potential of continuously removing the chlorinated solvents mobilized by the recirculation of water, and above all, through the zones with low permeability—the site of the residual source of contamination [12]. This allows the re-introduction of groundwater with a concentration of solvents significantly lower than the pumped ones [15]. To visualize the pilot test results, the cis-dichloroethene (cis-DCE) and VC trends in the extracted water have been reported. The data analysis showed how the concentration of chlorinated solvents in the groundwater extracted by the low permeability layer was considerably higher than that measured at the PNS1 monitoring point.
The concentrations of VC and cis-DCE did not exceed 200 μg L−1 in the water pumped from the transmissive portion, while the concentrations of the chlorinated substances detected in the water extracted by the low permeability layer reached tens of thousands of μg L−1 (about 20,000 and 6000 μg L−1 for cis-DCE and VC, respectively) [11]. This evidence obviously confirms how the low permeability horizons represent the areas where the contaminants are mostly adsorbed and/or trapped as a residual phase [12] (Figure 10).
It is noteworthy to underline how the realized recirculation system allows both areas to pump water from the sections with permeability, which is certainly prohibitive for traditional pumping systems, and to mobilize very high quantities of contaminated substances [11]. The designed and installed pilot test verified the increasing mobilization of the contaminants and their removal, as well as the effective distribution of electron donors in the groundwater [48]. The GCW, unlike traditional injection/pumping systems, allowed the extraction of water from the very low permeability layers by mobilizing the contaminants (residual DNAPL) trapped/adsorbed in these areas [12]. Based on the geological and hydrogeological characteristics of the site, a 26 m deep GCW [49] was designed to obtain in situ vertical groundwater circulation cells, by drawing groundwater from two lower screened sections (PNS1 and PNS2) of a multiscreened well separated by packers, and discharging it through an upper screened section (PNS9). The pressure gradient between two hydraulically separated screen sections in the well induced a circulation flow in the aquifer [51,52]. The groundwater moves through the treatment zone both horizontally and vertically, and consequently the low-permeable layer is constantly penetrated by the vertical flow of the GCW [12]. The results of the characterization identified a large source of contamination below an operative industrial warehouse. A significant mass of residual DNAPLs [46] was contained in an area with complex hydrogeological settings. Residual CAHs resulted and were associated with the low permeability layers [3,9]. Clayey silts act as a persistent slow-releasing secondary contamination source kinetically controlled by slow back-diffusion mechanisms [47]. The analysis of the data related to the pilot test emphasized how the concentration of chlorinated solvents in the water pumped from the low permeability layer was notably greater than that measured at the point corresponding to the high permeability horizon [12]. Although the volumetric flow rates were remarkably lower, the masses mobilized by the less permeable zone appeared almost two orders of magnitude higher than those corresponding to the most transmissive zone of the aquifer [15]. The flow dynamics induced by the GCW [49], for a physical/mechanical effect, clearly favored the mobilization of the adsorbed/trapped contaminants [5,19] in the solid matrix.
This potentially decreases the exhaustion (remediation) time of the trapped fractions in the areas with a lower permeability, i.e., the slow-release persistent secondary sources that are not influenced by the traditional pumping action [12]. The site-specific hydrogeological setting shows a multilayered heterogeneous aquifer, which consists of materials that vary in their water-transmitting properties laterally and vertically (from fine-to-medium sands with an intercalation of less permeable sandy silt to clayey silt layers with a permeability in the range of 10−8–10−5 m/s). In this situation, trapped DNAPL in low permeability zones acts as a continuous, persistent source for releasing contaminants into the more permeable layers by slow back-diffusion [47]. The contamination present at the site consists of quantities of pooled or trapped DNAPL (hotspots), and various dissolved plumes are generated from the residual phase [3,9]. Site characterization surveys have also indicated that natural attenuation is already ongoing in the investigated site—the presence of 1,2-DCE and VC indicates an intense but incomplete microbial dechlorination activity, which has led to the formation of toxic compounds, such as VC [14]. Due to the decreasing reductive dechlorination rate, under anaerobic conditions, an accumulation of cis-DCE or VC is often observed at CAH contaminated sites [45]. The hydrogen atoms replace the chlorine atoms one after the other, resulting in the typical dichlorination sequence from PCE, via TCE, cis-DCE and VC down to ethane. The rate of reductive dichlorination decreases with the decreasing number of chloroatoms, causing an accumulation of cis-DCE or VC [53]. Compounds with a higher degree of chlorination, like TCE, were certainly used in the past as industrial solvents, and therefore constitute the primary contaminants. They have been detected at lower concentrations, presenting an intense biological dechlorizing activity. It is a well-known fact that one of the requirements for a successful in situ bioremediation implementation for chlorinated DNAPLs is homogenous electron donor distribution [16]. In this case, the conventional addition methods were not suitable because of the geochemistry and the hydrogeology of the site. Traditional injection approaches are often limited by the preferential migration of injected fluids through the more permeable zones [19], while distribution through less permeable and contaminated layers is usually limited. Conventional injection approaches (either continuous or pulsed) were not applicable at the investigated site, owing to complex aquifer geological characteristics. Injected fluids would preferentially migrate through easily permeable zones, and thereby prevent fluids from reaching less permeable layers where significant masses of contaminants were accumulated [15]. The use of groundwater circulation well (GCW) technology could advantageously improve the distribution of soluble electron donors by creating an effective three-dimensional circulation cell in the aquifer [13]. This three-dimensional water flow is established by installing a multiple screened well, where a packer is inserted to isolate the screen intervals hydraulically. Groundwater is extracted from one screen, and after a generic treatment, is circulated back into the aquifer through another screen, thereby creating the circulation cell [12]. The pressure gradient between the hydraulically separated screen sections induces a circulation flow in the aquifer, forcing water through less permeable layers that are not usually affected by conventional pumping and injection systems [49]. In fact, even though an intensive pumping is active for twelve years to avoid any contaminant spreading outside the site, dissolved CAH concentrations remain significantly high. On the other hand, the remediation technology of a groundwater circulation well [49] allows the creation of in situ vertical groundwater circulation cells. This technology enhances the mobilization of pollutants from a less accessible, low-permeable zone, where a significant mass of contaminants is strongly retained [15]. In this regard, the traditional pump and treat approach could mostly remove contaminants from the more transmissive zones of an aquifer, but it has a negligible effect on the contaminant mass stored in low permeability media which is slowly released by back-diffusion [47]. Moreover, coupling GCW with the continuous production of electron donors should allow the improvement of the biological reductive dechlorination inside the less permeable layer, thus, potentially reducing the remediation time [12].
4. Conclusions
This research provides some evidence about the effectiveness of a composite hydrogeochemical database for the integrated management, representation and analysis of heterogeneous data, enabling the appropriate selection, design and optimization of an effective remediation strategy. The integrated geodatabase represents an effective “near real time” decision support system (DSS) able to manage and release data during the different remediation phases—from the characterization to the implementation of technique. The study highlights the need for a large amount of multi-source data to build a reliable and high-resolution conceptual model, and to design effective remediation strategies with innovative technologies. The 3D geological/hydrogeological model was refined and strengthened by integrating the hydrochemical evidence. The high-resolution hydrogeochemical characterization highlights the association of a significant mass of contaminants with lenses of fine materials with very low permeability, in the saturated zone, which act as slow-release sources of contaminants. 1,2-DCE and VC were identified as the main pollutants of the groundwater and were detected in concentrations of up to 100 mg L−1, indicating the presence of residual areas of DNAPL acting as persistent secondary sources. The complete multidisciplinary and multitemporal characterization has recognized the areas affected by residual contamination, and has supported the choice, the sizing and the configuration of the remediation technology to be deployed. The realization of a pilot test is functional for the evaluation of the effective contaminant mobilization. Results from the field test demonstrate the important mobilization of contaminants from the low permeability zone, and the possibility of distributing electron donors to enhance in situ the natural attenuation mechanisms based on biological reductive dichlorination. The GCW allowed the extraction of water from the very low permeability layers by mobilizing the contaminants (residual DNAPL) trapped/adsorbed in these areas. The GCW can also be operated in the “reverse flow” configuration (groundwater is recirculated from the bottom to the top). Changing the recirculation configuration could prove beneficial, by enhancing the mobilization of pollutants from less accessible zones. The results obtained during the experimentation will support a definitive design choice for the full-scale intervention, determining the remediation of the entire identified contamination source. The implementation of the strategy in full scale will verify the effectiveness of the adopted technology for the persistent, low permeability contaminant source zones. Pilot testing was properly coordinated through the multidisciplinary and multitemporal data management model, and controlled in the execution phase in terms of yield. The integrated data cockpit reflects the interdisciplinary action that involves the contribution and collaboration of the different scientific spheres to guarantee valid results in qualitative terms. The geodatabase represents the link that favors the dynamic interchangeability of information in the multidisciplinary nature of the elements involved in the hydrogeochemical arena. The central system to organize/return even heterogeneous data is a support tool for the evaluation and design of targeted, effective and economically sustainable remediation interventions.
Author Contributions
Conceptualization, P.C., M.P.P. and C.E.; methodology, P.C. and M.P.P.; software, P.C.; validation, C.E. and M.P.P.; formal analysis, P.C.; investigation, P.C.; data curation, P.C.; writing—original draft preparation, P.C.; writing—review and editing, C.E. and M.P.P.; visualization, P.C.; supervision, M.P.P.; project administration, M.P.P.
Funding
This research received no external funding.
Acknowledgments
We would like to thank those who collaborated during the laboratory tests. Heartfelt thanks go to Luigi Marino, Luigi Stedile, and to the technical staff of the Applied Geology Laboratory at the Sapienza University of Rome. In the same way, we would like to thank Lucia Pierro, Firoozeh Arjmand and the collaborators of the Chemistry Laboratory at the Sapienza University of Rome, for the great amount of work carried out during the microcosm and column tests.
Conflicts of Interest
The authors declare no conflict of interest.
References
- McCarty, P.L. Groundwater Contamination by Chlorinated Solvents: History, Remediation Technologies and Strategies. In In Situ Remediation of Chlorinated Solvent Plumes; Stroo, H., Ward, C., Eds.; SERDP/ESTCP Environmental Remediation Technology; Springer: New York, NY, USA, 2010; pp. 1–28. [Google Scholar]
- Kueper, B.H.; Stroo, H.; Vogel, C.M.; Ward, C. Source Zone Remediation: The State of the Practice. In Chlorinated Solvent Source Zone Remediation; Kueper, B.H., Stroo, H., Vogel, C.M., Ward, C., Eds.; SERDP/ESTCP Environmental Remediation Technology; Springer: New York, NY, USA, 2014; pp. 1–27. [Google Scholar]
- Luciano, A.; Viotti, P.; Petrangeli, P.M. Laboratory investigation of DNAPL migration in porous media. J. Hazard. Mater. 2010, 176, 1006–1017. [Google Scholar] [CrossRef] [PubMed]
- Lee, K.Y.; Chrysikopoulos, C.V. Dissolution of a multicomponent DNAPL pool in an experimental aquifer. J. Hazard. Mater. 2006, 128, 218–226. [Google Scholar] [CrossRef] [PubMed]
- Abdel-Moghny, T.; Mohamed, R.S.A.; El-Sayed, E.; Aly, S.M.; Snousy, M.G. Effect of soil texture on remediation of hydrocarbons-contaminated soil at El-Minia district, Upper Egypt. ISRN Chem. Eng. 2012, 2012, 406598. [Google Scholar] [CrossRef]
- Fjordbøge, A.S.; Janniche, G.S.; Jørgensen, T.H.; Grosen, B.; Wealthall, G.; Christensen, A.G.; Kerrn-Jespersen, H.; Broholm, M.M. Integrity of Clay till Aquitards to DNAPL Migration: Assessment Using Current and Emerging Characterization Tools. Groundw. Water Monit. Remediat. 2017, 37, 45–61. [Google Scholar] [CrossRef]
- Rao, P.S.C.; Annable, M.D.; Kim, H. NAPL source zone characterization and remediation technology performance assessment: Recent developments and applications of tracer techniques. J. Contam. Hydrol. 2000, 45, 63–78. [Google Scholar] [CrossRef]
- Ghasemizadeh, R.; Hellweger, F.; Butscher, C.; Padilla, I.; Vesper, D.; Field, M.; Alshawabkeh, A. Review: Groundwater flow and transport modeling of karst aquifers, with particular reference to the North Coast Limestone aquifer system of Puerto Rico. Hydrogeol. J. 2012, 20, 1441–1461. [Google Scholar] [CrossRef] [Green Version]
- Christ, J.A.; Ramsburg, C.A.; Pennell, K.D.; Abriola, L.M. Predicting DNAPL mass discharge from pool-dominated source zones. J. Contam. Hydrol. 2010, 114, 18–34. [Google Scholar] [CrossRef]
- Kueper, B.H.; Wealthall, G.P.; Smith, J.W.N.; Leharne, S.A.; Lerner, D.N. An Illustrated Handbook of DNAPL Transport and Fate in the Subsurface; Environment Agency: Bristol, UK, 2003; pp. 5–13.
- Pierro, L.; Matturro, B.; Rossetti, S.; Sagliaschi, M.; Sucato, S.; Bartsch, E.; Alesi, E.; Majone, M.; Arjmand, F.; Petrangeli, P.M. Un nuovo processo per a bonifica di sorgenti residuali di DNAPL: Risultati della prima sperimentazione in piena scala. Ing. dell’Ambiente 2016, 3, 160–171. [Google Scholar] [CrossRef]
- Petrangeli, P.M.; Majone, M.; Arjmand, F.; Silvestri, D.; Sagliaschi, M.; Sucato, S.; Alesi, E. First pilot test on integration of GCW (groundwater circulation well) with ENA (enhanced natural attenuation) for chlorinated solvents source remediation. Chem. Eng. Trans. 2016, 49, 91–96. [Google Scholar] [CrossRef]
- Tatti, F.; Petrangeli, P.M.; Torretta, V.; Mancini, G.; Boni, M.R.; Viotti, P. Experimental and numerical evaluation of Groundwater Circulation Wells as a remediation technology for persistent, low permeability contaminant source zones. J. Contam. Hydrol. 2019, 222, 89–100. [Google Scholar] [CrossRef]
- Aulenta, F.; Bianchi, A.; Majone, M.; Petrangeli, P.M.; Potalivo, M.; Tandoi, V. Assessment of natural or enhanced in situ bioremediation at a chlorinated solvent contaminated aquifer in Italy: A microcosm study. Environ. Int. 2005, 31, 185–190. [Google Scholar] [CrossRef] [PubMed]
- Pierro, L.; Matturro, B.; Rossetti, S.; Sagliaschi, M.; Sucato, S.; Alesi, E.; Bartsch, E.; Arjmand, F.; Petrangeli, P.M. Polyhydroxyalkanoate as a slow-release carbon source for in situ bioremediation of contaminated aquifers: From laboratory investigation to pilot-scale testing in the field. New Biotechnol. 2017, 37, 60–68. [Google Scholar] [CrossRef] [PubMed] [Green Version]
- Aulenta, F.; Pera, A.; Petrangeli, P.M.; Rossetti, S.; Majone, M. Relevance of side reactions in anaerobic reductive dechlorination microcosms amended with different electron donors. Water Res. 2007, 41, 27–38. [Google Scholar] [CrossRef] [PubMed]
- Matturro, B.; Heavner, G.L.; Richardson, R.E.; Rossetti, S. Quantitative estimation of Dehalococcoides mccartyi at laboratory and field scale: Comparative study between CARD-FISH and Real Time PCR. J. Microbiol. Methods 2013, 93, 127–133. [Google Scholar] [CrossRef] [PubMed]
- Brusseau, M.L. Soil and Groundwater Remediation. In Environmental and Pollution Science; Brusseau, M.L., Pepper, I.L., Gerba, C.P., Eds.; Academic Press: New York, NY, USA; Elsevier: Amsterdam, The Netherlands, 2019; pp. 329–354. [Google Scholar]
- Harris, M.K.; Looney, B.B.; Jackson, D.G. Geology and environmental remediation: Savannah River Site, South Carolina. Environ. Geosci. 2004, 11, 191–204. [Google Scholar] [CrossRef]
- Suthersan, S.S.; Horst, J.; Schnobrich, M.; Welty, N.; McDonough, J. Remediation Engineering, Design Concepts, 2nd ed.; CRC Press, Taylor & Francis Group: Boca Raton, FL, USA, 2016; pp. 107–135. [Google Scholar]
- Artimo, A.; Saraperä, S.; Ylander, I. Methods for Integrating an Extensive Geodatabase with 3D Modeling and Data Management Tools for the Virttaankangas Artificial Recharge Project, Southwestern Finland. Water. Resour. Manag. 2008, 22, 1723–1739. [Google Scholar] [CrossRef]
- Raiber, M.; White, P.A.; Daughney, C.J.; Tschritter, C.; Davidson, P.; Bainbridge, S.E. Three-dimensional geological modelling and multivariate statistical analysis of water chemistry data to analyse and visualise aquifer structure and groundwater composition in the Wairau Plain, Marlborough District, New Zealand. J. Hydrol. 2012, 436–437, 13–34. [Google Scholar] [CrossRef]
- Seyedpour, S.M.; Kirmizakis, P.; Brennan, P.; Doherty, R.; Ricken, T. Optimal remediation design and simulation of groundwater flow coupled to contaminant transport using genetic algorithm and radial point collocation method (RPCM). Sci. Total Environ. 2019, 669, 389–399. [Google Scholar] [CrossRef] [Green Version]
- Wycisk, P.; Gossel, W.; Schlesier, D.; Neumann, C. Digital geological 3D structure models provide capable and forward looking management tools. In Integrated 3D Modelling of Subsurface Geology and Hydrogeology for Urban Groundwater Management, Proceedings of the International Symposium on New Directions in Urban Water Management, Paris, France, 12–14 September 2007; The United Nations Educational, Scientific and Cultural Organization (UNESCO): Paris, France, 2007. [Google Scholar]
- Huysegoms, L.; Cappuyns, V. Critical review of decision support tools for sustainability assessment of site remediation options. J. Environ. Manag. 2017, 196, 278–296. [Google Scholar] [CrossRef]
- Bozzano, F.; Petitta, M.; Del Bon, A.; Nardoni, F.; Pacioni, E. Conceptual model and flow numerical simulation of aquifer contaminated by chlorinated solvents in Rho (MI). Ital. J. Eng. Geol. Environ. 2007, 1, 97–105. [Google Scholar] [CrossRef]
- ASTM International. ASTM D2487-11. Standard Practice for Classification of Soils for Engineering Purposes (Unified Soil Classification System); ASTM International: West Conshohocken, PA, USA, 2011. [Google Scholar]
- ASTM International. ASTM D4318-10. Standard Test Methods for Liquid Limit, Plastic Limit, and Plasticity Index of Soils; ASTM International: West Conshohocken, PA, USA, 2010. [Google Scholar]
- ASTM International. ASTM D2216-10. Standard Test Methods for Laboratory Determination of Water (Moisture) Content of Soil and Rock by Mass; ASTM International: West Conshohocken, PA, USA, 2010. [Google Scholar]
- Cheong, J.Y.; Hamm, S.Y.; Kim, H.S.; Ko, E.J.; Yang, K.; Lee, J.H. Estimating hydraulic conductivity using grain-size analyses, aquifer tests, and numerical modeling in a riverside alluvial system in South Korea. Hydrogeol. J. 2008, 16, 1129. [Google Scholar] [CrossRef]
- Lekula, M.; Lubczynski, M.W.; Shemang, E.M. Hydrogeological conceptual model of large and complex sedimentary aquifer systems—Central Kalahari Basin. Phys. Chem. Earth 2018, 106, 47–62. [Google Scholar] [CrossRef]
- Kaliraj, S.; Chandrasekar, N.; Peter, T.S.; Selvakumar, S.; Magesh, N.S. Mapping of coastal aquifer vulnerable zone in the south west coast of Kanyakumari, South India, using GIS-based DRASTIC model. Environ. Monit. Assess. 2015, 187, 4073. [Google Scholar] [CrossRef] [PubMed]
- Safarbeiranvnd, M.; Amanipoor, H.; Battaleb-Looie, S.; Ghanemi, K.; Ebrahimi, B. Quality Evaluation of Groundwater Resources using Geostatistical Methods (Case Study: Central Lorestan Plain, Iran). Water Resour. Manag. 2018, 32, 3611–3628. [Google Scholar] [CrossRef]
- Mirzaei, R.; Sakizadeh, M. Comparison of interpolation methods for the estimation of groundwater contamination in Andimeshk-Shush Plain, Southwest of Iran. Environ. Sci. Pollut. Res. 2016, 23, 2758–2769. [Google Scholar] [CrossRef] [PubMed]
- Adhikary, P.P.; Dash, C.J. Comparison of deterministic and stochastic methods to predict spatial variation of groundwater depth. Appl. Water Sci. 2017, 7, 339–348. [Google Scholar] [CrossRef]
- Xiao, Y.; Gu, X.; Yin, S.; Shao, J.; Cui, Y.; Zhang, Q.; Niu, Y. Geostatistical interpolation model selection based on ArcGIS and spatio-temporal variability analysis of groundwater level in piedmont plains, northwest China. SpringerPlus 2016, 5, 425. [Google Scholar] [CrossRef]
- Kourgialas, N.N.; Karatzas, G.P. Groundwater contamination risk assessment in Crete, Greece, using numerical tools within a GIS framework. Hydrol. Sci. J. 2015, 60, 111–132. [Google Scholar] [CrossRef]
- Tatti, F.; Petrangeli, P.M.; Raboni, M.; Viotti, P. Image analysis procedure for studying Back-Diffusion phenomena from low-permeability layers in laboratory tests. Sci. Rep. 2016, 30400. [Google Scholar] [CrossRef]
- Barchi, M.R.; Pauselli, C.; Chiarabba, C.; Di Stefano, R.; Federico, C.; Minelli, G. Crustal structure, tectonic evolution and seismogenesis in the Northern Apennines (Italy). Boll. Geof. Teor. Appl. 2006, 47, 249–270. [Google Scholar]
- Lugli, S.; Marchetti Dori, S.; Fontana, D.; Panini, F. Composizione dei sedimenti sabbiosi nelle perforazioni lungo il tracciato ferroviario ad alta velocità: Indicazioni preliminari sull’evoluzione sedimentaria della media pianura modenese. Ital. J. Quat. Sci. 2004, 17, 379–389. [Google Scholar]
- Regione Emilia Romagna; Eni-Agip. Riserve Idriche Sotterranee della Regione Emilia-Romagna; S.El.Ca: Firenze, Italy, 1998; p. 120. [Google Scholar]
- Heinz, J.; Aigner, T. Hierarchical dynamic stratigraphy in various Quaternary gravel deposits, Rhine glacier area (SW Germany): Implications for hydrostratigraphy. Int. J. Earth Sci. 2003, 92, 923–938. [Google Scholar] [CrossRef]
- Mayo, A.L. Ambient well-bore mixing, aquifer cross-contamination, pumping stress, and water quality from long-screened wells: What is sampled and what is not? Hydrogeol. J. 2010, 18, 823–837. [Google Scholar] [CrossRef]
- Kram, M.L.; Keller, A.A.; Rossabi, J.; Everett, L.G. DNAPL Characterization Methods and Approaches, Part 1: Performance Comparisons. Groundw. Water Monit. Remediat. 2001, 21, 109–123. [Google Scholar] [CrossRef]
- Aulenta, F.; Majone, M.; Verbo, P.; Tandoi, V. Complete dechlorination of tetrachloroethene to ethene in presence of methanogenesis and acetogenesis by an anaerobic sediment microcosm. Biodegradation 2002, 13, 411–424. [Google Scholar] [CrossRef] [PubMed]
- Leharne, S. Transfer phenomena and interactions of non-aqueous phase liquids in soil and groundwater. ChemTexts 2019, 5. [Google Scholar] [CrossRef]
- Lapworth, D.J.; Zahid, A.; Taylor, R.G.; Burgess, W.G.; Shamsudduha, M.; Ahmed, K.M.; Mukherjee, A.; Gooddy, D.C.; Chatterjee, D.; MacDonald, A.M. Security of deep groundwater in the coastal Bengal Basin revealed by tracers. Geophys. Res. Lett. 2018, 45, 8241–8252. [Google Scholar] [CrossRef]
- Aulenta, F.; Fuoco, M.; Canosa, A.; Petrangeli, P.M.; Majone, M. Use of poly-β-hydroxy-butyrate as a slow-release electron donor for the microbial reductive dechlorinationof TCE. Water Sci. Technol. 2008, 57, 921–925. [Google Scholar] [CrossRef]
- Johnson, R.L.; Simon, M.A. Evaluation of groundwater flow patterns around a dual-screened groundwater circulation well. J. Contam. Hydrol. 2007, 93, 188–202. [Google Scholar] [CrossRef]
- Dries, J.; Bastiaens, L.; Springael, D.; Agathos, S.N.; Diels, L. Removal of mixed chlorinated ethenes and heavy metals in zero valent iron systems. Meded. Rijksuniv. Gent. Fak. Landbouwkd Toegep. Biol. Wet. 2001, 66, 179–183. [Google Scholar]
- Xiang, J.; Kabala, Z.J. Performance of the steady-state dipole flow test in layered aquifer. Hydrol. Process. 1998, 11, 1595–1605. [Google Scholar] [CrossRef]
- EPA. Field Applications of in Situ Remediation Technologies: Ground-Water Circulation Wells; Environmental Protection Agency, Office of Solid Waste and Emergency Response, Technology Innovation Office: Washington, DC, USA, 1998; pp. 8–21. Available online: https://nepis.epa.gov/Exe/ZyPDF.cgi/1000306R.PDF?Dockey=1000306R.PDF (accessed on 2 July 2019).
- Tiehm, A.; Schmidt, K.R. Sequential anaerobic/aerobic biodegradation of chloroethenes-aspects of field application. Curr. Opin. Biotechnol. 2011, 22, 415–421. [Google Scholar] [CrossRef] [PubMed]
Figure 1.
3D geological model.

Figure 2.
Representation of the piezometric surface (meters above sea level) of the shallow aquifer.
Figure 2.
Representation of the piezometric surface (meters above sea level) of the shallow aquifer.

Figure 3.
Tracking map (a) and stratigraphic section across the pilot test area (b).

Figure 4.
Pilot test 3D “exploded” lithostratigraphic model.

Figure 5.
Contour maps that represent the 1,2-dicloroethylene (1,2-DCE) (a–c) and vinyl chloride (VC) (d–f) concentrations detected in groundwater in 2009, 2013, and 2017.
Figure 5.
Contour maps that represent the 1,2-dicloroethylene (1,2-DCE) (a–c) and vinyl chloride (VC) (d–f) concentrations detected in groundwater in 2009, 2013, and 2017.

Figure 6.
Hydrogeochemical sections relating to concentrations of 1,2-DCE detected in multilevel piezometers within the pilot area.
Figure 6.
Hydrogeochemical sections relating to concentrations of 1,2-DCE detected in multilevel piezometers within the pilot area.

Figure 7.
Hydrogeochemical sections relating to concentrations of VC detected in multilevel piezometers within the pilot area.
Figure 7.
Hydrogeochemical sections relating to concentrations of VC detected in multilevel piezometers within the pilot area.

Figure 8.
Contour maps representing the contamination state evolution of trichloroethylene (TCE) in the historical piezometric network.
Figure 8.
Contour maps representing the contamination state evolution of trichloroethylene (TCE) in the historical piezometric network.

Figure 9.
Pilot plant configuration.

Figure 10.
Trend of VC and cis-DCE concentrations in groundwater extracted from the permeable area (PNS1) (a) and the low permeability area (PNS2) (b) monitoring points [11].
Figure 10.
Trend of VC and cis-DCE concentrations in groundwater extracted from the permeable area (PNS1) (a) and the low permeability area (PNS2) (b) monitoring points [11].

© 2019 by the authors. Licensee MDPI, Basel, Switzerland. This article is an open access article distributed under the terms and conditions of the Creative Commons Attribution (CC BY) license (http://creativecommons.org/licenses/by/4.0/).
Share and Cite
MDPI and ACS Style
Ciampi, P.; Esposito, C.; Petrangeli Papini, M. Hydrogeochemical Model Supporting the Remediation Strategy of a Highly Contaminated Industrial Site. Water 2019, 11, 1371. https://doi.org/10.3390/w11071371
AMA Style
Ciampi P, Esposito C, Petrangeli Papini M. Hydrogeochemical Model Supporting the Remediation Strategy of a Highly Contaminated Industrial Site. Water. 2019; 11(7):1371. https://doi.org/10.3390/w11071371
Chicago/Turabian StyleCiampi, Paolo, Carlo Esposito, and Marco Petrangeli Papini. 2019. "Hydrogeochemical Model Supporting the Remediation Strategy of a Highly Contaminated Industrial Site" Water 11, no. 7: 1371. https://doi.org/10.3390/w11071371
Note that from the first issue of 2016, this journal uses article numbers instead of page numbers. See further details here.