Design of a Remote-Controlled Platform for Green Roof Plants Monitoring via Hyperspectral Sensors


1
DICEA (Dipartimento di Ingegneria Civile Edile e Ambientale), Sapienza University of Rome, via Eudossiana 18, 00184 Rome, Italy
2
DINCI (Dipartimento di Ingegneria Civile), University of Calabria, via P. Bucci 42B, 87036 Rende (CS), Italy
*
Author to whom correspondence should be addressed.
Water 2019, 11(7), 1368; https://doi.org/10.3390/w11071368
Submission received: 24 May 2019
/
Revised: 5 June 2019
/
Accepted: 26 June 2019
/
Published: 2 July 2019
(This article belongs to the Section Hydrology)
Abstract
:The combination of an appropriate design and careful management of green infrastructures may contribute to mitigate flooding (stormwater quantity) and pollutant discharges (stormwater quality) into receiving water bodies and to coping with other extreme climate impacts (such as temperature regime) on a long-term basis and water cycle variability. The vegetation health state ensures the green infrastructure’s effectiveness. Due to their remarkable spatial and spectral resolution, hyperspectral sensing devices appear to be the most suited for green infrastructure vegetation monitoring according to the peculiar spectral features that vegetation exhibits. In particular, vegetation health-state detection is feasible due to the modifications the typical vegetation spectral signature undergoes when abnormalities are present. This paper presents a ground spectroscopy monitoring survey of the green roof installed at the University of Calabria fulfilled via the acquisition and analysis of hyperspectral data. The spectroradiometer, placed on a fixed stand, was used to identify stress conditions of vegetation located in areas where drought could affect the plant health state. Broadband vegetation indices were employed for this purpose. For the test case presented, data acquired agreed well with direct observations on the ground. The analyses carried out showed the remarkable performances of the broadband indices Red Difference Vegetation Index (Red DVI), Simple Ratio (SR) and Triangular Vegetation Index (TVI) in highlighting the vegetation health state and encouraged the design of a remote-controlled platform for monitoring purposes.
1. Introduction
In urban and industrial environments (UIEs), the progressive surface sealing due to the development of built-up areas and motorways have generated a constant loss of natural areas and a disintegration of ecosystems [1]. Severe modifications in the natural water cycle, including reduced stormwater infiltration and evapo-transpiration, have increased the frequency and magnitude of flooding in UIEs. This trend unsustainably increases exposure to natural threats in large regions of Europe for human health, the environment, cultural heritage and economic activity [2,3,4]. Urbanization has also significantly altered the local microclimate, with the formation of so-called urban heat islands (UHIs). Urban surfaces with low albedo and permeability typically absorb most of the incoming solar radiation and reduce evapo-transpirational cooling, respectively [5,6].
Preventing pluvial flooding (PF) is one of the major challenging tasks of modern towns and cities. Unlike other types of flooding, pluvial flooding is a direct, quick and localised consequence of extreme rainfall causing the surcharge of sewer–stormwater networks. It often happens with little warning and in areas not obviously prone to flooding, making it hard to manage and predict. The European Flood Directive 2007/60/EC established a framework for the assessment and management of PF risks aimed to reduce/mitigate the adverse consequences of PF on human health, environment, cultural heritage and economic activities, hence, increasing the resilience of large to small cities.
The likelihood (i.e., hazard) of PF in urban areas is caused by the high proportion of artificial surfaces, which limit water infiltration and reduce flow resistance increasing the amount of water running off the ground surface, as well as its velocity. Following the paradigm of nature-based solutions, this paper presents a low-cost nature-based solution suitable for increasing the water retention and storage capacity of urban areas. This small-scale engineered facility, namely, a green roof facility, takes advantage of soils and vegetation to capture, infiltrate, transpire, and, in combination with other measures, reuse stormwater. Beyond the mitigation of floods, the numerous benefits of green infrastructures in the urban environment include mitigation of heat island effects, increased carbon sequestration capability, improved resilience to cope with extreme weather events, and increased biodiversity, quality of life and building energy efficiency.
Several studies analyse green roof hydraulics [7,8,9,10,11,12], thermal performance [13,14] and lifecycle assessment performance [15]. With vegetation being recognized as the key element in installing green roofs [16], few investigations have taken into account the role and importance of its health state in assuring green roof effectiveness in reducing the rate and volume of urban runoff, in diminishing the urban heat island effects and in guaranteeing biodiversity in an urban environment.
The huge potentiality of vegetation monitoring via the analysis of hyperspectral data is largely documented in the literature with interesting applications aimed at identifying different plants and the eventual start and evolution of stress situations [17,18,19]. It is well known that healthy plants present peculiar spectral properties strictly connected to their chemical composition (pigments and other biochemical constituents), to the physical (leaf thickness, mesophyll structure) and physiological (water content, photosynthetic efficiency) characteristics of the leaf apparatus [20]. Hyperspectral sensing systems supply high spatial, spectral, and temporal resolution data and are, for this reason, particularly suited for vegetation monitoring [21,22]. One of the most relevant applications is in the context of the quantitative estimation of biochemical and biophysical variables related to the physiological state of vegetation and of the occurrence of stress situations due to the extreme temperature conditions, presence of parasitic insects, presence of moulds, general anomalies, water scarcity, pollution, nutritional deficiency, presence of toxic elements, vegetable competition and mechanical damage. Referring to the identification of plant stress status, the potential of hyperspectral sensing systems lies in the possibility of quickly detecting a degenerative vegetation state, to be verified in the field in terms of presence and causes [23]. The timely identification of stress situations is particularly relevant to facilitate the identification of targeted areas and the design of localized actions that limit costs and avoid degradation of the environment with unnecessary treatments (anticrittogamics, insecticides) [23]. To handle the huge amount of information provided by hyperspectral sensing systems, it is useful to compute proper hyperspectral indices that synthesize reflectance characteristics. The indices, which in the case of vegetation monitoring are called vegetation indices (VIs), are in most of the cases functions of the reflectance in red (R) and near-infrared (NIR) spectral bands [24]. Vegetation indices are quite simple and effective algorithms for quantitative and qualitative evaluations of vegetation cover, vigour, and growth dynamics, among other applications. Within this framework, the paper presents the ground spectroscopy survey of a green roof installed at the University of Calabria and data processing to compute VIs. This study was developed within a larger research project, “Integrated and Sustainable Management Services for the Water–Energy Cycle in Urban Drainage Systems”, financed by European Structural funds aimed at understanding the influence of green roofs on rainwater management and energy consumption for air conditioning in the Mediterranean area.
It is worth noting that to interpret data gathered from hyperspectral devices via proximal and remote sensing campaigns, trustworthy close-range ground-truth information is mandatory. To this aim, the spectral device is usually placed close to the objects (plants) under investigation and measurements are conducted in “controlled” conditions not necessarily in the laboratory. In our investigation, (1) the simultaneous measurement of climatic, thermo-physical, hydrological and hydraulic quantities, which are helpful to infer the health state of vegetation, and (2) the selection of specific plants as the target of the investigation permitted the determination of the vegetation indices which were the most suited to understand if vegetation was affected by a drought-induced stress. Therefore, this work offers an interesting starting point for the design of a remote-controlled platform able to monitor the vegetation health and maintain an optimal roof vegetation coverage by engineered semi-automatic procedures.
The paper is organized as follows: Section 2 describes the spectroradiometer platform and data acquisition; Section 3 reviews the vegetation hyperspectral features and the most commonly employed broadband vegetation indices; Section 4 describes the results of the investigation. The paper ends with a concluding section.
2. Materials and Methods
2.1. Case Study: University of Calabria’s Green Roof
A green roof was installed at the University of Calabria and planted with three canopy species particularly suited to the Mediterranean climate: Carpobrotus Edulis (hereinafter Carpobrotus), Dianthus Granthianopolitanus (hereinafter Dianthus) and Cerastium Tomentosum (hereinafter Cerastium). To ensure that a green infrastructure will work properly, vegetated areas have to be continuously monitored to verify their health state. To this aim, the field-portable spectroradiometer FieldSpec 4-ASD was employed. For a detailed description of the site under investigation and data acquisition refer to References [13,25], respectively. Within the monitoring period (December 2014–June 2015) two canopies of each plant species, for a total of six plants, were monitored.
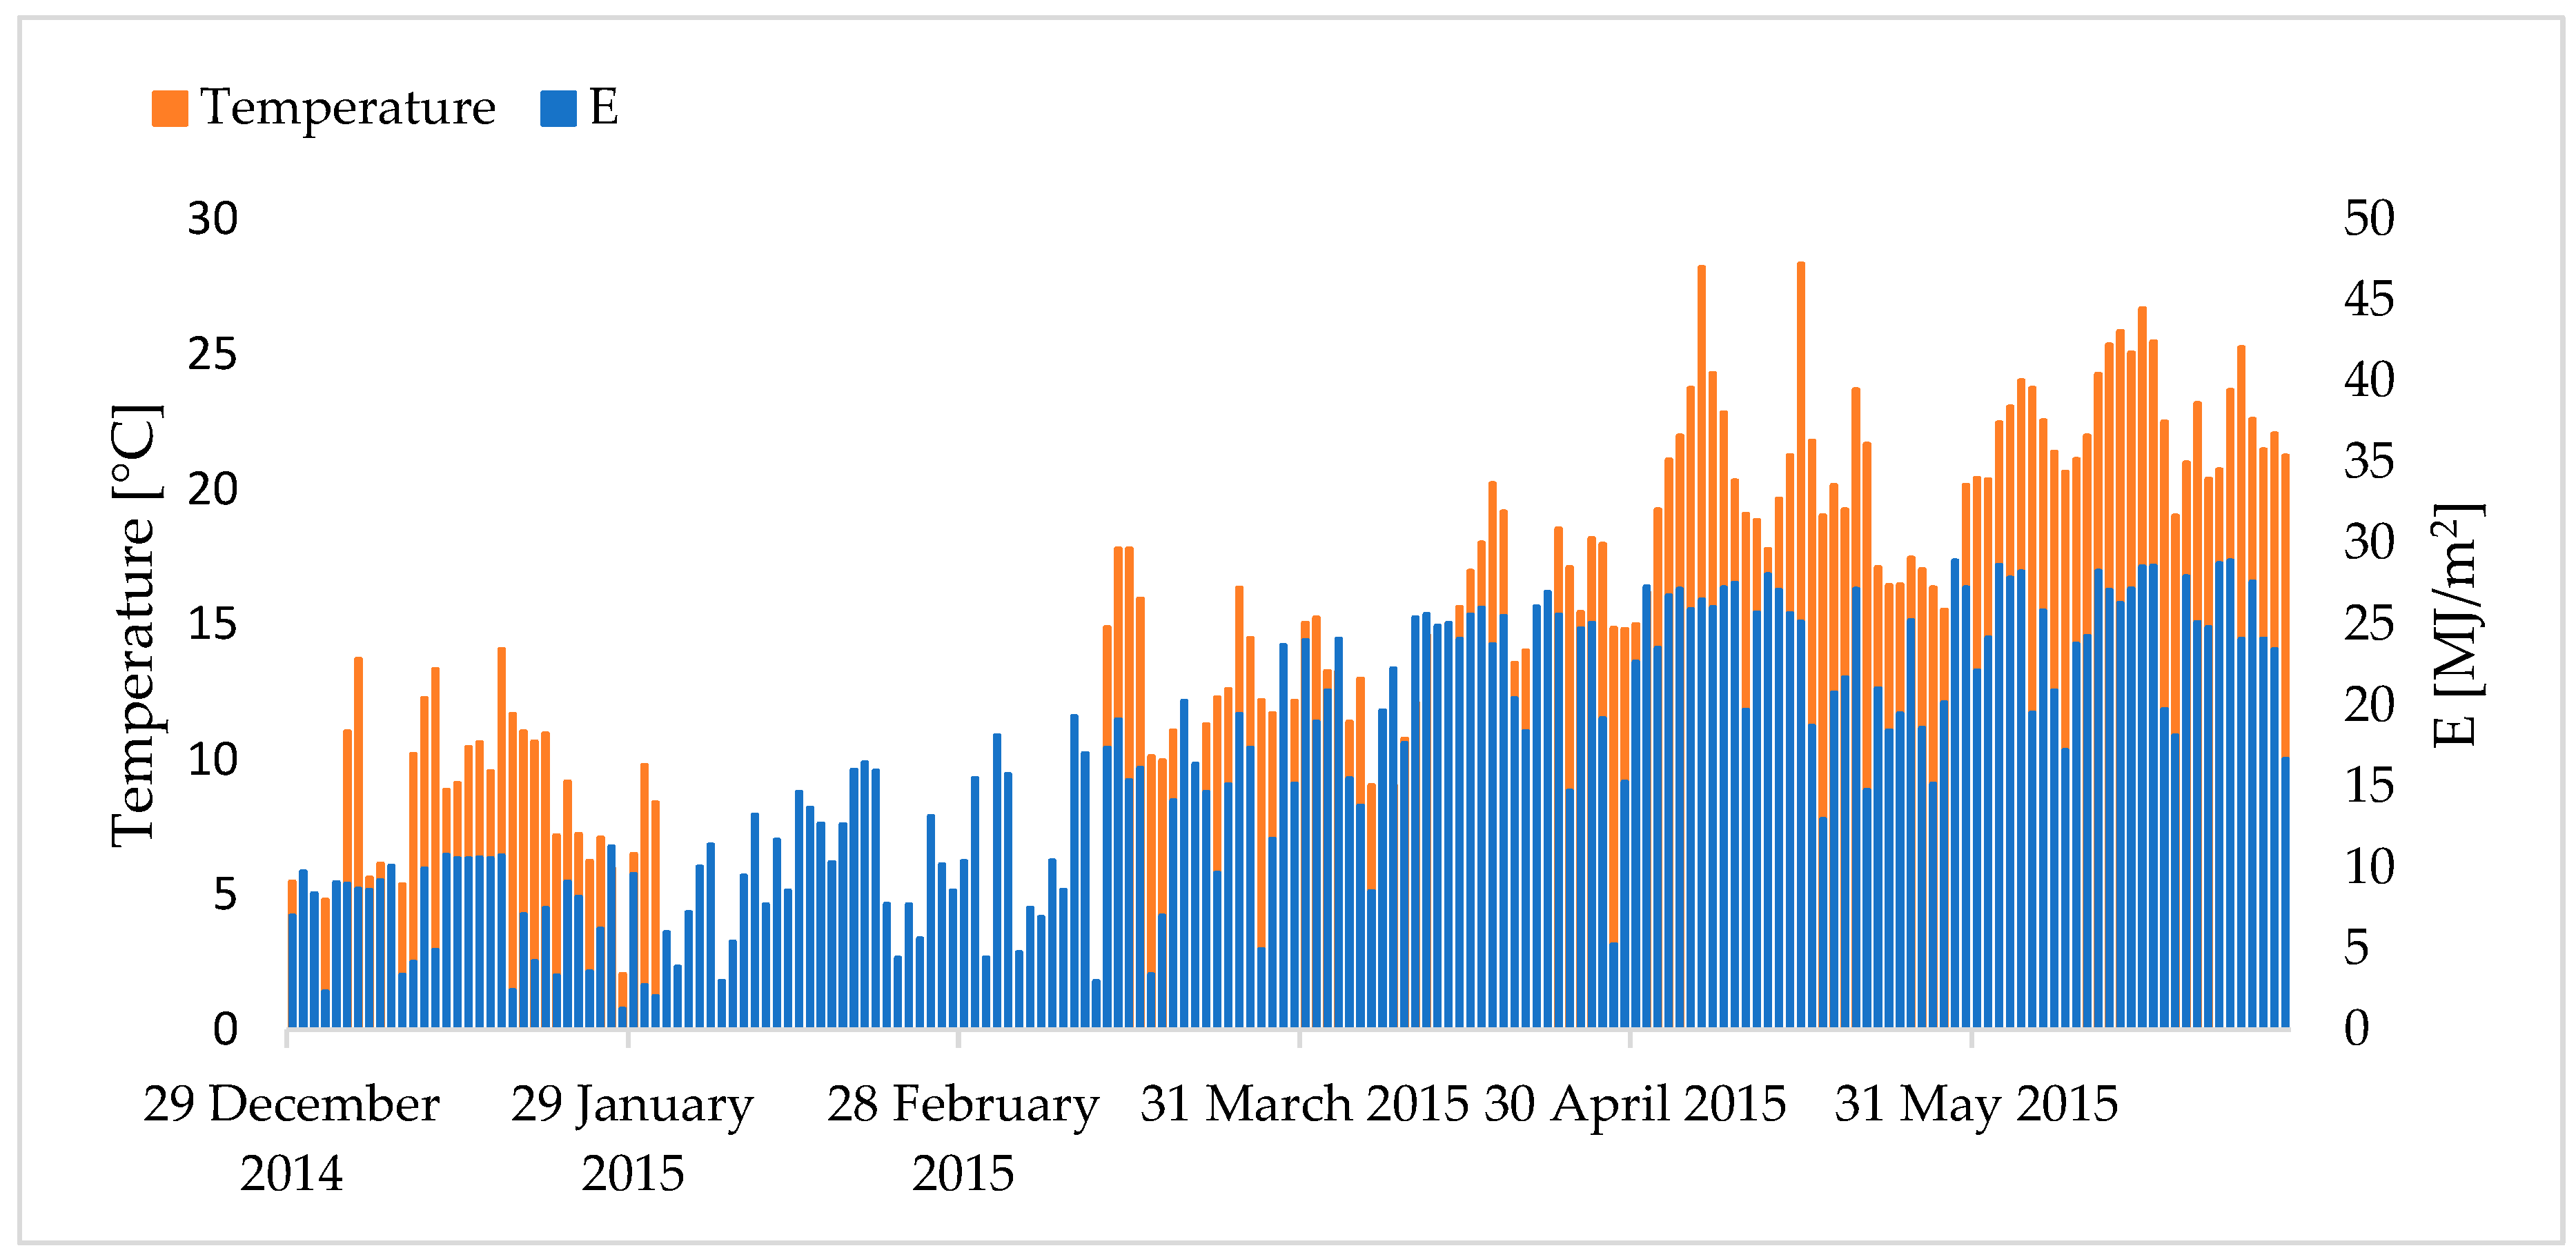
The study area was equipped with suitable devices for the monitoring of climatic, thermo-physical, hydrological and hydraulic quantities [25]. Solar radiation and air temperature were recorded during the sampling time by the monitoring system the green roof was equipped with. In order to simplify the results presentation, spectral data were related to air temperature (°C), solar radiation (MJ/(m2)) (Figure 1) and rainfall (mm/day) (Figure 2). These data were collected every minute. Air temperature data from 29 January 2015 to 20 March 2015 were lacking due to the fact of sensor failure. Soil temperature and volumetric water content (VWC) (Figure 2) were acquired through four SMT2 (Soil Moisture and Temperature Sensor) placed in four different points within the monitored area. The volumetric water content was then obtained by averaging the measurements from the four devices. The health condition of the plants was visually inspected by personnel with horticulture skills able to associate phenotyping (i.e., characteristic physical traits of a plant) with the plant status and annotated to be compared to the outcomes of the spectral data analysis as well as to meteo-climatic quantitative data.
2.2. Spectroradiometer Platform and Data Acquisition
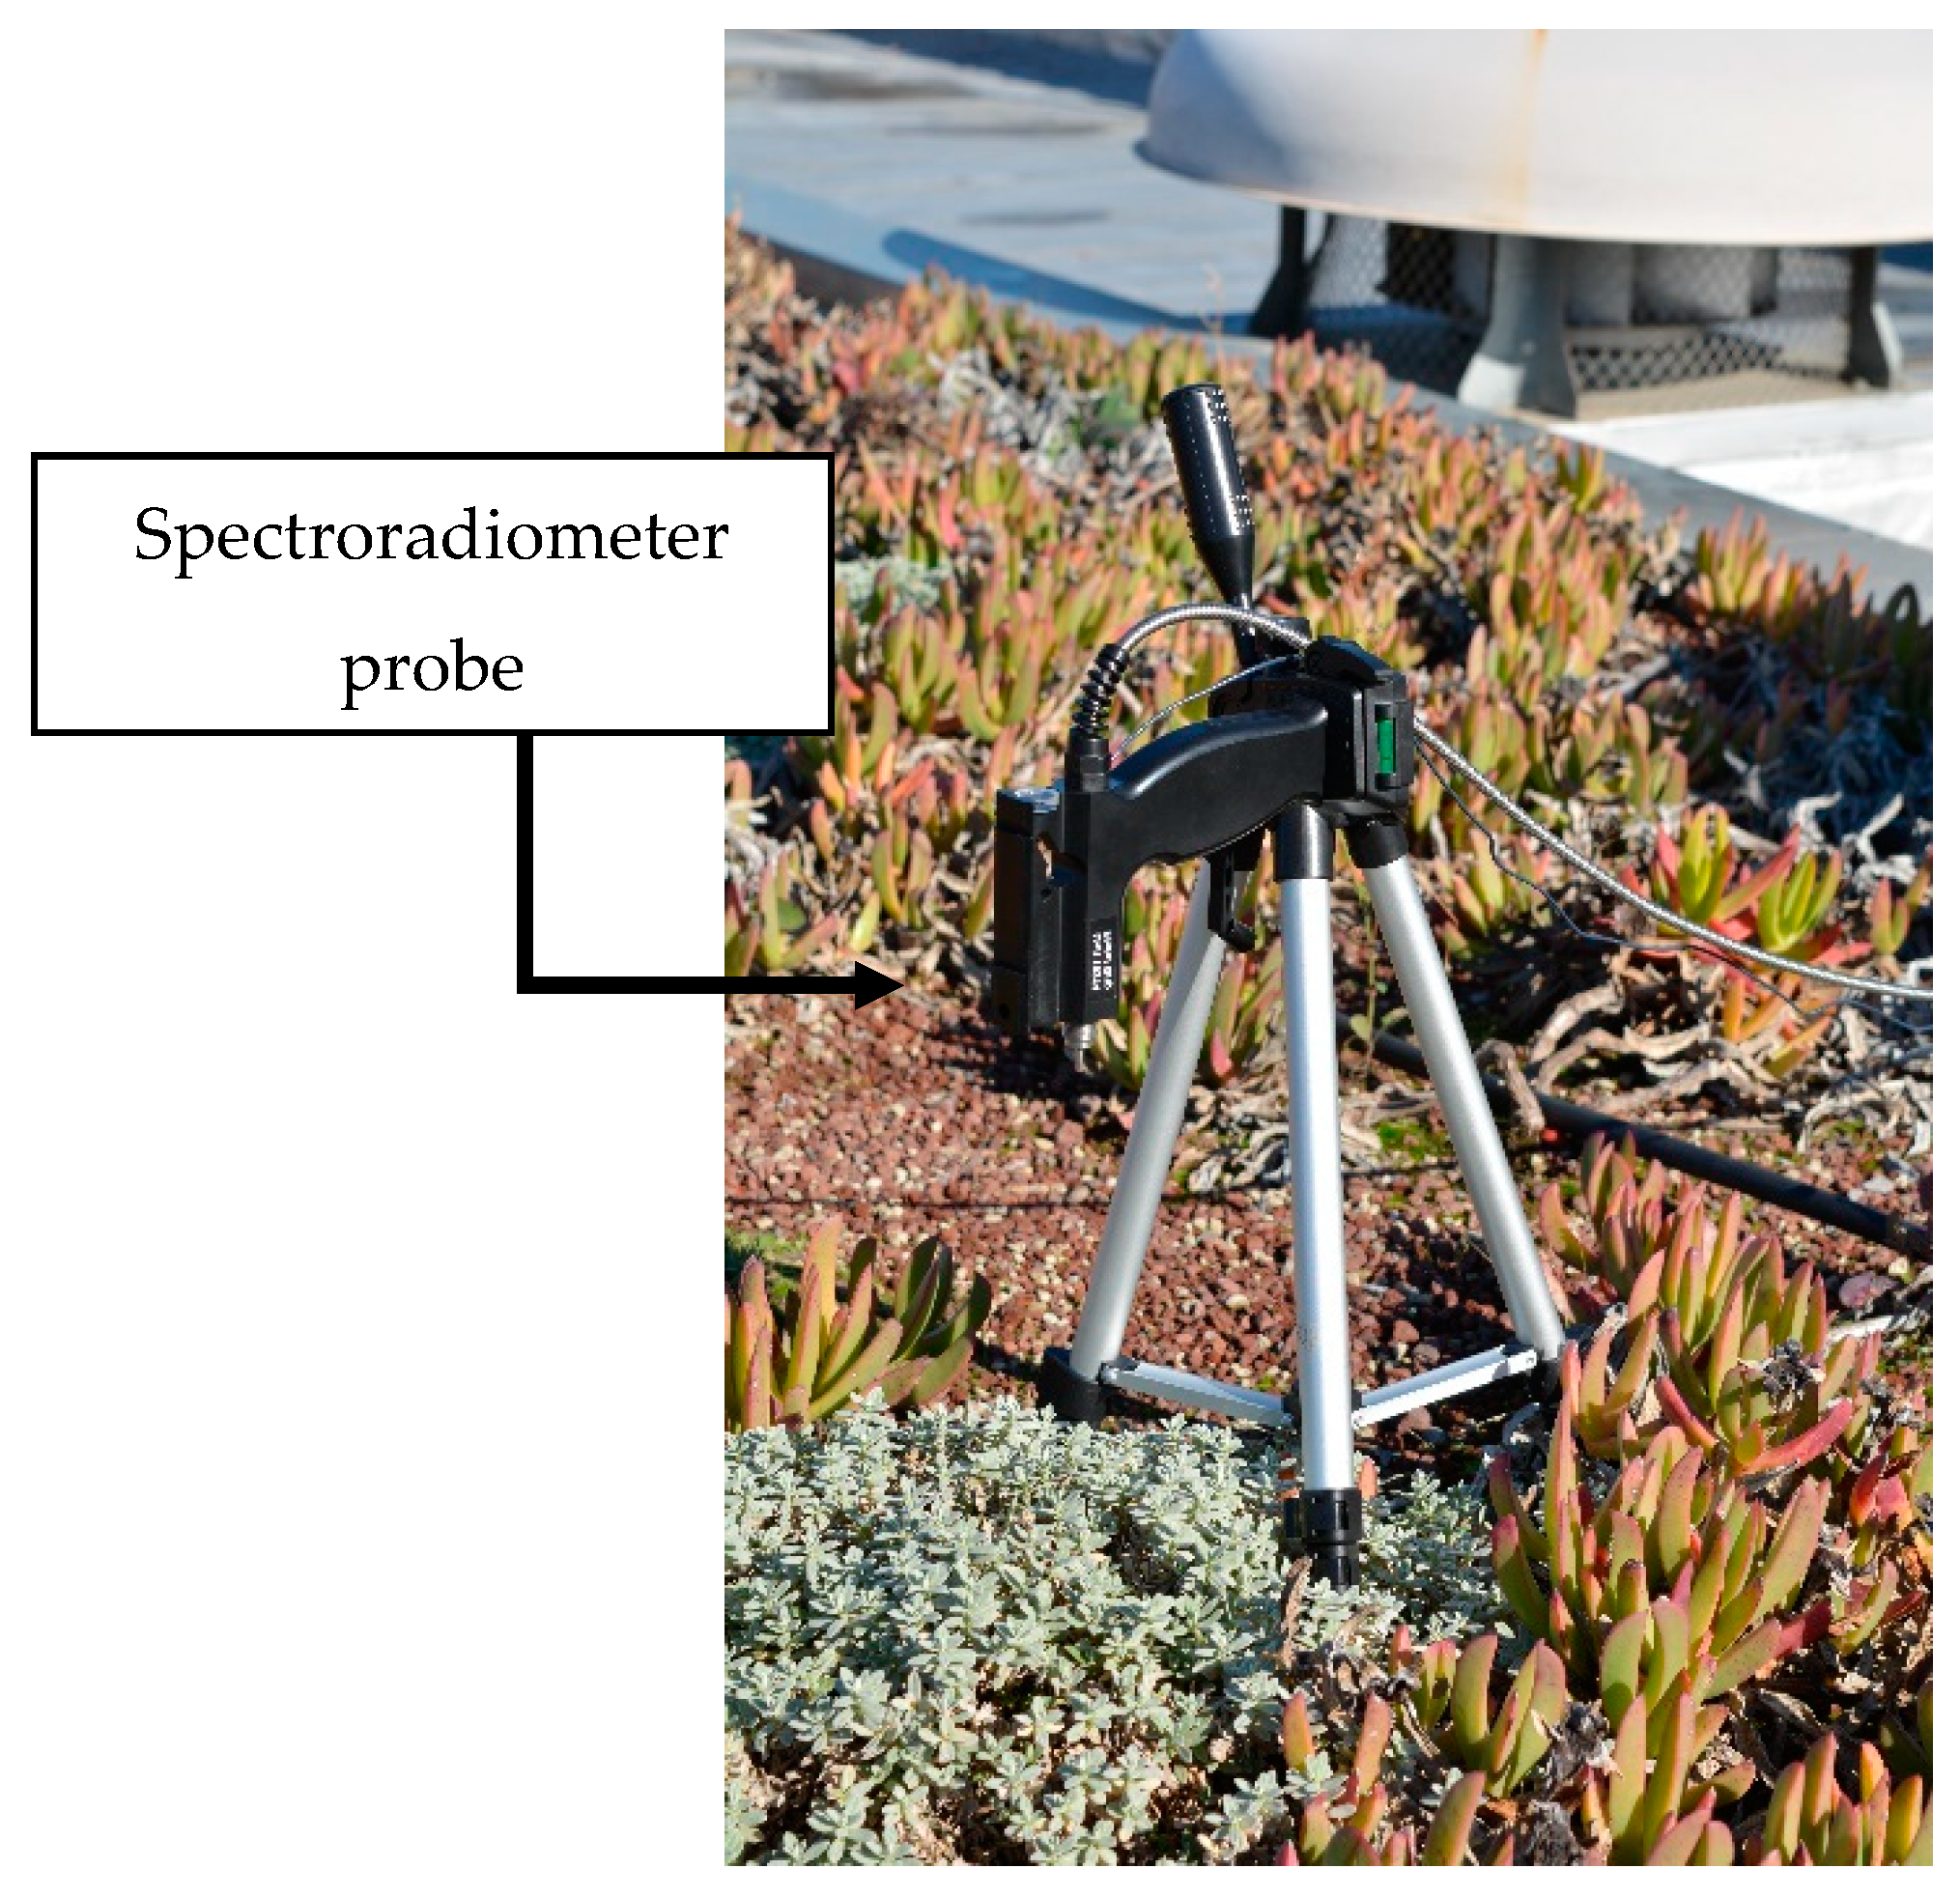
The spectroradiometer FieldSpec 4-ASD allows the measurement of a target spectral signature in the wavelength interval 350–2500 nm. It comprises two different typologies of high spectral resolution sensors: one VNIR (Visible and Near-InfraRed) sensor for the wavelength interval 350–1000 nm and graded index InGaAs photodiode SWIR (Short-Wave InfraRed) detectors for the wavelength interval 1000–2500 nm. The sensor visual field is 25°. To perform data acquisition with the spectroradiometer, the sensor was mounted at a height of 0.15 m above the foliage to ensure a large field of view including the plant only (0.005 m2). The spectroradiometer supplies a single spectral signature (1D information) containing the average spectral features of the object surface which is supposed to be homogeneous. Figure 3 shows the spectroradiometer measuring spectral signatures of vegetation on a green roof.
The spectral device provides radiometrically calibrated spectral signatures of the plants under investigation. A Spectralon panel was employed as the white reference. For each sample, three spectra were collected by rotating the instrument by 90 degrees and then averaged in order to detect one representative spectral measurement per plant. For each measurement, the absence of shadows due to the pistol grip falling in the instrument field of view was carefully checked. Spectral data were measured between 11:30 and 13:00 on clear days.
2.3. Vegetation Spectral Features and Indices
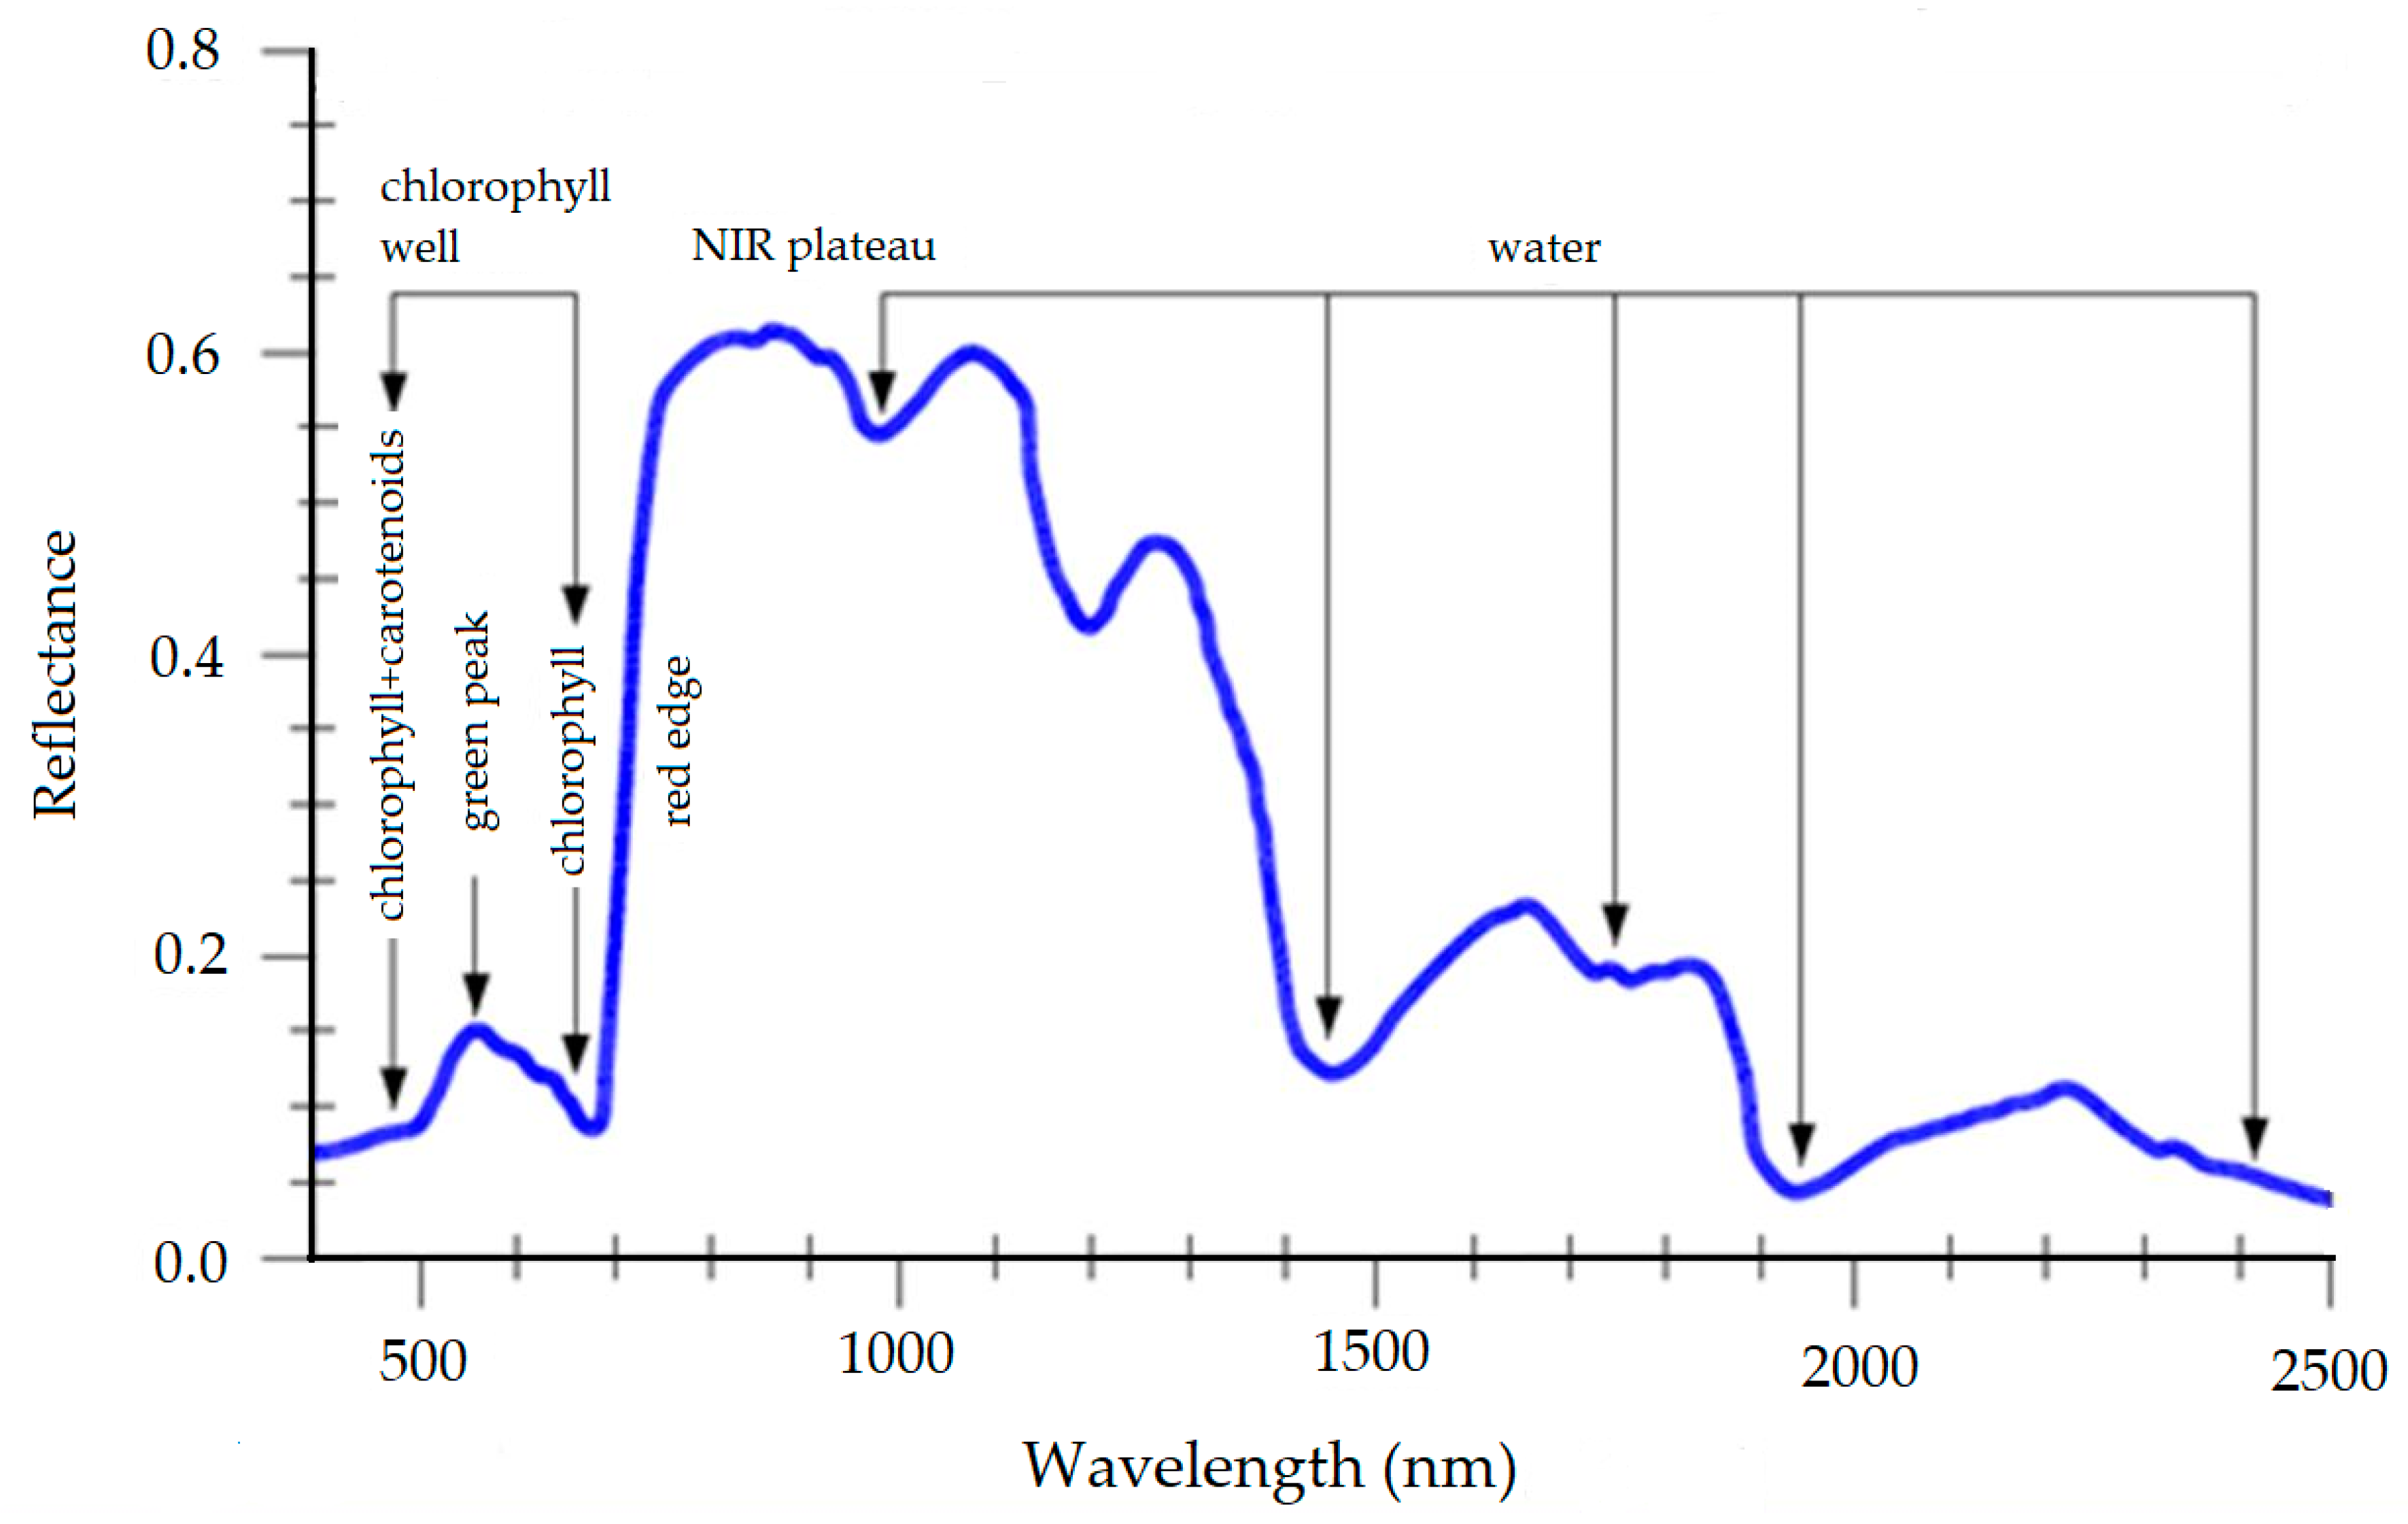
Figure 4 presents the typical healthy vegetation spectral signature characterized by two evident peaks in the green (540 nm) and in the near-infrared (690–720 nm) wavelengths, green peaks and red edge, respectively; by two minima in correspondence with the pigment absorption peaks at wavelengths 420–490 nm and 660 nm (chlorophyll wells) and by the NIR plateau in the near infrared region 720–1200 nm. The red edge is another characteristic feature of the leaf spectral signature. It is located at wavelengths where reflectance rises from low values, due to the absorption of chlorophyll in the red wavelengths of the visible region (600–700 nm), to higher values in the near infrared region, related to the internal structure of the leaves and to the water content. In the near infrared region, healthy leaves are generally characterized by high values of reflectance and transmittance. In the plant senescence stage, and when the plant is unhealthy, chlorophyll degrades quicker than carotenoids, among the pigments. This entails a significant increase of reflectance in the red wavelengths of the visible region, as the absorption due to the chlorophyll is remarkably reduced. Furthermore, the leaf reflectance in the NIR region initially increases and successively diminishes when cells deteriorate [17].
These qualitative observations of spectral signatures can be quantified via the introduction of vegetation indices [26]. Most of the VIs have been empirically determined combining bands associated to the specific features of the vegetation spectral signatures. As far as stress state detection is concerned, since stressing agents affect specific wavelengths related to the physiological characteristics of plants, bands that are sensitive and insensitive to stress are combined to detect the plant health state. Several VIs have been introduced in order to enhance a specific canopy reflectance feature or to minimize atmospheric errors, soil background scattering, etc. Vegetation indices are based on Green, Red, Visible (VIS) and NIR bands, because vegetation exhibits unique reflectance properties in these bands which can be used to measure the development and stress state of a plant. References [27,28] present a useful and complete review of vegetation indices available in the literature, discussing their specific applicability and representativeness according to the vegetation, environment and implementation precision. In field applications, as the one proposed in this contribution, a VI’s suitability is usually tailored to the specific application requirements coupled with appropriate validation tools and methodologies on the ground [28].
In this contribution, we explored the capability of VIs to detect stress due to the presence of drought. With respect to References [27,28], we focused on fewer indices, i.e., the broadband indices, because they are more consolidated than narrowband indices due to their recurrence in the literature. In Table 1, the list of VIs used in this study is provided. ρ refers to reflectance and the subscripts refer to specific spectral bands or wavelengths (i.e., NIR refers to the average in the band interval 750–1100 nm, VIS to the average in the band interval 580–750 nm, RED to the average in the band interval 600–700 nm and GREEN to the average in the band interval 500–600 nm).
In order to evaluate the performance of the VIs presented in this study, the VI contrast, VIcontrast, defined as the difference between the maximum and minimum values assumed by each index, divided by the average among the two values, was examined.
It was assumed that “healthy” and “unhealthy” plants may be associated with the extreme values assumed by each index, consistently with their mathematical definition. The VI contrast was then employed to identify those indices that showed the most remarkable variations.
3. Results
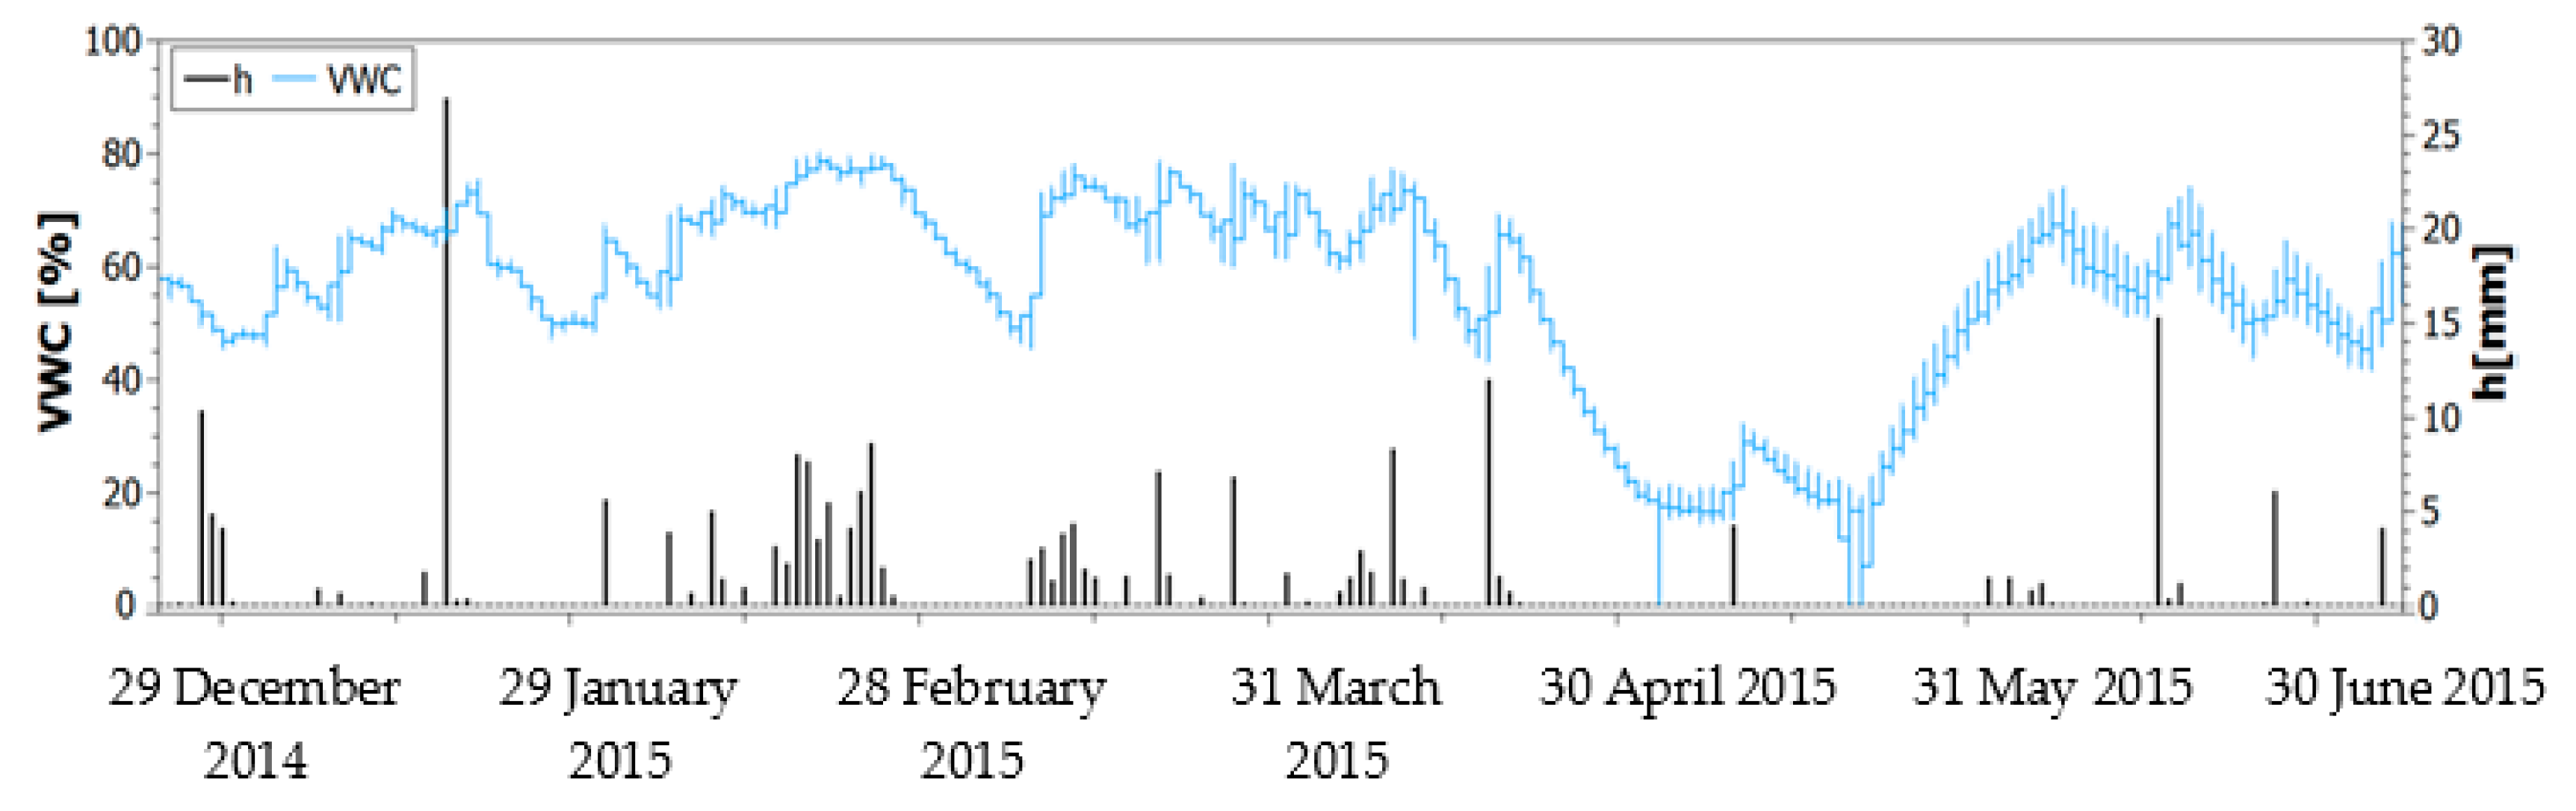
The spectra of plants in a healthy and unhealthy state for the three species monitored in this study (not shown) highlighted that spectral signatures of plants in a healthy state presented the characteristic behaviour of vegetation described in Reference [20] and briefly described in the introduction. In Reference [25], a preliminary investigation of the trend of a limited number of vegetation indices within the monitoring period for all the species under investigation is presented. All trends revealed an initial suffering period (December 2014–March 2015) after which the vegetation health improved. In this contribution, we investigated a wider number of vegetation indices and correlated their trend with the soil normalized volumetric water content (VWC), also called effective saturation, as well as with the relevant meteorological parameters monitored during the acquisition period through the analysis of variance (ANOVA) approach. Figure 2 shows the daily and the longer period fluctuations of the volumetric water content. During wintertime, the daily variations of VWC were less pronounced due to the lower evapotranspiration. Because of the lack of precipitations and anomalous weather conditions during the second half of April, the VWC values dropped from over 75% to roughly 20%. The increase in the VWC during the second half of May corresponded to the activation of the sprinkler system.
Table 2 presents the VIcontrast obtained for the investigated broadband indices. For each VI, the extreme values (minimum and maximum values) within the time-series were identified. Several indices showed an appreciable variation during the monitoring period. Remarkably, several indices showed higher VIcontrast than the NDVI index, which was one of the most widely used in the literature.
In order to confirm the outcomes of this qualitative analysis and to perform a quantitative assessment, the suitability of the investigated indices to discriminate green roof vegetation health state was evaluated through the ANOVA [29,30]. Table 3, Table 4 and Table 5 present the results of a one-way ANOVA. Four different water content (Θ) levels were identified (Θ < 20%; 20% < Θ < 45%; 45% < Θ < 60%; Θ > 60%) as well as the average vegetation indices (with related F- and p-values) for each water content level and plant species. From the results, 6, 9 and 12 out of the 14 indices showed a significant difference between the four water content categories at the p = 0.05 level for Carpobrotus, Cerastium and Dianthus, respectively. Carpobrotus belongs to the succulent plant family and for this reason a lower number of indices was significant for that species compared to the other two species under investigation. It is worth noting that vegetation indices commonly used in literature were developed for shrubs or bushes [29] which present characteristics different than succulent plants.
For Cerastium and Dianthus, all vegetation indices increased as the water content increased until Θ < 60%, indicating healthy crops, while they decreased for Θ > 60%, probably due to the excessive water content. For Carpobrotus, this trend was not confirmed due to its lesser water demand. The ANOVA test partially confirmed the VIcontrast results shown in Table 2. In fact, the most significant indices resulted to be IRG, Red NDVI and EVI for Carpobrotus; Red RVI, Red NDVI, OSAVI, MTVI, MSAVI, MSR, SR, EVI and NDVI for Cerastium; and Red DVI, IRG, Red RVI, Red NDVI, OSAVI, RDVI, EVI, MTVI, MSAVI, GEMI and TVI for Dianthus. By comparing the one-way ANOVA with VIcontrast results, MTVI was not significant for Carpobrotus and MSR was not significant for Dianthus.
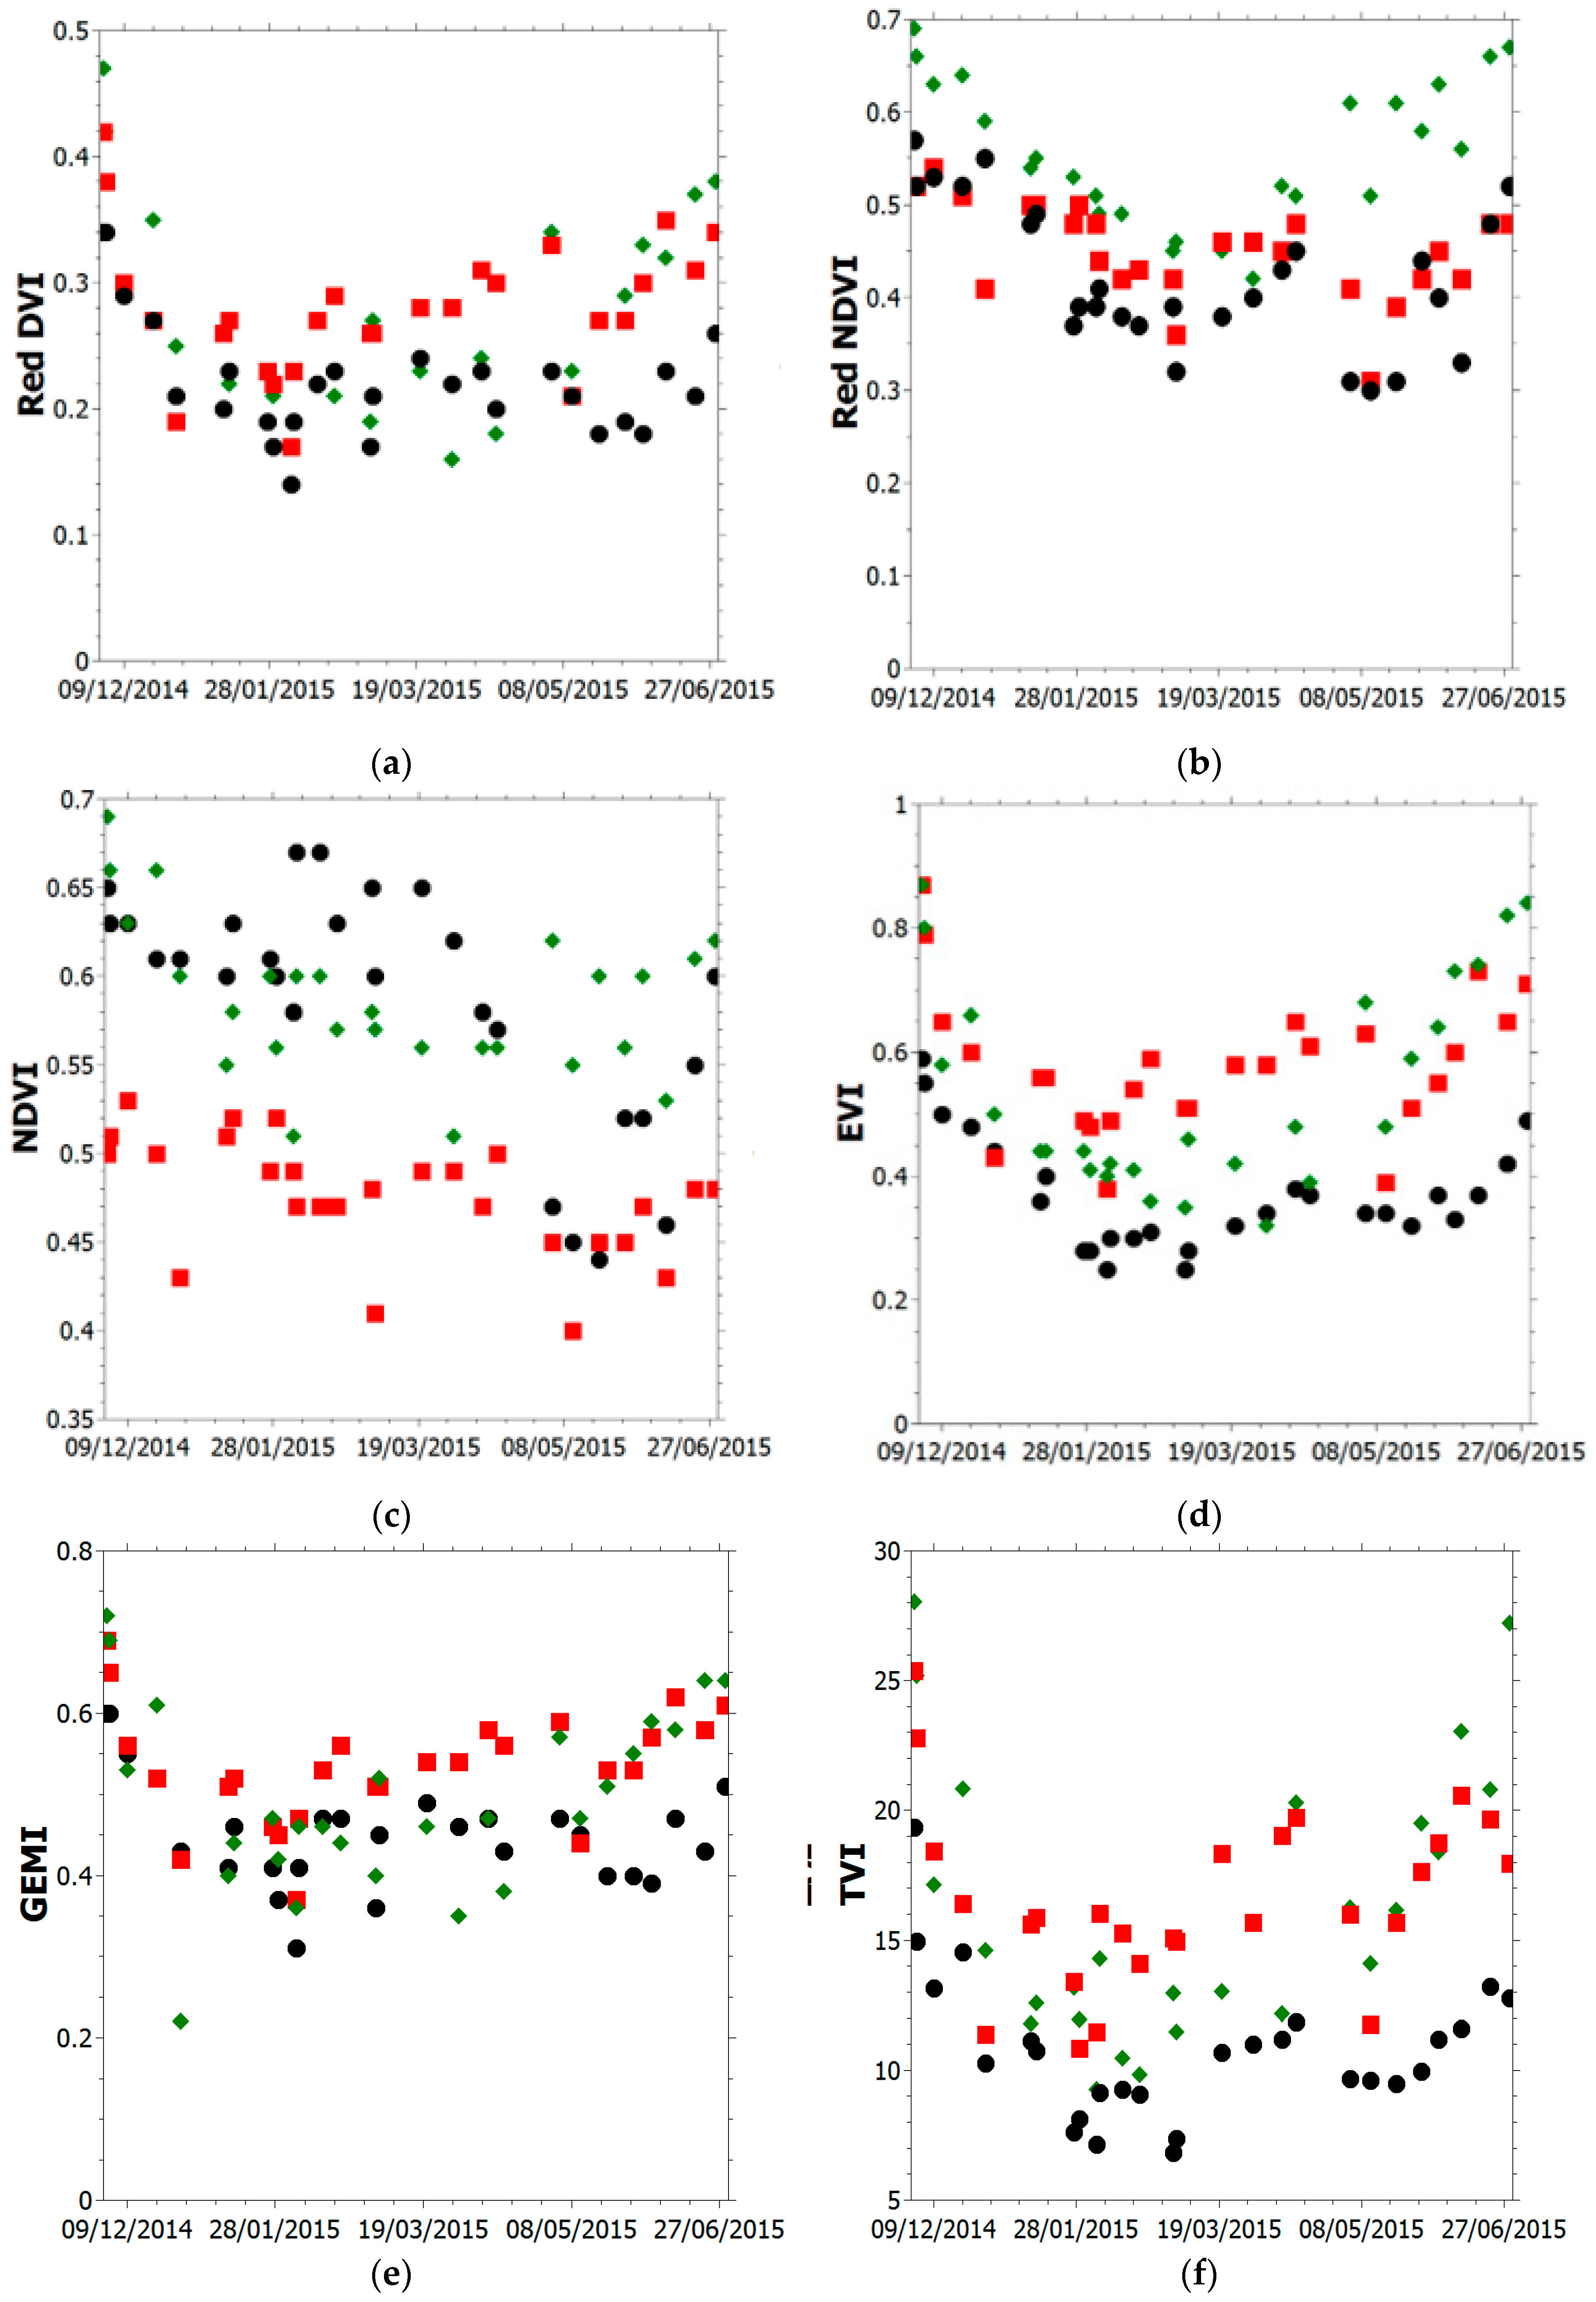
Figure 5 shows the trend within the monitoring period of the broadband VIs selected according to the VIcontrast analysis and the ANOVA test applied for the three plant species installed over the green roof. The x-axes indicate the time interval, while the y-axes indicate the corresponding VI values (dimensionless). The analysis of Figure 5 makes it possible to evaluate the eco-physiological status of the single species installed on the green roof and to understand the VI trend according to the plant health state. In fact, due to its formulation, the VIcontrast is positive by definition and it does not provide such information.
The trends reflected an initial suffering period (December 2014–March 2015) related to the cold winter climate for the Mediterranean environment, the worsening related to anomalous weather conditions in May and the health improvement after the sprinkler system activation. The suffering period coincided with low average values of air temperature and solar radiation registered by the monitoring station. During the winter months, the daily air temperature varied between 0 °C and 15 °C (average value of 9 °C), whereas solar radiation was between 1 MJ/(m2day) and 16 MJ/(m2day) (Figure 1). The general conditions in the green roof vegetation improved in springtime except for the first week of May, when air temperature rose to 28 °C and average daily solar radiation was 26.5 MJ/(m2day). The lack of precipitation, the high temperature and solar radiation values determined dryness and water shortage. To prevent the plant dying, the sprinkler system on the roof was activated. The plants benefited from this and a clear change in the indices was recorded.
Figure 5 also makes it possible to establish which species were affected the most. In fact, the absolute value of the indices and their variations make it possible to conclude that Carpobrotus was the most distressed species during the monitoring period. These assessments reflect the real state of the plants observed during the entire acquisition period. Figure 5 clearly shows that VI values differed from one phenological stage to another. Each VI had its own unique phenological diagram. Nevertheless, a consistent behaviour could be recognized. In fact, Red DVI, Red NDVI, EVI, MTVI, GEMI, TVI and NDVI decreased when a stress state occurred.
4. Discussion and Conclusions
The results of the monitoring field survey highlight the versatility of the hyperspectral apparatus. Sampling turned out to be rapid, portable, non-destructive and applicable to scales from leaf to canopy. The computation of vegetation indices turned out to be a fast and efficient way to manage the huge amount of data provided by the sensing device. The comparison of the indices demonstrated the possibility of estimating the plant eco-physiological state, highlighting the presence of unhealthy vegetation due to the presence of drought. The measurements carried out showed that the stress effects on the physiology of the plant may occur beyond the visible region and, in particular, in the near infrared region. The availability of a wide range of wavelengths is, thus, an indispensable element to highlight the state of stress of plants. Due to the remarkable performances of the broadband indices Red DVI, SR and TVI in highlighting the vegetation health state, the use of more than one VI is suggested for monitoring the green roof plants’ health condition and optimising the device functioning.
Results confirmed the low performance of the NDVI index in detecting a worsening of a plant health state and justify the interest in the development of new indices, which are less sensitive to external influences as is the NDVI. These indices are theoretically more reliable than NDVI, although their extensive use in detecting the vegetation health state is recent.
Recalling the mandatory characteristics of green roof plants, i.e., fast and efficient reproducibility, shortness in height and cushion-forming, shallow and spreading roots and succulent leaves [16], the three canopy species planted in the University of Calabria’s green roof appear particularly suited to guarantee the performance of the green roof assuming proper operative procedures for real-time monitoring of their health condition are set-up.
In this contribution, vegetation detection and a health state investigation were conducted employing broadband indices. Nevertheless, the hyperspectral sensors provided high-spectral resolution data that may be profitably employed to compute narrowband indices that are likely to be more effective to characterize vegetation.
Author Contributions
M.M. and P.P. conceived and designed the experiments; M.M. and M.P. performed the experiments; M.M., P.P. and M.P. analysed the data; M.M. and M.P. wrote the paper.
Funding
This work was partially financially supported within the project “Integrated and sustainable management service for the water–energy cycle in urban drainage systems” of the National Operational Program—Research and Competitiveness 2007–2013 (PON-REC), co-financed by the European Regional Development Fund and National Resources Grant.
Conflicts of Interest
The authors declare no conflict of interest. The funders had no role in the design of the study; in the collection, analyses, or interpretation of data; in the writing of the manuscript, or in the decision to publish the results.
References
- Eea-foen, J. Landscape Fragmentation in Europe—EEA Report N.2/2011. 2011. Available online: https://spectrum.library.concordia.ca/981303/ (accessed on 2 July 2019).
- Marsalek, J.; Cisneros, B.J.; Karamouz, M.; Malmquist, P.A.; Goldenfum, J.A.; Chocat, B. Urban Water Cycle Processes and Interactions: Urban Water Series-UNESCO-IHP; CRC Press: Boca Raton, FL, USA, 2008; Volume 2. [Google Scholar]
- Maksimović, Č.; Prodanović, D.; Boonya-Aroonnet, S.; Leitao, J.P.; Djordjević, S.; Allitt, R. Overland flow and pathway analysis for modelling of urban pluvial flooding. J. Hydraul. Res. 2009, 47, 512–523. [Google Scholar] [CrossRef]
- Piro, P.; Carbone, M.; Tomei, G. Assessing settleability of dry and wet weather flows in an urban area serviced by combined sewers. Water Air Soil Pollut. 2011, 214, 107–117. [Google Scholar] [CrossRef]
- Oleson, K.W.; Bonan, G.B.; Feddema, J.; Jackson, T. An examination of urban heat island characteristics in a global climate model. Int. J. Climatol. 2011, 31, 1848–1865. [Google Scholar] [CrossRef]
- Li, H.; Harvey, J.; Jones, D. Cooling Effect of Permeable Asphalt Pavement Under Dry and Wet Conditions. Transp. Res. Rec. J. Transp. Res. Board 2013, 2372, 97–107. [Google Scholar] [CrossRef]
- Bevilacqua, P.; Coma, J.; Pérez, G.; Chocarro, C.; Juárez, A.; Solé, C.; Cabeza, L.F. Plant cover and floristic composition effect on thermal behaviour of extensive green roofs. Build. Environ. 2015, 92, 305–316. [Google Scholar] [CrossRef] [Green Version]
- Garofalo, G.; Palermo, S.; Principato, F.; Theodosiou, T.; Piro, P. The influence of hydrologic parameters on the hydraulic efficiency of an extensive green roof in mediterranean area. Water 2016, 8, 44. [Google Scholar] [CrossRef]
- Brunetti, G.; Šimůnek, J.; Piro, P. A comprehensive numerical analysis of the hydraulic behavior of a permeable pavement. J. Hydrol. 2016, 540, 1146–1161. [Google Scholar] [CrossRef] [Green Version]
- Brunetti, G.; Šimůnek, J.; Turco, M.; Piro, P. On the use of surrogate-based modeling for the numerical analysis of Low Impact Development techniques. J. Hydrol. 2017, 548, 263–277. [Google Scholar] [CrossRef] [Green Version]
- Viola, F.; Hellies, M.; Deidda, R. Retention performance of green roofs in representative climates worldwide. J. Hydrol. 2017, 553, 763–772. [Google Scholar] [CrossRef] [Green Version]
- Niachou, A.; Papakonstantinou, K.; Santamouris, M.; Tsangrassoulis, A.; Mihalakakou, G. Analysis of the green roof thermal properties and investigation of its energy performance. Energy Build. 2001, 33, 719–729. [Google Scholar] [CrossRef]
- Brunetti, G.; Porti, M.; Piro, P. Multi-level numerical and statistical analysis of the hygrothermal behavior of a non-vegetated green roof in a mediterranean climate. Appl. Energy 2018, 221, 204–219. [Google Scholar] [CrossRef]
- Schultz, I.; Sailor, D.J.; Starry, O. Effects of substrate depth and precipitation characteristics on stormwater retention by two green roofs in Portland OR. J. Hydrol. Reg. Stud. 2018, 18, 110–118. [Google Scholar] [CrossRef]
- Maiolo, M.; Carini, M.; Capano, G.; Piro, P. Synthetic Sustainability Index (SSI) based on Life Cycle Assessment approach of Low Impact Development in the Mediterranean Area. Cogent Eng. 2017, 4, 1410272. [Google Scholar] [CrossRef]
- Li, W.C.; Yeung, K.K.A. A comprehensive study of green roof performance from environmental perspective. Int. J. Sustain. Built Environ. 2014, 3, 127–134. [Google Scholar] [CrossRef] [Green Version]
- Sims, A.D.; Gamon, J.A. Relationships between leaf pigment content and spectral reflectance across a wide range of species, leaf structures and developmental stages. Remote Sens. Environ. 2002, 81, 337–354. [Google Scholar] [CrossRef]
- Zarco-Tejada, P.J.; Morales, A.; Testi, L.; Villalobos, F.J. Spatio-temporal patterns of chlorophyll fluorescence and physiological and structural indices acquired from hyperspectral imagery as compared with carbon fluxes measured with eddy covariance. Remote Sens. Environ. 2013, 133, 102–115. [Google Scholar] [CrossRef]
- Manzo, C.; Mei, A.; Zampetti, E.; Bassani, C.; Paciucci, L.; Manetti, P. Top-down approach from satellite to terrestrial rover application for environmental monitoring of landfills. Sci. Total Environ. 2017, 584–585, 1333–1348. [Google Scholar] [CrossRef] [PubMed]
- Ollinger, S.V. Sources of variability in canopy reflectance and the convergent properties of plants. New Phytol. 2011, 189, 375–394. [Google Scholar] [CrossRef]
- Anderson, K.; Gaston, K.J. Lightweight unmanned aerial vehicles will revolutionize spatial ecology. Front. Ecol. Environ. 2013, 11, 138–146. [Google Scholar] [CrossRef] [Green Version]
- Li, L.; Zhang, Q.; Huang, D. A review of imaging techniques for plant phenotyping. Sensors 2014, 14, 20078–20111. [Google Scholar] [CrossRef]
- Thenkabail, P.S.; Smith, R.B.; De-Pauw, E. Evaluation of narrowband and broadband vegetation indices for determining optimal hyperspectral wavebands for agricultural crop characterization. Photogramm. Eng. Remote Sens. 2002, 68, 607–621. [Google Scholar]
- Gilabert, M.A.; Gonzalez-Piqueras, J.; Garcia-Haro, F.J.; Melia, J. A generalized soil-adjusted vegetation index. Remote Sens. Environ. 2002, 82, 303310. [Google Scholar] [CrossRef]
- Piro, P.; Porti, M.; Veltri, S.; Lupo, E.; Moroni, M. Hyperspectral Monitoring of Green Roof Vegetation Health State in Sub-Mediterranean Climate: Preliminary Results. Sensors 2017, 17, 662. [Google Scholar] [CrossRef] [PubMed]
- Moroni, M.; Lupo, E.; Cenedese, A. Hyperspectral Proximal Sensing of Salix Alba Trees in the Sacco River Valley (Latium, Italy). Sensors 2013, 13, 14633–14649. [Google Scholar] [CrossRef] [PubMed] [Green Version]
- Agapiou, A.; Hadjimitsis, D.G.; Alexakis, D.D. Evaluation of Broadband and Narrowband Vegetation Indices for the Identification of Archaeological Crop Marks. Remote Sens. 2012, 4, 3892–3919. [Google Scholar] [CrossRef] [Green Version]
- Xue, J.; Su, B. Significant Remote Sensing Vegetation Indices: A Review of Developments and Applications. J. Sens. 2017, 2017, 1353691. [Google Scholar] [CrossRef]
- Mutanga, O.; Skidmore, A.K.; van Wieren, S. Discriminating tropical grass (Cenchrus ciliaris) canopies grown under different nitrogen treatments using spectroradiometry. ISPRS J. Photogramm. Remote Sens. 2003, 57, 263–272. [Google Scholar] [CrossRef]
- Vaiphasa, C.; Ongsomwang, S.; Vaiphasa, T.; Skidmore, A.K. Tropical mangrove species discrimination using hyperspectral data: A laboratory study. Estuar. Coast. Shelf Sci. 2005, 65, 371–379. [Google Scholar] [CrossRef]
Figure 1.
Relevant meteorological parameters (i.e., temperature and solar radiation) monitored during the field survey.
Figure 1.
Relevant meteorological parameters (i.e., temperature and solar radiation) monitored during the field survey.

Figure 2.
Normalized Volumetric Water Content (VWC) and precipitations monitored during the field survey.
Figure 2.
Normalized Volumetric Water Content (VWC) and precipitations monitored during the field survey.

Figure 3.
Spectroradiometer measuring spectral signatures of vegetation on a green roof (Piro et al. 2017).
Figure 3.
Spectroradiometer measuring spectral signatures of vegetation on a green roof (Piro et al. 2017).

Figure 4.
Typical healthy vegetation spectral signature.

Figure 5.
Vegetation indices during the monitoring period. Carpobrotus, Cerastium and Dianthus VIs are indicated with black, red and green marks, respectively. (a) Red DVI; (b) Red NDVI; (c) NDVI; (d) EVI; (e) GEMI; (f) TVI; (g) MTVI
Figure 5.
Vegetation indices during the monitoring period. Carpobrotus, Cerastium and Dianthus VIs are indicated with black, red and green marks, respectively. (a) Red DVI; (b) Red NDVI; (c) NDVI; (d) EVI; (e) GEMI; (f) TVI; (g) MTVI


Table 1.
Vegetation indices investigated.
| Vegetation indices | VI acronym | Equation |
|---|---|---|
| Red Difference Vegetation Index | Red DVI | |
| Red Green Ratio Index | IRG | |
| Red Ratio Vegetation Index | Red RVI | |
| Simple Ratio | SR | |
| Red Normalized Difference Vegetation Index | Red NDVI | |
| Normalized Difference Vegetation Index | NDVI | |
| Optimized Soil Adjusted Vegetation Index | OSAVI | |
| Renormalized Difference Vegetation Index | RDVI | |
| Enhanced Vegetation Index | EVI | |
| Modified Simple Ratio | MSR | |
| Modified Triangular Vegetation Index | MTVI | |
| Modified Soil Adjusted Vegetation Index | MSAVI | |
| Global Environment Monitoring Index | GEMI | |
| Triangular Vegetation Index | TVI |
Table 2.
Vegetation indices’ (VI) performance.
| Vegetation Index | Carpobrotus VIcontrast (%) | Cerastium VIcontrast (%) | Dianthus VIcontrast (%) |
|---|---|---|---|
| Red DVI | 85.58 | 82.70 | 98.51 |
| IRG | 65.76 | 23.71 | 94.95 |
| Red RVI | 27.64 | 32.58 | 42.50 |
| SR | 69.33 | 54.87 | 76.58 |
| Red NDVI | 61.15 | 53.98 | 48.34 |
| NDVI | 42.59 | 27.81 | 29.90 |
| OSAVI | 58.70 | 52.46 | 61.51 |
| RDVI | 62.08 | 58.24 | 74.77 |
| EVI | 80.70 | 77.72 | 91.71 |
| MSR | 84.62 | 71.69 | 90.35 |
| MTVI | 117.01 | 85.85 | 103.79 |
| MSAVI | 40.37 | 41.69 | 49.47 |
| GEMI | 64.14 | 60.20 | 105.33 |
| TVI | 95.80 | 80.22 | 100.65 |
Table 3.
Analysis of variance for Carpobrotus vegetation indices for different water content levels (Θ).
Table 3.
Analysis of variance for Carpobrotus vegetation indices for different water content levels (Θ).
| Vegetation Index | Θ < 20% | 20% < Θ < 45% | 45% < Θ < 60% | Θ > 60% | F-Value | p-Value |
|---|---|---|---|---|---|---|
| Red DVI | 0.22 | 0.20 | 0.22 | 0.19 | 0.40 | 0.759 |
| IRG | 1.32 | 1.52 | 1.34 | 1.84 | 10.36 * | 0.002 |
| Red RVI | 1.89 | 1.80 | 2.03 | 1.92 | 0.72 | 0.559 |
| SR | 2.40 | 2.25 | 2.82 | 2.42 | 3.42 | 0.053 |
| Red NDVI | 0.50 | 0.53 | 0.57 | 0.62 | 9.94 * | 0.002 |
| NDVI | 0.40 | 0.37 | 0.46 | 0.41 | 4.06 * | 0.040 |
| OSAVI | 0.45 | 0.42 | 0.51 | 0.45 | 3.51 | 0.053 |
| RDVI | 0.29 | 0.27 | 0.32 | 0.28 | 2.03 | 0.188 |
| EVI | 0.39 | 0.32 | 0.40 | 0.31 | 8.20 * | 0.008 |
| MSR | 0.74 | 0.68 | 0.91 | 0.76 | 5.99 * | 0.013 |
| MTVI | 0.20 | 0.15 | 0.23 | 0.15 | 1.41 | 0.302 |
| MSAVI | 1.19 | 1.15 | 1.18 | 1.10 | 3.60 | 0.054 |
| GEMI | 0.45 | 0.42 | 0.45 | 0.40 | 0.35 | 0.789 |
| TVI | 10.39 | 10.60 | 11.51 | 8.95 | 6.35 * | 0.027 |
* Significant at the 0.05 level.
Table 4.
Analysis of variance for Cerastium vegetation indices for different water content levels (Θ).
Table 4.
Analysis of variance for Cerastium vegetation indices for different water content levels (Θ).
| Vegetation Index | Θ < 20% | 20% < Θ < 45% | 45% < Θ < 60% | Θ > 60% | F-Value | p-Value |
|---|---|---|---|---|---|---|
| Red DVI | 0.28 | 0.29 | 0.31 | 0.28 | 0.88 | 0.480 |
| IRG | 1.11 | 1.08 | 1.03 | 1.05 | 1.38 | 0.295 |
| Red RVI | 1.99 | 2.02 | 2.10 | 2.17 | 8.98 * | 0.003 |
| SR | 2.48 | 2.53 | 2.72 | 2.89 | 7.70 * | 0.006 |
| Red NDVI | 0.46 | 0.46 | 0.47 | 0.50 | 4.90 * | 0.021 |
| NDVI | 0.42 | 0.43 | 0.46 | 0.48 | 7.30 * | 0.006 |
| OSAVI | 0.51 | 0.52 | 0.55 | 0.57 | 5.23 * | 0.017 |
| RDVI | 0.34 | 0.35 | 0.38 | 0.37 | 1.42 | 0.289 |
| EVI | 0.55 | 0.58 | 0.65 | 0.59 | 7.36 * | 0.009 |
| MSR | 0.79 | 0.81 | 0.89 | 0.95 | 5.36 * | 0.016 |
| MTVI | 0.29 | 0.30 | 0.34 | 0.33 | 3.83 * | 0.046 |
| MSAVI | 1.32 | 1.34 | 1.38 | 1.32 | 4.78 * | 0.029 |
| GEMI | 0.54 | 0.55 | 0.57 | 0.54 | 2.95 | 0.085 |
| TVI | 15.82 | 16.48 | 18.44 | 15.59 | 1.38 | 0.311 |
* Significant at the 0.05 level.
Table 5.
Analysis of variance for Dianthus vegetation indices for different water content levels (Θ).
Table 5.
Analysis of variance for Dianthus vegetation indices for different water content levels (Θ).
| Vegetation Index | Θ < 20% | 20% < Θ < 45% | 45% < Θ < 60% | Θ > 60% | F-Value | p-Value |
|---|---|---|---|---|---|---|
| Red DVI | 0.19 | 0.26 | 0.31 | 0.27 | 10.67 * | 0.002 |
| IRG | 1.19 | 1.11 | 0.95 | 1.24 | 6.88 * | 0.006 |
| Red RVI | 2.23 | 2.56 | 2.57 | 2.34 | 7.60 * | 0.008 |
| SR | 3.01 | 3.97 | 4.17 | 3.33 | 1.25 | 0.344 |
| Red NDVI | 0.56 | 0.61 | 0.58 | 0.61 | 13.82 * | 0.002 |
| NDVI | 0.50 | 0.58 | 0.60 | 0.53 | 6.18 * | 0.039 |
| OSAVI | 0.53 | 0.65 | 0.68 | 0.61 | 11.64 * | 0.001 |
| RDVI | 0.31 | 0.40 | 0.43 | 0.38 | 12.81 * | 0.001 |
| EVI | 0.40 | 0.56 | 0.67 | 0.50 | 11.09 * | 0.002 |
| MSR | 1.00 | 1.31 | 1.37 | 1.11 | 1.54 | 0.255 |
| MTVI | 0.24 | 0.35 | 0.41 | 0.31 | 5.36 * | 0.018 |
| MSAVI | 1.10 | 1.27 | 1.36 | 1.28 | 11.77 * | 0.001 |
| GEMI | 0.41 | 0.51 | 0.56 | 0.52 | 10.82 * | 0.001 |
| TVI | 16.88 | 15.59 | 18.68 | 14.34 | 7.53 * | 0.014 |
* Significant at the 0.05 level.
© 2019 by the authors. Licensee MDPI, Basel, Switzerland. This article is an open access article distributed under the terms and conditions of the Creative Commons Attribution (CC BY) license (http://creativecommons.org/licenses/by/4.0/).
Share and Cite
MDPI and ACS Style
Moroni, M.; Porti, M.; Piro, P. Design of a Remote-Controlled Platform for Green Roof Plants Monitoring via Hyperspectral Sensors. Water 2019, 11, 1368. https://doi.org/10.3390/w11071368
AMA Style
Moroni M, Porti M, Piro P. Design of a Remote-Controlled Platform for Green Roof Plants Monitoring via Hyperspectral Sensors. Water. 2019; 11(7):1368. https://doi.org/10.3390/w11071368
Chicago/Turabian StyleMoroni, Monica, Michele Porti, and Patrizia Piro. 2019. "Design of a Remote-Controlled Platform for Green Roof Plants Monitoring via Hyperspectral Sensors" Water 11, no. 7: 1368. https://doi.org/10.3390/w11071368
Note that from the first issue of 2016, this journal uses article numbers instead of page numbers. See further details here.