Effect of Frequency of Multi-Source Water Supply on Regional Guarantee Rate of Water Use


Renewable Energy School, North China Electric Power University, Beijing 102206, China
*
Author to whom correspondence should be addressed.
Water 2019, 11(7), 1356; https://doi.org/10.3390/w11071356
Submission received: 23 May 2019
/
Revised: 22 June 2019
/
Accepted: 27 June 2019
/
Published: 29 June 2019
(This article belongs to the Special Issue Sustainable Management of Urban Water Resources)
Abstract
:Multi-source, combined water supply models play an increasingly important role in solving regional water supply problems. At present, in the area of regional water supply, models are mainly used to study the problem of overall water guarantee rate, and do not take into account the impact of the uncertainty of multi-source water supplies on water supply risk. There is also a lack of research on how changes in multi-source water supplies affect sub-region and sub-user water guarantee rates. To address this knowledge gap, the encounter probability of different frequencies and a refined water resources allocation model of multi-source supplies were used. Using Tianjin as an example, this paper studies the quantitative relationship between the uncertainty of multi-source water inflows and the regional guarantee rate of water use. The objectives of the study are to analyze the changing trend of the water shortage rate and the main body of water supply in each region, and to quantitatively describe the influence of the variation of multi-source water supply on the main body of water supply for users. The results show that under the same requirement of guarantee rate for water use, as the number of water diversion sources increase, the probability of water supply meeting the water use rate increases significantly, and the risk to water supplies decreases. At the same time, suburban areas have a low dependence on external water supplies, while the change in the quantity of external water sources has a great impact on the water supply of the Zhongxinchengqu and Binhaixiqnu areas. The distribution and main body of water supply will change for different water users. Therefore, it is important to ensure a stable supply of external water for maintaining the guarantee rate of regional water use.
1. Introduction
Because of rapid population growth and rapid urbanization, the demand for water resources has greatly increased [1], while water shortages are becoming increasingly serious because of, inter alia, climate change and water pollution [2,3,4,5]. Many regions in the world are facing serious water crises and water conflicts [6,7]. Multi-source, combined water supply modes, based on inter-basin water transfers have become an important means for solving urban water supply problems [8,9]. Many countries have planned and implemented a large number of inter-basin water transfer projects [10,11,12], such as China’s South-to-North Water Diversion project [13,14,15,16] and California’s State Water Project [17]. Inter-basin water transfers alleviate the uneven distribution of water resources through artificial redistribution, and balance the mismatch between water demand and water resources. However, there are disadvantages as well as advantages in the multi-water supply model approach [18]. On the one hand, inter-basin water transfers provide a new water supply source for the water supply system. Multiple water sources can supplement each other to avoid water shortages caused by insufficient water supply from a single water source in low-flow years, and thus effectively reduce the risks to water supplies [19]. On the other hand, because of the differences in water quality, project scale, and water price of the various external water sources [20,21], the competition between multiple water sources is likely to lead to water conflicts in the water distribution process [22]. Therefore, it is of great importance to study the joint water supply from multiple sources for the rational allocation of water resources, the quantification of water guarantee rates, and the assurance of water supply engineering benefits.
One current aspect of multi-source water supply research is to provide or simulate the water supply from each source, and then carry out water-distribution modeling using an optimized allocation model. For example, Montazar et al. studied the combined use of water in irrigation areas, an integrated soil water balance algorithm was coupled to a non-linear optimization model in order to carry out water allocation planning in complex deficit agricultural water resources systems based on an economic efficiency criterion [23]. Based on an integrated GSFLOW model, Wu et al. studied and optimized the combined use of surface water and groundwater in the Heihe River basin of China to alleviate the water conflict between agriculture and ecosystems [24]. Another aspect of multi-source water supply research is to take the amount of water resources as an uncertain condition to determine the upper and lower limits of available water resources, and then simulate the allocation of water resources. For example, Fu et al. adopted a two-stage, interval, stochastic planning method, introduced a risk preference, and carried out research on water resource allocation optimization, using an uncertain stochastic planning model based on risk values for the Sanjiang Plain [25]. Suo et al. proposed a comprehensive solution method for multi-objective, interval programming using fuzzy linear programming and an interactive two-step method, and applied this method to the case study of uncertain multi-water resource joint scheduling planning in eastern Handan, China [26]. In some studies, the above simulation was carried out using typical schemes for the interaction between multiple water sources in high-flow and low-flow years. For example, Yu et al. researched the optimal allocation of water resources in Tianjin based on two scheduling objectives for a system network topology (social benefit and water supply cost) by establishing a multi-source joint scheduling model of the urban water supply system [27]. To address regional water resources allocation under two correlated hydrological random variables and interval parameters, Chen et al. proposed a couple-based interval-bistochastic programming (CIBSP) method. To demonstrate the applicability, the CIBSP method is applied to the Zhanghe Irrigation District located in Hubei Province, Yangtze River basin of China, to optimally allocate available water resources to the municipality, industry, hydropower, and agriculture [28].
In essence, the optimization of the allocation of water resources is a highly complicated risk decision problem [29,30,31]. The uncertainty in water supply will directly affect the change of water guarantee rate for different water users, and have a great impact on the results of the water resources allocation. However, there is a lack of research on the impact of the uncertainty of multi-source water inflows, and on the probability of combination encounters of water supply risk. There is a lack of research on the impact of water quantity change from multiple water sources on water guarantee rates and the water supply composition for different regions and users. Therefore, the overall objective of this paper is to combine the encounter probability of different frequencies of multiple water sources and a refined water resources allocation model. The specific objectives are to study the quantitative relationship between the uncertainty of multi-source water supplies and the regional water guarantee rate, clarify the water supply schemes for different sources under specific water guarantee rates, and analyze the changing trend of the water shortage rate of users and the main body of water supply in different regions. In addition, the changing trend in water shortage rates for users and the main body of water supply in each region are analyzed, and the influence of the change in multi-source water supply quantity on the main body of water supply is quantitatively described.
2. The Study Area
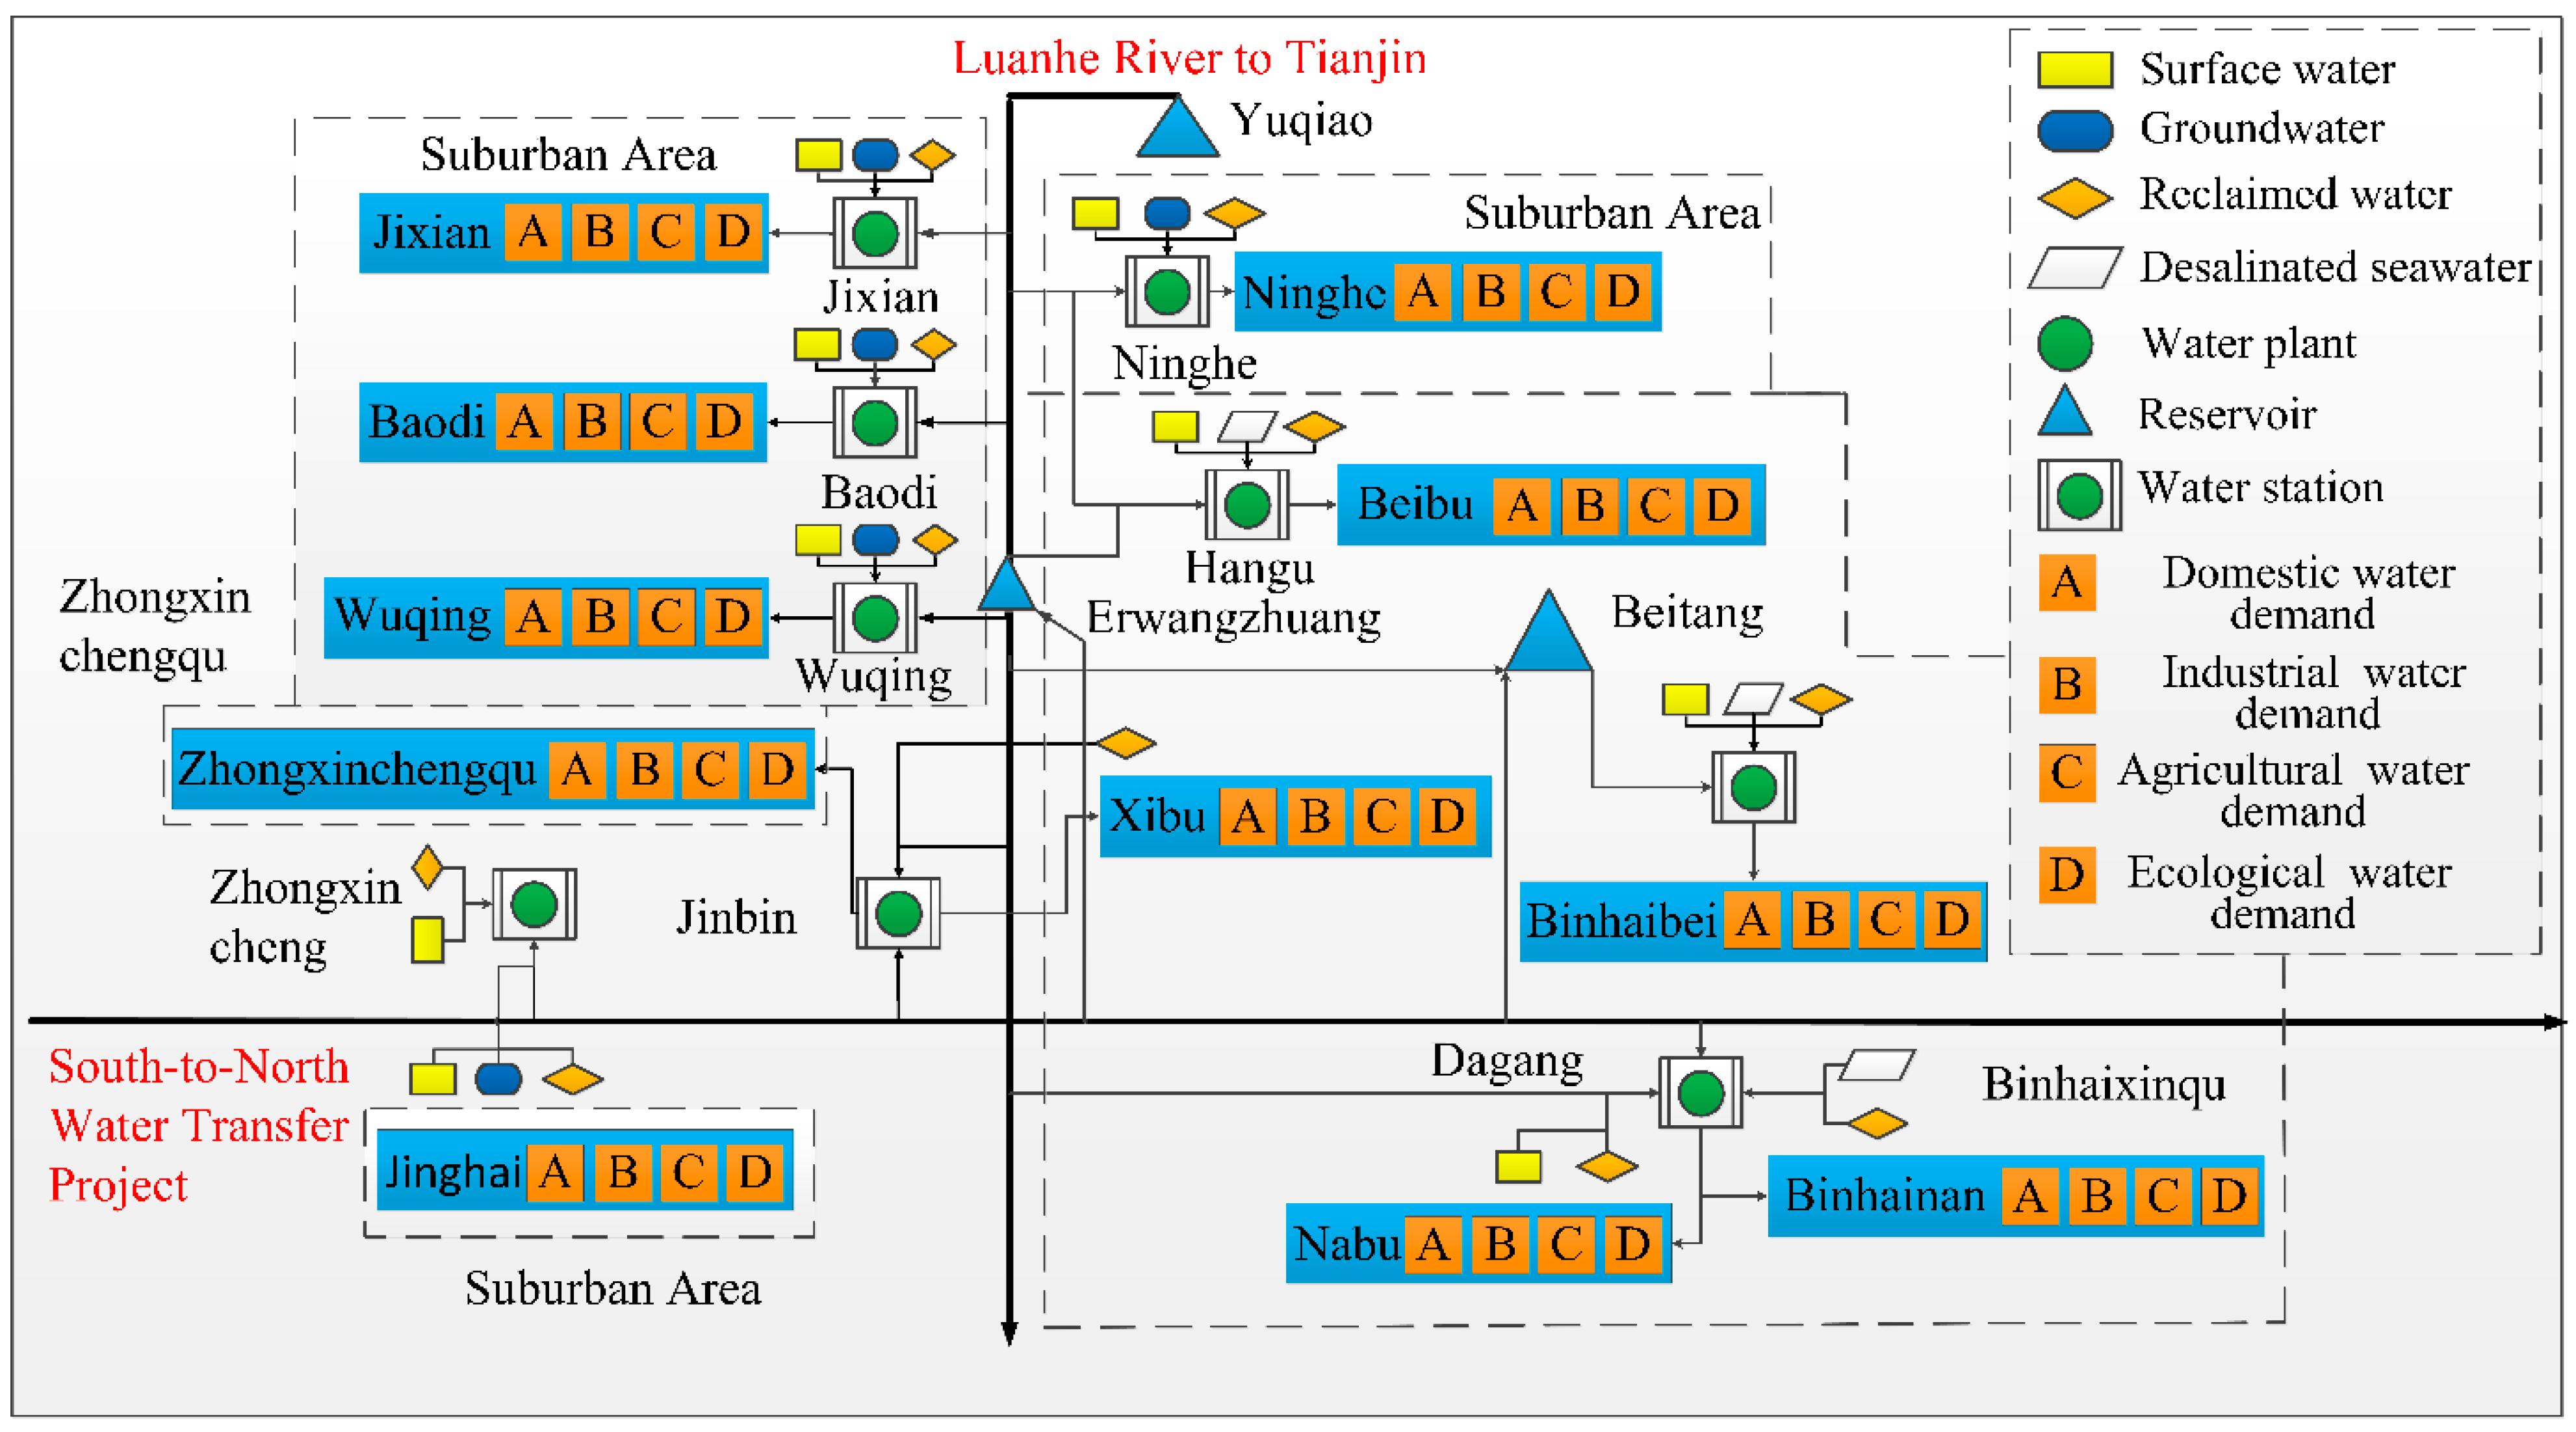
Tianjin is situated on the banks of the Haihe River in China. Tianjin has a developed economy and a large population. Water resources are in great demand, and there are large local water supply shortages. Per capita water use is only 124.84 m3 per annum [32]. This is the smallest per capita water use of all the provinces and cities in China. Severe water shortages have greatly restricted the sustainable development of Tianjin. Before the opening of the middle water supply route of China’s South-to-North Water Transfer Project (STNWTP), water sources available to Tianjin included surface water, groundwater, reclaimed water, desalinated seawater, and Luanhe river water. The opening of the STNWTP added an additional water source. A multi-source water supply system has been created. According to a preliminary study by the present research team [33], the problem of engineering water shortage can be solved by building a new water distribution network. Tianjin can be divided spatially into a horizontal and a vertical linear feature, three large areal features, eleven partitions, and four users (Figure 1b). The linear features refer to the two major external water diversion projects, i.e., the middle route of the STNWTP and the Luanhe river to Tianjin project. Two straight lines are used to represent the main water supply lines, and ignore the water quantity adjustment function of the reservoir. The three large areal features are the suburban area, the Zhongxincheng area, and the Binhaixinqu area. The eleven partitions refer to eleven administrative divisions within the three large areal features. The suburban areas include Jixian, Baodi, Wuqing, Jinghai, and Ninghe. The Zhongxincheng area includes Zhongxinchengqu and six districts of the city. The Binhaixinqu area includes Beibu, Xibu, Nanbu, Binhaibei, and Binhainan (Figure 1a). The four users refer to the four types of water users in each administrative division: domestic, industrial, agricultural, and ecological water demand. Because of the large number of water supply sources and complex water pipelines, water conflicts will occur among numerous water users with limited water supplies. The complex system of multi-source combined water supply makes the allocation of water resources in Tianjin extremely difficult. Therefore, the water supply system of Tianjin is a good choice for the current investigation’s case study. The combination of different frequency encounters of multiple water sources can better reflect the variation of the water guarantee rate for users in different regions. This can be used to quantitatively describe the impact of the fluctuation of water supply from multiple water sources on the actual water supply.
3. Methods
3.1. Research Design
“Random event”, “probability” and “independence” are basic concepts in probability theory. One result of a random experiment is called a random event (abbreviated as event), which is expressed by letters A, B, C, etc. Independent events refer to the fact that the occurrence of one event has no effect on the probability of the occurrence of another event. When event A, B and C are independent of each other, the probability of event A, B and C occurring simultaneously is equal to the product of the probability of three events [34,35]. That is,
Therefore, the inflow of surface water, Luanhe river water and STNWTP water in Tianjin at different design frequencies are mutually independent events and do not influence each other, i.e., events A, B and C. By calculating the schemes for different combinations of design frequencies of three different water sources, the influence of water quantity changes on guarantee rate of water use of Tianjin is simulated. This could quantitatively describe the distribution of water supplies from multiple water sources to different users in different regions, and describe the influence of the change in water supply sources on the regional water supply.
The flow chart of the research is shown in Figure 2.
3.2. Probability of Encounter of Incoming Water Combination and Guarantee Rate of Water Use
After the opening of the middle water supply route of China’s STNWTP, water sources available to Tianjin included surface water, groundwater, reclaimed water, desalinated seawater, Luanhe river water, and STNWTP water. Of these, the water supplies from surface water, Luanhe river water, and STNWTP water changed significantly under different design frequencies, while the water supplies from groundwater, reclaimed water, and desalinated seawater was relatively stable. Therefore, the selection of different design frequency combinations for surface water, Luanhe river water, and STNWTP water can effectively reflect the impact on the guarantee rate of water use in different administrative divisions and for different water users. Using the concept of mutually independent events from probability theory [34,35], the inflow of surface water, Luanhe river water and STNWTP water at different design frequencies (50%, 75% and 95%) are mutually independent events and do not influence each other. Assuming that the surface water inflow is event A, the Luanhe river water inflow is event B, and the STNWTP water inflow is event C, the probability that the surface water, the Luanhe river water, and STNWTP water will occur simultaneously at different design frequencies is:
where represents the encounter probability of the three water source combinations. represents the surface water when the design frequency is i, represents the Luanhe river water when the design frequency is j, and represents the STNWTP water when the design frequency is k.
The guaranteed rate of water use is mainly applied to water users, and can be expressed as the degree of water demand by the water users [36]. The higher the guaranteed rate of water use, the higher the satisfaction of the water demand of water users, and the higher the guaranteed water use. The calculation formula is as follows:
where represents water supply (1 × 10⁸ m3), and represents water demand (1 × 10⁸ m3).
3.3. Construction of Water Resources Optimal Allocation Model
3.3.1. Objective Functions
The benefits of water resources are comprehensive; from the perspective of water resource use, it can be divided into economic benefits and social benefits. The purpose of the optimal allocation of water resources is to ensure that the regional water supply system meets the water demand of all users as far as possible, and minimizes the water shortage rate and achieves the optimal comprehensive benefits of the water resources. Therefore, this paper takes the economic and social benefit targets as the objective functions of the refined water resources allocation model for Tianjin.
Economic Benefit Target
The economic benefit value is calculated in the form of a water benefit coefficient for different users. This can more directly reflect the total benefit value of the water distribution scheme. The economic benefit function is expressed as follows:
where: represents the economic benefits after the completion of the water supply tasks in the various districts during the year (1 × 10⁸ CNY); represents the annual amount of water that the water source supplied through the water station to the user of administrative division (1 × 10⁸ m3); represents the benefit coefficient of unit water supply to user (CNY/m3); represents the accumulated amount of Luanhe river water (1 × 10⁸ m3); and represents the accumulated amount of STNWTP water (1 × 10⁸ m3).
The industrial benefit coefficient was allocated using the gross industrial output value method [37,38]. This coefficient is the reciprocal of ten thousand CNY of industrial output. The agricultural benefit coefficient is the ratio of agricultural output value to agricultural water consumption. Based on the policy of giving priority to domestic water use to meet and protect ecological and environmental health, the coefficient of living and ecological benefits is taken as a larger value. Details are shown in Table 4:
Social Benefit Target
The social benefit target is to minimize the total water shortage in the region. The social benefits of water resources are manifested in four main aspects: life, industry, agriculture, and ecology. Meeting the domestic water use need is a basic condition for human survival and development. Meeting the industrial and agricultural water use need is a fundamental prerequisite for social stability and continuous economic improvement [39]. Therefore, to maximize the social benefits of water resources when water resources are limited, the minimum total water shortage in Tianjin is selected as the goal of social benefits. The function expression is as follows:
where represents the water shortage after the completion of water supply allocations in each district during the year (1 × 10⁸ m3). represents the annual water requirements of user in administrative division (108 m3). represents the annual amount of water that the water source supplied through the water station to the user in administrative division (1 × 10⁸ m3).
3.3.2. Constraints
The constraints to the optimal allocation of regional water resources are mainly the constraints of: water supply, water transmission capacity of the pipeline network, and the water supply capacity of the water stations.
- (1)
- Water supply capacity constraints: The total amount of water supplied annually to the connected water stations by the source during the year was not greater than the maximum capacity of the source.
- (2)
- Pipe network capacity constraints: The amount of water supplied by the source to the water station during a year was not greater than the maximum pipeline capacity of the water supplied by the source to the water station.
- (3)
- Water station purification capacity constraints: During a year, the total amount of purified water supplied to each partition user by the water station was not greater than the maximum capacity of the water purification station.
- (4)
- Water station constraints: The total amount of water supplied by the water station to users in each district must not be greater than the sum of water supplied by each water source to this water station.
- (5)
- Water supply constraints: The sum of the amount of water supplied by the water station to the users in each zone shall not be less than the lower limit of the water demand of the users and shall not be greater than the maximum water demand of the users.
- (6)
- Non-negative constraints: The model satisfies the non-negative constraint of the decision variables.
3.4. Simulation Scheme Setting
The water resource allocation of Tianjin in 2030 is used as a case study. In this paper, it was assumed that supplies of groundwater, reclaimed water, and desalinated seawater were constant. To analyze the quantitative relationship between the uncertainty of incoming water and the water assurance rate of users in different zones, 33 simulation schemes with different design frequency combinations of surface water, Luanhe river water, and STNWTP water were set up. The detailed simulation scheme settings are shown in Table 5.
3.5. Model Solution
LINGO software (Lindo Systems, Chicago, USA) was used to solve the model. LINGO software has a built-in modeling language, which provides multiple internal functions. The overall efficiency of this software, from modeling to solving, is very high. The objective function data and constraint data (water supply source data, user water demand data, water supply network capacity data, daily water plant capacity data, etc.) are input in the form of formulas. The modeling language built into LINGO then automatically transforms the mathematical model into matrix form, and automatically selects the appropriate solver to solve the problem in terms of the model. So LINGO is chosen to solve the model.
4. Results Analysis
4.1. Analysis of the Total Water Guarantee Rate of Different Schemes
4.1.1. Analysis of Six Schemes When the Luanhe River Is the Only External Water Source
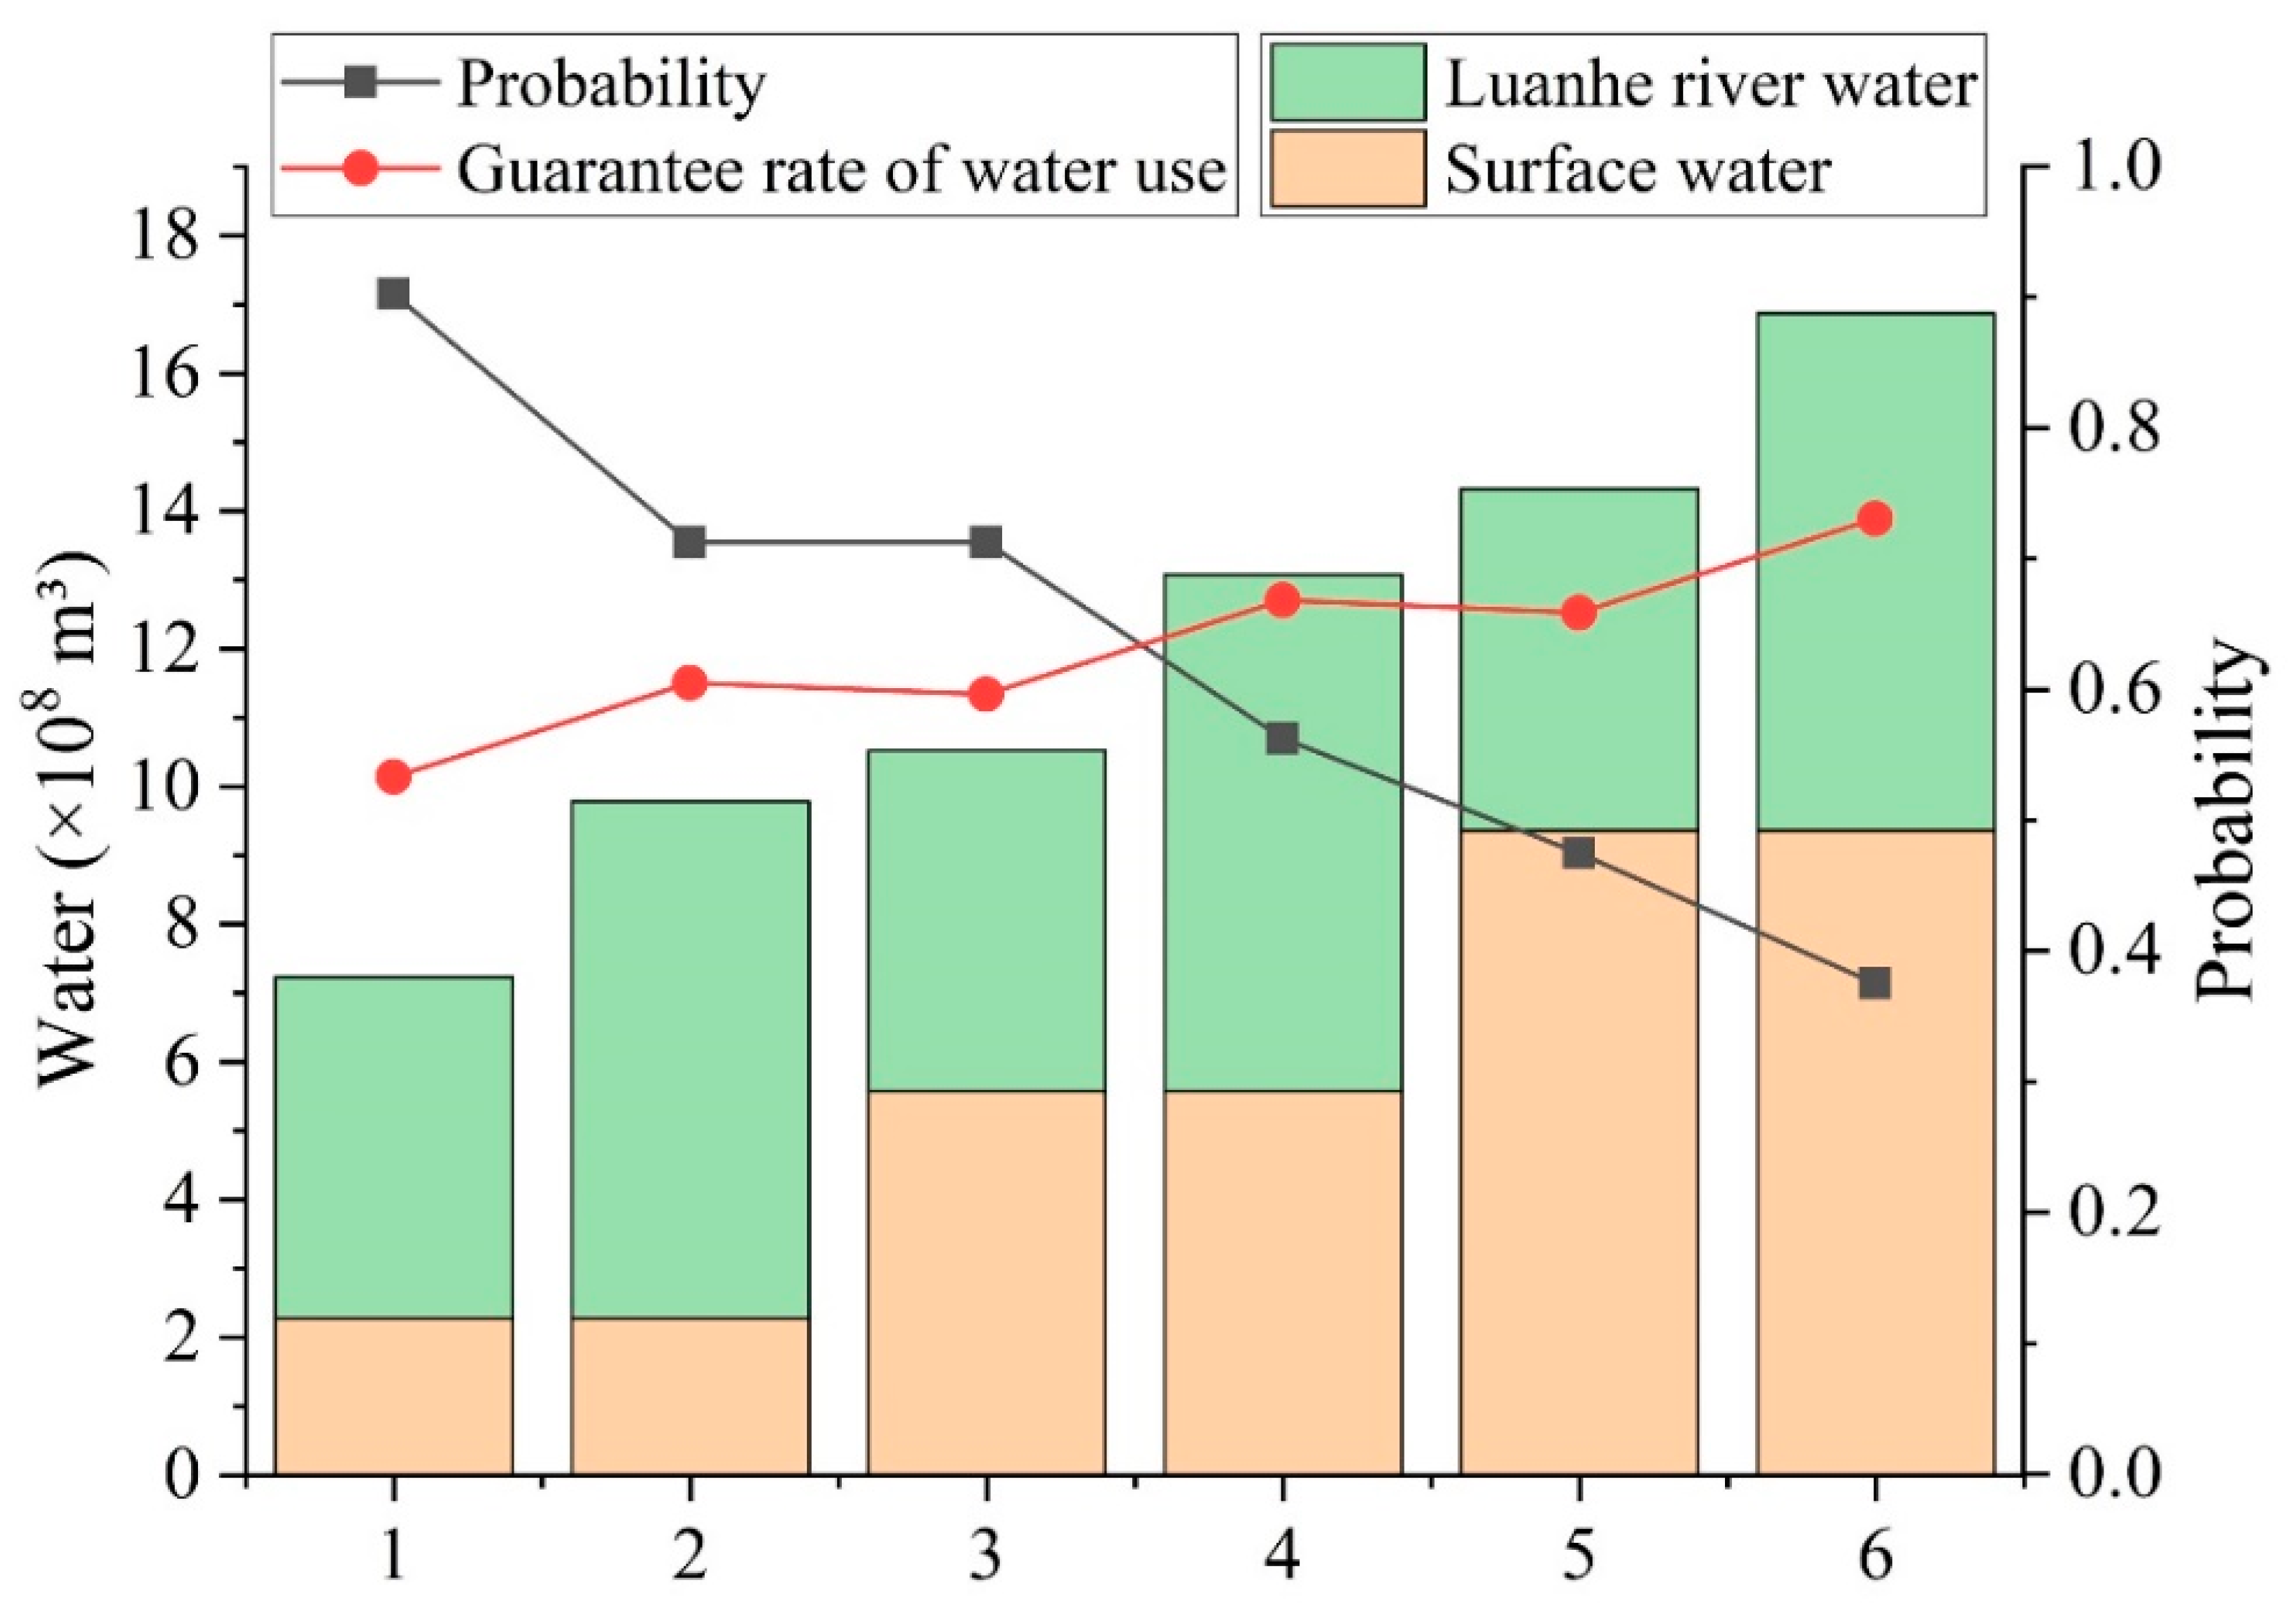
Figure 3 shows the occurrence probability for the six schemes, and the trend of the total water use guarantee rate in Tianjin, when the STNWTP water is not used, and when surface water and Luanhe river water are combined with different design frequencies. As can be seen from the Figure 3, with the increase of the total water supply from surface water and Luanhe river water (7.24→16.87 × 10⁸ m3), the guarantee rate of water use of Tianjin gradually increased (53.32%→73.07%), and the occurrence probability of the corresponding scheme presented a downward trend (90.25%→37.5%). Therefore, without the use of STNWTP water, Tianjin has a large water supply deficit. Relying only on local water sources and Luanhe river water is not sufficient for meeting the overall demand for water. At the same time, the risk to water supplies is high and the stability of the urban water supply system cannot be guaranteed.
4.1.2. Analysis of Nine Schemes When the STNWTP Is the only External Water Source
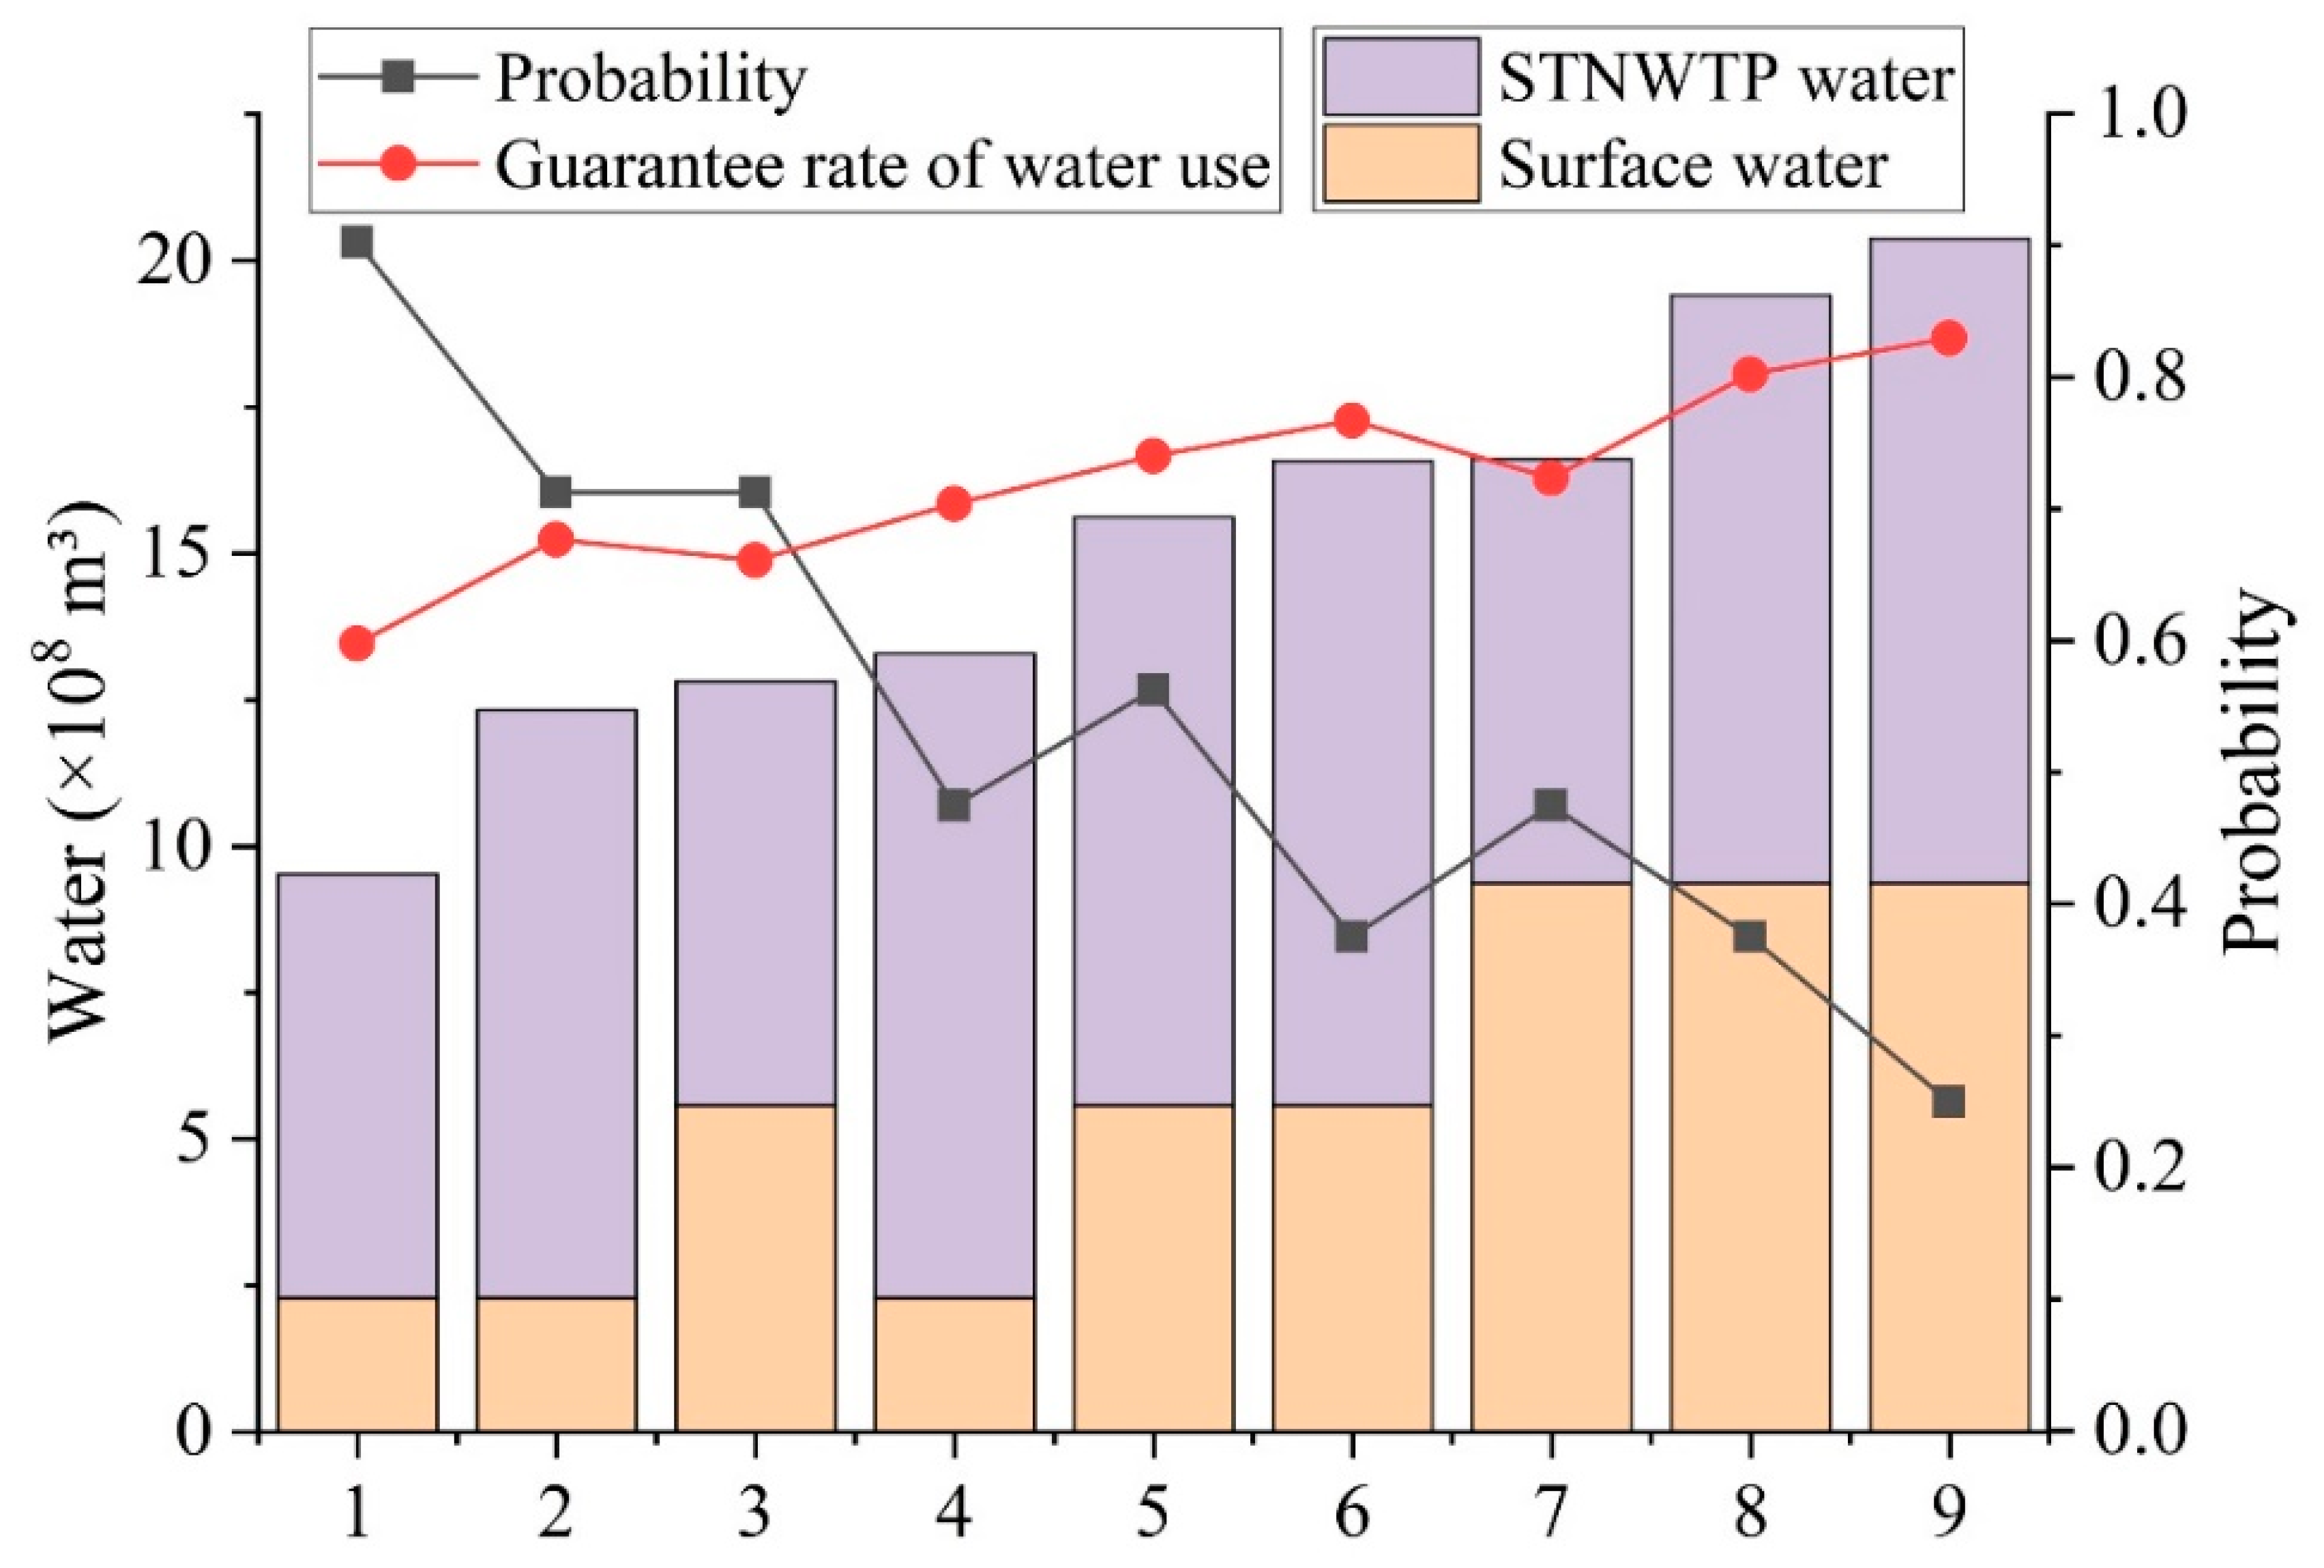
To analyze the water supply situation of Tianjin in the absence of Luanhe river water, a comparison was made with the scheme in Figure 3. Nine schemes for surface water and STNWTP water under different design frequency combinations were set up for the case when the Luanhe river water was excluded, as shown in Figure 4. It can be seen from the figure that, the overall guarantee rate of water use for Tianjin is low. As the surface water and STNWTP water supply is increased (9.53→20.37 × 10⁸ m3), the guarantee rate of water use gradually increases (59.78%→82.95%). However, when compared with Figure 3, it can be seen that the minimum and maximum guarantee rates of water use in Figure 4 have been increased, while the occurrence probability of nine schemes has been reduced. By combining the results from Figure 3 and Figure 4, it can be concluded that the water shortages in the aforementioned schemes is caused by insufficient water supplies, which are associated with resource-based water shortages. Water shortages can be alleviated and eliminated by increasing water supply sources.
4.1.3. Analysis of Eighteen Schemes When both Luanhe River Water and STNWTP Water Are Used
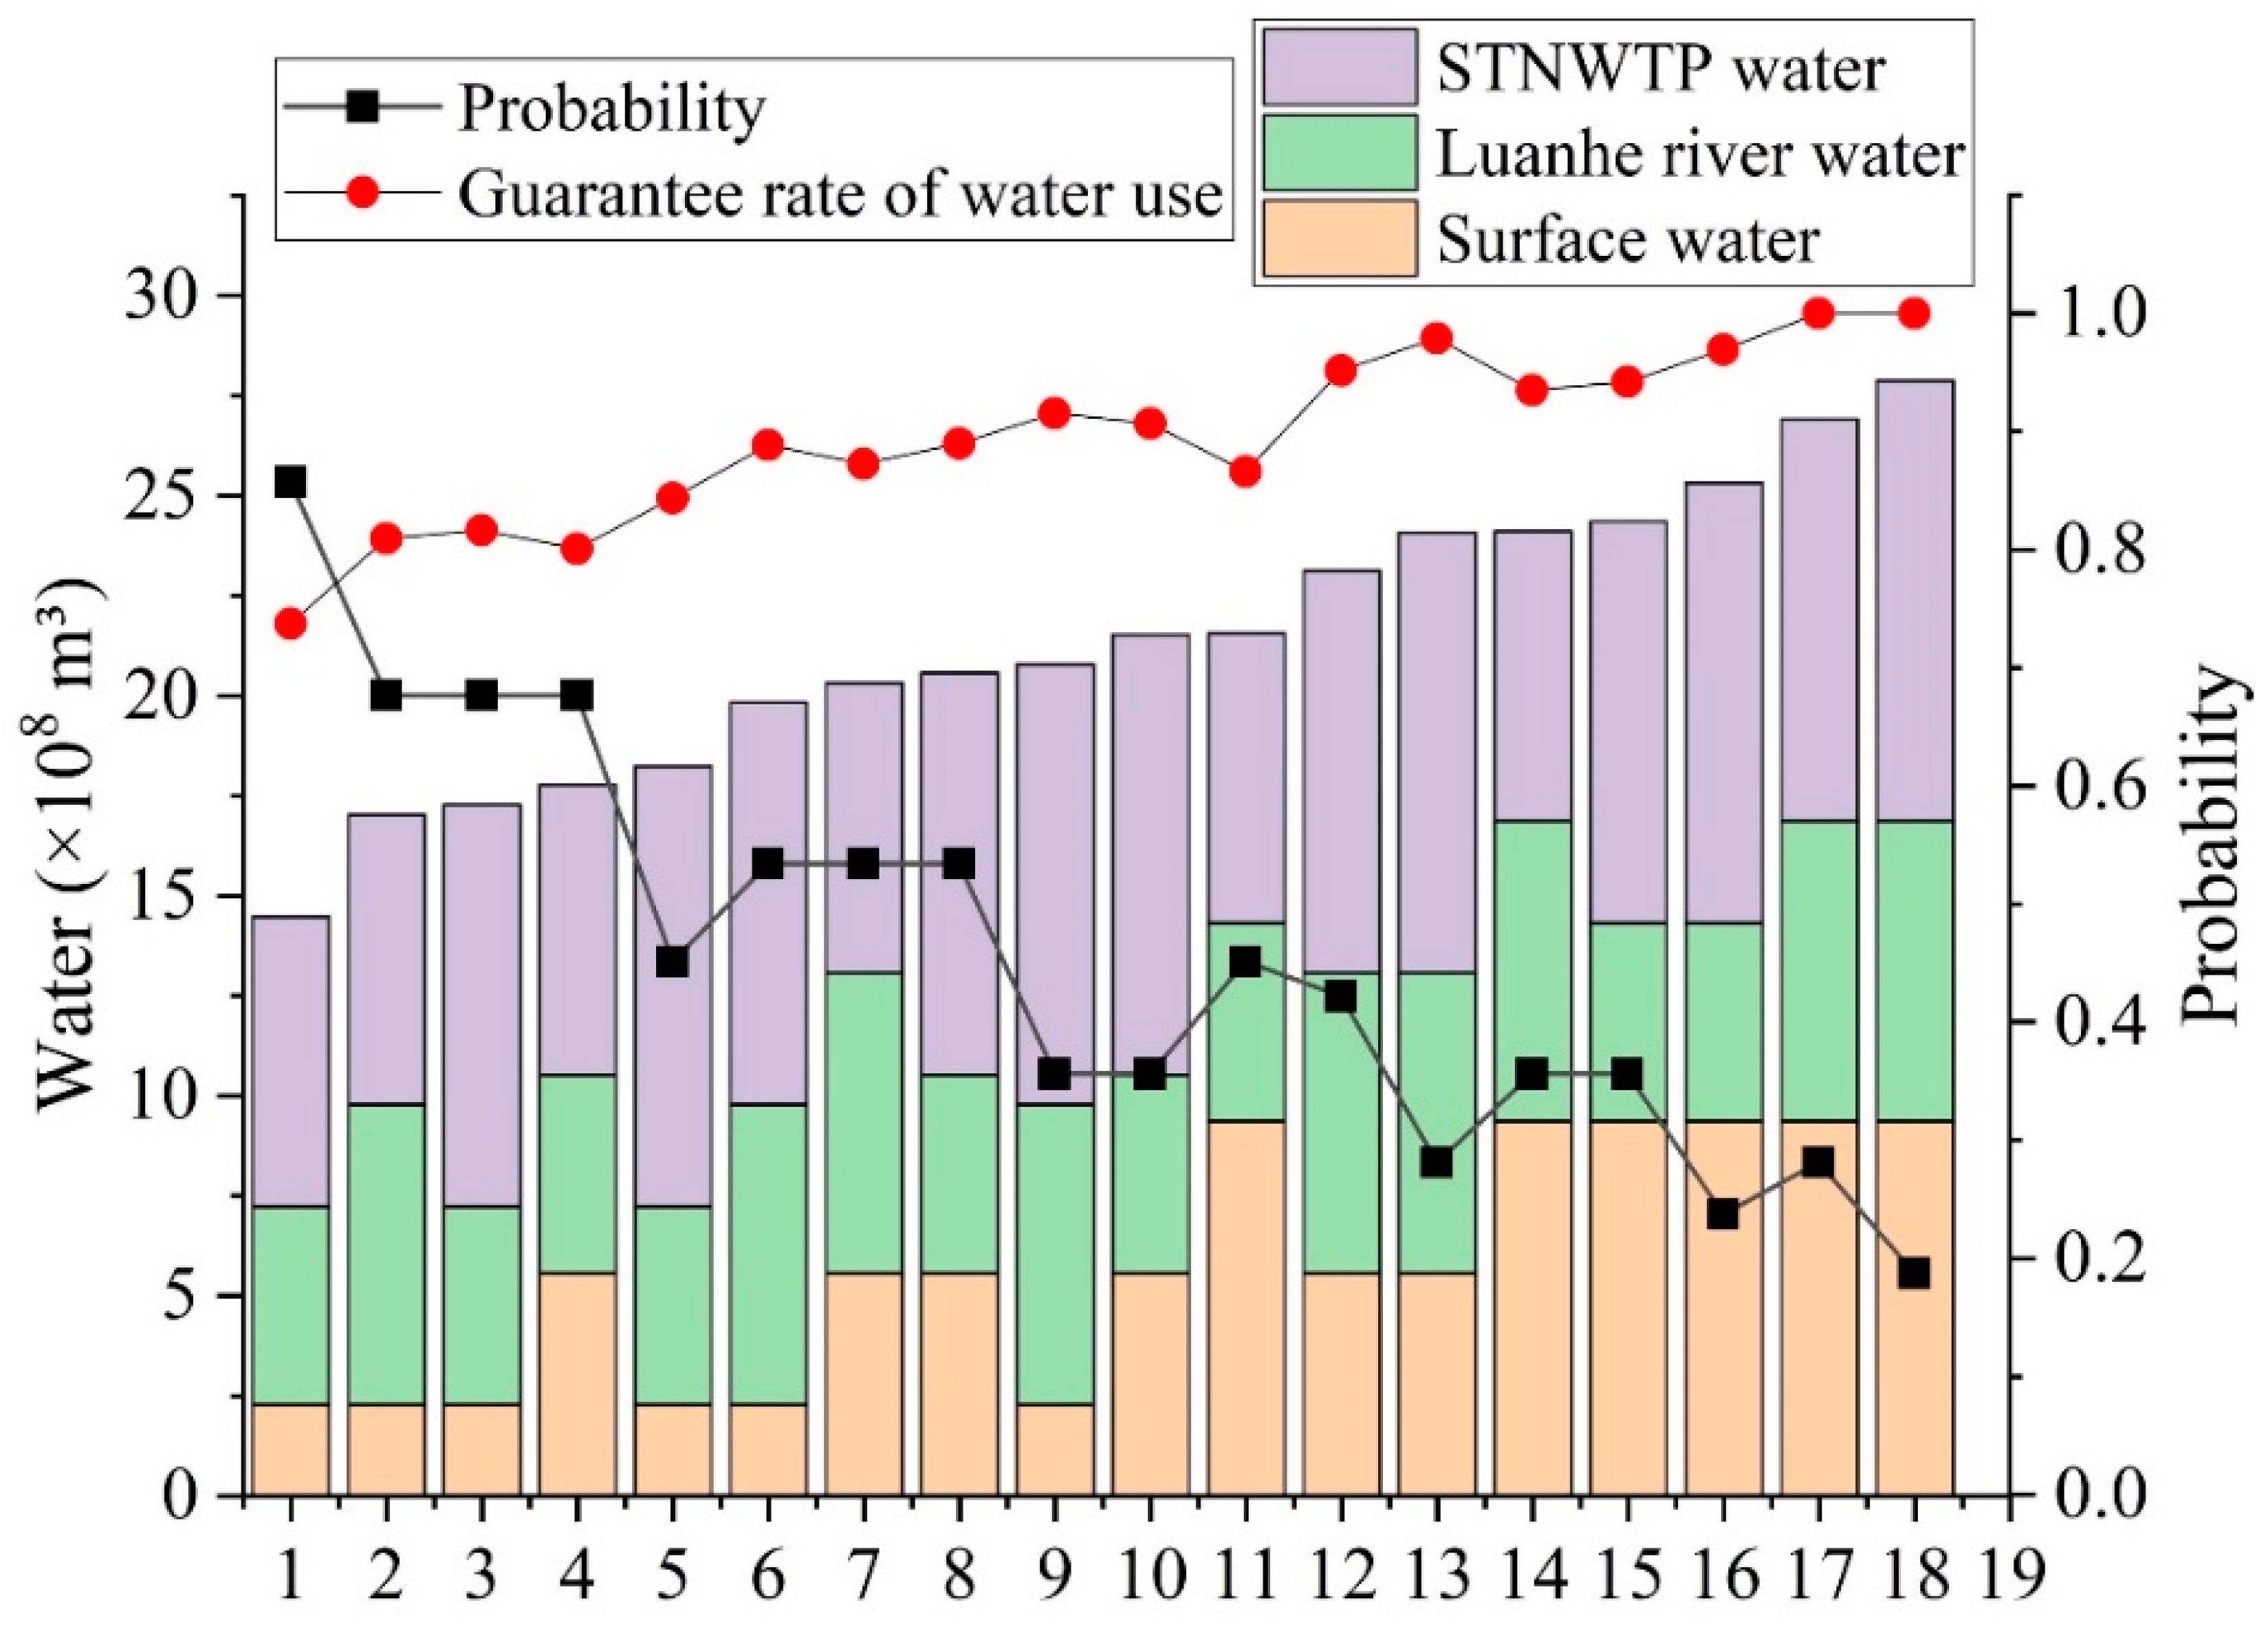
According to the analysis of the results shown in Figure 3 and Figure 4, there will always be a water shortage in Tianjin when there is only a single external water supply. Therefore, it is necessary to use both Luanhe river water and STNWTP water to increase the amount of water available from external diversions for Tianjin. This will reduce the risk to water supplies and improve the guarantee rate of water use. Figure 5 shows the occurrence probability for eighteen schemes and the variation trend of the overall water use guarantee rate in Tianjin when Luanhe river water and STNWTP water are used simultaneously; different design frequency combinations of surface water, Luanhe river water, and STNWTP water are shown. As can be seen from Figure 5, with the increase in the total water supply of surface water, Luanhe river water, and STNWTP water (14.48→27.87 × 10⁸ m3), the water guarantee rate of Tianjin gradually increased (73.75%→100%), while the occurrence probability of corresponding schemes showed a downward trend (85.74%→18.75%). This was consistent with the change trends shown in Figure 3 and Figure 4. However, unlike the cases depicted in Figure 3 and Figure 4, in the case of using Luanhe river water and STNWTP water at the same time, the water guarantee rate of all schemes maintained a relatively high level (stable 90% fluctuation), while the minimum and maximum guarantee rates of water use also increased significantly; the minimum water guarantee rate increased to 73.75%, and the maximum water supply guarantee rate increased to 100%.
In summary, with the increase in the types of external water sources, the total water supply in Tianjin increased significantly; the original water shortage has significantly improved, the overall water use guarantee rate shows an upward trend, and can ultimately meet the needs of the users in various urban districts. At the same time, the combination change of different design frequencies of multi-source water leads to uncertainty in water supply, and the fluctuation in water supply greatly affects the water guarantee rate for Tianjin. Therefore, a stable supply of external water sources is of great significance to the urban water supply system of Tianjin.
4.1.4. Occurrence Probability of Water Supply under Different Water Use Guarantee Rate Targets
1. When the water guarantee rate for Tianjin is more than 70%, one of the schemes shown in Figure 3 is satisfied, and the occurrence probability is 37.5%. In Figure 4, it can be seen than six schemes are satisfied, the probability of occurrence is 47.5%, the maximum guaranteed rate of water use is 82.95%, and the probability of occurrence is 25%. In Figure 5, it can be seen that all the schemes are satisfied, the occurrence probability is 85.74%, the maximum water guarantee rate is 100%, and the occurrence probability is 28.13%.
2. When the water guarantee rate for Tianjin is more than 80%, no solution is satisfied in Figure 3. In Figure 4, two schemes are satisfied, and the probability of occurrence is 37.5%. In Figure 5, seventeen schemes are satisfied, and the probability of occurrence is 67.69%.
3. When the water guarantee rate for Tianjin is more than 90%, there are no schemes that are satisfied in Figure 3 and Figure 4. In Figure 5, nine schemes are satisfied, and the probability of occurrence of the schemes is 35.63%.
4. When the water guarantee rate for Tianjin is 100%, only two schemes in Figure 5 are satisfied. Of these, the highest probability is 28.13%.
In summary, from Figure 3, Figure 4 and Figure 5, the number of schemes that can meet the requirements gradually increases, the occurrence probability of the corresponding schemes with the minimum guaranteed rate of water use shows an upward trend, and the maximum guaranteed rate of water use continuously increases to 100%. This shows that the addition of new water sources, that is, creating a multi-source combined water supply, can effectively improve the guarantee rate of water use, ensure the stability of water supply, and reduce the risk to water supplies. In addition, from a comparison of Figure 3 and Figure 4, it can be seen that the number of water supply schemes in Figure 4 that can satisfy all requirements is higher than that in Figure 3; the corresponding schemes in Figure 4 also have a higher probability of occurrence. Therefore, it can be deduced that the water supply stability of the STNWTP water is better than that of the Luanhe river water, and that the STNWTP is an indispensable water supply source for Tianjin.
4.1.5. The Cost of Water Supply
In a water supply system, the cost of the water supply is an important component. The different water prices of water sources will directly affect the final cost of the water supply. In the above scheme, only the water prices of external water sources (Luanhe river water 0.91 CNY/m3, STNWTP water 2.16 CNY/m3) were included in the calculation of the cost of water supply. Only these prices were used, because the purpose was to evaluate the impact of different external water sources on the cost of water supply.
Figure 4 and Figure 5 are taken as examples: the minimum water guarantee rate schemes are compared when the water guarantee rate of Tianjin is more than 70%. The scheme in Figure 4 is: (surface water 95% + STNWTP water 50%), the guaranteed rate of water use is 70.39%, and the cost of water supply is 23.76 × 10⁸ CNY. The scheme in Figure 5 is: (surface water 95% + Luanhe river water 95% + STNWTP water 95%), the guaranteed rate of water use is 73.75%, and the cost of water supply is 20.14 × 10⁸ CNY. It can be seen that when the guaranteed rate of water use is similar, the water supply cost of the scheme that uses more STNWTP water is higher. On the one hand, the large-scale use of STNWTP water can reduce the risk to water supplies in Tianjin and ensure the stability of water supply system. On the other hand, the high water price of STNWTP water also makes the cost of water supply increase sharply. Therefore, rational allocation of the use of STNWTP water is needed to effectively control the cost of water supply, and to obtain the best economic benefits.
4.2. Analysis of Water Supply to Divisions and Users
To analyze the influence of the variation in the water supplied from the STNWTP on the guaranteed rate of water use in Tianjin, the high-flow years of local water sources and abundant Luanhe river water in Tianjin were selected for analysis. Three schemes in different design frequencies were used in the analysis, design frequency: (surface water 50% + Luanhe river water 75%), (surface water 50% + Luanhe river water 75% + STNWTP water 95%) and (surface water 50% + Luanhe river water 75% + STNWTP water 75%). Based on the water allocation for the three schemes, the variation in water use guarantee rate for different divisions and users in Tianjin were analyzed in order to explore the influence of the variation in STNWTP water supplies on the water supply of users in different divisions.
4.2.1. Analysis of the Overall Water Guarantee Rate for Tianjin
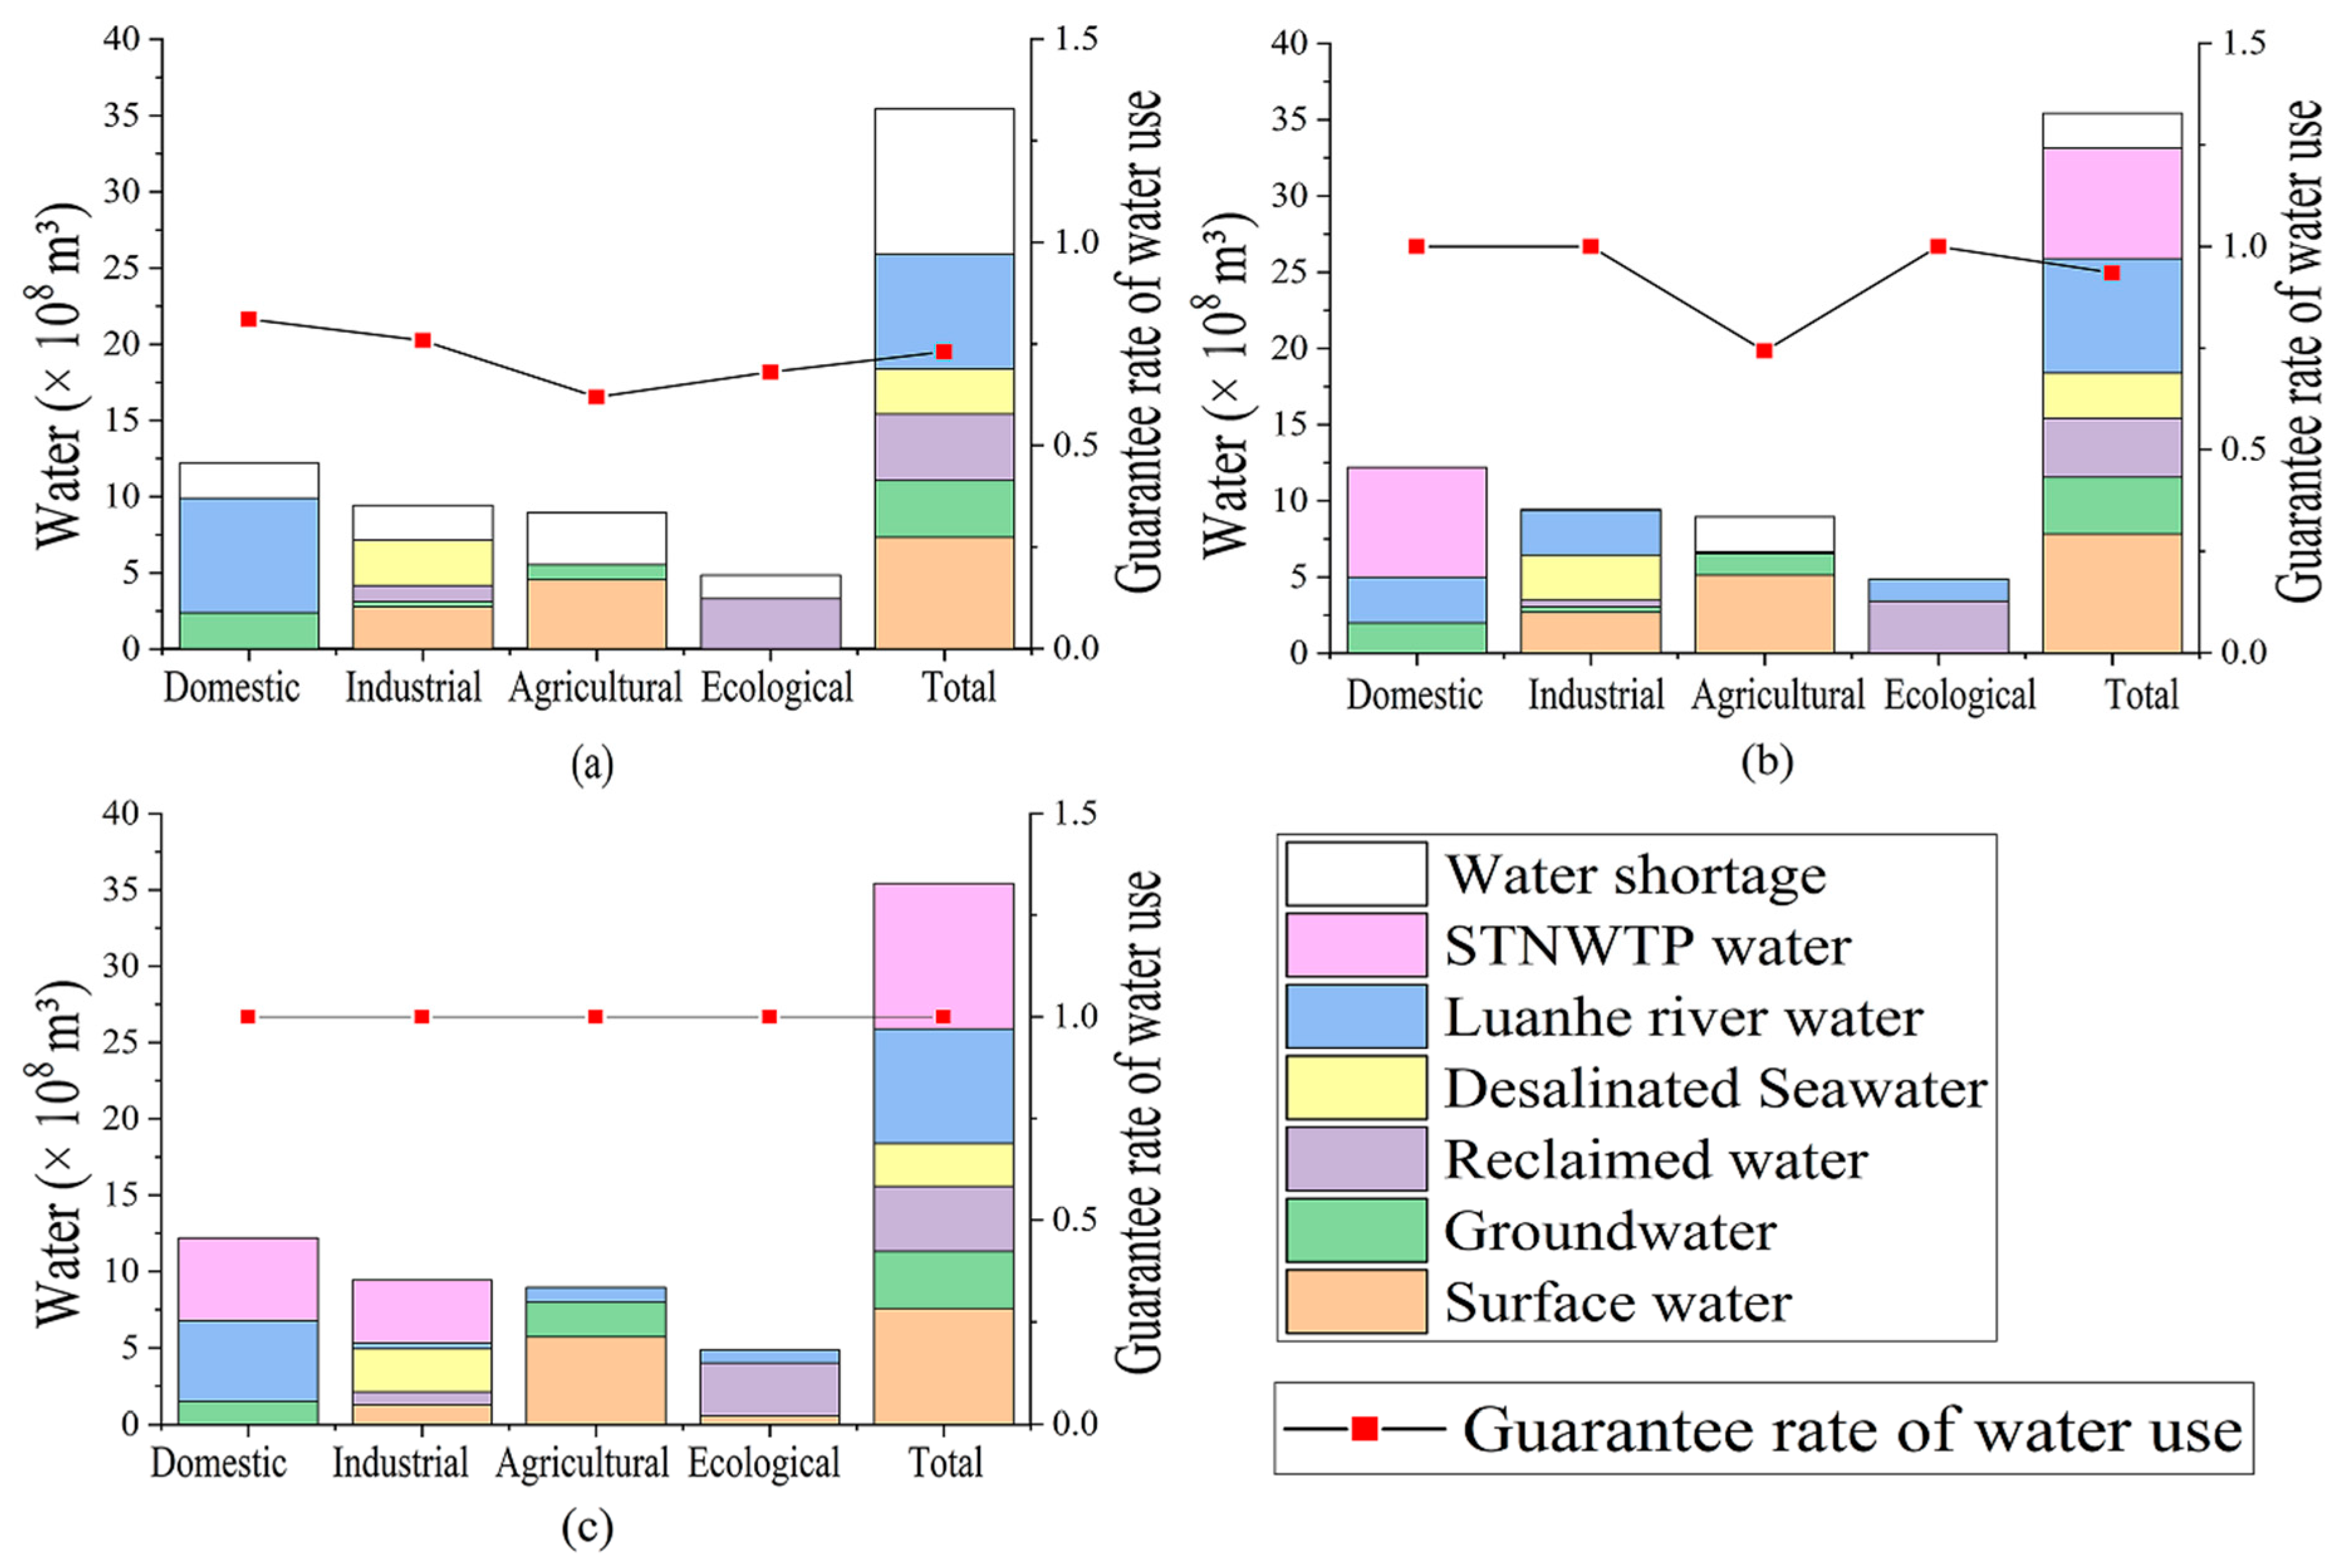
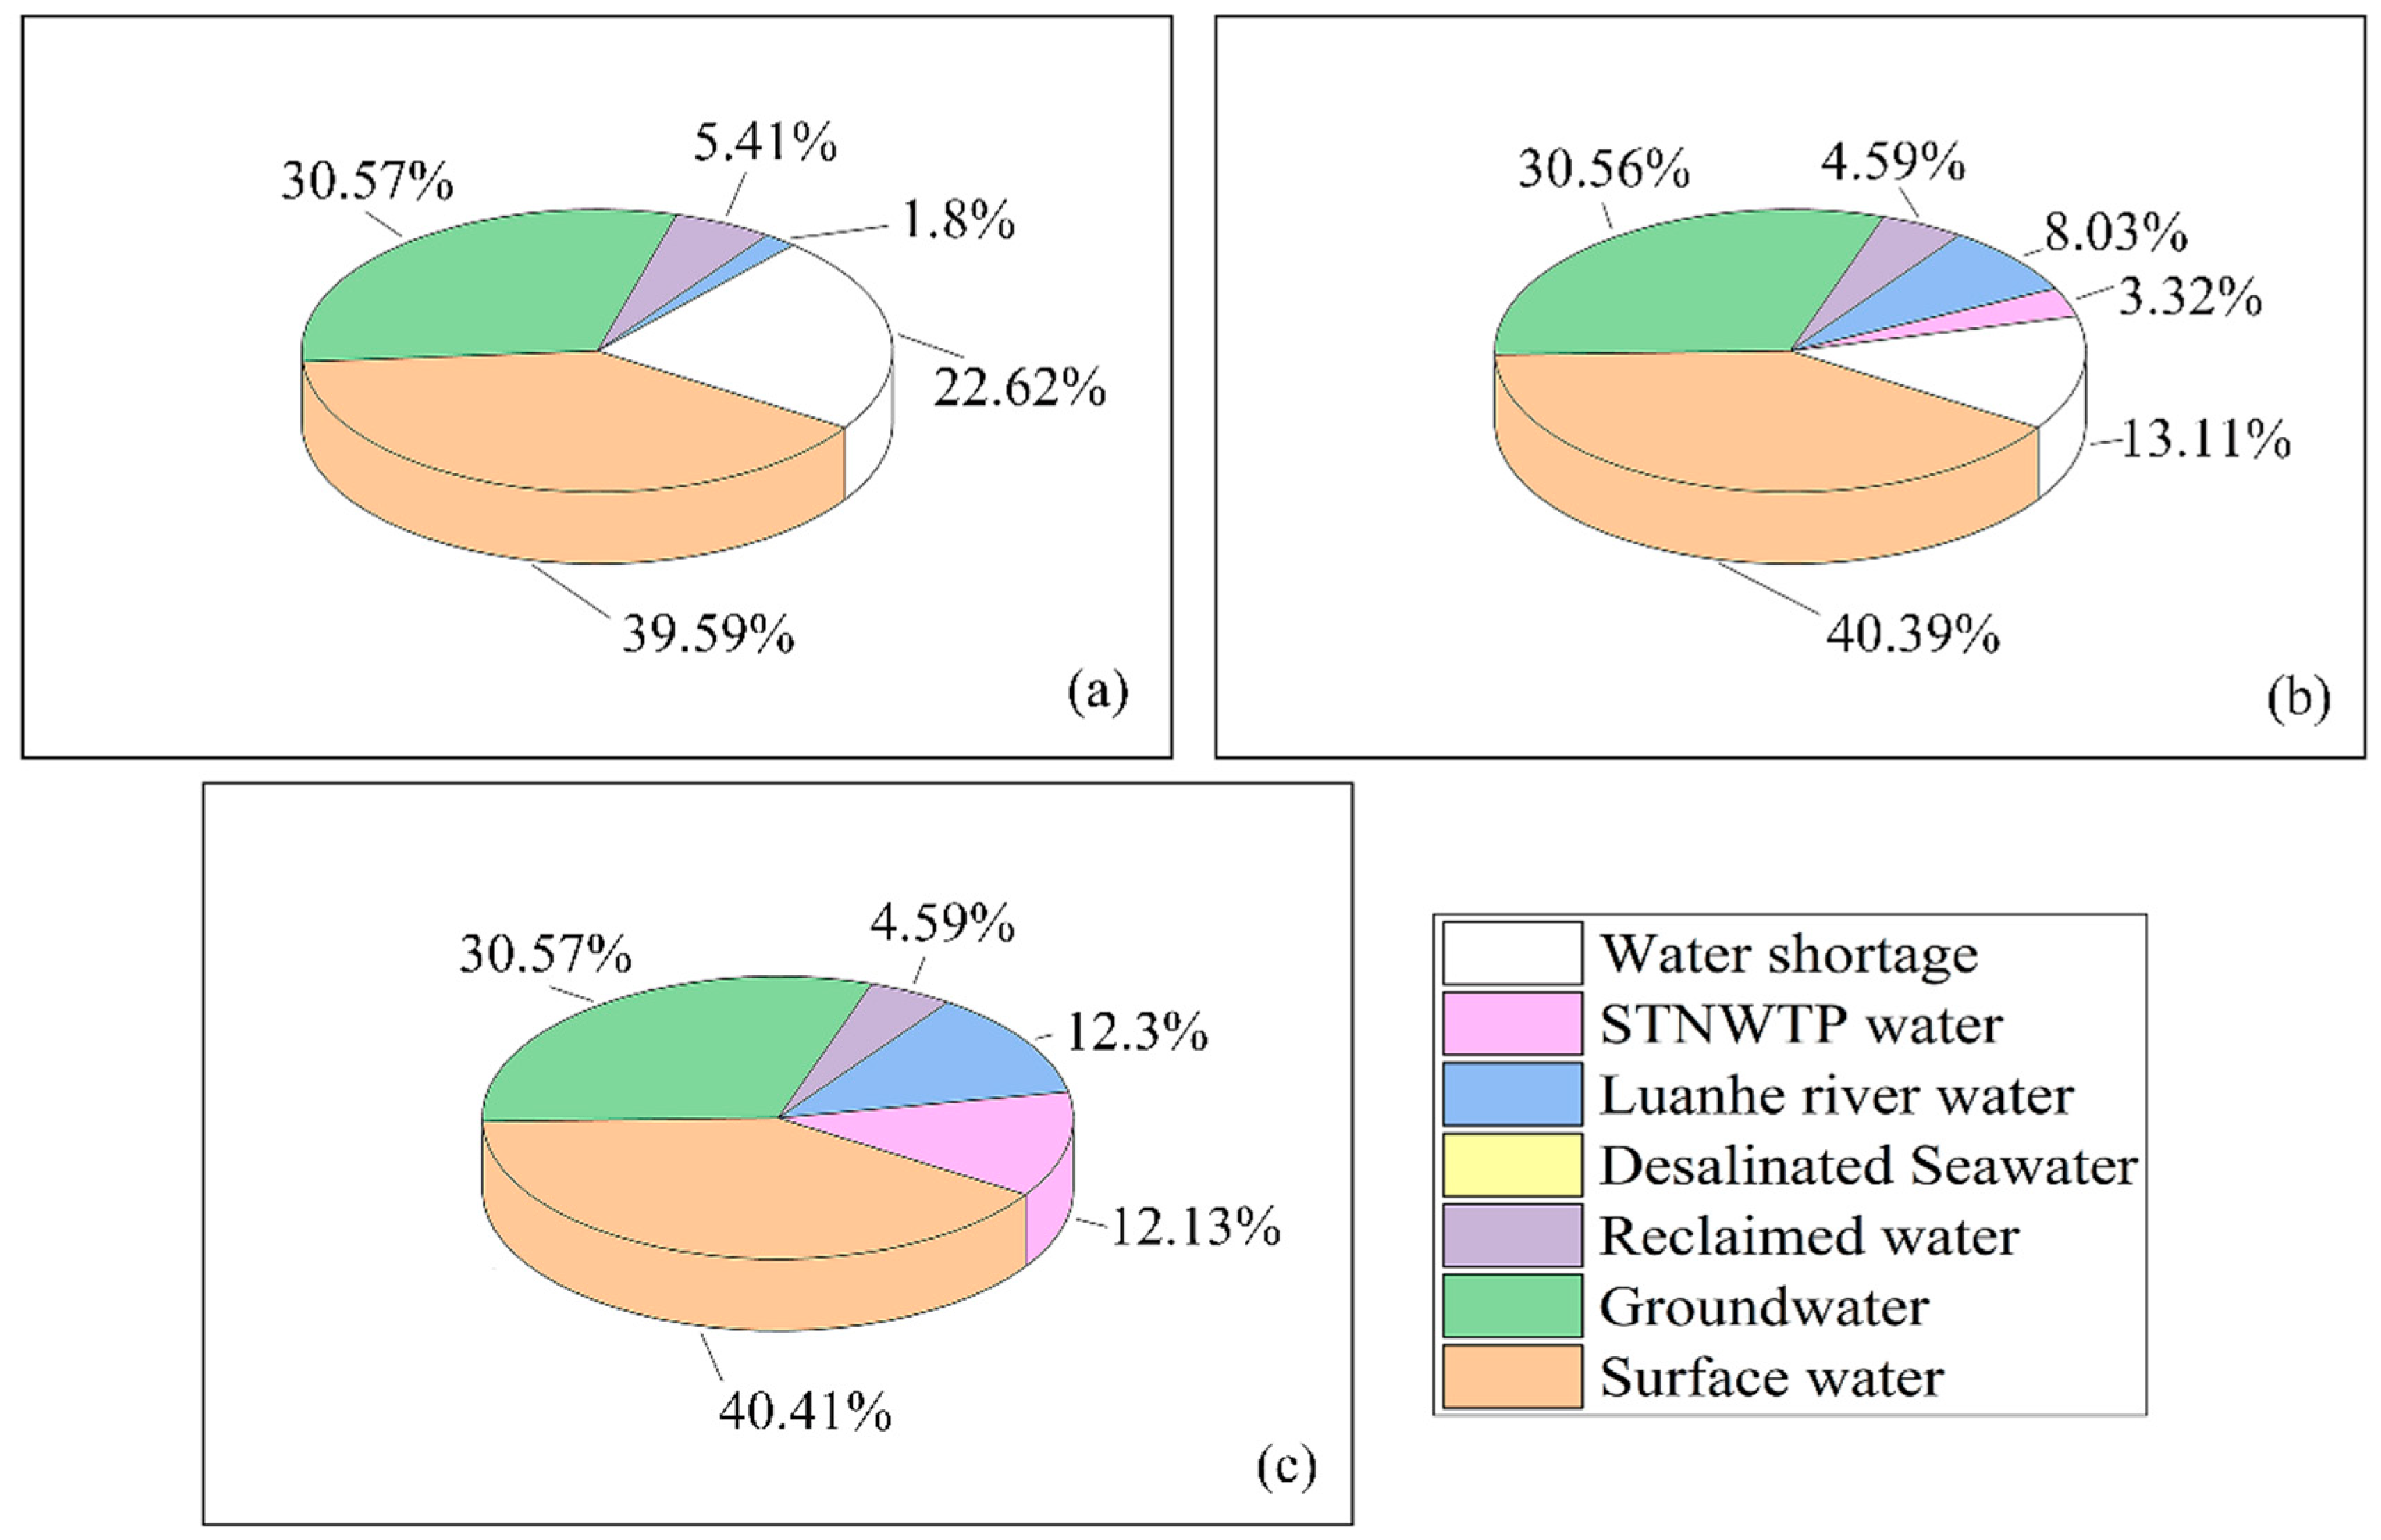
It can be seen from Figure 6 that the overall water guarantee rate for Tianjin clearly increases with the increase in the amount of water that can be supplied by the STNWTP, and that the guarantee rate rises to 100%. Water shortages mainly occur in the agricultural sector. The allocation results show that the reason for this water shortage is that the agricultural water demand in the suburban areas is large, and the local water source cannot meet this demand. Therefore, with the increase in water supply from the STNWTP, the water guarantee rate for the agricultural users gradually increases. As shown in Figure 6a–c, when the water supply from the STNWTP is sufficient, all water requirements can be met.
4.2.2. Analysis of Water Supply Guarantee Rate in Suburban Areas
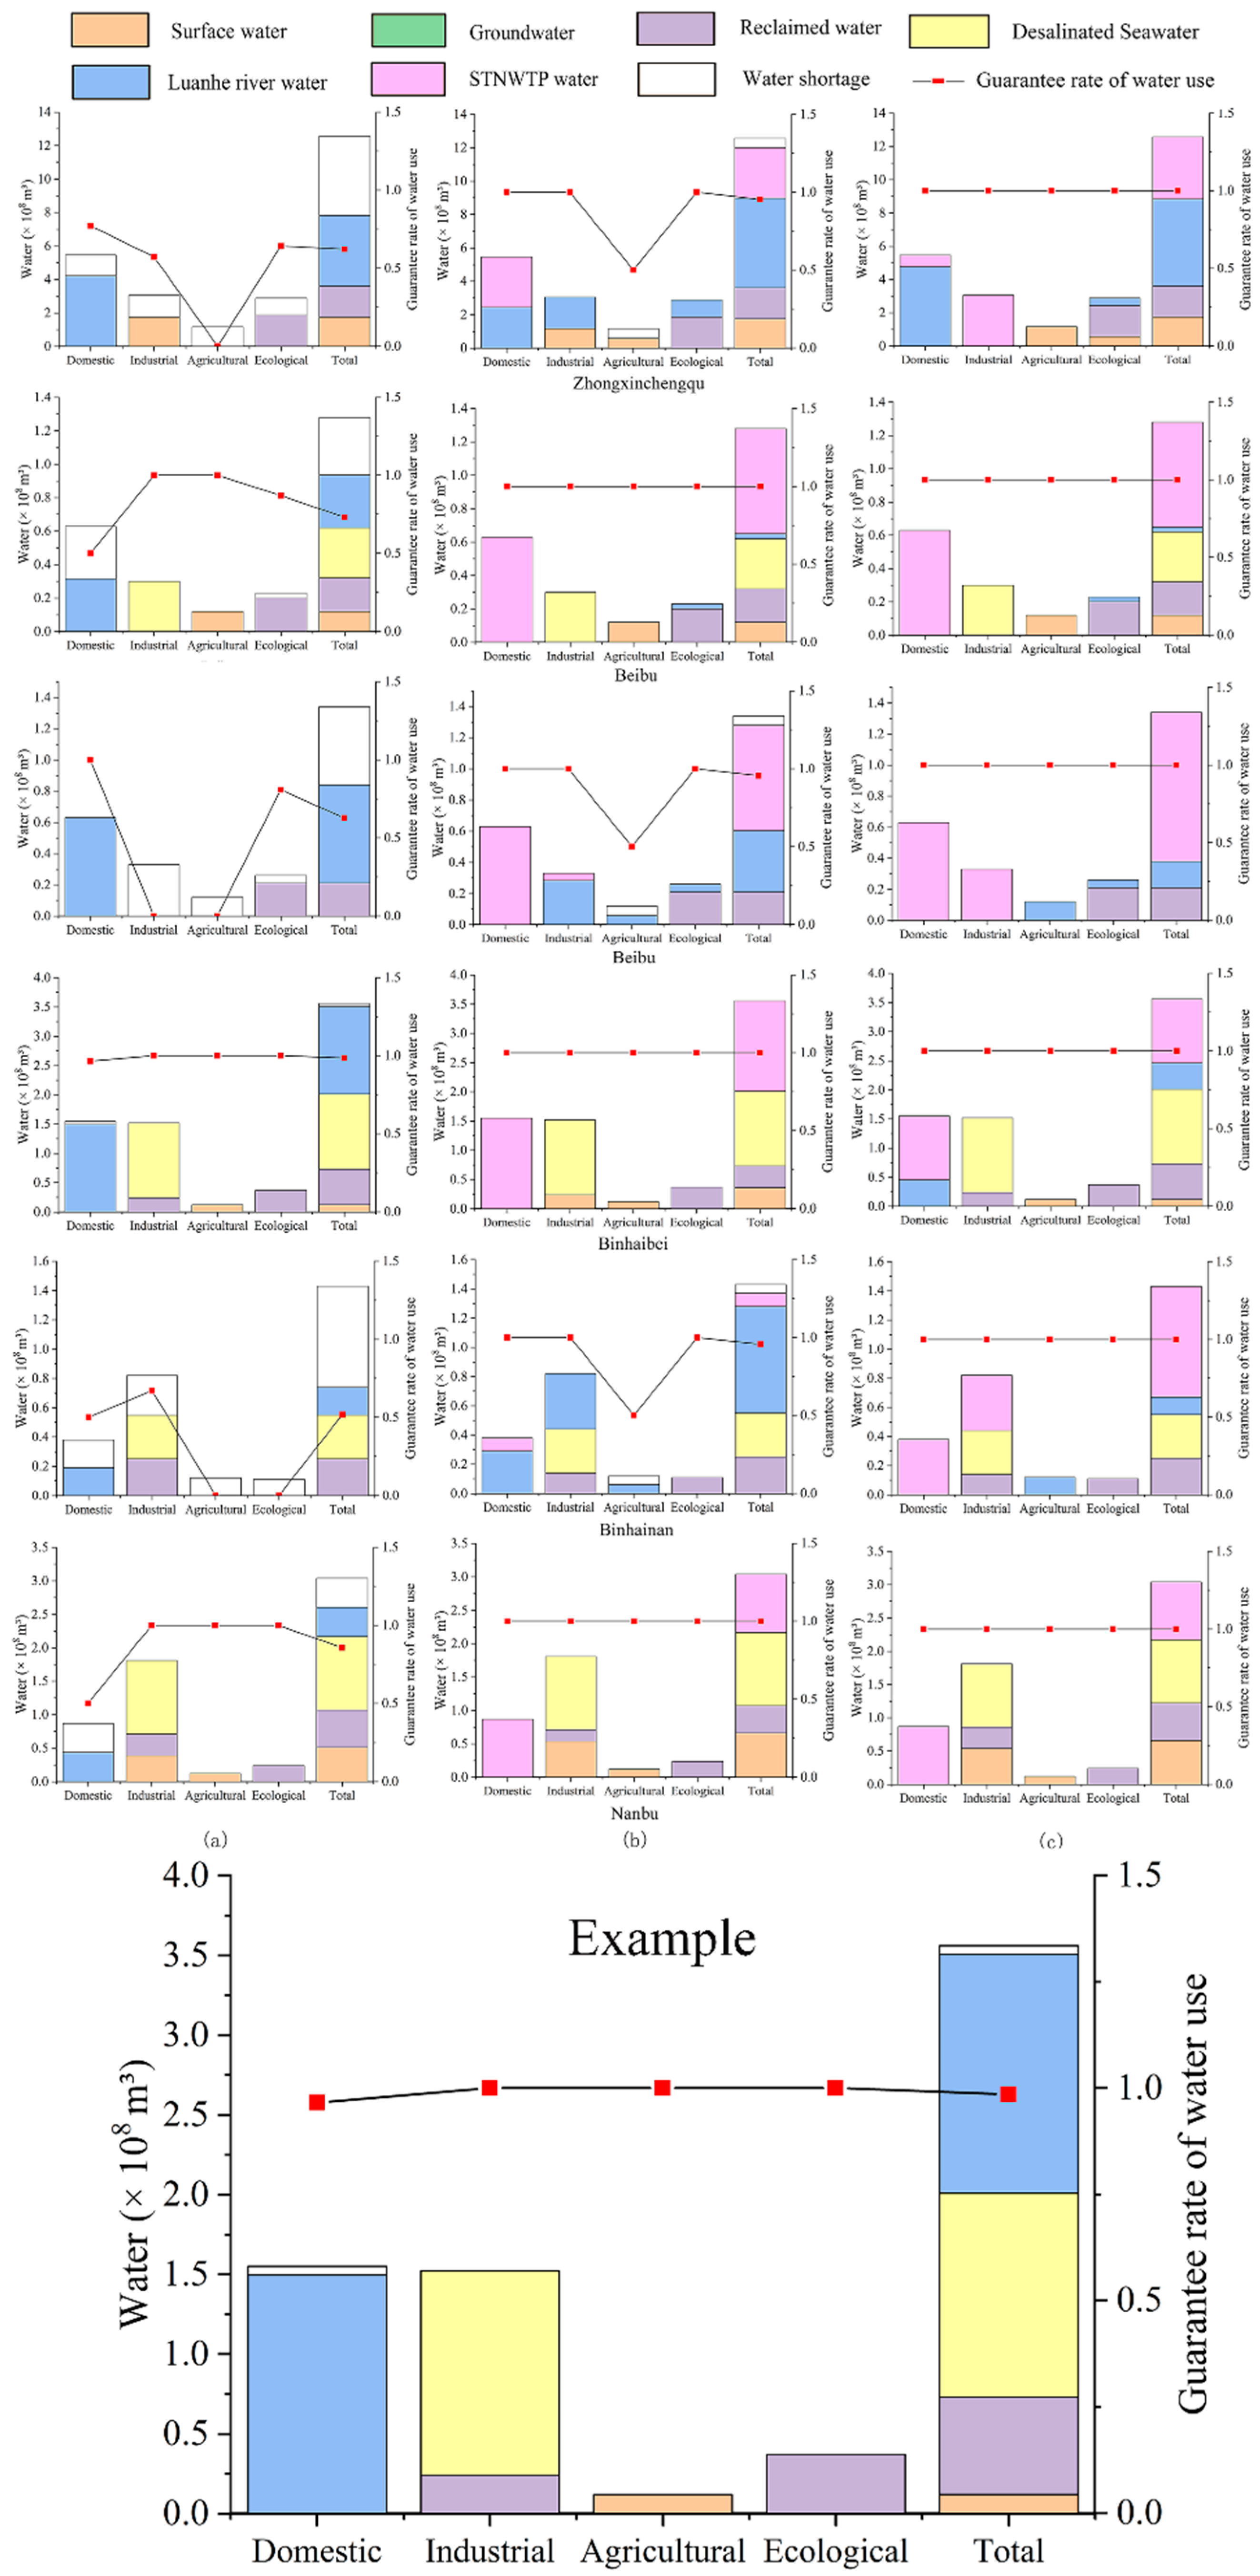
Figure 7 shows the variation in users’ water guarantee rate for different schemes in the suburban areas (Jixian, Baodi, Wuqing, Ninghe, and Jinghai). For the scheme that uses Luanhe river water as the only external source (surface water 50% + Luanhe river water 75%, (Figure 7a), the water guarantee rate for the four water users in the suburban areas is generally low, the difference is clear, and there are obvious imbalances in distribution. In the case of the scheme with low amounts of STNWTP water (surface water 50% + Luanhe river water 75%+ STNWTP water 95%, (Figure 7b), the water assurance rate for Wuqing and Ninghe has been significantly improved, and the water distribution between different water users is more equitable. However, the water supply situation in Baodi remained unchanged. The analysis of the results of water distribution show that the water shortages in Baodi mainly occurred in the agricultural sector. The effect of the water distribution rules involving insufficient external water was that the water guarantee rate in the Baodi area did not change. Thus, the conclusion is that the water shortages in the suburban areas in the aforementioned schemes were caused by insufficient water supplies, which can be solved by increasing water supplies. This conclusion is verified in Figure 7c. For the scheme with the highest amount of STNWTP water (surface water 50% + Luanhe river water 75% + STNWTP water 75%), all the water use guarantee rates in the suburban areas are 100%.
4.2.3. Distribution of Water Supply in Suburban Areas
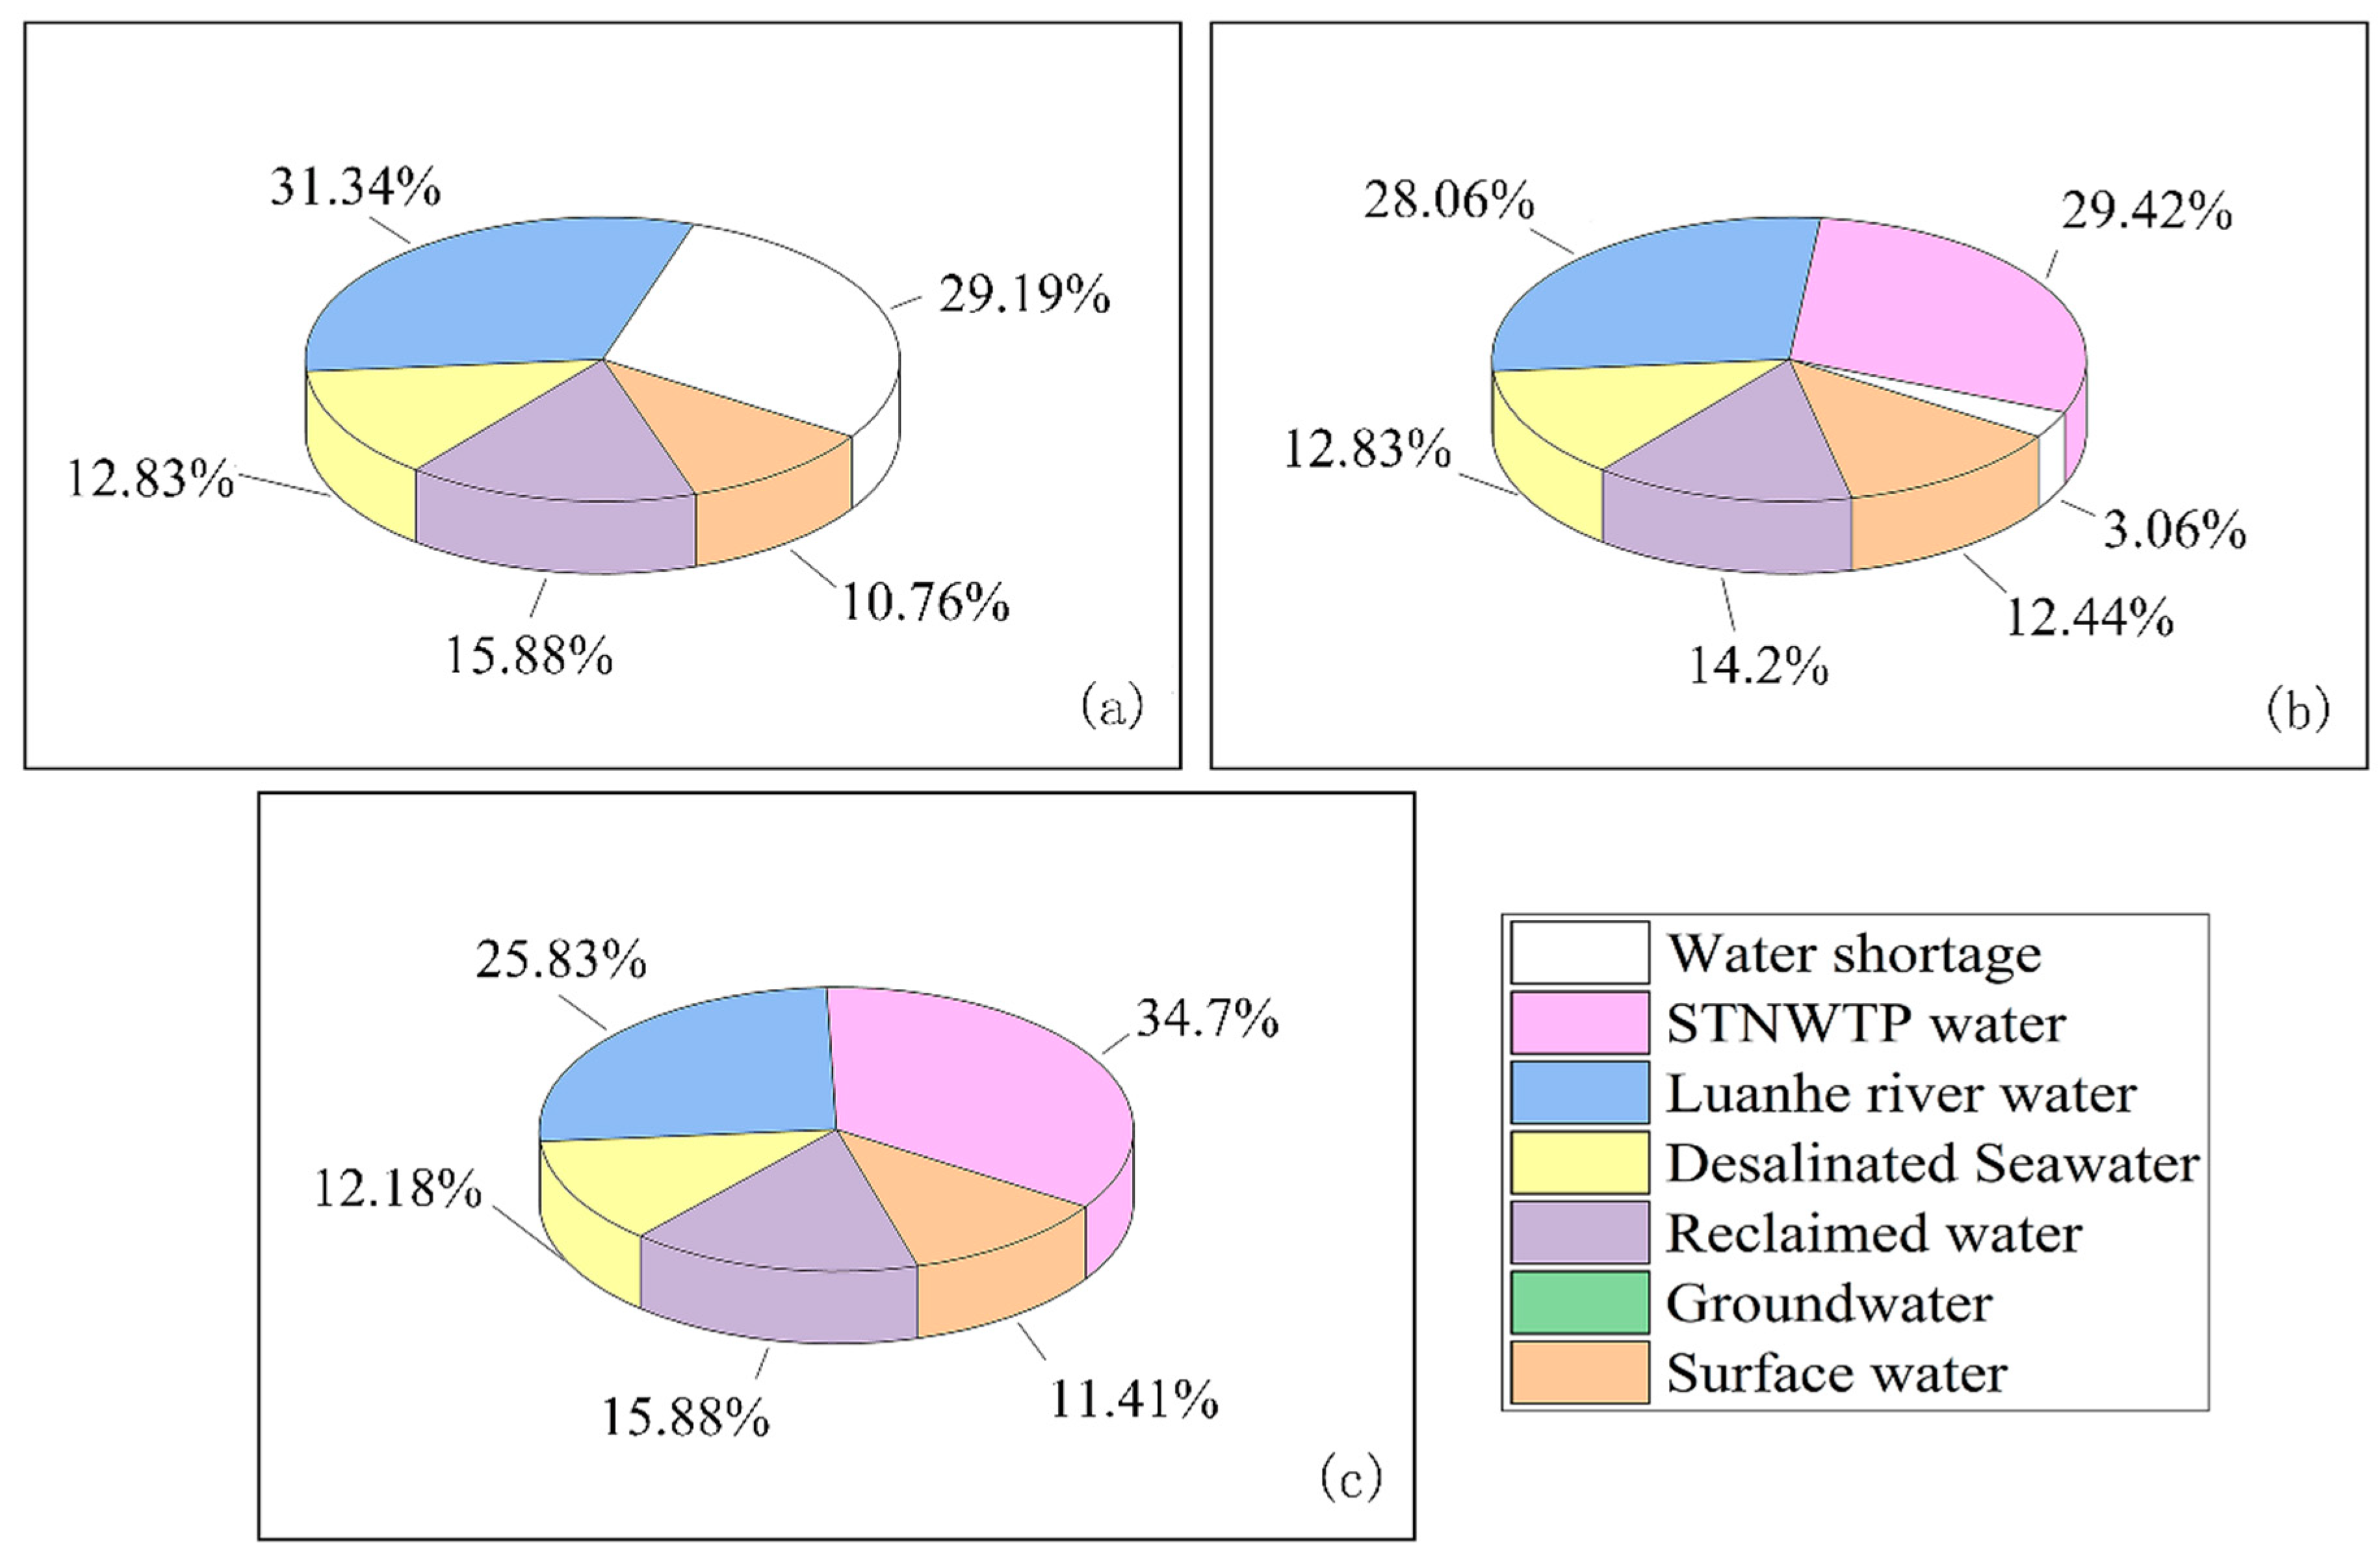
The distribution of water supply to various water sources was obtained from the statistics of the water distribution results for users in suburban areas, as shown in Figure 8. As can be seen from the figure, surface water and groundwater in the three schemes are the main source of water supply. The proportion of water from the STNWTP increases gradually as the amount of water from the STNWTP increases, while the water shortages gradually decrease to zero. It can be seen in Figure 7 and Figure 8 that: (a) groundwater and STNWTP water are the main sources for the domestic and industrial sectors; (b) surface water is the main supply for agricultural water use; and (c) reclaimed water is the main supply for ecological and industrial water requirements. The Luanhe river water changed from supplying water for domestic and industrial water use to supplying water for industrial and agricultural water requirements as the amount of STNWTP water used increased.
4.2.4. Analysis of Water Supply Guarantee Rates in the Zhongxinchengqu and Binhaixinqu Areas
Figure 9 shows the variation in users’ water guarantee rates for different schemes in the Zhongxinchengqu and Binhaixinqu areas (Zhongxincheng, Beibu, Xibu, Nanbu, Binhaibei, and Binhainan). As can be seen from the figure, as the amount of STNWTP water in the scheme is increased, the water guarantee rate of the four types of water users within the six zones presents an upward trend, until they all of reach 100%. As can be seen in Figure 9a, the shortage of diversion water caused by the lack of STNWTP water leads to serious water shortages in many zones, especially in the water demand from industry and agriculture in Zhongxinchengqu, Xibu, and Binhainan. In the scheme with low amounts of STNWTP water (surface water 50% + Luanhe river water 75% + STNWTP water 95%, (Figure 9b), the water guarantee rate for each region has been significantly improved. Except for a small amount of water shortages for agricultural users in some regions, the water requirements of users can be met. In the scheme with the highest amount of STNWTP water (surface water 50% + Luanhe river water 75% + STNWTP water 75%, (Figure 9c), the water demand requirements of all users within the zones are 100% satisfied.
4.2.5. Distribution of Water Supply in the Zhongxinchengqu and Binhaixinqu Areas
Figure 10 shows the water supply distribution for various water sources in the Zhongxinchengqu and Binhaixinqu areas. As the amount of STNWTP water in the three schemes is changed, the distribution of water supply in these areas and the main source of the water supply have changed significantly. In Figure 9a, the highest proportion of water supply in these areas is from Luanhe river water, while in Figure 10b,c, the main water supply is from the STNWTP, and the proportion of STNWTP increases. According to the analysis presented in Figure 9, STNWTP water plays an extremely important role in the water supply system of the Zhongxinchengqu and Binhaixinqu areas. In addition, water in these areas is essentially provided by external diversion water, and thus the areas are highly dependent on external diversion water.
In conclusion, water from the STNWTP is one of the most important external water sources for Tianjin, and plays a crucial role in the water supply system of Tianjin. The change in the amount of STNWTP water supplied has a direct impact on the overall water use guarantee rate of Tianjin. By comparing Figure 7 and Figure 9, it can be seen that (a) local water sources (surface water and groundwater) provide a relatively large contribution in the suburban areas, and thus the change in water supply from the STNWTP has little influence on the suburban areas; and (b) the water supply in the Zhongxinchengqu and Binhaixinqu areas mainly depends on external water sources (Luanhe river water and STNWTP water). In addition, STNWTP water accounts for a large proportion of the supply to domestic and industrial users. A change in the amount of water from the STNWTP will have a large impact on the water guarantee rate for the Zhongxinchengqu and Binhaixinqu areas, and will change the water supply distribution and the main source of water for the different water users. Therefore, it is of great significance for the socio-economic development of Tianjin’s to: ensure the stability of water supply from the STNWTP, effectively control the fluctuations in water guarantee rate in Tianjin, and maintain the stable operation of the water supply system.
5. Conclusions
The purpose of this investigation was to analyze a regional water supply system that possessed a high degree of complexity. Tianjin was selected for the analysis. The major research design of the paper is using the concept of independent events in probability theory, the investigation combines the encounter probability of different frequencies of multiple water sources with a refined water resources allocation model, it is the major innovation point of the paper. Multiple water sources with different design frequency combinations were set for simulation, and the analysis results can draw the following conclusions.
- The research analyzes the quantitative relationships between the uncertainties in the multi-source water supplies and the regional water guarantee rate. With the increase in the types of external water sources, the total amount of water supply in Tianjin increases significantly, the guaranteed rate of water use also shows an upward trend. However, the encounter probability of different combinations of design frequencies of multiple water sources gradually decreases.
- The research reveals the difference of water supply stability of various sources in Tianjin, and the influence of water price of different sources on water supply cost. For different requirements of water guarantee rate, the number of satisfied schemes when using both Luanhe river water and STNWTP water is obviously higher than when a single external source is used. The occurrence probability of the schemes meeting the lowest water guarantee rate clearly improved, and indicates that the water supply stability provided by the STNWTP is higher than that provided by Luanhe river water. However, at the same time, the large dependence on STNWTP water substantially increases the water supply costs.
- The research describes quantitatively the distribution of water supplies from multiple water sources to different users in different regions, and describes the influence of the change in water supply sources on the main body of water supply for regional water users. Without diversions from the STNWTP water or Luanhe river water, there were serious water shortages for the four water user sectors in Tianjin, especially the industrial, agricultural, and ecological users. The dependence of suburban areas on external water transfers is relatively low, while changes in water quantity from external water sources has a great impact on the water supply to the Zhongxinchengqu and Binhaixinqu areas, and will change the distribution and main source of water supply for different water users.
Author Contributions
Conceptualization, S.Z. and J.Y.; Investigation, C.Z.; Methodology, S.Z., J.Y., Z.X. and C.Z.; Supervision, S.Z. and C.Z.; Validation, S.Z., J.Y. and Z.X.; Writing—original draft, J.Y.
Funding
This study was supported by the 13th Five-Year National Key Research and Development Program of China (2016YFC0401406, 2016YFC0401407) and the Fundamental Research Funds for the Central Universities (2019MS030).
Acknowledgments
The authors thank the Haihe River Water Conservancy Commission for providing the data of water plant and pipeline network, Tianjin Water Bureau for providing the date of surface water, groundwater, Luanhe River water and STNWTP water. We thank Paul Seward, PhD, from Liwen Bianji, Edanz Group China (www.liwenbianji.cn/ac), for editing the English text of a draft of this manuscript.
Conflicts of Interest
The authors declare no conflict of interest.
References
- Wu, P.L.; Chen, X.H. Sustainable development of Shandong peninsula urban agglomeration: A scenario analysis based on water shortage and water environment changes. Ecol. Econ. 2008, 4, 189–197. [Google Scholar]
- Koleva, M.N.; Calderón, A.J.; Zhang, D.; Styan, C.A.; Papageorgiou, L.G. Integration of environmental aspects in modelling and optimisation of water supply chains. Sci. Total Environ. 2018, 636, 314–338. [Google Scholar] [CrossRef] [PubMed]
- Gebremeskel, G.; Kebede, A. Estimating the effect of climate change on water resources: Integrated use of climate and hydrological models in the Werii watershed of the Tekeze river basin, Northern Ethiopia. Agric. Nat. Resour. 2018, 52, 195–207. [Google Scholar] [CrossRef]
- Ren, C.F.; Li, R.H.; Zhang, L.D. Multiobjective stochastic fractional goal programming model for water resources optimal allocation among industries. J. Water Resour. Plan. Manag. 2016, 142, 04016036. [Google Scholar] [CrossRef]
- Maiolo, M.; Mendino, G.; Pantusa, D. Optimization of drinking water distribution systems in relation to the effects of climate change. Water 2017, 9, 803. [Google Scholar] [CrossRef]
- Huang, G.H.; Chang, N.B. The perspectives of environmental informatics and systems analysis. J. Environ. Inf. 2003, 1, 1–7. [Google Scholar] [CrossRef]
- Wang, L.Z.; Fang, L.P.; Hipel, K.W. Water resources allocation: A cooperative game theoretic approach. J. Environ. Inf. 2003, 2, 11–22. [Google Scholar] [CrossRef]
- Paton, F.L.; Dandy, G.C.; Maier, H.R. Integrated Framework for Assessing urban Water Supply Security of Systems with Non-Traditional Sources under Climate Change. Environ. Modell. Softw. 2014, 60, 302–319. [Google Scholar] [CrossRef]
- Kanakoudis, V.; Tsitsifli, S.; Papadopoulou, A.; Curk, B.C.; Karleusa, B. Water resources vulnerability assessment in the Adriatic Sea region: The case of Corfu Island. Environ. Sci. Pollut. Res. 2017, 24, 20173–20186. [Google Scholar] [CrossRef]
- Tu, X.J.; Du, X.X.; Singh, V.P.; Chen, X.H. Joint risk of interbasin water transfer and impact of the window size of sampling low flows under environmental change. J. Hydrol. 2017, 554, 1–11. [Google Scholar] [CrossRef]
- Juan, L.C. Interbasin water transfers and the size of regions: An economic geography example. Water Resour. Econ. 2018, 21, 40–54. [Google Scholar]
- Annys, S.; Adgo, E.; Ghebreyohannes, T.; Van Passel, S. Impacts of the hydropower-controlled Tana-Beles interbasin water transfer on downstream rural livelihoods (northwest Ethiopia). J. Hydrol. 2019, 569, 436–448. [Google Scholar] [CrossRef]
- Office of the South-to-North Water Diversion Project Construction Committee, State Council, PRC. The south-to-north water diversion project. Engineering 2016, 2, 265–267. [Google Scholar] [CrossRef]
- Huw, P. Compensating for the socioeconomic costs of catchment protection: The case of China’s South-North Water Transfer. Water Secur. 2019, 6, 100023. [Google Scholar] [CrossRef]
- Fu, H.; Yang, X.L. Effects of the south-north water diversion project on the water dispatching pattern and ecological environment in the water receiving area: a case study of the fuyang river basin in handan, China. Water 2019, 11, 845. [Google Scholar] [CrossRef]
- Kuo, Y.M.; Liu, W.W.; Zhao, E.M. Water quality variability in the middle and down streams of Han River under the influence of the Middle Route of South-North water diversion project, China. J. Hydrol. 2019, 569, 218–229. [Google Scholar] [CrossRef]
- Lefkoff, L.J.; Kendall, D.R. Optimization modeling of a new facility for the California state water project. JAWRA J. Am. Water Resour. Assoc. 1996, 32, 451–463. [Google Scholar] [CrossRef]
- Huang, W.; Chen, J. Approach on running mechanisms of water right allocation and water market in interbasin diversion project. J. Yangtze River Sci. Res. Inst. 2006, 23, 50–52. (In Chinese) [Google Scholar]
- Puleo, V.; Fontanazza, C.M.; Notaro, V. Multi sources water supply system optimal control: a case study. Procedia Eng. 2014, 89, 247–254. [Google Scholar] [CrossRef]
- Jean-Christophe, P. Conflicting Objectives in Groundwater Management. Water Resour. Econ. 2018, in press. [Google Scholar] [CrossRef]
- Lopes, A.F.; Macdonald, J.L.; Quinteiro, P.; Arroja, L.; Carvalho-Santos, C.; Cunha-e-Sá, M.A.; Dias, A.C. Surface vs. Groundwater: The Effect of Forest Cover on the Costs of Drinking Water. Water Resour. Econ. 2018, in press. [Google Scholar] [CrossRef]
- Martinsen, G.; Liu, S.; Mo, X.; Bauer-Gottwein, P. Joint optimization of water allocation and water quality management in Haihe River basin. Sci. Total Environ. 2018, 654, 72–84. [Google Scholar] [CrossRef] [PubMed]
- Montazar, A.; Riazi, H.; Behbahani, S.M. Conjunctive water use planning in an irrigation command area. Water Resour. Manag. 2010, 24, 577–596. [Google Scholar] [CrossRef]
- Wu, X.; Yi, Z.; Wu, B. Optimizing conjunctive use of surface water and groundwater for irrigation to address human-nature water conflicts: A surrogate modeling approach. Agric. Water Manag. 2016, 163, 380–392. [Google Scholar] [CrossRef]
- Fu, Q.; Li, J.H.; Liu, D.; Li, T.X. Allocation optimization of water resources based on uncertainty stochastic programming model considering risk value. Trans. Chin. Soc. Agric. Eng. 2016, 32, 136–144. [Google Scholar]
- Suo, M.Q.; Wu, P.F.; Zhou, B. An integrated method for interval multi-objective planning of a water resource system in the eastern part of Handan. Water 2017, 9, 528. [Google Scholar] [CrossRef]
- Yu, B.; Liang, G.H.; He, B. Modeling of joint operation for urban water-supply system with multi-water sources and its application. Adv. Water Sci. 2015, 26, 874–884. (In Chinese) [Google Scholar]
- Chen, S.; Xu, J.J.; Li, Q.Q. A copula-based interval-bistochastic programming method for regional water allocation under uncertainty. Agric. Water Manag. 2019, 217, 154–164. [Google Scholar] [CrossRef]
- Singh, A. Simulation–optimization modeling for conjunctive water use management. Agric. Water Manag. 2014, 141, 23–29. [Google Scholar] [CrossRef]
- Hassan-Esfahani, L.; Torres-Rua, A.; Mckee, M. Assessment of optimal irrigation water allocation for pressurized irrigation system using water balance approach, learning machines, and remotely sensed data. Agric. Water Manag. 2015, 153, 42–50. [Google Scholar] [CrossRef]
- Abdulbaki, D.; Al-Hindi, M.; Yassine, A. An optimisation model for the allocation of water resources. J. Clean. Product. 2017, 164, 994–1006. [Google Scholar] [CrossRef]
- Tianjin Municipal Bureau of Statistics. Tianjin’s Statistical Yearbook; Tianjin Municipal Bureau of Statistics: Tianjin, China, 2015. (In Chinese)
- Zhang, S.H.; Yang, J.S. Multi-water source joint scheduling model using a refined water supply network: case study of Tianjin. Water 2018, 10, 1580. [Google Scholar] [CrossRef]
- Michael Steele, J. Probability Theory: Formal. International Encyclopedia of the Social & Behavioral Sciences, 2nd ed.; Cambridgle University Press: Cambridge, UK, 2015; pp. 33–36. [Google Scholar]
- Ross, M.S. Introduction to Probability Theory. Introduction to Probability Models, 12th ed.; Academic Press: Amsterdam, The Netherlands, 2019; pp. 1–21. [Google Scholar]
- Hou, B.D.; Gao, E.K.; Xu, Z.Z. Connotation, calculation and application of guarantee rate of water use. China Water Resour. 2015, 17, 12–15. (In Chinese) [Google Scholar]
- Lavric, V.; Pertrica, l. Optimal water system topology through genetic algori-thm under multiple contaminated-water sources constraint. Comput. Aided Chem. Eng. 2004, 18, 433–438. [Google Scholar]
- Wang, L.T. Detailed Water Allocation of Urban. Complex. Water Utilization System—Case Study in New District of Tianjin; China Institute of Water Resource and Hydropower Research (IWHR): Beijing, China, 2015. (In Chinese) [Google Scholar]
- Xu, Y.; Wang, Y.; Li, S. Stochastic optimization model for water allocation on a watershed scale considering wetland’s ecological water requirement. Ecol. Indicat. 2018, 92, 330–341. [Google Scholar] [CrossRef]
Figure 1.
(a) Administrative and water distribution map for Tianjin. (b) Generalized water supply network. Two straight lines represent the main water supply line of the South-to-North Water Transfer Project and the Luanhe River to Tianjin project in Tianjin. Eleven blocks represent the eleven administrative divisions, and nine “water stations” are connected to two major water supply routes through a network of water pipes. The four users refer to the four types of water users in each administrative division: domestic, industrial, agricultural, and ecological water demand. All available water sources are transferred to the corresponding administrative divisions through the "water station" after unified treatment, and distributed to the four users in need for water.


Figure 2.
The flow chart of the research.

Figure 3.
Six schemes when Luanhe river water is the only external water source.

Figure 4.
Nine schemes when the STNWTP is the only external water source.

Figure 5.
Eighteen schemes when both Luanhe river water and STNWTP water are used.

Figure 6.
The guarantee rate of water use in Tianjin for: (a) (surface water 50% + Luanhe river water 75%); (b) (surface water 50% + Luanhe river water 75% + STNWTP water 95%); (c) (surface water 50% + Luanhe river water 75% + STNWTP water 75%).
Figure 6.
The guarantee rate of water use in Tianjin for: (a) (surface water 50% + Luanhe river water 75%); (b) (surface water 50% + Luanhe river water 75% + STNWTP water 95%); (c) (surface water 50% + Luanhe river water 75% + STNWTP water 75%).

Figure 7.
The guarantee rate of water use in suburban areas for: (a) (surface water 50% + Luanhe river water 75%); (b) (surface water 50% + Luanhe river water 75% + STNWTP water 95%); (c) (surface water 50% + Luanhe river water 75% + STNWTP water 75%). All coordinates in the figure are the same and shown in Example.

Figure 8.
Distribution of water supply in suburban areas for: (a) (surface water 50% + Luanhe river water 75%); (b) (surface water 50% + Luanhe river water 75% + STNWTP water 95%); (c) (surface water 50% + Luanhe river water 75% + STNWTP water 75%).
Figure 8.
Distribution of water supply in suburban areas for: (a) (surface water 50% + Luanhe river water 75%); (b) (surface water 50% + Luanhe river water 75% + STNWTP water 95%); (c) (surface water 50% + Luanhe river water 75% + STNWTP water 75%).

Figure 9.
Guarantee rate of water use in the Zhongxinchengqu and Binhaixinqu areas for: (a) (surface water 50% + Luanhe river water 75%); (b) (surface water 50% + Luanhe river water 75% + STNWTP water 95%); (c) (surface water 50% + Luanhe river water 75% + STNWTP water 75%). All coordinates in the figure are the same and shown in Example.

Figure 10.
Distribution of water supply in Zhongxinchengqu and Binhaixinqu areas for: (a) (surface water 50% + Luanhe river water 75%); (b) (surface water 50% + Luanhe river water 75% + STNWTP water 95%); (c) (surface water 50% + Luanhe river water 75% + STNWTP water 75%).
Figure 10.
Distribution of water supply in Zhongxinchengqu and Binhaixinqu areas for: (a) (surface water 50% + Luanhe river water 75%); (b) (surface water 50% + Luanhe river water 75% + STNWTP water 95%); (c) (surface water 50% + Luanhe river water 75% + STNWTP water 75%).


Table 1.
Water demand forecasting for Tianjin in 2030 (units = 108 m3).
| Water Users Administrative Divisions | Domestic Water Demand | Industrial Water Demand | Agricultural Water Demand | Ecological Water Demand | Total | |
|---|---|---|---|---|---|---|
| Zhongxin cheng Area | Zhongxin Chengqu | 5.46 | 3.06 | 1.17 | 2.89 | 12.58 |
| Suburban Area | Jixian | 0.46 | 0.46 | 0.73 | 0.05 | 1.7 |
| Baodi | 0.47 | 0.18 | 2.63 | 0.1 | 3.38 | |
| Wuqing | 0.84 | 0.3 | 2.16 | 0.1 | 3.4 | |
| Ninghe | 0.36 | 0.37 | 1.16 | 0.46 | 2.35 | |
| Jinghai | 0.54 | 0.28 | 0.5 | 0.05 | 1.37 | |
| Binhaixinqu Area | Beibu | 0.63 | 0.3 | 0.12 | 0.23 | 1.28 |
| Xibu | 0.63 | 0.33 | 0.12 | 0.26 | 1.34 | |
| Nanbu | 0.87 | 1.81 | 0.12 | 0.24 | 3.04 | |
| Binhaibei | 1.55 | 1.52 | 0.12 | 0.37 | 3.56 | |
| Binhainan | 0.38 | 0.82 | 0.12 | 0.11 | 1.43 | |
| City | 12.19 | 9.43 | 8.95 | 4.86 | 35.43 | |
Table 2.
Prediction units for local water supply in Tianjin in 2030 (units = 108 m3).
| Category Administrative Divisions | Surface Water | Groundwater | Reclaimed Water | Desalinated Seawater | |||
|---|---|---|---|---|---|---|---|
| Design Frequency | |||||||
| 50% | 75% | 95% | |||||
| Zhongxin cheng Area | Zhongxin Chengqu | 1.75 | 1.14 | 0.56 | 1.86 | ||
| Suburban Area | Jixian | 2.24 | 1.38 | 0.59 | 1.88 | 0.16 | |
| Baodi | 1.02 | 0.6 | 0.24 | 1.11 | 0.12 | ||
| Wuqing | 1.02 | 0.58 | 0.21 | 1.54 | 0.21 | ||
| Ninghe | 0.92 | 0.57 | 0.24 | 0.3 | 0.13 | ||
| Jinghai | 0.9 | 0.47 | 0.14 | 0.32 | 0.15 | ||
| Binhaixinqu Area | Beibu | 0.35 | 0.24 | 0.13 | 0.2 | 1.58 | |
| Xibu | 0.21 | ||||||
| Nanbu | 0.66 | 0.33 | 0.09 | 0.56 | 1.1 | ||
| Binhaibei | 0.51 | 0.27 | 0.09 | 0.66 | |||
| Binhainan | 0.25 | 0.3 | |||||
| City | 9.37 | 5.58 | 2.29 | 5.15 | 4.51 | 2.98 | |
Table 3.
Water supply from external diversions in 2030 (units = 108 m3).
| Category | Design Frequency | ||
|---|---|---|---|
| 50% | 75% | 95% | |
| Luanhe river water | 7.5 | 4.95 | |
| STNWTP water | 11 | 10.04 | 7.24 |
Table 4.
Economic benefit coefficients (units = CNY/m3).
| Category | Calculation Formula |
|---|---|
| Industrial benefit coefficient | = = 1307 |
| Domestic benefit coefficient | = 1500 |
| Agricultural benefit coefficient | = 467.44/12.32 = 37.95 |
| Ecological benefit coefficient | = 1300 |
Where the CNY is the unit of money used in the People’s Republic of China.
Table 5.
Simulation scheme settings (units = 108 m3).
| Category | Only use Luanhe river water | Only use STNWTP water | |||
|---|---|---|---|---|---|
| Luanhe river water | STNWTP water | ||||
| Surface water | Design frequency | ||||
| 75% | 95% | 50% | 75% | 95% | |
| 50% | (9.37,7.5) | (9.37,4.95) | (9.37,11) | (9.37,10.04) | (9.37,7.24) |
| 75% | (5.58,7.5) | (5.58,4.95) | (5.58,11) | (5.58,10.04) | (5.58,7.24) |
| 95% | (2.29,7.5) | (2.29,4.95) | (2.29,11) | (2.29,10.04) | (2.29,7.24) |
| Use both Luanhe river water and STNWTP water | |||||
| Category | STNWTP water | ||||
| Surface water | Luanhe river water | Design frequency | |||
| 50% | 75% | 95% | |||
| 50% | 75% | (9.37,7.5,11) | (9.37,7.5,10.04) | (9.37,7.5,7.24) | |
| 95% | (9.37,4.95,11) | (9.37,4.95,10.04) | (9.37,4.95,7.24) | ||
| 75% | 75% | (5.58,7.5,11) | (5.58,7.5,10.04) | (5.58,7.5,7.24) | |
| 95% | (5.58,4.95,11) | (5.58,4.95,10.04) | (5.58,4.95,7.24) | ||
| 95% | 75% | (2.29,7.5,11) | (5.58,7.5,10.04) | (5.58,7.5,7.24) | |
| 95% | (2.29,4.95,11) | (5.58,4.95,10.04) | (5.58,4.95,7.24) | ||
© 2019 by the authors. Licensee MDPI, Basel, Switzerland. This article is an open access article distributed under the terms and conditions of the Creative Commons Attribution (CC BY) license (http://creativecommons.org/licenses/by/4.0/).
Share and Cite
MDPI and ACS Style
Zhang, S.; Yang, J.; Xu, Z.; Zhang, C. Effect of Frequency of Multi-Source Water Supply on Regional Guarantee Rate of Water Use. Water 2019, 11, 1356. https://doi.org/10.3390/w11071356
AMA Style
Zhang S, Yang J, Xu Z, Zhang C. Effect of Frequency of Multi-Source Water Supply on Regional Guarantee Rate of Water Use. Water. 2019; 11(7):1356. https://doi.org/10.3390/w11071356
Chicago/Turabian StyleZhang, Shanghong, Jiasheng Yang, Zan Xu, and Cheng Zhang. 2019. "Effect of Frequency of Multi-Source Water Supply on Regional Guarantee Rate of Water Use" Water 11, no. 7: 1356. https://doi.org/10.3390/w11071356
Note that from the first issue of 2016, this journal uses article numbers instead of page numbers. See further details here.