Effects of Ca2+ Concentration on Anaerobic Ammonium Oxidation Reactor Microbial Community Structure


1
Guangxi Key Laboratory of Environmental Pollution Control Theory and Technology, Guilin University of Technology, Guilin 541004, China
2
College of Environmental Science and Engineering, Guilin University of Technology, Guilin 541004, China
3
College of Civil Engineering and Architecture, Guilin University of Technology, Guilin 541004, China
*
Author to whom correspondence should be addressed.
Water 2019, 11(7), 1341; https://doi.org/10.3390/w11071341
Submission received: 11 June 2019
/
Revised: 25 June 2019
/
Accepted: 28 June 2019
/
Published: 28 June 2019
(This article belongs to the Special Issue Microbial Ecology of Wastewater Treatment)
Abstract
:The anaerobic ammonium oxidation (anammox) reaction removes nitrogen from wastewater, the performance of which is influenced by Ca2+; however, the effect of Ca2+ on microbial community structure is unclear. Therefore, the effects of Ca2+ concentration on the treatment performance of an anammox reactor and microbial community structure of anammox sludge were investigated. Ca2+ concentration minimally influenced the removal efficiency of NO2−–N and NH4+–N, but substantially influenced total N removal. Changing the Ca2+ concentration (between 25 and 125 mg/L) caused the average removal rate of total nitrogen to fluctuate by 3.3 percentage points. There were five major bacterial phyla in the anammox sludge: Proteobacteria, Chloroflexi, Acidobacteria, Planctomycete, and Chlorobi. Microbiological analysis revealed that the genera Acidobacterium, Anaerolinea, and Denitratisoma were positively correlated with Ca2+ concentration, and improved treatment performance of the anammox reactor. Moreover, uncultured Chlorobi bacterium clone RUGL1-218 (GQ421108.1) and uncultured sludge bacterium A21b (KT182572.1) may be key microorganisms for the immobilization of anammox bacteria. These findings offer a theoretical basis for improved wastewater treatment using the anammox process.
1. Introduction
Anaerobic ammonium oxidation (anammox) bacteria can convert NO2−–N and NH4+–N into N2 using NO2−–N as the electron acceptor and NH4+–N as the electron donor under anaerobic conditions [1]. Traditionally, biological nitrogen removal was performed mainly using the nitrification–denitrification process, where nitrification involves the conversion of NH4+–N into NO2−–N or NO3−–N by nitrifying bacteria under aerobic conditions [2], and denitrification is the process by which denitrifying bacteria convert NO2−–N or NO3−–N into N2 gas [3]. In comparison, the anammox process realizes the efficient use of the internal carbon source of wastewater with high NH4+–N concentrations, and effectively solves some of the shortcomings of the traditional biological nitrogen removal technology [4]. Overall, the anammox process has the advantages of low residual sludge production, low energy consumption, and no need for additional carbon sources [5]. The anammox Planctomycetes has a unique metabolism and generates energy via oxidation of ammonia without oxygen (i.e., the “anammox” process, that is, anaerobic ammonia oxidation). This process is important for global nitrogen cycling, is used for environmental cleanup of nitrogen in wastewater [6,7], and may in future considerably reduce the energy costs of sewage cleanup [8].
Calcium and other polyvalent cations are important for bioflocculation and granulation, because they can form bridges between bacteria and bioflocs that are negatively charged due to the formation of extracellular polymeric substances [9]. Calcium indirectly maintains the biomass of the bacteria by immobilizing the cells. Cell immobilization technologies are also the basis of process engineering applications [10,11]. For instance, de Graaff et al. [12] studied the autotrophic removal of N from black water, and showed that the addition of extra calcium was necessary to sustain the anammox biomass in the reactor. In addition, Jiang et al. [13] investigated specific cultured microbial particles in sludge bed reactors, and noted that divalent metal cations such as Ca2+ had an important role in microbial biomass immobilization. In particular, an increase in Ca2+ concentration from 80 to 150 mg/L promoted anammox granule formation during start-up. Liu et al. [14] studied the effect of Ca2+ on the recovery of damaged anammox bacteria, and showed that a certain concentration of Ca2+ could increase the strength and density of anammox granules, ensuring good sedimentation and high biomass. Moreover, Ca2+ precipitated on the particles reduced the effective mass transfer of the sludge [14]. These and other studies underline the importance of understanding cell immobilization in anammox processes, including granulation and biofilm, to improve the treatment performance of the reactor without changing the original microbial community structure [15,16,17,18,19,20,21].
To this end, a relatively large body of research has investigated the promotion of the anammox process and nitrogen removal by Ca2+. However, Hyun et al. [22] studied the effects of Ca2+ on biological nitrogen removal in a reverse osmosis concentrate and adsorption treatment, according to the specific denitrification rate, and observed an interesting trend. Below 500 mg/L, Ca2+ had a beneficial effect on denitrification, and the transport of anion NO3−–N and a carbon source by denitrifying microorganisms was facilitated by injection of Ca2+. In contrast, at Ca2+ concentrations above 500 mg/L, denitrification was suppressed, and the efficiency was lowered; this was caused by a large amount of precipitate formed by Ca2+, which adsorbed onto the surface of microorganisms, reducing microbial activity. Although the application of immobilized cells has been studied for 20 years, its application to the anammox process has focused on the removal performance of the reactor. By contrast, no studies have investigated the changes in microbial community structure involved in the anammox reaction during the immobilization process.
Therefore, this study investigated the effect of Ca2+ concentration on the nitrogen removal performance of an anammox reactor to determine the optimal concentration of Ca2+, specifically in the removal of TN, NH4+–N, and NO2−–N. In addition, combined with molecular biology methods, the microbial community structure changes and dominant species of anammox sludge under different Ca2+ concentrations were analyzed. These findings provide a theoretical basis for engineering applications of the anammox process.
2. Materials and Methods
2.1. Experimental Setup
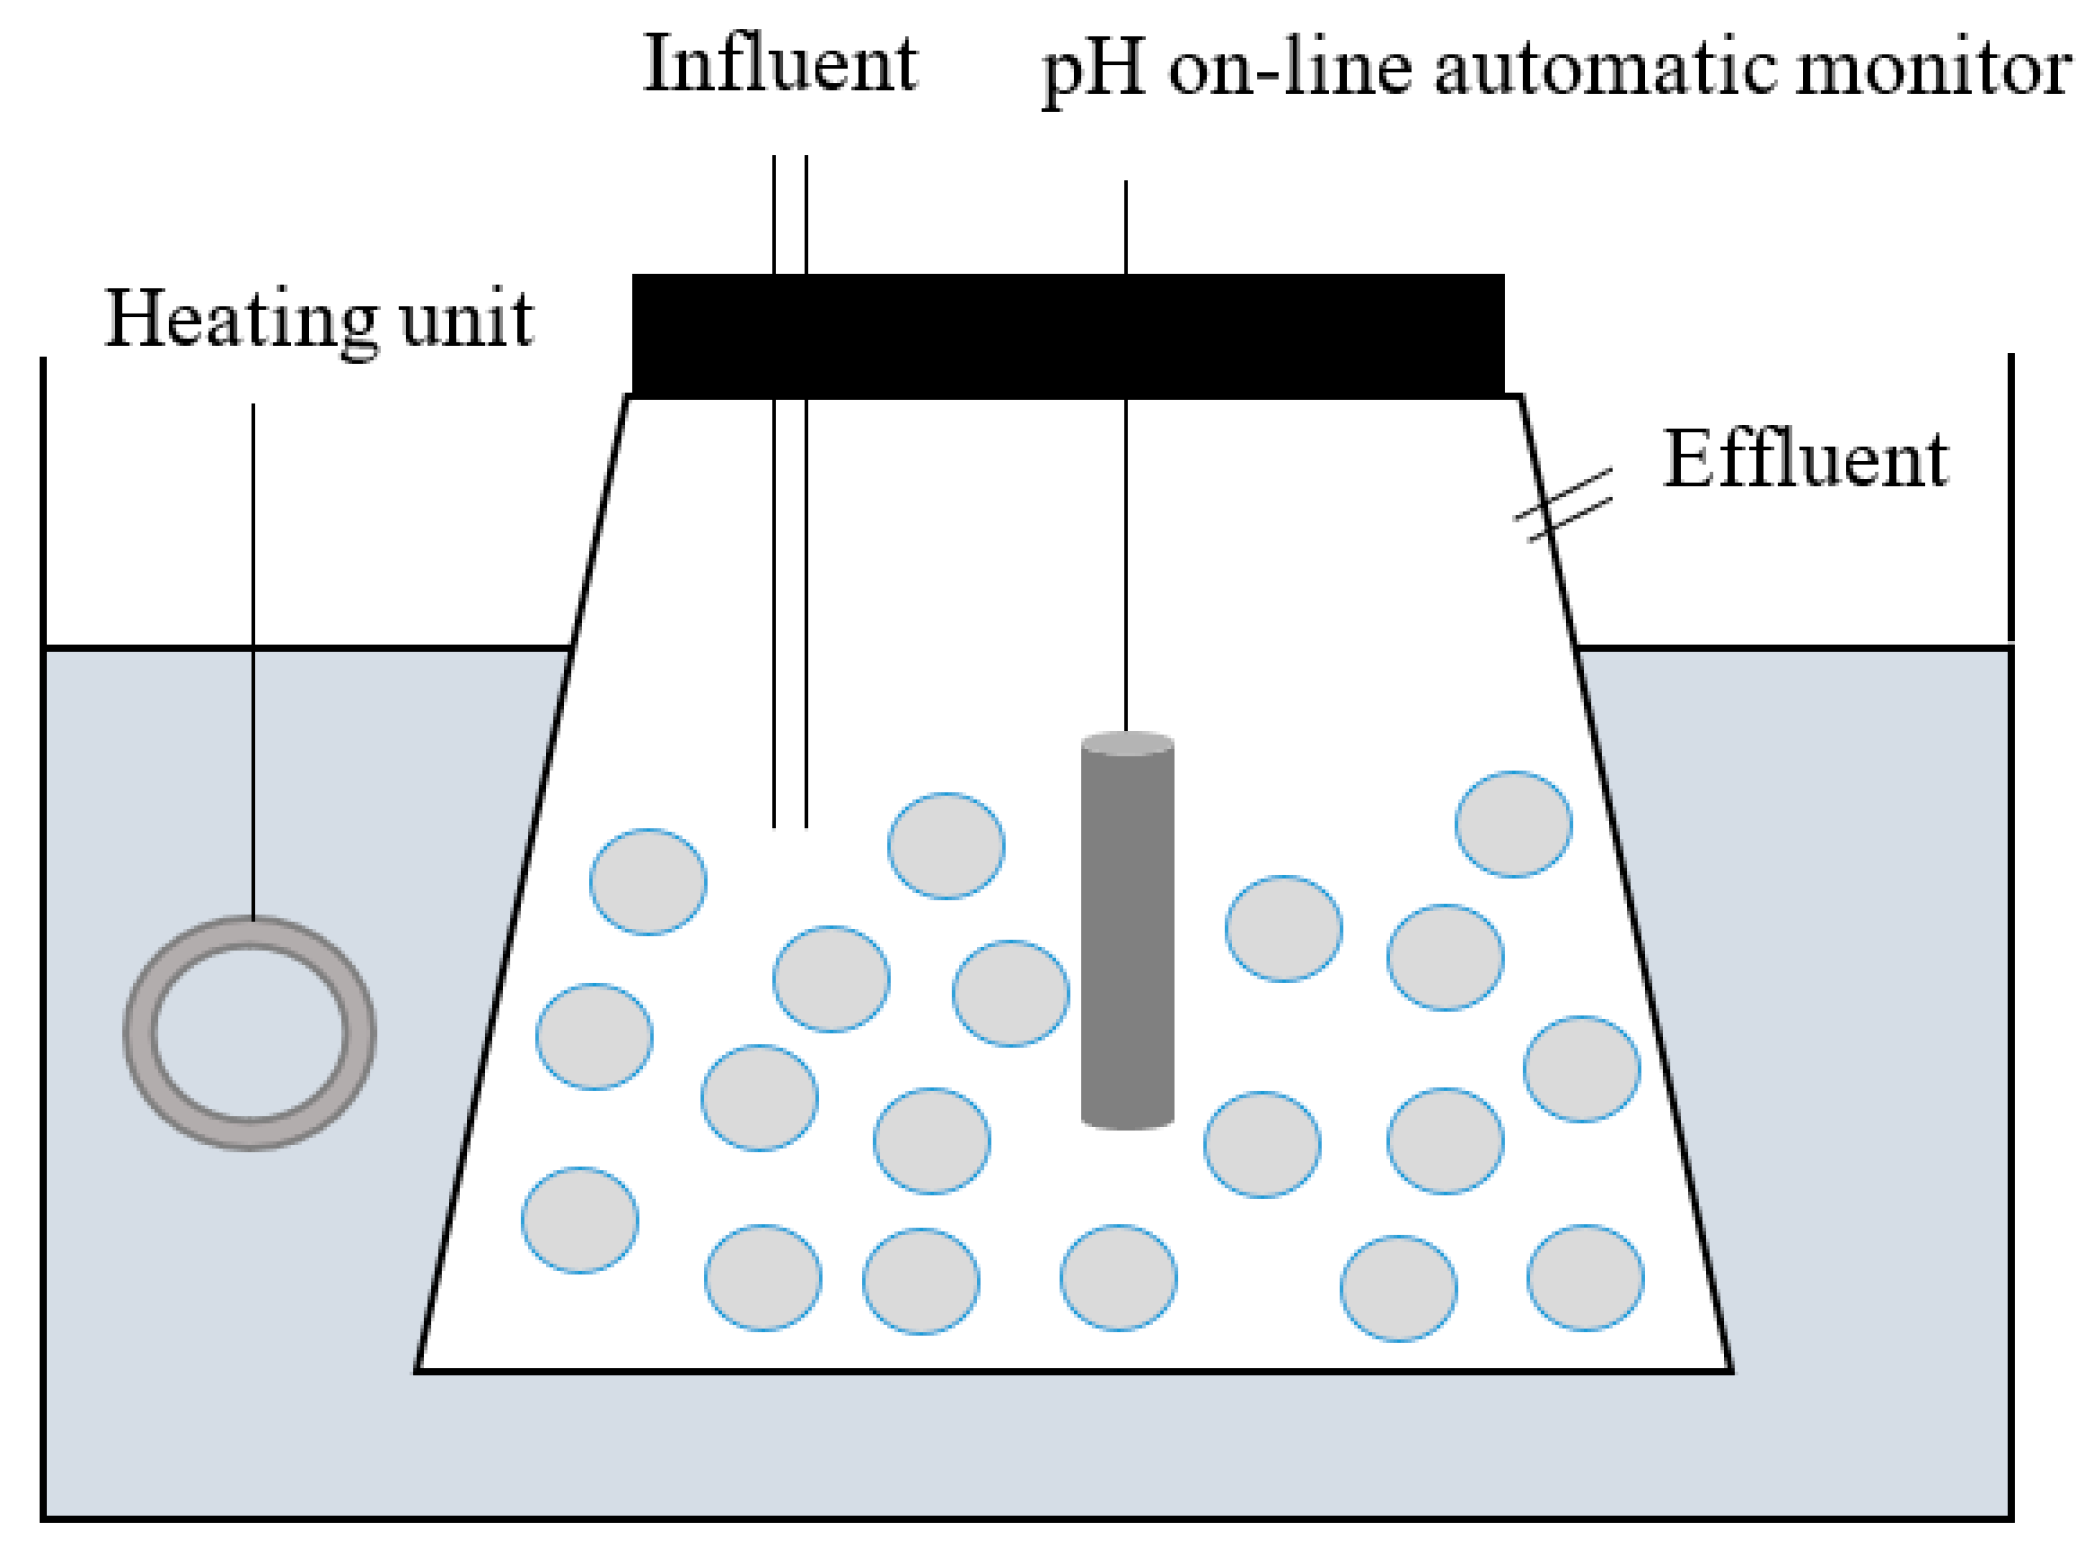
A schematic diagram of the experimental reactor used in this study is shown in Figure 1. Sequencing batch reactors made of plexiglass were used in this study. The whole device was wrapped with black cloth to occlude light, which can have a negative impact on bacteria [23,24]. The reactor was filled with the seed anammox sludge with the 1–3 mm (in length) granular activated carbon carriers, which were cultured in a 50 L reactor for 6 years at Guilin University of Technology, China, and showed high biological activity [25,26,27,28,29]. The working volume was 300 mL, and the experimental wastewater enters the reactor through a peristaltic pump. The effluent was drained from the upper area after passing through the sludge layer. The experiment was conducted at 32 ± 1 °C, controlled using a water bath. The influent pH was adjusted at 7.4~7.6 by adding 0.5 mol/L H2SO4 [30]. The dissolved oxygen (DO) concentrations of the feeding synthetic wastewater were kept below 0.5 mg/L using N2 gas purging for approximately 1 h [31].
Zhang et al. [25] showed that 35 days was sufficient to successfully start-up and restore the activity of stored anaerobic ammonium oxide sludge. Therefore, six reactors were operated simultaneously, with a running time of 35 days; and analyzed the denitrification performance. Different Ca2+ concentrations have an effect on anammox bacteria, and the effect of Ca2+ concentration on anammox process is manifested by the denitrification during the reaction.
2.2. Artificial Wastewater
Artificial wastewater was used as the experimental influent. The contents of the wastewater are listed in Table 1 and Table 2. Of note, NH4+–N was supplied as NH4HCO3 at a concentration of 20 mg/L, and NO2−–N was supplied as NaNO2 at a concentration of 30 mg/L, which were provided at a molar ratio of NH4+–N to NO2−–N of 1:1.5. KH2PO4 was added as the phosphorus source, and the concentration of phosphorus is about 7 mg/L. CaCl2 was added to final influent Ca2+ concentrations of 25, 50, 75, 100, and 125 mg/L. The synthetic wastewater was purged with N2 and a small amount of anhydrous sodium sulfite was added to control the dissolved oxygen (DO) content below 0.5 mg/L.
2.3. Analytical Methods
2.3.1. Wastewater Samples
After the reactor was started, wastewater samples were collected daily. NH4+–N and NO2−–N were measured according to the Standard Methods protocol (APHA, 1995) [32]. Total nitrogen (TN) was determined using the persulfate method (APHA, 1995) [32]. NO3−–N was calculated as the difference between TN and the sum of NH4+–N and NO2−–N. The Ca2+ concentration was determined using EDTA titration (ISO 6058-1984). pH was measured using a pH meter (9010; Jenco Instruments, San Diego, CA, USA), and DO was measured using a DO meter (6010; Jenco Instruments, San Diego, CA, USA).
2.3.2. Microbial Analysis
Sludge samples were collected from the reactors containing different Ca2+ concentrations. After dewatering, the sludge samples were sealed in a centrifuge tube and stored in a refrigerator at −20 °C. The PowerSoil DNA Isolation Kit (Mo Bio, Carlsbad, CA, USA) was used to extract DNA from the sludge samples. After verifying the purity (OD260/OD280: 1.6–1.8), the DNA was amplified by polymerase chain reaction (PCR). Using PCR, amplification of the target fragment was performed simultaneously with cleavage of the target DNA fragment. The primers used in this experiment were 968F and 1401R, and the amplified DNA fragment was the V6 region of 16S rDNA of bacteria. The sequence length was about 430 bp.
The target DNA fragment was isolated and purified via denaturing gradient gel electrophoresis (DGGE), where the DNA fragments of different microorganisms were fixed at different positions of the gel. After each step of gelation, individual bands were recovered and re-dissolved for purification of the target DNA fragment. The DGGE results were cloned and using high-throughput molecular approaches sequenced by Bioengineering Biotechnology (Shanghai) Co., Ltd. The sequences were identified with DNASTAR® software and the vector sequences at both ends were removed. The sequenced genes were compared with the National Center for Biotechnology Information (NCBI) GenBank database using BLAST analysis, and DGGE images were analyzed using Quantity One software (Bio-Rad, Hercules, CA, USA).
2.3.3. Data Analysis
Data analysis was carried out using Origin 2017 software (Origin Lab, Northampton, MA, USA). To explore the correlation between microbial diversity and environmental factors, detrended correlation analysis was performed on the species, after which redundancy analysis (RDA) was performed.
3. Results
3.1. Effect of Ca2+ Concentration on Nitrogen Removal
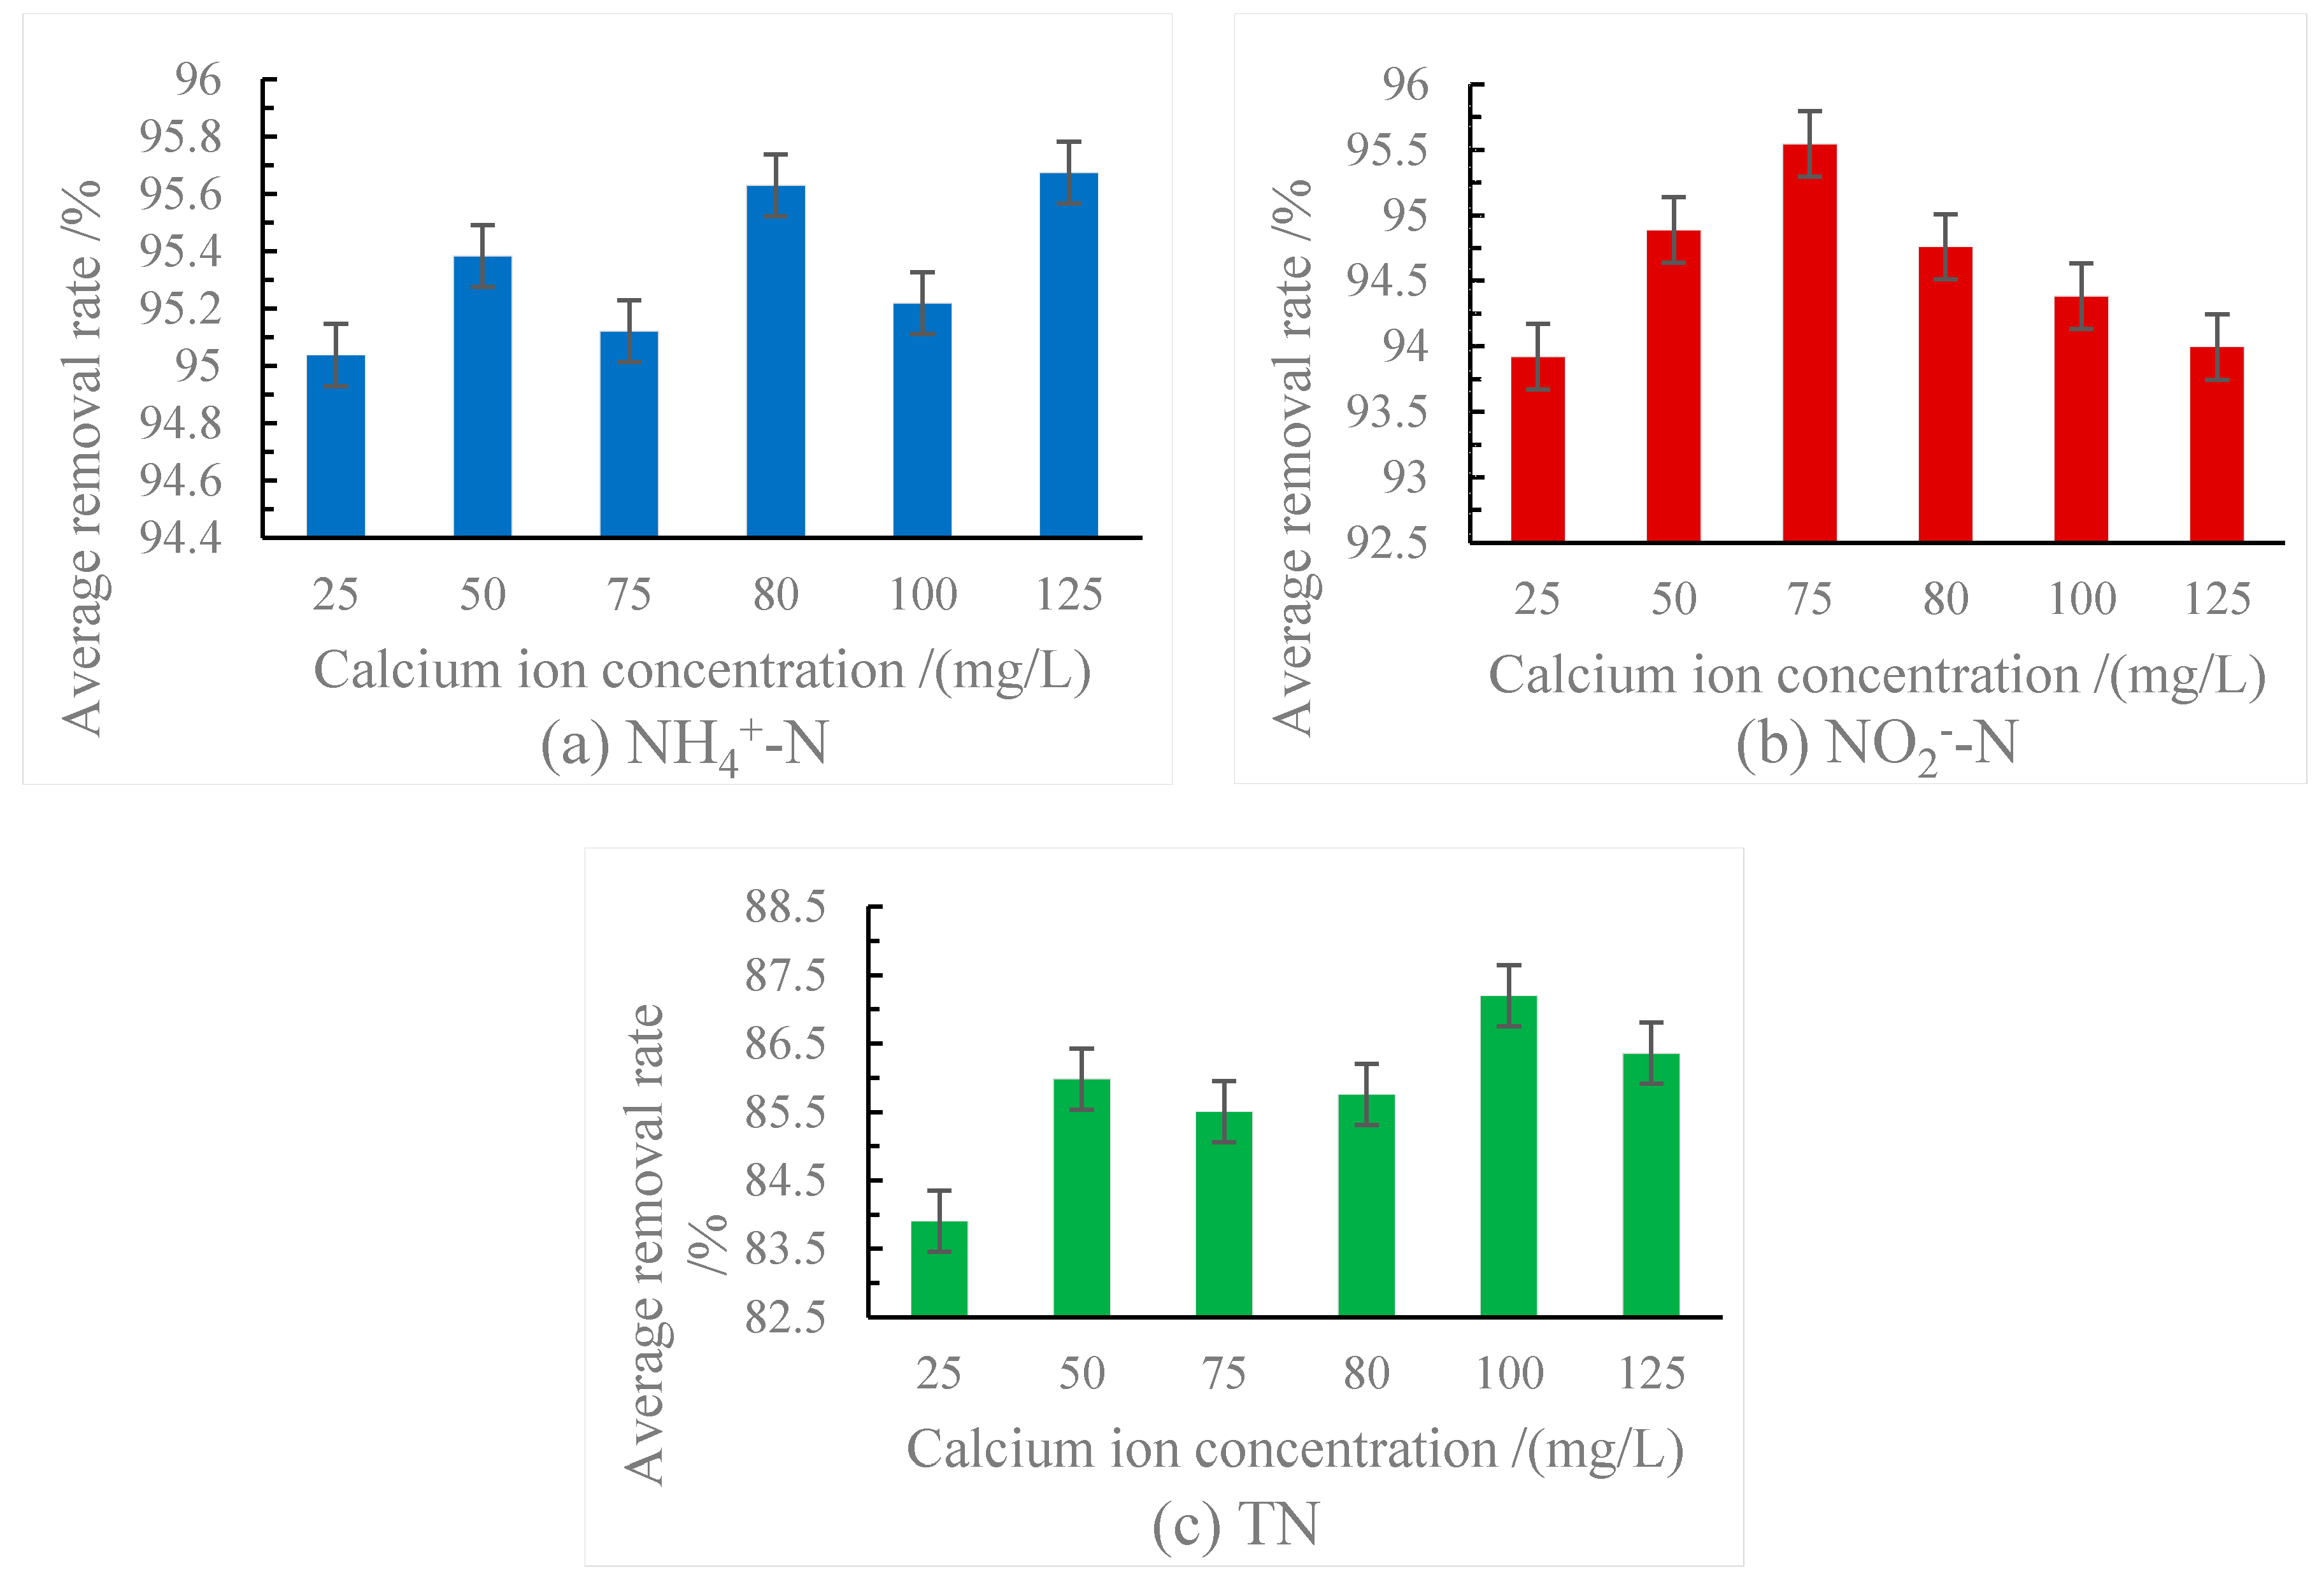
The results of nitrogen removal after 35 days of operation at different Ca2+ concentrations are shown in Figure 2. Wastewater distribution and wastewater exchange were carried out in a cycle of 3 days. For each wastewater exchange, wastewater samples were collected. The indicators NH4+–N, NO2−–N, and TN were measured, and their removal rates were analyzed.
The Ca2+ concentration had little effect on NH4+–N and NO2−–N removal (Figure 2). Nevertheless, Ca2+ concentration had a substantial influence on TN removal. For both NH4+–N and NO2−–N, the removal rates were maintained around 95% with increasing Ca2+ concentration. In the reactor containing a Ca2+ concentration of 100 mg/L, the NH4+–N removal rate fluctuated greatly (as shown by the length of the error bars in Figure 2), indicating that the presence of Ca2+ altered the community structure of microbes involved in its reaction. However, once the microorganisms adapted to the environment, the removal rate was basically maintained at 95%. According to the length of the error bars in Figure 2, the removal rate fluctuated little in the reactor containing a Ca2+ concentration of 125 mg/L; however, the microbial activity decreased when Ca2+ concentration changed, indicating that high concentrations of Ca2+ affected the environment required to maintain sludge particle structure and microbial activity.
The overall nitrogen removal rate fluctuated continuously (Figure 2), indicating that the microbial community structure associated with nitrogen removal changed constantly over time, adapting to the concentrations of Ca2+ in the reactor. Optimal Ca2+ concentrations can increase the strength and density of anammox sludge granules, ensuring good sedimentation and high biomass retention [14]. However, excessive Ca2+ will form precipitates and reduce the effective mass transfer of sludge. This could explain the different degrees of fluctuation in nitrogen removal at different Ca2+ concentrations. For instance, at a Ca2+ concentration of 100 mg/L, the removal rate fluctuated minimally, ultimately reaching 95%, indicating that the microorganisms at this concentration were bettered adapt to the environment, resulting in minimal changes to the community structure.
The removal of TN was affected by NH4+–N and NO2−–N, and overall first declined and then increased. Changing the Ca2+ concentration (between 25 and 125 mg/L) caused the average removal rate of TN to fluctuate by 3.3 percentage points. The main inhibiting factor was precipitate formed by Ca2+, which could adhere to the surface of the microorganisms involved in the reaction [33], hindering the availability of matrix nutrients to anammox bacteria, resulting in their death and thereby reducing the removal rate. Subsequently, microbial activity was restored, and the removal rate increased after the anammox bacteria lost their activity; therefore, NO3−–N accumulated as a product of the anammox reaction around the bacteria. In areas where NO3−–N concentrated, some denitrifying bacteria could grow, consuming NO3−–N as a substrate, whereas the inactivated anammox bacteria provided nutrients; therefore, denitrification could occur. Therefore, the TN removal rate showed an increasing trend in the later stage of the reaction.
3.2. DGGE
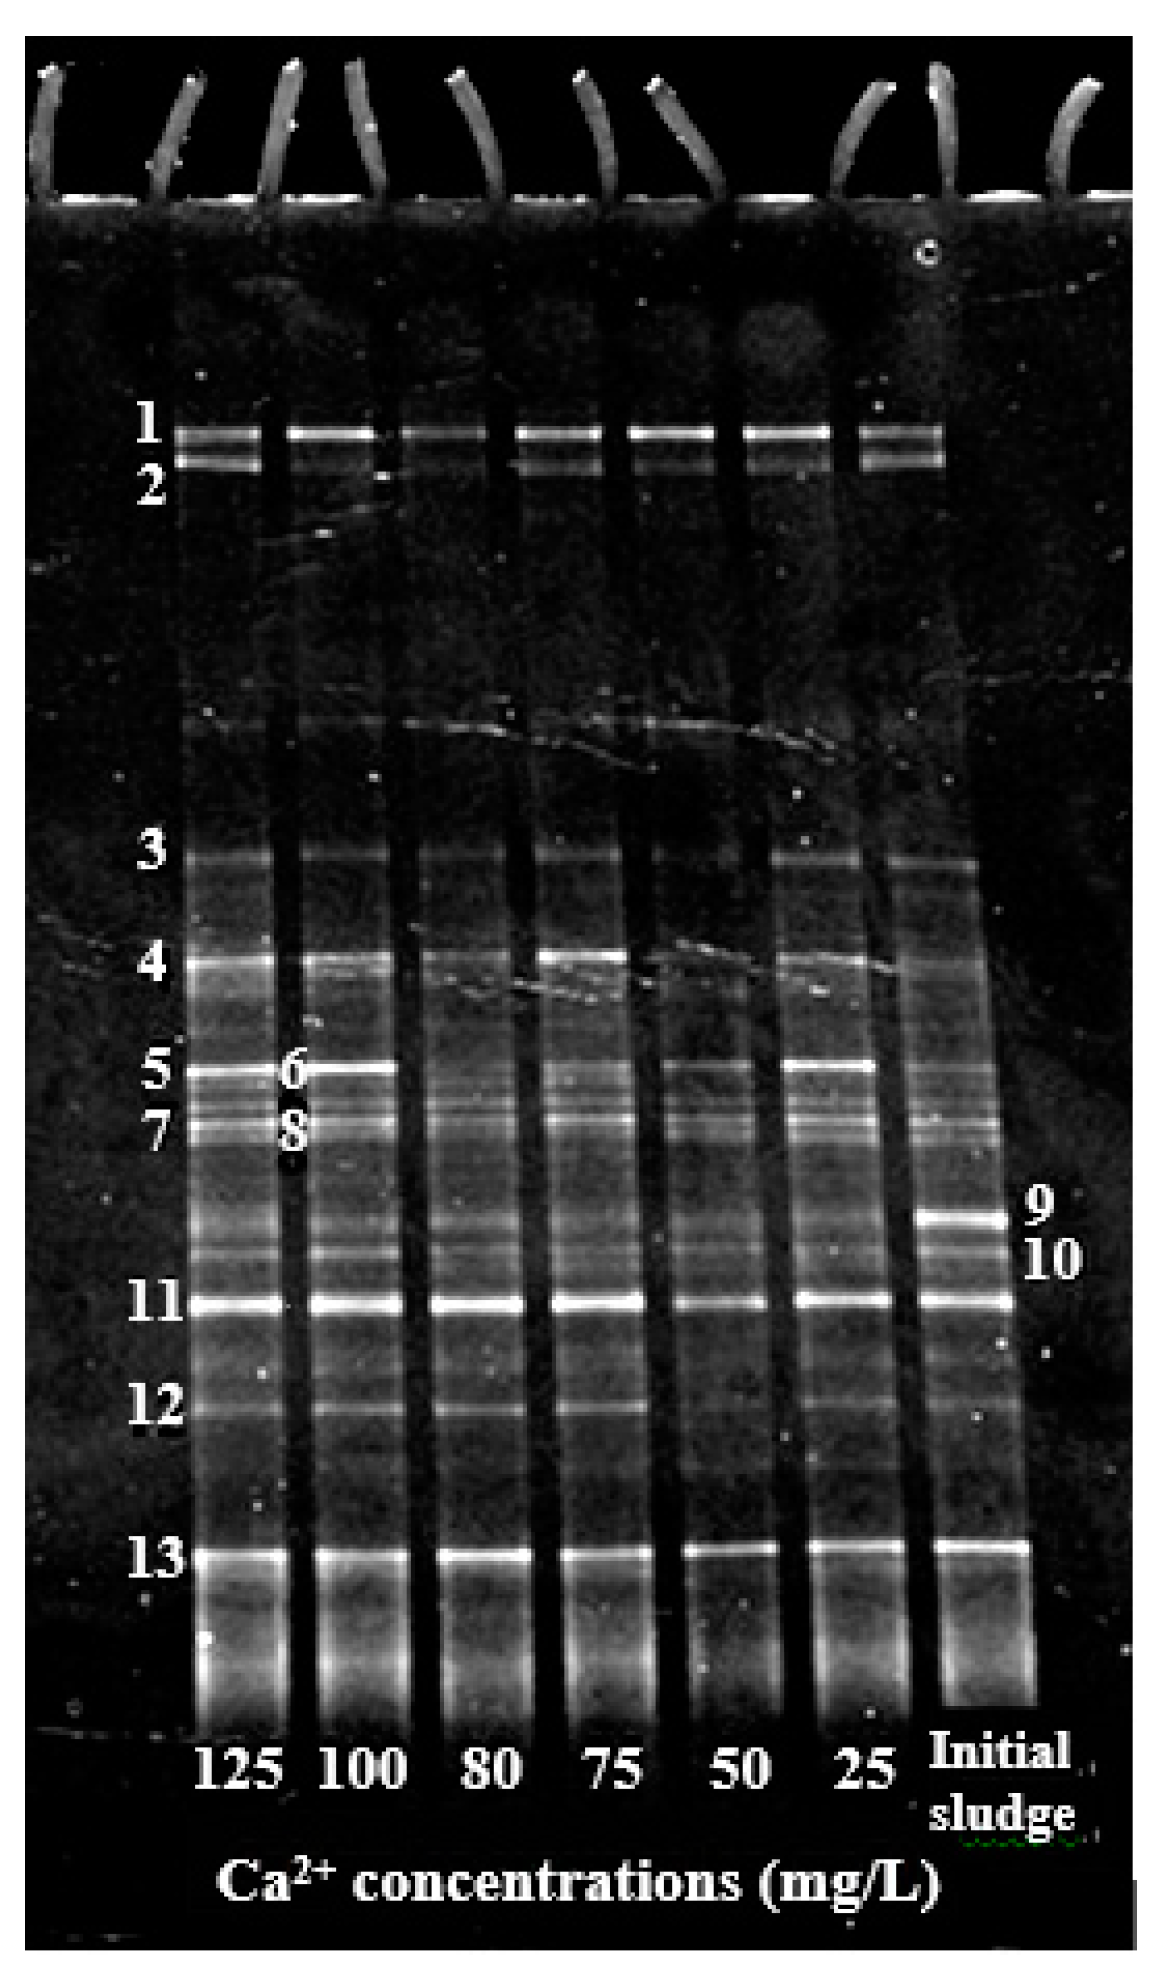
Figure 3 shows the DGGE electropherogram, which is capable of separating organisms at the genus level, where the bright and dark bands represent the dominant and inferior microbial taxa, respectively. From the changes in bright and dark bands among the reaction conditions, dominant and inferior taxa varied by Ca2+ concentration. Moreover, some bright bands were only observed at a single Ca2+ concentration. For example, band 1 was bright at all Ca2+ concentrations, indicating that it was a dominant species. Band 3 was also present at all Ca2+ concentrations, but exhibited a lower brightness, indicating that it was an inferior taxon. Band 9 was only bright (i.e., dominant) in the initial sludge, and showed low brightness at all Ca2+ concentrations. Compared to the microbial population of the initial sludge, addition of, and changes in, Ca2+ concentration resulted in substantial changes in microbial population structure.
3.3. Microbial Community Structure Analysis
Microbial diversity was analyzed using the Shannon–Weaver index and the results of the seven sludge samples are presented in Table 3. Although there were slight differences in the microbial diversity index values among the seven samples, all were greater than 2, indicative of relatively high microbial population richness, and relatively uniformity of microorganisms among the seven samples.
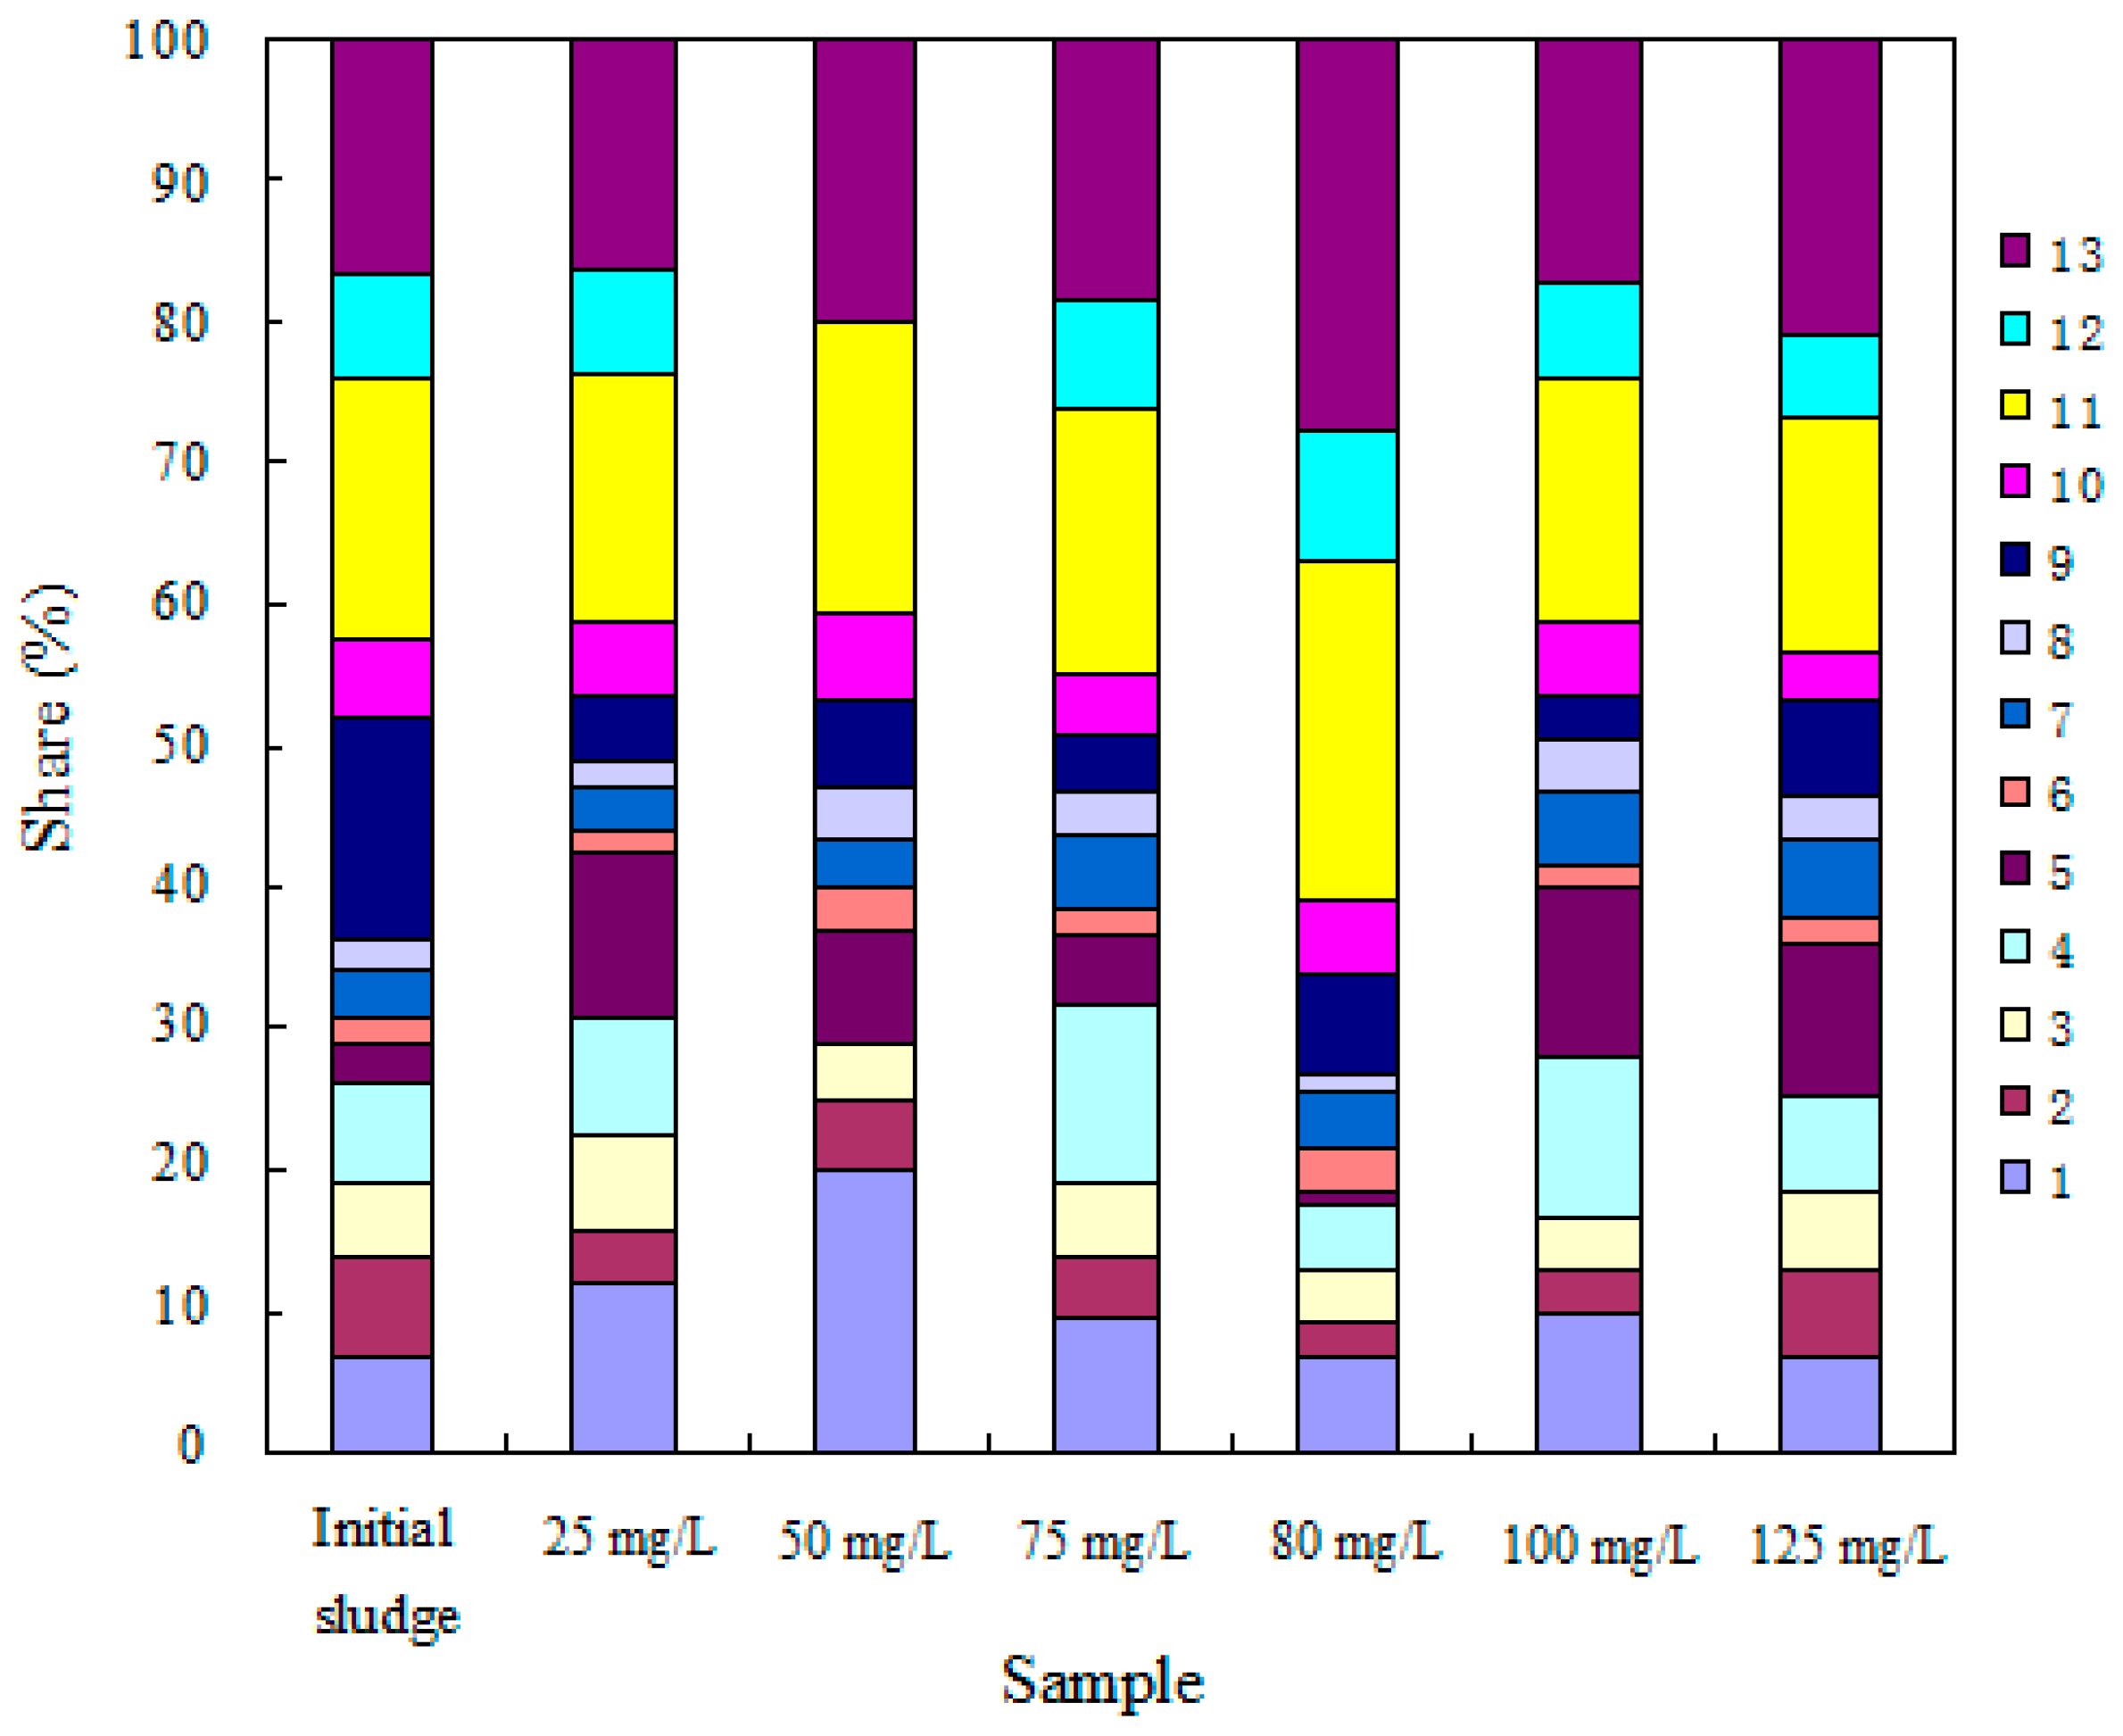
The relative proportions of the dominant taxa in the seven samples are shown in Figure 4. The microbial community structures differed substantially between the initial sludge and sludge containing added Ca2+, as well as among the samples containing different Ca2+ concentrations.
The relative concentrations of the different taxa (based on the DGGE separation) in each sample and the relative concentrations of the same taxa in different samples can be divided into several cases, as follows. First, bands 2, 6, 7, 8 and 10 showed similar degrees of dominance in all seven samples. Second, bands 1, 11 and 13 were dominant taxa in all seven samples, albeit present in varying proportions, with the maximum proportions of bands 1, 11, and 13 observed in samples 3, 5, and 5, respectively. Third, bands 5 and 9 were present in all seven samples, but were dominant taxa in samples 1 and 2; the band 5 taxon was dominant in samples 2 and 6, whereas the band 9 taxon was dominant in sample 1. Fourth, the band 3, 4 and 12 taxa were dominant in samples 1, 2, 4, 5, 6 and 7, but were not observed in sample 3. Overall, these results indicated that Ca2+ concentration influenced the microbial community structures of the anammox reactors.
The 13 bands in the DGGE results were cloned and the BLAST (Basic Local Alignment Search Tool, http://blast.ncbi.nlm.nih.gov) results with a similarity of 92%–100% are shown in Table 4. The microbial composition and dominant species in the activated sludge were analyzed by DGGE. The number and brightness of the bands were statistically different during the periods with high and low Ca2+ concentrations, indicating that the addition of Ca2+ had a significant effect on the microbial community structure. In total, 13 main bands were collected and sequenced. The resulting sequences in the anaerobic anammox sludge mainly comprised five bacterial phyla: Proteobacteria (46%), Chloroflexi, Acidobacteria, Planctomycete, Chlorobi, as well as some uninformable untrained microorganisms (UUMs). UUMs are complex and may play a variety of roles in the anammox system. No Firmicutes or Bacteroides were detected in any samples.
The Proteobacteria in the reactor could be divided into two classes: β-Proteobacteria and γ-Proteobacteria. In some DGGE bands, the bacteria could be identified to the genus and species levels; however, some of these could not be matched with known bacteria, indicating that there were undescribed strains present in the anaerobic anammox reactors. It is generally considered that a sequence homology of less than 97% is representative of different populations [34]. Analysis of the five major bacterial phyla were identified in the anaerobic anammox sludge. The microbes in band 1 belonged to the genus Ignavibacterium (Chlorobi). The microbes in band 2 belonged to Acidobacterium (Acidobacteria). The microbes in bands 4, 9, and 10 belonged to Denitratisoma (β-Proteobacteria); those in band 7 belonged to Planctomycete (Planctomycetes). Microbiologists have found Planctomycetes in the environment via culturing using media containing antibiotics, since Planctomycetes are inherently resistant to penicillin, or via clone libraries generated from DNA followed by PCR and sequencing of 16S rRNA genes. The microbes in band 8 belonged to Anaerolinea (Chloroflexi). Finally, the microbes in band 13 belonged to Steroidobacter (γ-Proteobacteria). The activities of these bacteria in sludge reactors are described in the Discussion below (Section 4).
4. Discussion
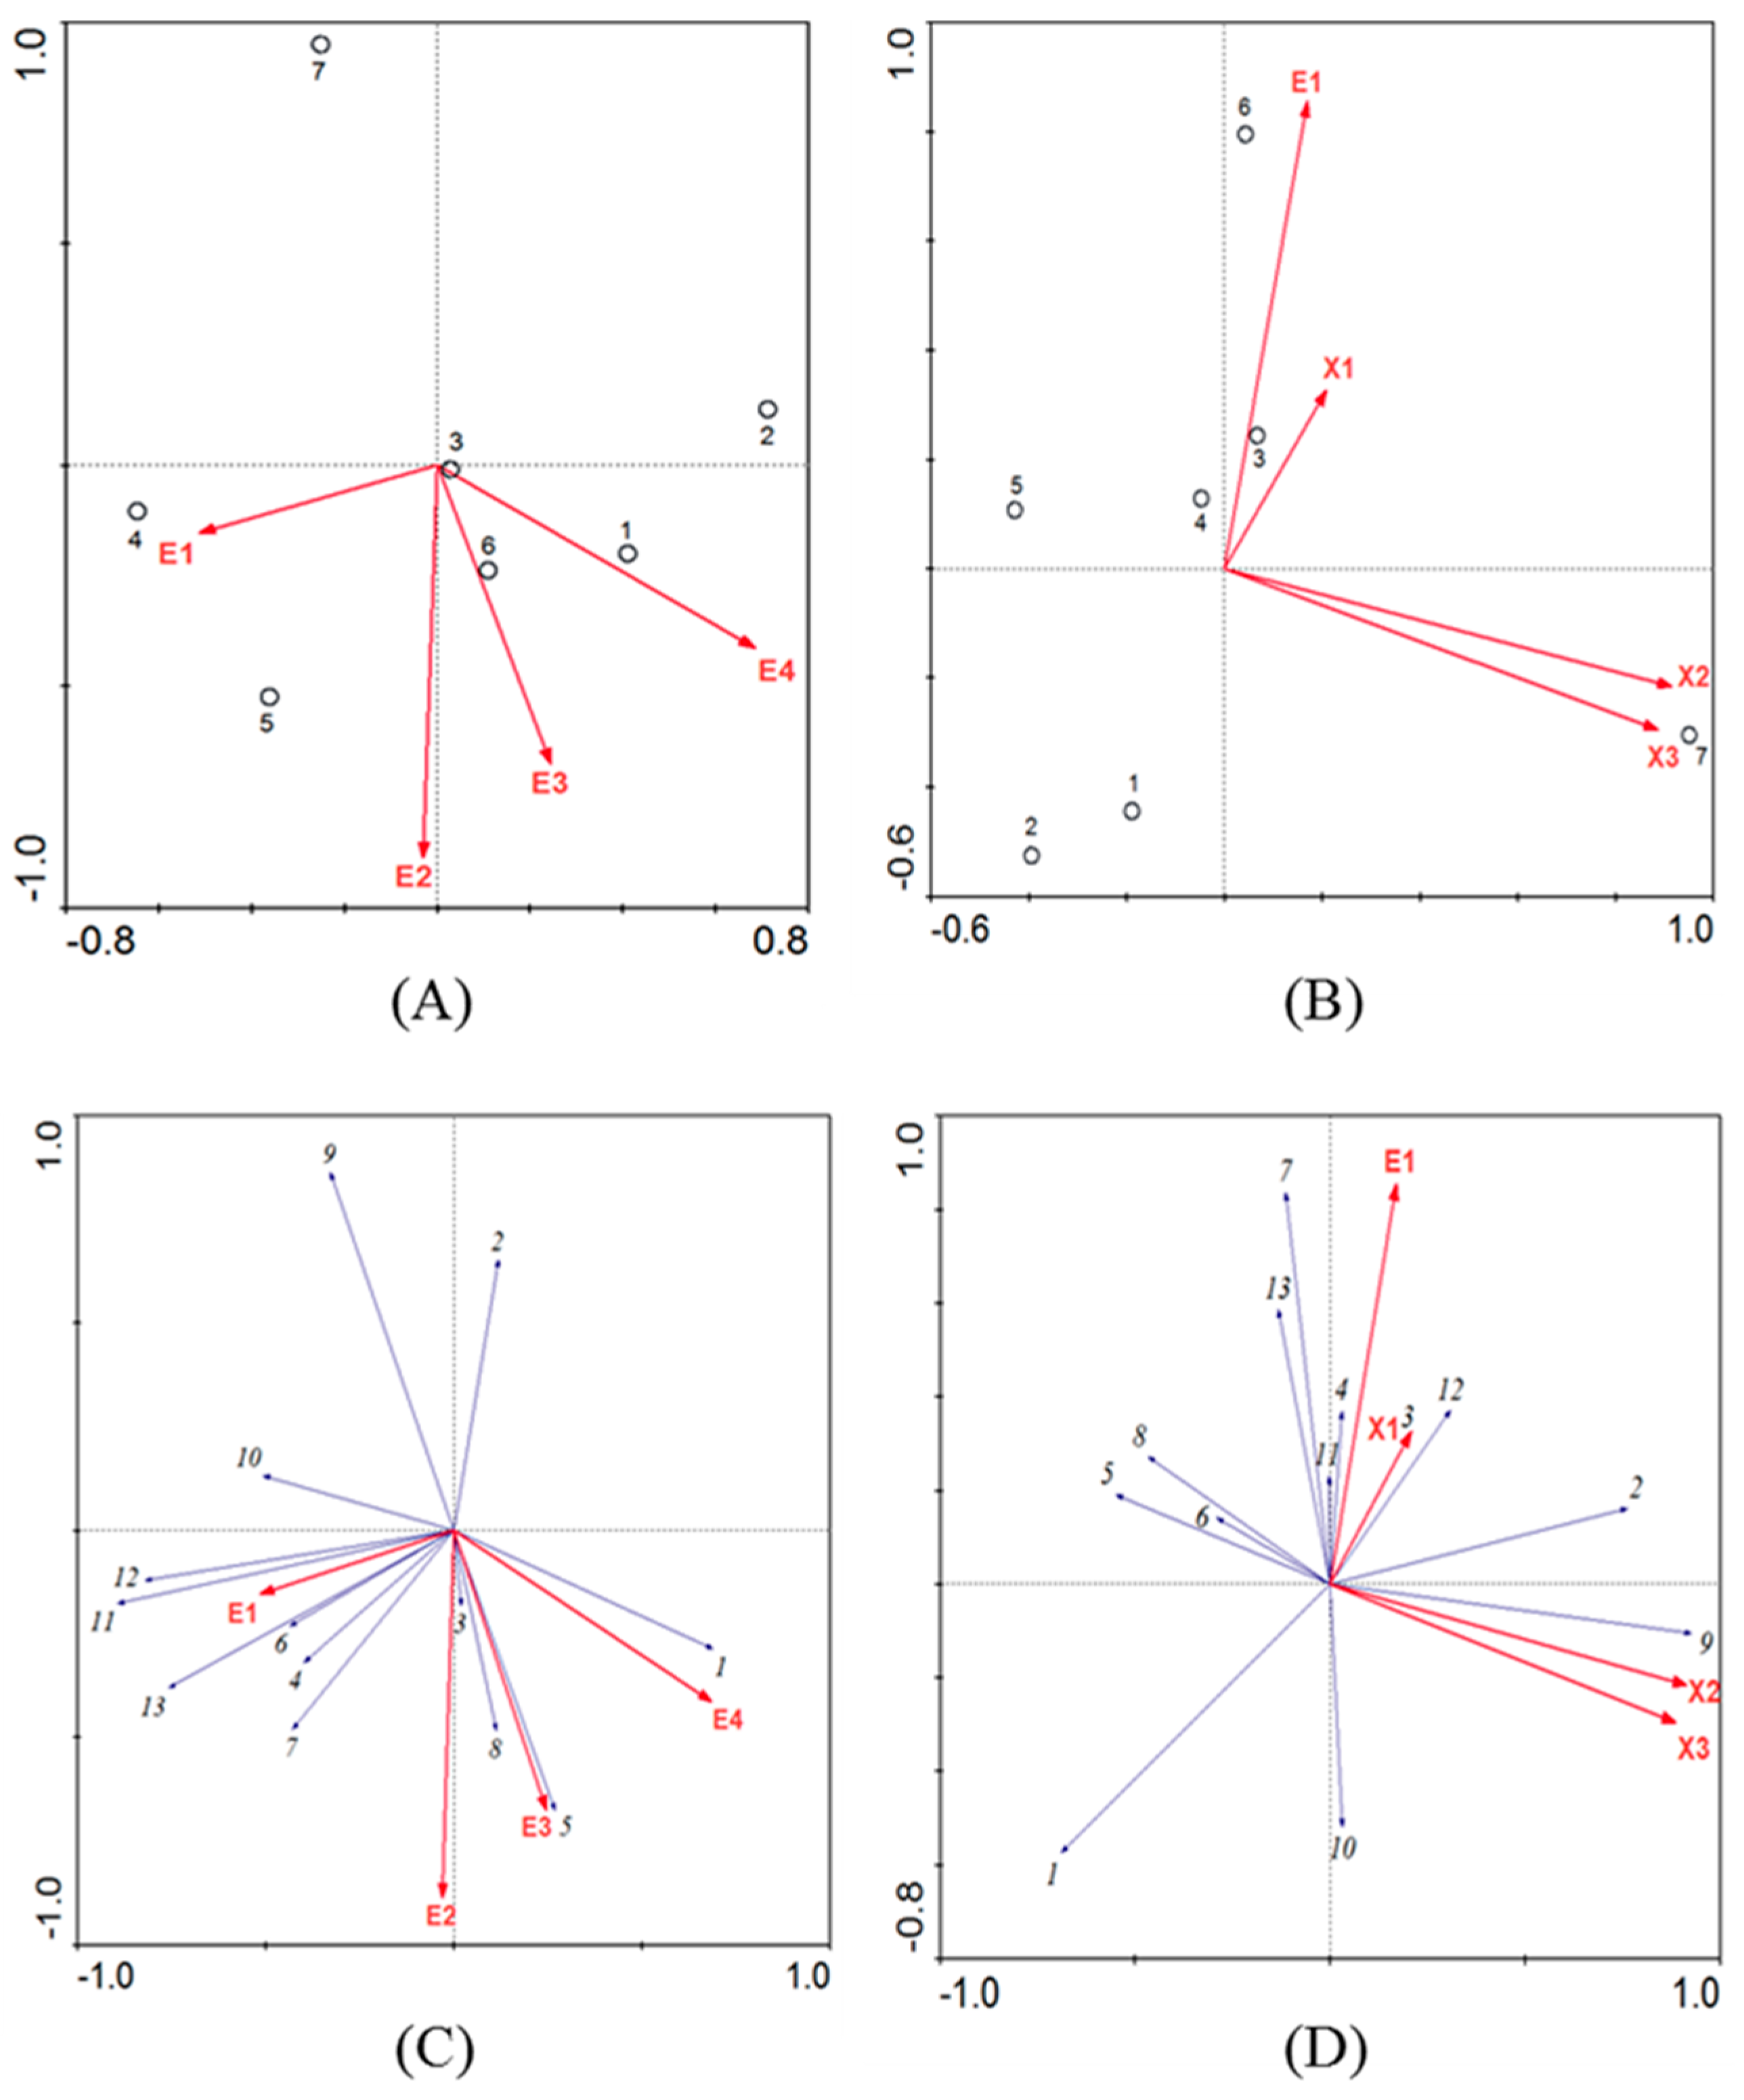
Redundancy analysis (RDA) is a sorting method developed based on correspondence analysis (CA). Correspondence analysis and multivariate regression analysis are combined, and regression is carried out with environmental factors in each step, also known as multivariate direct gradient analysis. Detrended correspondence analysis of the species data showed that the maximum gradient length in the four axes was 0.610; because this value was less than 3, linear RDA was performed. According to the experimental conditions, we selected Ca2+ concentration (E1), TN (E2), NH4+–N (E3), and NO2−–N (E4) as the environmental factors. In addition, we used TN removal rate (X1), NH4+–N removal rate (X2) and NO2−–N removal rate (X3) to analyze the denitrification efficiency. The RDA results are shown in Figure 5.
Figure 5 show the correlations of microbial community structure with the environmental factors and nitrogen removal rates, respectively. Based on the distribution of the samples, the samples containing added Ca2+ were relatively far from the initial sludge (sample 7) (Figure 5A). In addition, the samples containing Ca2+ showed some degree of separation, indicating that changes in environmental factors resulted in substantial differences in microbial community structure. For instance, a change in Ca2+ concentration had a degree of influence on microbial community structure. The Ca2+ concentration was related to the total TN content, but showed little correlation with NH4+–N and NO2−–N contents; therefore, the Ca2+ concentration likely influenced the microbial community structure through interactions with TN (Figure 5A).
In terms of nitrogen removal, the Ca2+ concentration was correlated the TN removal rate (Figure 5B), confirming the results described above. The Ca2+ concentration influenced the anammox treatment performance, but had little correlation with the average NH4+–N and NO2−–N removal rates. This indicates that Ca2+ concentration may be related to NO3−–N removal, subsequently affecting TN removal. The average TN removal rates from the reactors containing different Ca2+ concentrations followed the order 125 mg/L Ca2+ > 75 mg/L Ca2+ > 80 mg/L Ca2+ > 100 mg/L Ca2+ > 25 mg/L Ca2+ > 50 mg/L Ca2+. Although the average TN removal rate fluctuated with Ca2+ concentration, overall, the TN removal rate increased with increasing Ca2+ concentration.
Figure 5C,D show the correlation of microbial community structure with environmental factors and nitrogen removal rate by DGGE band. Bands 3 and 8 were positively correlated with all environmental factors, indicating that the taxa in bands 3 and 8 were positively correlated with Ca2+ concentration (Figure 5C). The microorganisms in band 3 belonged to the phylum Chlorobi but could not be identified to the genus or species levels; because only a part of the RUGL1-218 gene was cloned, it could not be further studied. However, it has been shown that Ca2+ has an important role in the immobilization of anammox sludge [13], and that bacteria of the phylum Chloroflexi have a certain effect on the granulation of anaerobic anammox sludge. Therefore, it can be speculated that the microorganisms in band 3 may be key microorganisms for the immobilization of anammox sludge. In addition, the microorganisms in band 8 belonged to the genus Anaerolinea, which has been shown not to have nitrogen-removal functions [35]. However, the RDA results suggested that Anaerolinea had an important role in the environment in which Ca2+ interacted with other environmental factors, such as TN, NH4+–N, and NO2−–N. Therefore, these microbes may also be related to bacteria with denitrification functions, and may be related to immobilization of anammox bacteria.
Bands 2, 3, 9 and 12 were positively correlated with all nitrogen removal rates (Figure 5D). As the Ca2+ concentration changed, the microorganisms in band 2, 3, 9 and 12 promoted denitrification and were all related to the immobilization of anammox bacteria. The microorganisms in band 12 belonged to β-Proteobacteria, but could not be identified to the genus and species level; however, a previous study showed such microbes to be related to Ca2+ [36]. The microorganism in band 2 belonged to Acidobacterium, and was not a main denitrifier based on the phylogenetic tree. However, from the RDA, it was speculated that increases in Ca2+ concentration would affect Acidobacterium levels, which would subsequently influence the removal rates of TN, NH4+–N, and NO2−–N. Therefore, Acidobacterium may comprise important symbiotic bacterial species. The microorganisms in band 9 belonged to Denitratisoma, within the family Rhodocyclaceae. Fahrbach et al. [36] isolated microbes from activated sludge from municipal wastewater treatment plants, using 17-β-estradiol as a carbon source for the reduction of NO2−–N into N2O. With reference to their findings, under conditions of different Ca2+ concentrations, Denitratisoma species are key microorganisms affecting anammox denitrification performance.
In this study, an improved TN removal rate was observed with increasing Ca2+ concentration. Therefore, the removal of residual TN is a research topic for future anammox applications, and the present findings are expected provide direction for enhancing TN removal using the anammox process.
5. Conclusions
In the experimental anammox reactors, the removal of TN was affected by NH4+–N and NO2−–N, and overall first declined and then increased. And when the calcium ion concentration was 100 mg/L, the removal rate of TN was the highest and the denitrification effect was the best. Ca2+ concentration was positively related to TN removal rate, but showed no obvious effects on NH4+–N and NO2−–N removal. The microbial analysis indicated that the microorganisms in the sludge samples could be divided into five phyla (Proteobacteria, Chloroflexi, Acidobacteria, Planctomycete, and Chlorobi), as well as unknown bacteria. From the RDA, Acidobacterium and Denitratisoma were positively correlated with Ca2+ concentration, and were confirmed to be important for promoting the immobilization of anammox bacteria; Acidobacterium are important symbiotic bacteria and Denitratisoma are critical to annamox denitrification. These findings offer a theoretical basis to improve wastewater treatment using the anammox process.
Author Contributions
Conceptualization, X.M. and W.Z.; methodology, Y.J.; software, Y.J.; validation, X.M., Y.J. and W.Z.; formal analysis, X.M.; investigation, W.Z.; resources, Y.J.; data curation, X.M.; writing—original draft preparation, X.M.; writing—review and editing, W.Z.; visualization, Y.J.; supervision, W.Z.; project administration, W.Z.; funding acquisition, W.Z.
Funding
This research was supported by the National Natural Science Foundation of China (Grant No. 51668013, 51638006); Guangxi Science and Technology Planning Project [grant number GuiKe-AD18126018]; and Special Funding for a Guangxi “BaGui Scholar” Construction Project.
Acknowledgments
We thank Editage (www.editage.cn) for English language editing.
Conflicts of Interest
The authors declare no conflict of interest.
References
- Mulder, A.A.; van de Graaf, L.A.; Robertson, J.G. Anaerobic ammonium oxidation discovered in a denitrifying fluidized bed reactor. FEMS Microbiol. Ecol. 1995, 16, 177–183. [Google Scholar] [CrossRef]
- Donald, S.; Beverley, C. A cross-site comparison of factors influencing soil nitrification rates in northeastern USA forested watersheds. Ecosystems 2009, 12, 158–178. [Google Scholar]
- Magalhaes, C.; Kiene, R.; Buchan, A. A novel inhibitory interaction between dimethylsulfoniopropionate (DMSP) and the denitrification pathway. Biogeochemistry 2012, 17, 393–408. [Google Scholar] [CrossRef]
- Chaali, M.; Naghdi, M. A review on the advances in nitrifying biofilm reactors and their removal rates in wastewater treatment. J. Chem. Technol. Biotechnol. 2018, 93, 3113–3124. [Google Scholar] [CrossRef]
- Yu, J.; Chen, H.; Ji, Y.; Zhang, J.; Ma, C.; Jin, R. Mechanisms of ultrasound irradiation for enhancing the ANAMMOX process. Sep. Purif. Technol. 2014, 130, 141–146. [Google Scholar] [CrossRef]
- Kuenen, J.G. Anammox bacteria: From discovery to application. Nat. Rev. Microbiol. 2008, 6, 320–326. [Google Scholar] [CrossRef] [PubMed]
- Strous, M.; Fuerst, J.A.; Kramer, E.H.M.; Logemann, S.; Muyzer, G.; van de Pas-Schoonen, K.T.; Webb, R.; Kuenen, J.G.; Jetten, M.S.M. Missing lithotroph identified as new planctomycete. Nature 1999, 400, 446–449. [Google Scholar] [CrossRef]
- Kartal, B.; Kuenen, J.G.; van Loosdrecht, M.C.M. Sewage treatment with anammox. Science 2010, 328, 702–703. [Google Scholar] [CrossRef]
- Sobeck, D.; Higgins, M.J. Examination of three theories for mechanisms of cation-induced bioflocculation. Water Res. 2002, 36, 527–538. [Google Scholar] [CrossRef]
- Ali, M.; Oshiki, M.; Rathnayake, L.; Ishii, S.; Satoh, H.; Okabe, S. Rapid and successful start-up of anammox process by immobilizing the minimal quantity of biomass in PVA-SA gel beads. Water Res. 2015, 79, 147–157. [Google Scholar] [CrossRef] [Green Version]
- Hyokwan, B.; Minkyu, C.; Changsoo, L. Enrichment of ANAMMOX bacteria from conventional activated sludge entrapped in poly(vinyl alcohol)/sodium alginate gel. Chem. Eng. J. 2015, 281, 531–540. [Google Scholar]
- De Graaff, M.S.; Temmink, H.; Zeeman, G.; van Loosdrecht, M.C.M.; Buisman, C.J.N. Autotrophic nitrogen removal from black water: Calcium addition as a requirement for settleability. Water Res. 2011, 45, 63–74. [Google Scholar] [CrossRef] [PubMed]
- Jiang, H.; Tay, J.; Liu, Y.; Stephen, T.T. Ca2+ augmentation for enhancement of aerobically grown microbial granules in sludge blanket reactors. Biotechnol. Lett. 2003, 25, 95–99. [Google Scholar] [CrossRef] [PubMed]
- Liu, S.; Zhang, Z.; Ni, J. Effects of Ca2+ on activity restoration of the damaged anammox consortium. Bioresour. Technol. 2013, 143, 315–321. [Google Scholar] [CrossRef] [PubMed]
- Chen, G.; Li, J.; Tabassum, S. Anaerobic ammonium oxidation (ANAMMOX) sludge immobilized by waterborne polyurethane and its nitrogen removal performance-a lab scale study. RSC Adv. 2015, 5, 25372–25381. [Google Scholar] [CrossRef]
- Zhang, W.; Zhang, X.; Wang, D.; Koga, Y.; Joseph, D.R.; Furukawa, K. Trace elements enhance biofilm formation in UASB reactor for solo simple molecule wastewater treatment. Bioresour. Technol. 2011, 102, 9296–9299. [Google Scholar] [CrossRef]
- Jung, J. Comparison of nitrogen removal efficiency on process stability for granular and immobilized anammox bacteria. J. Korean Soc. Water Wastewater 2014, 28, 195–206. [Google Scholar] [Green Version]
- Liu, R.; Wu, C.; Lu, X. The characteristics of immobilized granular sludge in the laboratory-scale stable partial nitrification-Anammox aquaculture water reactors. J. Water Reuse Desalin. 2016, 6, 445–453. [Google Scholar] [Green Version]
- Wang, W.; Wang, X.; Wang, S.; Li, J. Partial denitrification coupled with immobilization of anammox in a continuous upflow reactor. RSC Adv. 2018, 8, 32016–32021. [Google Scholar] [CrossRef] [Green Version]
- Zhang, W.; Deng, Y.; Wang, D.; Chi, H.; Jin, Y. Treatment of high-strength rare-earth ammonia wastewater with a two-stage anaerobic ammonium oxidation (anammox) process. Glob. NEST J. 2016, 18, 867–874. [Google Scholar]
- Zhu, G.; Yan, J.; Hu, Y. Anaerobic ammonium oxidation in polyvinyl alcohol and sodium alginate immobilized biomass system: A potential tool to maintain anammox biomass in application. Water Sci. Technol. 2014, 69, 718–726. [Google Scholar] [CrossRef] [PubMed]
- Kim, H.G.; Kim, S.S.; Kim, S.C.; Joo, H.J. Effects of Ca2+ on biological nitrogen removal in reverse osmosis concentrate and adsorption treatment. J. Ind. Eng. Chem. 2018, 57, 216–225. [Google Scholar] [CrossRef]
- Jetten, M.S.M.; Cirpus, I.; Kartal, B. 1994–2004: 10 years of research on the anaerobic oxidation of ammonium. Biochem. Soc. Trans. 2005, 33, 119–123. [Google Scholar] [CrossRef] [PubMed]
- Jin, Y.; Wang, D.; Zhang, W. Effects of substrates on N2O emissions in an anaerobic ammonium oxidation (anammox) reactor. SpringerPlus 2016, 5, 1–12. [Google Scholar] [CrossRef] [PubMed]
- Zhang, W.; Zhang, Y.; Li, L. Fast start-up of expanded granular sludge bed (EGSB) reactor using stored Anammox sludge. Water Sci. Technol. 2014, 69, 1469–1474. [Google Scholar]
- Zhang, W.; Wang, H.; Joseph, D.R.; Jin, Y. Granular activated carbon as nucleus for formation of Anammox granules in an expanded granular-sludge-bed reactor. Glob. NEST J. 2015, 17, 508–514. [Google Scholar]
- Zhang, Z.; Liu, S.; Taro, M. Mitigated membrane fouling of anammox membrane bioreactor by microbiological immobilization. Bioresour. Technol. 2016, 201, 312–318. [Google Scholar] [CrossRef] [Green Version]
- Zhang, W.; Jin, Y. Effects of Fe(II) on N2O emissions from anammox reactors. Desalin. Water Treat. 2017, 63, 221–226. [Google Scholar] [CrossRef]
- Zhang, W.; Wang, D.; Jin, Y. Effects of inorganic carbon on the nitrous oxide emissions and microbial diversity of an anaerobic ammonia oxidation reactor. Bioresour. Technol. 2018, 250, 124–130. [Google Scholar] [CrossRef]
- Jin, Y.; Wang, D.; Zhang, W. Use of bamboo charcoal reduced the cultivated anammox seed sludge dosage during the start-up period. Desalin. Water Treat. 2015, 57, 20248–20253. [Google Scholar] [CrossRef]
- Wang, H.; Han, J.; Zhang, W. Effects of NH4+-N and NO2−-N on carbon fixation in an anaerobic ammonium oxidation reactor. J. Environ. Manag. 2019, 241, 450–457. [Google Scholar] [CrossRef] [PubMed]
- American Public Health Association (APHA). Standard Methods for the Examination of Water and Wastewater, 19th ed.; APHA: Washington, DC, USA, 1995; p. 1467. [Google Scholar]
- Xing, B.; Guo, Q.; Yang, G.; Zhang, Z.; Li, P.; Guo, L.; Jin, R. The properties of anaerobic ammonium oxidation (anammox) granules: Roles of ambient temperature, salinity and calcium concentration. Sep. Purif. Technol. 2015, 147, 311–318. [Google Scholar] [CrossRef]
- Lipschultz, F.; Zafiriou, O.C.; Wofsy, S.C. Production of NO and N2O by soil nitrifying bacteria. Nature 1981, 294, 641–643. [Google Scholar] [CrossRef]
- Bhattacharjee, A.S.; Wu, S.; Lawson, C.E.; Jetten, M.S.; Kapoor, V.; Domingo, J.W.; McMahon, K.D.; Noguera, D.R.; Goel, R. Whole-Community Metagenomics in Two Different Anammox Configurations: Process Performance and Community Structure. Environ. Sci. Technol. 2017, 51, 4317–4327. [Google Scholar]
- Fahrbach, M.; Kuever, J.; Meinke, R. Denitratisoma oestradiolicum gen. nov., sp. nov., a 17β-oestradiol-degrading, denitrifying betaproteo bacterium. Int. J. Syst. Evol. Microbiol. 2006, 56, 1547–1552. [Google Scholar] [CrossRef] [PubMed]
Figure 1.
Schematic diagram showing the experimental anaerobic ammonium oxidation (anammox) reactor.
Figure 1.
Schematic diagram showing the experimental anaerobic ammonium oxidation (anammox) reactor.

Figure 2.
Removal of (a) NH4+–N, (b) NO2−–N, and (c) TN from the anammox reactor after 35 days of operation at different Ca2+ concentrations.
Figure 2.
Removal of (a) NH4+–N, (b) NO2−–N, and (c) TN from the anammox reactor after 35 days of operation at different Ca2+ concentrations.

Figure 3.
Denaturing gradient gel electrophoresis (DGGE) gel imaging. From right to left, sample 1, initial sludge; Sample 2, (Ca2+) = 25 mg/L; Sample 3, (Ca2+)= 50 mg/L; Sample 4, (Ca2+) = 75 mg/L; Sample 5, (Ca2+) = 80 mg/L; Sample 6, (Ca2+) = 100 mg/L; and Sample 7, (Ca2+) = 125 mg/L.
Figure 3.
Denaturing gradient gel electrophoresis (DGGE) gel imaging. From right to left, sample 1, initial sludge; Sample 2, (Ca2+) = 25 mg/L; Sample 3, (Ca2+)= 50 mg/L; Sample 4, (Ca2+) = 75 mg/L; Sample 5, (Ca2+) = 80 mg/L; Sample 6, (Ca2+) = 100 mg/L; and Sample 7, (Ca2+) = 125 mg/L.

Figure 4.
Relative proportions of the dominant microbial populations from the denaturing gradient gel electrophoresis bands in sludge samples from anammox reactors containing different Ca2+ concentrations. The numbers in the legends refer to the band numbers in Figure 3. Sample 1, initial sludge; Sample 2, (Ca2+) = 25 mg/L; Sample 3, (Ca2+) = 50 mg/L; Sample 4, (Ca2+) = 75 mg/L; Sample 5, (Ca2+) = 80 mg/L; Sample 6, (Ca2+) = 100 mg/L; Sample 7, (Ca2+) = 125 mg/L.

Figure 5.
Correlations between microbial community structure of the anammox sludge with (A) environmental factors and (B) nitrogen removal rate and between microbial community structure based on the denaturing gradient gel electrophoresis bands with (C) environmental factors and (D) nitrogen removal rate. The black numbers in (A, B) refer to the experimental reactors: 1, (Ca2+) = 25 mg/L; 2, (Ca2+) = 50 mg/L; 3, (Ca2+) = 75 mg/L; 4, (Ca2+) = 80 mg/L; 5, (Ca2+) = 100 mg/L; 6, (Ca2+) = 125 mg/L; 7, initial sludge. The black numbers in (C, D) refer to the band numbers in Figure 3. E1, Ca2+ concentration; E2, total nitrogen content; E3, NH4+–N content; E4, NO2−–N content; X1, NO2−–N removal rate; X2, NH4+–N removal rate; X3, TN rate.


Table 1.
Components of the influent.
| Component | Concentration |
|---|---|
| NH4HCO3 | 0.11 g/L |
| NaNO2 | 0.12 g/L |
| KH2PO4 | 0.03 g/L |
| MgSO4·7H2O | 0.1 g/L |
| CaCl2·2H2O | 0.09–0.46 * g/L |
| NaS2O3 | 0.04 * g/L |
| EDTA | 0.25 * mL/L |
| Na2S2O3 | 0.01 mL/L |
| Trace elements | 0.5 mL/L |
* CaCl2·2H2O was added at prescribed experimental concentrations to yield final Ca2+ concentrations of 0.025–0.125 g/L; EDTA, 5 mg/L; Na2S2O3, 24.81 mg/L.
Table 2.
Trace elements in the reactor influent.
| Component | Concentration (mg/L) |
|---|---|
| FeSO4·7H2O | 10,000 |
| C10H14N2Na2O3 | 5600 |
| MnCl2·4H2O | 352 |
| CoCl2·6H2O | 96 |
| NiCl2·6H2O | 80 |
| CuSO4·5H2O | 100 |
| ZnSO4·7H2O | 172 |
| NaMoO4·2H2O | 110 |
Table 3.
Microbial diversity index of sludge samples from the seven reactors.
| Calcium Ion Concentration (mg/L) | Diversity Index |
|---|---|
| Initial sludge | 2.327 |
| 25 | 2.443 |
| 50 | 2.231 |
| 75 | 2.345 |
| 80 | 2.131 |
| 100 | 2.350 |
| 125 | 2.367 |
Table 4.
Homology search results for 16S rRNA gene sequences of the main bacterial members in the anammox sludge community.
Table 4.
Homology search results for 16S rRNA gene sequences of the main bacterial members in the anammox sludge community.
| Band No. | Strains | Gene Band No. | Similarity | Phylum |
|---|---|---|---|---|
| 1 | Ignavibacterium sp. | JQ724348.1 | 98% | Chlorobi |
| 2 | Uncultured Acidobacteria bacterium clone 3F2 | KC442541.1 | 97% | Acidobacteria |
| 3 | Uncultured Chlorobi bacterium clone RUGL1-218 | GQ421108.1 | 99% | Chlorobi |
| 4 | Denitratisoma oestradiolicum clone 20b_15 | KF810114.1 | 99% | Proteobacteria |
| 5 | Uncultured Chloroflexi bacterium clone MA-R101 | JN038662.1 | 98% | Chloroflexi |
| 6 | Uncultured Chlorobi bacterium | CU918838.1 | 92% | Chlorobi |
| 7 | Uncultured planctomycete clone 5GA_Pla_HKP_08 | GQ356155.1 | 100% | Planctomycete |
| 8 | Uncultured Anaerolinea sp. | EF636836.1 | 94% | Chloroflexi |
| 9 | Uncultured Denitratisoma sp. clone as185 | KF287743.1 | 98% | Proteobacteria |
| 10 | Denitratisoma oestradiolicum clone 20b_2 | KF810120.1 | 99% | Proteobacteria |
| 11 | Uncultured beta proteobacterium clone B-AB39 | AY622250.1 | 99% | Proteobacteria |
| 12 | Uncultured sludge bacterium A21b clone MBR Ca 300ppm 19 | KT182572.1 | 99% | Proteobacteria |
| 13 | Uncultured gamma proteobacterium clone 428 | AB252885.1 | 98% | Proteobacteria |
© 2019 by the authors. Licensee MDPI, Basel, Switzerland. This article is an open access article distributed under the terms and conditions of the Creative Commons Attribution (CC BY) license (http://creativecommons.org/licenses/by/4.0/).
Share and Cite
MDPI and ACS Style
Ma, X.; Jin, Y.; Zhang, W. Effects of Ca2+ Concentration on Anaerobic Ammonium Oxidation Reactor Microbial Community Structure. Water 2019, 11, 1341. https://doi.org/10.3390/w11071341
AMA Style
Ma X, Jin Y, Zhang W. Effects of Ca2+ Concentration on Anaerobic Ammonium Oxidation Reactor Microbial Community Structure. Water. 2019; 11(7):1341. https://doi.org/10.3390/w11071341
Chicago/Turabian StyleMa, Xueyan, Yue Jin, and Wenjie Zhang. 2019. "Effects of Ca2+ Concentration on Anaerobic Ammonium Oxidation Reactor Microbial Community Structure" Water 11, no. 7: 1341. https://doi.org/10.3390/w11071341
Note that from the first issue of 2016, this journal uses article numbers instead of page numbers. See further details here.