Spatial Drought Characterization for Seyhan River Basin in the Mediterranean Region of Turkey


Department of Civil Engineering, Istanbul Technical University, Maslak, Istanbul 34469, Turkey
*
Author to whom correspondence should be addressed.
Water 2019, 11(7), 1331; https://doi.org/10.3390/w11071331
Submission received: 22 May 2019
/
Revised: 21 June 2019
/
Accepted: 24 June 2019
/
Published: 27 June 2019
(This article belongs to the Special Issue Multiscale Impacts of Anthropogenic and Climate Changes on Tropical and Mediterranean Hydrology)
Abstract
:Drought is a natural phenomenon that has great impacts on the economy, society and environment. Therefore, the determination, monitoring and characterization of droughts are of great significance in water resources planning and management. The purpose of this study is to investigate the spatial drought characterizations of Seyhan River basin in the Eastern Mediterranean region of Turkey. The standardized precipitation index (SPI) was calculated from monthly precipitation data at 12-month time scale for 19 meteorological stations scattered over the river basin. Drought with the largest severity in each year is defined as the critical drought of the year. Frequency analysis was applied on the critical drought to determine the best-fit probability distribution function by utilizing the total probability theorem. The sole frequency analysis is insufficient in drought studies unless it is numerically related to other factors such as the severity, duration and intensity. Also, SPI is a technical tool and thus difficult to understand at first glance by end-users and decision-makers. Precipitation deficit defined as the difference between precipitation threshold at SPI = 0 and critical precipitation is therefore more preferable due to its usefulness and for being physically more meaningful to the users. Precipitation deficit is calculated and mapped for 1-, 3-, 6- and 12-month drought durations and 2-, 5-, 10-, 25-, 50- and 100-year return periods at 12-month time scale from the frequency analysis of the critical drought severity. The inverse distance weighted (IDW) interpolation technique is used for the spatial distribution of precipitation deficit over the Seyhan River basin. The spatial and temporal characteristics of drought suggest that the Seyhan River Basin in the Eastern Mediterranean region of Turkey experiences quite mild and severe droughts in terms of precipitation deficit. The spatial distribution would alter greatly with increasing return period and drought duration. While the coastal part of the basin is vulnerable to droughts at all return periods and drought durations, the northern part of the basin would be expected to be less affected by the drought. Another result reached in this study is that it could be common for one point in the basin to suffer dry conditions, whilst surrounding points in the same basin experience normal or even humid conditions. This reinforces the importance of spatial analysis over the basin under investigation instead of the point-scale temporal analysis made in each of the meteorological stations. With the use of spatial mapping of drought, it is expected that the destructive and irreversible effects of hydrological droughts can be realized in a more physical sense.
1. Introduction
Drought is a stochastic natural event which emerges from a remarkable deficiency in precipitation. It has an impact on a large number of sectors since water is the source of life. Drought seriously affects the majority of the population in many ways such as economically, socially and environmentally. The fact that the lack of water affects different sectors makes it more difficult to create one single definition of drought. A certain definition does not exist for drought because of the complicated stochastic nature of hydrometeorological variables and water demand in different regions around the world [1] and the variability in the climate of the region under investigation. Owing to the increase in water demand, drought hydrology has been receiving much attention. As a result, extensive research studies have been performed on drought and numerous review papers have been published [1,2,3,4,5,6].
Drought typically has probabilistic characteristics which are severity, duration, intensity, frequency and interarrival time [3,7,8,9]. In the literature, there have been limitless studies on drought characterization [10,11,12,13,14,15,16]. A different approximation of frequency analysis was used to derive precipitation deficit from the drought Severity-Duration-Frequency (SDF) curves for drought characterization in different hydrological basins in Turkey [17,18,19]. As the most recent study on drought in Turkey, Cavus [20] developed a methodology based on precipitation deficit, precipitation threshold and critical precipitation concepts, all newly introduced and detailed below. Also used is a regression equation established between the SPI and the corresponding precipitation. As the outputs of the methodology, drought SDF and intensity–duration–frequency (IDF) curves were plotted with which it is possible to determine the severity and intensity of a drought with a given duration and return period.
Turkey is situated in the East Mediterranean. Annual average precipitation in Turkey is 630 mm, 67% of which falls during the winter and spring months with the influence of Mediterranean depression [21,22,23]. Climate models predict that, by the end of the 21st century, Europe will face droughts extending over larger areas in the Mediterranean region with increasing intensity and duration [24,25]. Therefore, monitoring of drought and management plans are vital to determine the impact of drought on the Mediterranean region. Drought action plans should be more efficient such that the use of economic resources is optimized. As examples, Vicente-Serrano and Begueria [26] evaluated the impact of drought using remote sensing in the semi-arid Mediterranean region in Spain. Caloiero et al. [27] analyzed drought to calculate different return-period droughts by using the SPI in the northern hemisphere including the European continent, Ireland, UK and the Mediterranean basins. Vicente-Serrano et al. [28] studied drought patterns in eastern Spain of the Mediterranean region and found the frequency, duration and intensity of drought for each region considered. Also, Spinoni et al. [29] classified drought episodes by frequency, duration and severity.
A particular meteorological station is used when the point-scale temporal analysis of drought is concerned. On the other hand, spatial analysis of drought is as important as its temporal analysis, as it could be common for one point in an area to suffer dry conditions, whilst surrounding points in the same area experience normal or even humid conditions. Thus, information related to not only one particular station but also to neighboring stations is needed in making decision for drought mitigation or preparedness at the basin scale. Spatial analysis is performed using data from all available meteorological stations in the basin. This provides spatial drought characterization that utilizes the severity, intensity, duration and return period. It can be presented in the form of spatial patterns of drought intensity contours for a given drought duration and return period. Spatial variability of drought events in the literature has been approached from different perspectives [21,22,23,30,31]. He et al. [32] investigated drought hazard and spatial characteristic analysis in China using a GIS-based drought hazard assessment model.
Spatial IDF mapping of the precipitation deficit has been the purpose of this study to provide a comprehensive characterization of droughts for meteorological stations in the Seyhan River basin of the Eastern Mediterranean region, Turkey. In the IDF maps, contours based on the precipitation deficit are plotted for a given drought duration and return period. The maps are given in this study for drought durations of 1, 3, 6 and 12 months and return periods of 2, 5, 10, 25, 50, and 100 years at 12-month time scale. They are expected to provide useful information to use in taking actions against drought such that it becomes less destructive and does not create irreversible effects on the economy, society and ecology. This study is also expected to provide measures for reducing the negative effects of the drought as a step in the drought management plan.
2. Seyhan River Basin and Data
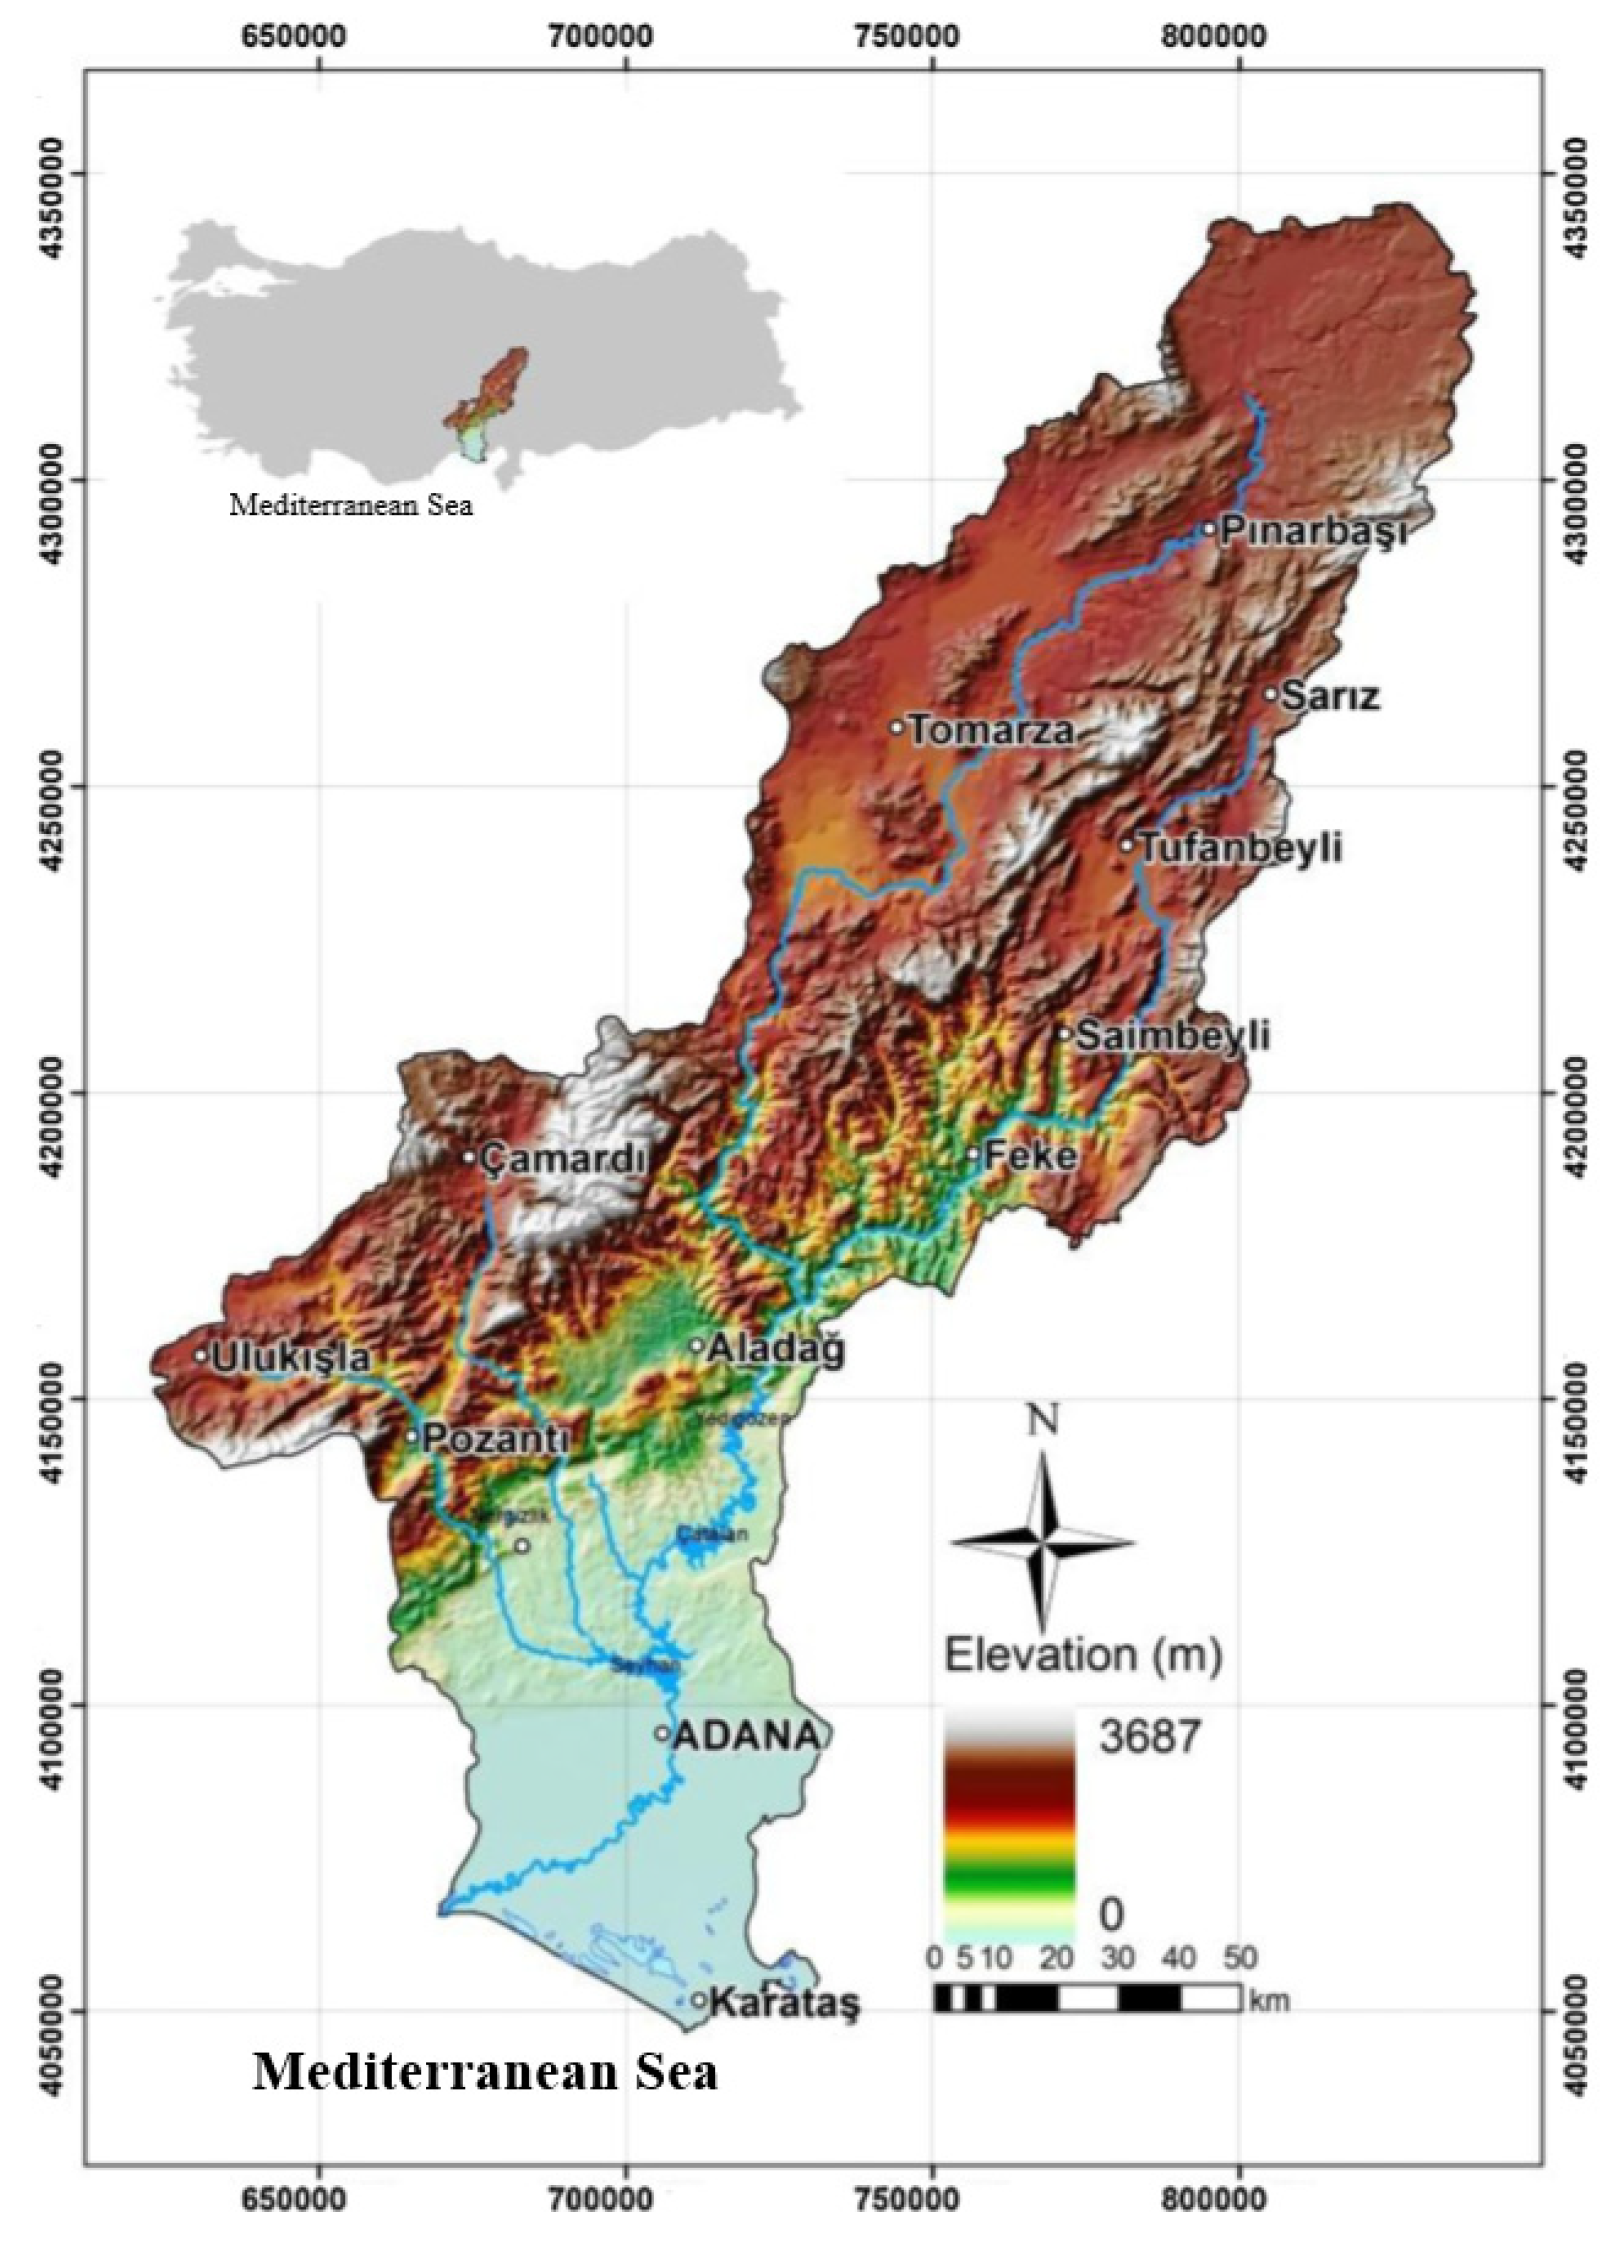
The Seyhan River Basin is located in the southern part of Turkey (Figure 1). The climate in the Seyhan River basin is strongly influenced by the topography. The northern part of the basin is characterized by a mountainous, steep, harsh topography while lowlands prevail in the southern part of the basin (Figure 1). The basin extends from the Mediterranean coast to the Central Anatolia and shows three different characteristics in terms of climate. The northern part of the basin exhibits the characteristics of the Central Anatolian climate; thus, it is colder than the southern part of the basin; the highest precipitation is observed at highlands in this part of the basin. In the coastal areas of the Çukurova plain and the surrounding areas, the summer season is hot and dry while the winter is warm and rainy. That part of the basin between the coastal zone in the south and the Tarsus mountains in the north has a semi-arid Mediterranean climate with dry and hot summers and rainy and warm winters.
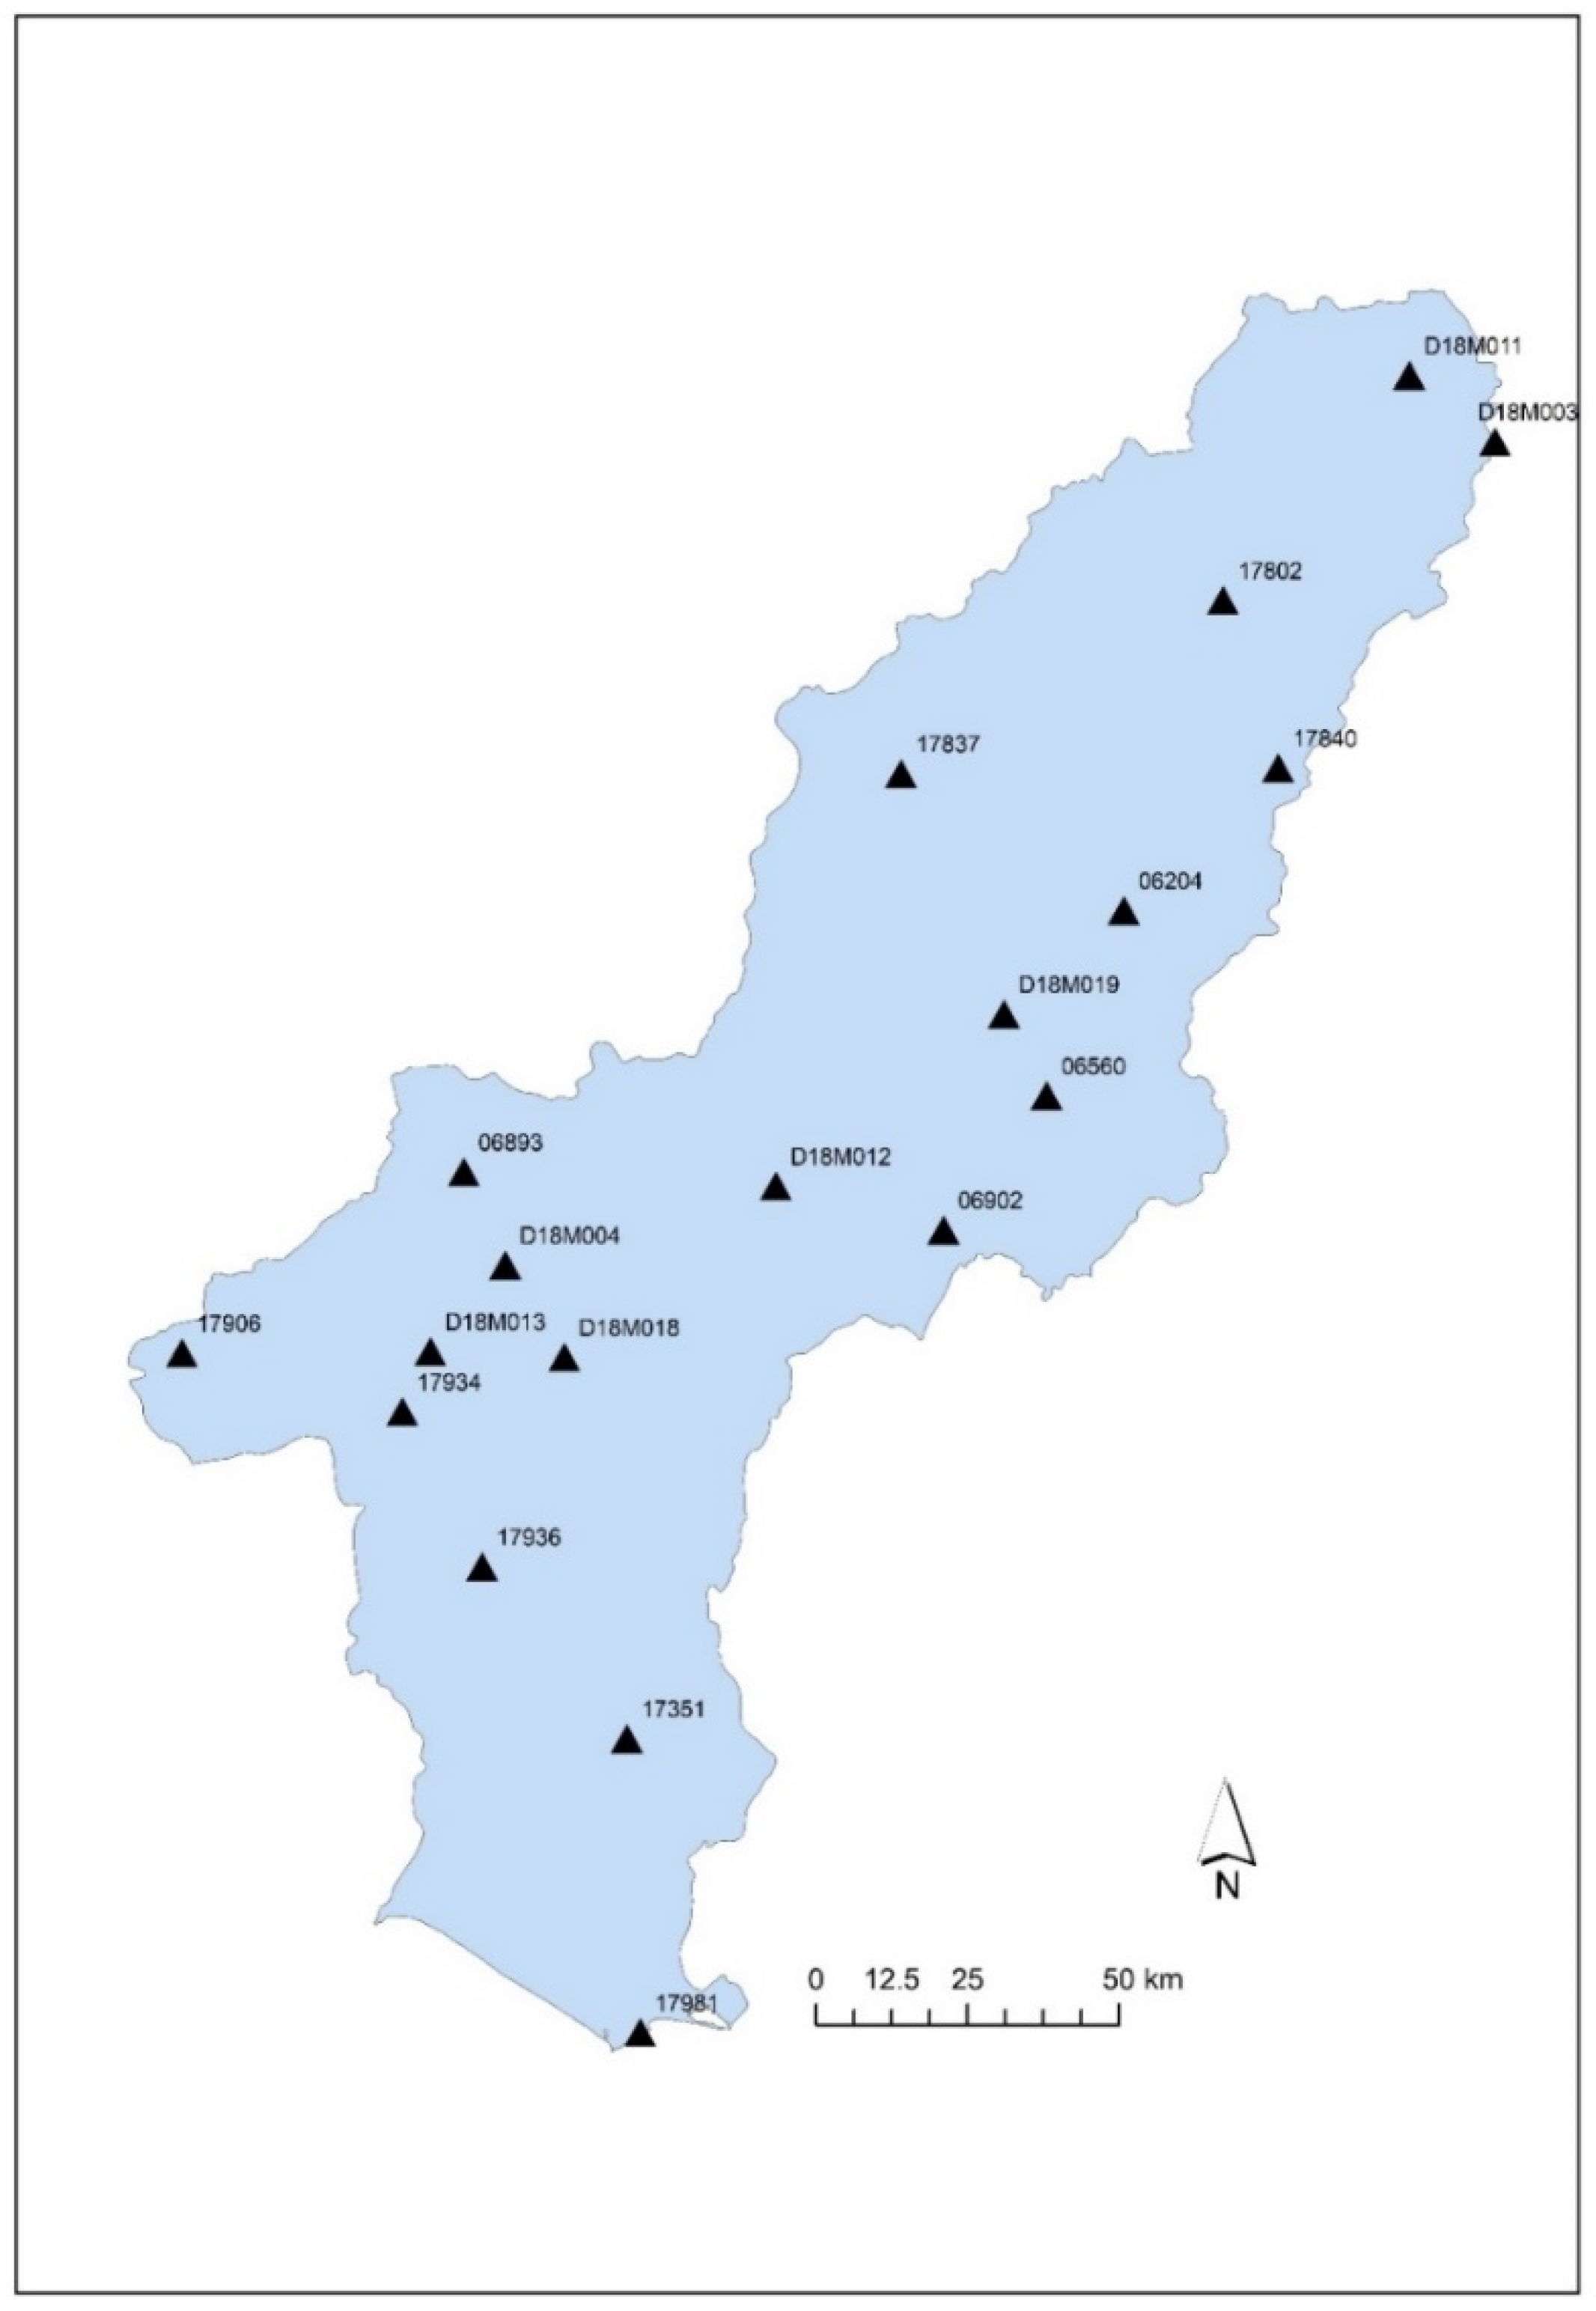
Monthly precipitation data were obtained from 19 meteorological stations operated by the State Meteorological Service (MGM with its Turkish acronym) and from the General Directorate of State Hydraulic Works (DSI). The meteorological stations are listed in Table 1 in which the number and name of the stations are given together with the observation period of each station and the total number of missing data filled (in months). Statistical characteristics calculated from the monthly precipitation time series of each meteorological station are also given in Table 1. They are the minimum, maximum and mean values of monthly precipitation data in each meteorological station. It is seen, for example, that station 17981 (Karataş) among all meteorological stations has the highest percentage of no-rainy months (15.31%) and also the lowest altitude (22 m above mean sea level) compared to other stations. The altitude of the meteorological stations varies greatly within the basin owing to the topography. Data quality is an important issue in meteorological applications [33,34]. Any meteorological station with a minimum of 10 years of observation is taken for the analysis. Any gap in the data not exceeding 12 consecutive months was filled; longer gaps, if any, were not filled. In the case that a gap longer than 12 months exists in the time series, data before or after the gap were used provided that either portion is at least 10 years long. From the data before or after such a gap, the longer one was taken. The long-term monthly mean was taken to replace for the missing value of the month in the gap. Precipitation time series of the 19 meteorological stations satisfied the above criteria; i.e., all-time series have 10-year minimum length with a missing data gap, if any, of the 12-month uninterrupted length at maximum. The layout of the meteorological stations in the Seyhan River basin is shown in Figure 2 from which it is seen that the stations are scattered over the basin almost homogenously.
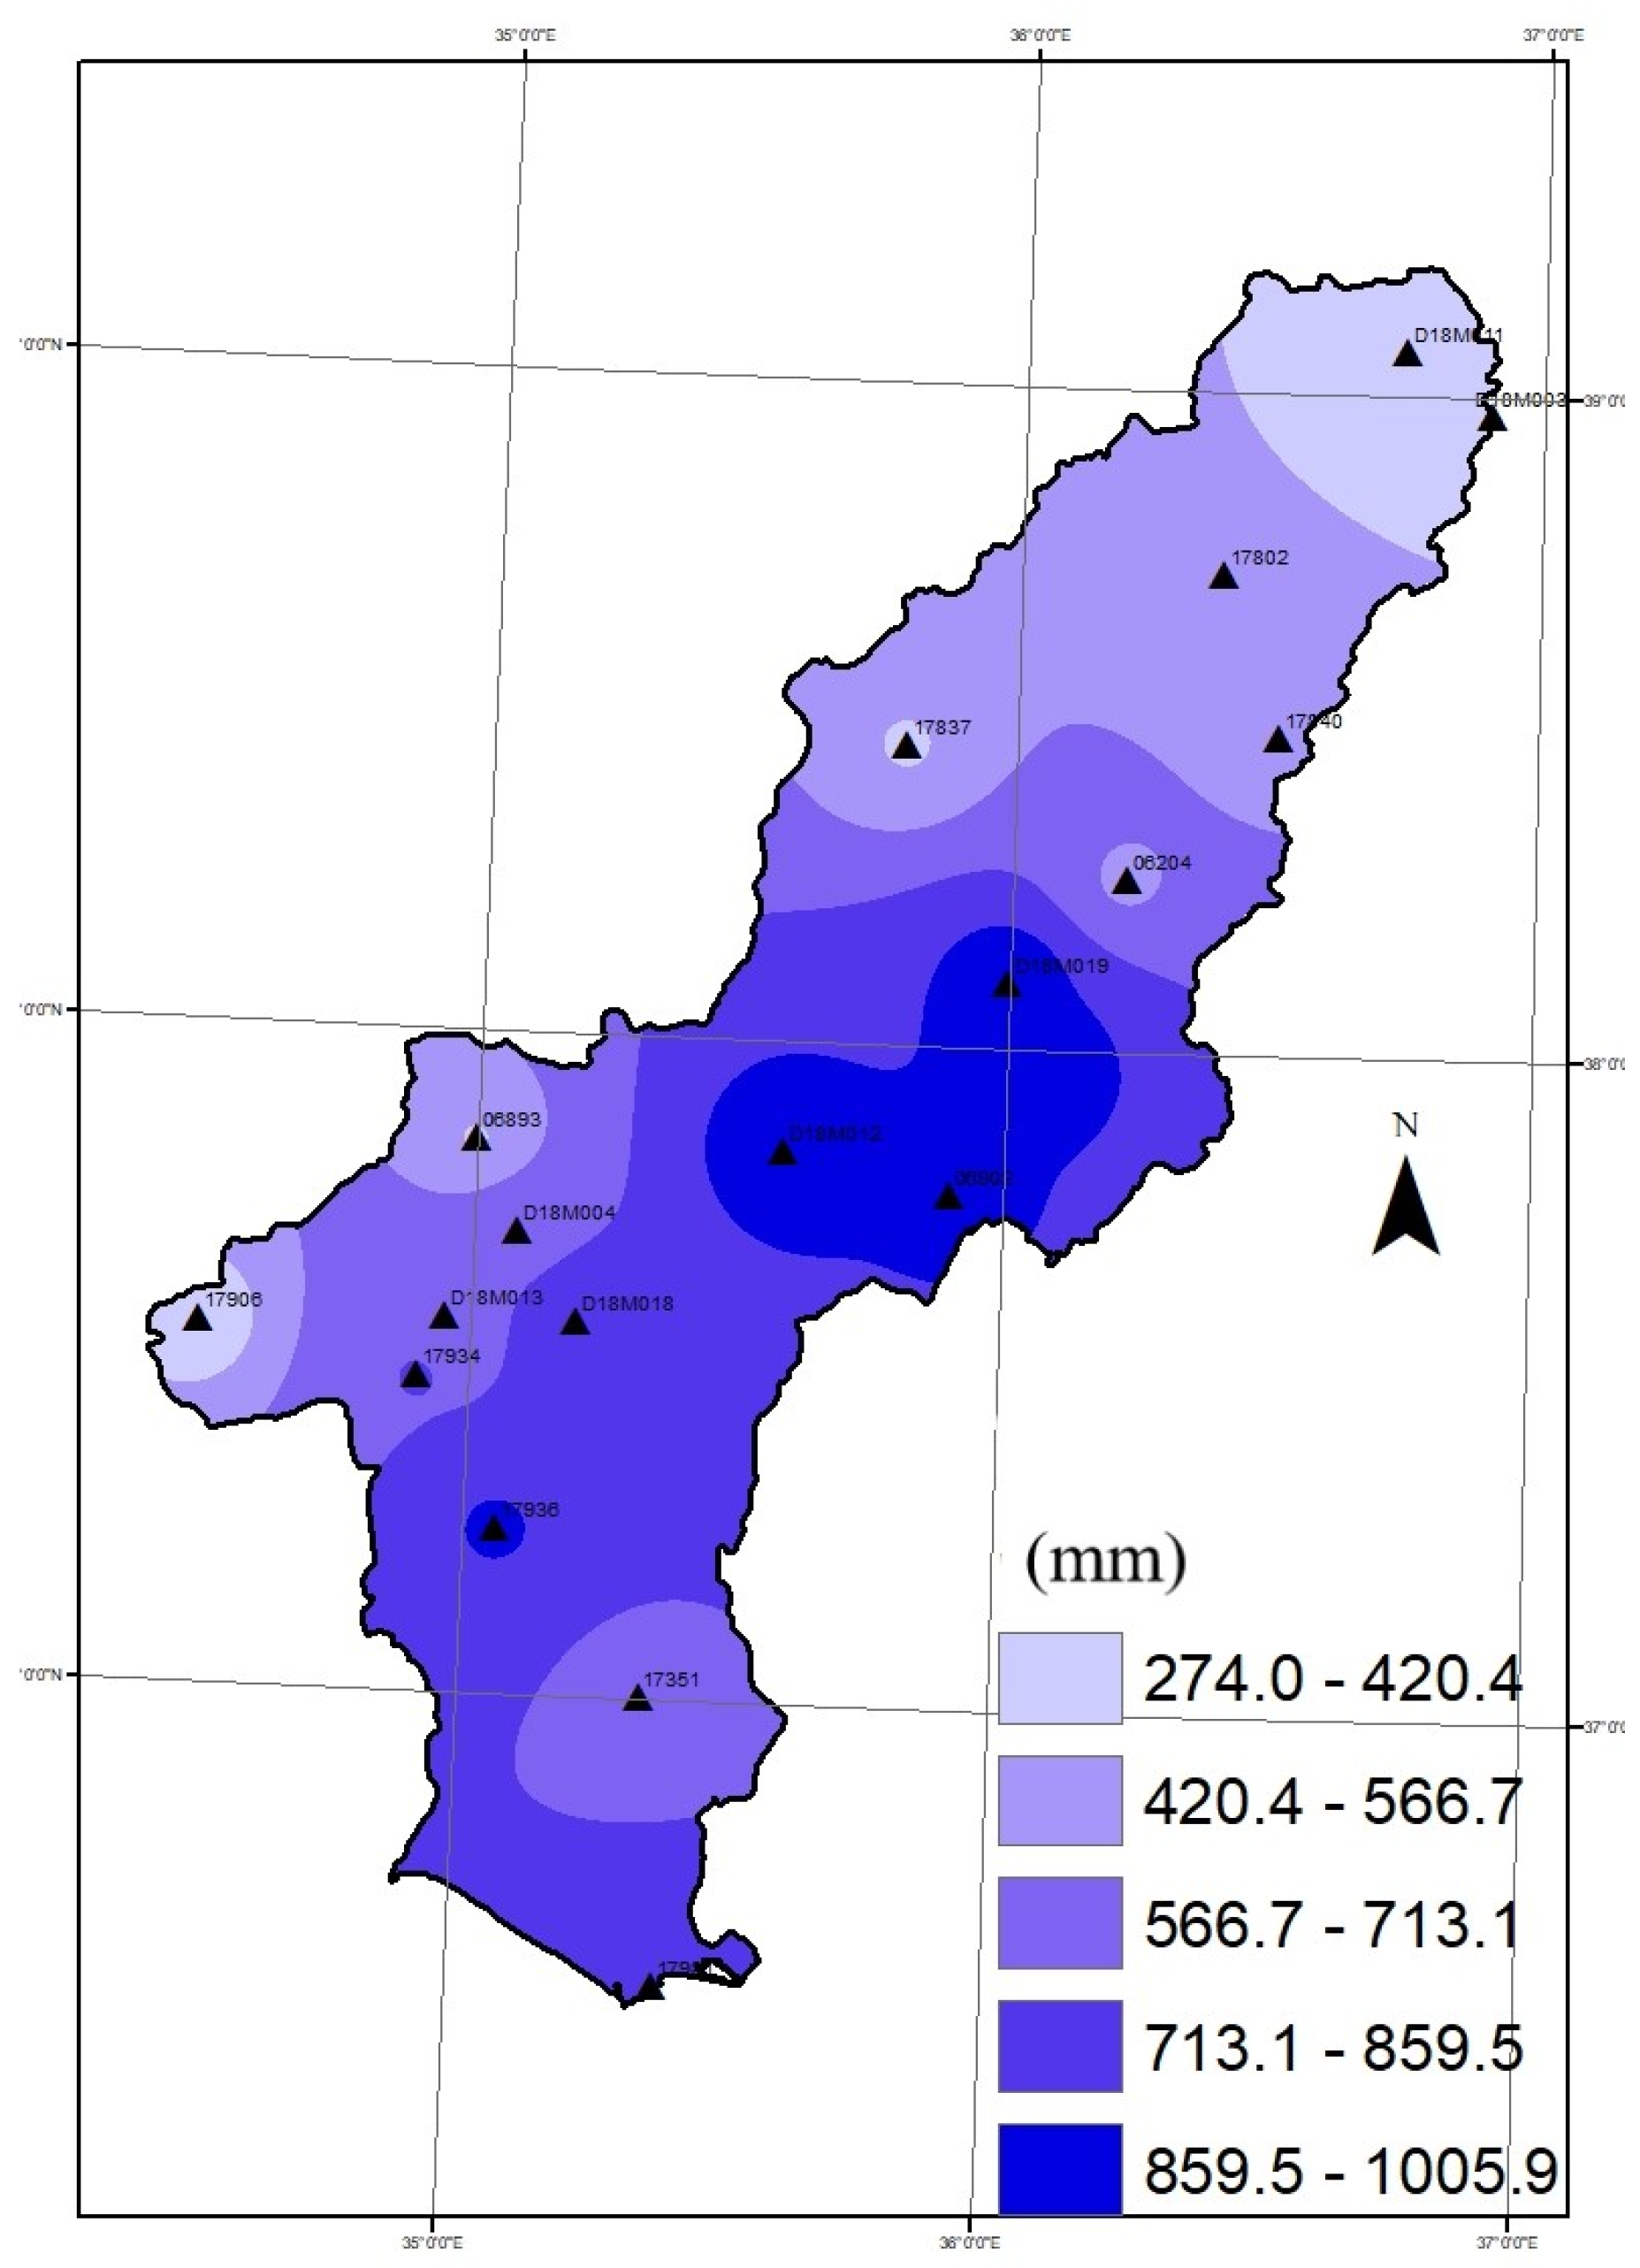
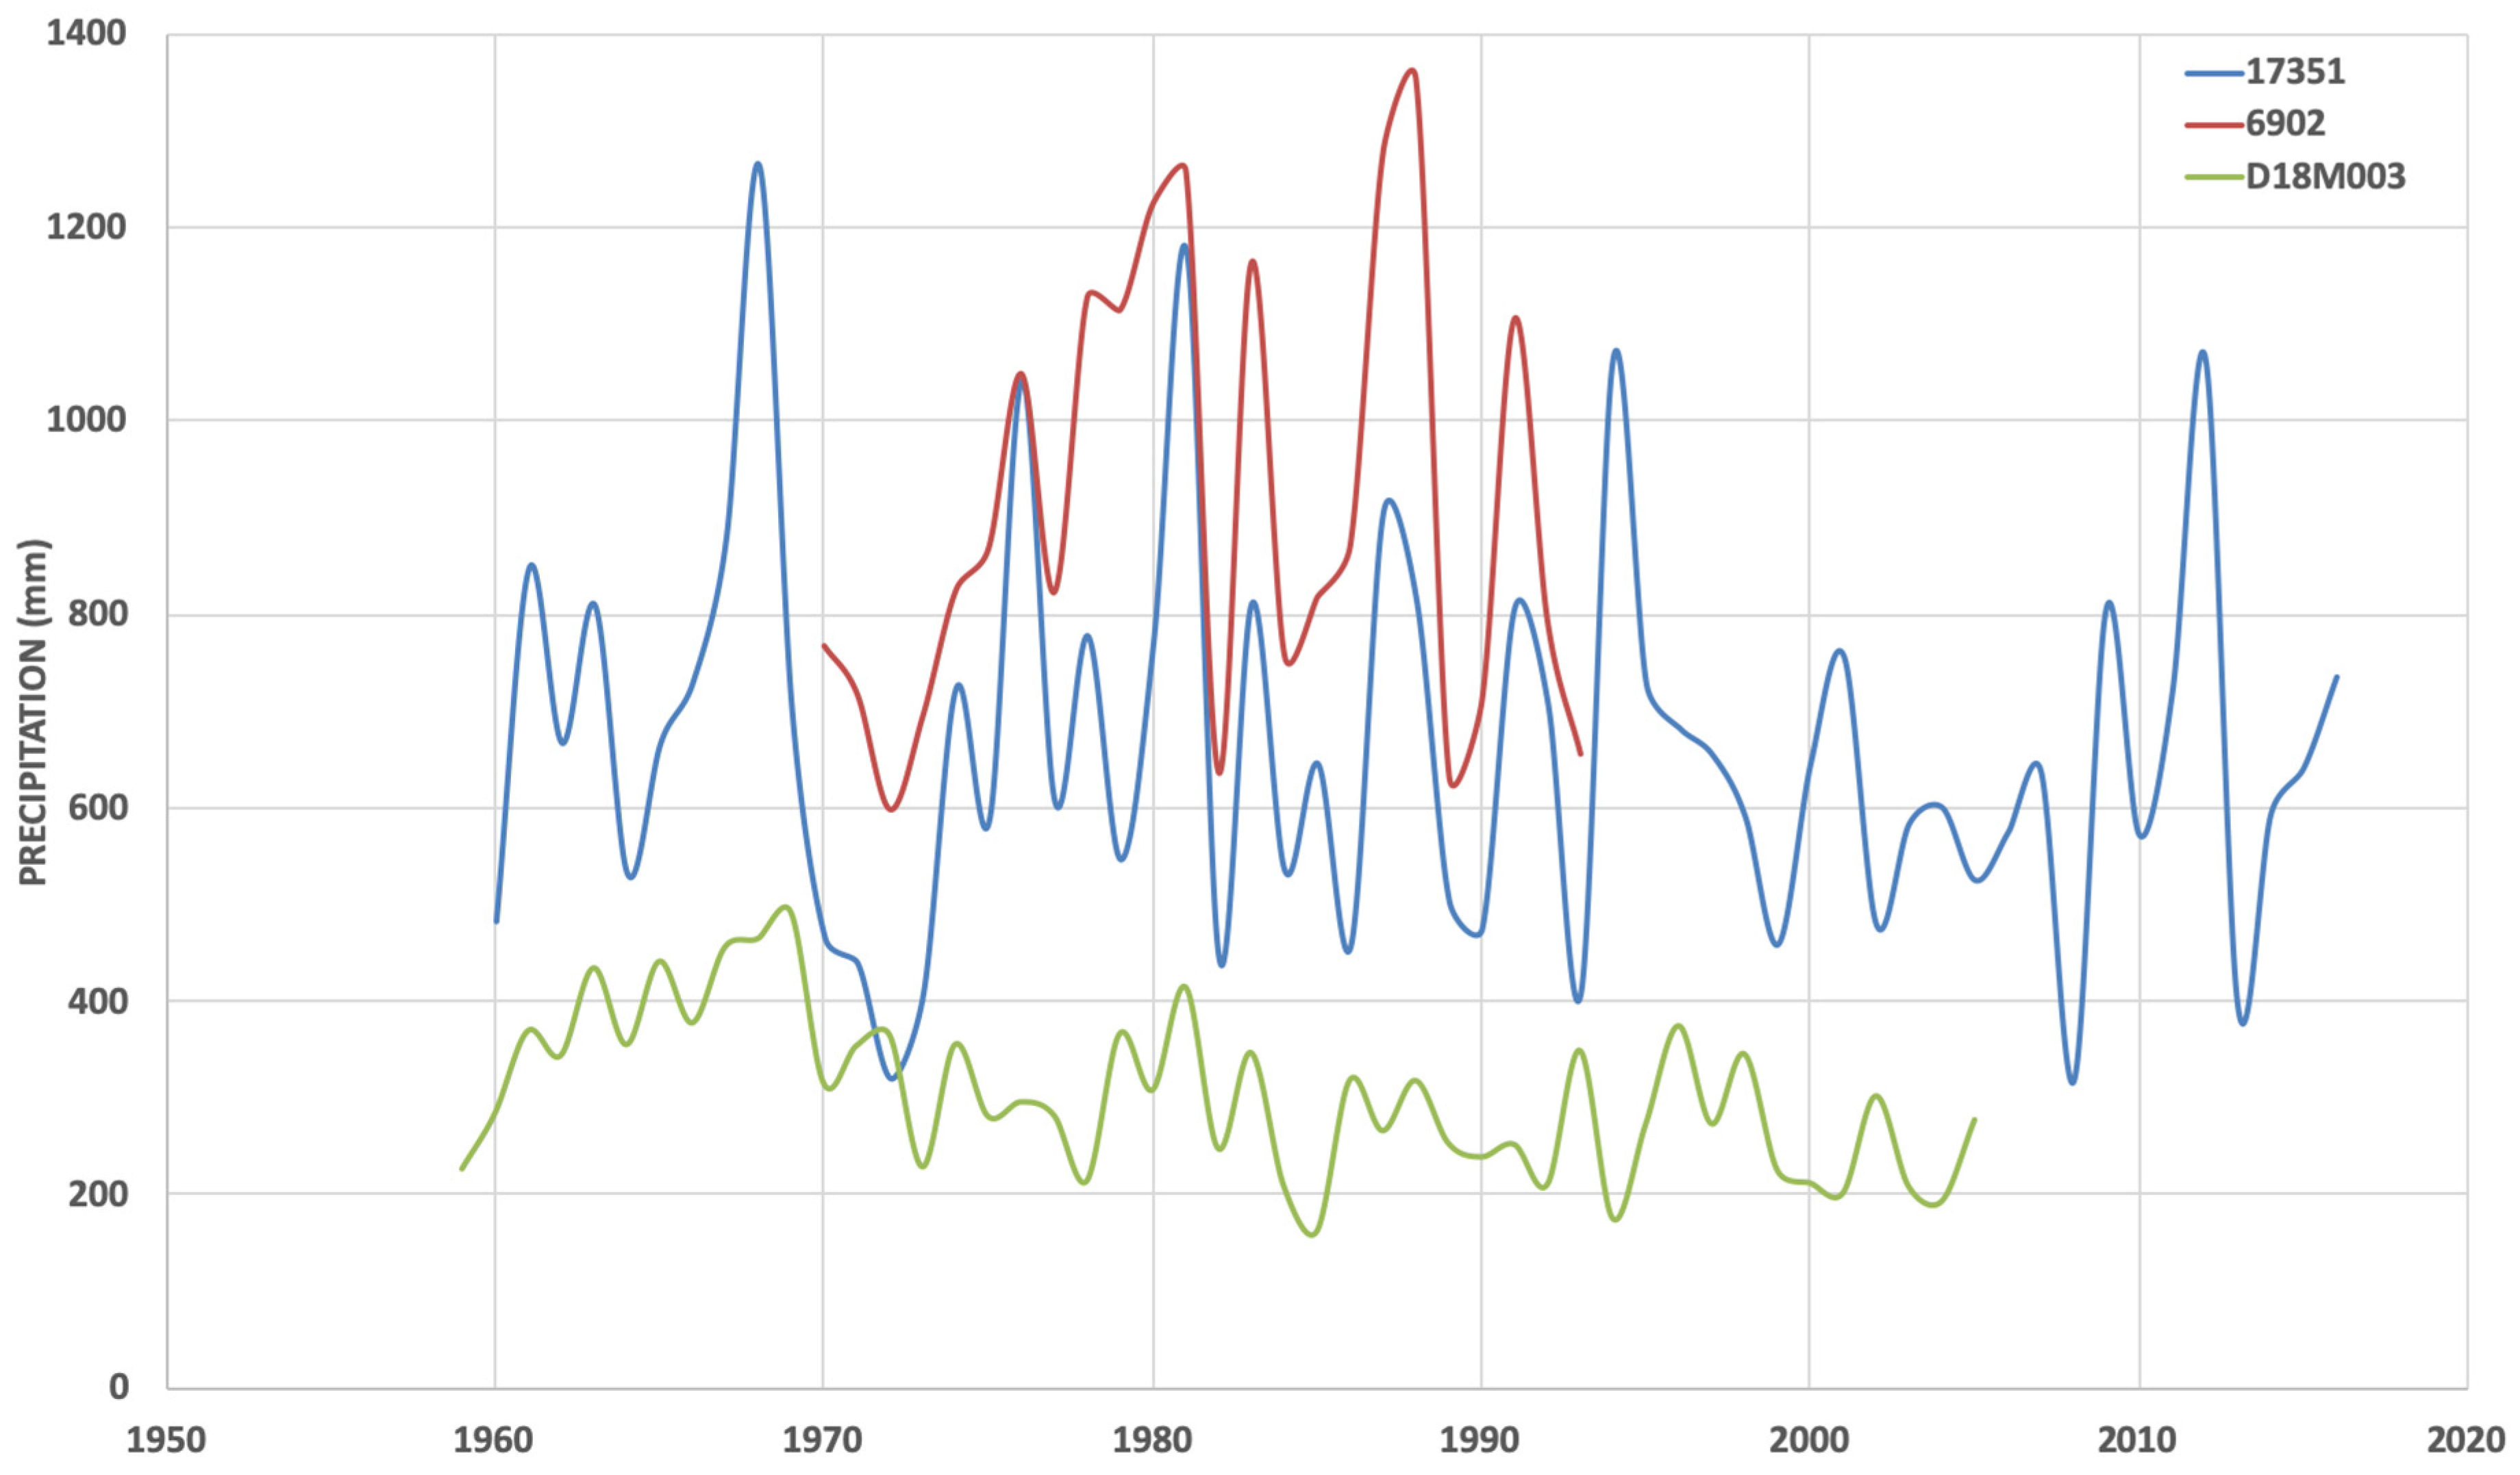
The average annual total precipitation is 641 mm in the Seyhan River basin; it changes from 274 mm in Kazancik (D18M011) in the north to 1006 mm in Hasan Cavuslar (D18M012) in the central part of the basin. A general decreasing tendency in the precipitation is observed from the coastal south to the north in the basin (Figure 3). As for the temporal change in the precipitation of the Seyhan River basin, three meteorological stations were taken: Adana (17351) from the southern, Feke (6902) from the central and Uzunpinar (D18M003) from the northern part (Figure 4). The annual total precipitation time series of the meteorological stations depict a visual stationarity along the observation period, meaning that no significant trend is observed. Also, a parallel tendency is noticed from the temporal fluctuations in the precipitation of the selected meteorological stations. This is simply connected to the size of the basin which is not so large as to create a difference.
The drainage area of the basin is 20,731 km2 which is composed of 2.82% of the surface area of Turkey. The annual mean flow at the outlet of the basin to the Mediterranean Sea is 211.07 m3/s. The most important river in the basin is the Seyhan River, which gives its name to the basin. It is formed by the confluence of Zamanti and Goksu rivers and flows into the Mediterranean Sea. It has a length of 560 km, making it one of the largest rivers in Turkey [35,36].
The Seyhan River basin has been studied widely due to its importance for irrigation, energy and flood control as well as water resources management and planning. For example, the Impact of Climate Change on Water Resources Project, the Seyhan Basin Pollution Prevention Action Plan and the Seyhan Basin Sectoral Water Allocation Plan are among the studies completed by the General Directorate of Water Management [35,36] and the Water Management and Preparation of Basin Protection Action Plan is one performed by the Scientific and Technological Research Council of Turkey [37]. Further examples to be mentioned are given by Dikici et al. [38] who studied drought analysis with the Palmer drought index, Selek and Tuncok [39] who examined the effect of climate change on surface water management, and Topaloğlu [40] who determined the best-fit probability distribution functions for flow and precipitation in the basin. It should be emphasized that these are only a very short list of the studies conducted in the Seyhan River basin. On the other hand, making observation and mapping the formation of drought by using precipitation, soil moisture and plant as indicators the European Drought Observatory (EDO) has found that the most severe drought and precipitation deficit in the Seyhan River basin was recorded in 1990.
3. Methodology
3.1. Standardized Precipitation Index (SPI)
With the help of SPI [41], dry periods of the monthly precipitation can be identified and monitored as well as wet periods. The SPI is obtained simply as the standard normal variable transformed from the gamma distribution [42] by (Equation (1))
where is the precipitation (in mm) in month j (j = 1, 2, 3, ……, 12) of year i (i = 1, 2, …, n); and , are the average and standard deviation of precipitation (in mm) in month j, respectively. The SPI values are calculated for different time scales such as k = 1, 3, 6, 9, 12, 24 months. These arbitrarily selected time scales are used to represent the three types of drought: meteorological, agricultural, and hydrological [41].
3.2. Frequency Analysis
Frequency analysis is performed to characterize the drought and to determine the best-fit probability distribution function. In the frequency analysis of drought, the 2- and 3-parameter Gamma (G2, G3), the Generalized Extreme Value (GEV), the 2- and 3-parameter log-normal (LN2, LN3), Log-Pearson Type 3 (LP3) and the 2- and 3-parameter Weibull (W2, W3) probability distribution functions are often used in the literature [1,3]. For the sake of consistency with the literature, the above probability distribution functions were considered for the frequency analysis of drought in this study.
For months, when no precipitation is observed in certain years, the frequency analysis is applied on the non-zero values only to distinguish zero values from non-zero values, because the frequency analysis would otherwise not be meaningful. Any process that is composed of zero and non-zero values is called a censored or intermittent process. The total probability theorem is available to use for such processes to examine them in two parts: the zero- and non-zero parts.
Therefore, Equation (4)
is obtained.
is the rate of years with non-zero values in the SPIk (k = 1, 3, 6, 9, 12, 24 months) time series. Equation (4) can also be written in terms of the cumulative probability distribution as
In Equation (5), p is the probability of zero values. F(x) is the cumulative probability distribution function of all X including zeros which is expressed as and is the cumulative probability distribution function of the non-zero values of X which is expressed as . The rate of the non-zero values, in Equation (5), can be expressed in terms of the probability as (Equation (6))
The magnitude of an event with return period T can be predicted by solving Equation (5) for and then by using the inverse transformation of to get the value of X. From Equation (5), Equation (7)
and Equation (8)
can be written. Considering that the return period of a given severity for a particular drought duration can be predicted by Equation (9)
Equation (8) turns into Equation (10)
3.3. New Concepts and Definitions
The already known concepts related to the drought process are the dry period length, drought duration, drought severity and drought intensity. Also, the frequency or return period is used to characterize the drought. These concepts are defined as follows:
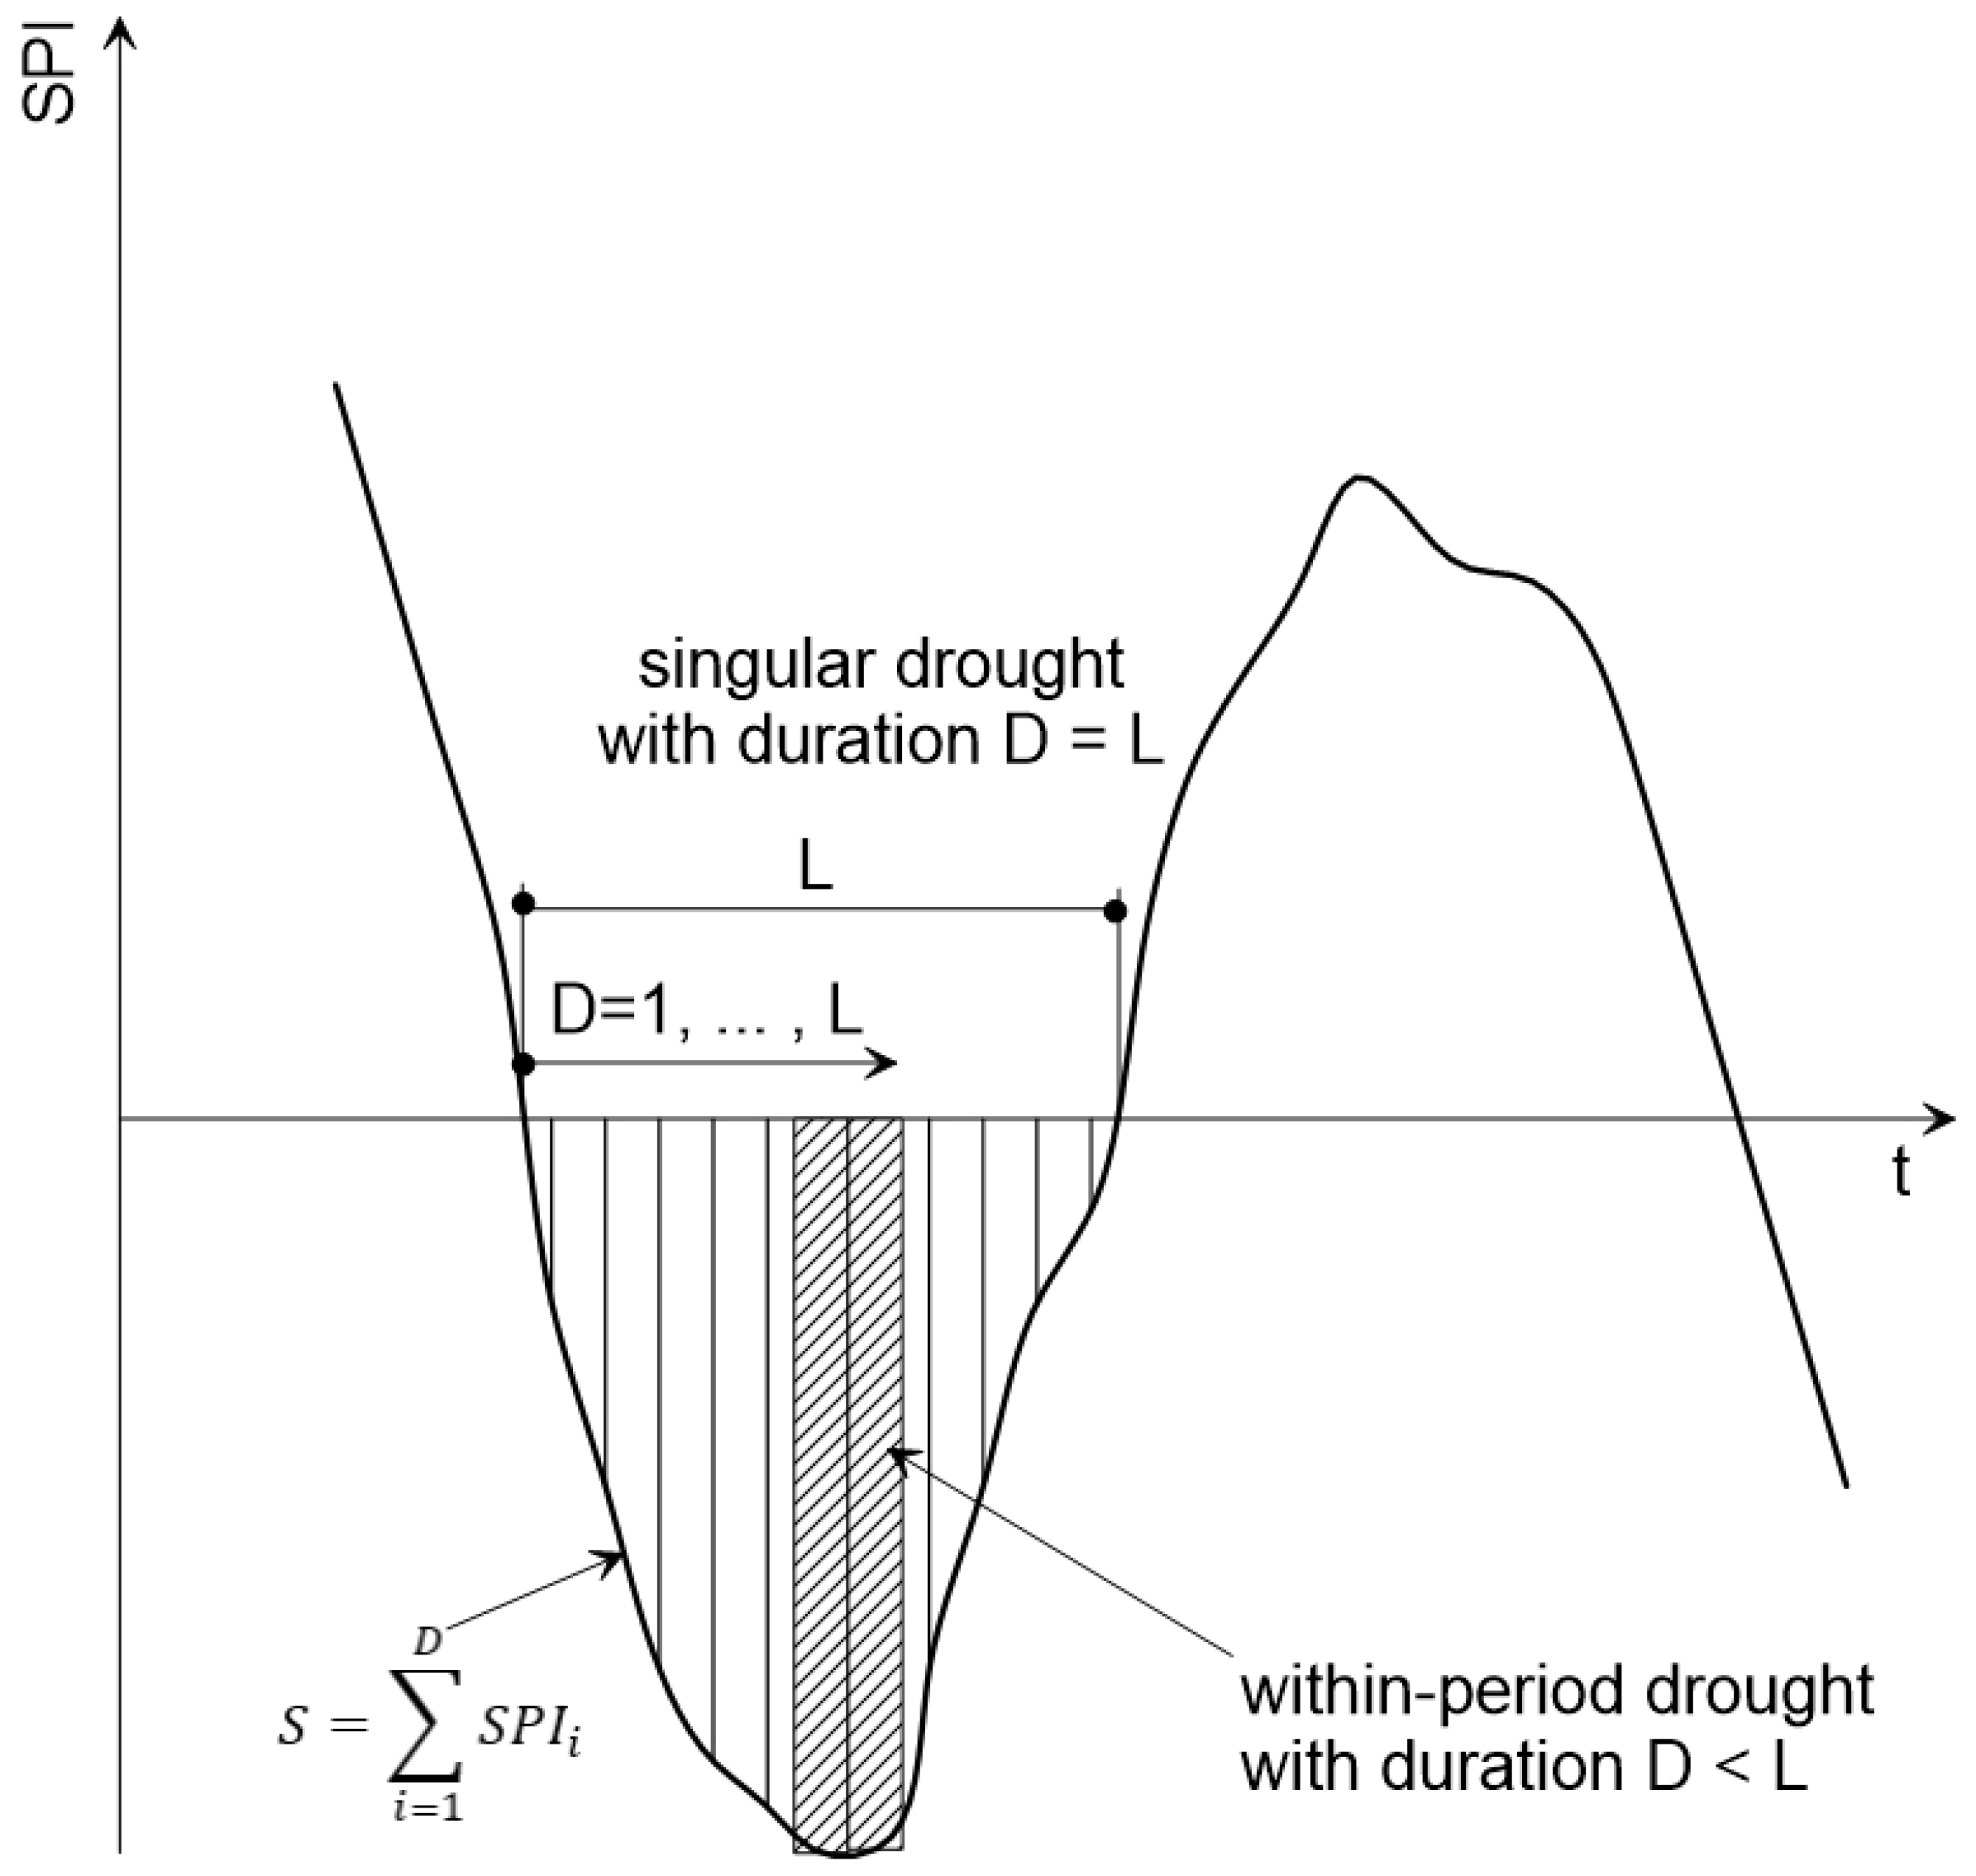
(a) Dry period length (L): The cluster which consists of consecutive negative values of SPI is referred to as the dry period length (Figure 5). It begins in a month with a negative SPI and continues until a positive SPI value is obtained in the time series. A dry period is shown mathematically as in Equation (11)
where is the number of elements of set that shows the length of the dry period as (Equation (12))
(b) Drought duration (D): Duration of droughts in an L-month long dry period is .
(c) Drought severity (S): The accumulation of negative SPI values preceded and followed by positive SPI clusters is called severity. The severity of a drought D month-long is calculated by Equation (13)
In other words, it is the largest absolute value of the cumulative drought index (SPI in this study) in the dry period considered (Equation (14)):
(d) Drought intensity (I): The intensity is obtained by dividing the severity of the drought by its duration (Equation (15)):
(e) Return period (or frequency): The return period of a drought is defined as the average time between two consecutive drought events. The drought frequency decreases with the increasing return period.
In this study, the following definitions of Cavus [20] are also considered:
(f) Critical drought severity: When more than one drought is recorded for any year, drought with the maximum severity is taken as the critical drought. No critical drought is assigned to a year in which drought is not observed.
(g) Within-period drought: Any drought with a duration shorter than the dry period length is called within-period drought. For example, in a dry period of 3 months, there are three 1-month droughts and two 2-month droughts. Similarly, there are two 1-month droughts in a dry period of 2 months (Figure 5).
(h) Singular drought: Drought that extends over the dry period length is called a singular drought. For example, there exists a 1-month singular drought in a dry period of 1 month; a 2-month singular drought in a dry period of 2 months; a 3-month singular drought in a dry period of 3 months and so on. The length of dry period becomes the same as the drought duration for singular droughts while the former is larger than the latter for within-period droughts.
(i) No drought year: Any year with no negative run of SPI is considered a year with no drought. Thus, the critical drought severity is not calculated for such years; a zero value is assigned to the critical drought severity instead.
It should be emphasized that drought is a process which is different than a dry period. It occurs any time when the value of the drought index (SPI in this study) takes a negative value. The drought can be as short as 1 month and as long as the dry period length. However, the critical drought concept introduced in this study considers the most severe drought of the year and eliminates all other milder droughts observed in the same year. The critical drought concept is meteorological station-based and therefore, area under the drought episodes are not considered [44].
3.4. Precipitation Deficit
A drought is defined as a period in which the SPI is continuously negative [41,45,46]. In other words, it begins when the SPI first falls below zero and ends with a positive value of SPI [41]. Thus, the retrospective analysis of drought events by using runs of SPI values may be useful to derive tangible information for precipitation required to overcome the drought [19].
Instead of the direct use of drought indices to develop SDF curves as in previous studies [10], the precipitation deficit is calculated in this study. This approach helps to better understand as the accumulated precipitation is used to define the drought event so that it can be easily identified by end-users such as farmers and decision-makers.
As part of the methodology in this study, the relationship between the precipitation and SPI is detected by regression analysis. In the drought analysis, when the drought duration (D month) and return period (T years) increase, precipitation is expected to decrease, and therefore, the precipitation deficit is expected to increase. Any function to be applied on the relationship between precipitation and the corresponding SPI should satisfy this physical expectation. Some types of functions such as the second and the third order polynomials were omitted as they might produce negative precipitation deficit values against this physical reality. On the other hand, some functions such as Gompertz were discarded, because it was discovered after trials that they could not properly fit SPIk time series of months with high number of zero values (such as SPI1 in August–July). As a result, it was seen that the logistic function could be appropriate to choose among the functions tested due to the above expectation of the physical realization. The logistic regression equation was fitted to the relation between precipitation and the corresponding SPI values and therefore the logistic regression equation was used to analyze data clusters. It describes a family of sigmoidal curves. The simple logistic function has the form of (Equation (16))
in which , and are parameters to be estimated through the use of data scatter.
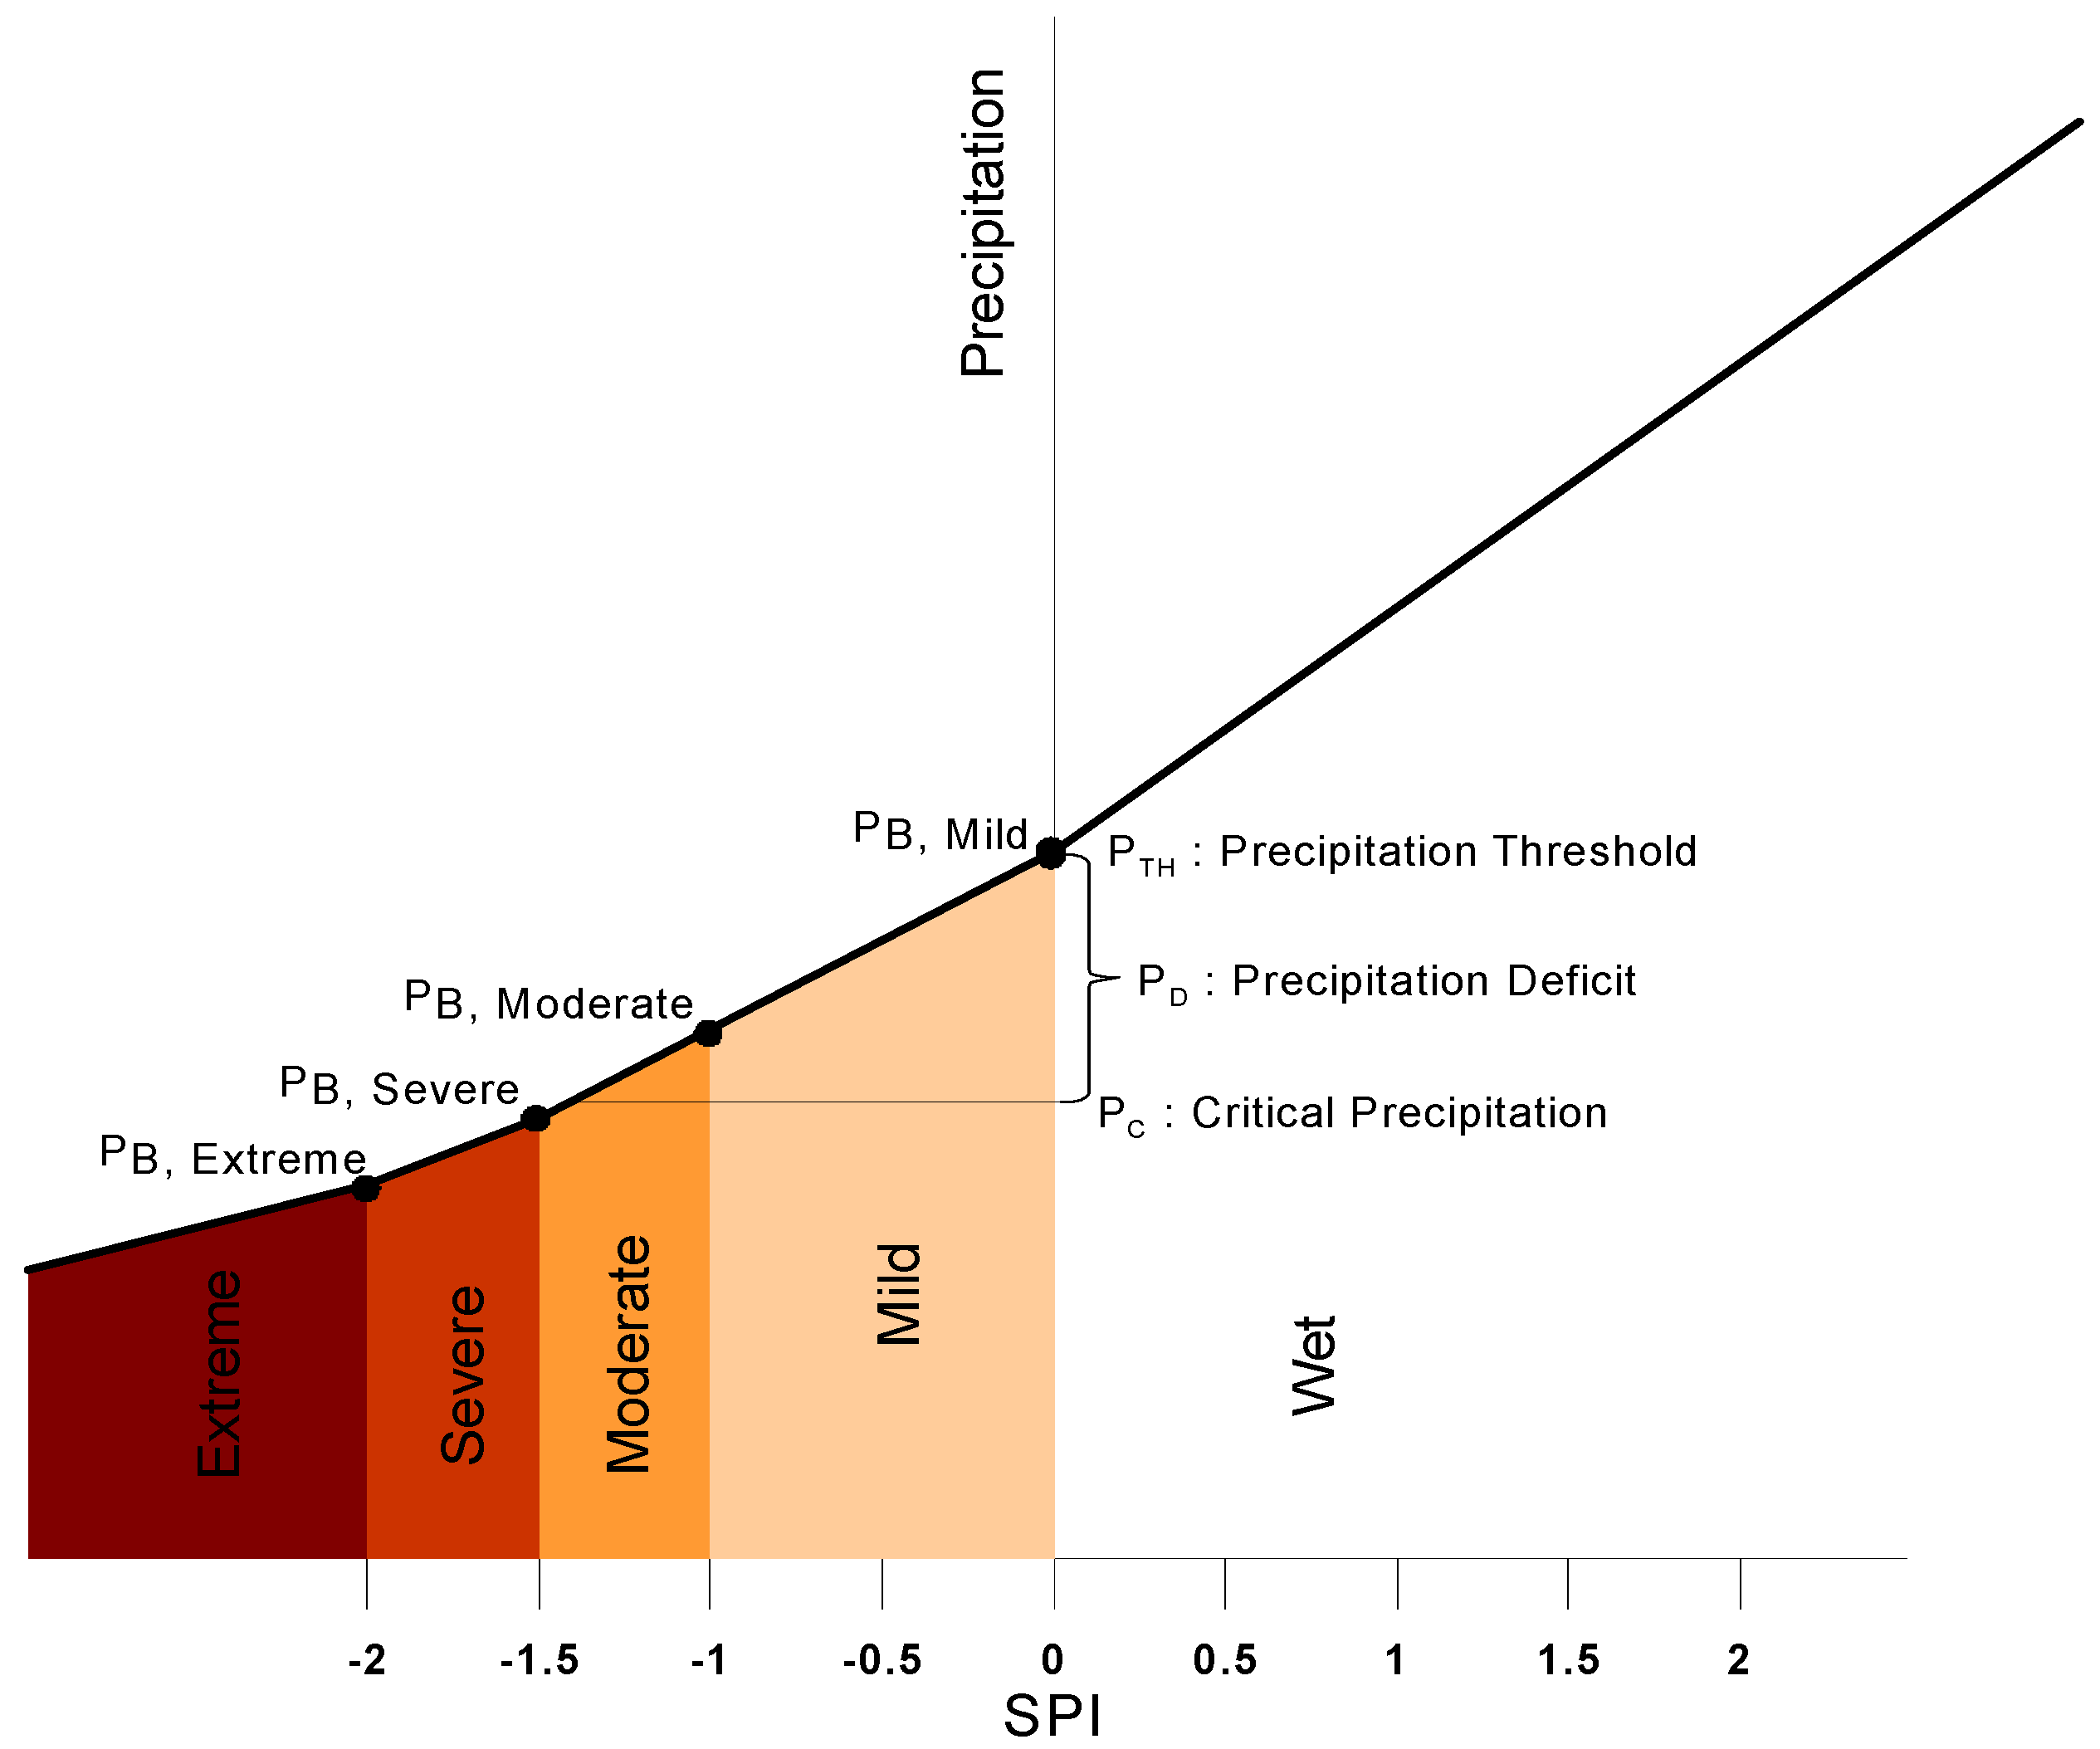
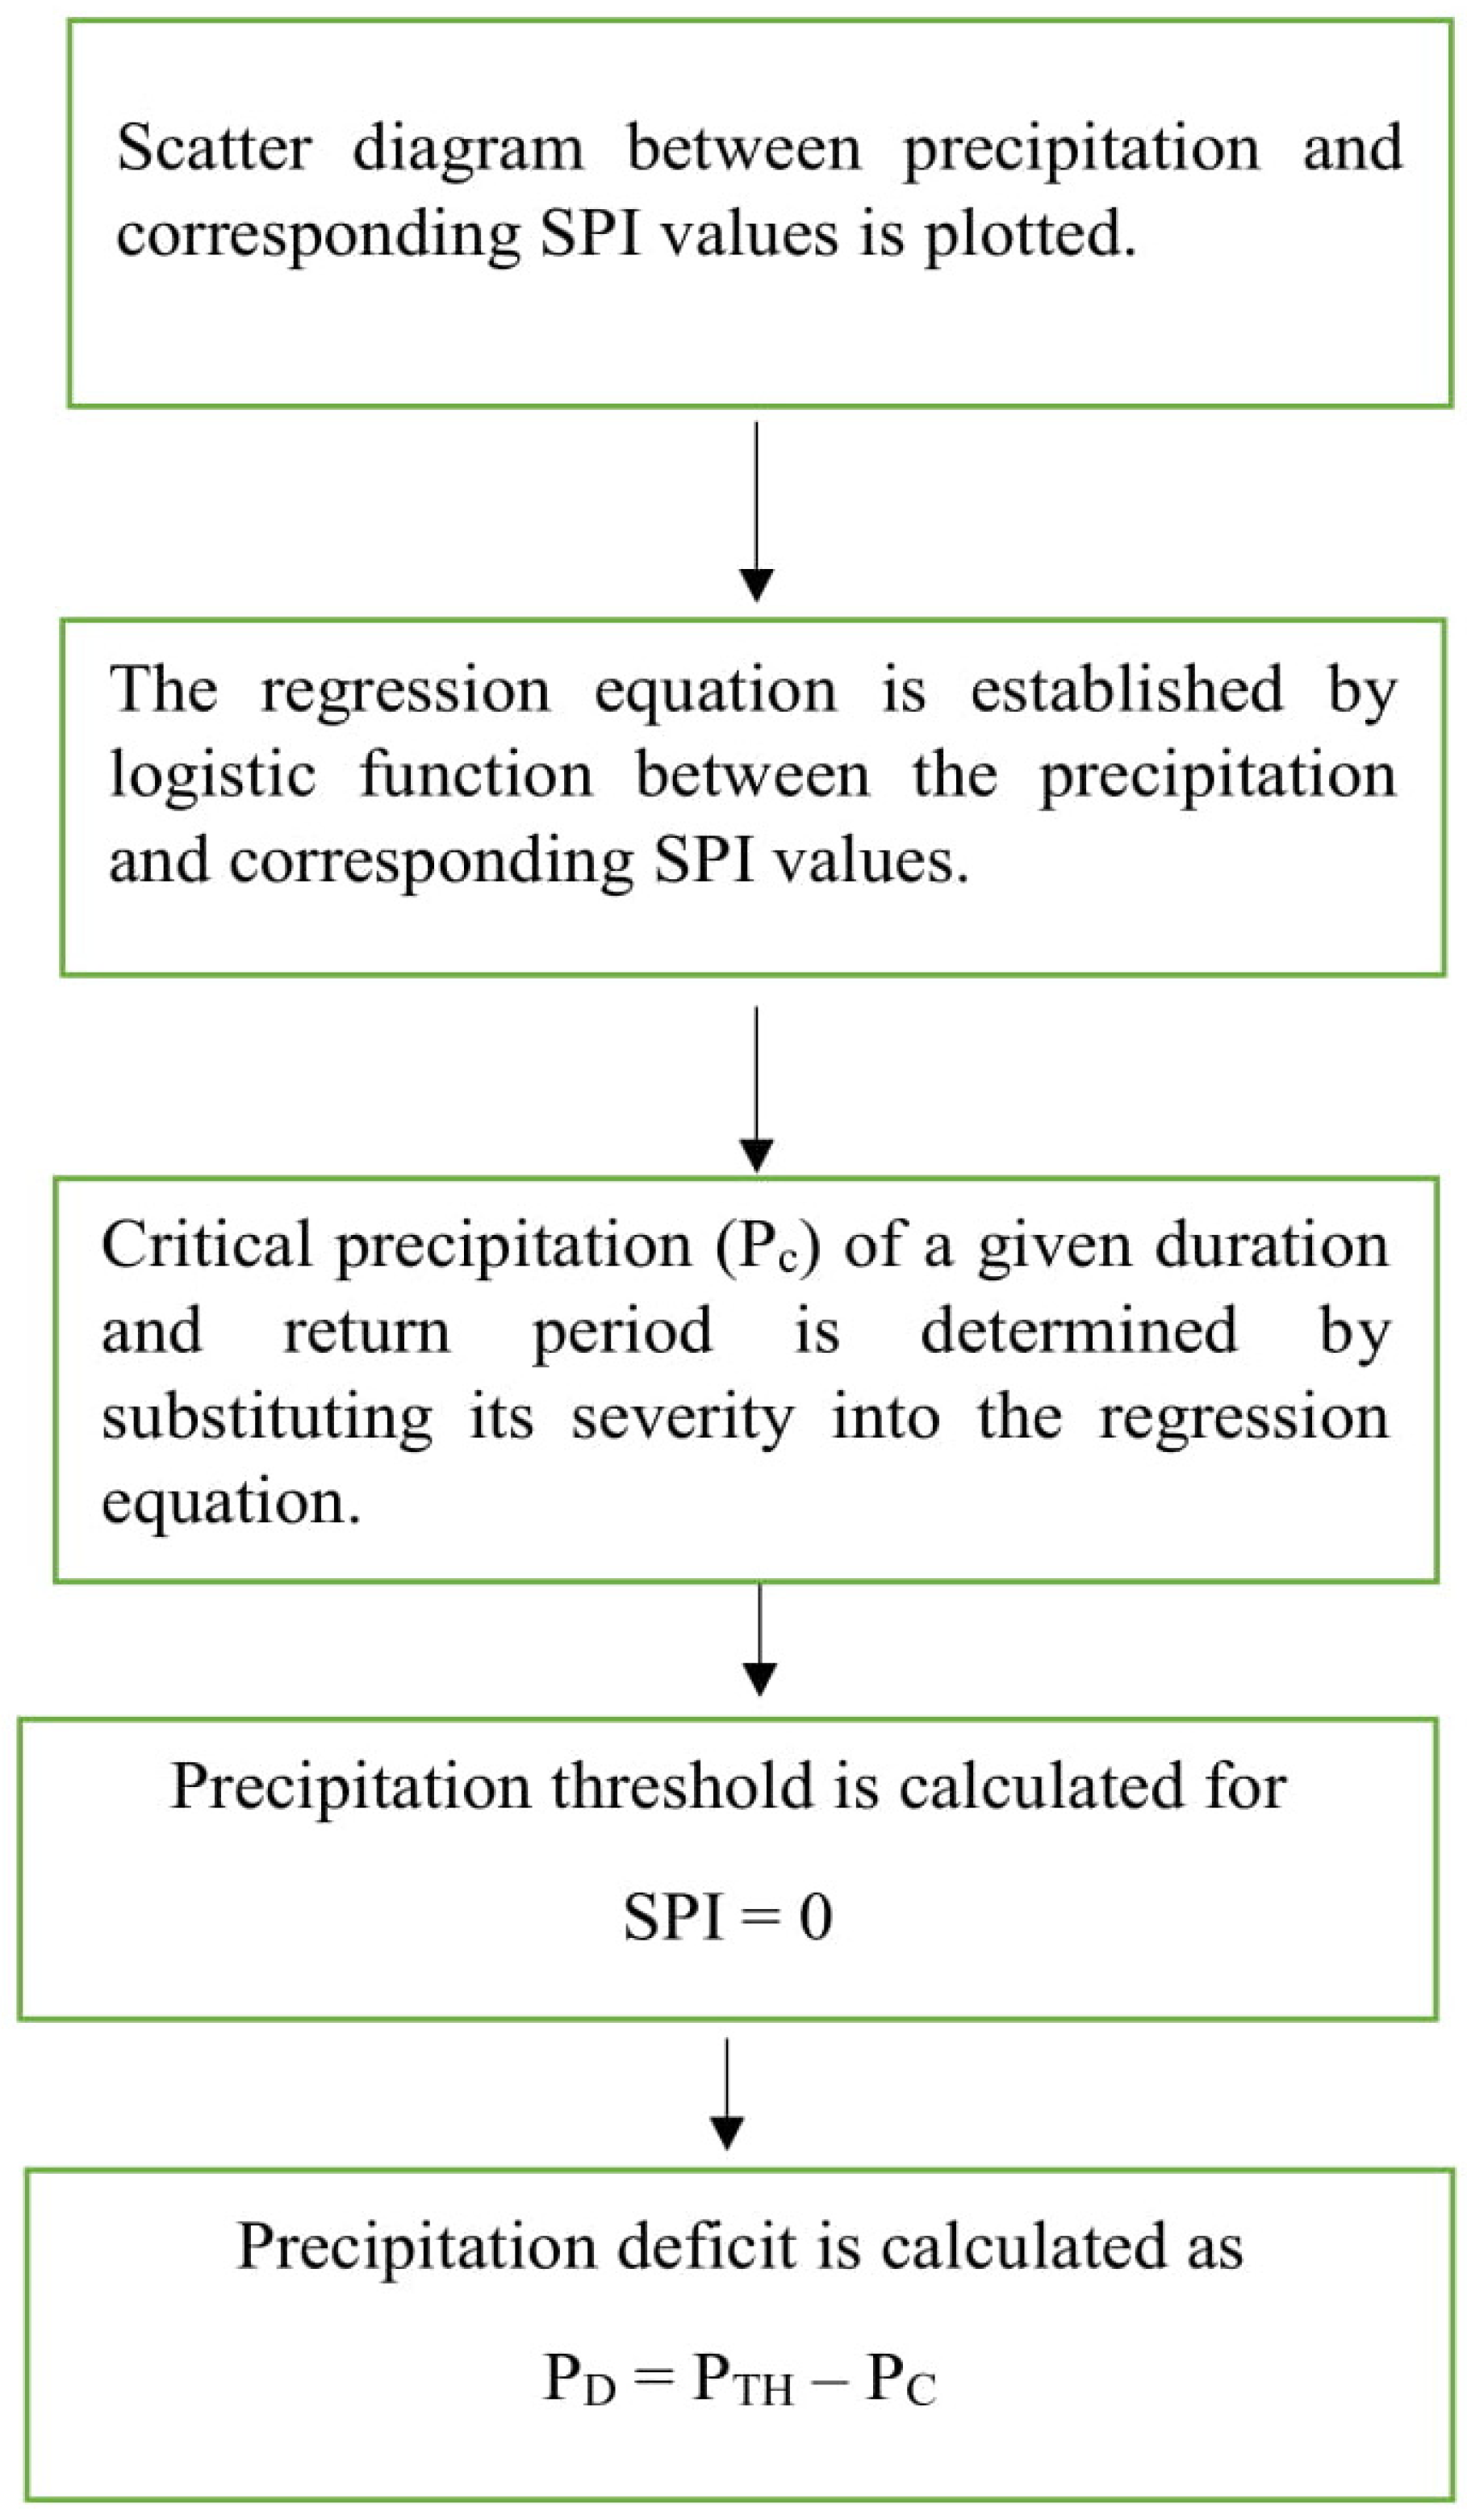
The regression equation can be used to calculate the precipitation threshold value. For time scales 1, 3, 6 and 9 months, the relation between precipitation and SPI changes from month to month. That is, a particular function should be used for each month of the year. However, one curve exists for time scales of 12 and 24 months. Drought is classified depending on the value that the drought index takes [47]. Referring to Figure 6, the precipitation threshold (PTH) was taken as precipitation at SPI = 0 for all time scales. Precipitation values at the boundary of drought classes (PB,Extreme, PB,Severe, PB,Moderate, PB,Mild) are determined based on the classification of McKee et al. [41] as shown in Figure 6. Also shown is the critical precipitation (Pc) which is expected to occur under a critical drought. The difference between the precipitation threshold and the critical precipitation is defined as the precipitation deficit and it is calculated by Equation (17)
for each drought of a given duration and return period. A flowchart of the steps that will be implemented for calculating the precipitation deficit is given in Figure 7.
4. Spatial Mapping
In this study, the Seyhan River basin in the Mediterranean region of Turkey was investigated for its drought characteristics based on the precipitation deficit by considering 19 meteorological stations. SPI was applied to monthly precipitation data at the stations at k = 12-month time scale. Critical drought severity was calculated from the SPI time series which were first implemented by frequency analysis after which critical drought severities were calculated for return periods of 2, 5, 10, 25, 50 and 100 years. From the critical drought severity, the precipitation deficit of 1-, 3-, 6- and 12-month drought durations and 2-, 5-, 10-, 25-, 50- and 100-year return periods were determined at k = 12-month time scale. The drought intensity values were also obtained as the ratio of the drought severity to its duration. Examples to describe the above analysis are given in Table 2 from which it is clearly seen that no drought exists in a few meteorological stations for longer drought duration and return periods as the likelihood of any drought decreases as its duration and return period increase. Also, it is seen from Table 2 that no drought was determined in station 6560 at k = 12-month time scale although the station has experienced drought at lower time scales. This is due to the short length of the precipitation time series that do not allow one to make a proper frequency analysis and to quantify the drought.
Spatial mapping becomes useful in obtaining information for stations with smaller size observation that prevents making a proper frequency analysis or no observation at all [40]. The resulting precipitation deficit corresponding to D month-drought duration and T year-return period at k = 12-month time scale was mapped using the inverse distance weighted (IDW) interpolation technique (Figure 8). Only the precipitation deficit calculated from the SPI was considered in the interpolation process to derive the spatial mapping of the drought over the basin.
Figure 8 presents boundary values of precipitation deficit changes for each D-month drought. As given in Table 2, the D = 1-month drought has its own boundary value that changes between 42.6 mm (the 2-year return period drought in meteorological station 17802) and 567.9 mm (the 100-year return period drought in meteorological station D18M019). Similarly, for the drought of D = 3 month-duration, boundary values are between 31.2 mm (the 2-year return period drought in meteorological station D18M011) and 305.6 mm (the 100-year return period drought in meteorological station D18M012). This is also applied to D = 6 and 12-month drought durations for which the precipitation deficit intervals are 16.7 mm–231.2 mm and 22.1 mm–74.9 mm, respectively (Table 2). Therefore, it is important to emphasize that the maps in Figure 8 are only comparable for each of the drought durations, because the iso-contours of the precipitation deficit have been fixed for each of the drought durations separately. Darker colors in the maps of the same drought duration imply more severe drought. For example, it is seen that droughts become more severe with moving from shorter return periods to longer return periods for D = 1-month drought. This statement is correct for D = 3-, 6- and 12-month drought as well. However, when droughts with different durations are compared, it should be emphasized also that a darker color in a longer drought duration map does not necessarily mean that the drought is more severe than a drought with a lighter color in the shorter drought duration. Similarly, a lighter color does not necessarily mean the opposite; i.e., the drought is milder. Therefore, the discussion of results should be made through the joint use of Table 2 with Figure 8 to arrive at a conclusive discussion about the severity of the drought. It is clearly seen from Table 2 and Figure 8 that the drought severity becomes milder with the increasing longer return periods. This is an expected result of the fact that drought severity is absorbed along longer drought durations. This is a phenomenon quite similar to or even the same as the less intense precipitation of longer durations in the hydrological practice of precipitation intensity–duration–frequency curves.
The spatial distribution of D = 1-month drought duration indicates that more severe precipitation deficits tend to occur in the coastal parts of the basin for all return periods while the north-eastern part of the basin is prone to a lower precipitation deficit at the same return periods. In other words, the majority of the precipitation deficit that occurred in the coastal part was severe in D = 1-month drought duration. As the return period increases from 2 years to 100 years, the drought intensity increases and more severe intensities move towards the northern part of the basin. However, it is always lower in the north compared to the south. The intensity of precipitation deficit exhibits a more variable behavior over the basin when the return period increases.
At the D = 3-month drought duration, again more severe droughts are typically observed at the coastal part of the basin. Especially, the northern part of the Seyhan River basin exhibits a lower precipitation deficit. Nevertheless, as the return period increases, more severe droughts shift from south towards the north, as was the case for D = 1-month drought. It should be noted from Table 2 that for three meteorological stations (6204, 6560 and D18M019), no drought intensity is calculated. This is because the number of critical drought severities is less than 10 and the frequency analysis was therefore not applied on these particular meteorological stations. The number of such meteorological stations increases to 5 and 6 for D = 6 and 12 months, respectively. These stations are not indicated in the corresponding maps in Figure 8.
Another issue to discuss is the D = 12-month duration drought with 2-year return period (See blank column of T = 2-year return period in D = 12-month drought in Table 2 that corresponds to the blank lower-left cell of Figure 8). The mildest drought of D = 12-month has a return period longer than 2 years. In other words, once a 12-month drought is observed, it is as severe as a drought with a return period longer than 2 years. This is the case for 19 meteorological stations used in this study. Therefore, no map was created for D = 12-month drought at T = 2-year return period. Also, it is noticeable from Table 2 that this has been the case for five meteorological stations (6902, 17802, 17840, 17934, and 17936). Maps in Figure 8 have been created by using meteorological stations for which the precipitation deficit is calculated for a given drought duration and return period.
Except for the northern part, the majority of the basin has more severe droughts for all return periods. A conclusive result is that the coastal part of the basin with higher precipitation (Figure 3) experiences more severe drought at all return periods while the northern part of the basin with lower precipitation is characterized by a milder drought. This can be explained by the fact that higher temperature in the southern coastal lowlands increases evapotranspiration that reduces the available precipitation substantially and gives an increase in the precipitation deficit to end up with more severe droughts. In the northern part of the basin with higher altitudes and lower temperature, droughts are milder compared to the southern part due to the net precipitation being reduced by the lower evapotranspiration. It shows also that the coastal parts of the basin are more likely to be affected from hydrological drought with a consequent loss in water resources.
5. Conclusions
This study was assessed as a presentation of a framework of methodologies for the analysis of the spatial characteristics of drought by utilizing frequency analysis in Seyhan River basin in the eastern part of the Mediterranean region in Turkey. The SPI calculated at the 12-month time scale was used as an indicator of drought. Precipitation deficit was newly introduced and calculated using regression analysis between SPI and the corresponding precipitation.
The precipitation deficit was calculated based on the SPI. Instead of the direct use of SPI, the severity/intensity is calculated using the precipitation deficit to characterize the drought to make the procedure more physically based for a better and simpler interpretation. This is because SPI is a technical tool and it is thus difficult to understand, at first glance, by end-users and decision-makers. Precipitation deficit in different durations and return periods is more useful and physically meaningful to the users. The direct information provided by the precipitation deficit allows planning and measures against drought to be taken in advance. Spatial analysis of drought might help decision makers to achieve better natural resources planning by considering the spatial drought vulnerability.
The spatial analysis indicates that the Seyhan River basin in the Mediterranean region of Turkey experiences droughts with quite different severities simultaneously. The spatial distribution would alter greatly with increasing return period and drought duration. While the coastal part of the basin is vulnerable to droughts at all return periods and drought durations, the northern part of the basin would be expected to be less affected by the drought. On the other hand, as the drought duration and return period increase, drought intensity based on precipitation deficit is expected to decrease. Another result reached in this study is that it could be common for one point in the basin to suffer from the drought, whilst surrounding points in the same basin experience normal or even humid conditions. This reinforces the importance of spatial analysis over the basin instead of the point-scale temporal analysis made in each meteorological station in the basin.
The drought characterization based on precipitation deficit completely changes at longer drought duration and return periods. The river basin experiences severe prolonged droughts, which means that, at k = 12-month time scale, the coastal part will suffer from severe hydrological drought.
Author Contributions
Conceptualization, H.A. and Y.C.; Data Curation, H.A.; Formal Analysis, H.A. and Y.C.; Investigation, H.A. and Y.C.; Methodology, H.A. and Y.C.; Software, Y.C.; Visualization, Y.C. and H.A.; Writing-Original Draft Preparation, Y.C.; Writing-Review & Editing, H.A. and Y.C.
Funding
This research was supported by Research Fund of the Istanbul Technical University. Project Number: 42141.
Conflicts of Interest
The authors declare no conflict of interest.
References
- Mishra, A.K.; Singh, V.P. A review of drought concepts. J. Hydrol. 2010, 391, 202–216. [Google Scholar] [CrossRef]
- Heim, R. A review of twentieth-century drought indices used in the United States. Bull. Am. Meteorol. Soc. 2002, 83, 1149–1165. [Google Scholar] [CrossRef]
- Mishra, A.K.; Singh, V.P. Drought modeling—A review. J. Hydrol. 2011, 403, 157–175. [Google Scholar] [CrossRef]
- Zargar, A.; Sadiq, R.; Naser, B.; Khan, F.I. A review of drought indices. Environ. Rev. 2011, 19, 333–349. [Google Scholar] [CrossRef]
- Hao, Z.; Singh, V.P. Drought characterization from a multivariate perspective: A review. J. Hydrol. 2015, 527, 668–678. [Google Scholar] [CrossRef]
- Eslamian, S.; Ostad-Ali-Askari, K.; Singh, V.P.; Dalezios, N.R.; Ghane, M.; Yihdego, Y.; Matouq, M. A review of drought indices. Int. J. Constr. Res. Civ. Eng. 2017, 3, 48–66. [Google Scholar]
- Dracup, J.A.; Lee, K.S.; Paulson, E.G. On the statistical characteristics of drought events. Water Resour. Res. 1980, 16, 289–296. [Google Scholar] [CrossRef]
- Rossi, G.; Benedini, M.; Tsakiris, G.; Giakoumakis, S. On regional drought estimation and analysis. Water Resour. Manag. 1992, 6, 249–277. [Google Scholar] [CrossRef]
- Loaiciga, H.A.; Leipnik, R.B. Stochastic renewal model of Iow-fow streamflow sequences. Stoch. Hydrol. Hydraul. 1996, 10, 65–85. [Google Scholar] [CrossRef]
- Dalezios, N.R.; Loukas, A.; Vasiliades, L.; Liakopoulos, E. Severity-duration-frequency analysis of droughts and wet periods in Greece. Hydrol. Sci. J. 2001, 45, 751–769. [Google Scholar] [CrossRef]
- Tsakiris, G.; Vangelis, H. Establishing a drought index incorporating evapotranspiration. Eur. Water 2005, 9, 3–11. [Google Scholar]
- Nalbantis, I.; Tsakiris, G. Assessment of hydrological drought revisited. Water Resour. Manag. 2009, 23, 881–897. [Google Scholar] [CrossRef]
- Eris, E.; Aksoy, H. Persistency in wet and dry periods in Goztepe meteorological station in Istanbul, Turkey. In Proceedings of the AMHY-FRIEND International Workshop on Hydrological Extremes, Analyses and Images of Hydrological Extremes in Mediterranean Environments, Cosenza, Italy, 10–12 July 2008; pp. 93–99. [Google Scholar]
- Vicente-Serrano, S.M.; Begueria, S.; Moreno, J.I.L. A multiscalar drought index sensitive to global warming: The standardized precipitation evapotranspiration index. J. Clim. 2010, 23, 1696–1718. [Google Scholar] [CrossRef]
- Santos, J.; Portela, M.; Pulido-Calvo, I. Regional frequency analysis of droughts in portugal. Water Resour. Manag. 2011, 25, 3537–3558. [Google Scholar] [CrossRef]
- Tigkas, D.; Vangelis, H.; Tsakiris, G. The drought indices calculator (DrinC). Earth Sci. Inform. 2015, 8, 697–709. [Google Scholar] [CrossRef]
- Aksoy, H.; Cetin, M.; Onoz, B.; Yuce, M.I.; Eris, E.; Selek, B.; Aksu, H.; Burgan, H.I.; Esit, M.; Orta, S.; et al. Hidrolojik havzalarda düşük akımlar ve kuraklık analizi; Rapor No. TUJJB-TUMEHAP-2015-01; TUJJB Sonuç Raporu: Istanbul, Turkey, 2018. [Google Scholar]
- Aksoy, H.; Onoz, B.; Cetin, M.; Yuce, M.I.; Eris, E.; Selek, B.; Aksu, H.; Burgan, H.I.; Esit, M.; Orta, S.; et al. SPI-based drought severity-duration-frequency analysis. In Proceedings of the 13th International Congress on Advances in Civil Engineering, Izmır, Turkey, 12–14 September 2018. [Google Scholar]
- Cetin, M.; Aksoy, H.; Onoz, B.M.; Yuce, M.I.; Eris, E.; Selek, B.; Aksu, H.; Burgan, H.I.; Esit, M.; Cavus, Y.; et al. Deriving accumulated precipitation deficits from drought severity duration-frequency curves: A case study in Adana province, Turkey. In Proceedings of the 1st International, 14th National Congress on Agricultural Structures and Irrigation, Antalya, Turkey, 26–28 September 2018. [Google Scholar]
- Cavus, Y. Critical Drought Severity-Duration-Frequency Curves Based on Precipitation Deficit. Master’s Thesis, Hydraulics and Water Resources Programme, Department of Civil Engineering, Graduate School of Science, Engineering and Technology, Istanbul Technical University, İstanbul, Turkey, May 2019; 160p. [Google Scholar]
- Turkes, M. Spatial and temporal analysis of annual rainfall variations in Turkey. Int. J. Climatol. 1996, 16, 1057–1076. [Google Scholar] [CrossRef]
- Komuscu, A.U. An analysis of recent drought conditions in Turkey in relation to circulation patterns. Drought Network News, Summer–Fall 2001, University of Nebraska Lincoln. Drought-Natl. Drought Mitig. Cent. 2001, 13, 5–6. [Google Scholar]
- Sonmez, F.K.; Komuscu, A.U.; Erkan, A.; Turgu, E. An analysis of spatial and temporal dimension of drought vulnerability in Turkey using the standardized precipitation index. Nat. Hazard. 2005, 35, 243–264. [Google Scholar] [CrossRef]
- Jones, P.D.; Hulme, M.; Briffa, K.R.; Jones, C.G. Summer moisture availability over Europe in the Hadley centre general circulation model based on the Palmer drought severity index. Int. J. Climatol. 1996, 16, 155–172. [Google Scholar] [CrossRef]
- Vicente-Serrano, S.M.; Begueria, S. Differences in spatial patterns of drought on different time scales: An analysis of the Iberian penisula. Water Resour. Manag. 2006, 20, 37–60. [Google Scholar] [CrossRef]
- Vicente-Serrano, S.M.; Begueria, S. Evaluating the impact of drought using remote sensing in a Mediterranean, semi-arid region. Nat. Hazard. 2007, 40, 173–208. [Google Scholar] [CrossRef]
- Caloiero, T.; Veltri, S.; Caloiero, P.; Frustaci, F. Drought analysis in Europe and in the Mediterranean basin using the standardized precipitation index. Water 2018, 10, 1043. [Google Scholar] [CrossRef]
- Vicente-Serrano, S.M.; Gonzalez-Hidalgo, J.C.; Luis, M.D.; Raventos, J. Drought pattern in the Mediterranean area: The Valencia region (eastern Spain). Clim. Res. 2004, 26, 5–15. [Google Scholar] [CrossRef]
- Spinoni, J.; Antofie, T.; Barbosa, P.; Bihari, Z.; Lakatos, M.; Szalai, S.; Szentimrey, T.; Vogt, J. An overview of drought events in the Carpathian Region in 1961–2010. Adv. Sci. Res. 2013, 10, 21–32. [Google Scholar] [CrossRef]
- Bonaccorso, B.; Bordi, I.; Cancelliere, A.; Rossi, G.; Sutera, A. Spatial variability of drought: An analysis of the SPI in Sicily. Water Resour. Manag. 2003, 17, 273–296. [Google Scholar] [CrossRef]
- Loukas, A.; Vasiliades, L. Probabilistic analysis of drought spatiotemporal characteristics in Thessaly region, Greece. Nat. Hazards Earth Syst. Sci. 2004, 4, 719–731. [Google Scholar] [CrossRef]
- He, B.; Lv, A.F.; Wang, J.J.; Zhao, L.; Liu, M. Drought hazard assessment and spatial characteristics analysis in Chine. J. Geogr. Sci. 2011, 21, 235–249. [Google Scholar] [CrossRef]
- Murara, P.; Acquaotta, F.; Garzena, D.; Fratianni, S. Daily precipitation extremes and their variations in the Itajaí River Basin, Brazil. Meteorol. Atmos. Phys. 2018. [Google Scholar] [CrossRef]
- Baronetti, A.; Acquaotta, F.; Fratianni, S. Rainfall variability from a dense rain gauge network in north-western Italy. Clim. Res. 2018, 75, 201–213. [Google Scholar] [CrossRef]
- Su Yönetimi Genel Müdürlüğü. Seyhan Havzası Sektörel Su Tahsis Planı Hazırlanması Projesi; Impact of Climate Change on Water Resources Project; Ankara, Turkey, 2016; (In Turkish). Available online: https://www.tarimorman.gov.tr/SYGM/Belgeler/Seyhan%20Havzas%C4%B1/Sekt%C3%B6rel%20Su%20Tahsis%20Plan%C4%B1.pdf (accessed on 15 May 2019).
- Su Yönetimi Genel Müdürlüğü. İklim Değişikliğinin Su Kaynaklarına Etkisi Projesi, Proje Nihai Raporu, Ek 20-Seyhan Havzası; Change on Water Resources Project; Ankara, Turkey, 2017; (In Turkish). Available online: http://iklim.ormansu.gov.tr/ckfinder/userfiles/files/Iklim_Nihai_Rapor_Seyhan_Ek_20_REV_nihai.pdf (accessed on 15 May 2019).
- The Scientific and Technological Research Council of Turkey (TUBITAK) Marmara Research Center (MAM) (TUBITAK). Havza Koruma Eylem Planları-Seyhan Havzası; Water Management and Preparation of Basin Protection Action Plans; Ankara, Turkey, 2010; (In Turkish). Available online: https://www.tarimorman.gov.tr/SYGM/Belgeler/havza%20koruma%20eylem%20planlar%C4%B1/Seyhan_Havzasi.pdf (accessed on 15 May 2019).
- Dikici, M.; Ipek, C.; Topcu, I. Seyhan havzasında Palmer indeksleri ile kuraklık analizi. In Proceedings of the 6th International Symposium on Innovative Technologies in Engineering and Science, Antalya, Turkey, 9–11 November 2018. [Google Scholar]
- Selek, B.; Tuncok, I.K. Effects of climate change on surface water management of Seyhan basin, Turkey. Environ. Ecol. Stat. 2014, 21, 391–409. [Google Scholar] [CrossRef]
- Topaloğlu, F. Determining suitable probability distribution models for flow and precipitation series of the Seyhan river basin. Turk. J. Agric. For. 2002, 26, 187–194. [Google Scholar]
- McKee, T.B.; Doesken, N.J.; Kleist, J. The relationship of drought frequency and duration to time scales. In Proceedings of the Eighth Conference on Applied Climatology, American Meteorological Society, Anaheim, CA, USA, 17–23 January 1993. [Google Scholar]
- Aksoy, H. Use of gamma distribution in hydrological analysis. Turk. J. Eng. Environ. Tubitak 2000, 24, 419–428. [Google Scholar]
- Haan, C.T. Statistical Methods in Hydrology; Iowa State University Press: Ames, IA, USA, 1977. [Google Scholar]
- González-Hidalgo, J.C.; Vicente-Serrano, S.M.; Peña-Angulo, D.; Salinas, C.; Tomas-Burguera, M.; Beguería, S. High-resolution spatio-temporal analyses of drought episodes in the western Mediterranean basin (Spanish mainland, Iberian Peninsula). Acta Geophys. 2018, 66, 381–392. [Google Scholar] [CrossRef] [Green Version]
- Paula, A.; Pereira, L.S. Drought concepts and characterization: Comparing drought indices applied at local and regional scales. Int. Water Resour. Assoc. Water Int. 2006, 31, 37–49. [Google Scholar] [CrossRef]
- Rahmat, S.N.; Jayasuriya, N.; Bhuiyan, M. Development of drought severity-duration-frequency curves in Victoria, Australia. Aust. J. Water Resour. 2015, 19, 156–160. [Google Scholar] [CrossRef]
- Spinoni, J.; Naumann, G.; Carro, H.; Barbosa, P.; Vogt, J. World drought frequency, duration, and severity for 1951–2010. Int. J. Climatol. 2014, 34, 2792–2804. [Google Scholar] [CrossRef]
Figure 1.
Topography of the Seyhan River basin.

Figure 2.
Layout of the meteorological stations in the Seyhan River basin.

Figure 3.
Spatial change in the annual precipitation over the Seyhan River basin.

Figure 4.
Temporal variability in precipitation.

Figure 5.
Dry period length (L), drought duration (D), and drought severity (S). Dry period length (L) is determined as a fixed value for each dry period; drought duration (D) changes, however, from 1 month to L. Drought with duration L is called a singular drought while droughts with duration shorter than the dry period length are called within-period drought.

Figure 6.
Definition of precipitation threshold, boundary precipitation and critical precipitation.

Figure 7.
Step-by-step calculation of the precipitation deficit.

Figure 8.
Intensity maps for droughts of 1, 3, 6 and 12-month durations and 2, 5, 10, 25, 50 and 100-year return periods over the Seyhan River basin.
Figure 8.
Intensity maps for droughts of 1, 3, 6 and 12-month durations and 2, 5, 10, 25, 50 and 100-year return periods over the Seyhan River basin.


Table 1.
Meteorological stations in the Seyhan River basin.
| Code | Station Name | Latitude | Longitude | Altitude (m) | Institution | Observation Period | Missing Data (month) | No-Rainy Months (%) | Mean (mm) | Min (mm) | Max (mm) |
|---|---|---|---|---|---|---|---|---|---|---|---|
| 6204 | Tufanbeyli | 38.2600 | 36.2195 | 1415 | MGM | 1998–2012 | 3 | 6.67 | 545 | 312 | 706 |
| 6560 | Saimbeyli | 37.9811 | 36.0853 | 1050 | MGM | 1986–1995 | 4 | 4.17 | 923 | 625 | 1233 |
| 6893 | Çamardı | 37.8358 | 34.9975 | 1603 | MGM | 1969–1982 | 1 | 7.74 | 412 | 316 | 546 |
| 6902 | Feke | 37.7764 | 35.9000 | 583 | MGM | 1970–1993 | 1 | 4.86 | 910 | 598 | 1352 |
| 17351 | Adana Bölge | 37.0041 | 35.3443 | 23 | MGM | 1960–2016 | 0 | 11.40 | 663 | 317 | 1265 |
| 17802 | Kayseri Pınarbaşı | 38.7251 | 36.3904 | 1542 | MGM | 1963–2009 | 5 | 4.08 | 423 | 267 | 597 |
| 17837 | Tomarza | 38.4522 | 35.7912 | 1402 | MGM | 1965–2010 | 8 | 4.53 | 408 | 269 | 585 |
| 17840 | Sarız | 38.4781 | 36.5035 | 1599 | MGM | 1968–2011 | 0 | 5.30 | 524 | 354 | 748 |
| 17906 | Ulukışla | 37.5480 | 34.4867 | 1453 | MGM | 1962–2011 | 11 | 6.33 | 322 | 182 | 428 |
| 17934 | Pozantı | 37.4758 | 34.9022 | 1080 | MGM | 1963–1992 | 24 | 6.11 | 719 | 380 | 1299 |
| 17936 | Karaisalı | 37.2505 | 35.0628 | 240 | MGM | 1965–2011 | 0 | 4.61 | 881 | 437 | 1451 |
| 17981 | Karataş | 36.5683 | 35.3894 | 22 | MGM | 1963–2011 | 5 | 15.31 | 777 | 366 | 1365 |
| D18M003 | Uzunpınar | 38.9710 | 36.8990 | 1740 | DSI | 1959–2005 | 11 | 7.45 | 303 | 161 | 493 |
| D18M004 | Seyhan Baraj | 37.7000 | 35.0830 | 55 | DSI | 1974–2015 | 4 | 14.48 | 657 | 314 | 1117 |
| D18M011 | Kazancık | 39.0670 | 36.7330 | 1585 | DSI | 1965–2003 | 8 | 7.69 | 274 | 176 | 433 |
| D18M012 | Hasan Çavuşlar | 37.8330 | 35.5830 | 1400 | DSI | 1990–2005 | 0 | 3.65 | 1006 | 713 | 1539 |
| D18M013 | Kamışlı | 37.5670 | 34.9500 | 1225 | DSI | 1963–2002 | 2 | 9.17 | 628 | 328 | 1123 |
| D18M018 | Gıcak | 37.5670 | 35.2000 | 975 | DSI | 1988–2006 | 0 | 10.53 | 843 | 520 | 1173 |
| D18M019 | Çeralan | 38.1000 | 36.0000 | 1600 | DSI | 1991–2005 | 4 | 6.67 | 970 | 622 | 1342 |
Table 2.
Drought intensity based on precipitation deficit corresponding to 2, 5, 10, 25, 50 and 100-year return periods at k = 12-month time scale.
Table 2.
Drought intensity based on precipitation deficit corresponding to 2, 5, 10, 25, 50 and 100-year return periods at k = 12-month time scale.
| D = 1 Month | D = 3 Months | D = 6 Months | D = 12 Months | ||||||||||||||||||||||
|---|---|---|---|---|---|---|---|---|---|---|---|---|---|---|---|---|---|---|---|---|---|---|---|---|---|
| Return Period | 2 | 5 | 10 | 25 | 50 | 100 | 2 | 5 | 10 | 25 | 50 | 100 | 2 | 5 | 10 | 25 | 50 | 100 | 2 | 5 | 10 | 25 | 50 | 100 | |
| Station no | |||||||||||||||||||||||||
| 6204 | 50.4 | 152.7 | 214.8 | 281.1 | 321.0 | 353.5 | |||||||||||||||||||
| 6560 | |||||||||||||||||||||||||
| 6893 | 81.3 | 108.7 | 123.0 | 138.6 | 148.7 | 158.1 | 65.3 | 79.3 | 86.1 | 93.3 | 97.8 | 101.8 | |||||||||||||
| 6902 | 174.3 | 280.5 | 320.4 | 354.2 | 371.5 | 384.3 | 96.4 | 199.7 | 218.4 | 230.4 | 235.4 | 238.6 | 131.3 | 137.6 | 141.1 | 142.5 | 143.4 | 73.4 | 74.4 | 74.7 | 74.8 | 74.9 | |||
| 17351 | 142.0 | 230.9 | 273.7 | 316.4 | 342.1 | 363.7 | 79.9 | 150.2 | 172.4 | 187.7 | 194.3 | 198.6 | 44.1 | 96.9 | 102.4 | 105.3 | 106.2 | 106.7 | 52.6 | 53.4 | 53.6 | 53.6 | 53.7 | ||
| 17802 | 42.6 | 113.4 | 156.4 | 199.8 | 224.6 | 243.7 | 31.4 | 81.4 | 99.4 | 114.8 | 122.5 | 127.9 | 56.2 | 63.8 | 67.8 | 69.0 | 69.5 | 32.7 | 34.4 | 34.8 | 34.9 | 34.9 | |||
| 17837 | 66.6 | 113.9 | 136.9 | 158.7 | 170.8 | 180.4 | 48.1 | 76.9 | 90.7 | 103.8 | 111.0 | 116.5 | 34.0 | 52.5 | 58.8 | 63.3 | 65.1 | 66.1 | 29.9 | 32.3 | 33.2 | 33.4 | 33.5 | ||
| 17840 | 69.7 | 136.4 | 170.9 | 207.8 | 231.4 | 252.2 | 38.6 | 94.3 | 113.4 | 130.4 | 139.6 | 146.7 | 66.6 | 75.4 | 81.3 | 83.7 | 85.2 | 40.2 | 42.3 | 43.2 | 43.5 | 43.6 | |||
| 17906 | 42.7 | 96.5 | 125.2 | 151.9 | 165.9 | 176.4 | 32.0 | 66.1 | 78.4 | 88.1 | 92.7 | 95.9 | 22.1 | 45.9 | 49.7 | 51.5 | 52.1 | 52.4 | 25.6 | 26.3 | 26.4 | 26.5 | 26.5 | ||
| 17934 | 146.1 | 242.9 | 294.1 | 348.3 | 382.5 | 412.4 | 98.4 | 154.5 | 178.1 | 199.0 | 209.8 | 217.5 | 98.9 | 107.6 | 113.7 | 115.7 | 116.6 | ||||||||
| 17936 | 150.8 | 296.0 | 374.1 | 452.4 | 498.3 | 535.5 | 105.8 | 204.3 | 228.8 | 246.5 | 254.7 | 260.4 | 129.6 | 136.4 | 140.0 | 141.2 | 141.9 | 70.5 | 71.3 | 71.5 | 71.5 | 71.6 | |||
| 17981 | 149.7 | 270.4 | 325.1 | 377.9 | 408.8 | 434.0 | 80.4 | 179.0 | 201.9 | 218.4 | 226.0 | 231.2 | 80.4 | 179.0 | 201.9 | 218.4 | 226.0 | 231.2 | 62.3 | 62.9 | 63.1 | 63.1 | 63.1 | ||
| D18M003 | 57.9 | 109.1 | 134.8 | 159.3 | 173.0 | 183.9 | 45.7 | 72.1 | 80.9 | 87.7 | 90.8 | 93.0 | 31.0 | 45.3 | 47.6 | 48.6 | 48.9 | 49.1 | 24.3 | 24.5 | 24.6 | 24.6 | 24.6 | ||
| D18M004 | 129.2 | 208.8 | 254.0 | 305.7 | 340.6 | 372.8 | 89.4 | 141.5 | 161.9 | 180.1 | 189.7 | 196.8 | 58.9 | 95.0 | 100.8 | 104.3 | 105.7 | 106.5 | 52.2 | 53.4 | 53.8 | 53.9 | 54.0 | ||
| D18M011 | 43.0 | 85.6 | 108.3 | 130.9 | 143.9 | 154.3 | 31.2 | 60.7 | 69.8 | 76.9 | 80.3 | 82.8 | 16.7 | 39.6 | 42.8 | 44.4 | 44.8 | 45.0 | 22.1 | 22.5 | 22.6 | 22.6 | 22.6 | ||
| D18M012 | 152.6 | 247.5 | 312.4 | 396.4 | 459.6 | 521.3 | 70.3 | 165.4 | 216.2 | 264.3 | 288.9 | 305.6 | |||||||||||||
| D18M013 | 146.7 | 234.8 | 276.7 | 317.9 | 342.2 | 362.1 | 96.9 | 150.2 | 166.8 | 179.4 | 185.3 | 189.5 | 61.2 | 94.0 | 98.8 | 101.1 | 101.8 | 102.2 | 50.3 | 51.1 | 51.3 | 51.3 | 51.3 | ||
| D18M018 | 149.2 | 286.5 | 350.0 | 411.9 | 448.4 | 478.1 | 72.7 | 189.1 | 220.0 | 242.3 | 252.3 | 259.1 | |||||||||||||
| D18M019 | 109.9 | 270.7 | 356.5 | 451.3 | 512.8 | 567.9 | |||||||||||||||||||
© 2019 by the authors. Licensee MDPI, Basel, Switzerland. This article is an open access article distributed under the terms and conditions of the Creative Commons Attribution (CC BY) license (http://creativecommons.org/licenses/by/4.0/).
Share and Cite
MDPI and ACS Style
Cavus, Y.; Aksoy, H. Spatial Drought Characterization for Seyhan River Basin in the Mediterranean Region of Turkey. Water 2019, 11, 1331. https://doi.org/10.3390/w11071331
AMA Style
Cavus Y, Aksoy H. Spatial Drought Characterization for Seyhan River Basin in the Mediterranean Region of Turkey. Water. 2019; 11(7):1331. https://doi.org/10.3390/w11071331
Chicago/Turabian StyleCavus, Yonca, and Hafzullah Aksoy. 2019. "Spatial Drought Characterization for Seyhan River Basin in the Mediterranean Region of Turkey" Water 11, no. 7: 1331. https://doi.org/10.3390/w11071331
Note that from the first issue of 2016, this journal uses article numbers instead of page numbers. See further details here.