Article

The Capacity of the Hydrological Modeling for Water Resource Assessment under the Changing Environment in Semi-Arid River Basins in China

1
Institute of Hydrology and Water Resources, Hohai University, Nanjing 210098, China
2
Research Center for Climate Change, Ministry of Water Resources, Nanjing 210029, China
3
State Key Laboratory of Hydrology-Water Resources and Hydraulic Engineering, Nanjing Hydraulic Research Institute, Nanjing 210029, China
4
International Water Management Institute-IWMI, Head of MENA Region, 3000 Cairo, Egypt
5
Hydrology Bureau, Yellow River Conservancy Commission, Ministry of Water Resources, Zhengzhou 450003, China
6
School of Resources and Environment, University of Electronic Science and Technology of China, Chengdu 611731, China
*
Authors to whom correspondence should be addressed.
Water 2019, 11(7), 1328; https://doi.org/10.3390/w11071328
Submission received: 6 May 2019 / Revised: 20 June 2019 / Accepted: 24 June 2019 / Published: 27 June 2019
(This article belongs to the Special Issue Hydrological Processes under Environmental Change)

Abstract

:
Conducting water resource assessment and forecasting at a basin scale requires effective and accurate simulation of the hydrological process. However, intensive, complex human activities and environmental changes are constraining and challenging the hydrological modeling development and application by complicating the hydrological cycle within its local contexts. Six sub-catchments of the Yellow River basin, the second-largest river in China, situated in a semi-arid climate zone, have been selected for this study, considering hydrological processes under a natural period (before 1970) and under intensive human disturbance (2000–2013). The study aims to assess the capacity and performance of the hydrological models in simulating the discharge under a changing environment. Four well-documented and applied hydrological models, i.e., the Xin’anjiang (XAJ) model, GR4J model, SIMHYD model, and RCCC-WBM (Water Balance Model developed by Research Center for Climate Change) model, were selected for this assessment. The results show that (1) the annual areal temperature of all sub-catchments presented a significant rising trend, and annual precipitation exhibited insignificant decline trend; (2) as a result of climate change and intensive human activities, the annual runoff series showed a declining trend with abrupt changes mostly occurring in the 1980s with the exception of the Tangnaihai station; (3) the four hydrological models generally performed well for runoff simulation for all sub-catchments under the natural period. In terms of Nash–Sutcliffe efficiency coefficient, the XAJ model worked better in comparison to other hydrological models due to its detailed representations and complicated mechanism in runoff generation and flow-routing scheme; (4) environmental changes have impacted the performance of the four hydrological models under all sub-catchments, in particularly the Pianguan River catchment, which is could be attributed to the various human activities that in turn represent more complexity for the regional hydrological cycle to some extent, and reduce the ability to predict the runoff series; (5) the RCCC-WBM model, well known for its simple structure and principles, is considered to be acceptable for runoff simulation for both natural and human disturbance periods, and is recommended for water resource assessment under changing environments for semi-arid regions.

1. Introduction

Hydrological models are essential for river flow forecasting, regional water resource assessment, and climate change impact analysis, owing to their consistent simulation capacity of hydrological series [1,2]. However, with rapid socio-economic development, most areas or river basins have been highly regulated with intensive human activities, such as large-scale soil and water conservation measures in arid or semi-arid climatic zones, water conservancy projects (e.g., reservoirs, water intake projects, etc.), and urbanization, etc. These human activities can influence or change the regional hydrological cycle and, more importantly, change the natural relationship between rainfall and runoff [3]. Society and hydrology have been main themes of “Panta Rhei—Everything Flows” and the new Scientific Decade 2013–2022 of IAHS (International Association of Hydrological Sciences) [4], and hydrological modeling under a changing environment has been an international leading scientific topic of the current WMO-IHP (International Hydrological Programme of World Meteorological Organization) [5].
The consistency of the hydrological series was usually changed due to large-scale human activities [6,7,8,9,10]. Numerous statistical methods, e.g., rank-sum test [11], Mann–Kendall rank correlation test [12], rescaled-range (R/S) analysis [13], Brown–Forsythe test [14] and Bayesian methods [15] have widely been applied around the world to detect the characteristics and variation features of the hydrological series. Guan et al. [16] analyzed the characteristics and applicability of different statistical methods for testing the consistency of hydrological series and indicated that the Mann–Kendall test method is optimal due to its clear principle and intuitive result. Hou et al. [17] analyzed the evolution of runoff time series by using the Kendall rank correlation coefficient, R/S analysis, and precipitation-runoff double cumulative curve method in the Weihe River (an important tributary of the Yellow River), and found that the human activities in the late 1980s led to an abrupt drop in the annual runoff series, which is consistent with the conclusion drew by Guan et al. [18].
In general, the hydrological models have been considered a powerful tool for revealing hydrological cycle mechanisms, flow forecasting, and regional water resource assessment at basin level [19]. Most of the recent work on hydrological models and their applications focus on model improvement and parameterization [20], runoff change attribution [21,22,23], flood forecasting, etc. Hydrological models could provide a technical theoretical basis for water resource management and river basin management based on an understanding of the impact of human activities and runoff sensitivity analysis [24,25,26,27,28,29]. For a human-regulated river basin, models were usually applied in two stages separately, as a non-interference period and human interference period [23]. Xu and Cheng [30] reviewed the application prospects of the distributed hydrological model and pointed out that the distributed hydrological models have shown their advantages in hydrologic process knowledge in the upward (bottom-up) approach to predict overall catchment response. However, distributed hydrological models are confronting some other problems in the application due to the amount of data that are required. Meanwhile, the error and uncertainty in multiple input data and many parameters often would enlarge and propagate uncertainty in simulations, and the accumulated error induced by many uncertainties can also not be ignored. The downward approach attempts to build a conceptual or lumped model directly at the level of interest to capture the whole system behavior [31]. Guo and Ma [32] applied the conceptual SIMHYD model to catchments in Australia and the Yellow River basin and found that this model is acceptable for monthly runoff prediction. Wang, et al. [20] established a monthly scale water balance model and successfully applied to many catchments in different climatic zones. The previous studies on model applications mainly focus on simulation of discharge series under natural period [33,34]. However, due to intensive human activities, it is very difficult to find a consistent runoff series with a long-time span, particularly during dry years [35]. Zhang, et al., [36] analyzed the possible drivers of runoff reduction in the Middle of the Yellow River and found that the annual runoff from 1980–2000 at Huayuankou station decreased by more than 30% in relation to the previous period of time, and that human activities, such as land cover change, water conservation projects, etc., which played a dominant role in runoff decrease, accounted for about 62% of the total reduction.
The mechanism of runoff yield in arid areas is quite a complex process and hydrological modeling is therefore a challenge in hydrological sciences [37,38]. Numerous studies have indicated that almost all hydrological models perform well for humid catchments; only a few models could acceptably simulate the hydrological process for arid catchments [39,40]. In addition, human activities alter the relationship between rainfall and runoff by changing land use and water consumption styles, and thus add more complexity to the hydrological processes in runoff generation in arid catchments [41]. Therefore, it is necessary to study hydrological modeling for river basins in dry regions under a changing environment, to strongly support flood control and water resource management decisions for complex dry river basins.
The Yellow River is an important water source in north China, with 15% arable land and 12% of the population in China, and represents only 2.6% of China’s national water resources. Being highly influenced by the Asia Monsoon climate, the Yellow River basin is currently affected by a decline of water resource, due to the decrease of precipitation and intensive evapotranspiration. With rapid development of agriculture and industry and population growth, water resources in the Yellow River basin have been under extremely increasing pressure. Sustainable water resource use of the Yellow River urgently needs effective flow forecasting based on strong hydrological modeling that could represent the runoff series in terms of environmental changes.
The main objectives of this paper are as follows: (1) to understand climate change in the study areas and variation of observed runoff as a result of environment changes; (2) to test the performance of four hydrological models that are selected for this study and find the most suitable to support hydrological forecasting; (3) to investigate the impact of environment change on hydrological modeling.

2. Data Source and Methods

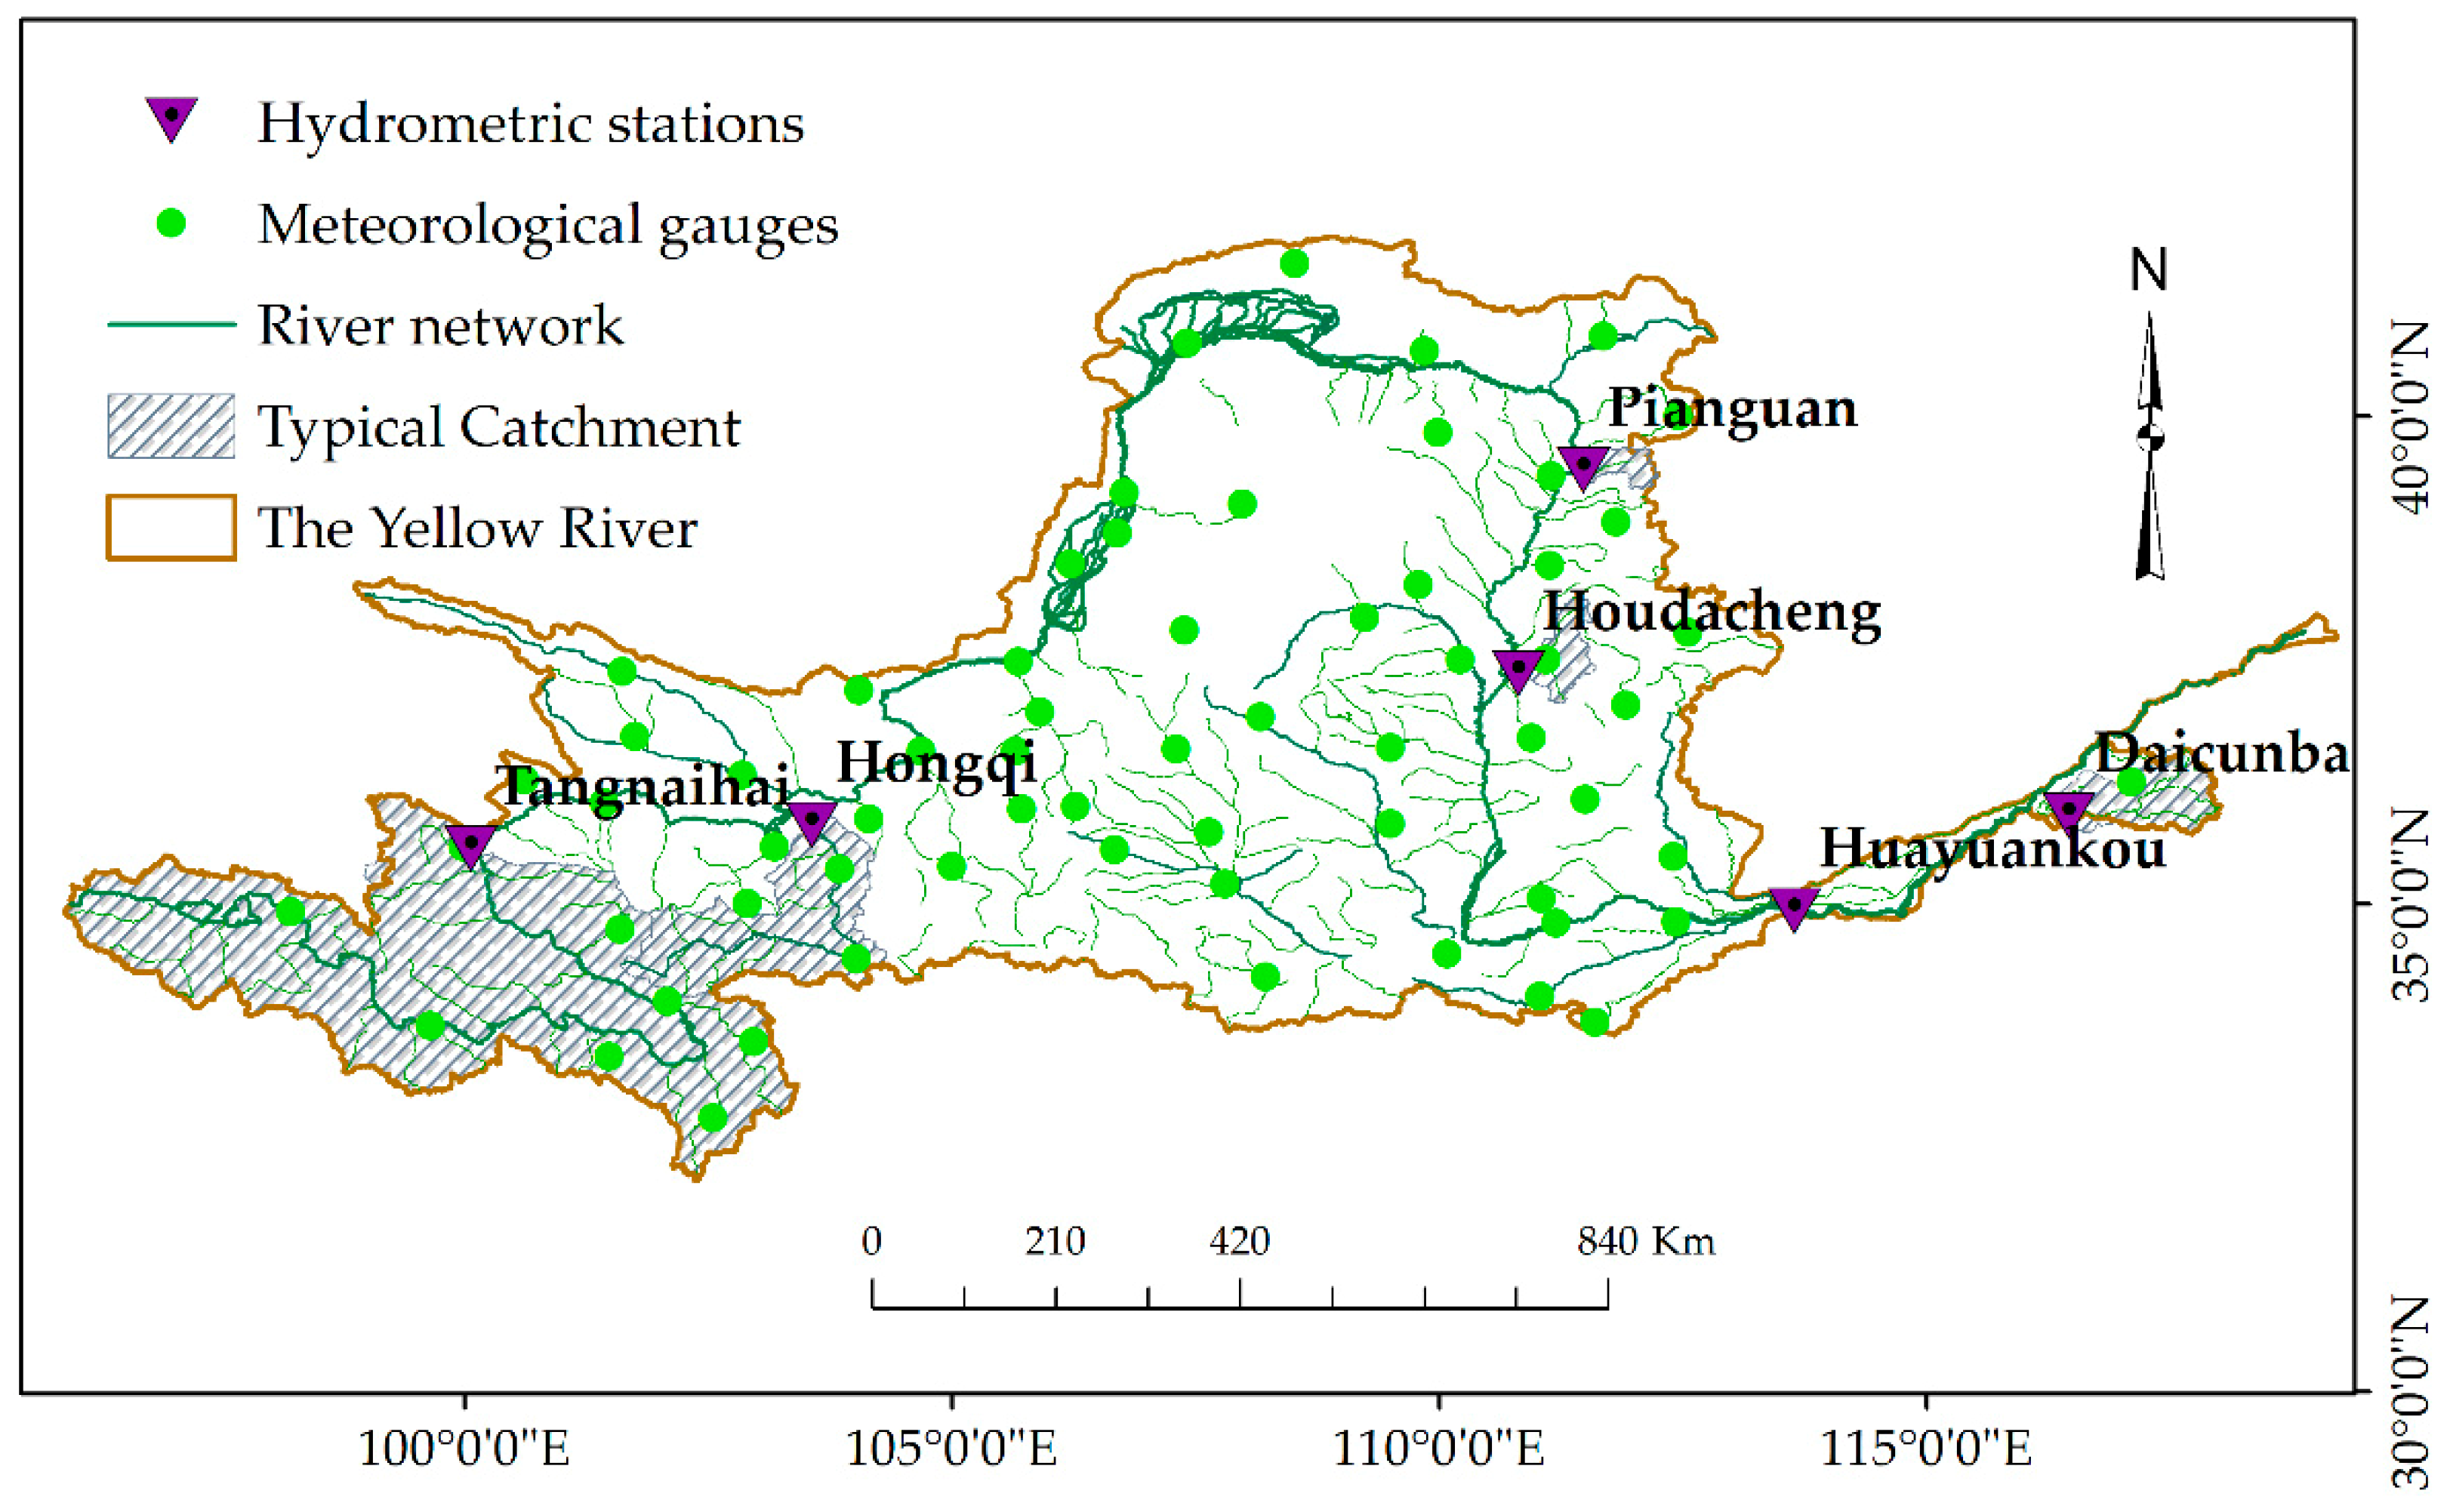
2.1. Study Areas and Data Sources

The Yellow River is the second-largest river basin in China, with a drainage area of about 752,443 km2 and total length of 5464 km in China. Due to the significant Asian Monson influence, the climate in the Yellow River basin could be characterized as hot and wet in summer, and cold and dry in winter. The annual precipitation over the basin is about 480mm with uneven distribution in time and space. Precipitation tends to decrease from southeast to northwest. More than 70% of the precipitation comes during flood season, from July to September. The total water amount of the Yellow River basin is only about 2.6% of China’s national water availability, with which it supports more than 13% of China’s farmland, food production, and about 25% of China’s coal and oil production.
Due to dry climate conditions and heavy rainfall in wet season, the ecological system in the Yellow River is very vulnerable [42]. The basin has been experiencing intensive human activities aimed at improving the local environment since the 1970s with large-scale soil and water conservation measures [43]. As a result, the observed runoff has dramatically decreased, particularly for tributaries on the Loess Plateau in the middle reaches. Some tributaries even have zero values of river discharge during the dry season [44]. To investigate the influence of environmental change on the hydrological modeling, six hydrometric stations were selected, among which two stations are on the main stream of the Yellow River, and the other four stations are on tributaries. Hydrological data were collected from the Hydrological Yearbook issued by the Ministry of Water Resources, China. Within or near to the Yellow River basin, there are 65 meteorological stations with available data. Daily precipitation, daily average, and maximum and minimum air temperature over 1951–2013 were collected from the Chinese Meteorology Administration (CMA, http://cdc.cma.gov.cn) to drive the hydrological models in this study. River system and the locations of the 4 tributary catchments and two key main stream hydrometric stations are shown in Figure 1, and Table 1 provides information and data regarding the stations and tributary catchments.
The Upper Yellow River gauged by the Tangnaihai station located on the Tibetan Plateau, Gelic Leptosols, is the predominant soil type, which covers 60.1% of the catchment. The Tao River is in the transitional area from the Loess Plateau to the Tibetan Plateau; the catchment is covered with sparse grass. The Pianguan River and the Sanchuan River both are loess hilly catchments on the Loess Plateau, in which silt and sandy loam are the main soil texture of the catchments. The Dawen River is in the lower reaches of the Yellow River; the catchment is geographically characterized as a rocky and hilly watershed, in which sandy clay loam is the predominant soil texture. Permafrost change induced by global warming has changed regional hydrology for the Upper Yellow River basin, while the other river catchments have been highly regulated by intensive human activities for the purposes of soil and water conservation and agricultural development.
Table 1 shows that the selected six catchments have a wide range of drainage area and hydro-climate characteristics. The drainage area spans from 1896 km2 (Pianguan River) to 730,036 km2 (Yellow River gauged at Huayuankou station). Precipitation varies from 425 mm to 870 mm and temperature changes from −4.9 °C in the Upper Yellow River to 13.9 °C in the Dawen River located in the lower reaches.

2.2. Mann–Kendall Rank Test

The Mann–Kendall rank test is a non-parametric, distribution-free method to detect trends of time series with minimal assumptions [45]. The method has been widely applied to test trends in hydrological and meteorological series all over the world. The Mann–Kendall rank trend test statistic index U (so-called M–K value) follows the standard normal distribution. A positive value of U represents an upward trend, while a negative one indicates a downward trend. The statistic U is under the null hypothesis of no trend when the number of series increases. The null hypothesis is rejected at the significance level of α , if | U | U α / 2 , U α / 2 is the critical value of the standard normal distribution with a probability exceeding α / 2 .
If | U | < U α / 2 , the null hypothesis is accepted, and the trend was not significant. For a significance level of α = 5 % , then U α / 2 = 1.96 .

2.3. Average-Difference T-Test

The average-difference T-test is one of many statistically based approaches available in the literature to diagnose an abrupt change in time series [46,47].
If the variance is the same, statistic t is defined as:
t = X 1 P X 2 P S P ( 1 / M 1 + 1 / M 2 ) 1 / 2
S P 2 = ( M 1 1 ) S 1 2 + ( M 2 1 ) S 2 2 M 2 + M 1 2
where X 1 P and S 1 are, separately, the average value and standard deviation of the data before base year, whose number is M 1 , X 2 P and S 2 are average value and standard deviation of the data after base year, the number of which is M 2 . S P 2 is the joint sample variance. Time series of t are calculated by moving the base year continuously. The statistic t follows the t-distribution with the degree of freedom that is M 1 + M 2 2 , when the statistic value t > t α is at the significance level of α or the calculated P-value is less than α , then the average values of two sequences before and after the base year share a significant difference between each other, and the base year is an abrupt change point. When a first abrupt change point is detected, the two sequences can be tested with the same procedure respectively for the second or third abrupt change point if the null hypothesis is rejected.

2.4. Hydrological Models

Considering model structure, physical interpretation, application performance, and accessibility, four conceptual hydrological models of Xin’anjiang model, SIMHYD rainfall–runoff model, GR4J model, and RCCC-WBM model are selected to conduct the study and assess their capacity in generation of runoff series in dry regions with environmental changes. The brief introduction of each model is given below:

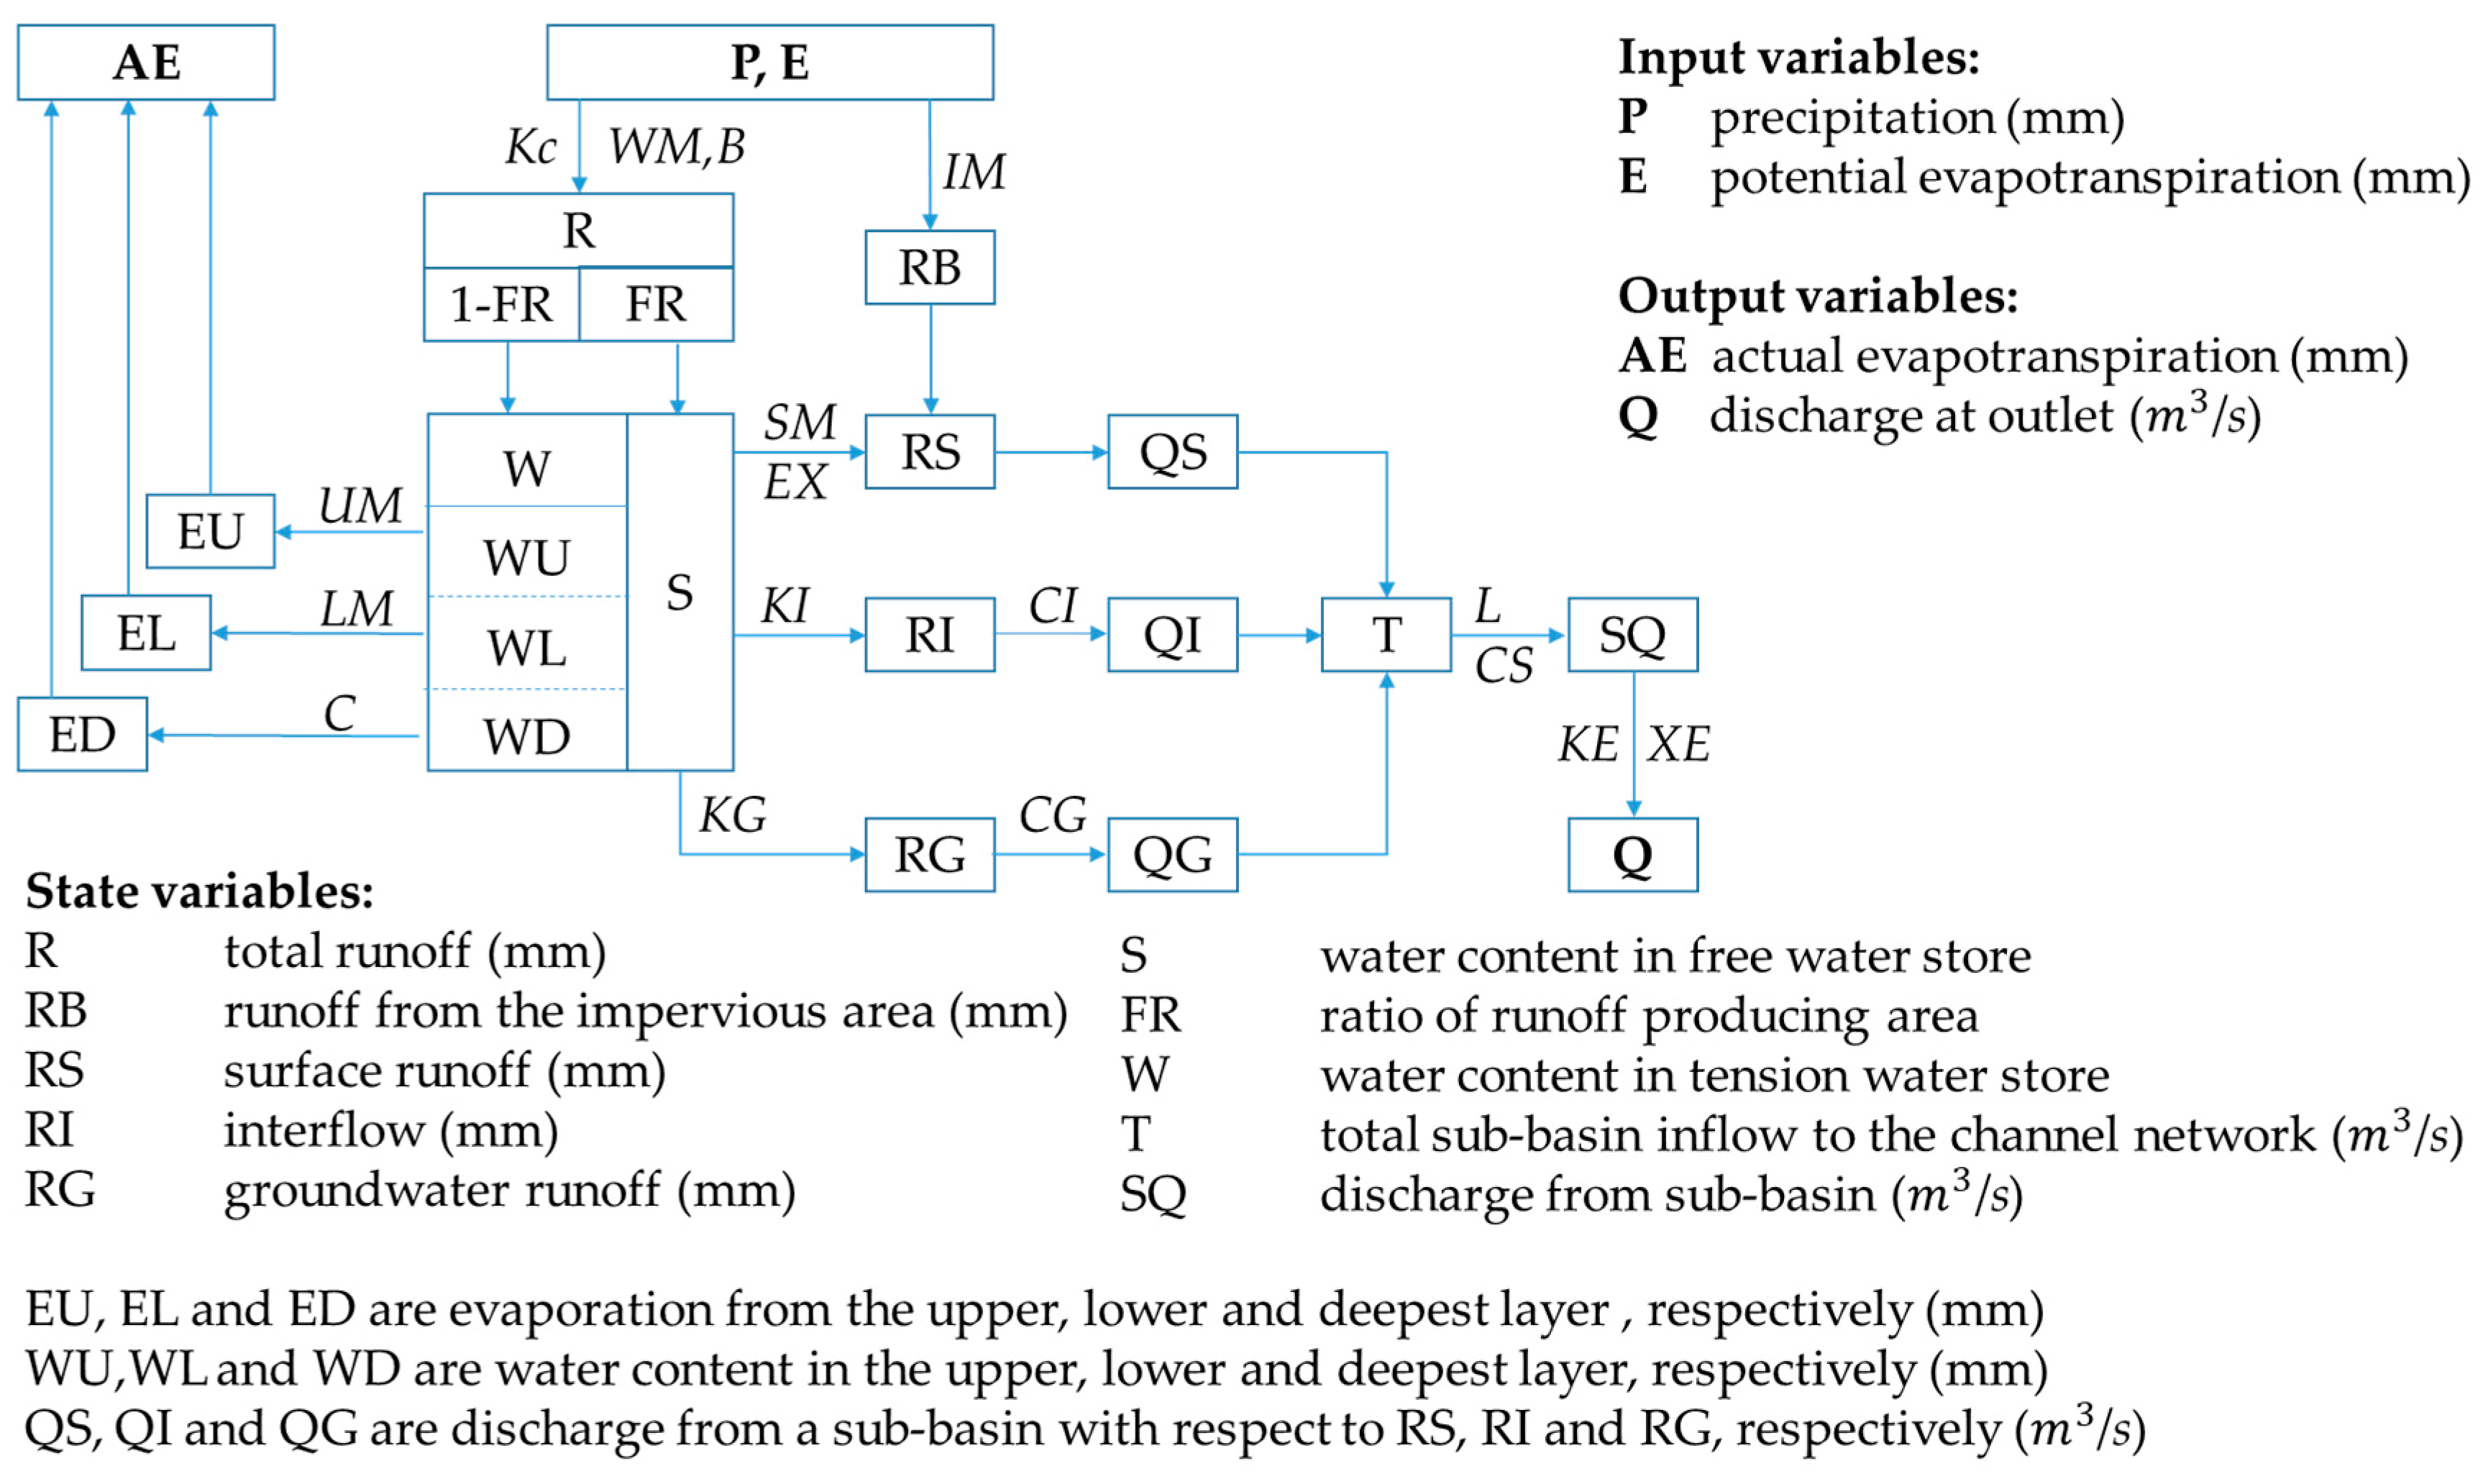
2.4.1. Xin’anjiang Model
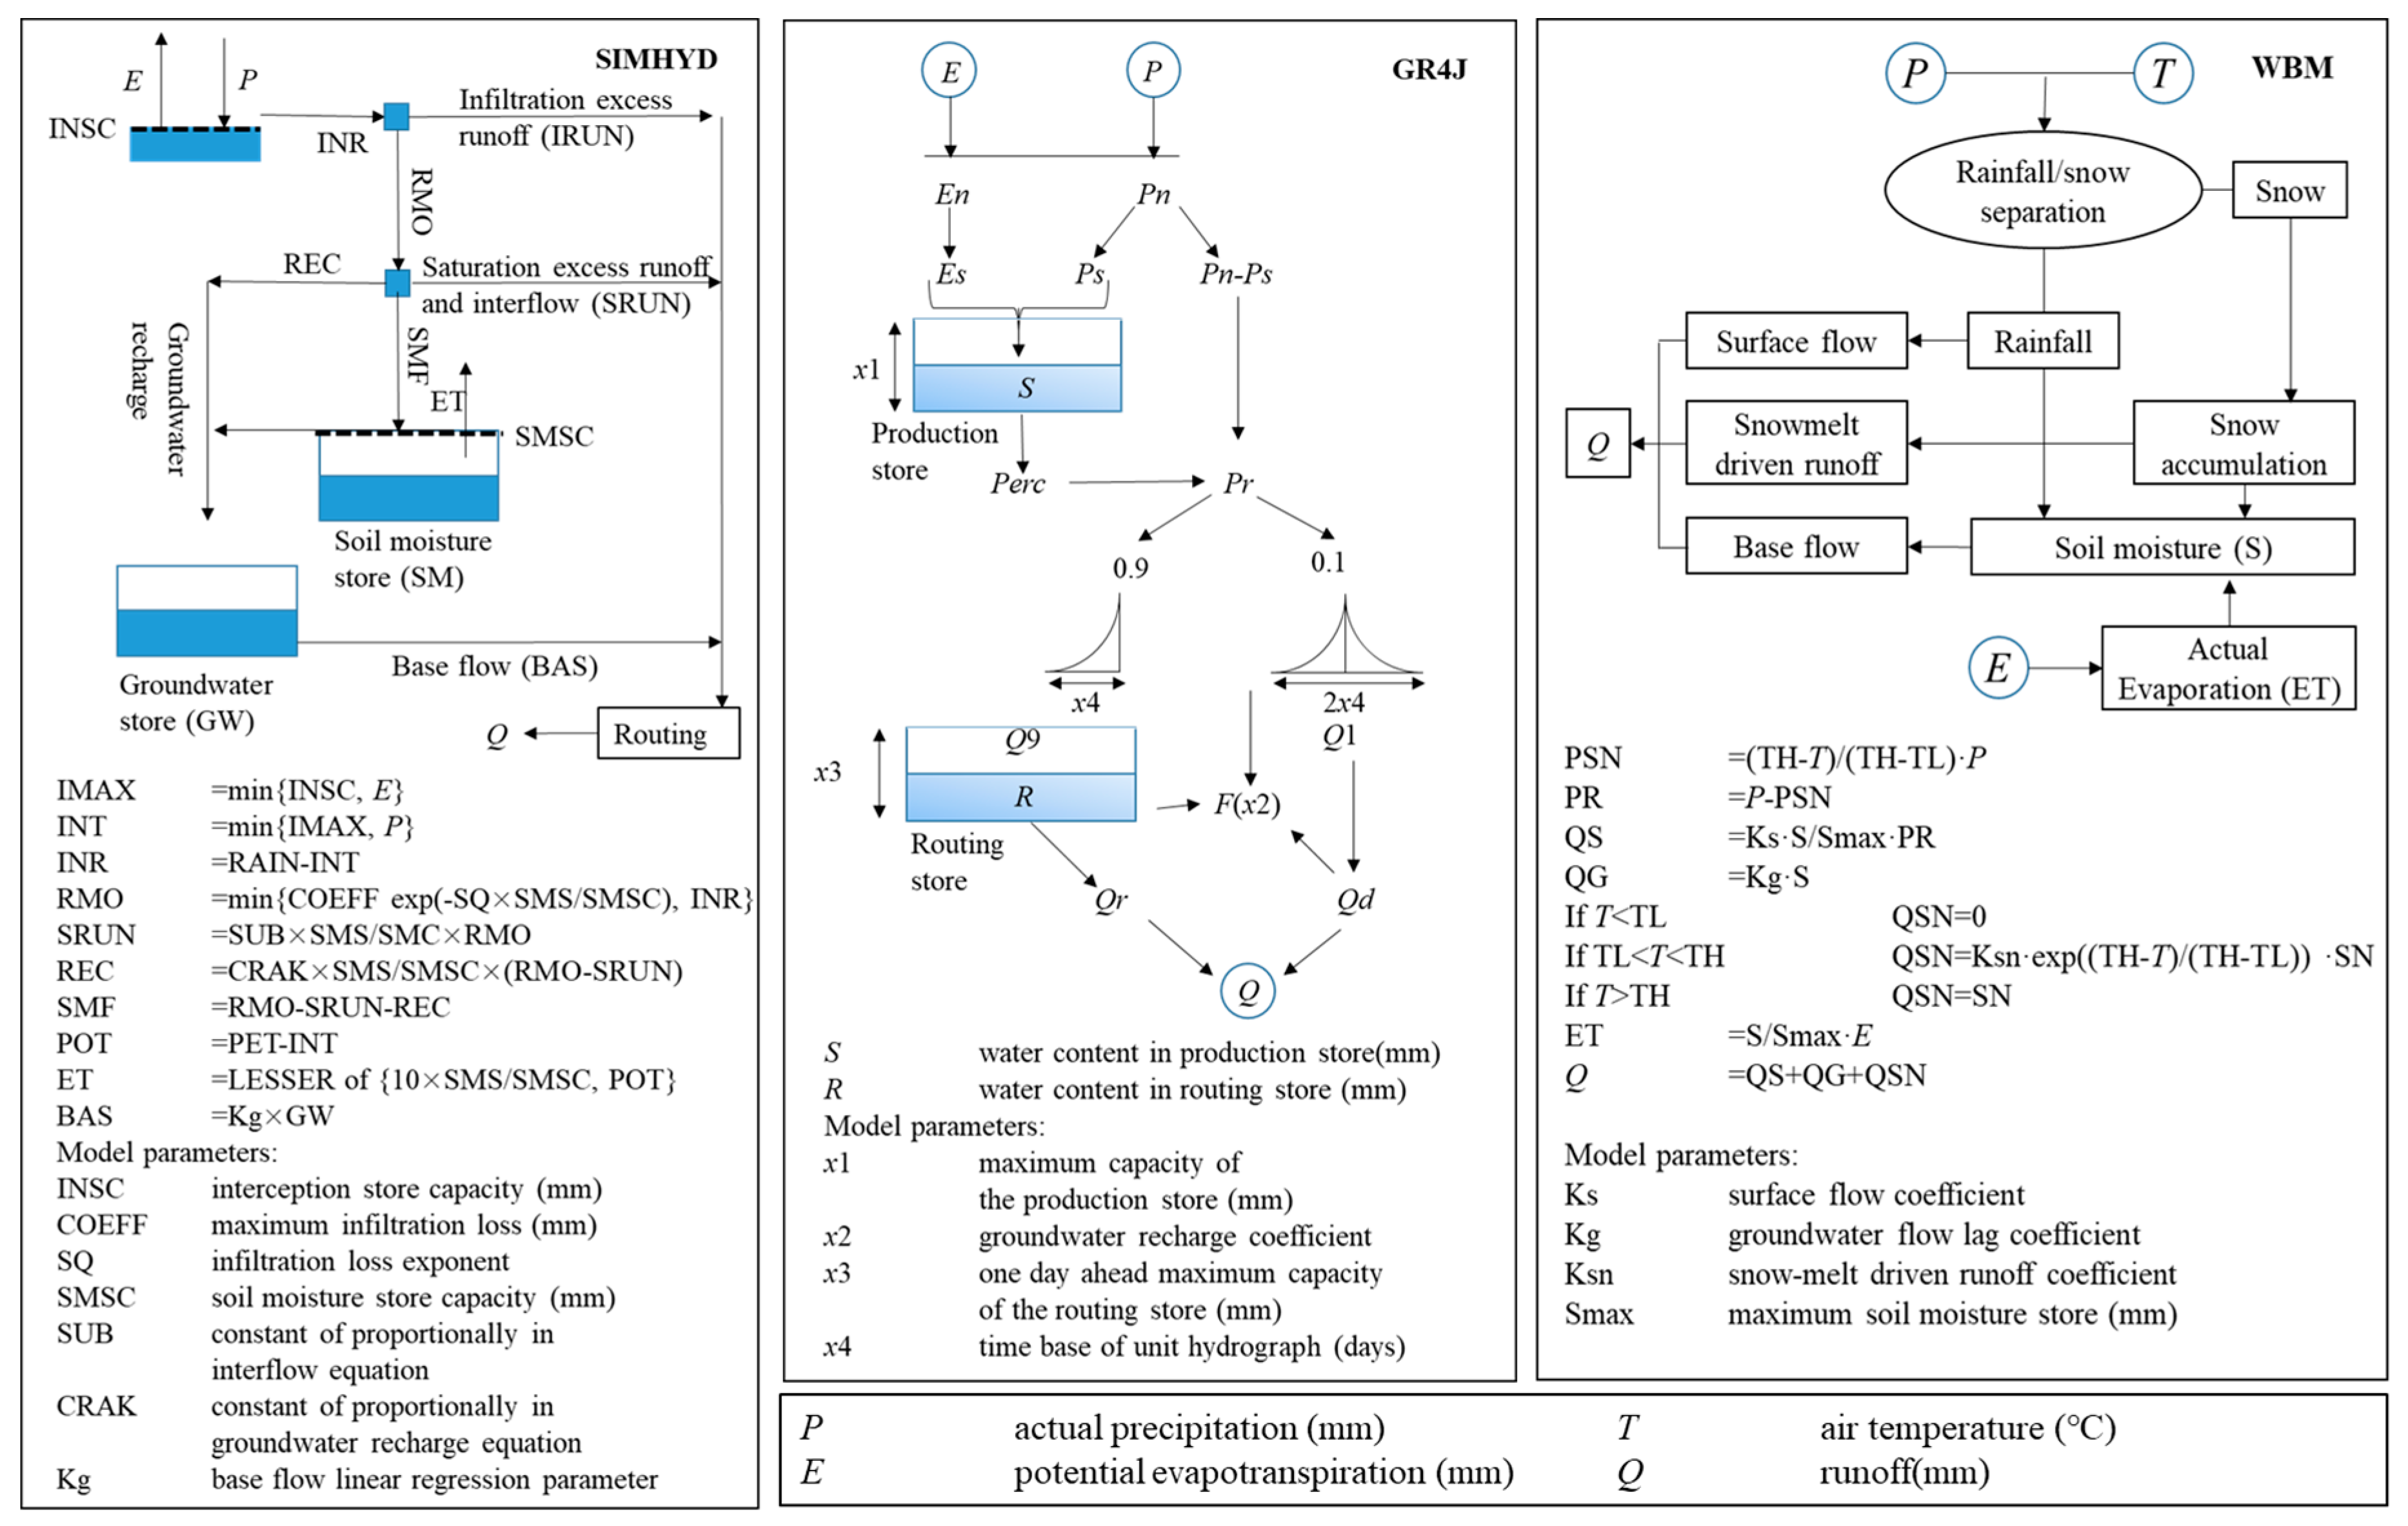
Xin’anjiang (XAJ) model is a conceptual rainfall–runoff hydrological model developed by Hohai University, which has been widely used in humid and semi-humid catchments globally [48]. The schematic diagram of the model is shown in Figure 2 and the notations and physical meanings of the model parameters (italicized in Figure 2) and state variables can be found in references [49,50] for detail. The key hypothesis of the model is that the runoff is not generated until the soil moisture content of the aeration zone reaches field capacity [51]. The model is mainly composed of four parts, namely evapotranspiration being represented by a model of three soil layers, runoff yield component which separates runoff into surface flow, interflow and ground water, and a flow-routing component. The model has 16 parameters, mainly reflecting the properties of the soil layer, such as hydraulic conductivity and moisture capacity of tension water and free water, which greatly influences the behavior of runoff yield and flow routing. Daily areal average precipitation (sum of rainfall and snowfall) and potential evapotranspiration data series are required to drive the model and calculate the discharge.

2.4.2. SIMHYD Model

The SIMHYD model is a simplified lumped rainfall–runoff model that has been applied successfully in many semi-arid or semi-humid basins located in the United States, Australia, and other countries [52,53]. Components of runoff simulated with the SIMHYD model consist of surface flow (SRUN), interflow (INF), and base flow (BAS). The first component is an infiltration excess runoff, interflow is based on a saturation excess mechanism, and base flow is simulated as a linear recession function of groundwater store (GW). Infiltration is a key component of this model and is simulated as a negative exponential function of soil wetness (SM). Model structure and mathematical formulas are shown in Figure 3.

2.4.3. GR4J Model

The GR4J model is an empirical and lumped, reservoir-based model. It was developed by the research group at CEMAGREF (now IRSTEA) [54]. It was conceived for water resource management and spring flood prediction for hydrologic applications. Initially, this model was parsimonious with only 4 parameters, with most secondary processes being represented by empirical constants, which has been widely used in Europe and Australia [55,56]. The first operation is the subtraction of E from P to determine either a net rainfall (Pn) or a net evapotranspiration capacity En. A part Ps of Pn, determined as a function of water content (S), fills the production store and Es will evaporate from the store. A percolation leakage Perc from the store is then calculated as a power function of S and added to Pn-Ps as effective rainfall Pr. Then, Pr is divided into two parts, 90% of which (Q9 in Figure 3) infiltrates into the routing store and forms the slow flow (Qr) with a unit hydrograph, while the remaining 10% of the components (Q1) forms the fast flow (Qd). Figure 3 describes the model structure and detailed calculation process and the formula can be found in reference [56].

2.4.4. RCCC-WBM Model

The RCCC-WBM (Water Balance Model, WBM) model is a simplified large-scale hydrological model with a strong physical interpretation of the runoff yield mechanism, developed by the Research Center for Climate Change, Ministry of Water Resources of China [20]. The model has the ability to estimate monthly stream flow from monthly rainfall, temperature, and potential evaporation data, where catchment evaporation is estimated with a one-layer soil evaporation formula, and monthly precipitation is divided into rainfall (PR in Figure 3) and snowfall (PSN) with preset upper and lower temperature (TH and TL) criteria by linear partitioning method to calculate surface flow (GS) and snow-melt-driven flow (QSN), while the surface flow is only proportional to soil moisture (S) and rainfall, and the snow-melt rate is an exponential function of air temperature and is proportional to snow accumulation (SN), and lastly the base flow (QG) is simulated as a linear recession function of soil moisture. The model has only four parameters and has been successfully applied in semi-arid and humid catchments located in China [2]. Compared to other hydrological models, the RCCC-WBM model has the advantages of a simpler structure, fewer parameters, and flexibility in use. The model structure and descriptions are shown in Figure 3. For more details, please refer to reference [20].

2.5. Model Calibration and Objective Functions

Firstly, the default value ranges of model parameters are estimated, then different parameter sets are selected to drive the model and calculate the objective functions which represent the quality of simulation results and is used for later parameter modification until optimum is obtained. This calibration method is partially reliant on experience and expertise. Therefore, objective functions should be well selected to evaluate the performance of hydrological models in stream flow simulation and assist model calibration. Root mean squared error (RMSE), mean absolute percentage error (MAPE), and Nash–Sutcliffe efficiency (NSE) are widely used by hydrologists to evaluate model performance in many previous studies, among which NSE is a normalized statistic [57]. Normalization facilitates the easier comparison of hydrological model performance for disparate catchments.
It is desirable to have a good fit between the observed and simulated runoff time series, but also to minimize overall bias in the simulation. Therefore, the NSE and the relative error (RE) between simulated and observed runoff were both employed as objective functions in calibrating the models [2]. Normally, a good simulation result will have NSEs approaching to 1 and REs close to 0.

3. Results and Discussion

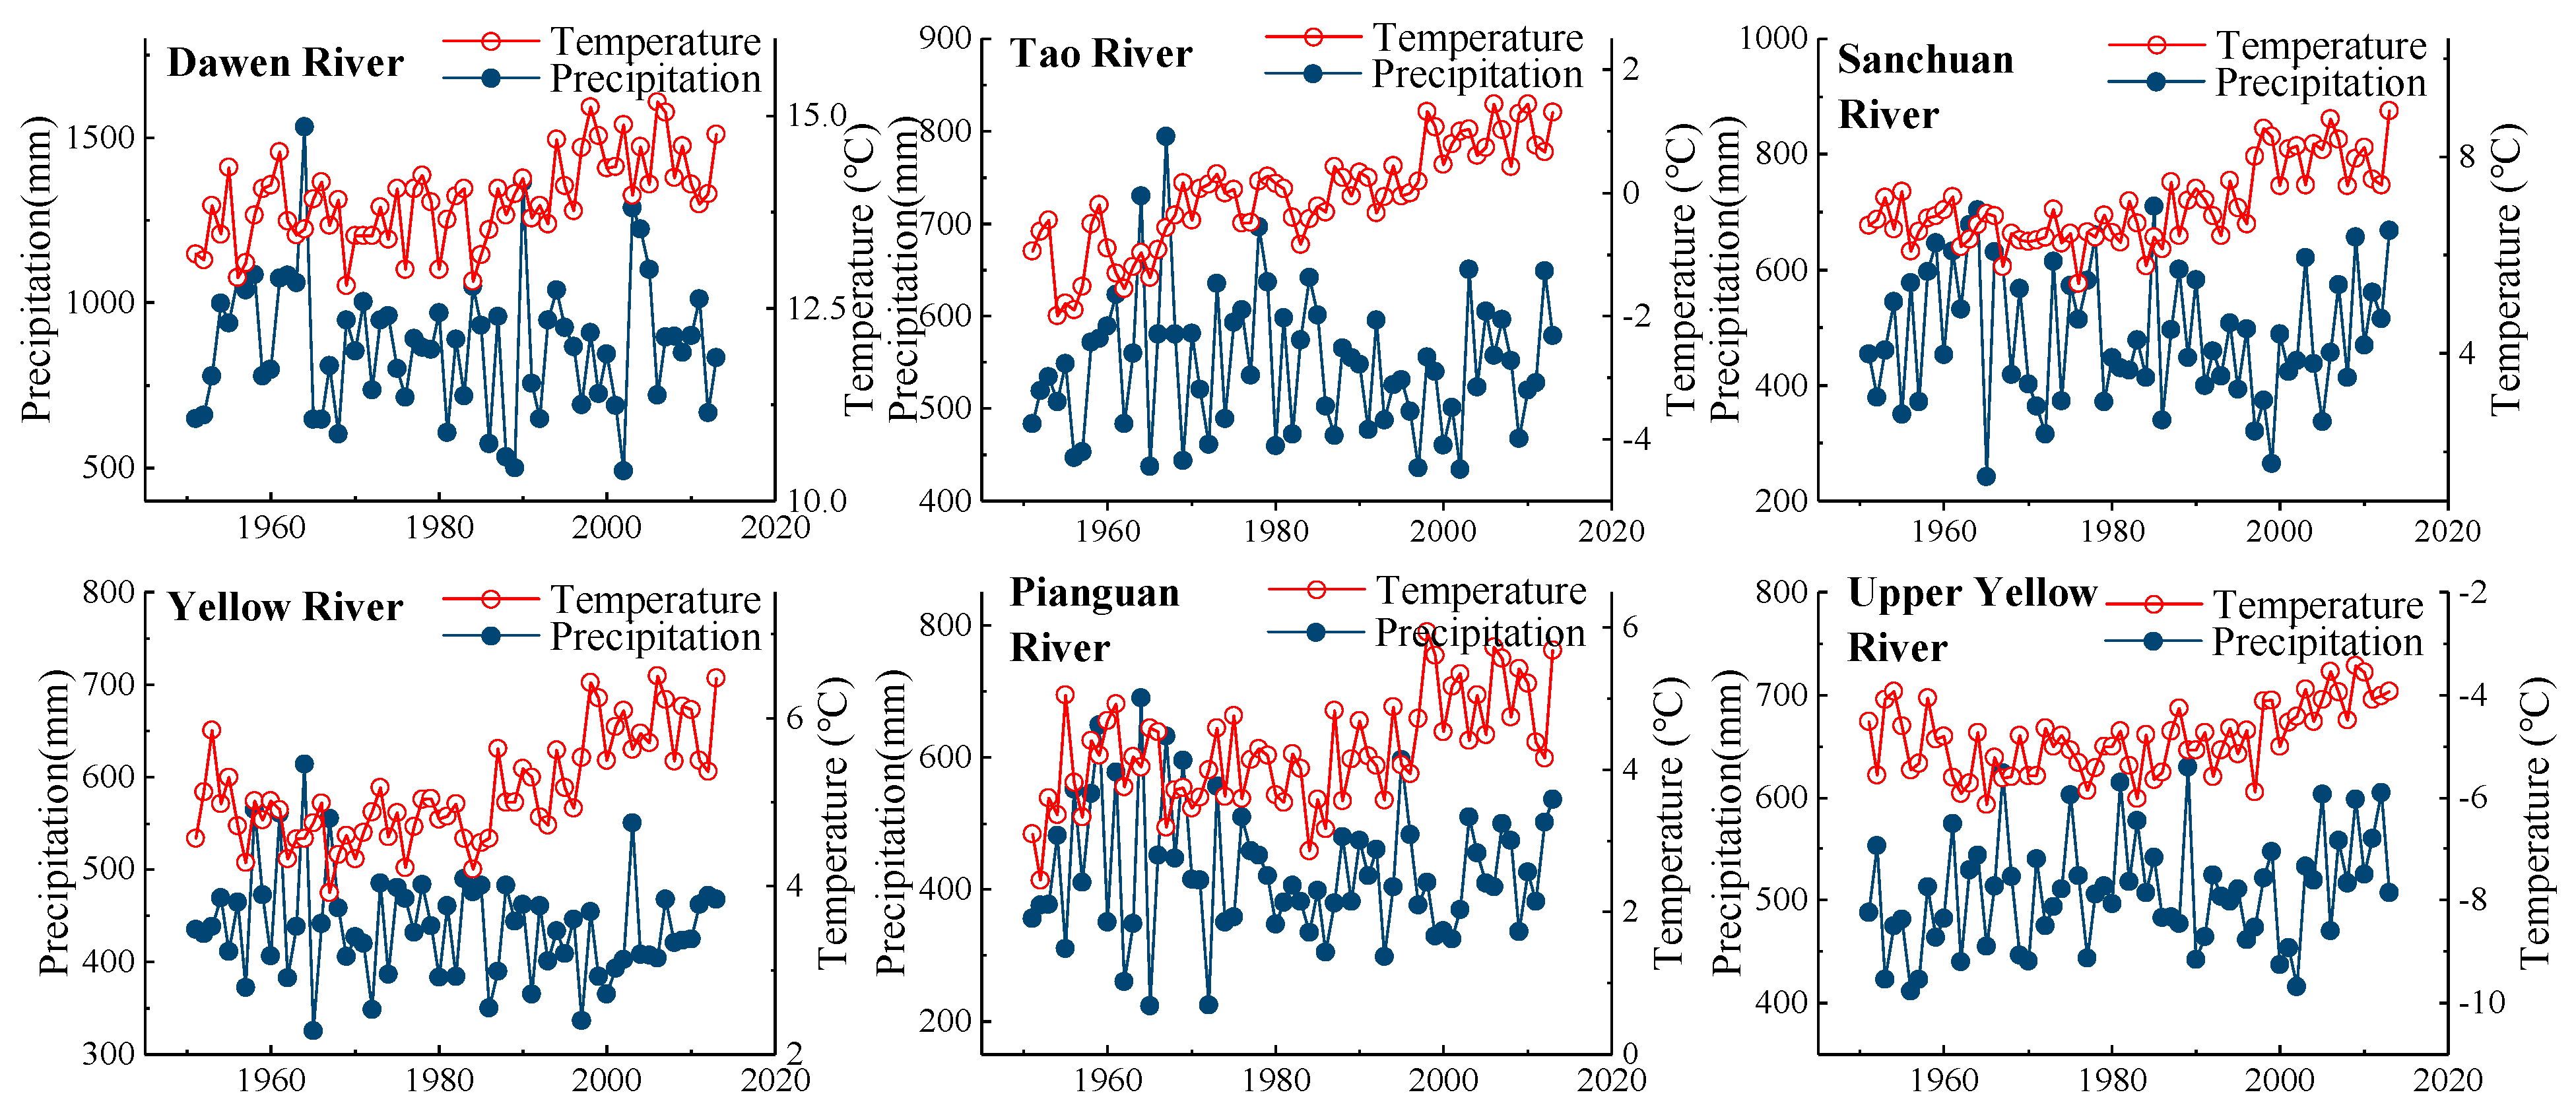
3.1. Variability and Trends of Precipitation and Temperature in 1951–2013

Precipitation and temperature are the most important meteorological elements that modulate the river regime. Long-term variations of annual areal average precipitation (calculated by arithmetic averaging method) and temperature are shown in Figure 4. Trends test of precipitation and temperature of the six catchments are summarized in Table 2, in which the slope coefficient (S) of the regression line illustrates the magnitude of the upward or downward trend of a time series. U (or M–K) value shows significance of a series trend.
Figure 4 shows that all catchments are characterized by similar increases in temperature series during the period 1951–2013. There were no significant upward or downward trends observed in the precipitation series, which fluctuate around the mean value without great abrupt change over the period. Table 2 shows that temperatures of the six catchments exhibit significant rising trends, with linear rising rate of >0.13 °C/10 year. The highest rise occurred in the Sanchuan River basin, and the Upper Yellow River basin shows the lowest rise in temperature. Insignificant variation trends were detected in the precipitation series for all six catchments. Annual precipitation series of five catchments present slight decreasing trends (from −10.3 mm/10 year to −2.3 mm/10 year) with the exception of the Upper Yellow River, which exhibits an increasing trend (7.03 mm/10 year).

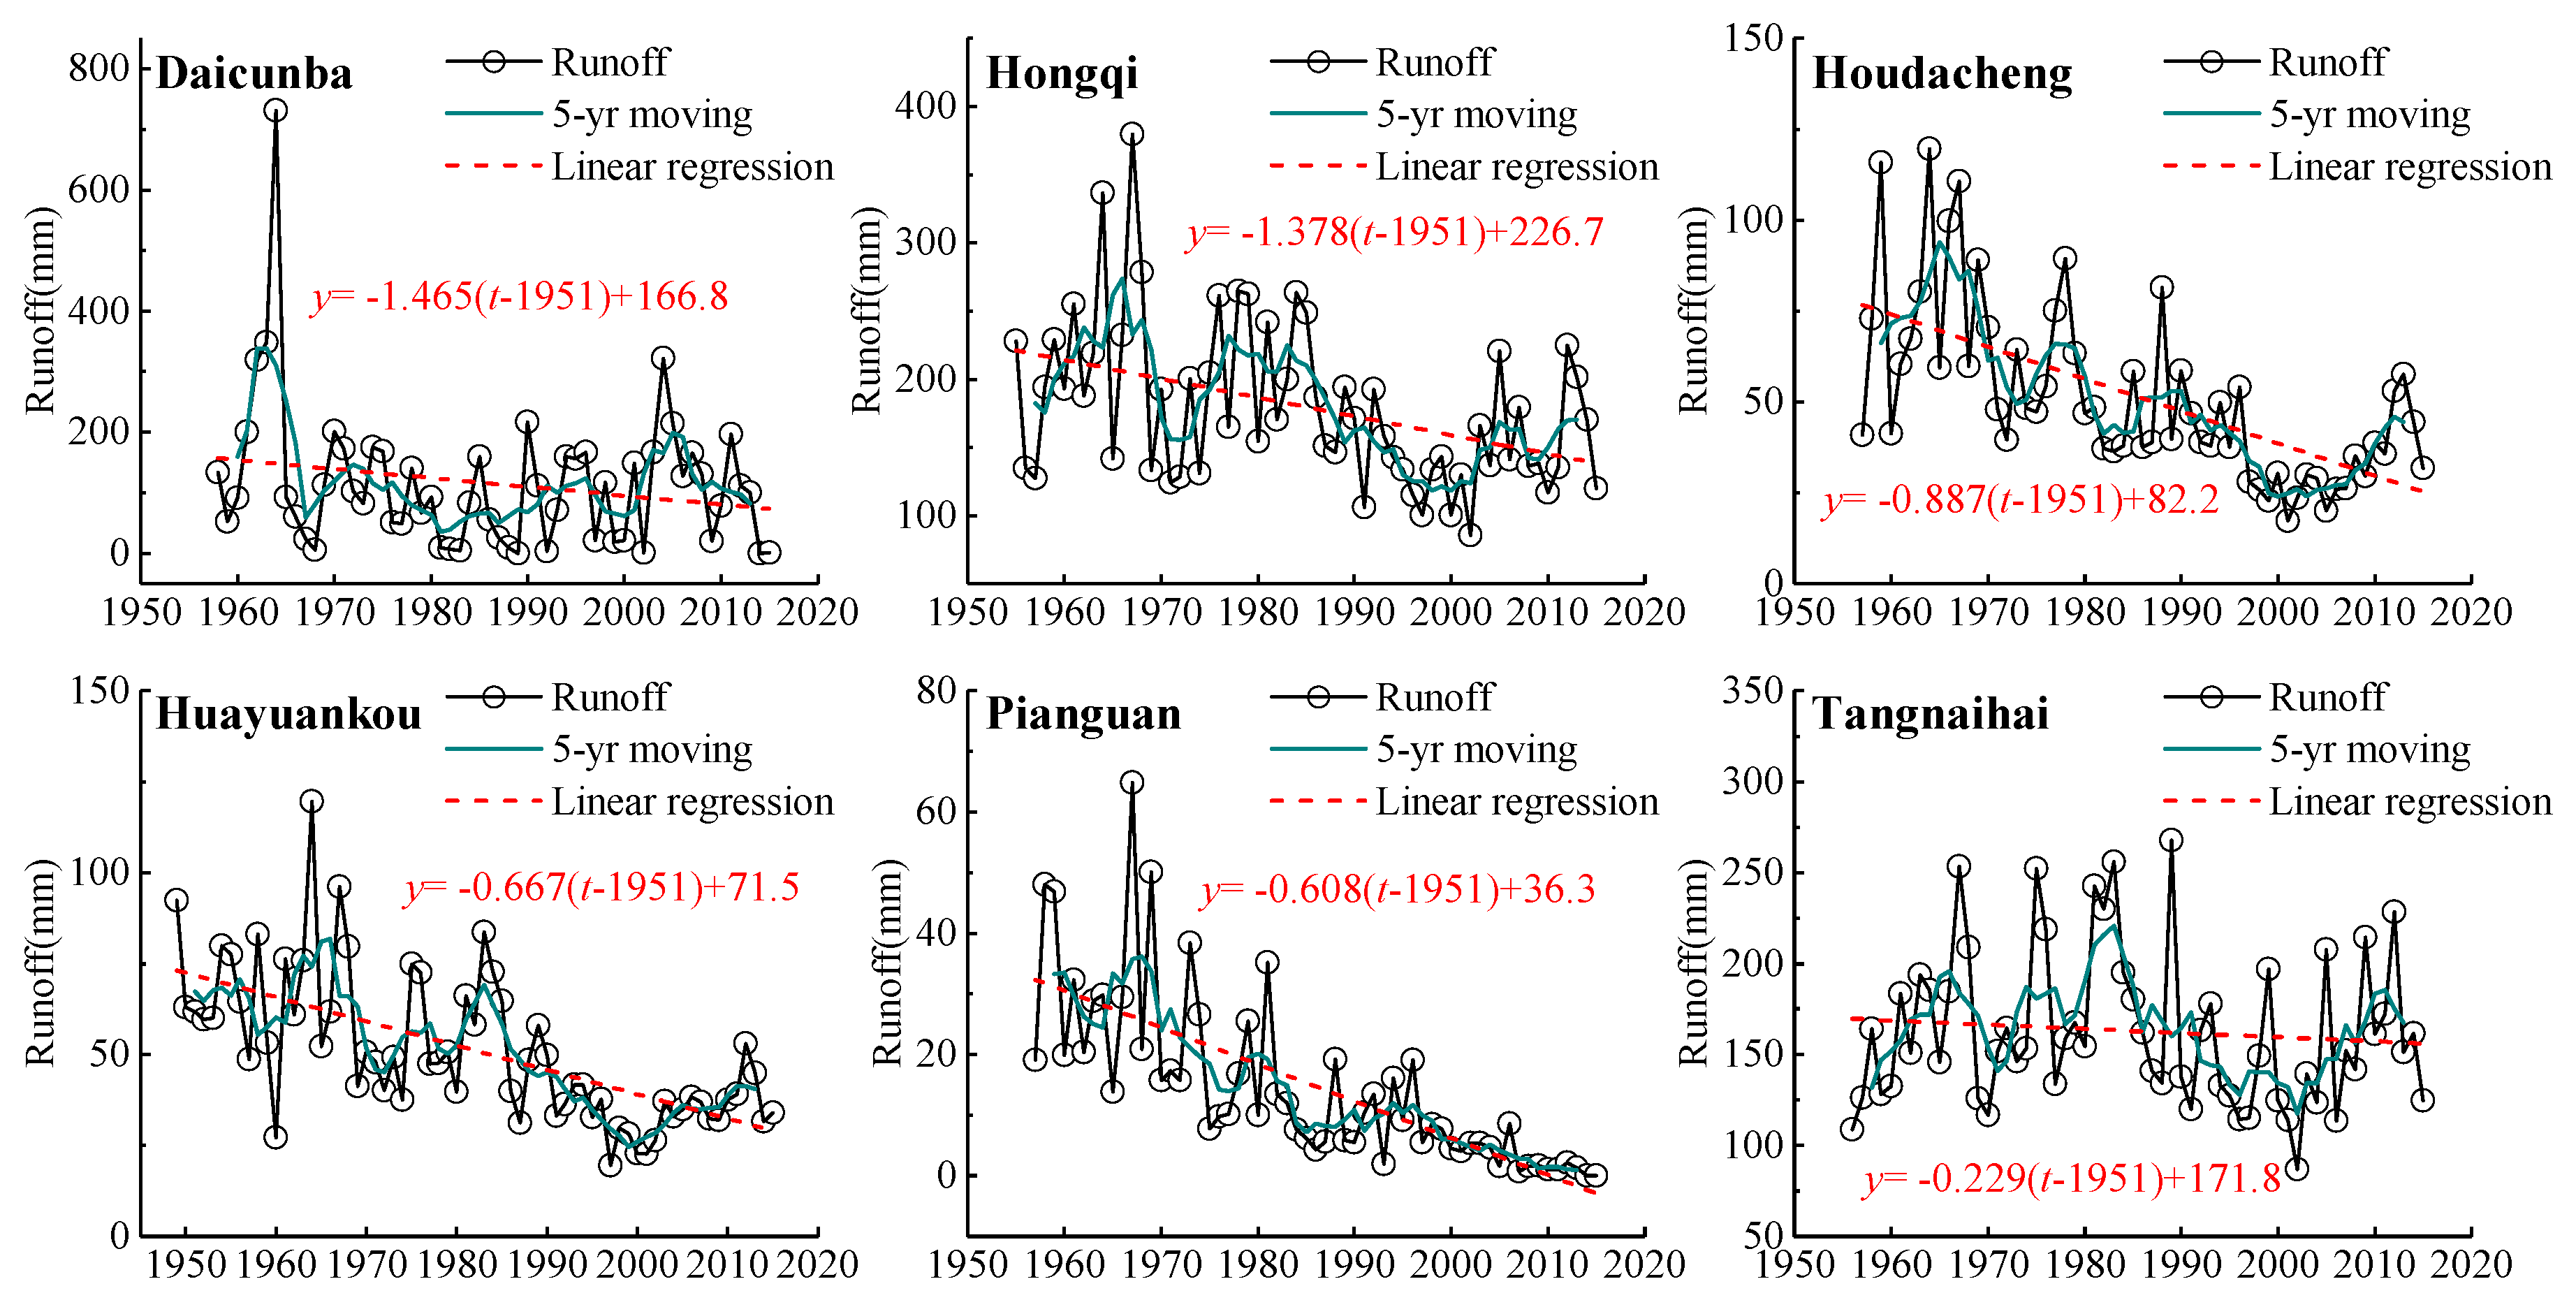
3.2. Inter-Annual Variations and Abrupt Change of Observed Runoff

Figure 5 shows the long-term variations of the observed runoff at the six hydrometric stations. Variation trends in annual discharge series were investigated using the Mann–Kendall test and linear regression. Abrupt change was detected by applying average-difference T-test (in Table 3).
Figure 5 shows that (1) observed runoff at Daicunba station, Hongqi station, and Tangnaihai station shows higher variability with greater annual runoff fluctuation in comparison to the other three stations. (2) Runoff at all the six stations shows declining trends with linear decreasing rates of −1.465 (Daicunba station), −1.378 (Hongqi station), −0.887 (Houdacheng station), −0.667 (Huayuankou station), −0.608 (Pianguan station), and −0.229 mm/year (Tangnaihai station), respectively. (3) Significant declining trends are detectable except for runoff gauged at Tangnaihai station and Daicunba station (based on U values in Table 3).
Table 3 presents the abrupt change year detected by using the T-test. The earliest abrupt change year for all six catchments occurred in 1975, and the latest abrupt change occurred in 1997; this agrees with the results detected by using Mann–Kendall test published in previous studies [58,59,60,61,62].

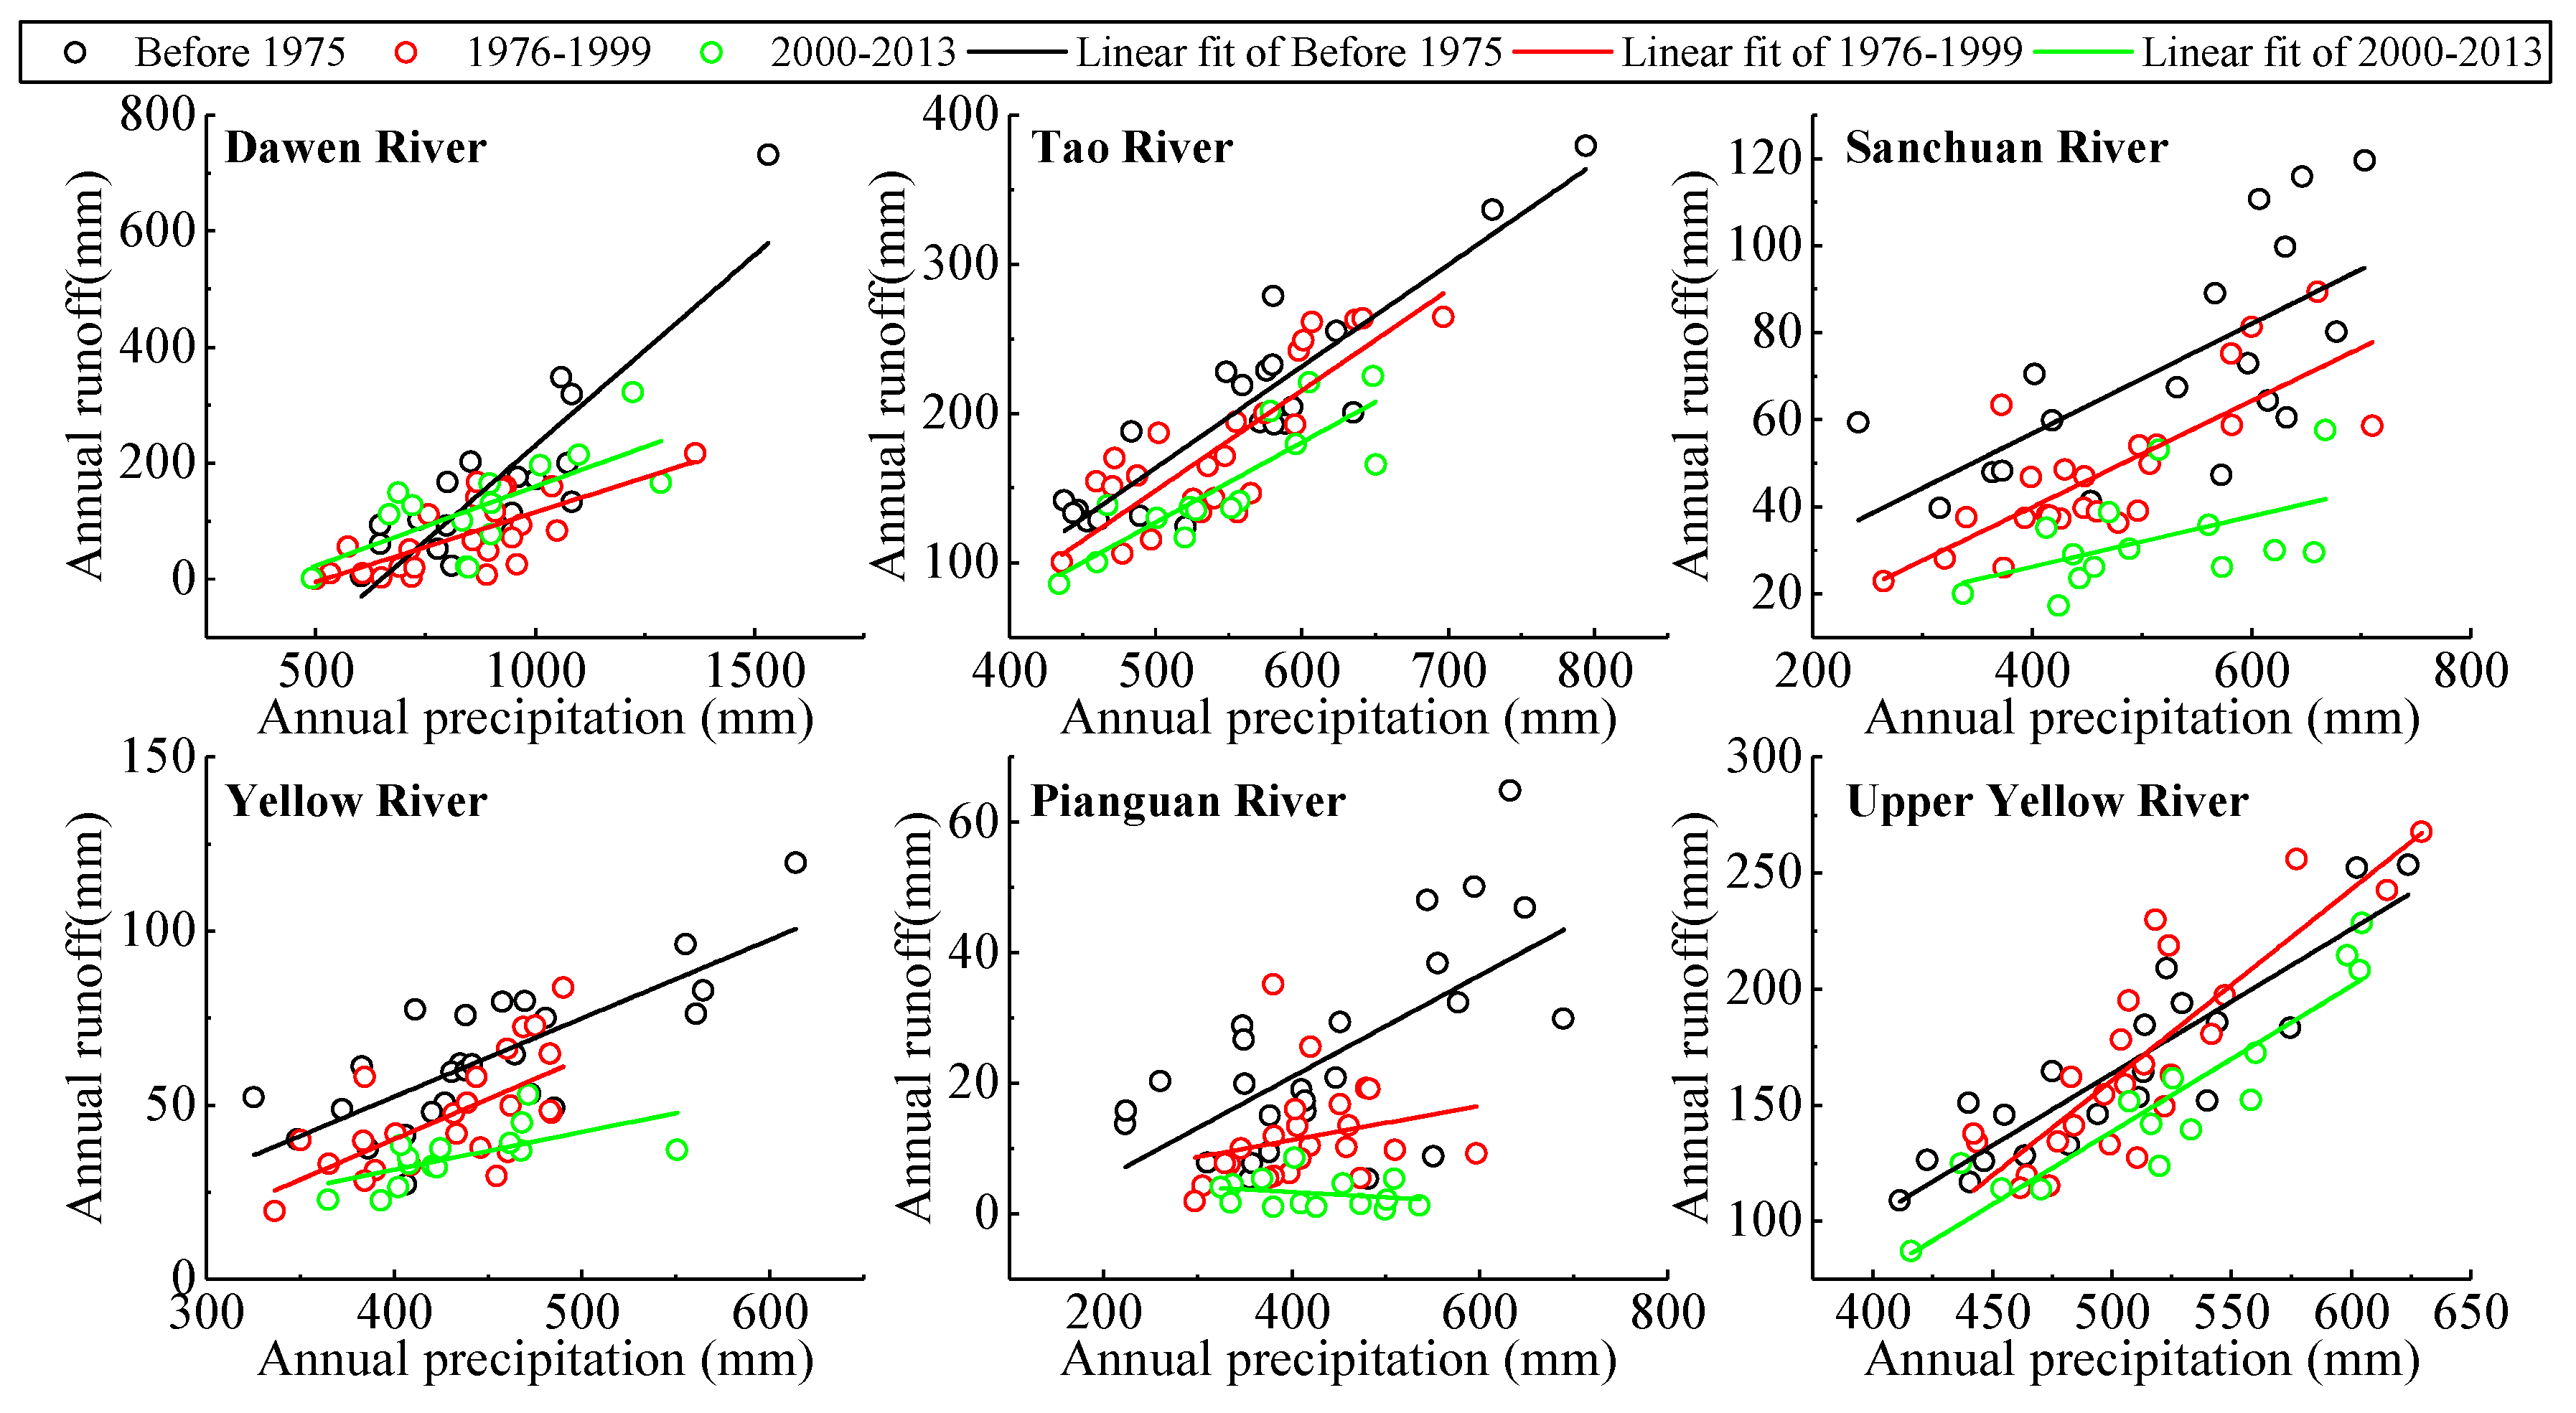
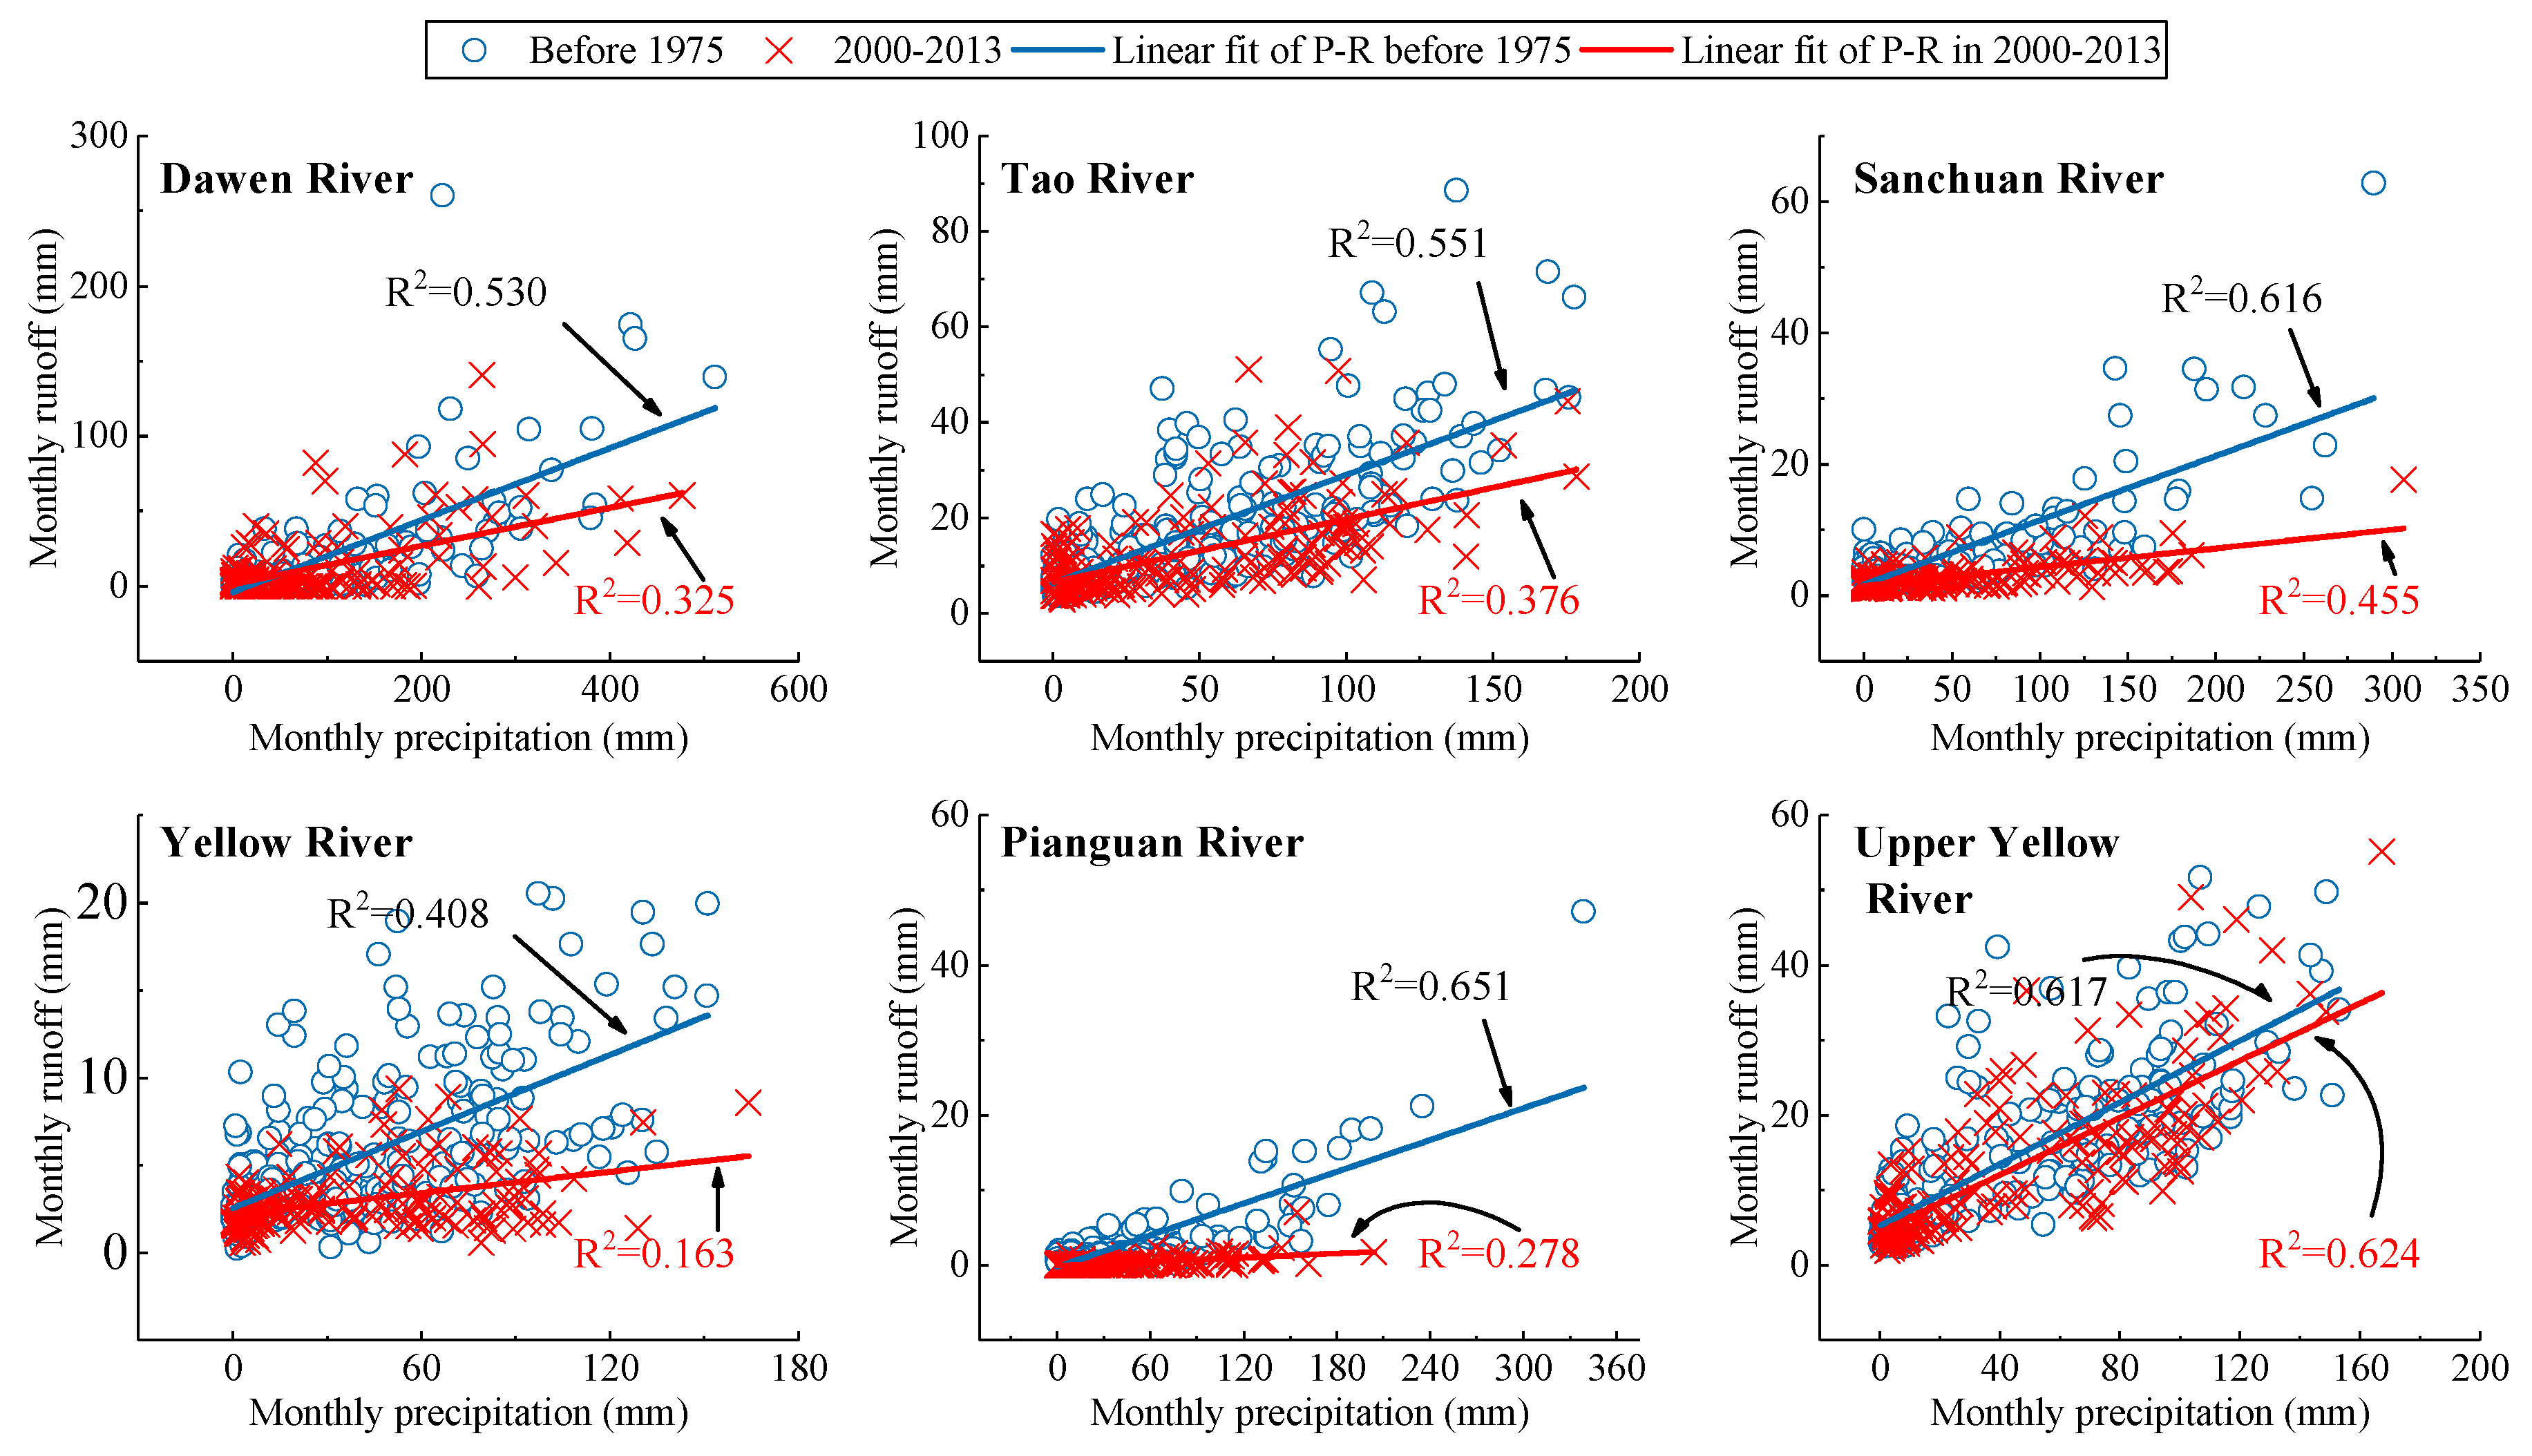
3.3. Relationships between Runoff and Precipitation in a Changing Environment

The observed annual rainfall and runoff series were divided into three periods [before 1975, 1976–1999, and 2000–2013] (Figure 6) to explore their phased relationships and abrupt change analysis. Figure 5 indicates that: (1) runoff is highly correlated with precipitation before 1975 (black hollow points and black regression line) for every catchment with natural conditions; (2) with the exception of the Upper Yellow River basin, the points of runoff against precipitation after 1975 fall towards the lower phase, especially in 2000–2013, which shows that runoff was much reduced in terms of similar magnitude of precipitation at the annual scale.

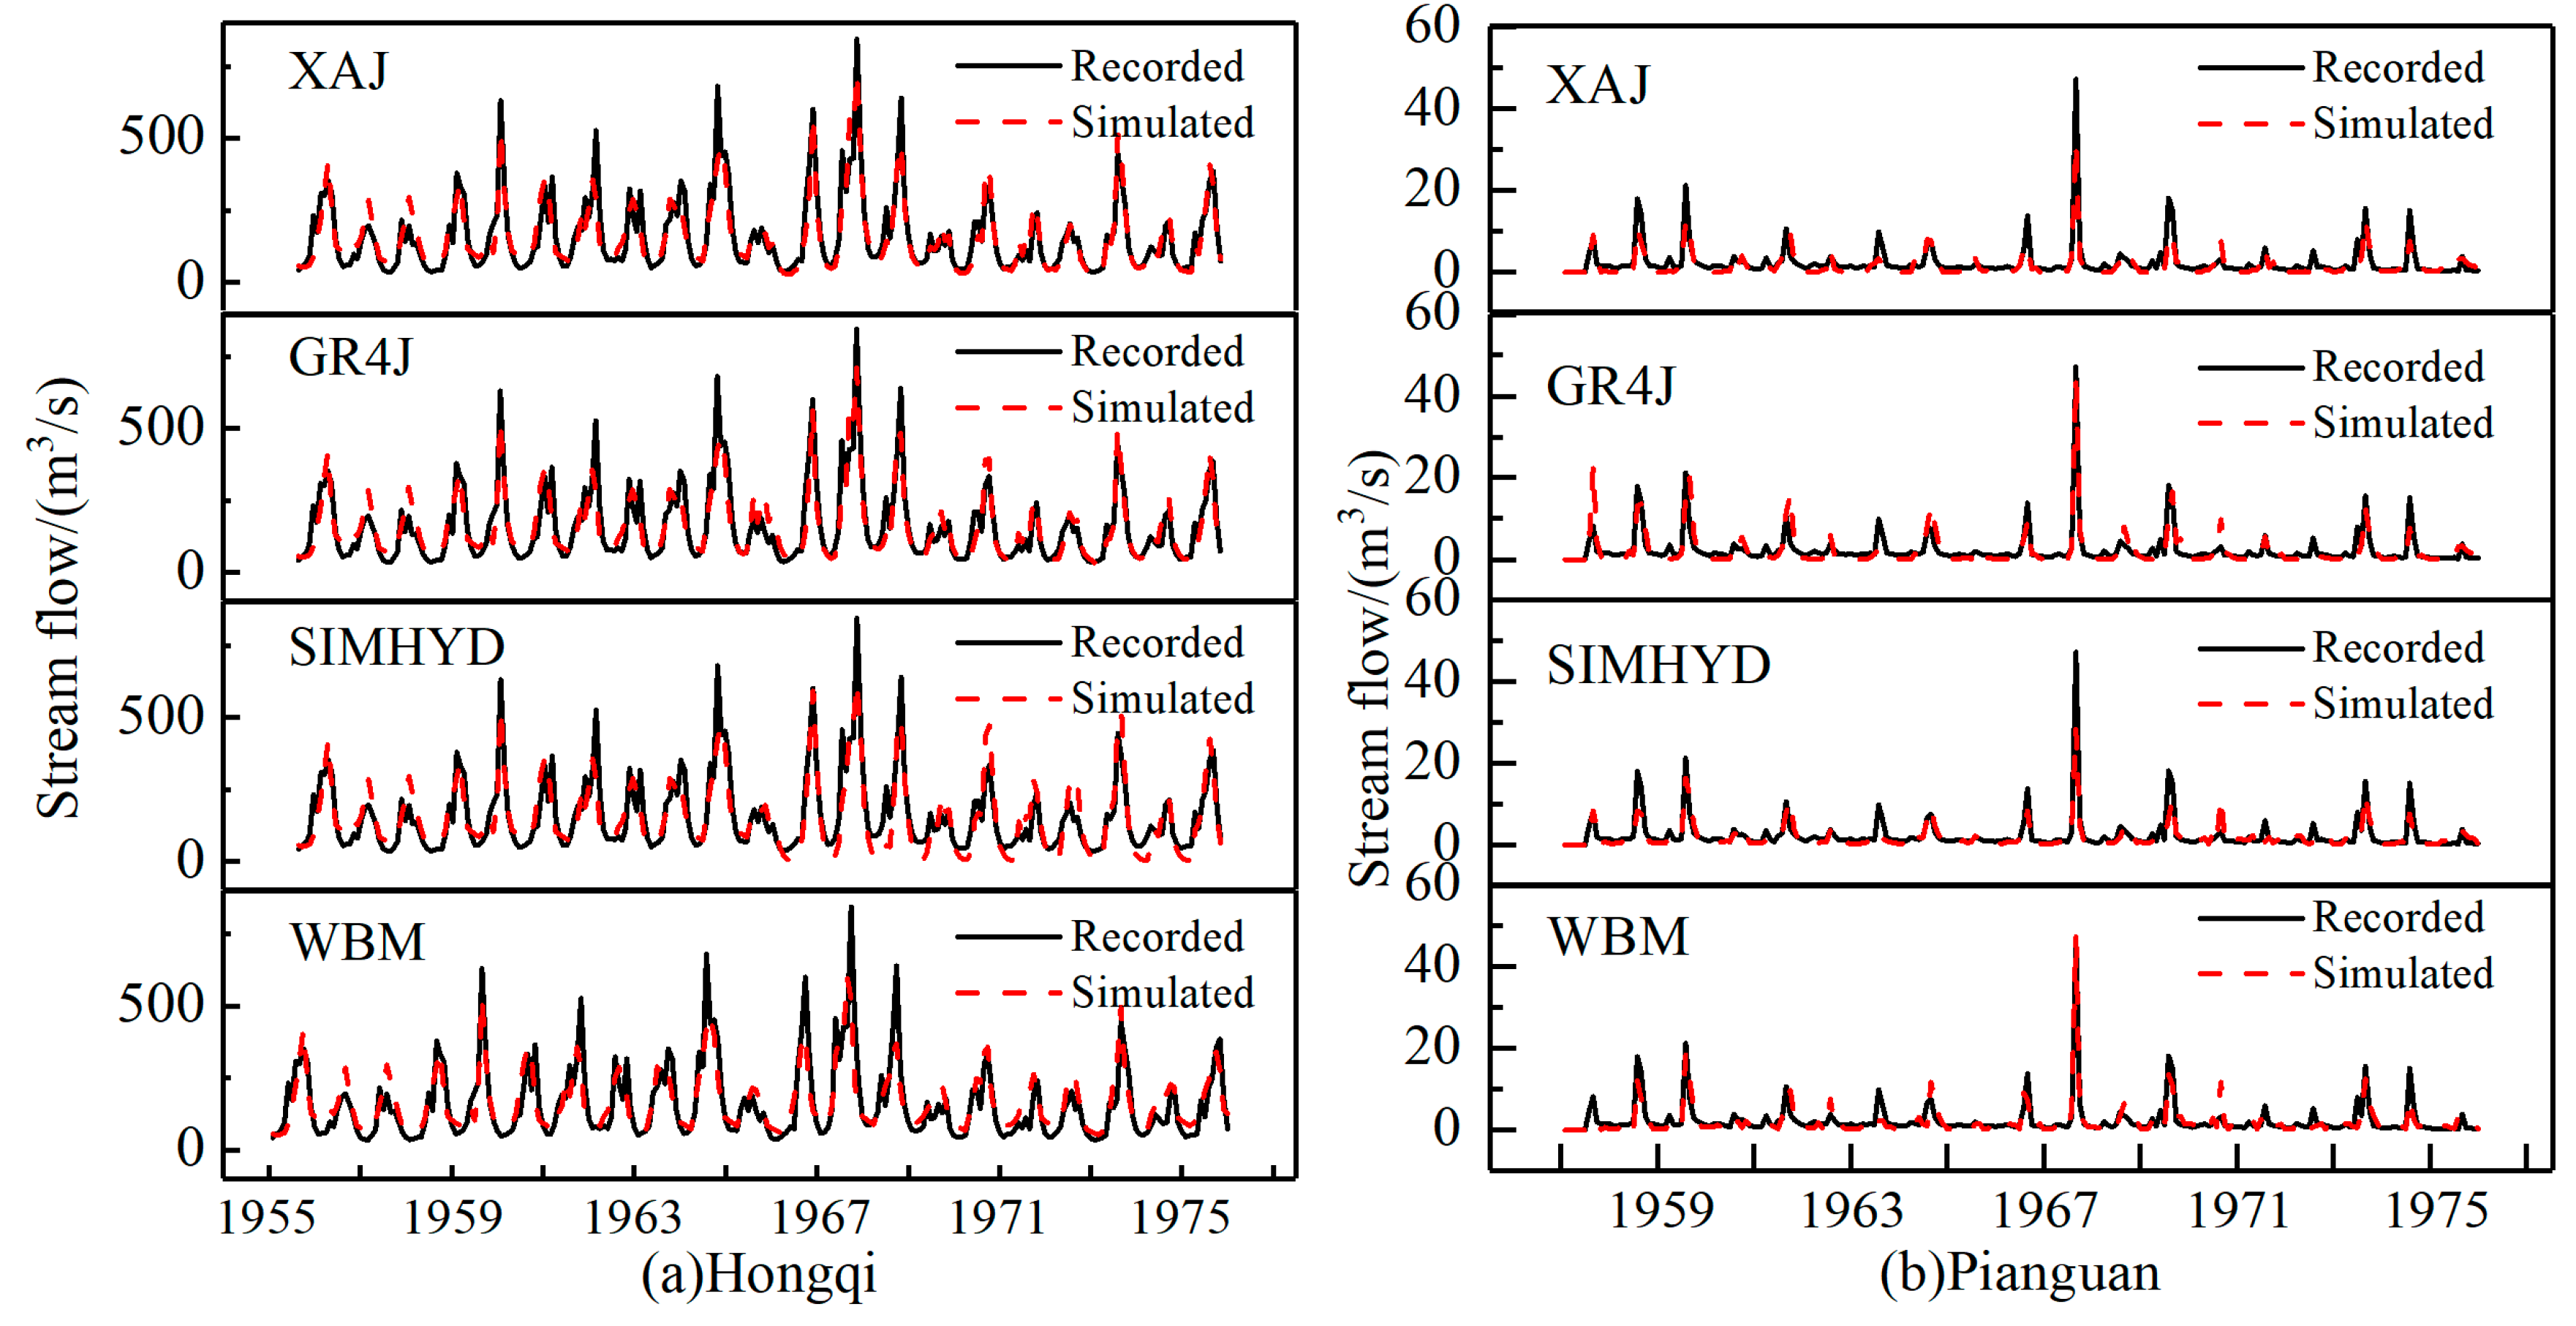
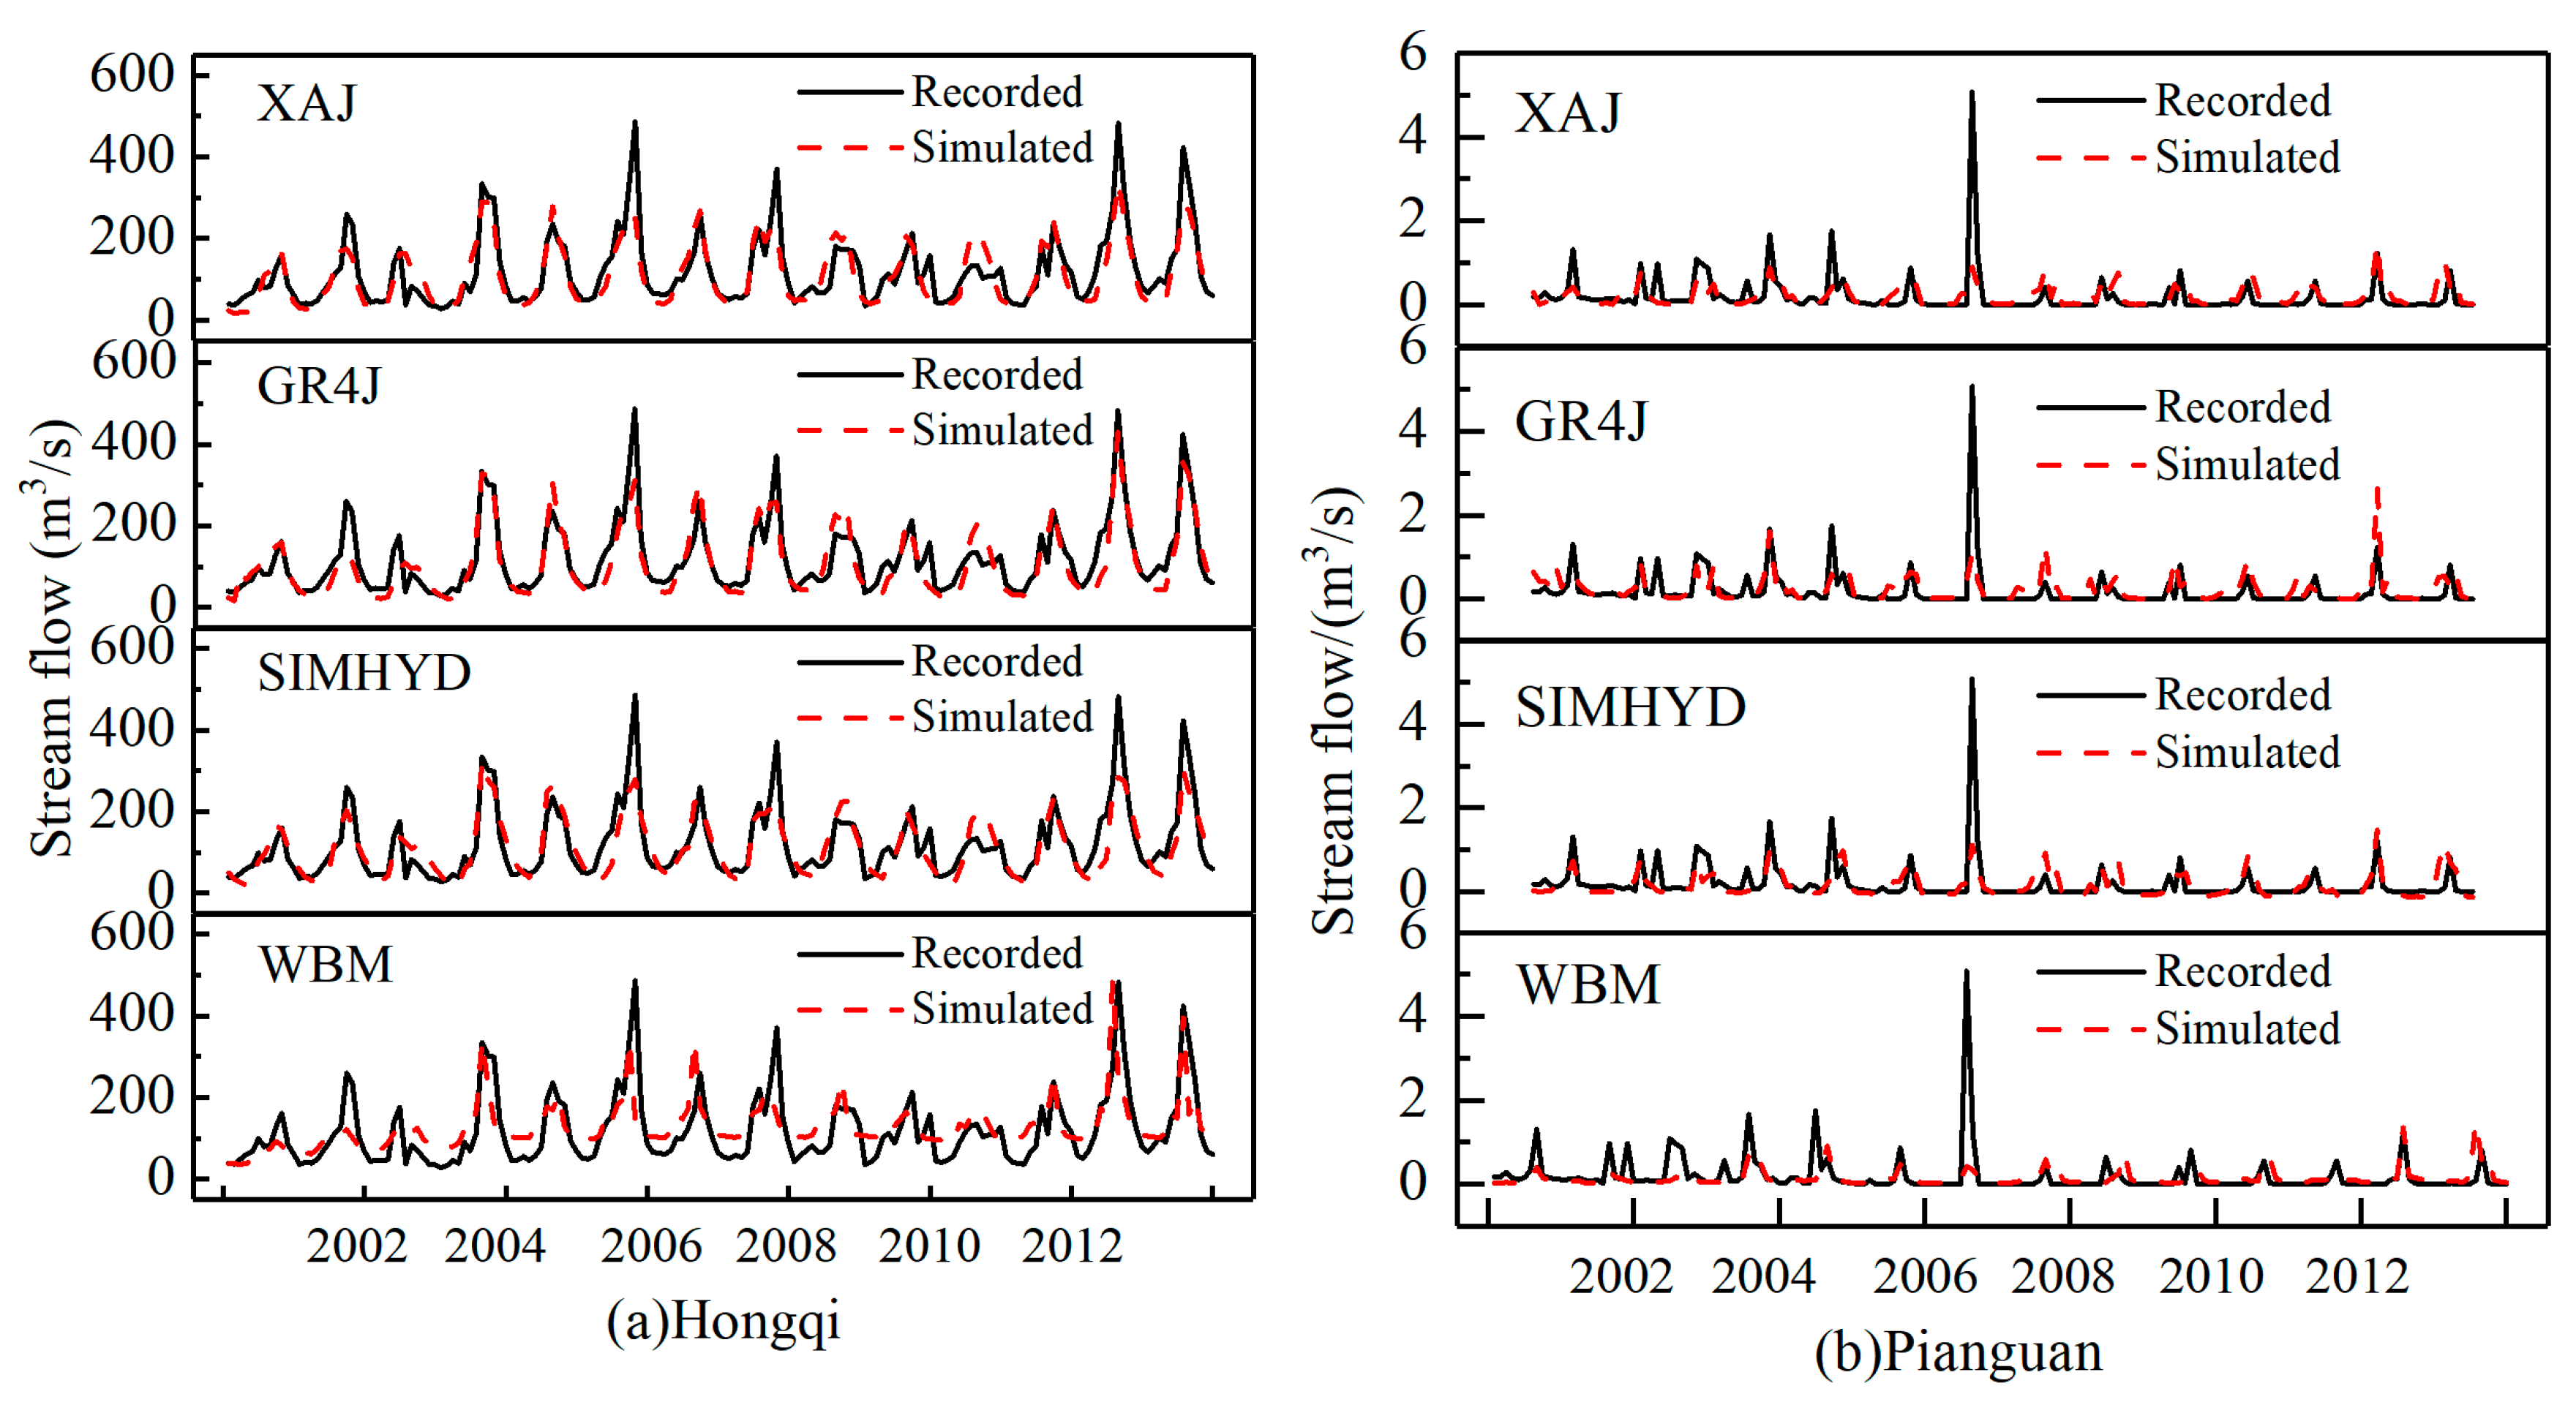
3.4. Hydrological Simulation for Stream Flow

3.4.1. Hydrological Modeling under Natural Period

To evaluate the models’ performance for simulating the discharge under the natural condition without severe impacts of human activities, the data series before abrupt changing years was divided into calibration and verification periods for the six selected hydrometric stations, respectively. The XAJ, GR4J, and SIMHYD models simulated the daily discharge and results were aggregated to monthly discharge volumes at the hydrometric stations, while monthly rainfall, temperature, and potential evaporation data series were necessary as model inputs to estimate monthly stream flow by the RCCC-WBM model. The performance of the four models over the six sub-basins is presented in Table 4 and Table 5. The monthly observed and simulated discharge at the Hongqi and Pianguan station are taken as typical examples and shown in Figure 7.
Table 4 and Table 5 show that: (1) the four hydrological models not only perform well for the monthly discharge of tributary catchments but also for Tangnaihai and Huayuankou stations on the main stream of the Yellow River. For the tributary catchments (excluding Huayuankou station), NSEs in the calibration period vary from 0.814 to 0.849 for XAJ model, from 0.729 to 0.870 for GR4J model, from 0.709 to 0.799 for SIMHYD model and from 0.703 to 0.812 for RCCC-WBM model. In addition, the REs were all between −15% and 15%. NSEs in the verification period were all greater than 0.7 with the absolute value of REs less than 15%. (2) The XAJ model has the best discharge simulation performance in the Yellow River basin with the highest NSEs and lowest REs for both calibration and verification period among the four hydrological models, followed by GR4J. The adequate performance of the simulations indicates that the hydrological models may be useful for investigating the stream flow in the Yellow River basin.
The calibrated XAJ model was then forced by meteorological data for the entire period of record, using the constant set of parameters to generate runoff estimates (Figure 8). The simulated runoff series reflect the benchmark situation without major human influences throughout the basin. Figure 8 shows the following: (1) the simulated and observed annual runoff at the Daicunba and Hongqi stations match well, not only for the first model calibration and verification periods, but also for several years after these periods; (2) as the parameters were kept constant, variability of the simulated runoff reflects the changes in climatic variables, such as the variability in precipitation and trend in temperature; (3) the simulation errors (the difference between observed and simulated runoff) become ever larger (overestimated) after 1980, which show large value after 2000 for the other 4 hydrometric stations, suggesting substantial human activities and influence were observed. The starting year of abrupt change in the runoff series indicated in Figure 7 was similar to the T-test results in Table 4.

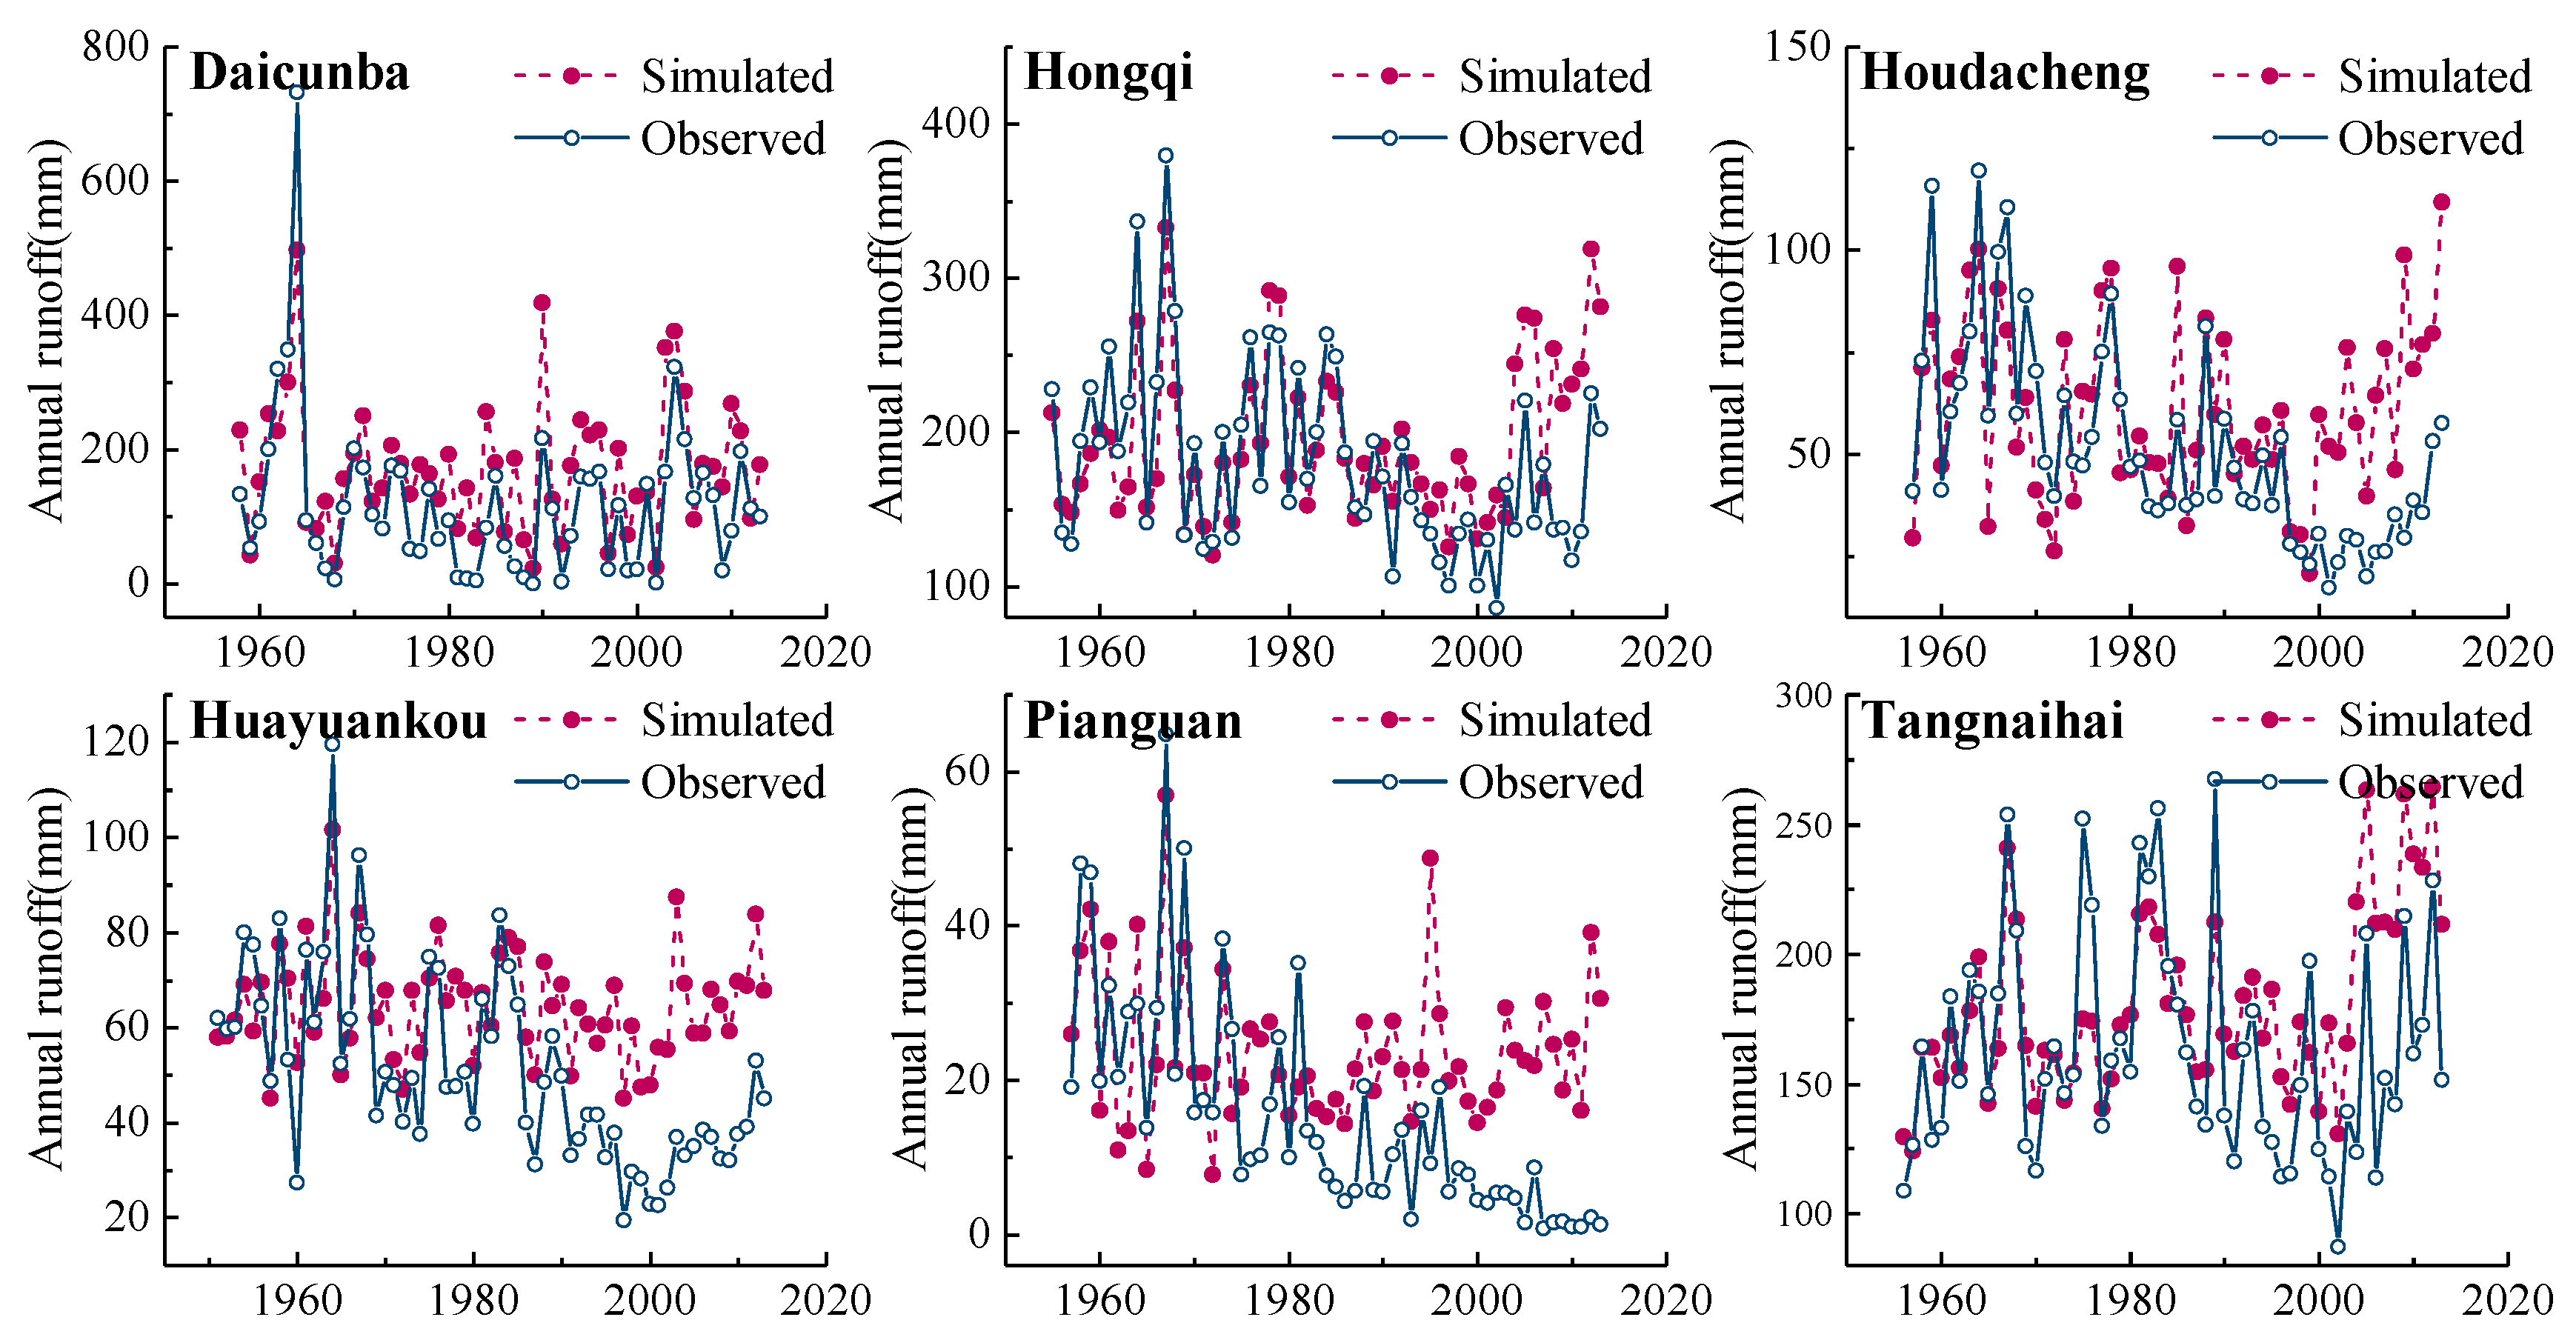
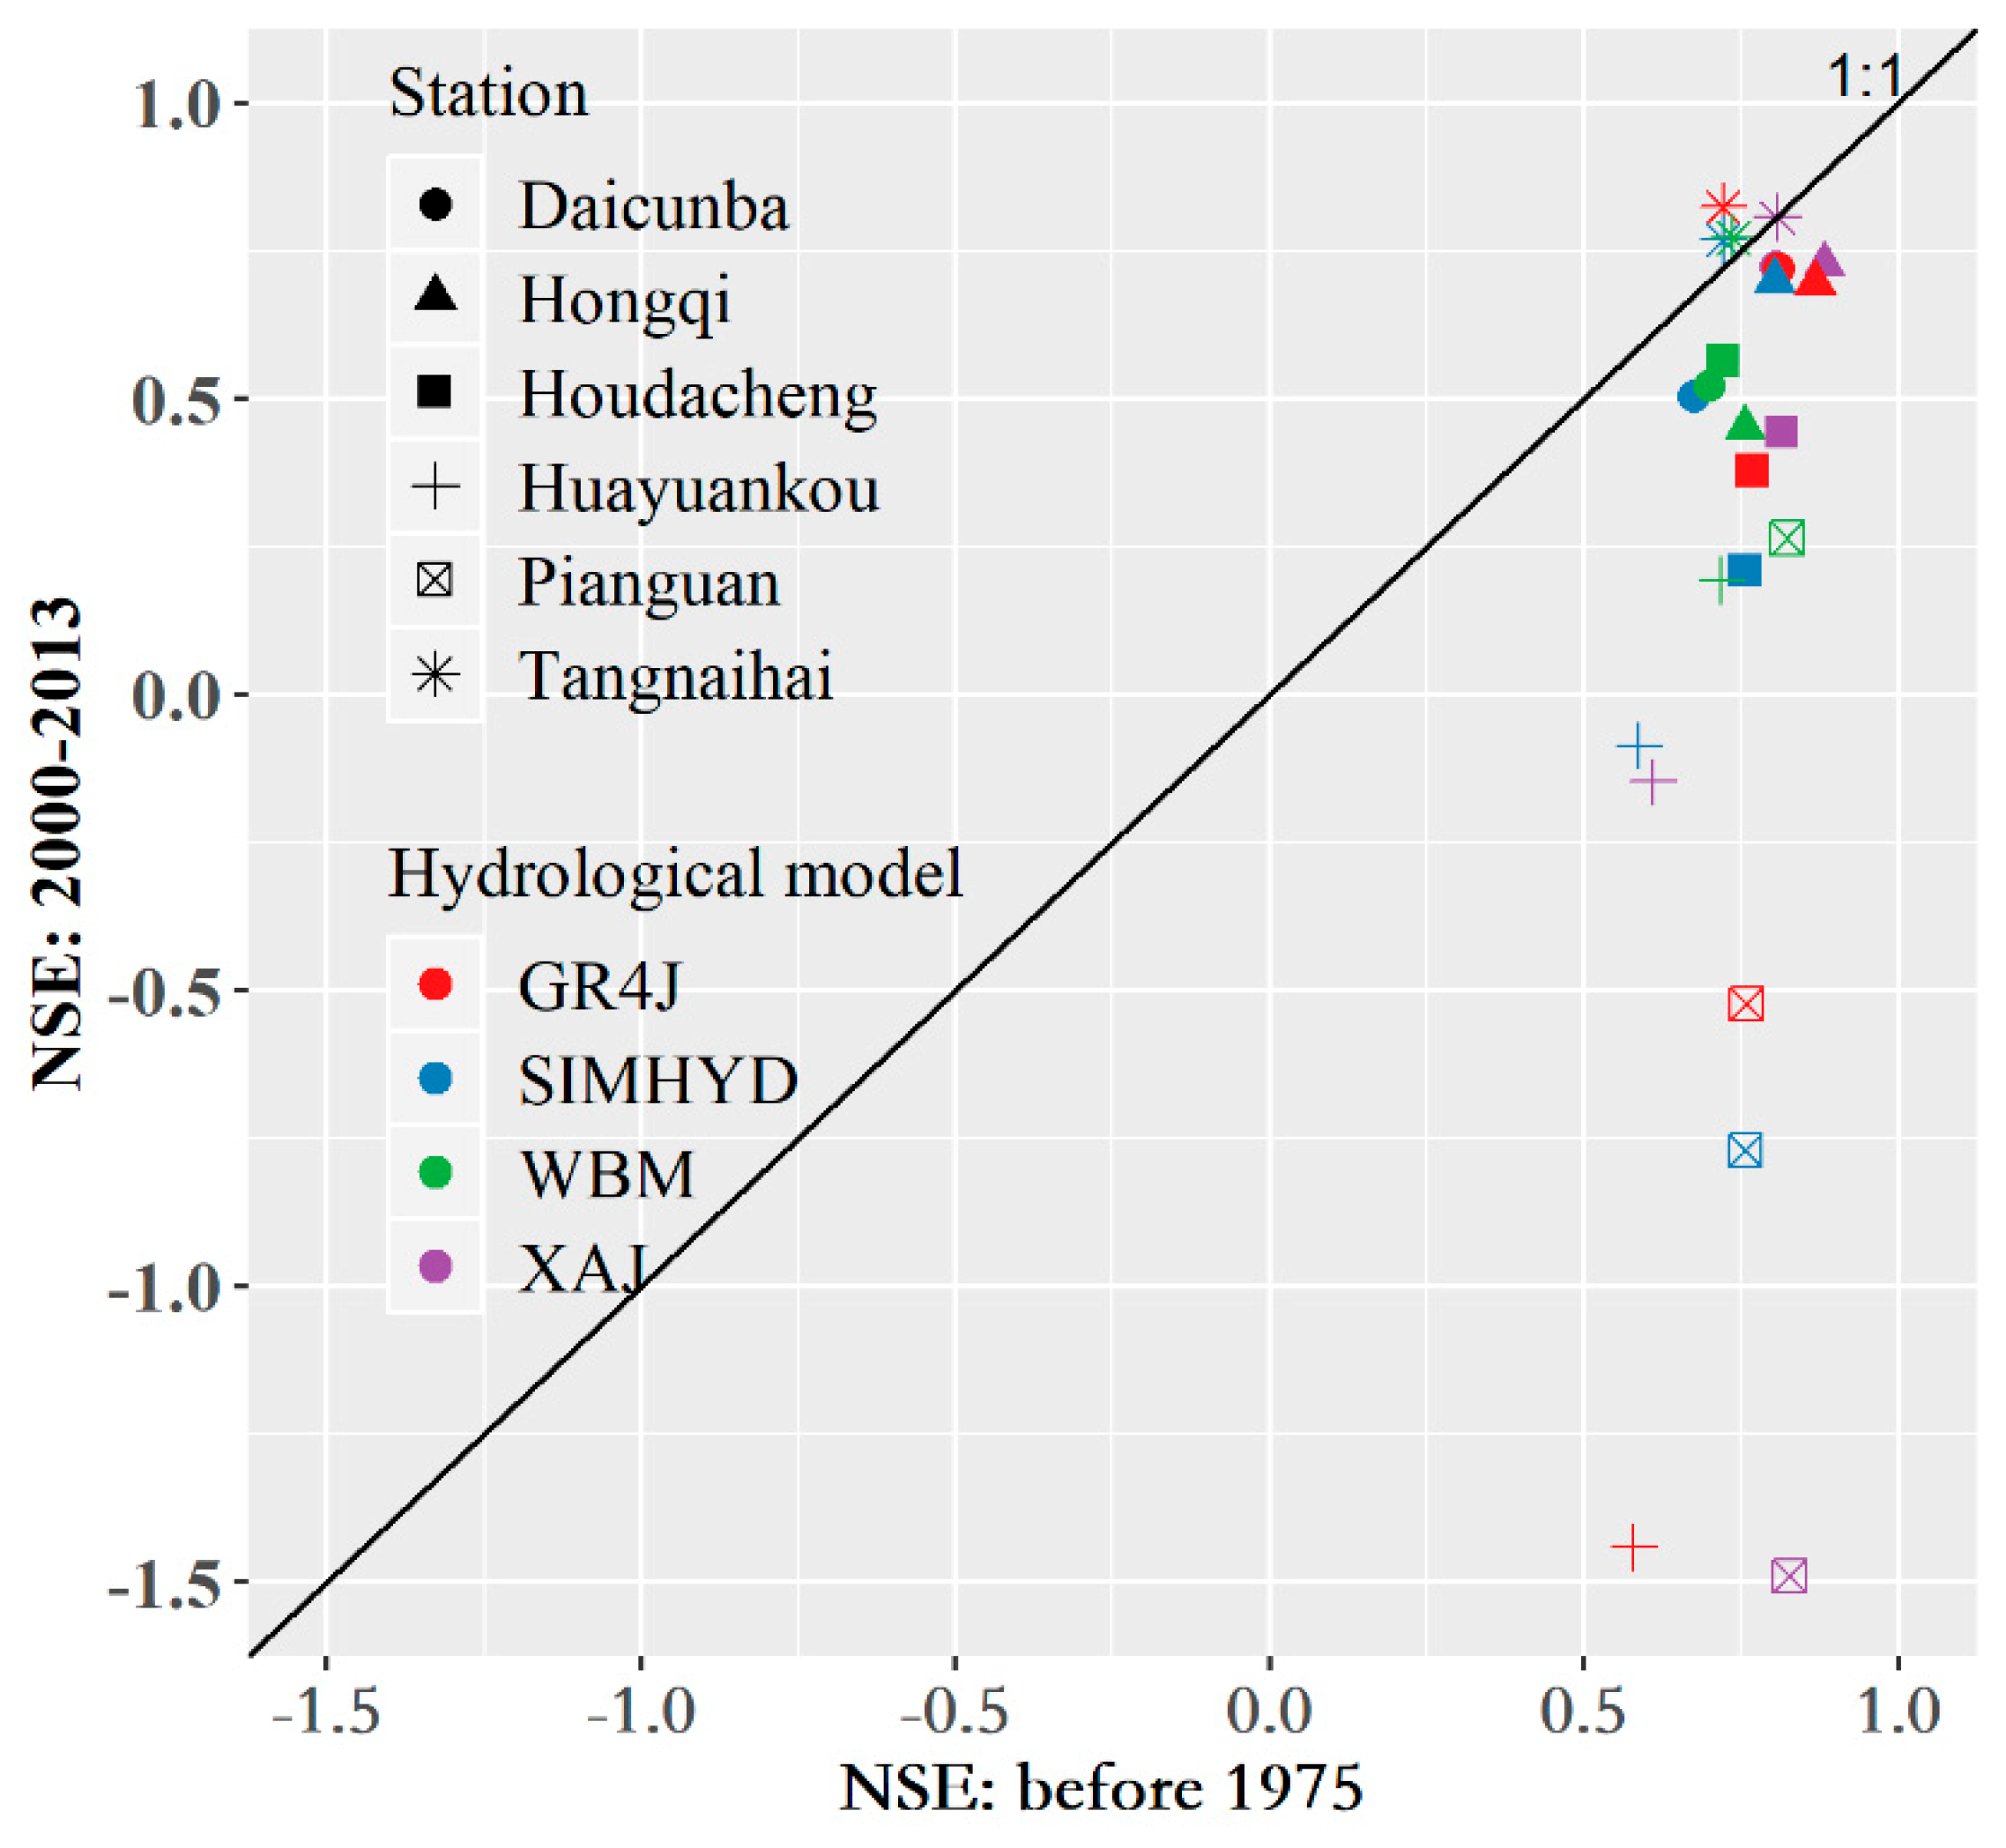
3.4.2. Hydrological Modeling under a Changing Environment

Under the changing environments where impacts of human activities such as land use change and artificial water intake are expected to have a great influence on hydrological regime, namely the response of runoff to rainfall; therefore, the hydrological model performance, reliability, and applicability require reassessment. Based on this, the input data series in 2000–2013 that were used to drive the 4 hydrological models and the monthly simulation results for calibration and verification periods are presented in Table 6 and Table 7. As the rainfall–runoff relationship is the simplest hydrological model, scatters between monthly precipitation and runoff and linear regression with R-squared (R2) calculated were drew in Figure 9. The monthly observed and simulated discharge from 2000–2013 at the Hongqi and Pianguan stations are taken as typical examples, and shown in Figure 10.
The runoff simulation results show that: (1) the 4 hydrological models performed comparatively well in Dawen River, Tao River, and Upper Yellow River basin especially for XAJ and GR4J models, with NSEs over 0.6 and absolute value of REs less than 20% for both calibration and verification periods. For the Upper Yellow River basin, NSEs calculated by 4 models were all above 0.7, which were in great agreement with that shown in Figure 9, where points of annual runoff against precipitation in all the three periods fall into the same or similar domain meaning the relationship between runoff and precipitation did not change significantly; (2) the performance of the four conceptual hydrological models for runoff simulation at Houdacheng, Huayuankou, and Pianguan stations were not satisfactory where the NSEs were no greater than 0.4 for the calibration period and even less than zero for the verification period for Huayuankou and Pianguan stations. Furthermore, the REs for the three hydrometric stations fluctuated with large amplitude and even exceeded 100% at Pianguan station where discharge was gauged to be not zero only in summer (in Figure 9, the runoff mostly approaches zero during 2000–2013, meaning weak influence on runoff from the rainfall exerted) making the correlation between precipitation and runoff so weak and in turn the conceptual hydrological models could not depict the law of runoff generation and flow routing any more under a changing environment; (3) the four models’ simulation results agree with that expressed by the rainfall–runoff relationship at both yearly and monthly scale. In other words, conceptual or lumped hydrological models lose their advantage in simulating the discharge under a changing environment, which poses great challenges to watershed water resource assessment and management.

3.5. Discussion

Among all the six hydrometric stations, the earliest abrupt change occurred in 1975 for the Dawen River, and the latest abrupt change was detected in 1997 for the Sanchuan River (in Table 3). Previous studies indicated that human activities are the main drivers of runoff’s change for the middle Yellow River [60]. Also, the variation of rainfall dominates the fluctuation of runoff while temperature could influence runoff by changing evaporation. In addition, large-scale soil and water conservation measures have been implemented along the Yellow River since the 1970s [43].
By comparing the modeling capacity in simulation of the stream flow for the four hydrological models during the natural period, the average NSE of the four models for the calibration period for Tangnaihai and Huayuankou stations were 0.758 and 0.656, respectively, while the absolute value of REs during the verification period ranges from 0.33 to 8.81 and from 8.54 to 23.34 for the same two stations. Therefore, it can be concluded that the four hydrological models are performing better at Tangnaihai station than Huayuankou station. This conclusion can be attributed to a lower anthropic impact on the hydrological regime in the Upper Yellow River basin even though the upper basin of Huayuankou station encompasses complex and variable climate zones and underlying conditions, whose area occupies over 97% of the whole Yellow River basin.
Figure 11 shows the comparison results of the four models’ performances at the 6 typical sub-catchments under both natural (before 1975) and changing environment periods (2000–2013), where shapes of the points stand for hydrometric stations and colors of the points distinguish the 4 hydrological models. The 4 points representing Tangnaihai station are above or on the 1:1 line (solid black line), implying good performance of the 4 models in the Upper Yellow River basin. The other points represent the other 5 stations all located below the 1:1 line, which implies low performance. In addition, the NSE values for the 2000–2013 period are below 0 at Huayuankou and Pianguan stations except for the WBM model, meaning that the ability of stream flow simulation by the conceptual models are weakened at a catchment scale under a changing environment, especially for Pianguan and Huayuankou stations because the rainfall–runoff relationship is greatly disturbed by human production practice.

4. Conclusions

Trends of forecasting and hydro-meteorological elements and stream flow simulation under changing environments have played significant roles in watershed water resource assessment and management, and have become a major challenge in modern water science research. Therefore, variation trends in annual and seasonal hydro-climatic variables (e.g., discharge, precipitation, and temperature) over six selected catchments of the Yellow River basin were investigated to assess the hydrological model capacity (four models XAJ, SIMHYD, GR4J, and RCCC-WBM were selected for this analysis) in simulating the streamflow discharge under natural and changing environments in the dry region. Temperatures over the Yellow River basin and sub-catchments have tended to increase with significant rising trends exhibited by Mann–Kendall rank test probably due to global warming, while there are no significant upward or downward trends established in the annual precipitation series, which fluctuate around the mean value without great abruption over all the six catchments.
The annual runoff series are relatively stationary until approximately the 1980s and mostly the high-runoff at the hydrometric stations occurred before the 2000s and continuously and unprecedentedly decline from 2000, which is in accordance to the abrupt change years in annual the runoff series that mostly occurred between 1980 and 2000 and was detected by using the average-difference T-test analysis. This is can be attributed to changing environments such as regulation of the system, land use changes, conservation infrastructure, etc.
Appropriate periods of data were applied to calibrate and validate the four selected hydrological models. The study found that the four hydrological models performed well for runoff simulation in the Yellow River basin. In terms of the Nash–Sutcliffe efficiency coefficient, owing to the detailed and complicated mechanism of runoff generation and flow routing being well represented in model structure, the XAJ model worked better than SIMHYD, WBM, and GR4J. However, under the changing environment (2000–2013), the discharge at Houdacheng, Huanyuankou, and Pianguan stations were not simulated appropriately because the rainfall–runoff relationship in the three sub-catchments have changed a lot due to the intensive human activities during that period, where the conceptual hydrological models lose their ascendancy and capacity. However, the RCCC-WBM model, in comparison to the other models, could be considered to be acceptable, and has the capacity to simulate the runoff under natural and changing environmental periods, which is can be attributed to its simple structure and easy-to-understand principle, and it can be recommended for water resource assessment under changing environments.
The Yellow River basin has a range of climatic zones with distinguishing rainfall–runoff mechanisms and different geomorphological features, to which hydrological models are required to have plasticity and adaptation as well as sufficient precision in rapid assessment of water resources under changing environments to allow the simulation of the runoff under human activities. These will require a fair presentation of the regulation regime.

Author Contributions

J.Z. and G.W. designed the study and improved the manuscript; X.G. performed model application and drafted the paper; X.L. and J.L. collected hydrological data and meteorological data; Y.L. (Yue Liu) and J.J. analyzed variation of hydro-meteorological data series; Y.L. (Yanli Liu) and Z.B. investigated relationships between runoff and precipitation for various periods; C.L. and R.H. conducted comparison of model performance for hydrological modeling; A.E. reviewed the designed study, results, analysis in addition to the document and edited the paper.

Funding

This study has been financially supported by the National Key Research and Development Programs of China (Grants: 2016YFA0601501), the National Natural Science Foundation of China (Grants: 41830863, 51879162, 41601025, 51879164, 41330854, 51779146), and State Key Laboratory of Hydrology-Water Resources and Hydraulic Engineering (Grant No. 2017490211).

Acknowledgments

We appreciate Tiesheng Guan from Nanjing Hydraulic Research Institute and Qinli Yang from University of Electronic Science and Technology of China for their comments on the study, Thanks also to the anonymous reviewers and editors for their valuable comments.

Conflicts of Interest

The authors declare no conflict of interest.

References

  1. Xu, Z.X. Hydrological models: Past, present and future. J. Beijing Norm. Univ. 2010, 46, 278–289. [Google Scholar]
  2. Elsawah, S.; Pierce, S.A.; Hamilton, S.H.; Delden, H.V.; Haase, D.; Elmahdi, A.; Jakeman, A.J. An overview of the system dynamics process for integrated modelling of socio-ecological systems: Lessons on good modelling practice from five case studies. Environ. Model. Softw. 2017, 93, 127–145. [Google Scholar] [CrossRef]
  3. Wang, G.; Zhang, J.; Yang, Q. Attribution of runoff change for the Xinshui River catchment on the Loess pPateau of cCina in a changing environment. Water 2016, 8, 267. [Google Scholar] [CrossRef]
  4. Montanari, A.; Young, G.; Savenije, H.H.G.; Hughes, D.; Wagener, T.; Ren, L.L.; Koutsoyiannis, D.; Cudennec, C.; Toth, E.; Grimaldi, S.; et al. “Panta rhei—Everything flows”: Change in hydrology and society—The IAHS scientific decade 2013–2022. Hydrol. Sci. J. 2013, 58, 1256–1275. [Google Scholar] [CrossRef]
  5. Zhang, H.; Wang, B.; Liu, D.L.; Zhang, M.; Feng, P.; Cheng, L.; Yu, Q.; Eamus, D. Impacts of future climate change on water resource availability of eastern Australia: A case study of the Manning River basin. J. Hydrol. 2019, 573, 49–59. [Google Scholar] [CrossRef]
  6. IPCC. Climate Change 2007: Impacts Adaptation and Vulnerability; Cambridge University Press: Cambridge, UK, 2007. [Google Scholar]
  7. IPCC. Climate Change and Water; Cambridge University Press: Cambridge, UK, 2008. [Google Scholar]
  8. Bao, Z.; Zhang, J.; Wang, G.; Fu, G.; Liu, C.; Yan, X. Pan evaporation trend for the Haihe River basin and its response to climate change. Pan 2011, 237, 1. [Google Scholar]
  9. Bao, Z.; Zhang, J.; Wang, G.; Fu, G.; He, R.; Yan, X.; Jin, J.; Liu, Y.; Zhang, A. Attribution for decreasing streamflow of the haihe river basin, northern China: Climate variability or human activities? J. Hydrol. 2012, 460, 117–129. [Google Scholar] [CrossRef]
  10. Albergel, C.; Dorigo, W.; Reichle, R.H.; Balsamo, G.; de Rosnay, P.; Muñoz-Sabater, J.; Isaksen, L.; de Jeu, R.; Wagner, W. Skill and global trend analysis of soil moisture from reanalyses and microwave remote sensing. J. Hydrometeorol. 2013, 14, 1259–1277. [Google Scholar] [CrossRef]
  11. Datta, S.; Satten, G.A. Rank-sum tests for clustered data. J. Am. Stat. Assoc. 2005, 100, 908–915. [Google Scholar] [CrossRef]
  12. Yang, Y.; Fei, T. Abrupt change of runoff and its major driving factors in Haihe River catchment, China. J. Hydrol. 2009, 374, 373–383. [Google Scholar] [CrossRef]
  13. Bassingthwaighte, J.B.; Raymond, G.M. Evaluating rescaled range analysis for time series. Ann. Biomed. Eng. 1994, 22, 432–444. [Google Scholar] [CrossRef] [PubMed]
  14. Zhang, Y.C.; Zhou, C.H.; Bao-Lin, L.I. Brown-forsythe based method for detectingchange points in hydrological time series. Geogr. Res. 2005, 6, 14–18. [Google Scholar]
  15. Lee, A.F.S.; Heghinian, S.M. A shift of the mean level in a sequence of independent normal random variables: A bayesian approach. Technometrics 1977, 19, 503–506. [Google Scholar]
  16. Guan, X.X.; Zhang, J.Y.; Ju, Q.; Wang, G.Q.; Guan, T.S. Comparison of consistency testing for key hydrological elements by using multiple statistical methods. J. North China Univ. Water Resour. Electr. Power 2018, 39, 51–56. [Google Scholar]
  17. Hou, Q.L.; Bai, H.Y.; Ren, Y.Y.; He, Y.N.; Ma, X.P. Analysis of variation in runoff of the main stream of the Weihe River and related driving forces over the last 50 years. Resour. Sci. 2011, 33, 1505–1512. [Google Scholar]
  18. Guan, X.X.; Liu, Y.; Jin, J.L.; Liu, C.S.; Liu, Y.L.; Wang, G.Q. Characteristics of hydrological changes of typical catchments in different climatic regions of China. J. North China Univ. Water Resour. Electr. Power 2018, 39, 13–17. [Google Scholar]
  19. Bao, W.M. Hydrological Forecasting, 4th ed.; China Water and Hydropower Press: Beijing, China, 2009. [Google Scholar]
  20. Wang, G.Q.; Zhang, J.Y.; Jin, J.L.; Liu, Y.L.; He, R.M.; Bao, Z.X.; Liu, C.S.; Li, Y. Regional calibration of a water balance model for estimating stream flow in ungauged areas of the Yellow River basin. Quat. Int. 2014, 336, 65–72. [Google Scholar] [CrossRef]
  21. Zhan, C.S.; Jiang, S.S.; Sun, F.B.; Jia, Y.W.; Yue, W.F.; Niu, C.W. Quantitative contribution of climate change and human activities to runoff changes in the Wei River basin, China. Hydrol. Earth Syst. Sci. 2014, 11, 2149–2175. [Google Scholar] [CrossRef]
  22. Zeng, S.; Zhan, C.; Sun, F.; Du, H.; Wang, F. Effects of climate change and human activities on surface runoff in the Luan River basin. Adv. Meteorol. 2015, 2015, 1–12. [Google Scholar] [CrossRef]
  23. Dey, P.; Mishra, A. Separating the impacts of climate change and human activities on streamflow: A review of methodologies and critical assumptions. J. Hydrol. 2017, 548, 278–290. [Google Scholar] [CrossRef]
  24. Nash, L.L.; Gleick, P.H. Sensitivity of streamflow in the Colorado Basin to climatic changes. J. Hydrol. 1991, 125, 221–241. [Google Scholar] [CrossRef]
  25. Legesse, D.; Vallet-Coulomb, C.; Gasse, F. Hydrological response of a catchment to climate and land use changes in tropical Africa: Case study south central Ethiopia. J. Hydrol. 2003, 275, 67–85. [Google Scholar] [CrossRef]
  26. Ficklin, D.L.; Luo, Y.; Luedeling, E.; Zhang, M. Climate change sensitivity assessment of a highly agricultural watershed using SWAT. J. Hydrol. 2009, 374, 16–29. [Google Scholar] [CrossRef]
  27. Wen, D.; Cui, B.; Liu, Z.; Zhang, K. Relative effects of human activities and climate change on the river runoff in an arid basin in northwest China. Hydrol. Process. 2015, 28, 4854–4864. [Google Scholar]
  28. Liu, X.M.; Liu, W.H.; Xia, J. Comparison of the streamflow sensitivity to aridity index between the Danjiangkou Reservoir basin and Miyun Reservoir basin, China. Theor. Appl. Climatol. 2013, 111, 683–691. [Google Scholar] [CrossRef]
  29. Wang, G.Q.; Zhang, J.Y.; Jin, J.L.; Pagano, T.C. Assessing water resources in China using precise projections and VIC model. Hydrol. Earth Syst. Sci. Discuss. 2012, 16, 231–240. [Google Scholar] [CrossRef]
  30. Xu, Z.X.; Cheng, L. Progress on studies and applications of the distributed hydrological models. J. Hydraul. Eng. 2010, 41, 1009–1017. [Google Scholar]
  31. Zhao, J.; Wang, D.; Yang, H.; Sivapalan, M. Unifying catchment water balance models for different time scales through the maximum entropy production principle. Water Resour. Res. 2016, 52, 7503–7512. [Google Scholar] [CrossRef]
  32. Guo, F.; Ma, J.J. An analysis of applying SIMHYD model in the Yellow River basin. China Rural Water Hydropower 2015, 6, 75–80. [Google Scholar]
  33. Arsenault, R.; Gatien, P.; Renaud, B.; Brissette, F.; Martel, J.-L. A comparative analysis of 9 multi-model averaging approaches in hydrological continuous streamflow simulation. J. Hydrol. 2015, 529, 754–767. [Google Scholar] [CrossRef]
  34. Bao, Z.; Fu, G.; Wang, G.; Jin, J.; He, R.; Yan, X.; Liu, C. Hydrological projection for the Miyun Reservoir basin with the impact of climate change and human activity. Quat. Int. 2012, 282, 96–103. [Google Scholar] [CrossRef]
  35. Wang, G.Q.; Yan, X.L.; Zhang, J.Y.; Liu, C.S.; Jin, J.L.; Liu, Y.L.; Bao, Z.X. Detecting evolution trends in the recorded runoffs from the major rivers in China during 1950–2010. J. Water Clim. Chang. 2013, 4, 252–264. [Google Scholar] [CrossRef]
  36. Zhang, J.Y.; Wang, G.Q.; He, R.M.; Liu, C.S. Variation trends of runoffs in the Middle Yellow River basin and its response to climate change. Adv. Water Sci. 2009, 20, 153–158. [Google Scholar]
  37. Andersen, F.; Jensen, K.H.; Sandholt, I.; Stisen, S.; Jorreto, S.; Pulido-Bosch, A. Hydrological modelling in a semi-arid region using remote sensing data. AGU Fall Meet. 2006. Available online: http://citeseerx.ist.psu.edu/viewdoc/download?doi=10.1.1.621.5983&rep=rep1&type=pdf (accessed on 6 May 2019).
  38. Alkhoury, W.; Toll, M.; Gunkel, A.; Lange, J.; Sauter, M. The effect of space-time variations and measurement accuracy of precipitation on hydrological modelling in arid and semi-arid regions—A case study from Jordan. EGU Gen. Assem. Conf. 2010, 12, 1009. [Google Scholar]
  39. Molina-Navarro, E.; Hallack-Alegría, M.; Martínez-Pérez, S.; Ramírez-Hernández, J.; Mungaray-Moctezuma, A.; Sastre-Merlín, A. Hydrological modeling and climate change impacts in an agricultural semiarid region. Case study: Guadalupe River basin, Mexico. Agric. Water Manag. 2016, 175, 29–42. [Google Scholar] [CrossRef]
  40. Bhatti, A.M.; Jaranillasanchez, P.A.; Koike, T. Modeling hydrological responses to climate change in semi-arid region watershed. AGU Fall Meet. 2013. Available online: http://adsabs.harvard.edu/abs/2013AGUFM.H52B..04B (accessed on 6 May 2019).
  41. Kateb, H.E.; Zhang, H.; Zhang, P.; Mosandl, R. Soil erosion and surface runoff on different vegetation covers and slope gradients: A field experiment in southern Shaanxi province, China. Catena 2013, 105, 1–10. [Google Scholar] [CrossRef]
  42. Peng, Y.; Li, C.X.; Li, J. Assessment on the ecological security of the Yellow River Basin in Ningxia Province from 2000 to 2012. Resour. Sci. 2015, 37, 2480–2490. [Google Scholar]
  43. Zhang, R.; Wang, Y.M.; Chang, J.X.; Li, Y.Y. Response of land use change to human activities in the Yellow River Basin based on water resources division. J. Nat. Resour. 2019, 34, 274–287. [Google Scholar]
  44. Liu, F.; Chen, S.; Dong, P.; Peng, J. Spatial and temporal variability of water discharge in the Yellow River basin over the past 60 years. J. Geogr. Sci. 2012, 22, 1013–1033. [Google Scholar] [CrossRef]
  45. Jiang, S.; Ren, L.; Yong, B.; Singh, V.P.; Yang, X.; Yuan, F. Quantifying the effects of climate variability and human activities on runoff from the Laohahe basin in northern China using three different methods. Hydrol. Process. 2011, 25, 2492–2505. [Google Scholar] [CrossRef]
  46. Wang, G.Q.; Zhang, J.Y.; Pagano, T.C.; Liu, Y.L.; Liu, C.S.; Bao, Z.X.; Jin, J.L.; He, R.M. Using hydrological simulation to detect human-disturbed epoch in runoff series. Water Sci. Technol. 2015, 71, 691–699. [Google Scholar] [CrossRef] [PubMed]
  47. Bao, W.M.; Shen, D.D.; Ni, P.; Zhou, J.W.; Sun, Y.Q. Proposition and certification of moving mean difference method for detecting abrupt change points. J. Geogr. Sci. 2018, 73, 2075–2085. [Google Scholar]
  48. Zhang, X.; Fang, Y.; Qu, B. Key techniques and challenges of developing real-time flood forecasting systems based on the xin’anjiang model. AGU Fall Meet. 2015. Available online: http://adsabs.harvard.edu/abs/2015AGUFM.H43J..05Z (accessed on 6 May 2019).
  49. Zhao, R.J. The Xinanjiang model applied in China. J. Hydrol. 1992, 135, 371–381. [Google Scholar]
  50. Lü, H.; Hou, T.; Horton, R.; Zhu, Y.; Chen, X.; Jia, Y.; Wang, W.; Fu, X. The streamflow estimation using the xinanjiang rainfall runoff model and dual state-parameter estimation method. J. Hydrol. 2013, 480, 102–114. [Google Scholar] [CrossRef]
  51. Song, X.; Kong, F.; Zhan, C.; Han, J.; Zhang, X. Parameter identification and global sensitivity analysis of Xin’anjiang model using meta-modeling approach. Water Sci. Eng. 2013, 6, 1–17. [Google Scholar]
  52. Chiew, F.H.S.; Peel, M.C.; Western, A.W.; Singh, V.P.; Frevert, D. Application and Testing of the Simple Rainfall-Runoff Model Simhyd; Water Resources Publication: Littleton, CO, USA, 2002. [Google Scholar]
  53. Kachroo, R.K. River flow forecasting. Part 5. Applications of a conceptual model. J. Hydrol. 1992, 133, 141–178. [Google Scholar] [CrossRef]
  54. Nascimento, N.; Yang, X.; Makhlouf, Z.; Michel, C. GR3J: A daily watershed model with three free parameters. Hydrol. Sci. J. 1999, 44, 263–277. [Google Scholar]
  55. Xu, C.-Y.; Singh, V.P. A review on monthly water balance models for water resources investigations. Water Resour. Manag. 1998, 12, 20–50. [Google Scholar] [CrossRef]
  56. Perrin, C.; Michel, C.; Andréassian, V. Improvement of a parsimonious model for streamflow simulation. J. Hydrol. 2003, 279, 275–289. [Google Scholar] [CrossRef]
  57. Nash, J.E.; Sutcliffe, J.V. River flow forecasting through conceptual models part I—A discussion of principles. J. Hydrol. 1970, 10, 282–290. [Google Scholar] [CrossRef]
  58. Zhang, J.Y.; Wang, G.Q. Variation of Stream Flow and Attribution Analysis; China Science Press: Beijing, China, 2014. [Google Scholar]
  59. Li, C.B.; Wang, S.B.; Yang, L.S.; Yang, W.J.; Li, W.Y. Spatial and temporal variation of main hydrologic meteorological elements in the Taohe River basin from 1951 to 2010. J. Glaciol. Geocryol. 2013, 35, 1259–1266. [Google Scholar]
  60. Wang, F.; Mu, X.M.; Zhang, X.P.; Li, Y. Effect of soil and water conservation on runoff and sediment in Pianguan River. Sci. Soil Water Conserv. 2005, 2, 10–14. [Google Scholar]
  61. Zheng, H.X.; Zhang, L.; Zhu, R.R.; Liu, C.M.; Sato, Y.; Fukushima, Y. Responses of streamflow to climate and land surface change in the headwaters of the yellow river basin. Water Resour. Res. 2009, 45, 641–648. [Google Scholar] [CrossRef]
  62. Zhang, H.; Wang, B.; Lan, T.; Shi, J.; Lu, S. Change-point detection and variation assessment of the hydrologic regime of the Wenyu River. Toxicol. Environ. Chem. 2016, 98, 358–375. [Google Scholar] [CrossRef]
Figure 1. River system and location of meteorological and hydrometric stations in the Yellow River basin.
Water 11 01328 g001
Figure 2. Flowchart of Xin’anjiang model.
Water 11 01328 g002
Figure 3. Model structures of SIMHYD, GR4J, and RCCC-WBM.
Water 11 01328 g003
Figure 4. Long-term variations of annual precipitation (unit: mm, dark blue lines) and temperature (unit: °C, red lines) of the selected basins during 1951–2013.
Water 11 01328 g004
Figure 5. Variation of annual runoff (unit: mm, black dotted line) at hydrometric stations in the Yellow River basin and their 5-year moving average (green solid line) and linear trend line (red dash line).
Water 11 01328 g005
Figure 6. Relationship of annual runoff (mm) and areal average precipitation (mm) for the six catchments.
Water 11 01328 g006
Figure 7. Monthly simulated and observed discharge (a) for 1965–1975 at Hongqi station of the Tao River catchment and (b) for 1957–1975 at Pianguan station of the Pianguan River catchment.
Water 11 01328 g007
Figure 8. Annual simulated (by using XAJ model) and observed runoff (mm) at selected hydrometric stations in Yellow River basin.
Water 11 01328 g008
Figure 9. Relationship of monthly runoff (mm) against areal average precipitation (mm) for the six catchments.
Water 11 01328 g009
Figure 10. Monthly simulated and observed discharge (a) at Hongqi station of the Tao River catchment and (b) Pianguan station of the Pianguan River catchment for 2000–2013.
Water 11 01328 g010
Figure 11. Comparison of NSEs calculated by monthly observed and simulated discharge before 1975 and 2000–2013.
Water 11 01328 g011
Table 1. Information of 4 tributary catchments and 2 key stations of the Yellow River basin.
RiverStationsDrainage Area/km2Discharge SeriesPrecipitation/mmRunoff/mmAnnual Average Temperature/°C
Upper Yellow RiverTangnaihai121,9731956–2013507.9166.9−4.9
Tao RiverHongqi24,9731955–2015547.2180.60.2
Pianguan RiverPianguan18961951–2013425.314.74.3
Sanchuan RiverHoudacheng41051957–2015487.151.17.0
Yellow RiverHuayuankou730,0361951–2013437.856.75.1
Dawen RiverDaicunba82641958–2015870.973.913.9
Table 2. Trend test of annual precipitation and temperature of selected typical basins at annual scale from 1951–2013.
River/BasinsHydrometric StationAnnual PrecipitationAnnual Temperature
S (mm/year)TrendUS (°C/year)TrendU
Dawen RiverDaicunba−1.031 −0.880.0174.18
Tao RiverHongqi−0.226 −0.050.0194.15
Sanchuan RiverHoudacheng−0.462 −0.410.0294.74
Yellow RiverHuayuankou−0.483 −0.720.0224.78
Pianguan RiverPianguan−0.433 −0.230.0223.7
Upper Yellow RiverTangnaihai0.703 1.80.0133.36
Table 3. Results of trends detection and abrupt change test for runoff series gauged at the six hydrometric stations.
RiverStationsUAbrupt Change YearStatisticsP-ValuePrevious Studies
Change YearReferences
Dawen RiverDaicunba−1.1919751.8667.78 × 10−21975[58]
Tao RiverHongqi−3.0219863.1683.50 × 10−31989[59]
Sanchuan RiverHoudacheng−3.601997−17.181.74 × 10−51995[58]
Yellow RiverHuayuankou−5.5719863.5055.02 × 10−31986[58]
Pianguan RiverPianguan−7.4119836.1661.30 × 10−71984[60]
Upper Yellow RiverTangnaihai−1.131990−3.4327.62 × 10−31990[61]
Table 4. Simulated monthly discharge by the four hydrological models for the calibration period ion results for monthly discharge in the Yellow River basin by using four hydrological models.
RiverStationCalibration
Period
NSE 1RE (%)
XAJGR4JSIMHYDWBMXAJGR4JSIMHYDWBM
Dawen RiverDaicunba1958–19680.827 0.870 0.709 0.703 −0.68 −0.36 −10.2 −6.73
Tao RiverHongqi1955–19650.849 0.852 0.779 0.732 −5.48 −5.46 −9.26 5.15
Sanchuan RiverHoudacheng1957–19670.814 0.754 0.747 0.728 −4.58 −9.63 1.64 −11.9
Yellow RiverHuayuankou1958–19680.665 0.5600.6470.752−7.57 −7.60−9.350.10
Pianguan RiverPianguan1957–19670.838 0.7290.7990.812−4.11 −9.27−2.13−10.9
Upper Yellow RiverTangnaihai1956–19660.834 0.7250.7380.7354.80 −0.55−6.95−2.02
1 NSEs are calculated by monthly observed and simulated discharges, so are the NSEs in the following tables.
Table 5. Simulated monthly discharge by the four hydrological models for the verification period.
RiverStationVerification
Period
NSERE (%)
XAJGR4JSIMHYDWBMXAJGR4JSIMHYDWBM
Dawen RiverDaicunba1969–19750.784 0.7500.638 0.696 9.009.17−13.9 15.4
Tao RiverHongqi1966–19750.915 0.8830.828 0.781 4.7211.6 5.17 11.0
Sanchuan RiverHoudacheng1968–19750.816 0.7820.764 0.714 7.47−14.9 6.79 −10.9
Yellow RiverHuayuankou1969–19750.555 0.5990.529 0.686 16.98.54 13.1 23.3
Pianguan RiverPianguan1968–19750.815 0.7880.713 0.834 −8.48 −16.1 15.6 −16.7
Upper Yellow RiverTangnaihai1967–19750.781 0.7180.705 0.739 8.300.33 8.81 −2.45
Table 6. Simulated monthly discharge by the four hydrological models for the calibration period under changing environments.
RiverStationCalibration PeriodNSERE (%)
XAJGR4JSIMHYDWBMXAJGR4JSIMHYDWBM
Dawen RiverDaicunba2000–20100.748 0.726 0.544 0.486 −3.42 16.8 35.1 8.06
Tao RiverHongqi2000–20100.661 0.652 0.705 0.409 −11.8 −6.61 −1.26 4.16
Sanchuan RiverHoudacheng2000–20100.341 0.199 0.416 0.490 −14.6 −28.7 −3.40 4.25
Yellow RiverHuayuankou2000–20100.065 −0.885 0.099 0.217 −3.15 −28.4 0.35 0.46
Pianguan RiverPianguan2000–20100.293 0.271 0.352 0.265 4.16 12.2 −19.6 −25.9
Upper Yellow RiverTangnaihai2000–20100.824 0.818 0.761 0.776 −10.9 −6.700.27 −0.87
Table 7. Simulated monthly discharge by the four hydrological models for the verification period under changing environments.
RiverStationVerification PeriodNSERE (%)
XAJGR4JSIMHYDWBMXAJGR4JSIMHYDWBM
Dawen RiverDaicunba2011–20130.701 0.719 0.465 0.558 −10.5 −1.57 27.9 −11.0
Tao RiverHongqi2011–20130.794 0.740 0.695 0.495 −11.3 8.42 −17.9 −16.4
Sanchuan RiverHoudacheng2011–20130.549 0.560 0.005 0.640 −34.2 −18.3 −59.8 −9.25
Yellow RiverHuayuankou2011–2013−0.359 −1.99 -0.270 0.170 −29.5 −9.52 −31.3 −22.1
Pianguan RiverPianguan2011–2013v3.27 v1.32 −1.89 0.264 296 157 213 193
Upper Yellow RiverTangnaihai2011–20130.791 0.832 0.778 0.769 −18.8 13.3 −15.0 −11.2

