A Time-Integrated Index for Flood Risk to Resistance Capacity
by
 , , and
Osvaldo M. Rezende
1,* ,
,
Luciana F. Guimarães
2,
Francis M. Miranda
1,
Assed N. Haddad
1,3 and
Marcelo G. Miguez
1,2,3,4,* 1
Programa de Engenharia Ambiental—PEA-POLI-EQ/UFRJ, Rio de Janeiro 21941-909, Brazil
2
Programa de Engenharia Civil—PEC-COPPE/UFRJ, Rio de Janeiro 21941-450, Brazil
3
Escola Politécnica—POLI/UFRJ, Rio de Janeiro 21941-909, Brazil
4
Programa de Engenharia Urbana—PEU-POLI/UFRJ, Rio de Janeiro 21941-909, Brazil
*
Authors to whom correspondence should be addressed.
Water 2019, 11(7), 1321; https://doi.org/10.3390/w11071321
Submission received: 1 May 2019
/
Revised: 21 May 2019
/
Accepted: 4 June 2019
/
Published: 26 June 2019
(This article belongs to the Special Issue Future Challenges in Flood Defence Design and Management)
Abstract
:The lack of open spaces and the intense land use occupation in flood plains makes floods in consolidated urban areas difficult to mitigate. In these areas, setting a standard pre-defined return period for projects can limit and even preclude flood mitigation actions. However, it is possible to propose flood control alternatives that are compatible with available spaces. Thus, determining how much the original risk is reduced and how significant the residual risk can be becomes the main target. In this context, a time-integrated index for risk to resistance capacity is proposed to address these questions. This index correlates the exposure of buildings and urban infrastructure to the hazard of a given flood and is then evaluated over a project horizon through a sequence of events. The proposed index is applied to the Canal do Mangue catchment, a highly urbanized watershed located in Rio de Janeiro. The results demonstrate the difficulty of designing flood mitigation measures in extremely occupied watersheds and the importance of evaluating residual risks associated with proposed projects. As an additional result, a scenario with concentrated measures is compared to another with distributed interventions, evidencing the greater coverage of the latter.
1. Introduction
Historically, the problem of urban floods has often been treated as a direct consequence of excess rainfall without necessarily considering the functioning of the river watershed as an interrelated and interdependent system. This approach led engineers to seek local solutions, generally focused on the readjustment of the drainage network, primarily by increasing the size of existing galleries and channeling and rectifying the macro drainage system in order to accelerate the stormwater discharge away from the intervention site [1]. In this line, the improvement of the urban drainage network has the objective of ensuring that no area of the city suffers from flooding during hydrological events with a return period equal or lower than the design storm [2]. This logic pointed in the direction of increasing the city’s resistance against floods.
Over time, simply adapting network dimensions to the new drainage conditions has become a problem due to the need for increasing areas in an urban environment that was already densely occupied. This context led to the need for another more comprehensive and systemic approach, capable of providing sustainability for the process of urban flood control. Thus, this view has emerged as a break from the old paradigm and has established that drainage systems should be designed to minimize the impacts of urbanization on natural flow patterns, considering quantitative and qualitative aspects, to achieve technical, social, economic and political goals without transferring costs in time and space [3].
The urban planning approaches for storm water management systems were developed based on specificities and the main focus [4] from the Best Management Practices (BMP) [5], the Sustainable Urban Drainage Systems (SUDS) [1,6] and the Low Impact Development (LID) [7] to a more comprehensive conception, based on the Water Sensitive Urban Design (WSUD) [8] and the Green Infrastructure (GI) [9]. Fletcher et al. [4] summarized the history, scope, application and underlying principles of these concepts.
Under this new perspective, urban drainage projects, in theory and whenever possible, should neutralize the effects of urbanization and restore the pre-urbanization hydrological conditions, providing a better temporal and spatial coverage of flood control projects.
These projects start from a diagnosis of the current situation, identifying the most vulnerable areas or those with greater risks of flooding, and then evaluate different interventions to reduce these risks, considering a design storm. In the Brazilian case, for instance, the return period usually adopted to design drainage interventions, as recommended by the Federal Government, is 25 years. The solution to be implemented will correspond to the intervention with the greatest benefit, that is the one that presents the lowest cost–risk reduction ratio. However, the system often does not go through an integrated assessment, which does not allow for observation of the actual behaviour of the watershed after the implantation of the structures. When the interventions are based on high concentrated measures, they still rely heavily on an efficient drainage network with high hydraulic conduction capacity, leaving some areas exposed to the negative impacts of the acceleration of the flows. In some cases, the network does not receive improvement and reconditioning investments, which are limited by the huge cost of implementing large reservoirs, resulting in an inefficient system in which rainwater does not reach storage sites. This situation can leave the catchment more vulnerable to frequent flooding, discrediting the population of technical solutions for flood control. Therefore, recognizing the impact of floods means that risk assessment is an important step for storm water management [10]. In this direction, to achieve such results, throughout the world, there has been a change in the strategy of defense against floods with the floods risk management (FRM) approach [11].
In the field of engineering, risk is the combination of the probability of the occurrence of an event and the expected consequences caused by it. The consequences depend on the exposure, the vulnerability and the resilience of the system. Resilience can be defined as the capacity to resist, respond to, recover from and adapt to the flood impact and reach sustainability over time [12]. It is important to note that the level of risk is not static and can be altered by changes in the natural system or by human interventions [13].
The acceptance that hydraulic systems have a limit of protection means that absolute protection against flood risks is impossible [14] and that decisions should be based on acceptable residual risk [13,15,16]. This approach assumes that urban systems will be subject to impacts from flood events regardless of the measures taken to eliminate them. In addition to possible structural failures and the occurrence of events of magnitude greater than the design event, changes in patterns of hydrological variability may still occur, with flood control infrastructure no longer being reliable to mitigate flood problems in the face of uncertainties related to climate change [17,18]. Therefore, the residual risk can be understood as the risk due to the failure of the structural system or to the occurrence of a flood exceeding the one considered in the design phase [19].
Measures to protect urban areas reduce flood risks; however, they still maintain an increased risk associated with their failure. Thus, risk reduction owing to the implementation of structural measures will be a result of the current risk minus the project risk plus the increment due to failures. The non-recognition of this residual risk can induce increased exposure of people and goods due to the false perception of risk. This explains why investigating residual risk, risk perception and resilience receives attention in flood risk assessment literature [15,20,21,22].
Summing up, when designing project alternatives for flood control, it is usual to define a return period of reference, aiming to give a certain protection to the city and its population. However, it can be very difficult to reach the desired safety level in dense urban environments.
The urbanization process itself occurs in different ways depending on local land use policies and the capacity to order urban growth. Floods in consolidated urban areas may be difficult to mitigate due to the lack of open spaces and the intense land use occupation in flood plains, restricting the possibility of providing storage areas or working on improving channel conveyance. Therefore, projects that meet a pre-defined return period standard can be prohibitive due to the need of relocating people and infrastructures already implemented. In this context, it is possible to propose flood control alternatives that mitigate the flooding effects as much as possible using the available spaces and channel network capacity. Thus, it is important to determine how much the original risk is reduced and how significant the remaining risk is.
In this context, the use of indicators and the formulation of flood risk indexes have been developed, aiming to better support the decision-making process [23]. An index allows synthesizing large amounts of data, comparing scenarios as well facilitating communication between policy makers and the community. FRM related indexes can represent risk components [13] in an independent way as hazards [24], physical susceptibility [25,26], vulnerability [27,28] or combined, representing risk itself [29,30,31]. More recently, several studies have proposed methods to quantify resilience [10,21,23,32]. Chen and Leandro [33] have introduced a time-dependent method to quantify flood resilience, measuring both the capacity to withstand the impacts during the flooding and the ability to recover from the adverse effects.
This work intends to address this question, proposing a method for calculating the integrated flood risk of an urban watershed, considering a certain planning horizon. The integrated risk results will be obtained from an original and simplified flood risk index developed in this research and spatialized over the watershed. The proposed index will provide insights into one of the resilience components—the resistance capacity—through the correlation of the exposure of buildings and urban infrastructure with the potential flood damages, given by its maximum water depth. In addition to a spatial analysis, the proposed method allows the temporal evaluation of flood risk through multi-events rather than a single reference event.
To illustrate the proposed method, a highly dense urban catchment localized in a central area of Rio de Janeiro City, Brazil will be analysed. Three alternatives for the urban drainage system will be simulated: “doing nothing”; concentrated measures; distributed measures. The integrated risk evaluation will be applied to each alternative, allowing for comparison between them.
2. Materials and Methods
The complexity of the processes involved in flood risk management and the need for a comparative assessment between different scenarios requires a method to construct an urban diagnosis that addresses aspects of flood risk. Several researchers suggest that an approach based on indicators can provide a comprehensive view of the vulnerability and resilience of a city or community [16,23,27,34,35]. In this Section, we present in detail the Risk to Resistance Capacity Index as well as the indicators that compose it.
2.1. Risk to Resistance Capacity Index—RCI
The RCI represents the resistance to damage according to the degree of exposure of the population and the existing assets in the watershed. It correlates the exposure of buildings and urban infrastructure to the potential damages of a given flood. For this reason, its formulation uses three indicators, which are: buildings exposure (Ibe); urban infrastructure exposure (Iie); and flood height (Ih). Equation (1) presents the mathematical expression for the index.
In Equation (1), , , , and are weights associated with each term. In the present phase of the research, the weighting process considered an equal value for all terms. The main goal here is to test the method, and refining the weights definition to reach a more representative value is not crucial. Further investigations can define the better weighting distribution.
Note that the summed parcels refer to the exposure, while the hazard, represented by the flood heights, is multiplied by the exposure. Thus, if there is no exposure or if there is no flooding, this index is nullified and the risk becomes non-existent.
The RCI development process has considered its easy application and potential for adaptation to other basins. Therefore, the amount of indicators necessary for its formulation was limited, always seeking commonly available information.
Although some hydrodynamic models are capable of calculating the flood velocity and permanence time, more simplified models do not provide this information. Thus, the index application would be conditioned to the use of more sophisticated models, which does not fit the objective of this study. Furthermore, flood heights histories are generally available for several basins and could be compared with the values obtained with the modelling, validating the results.
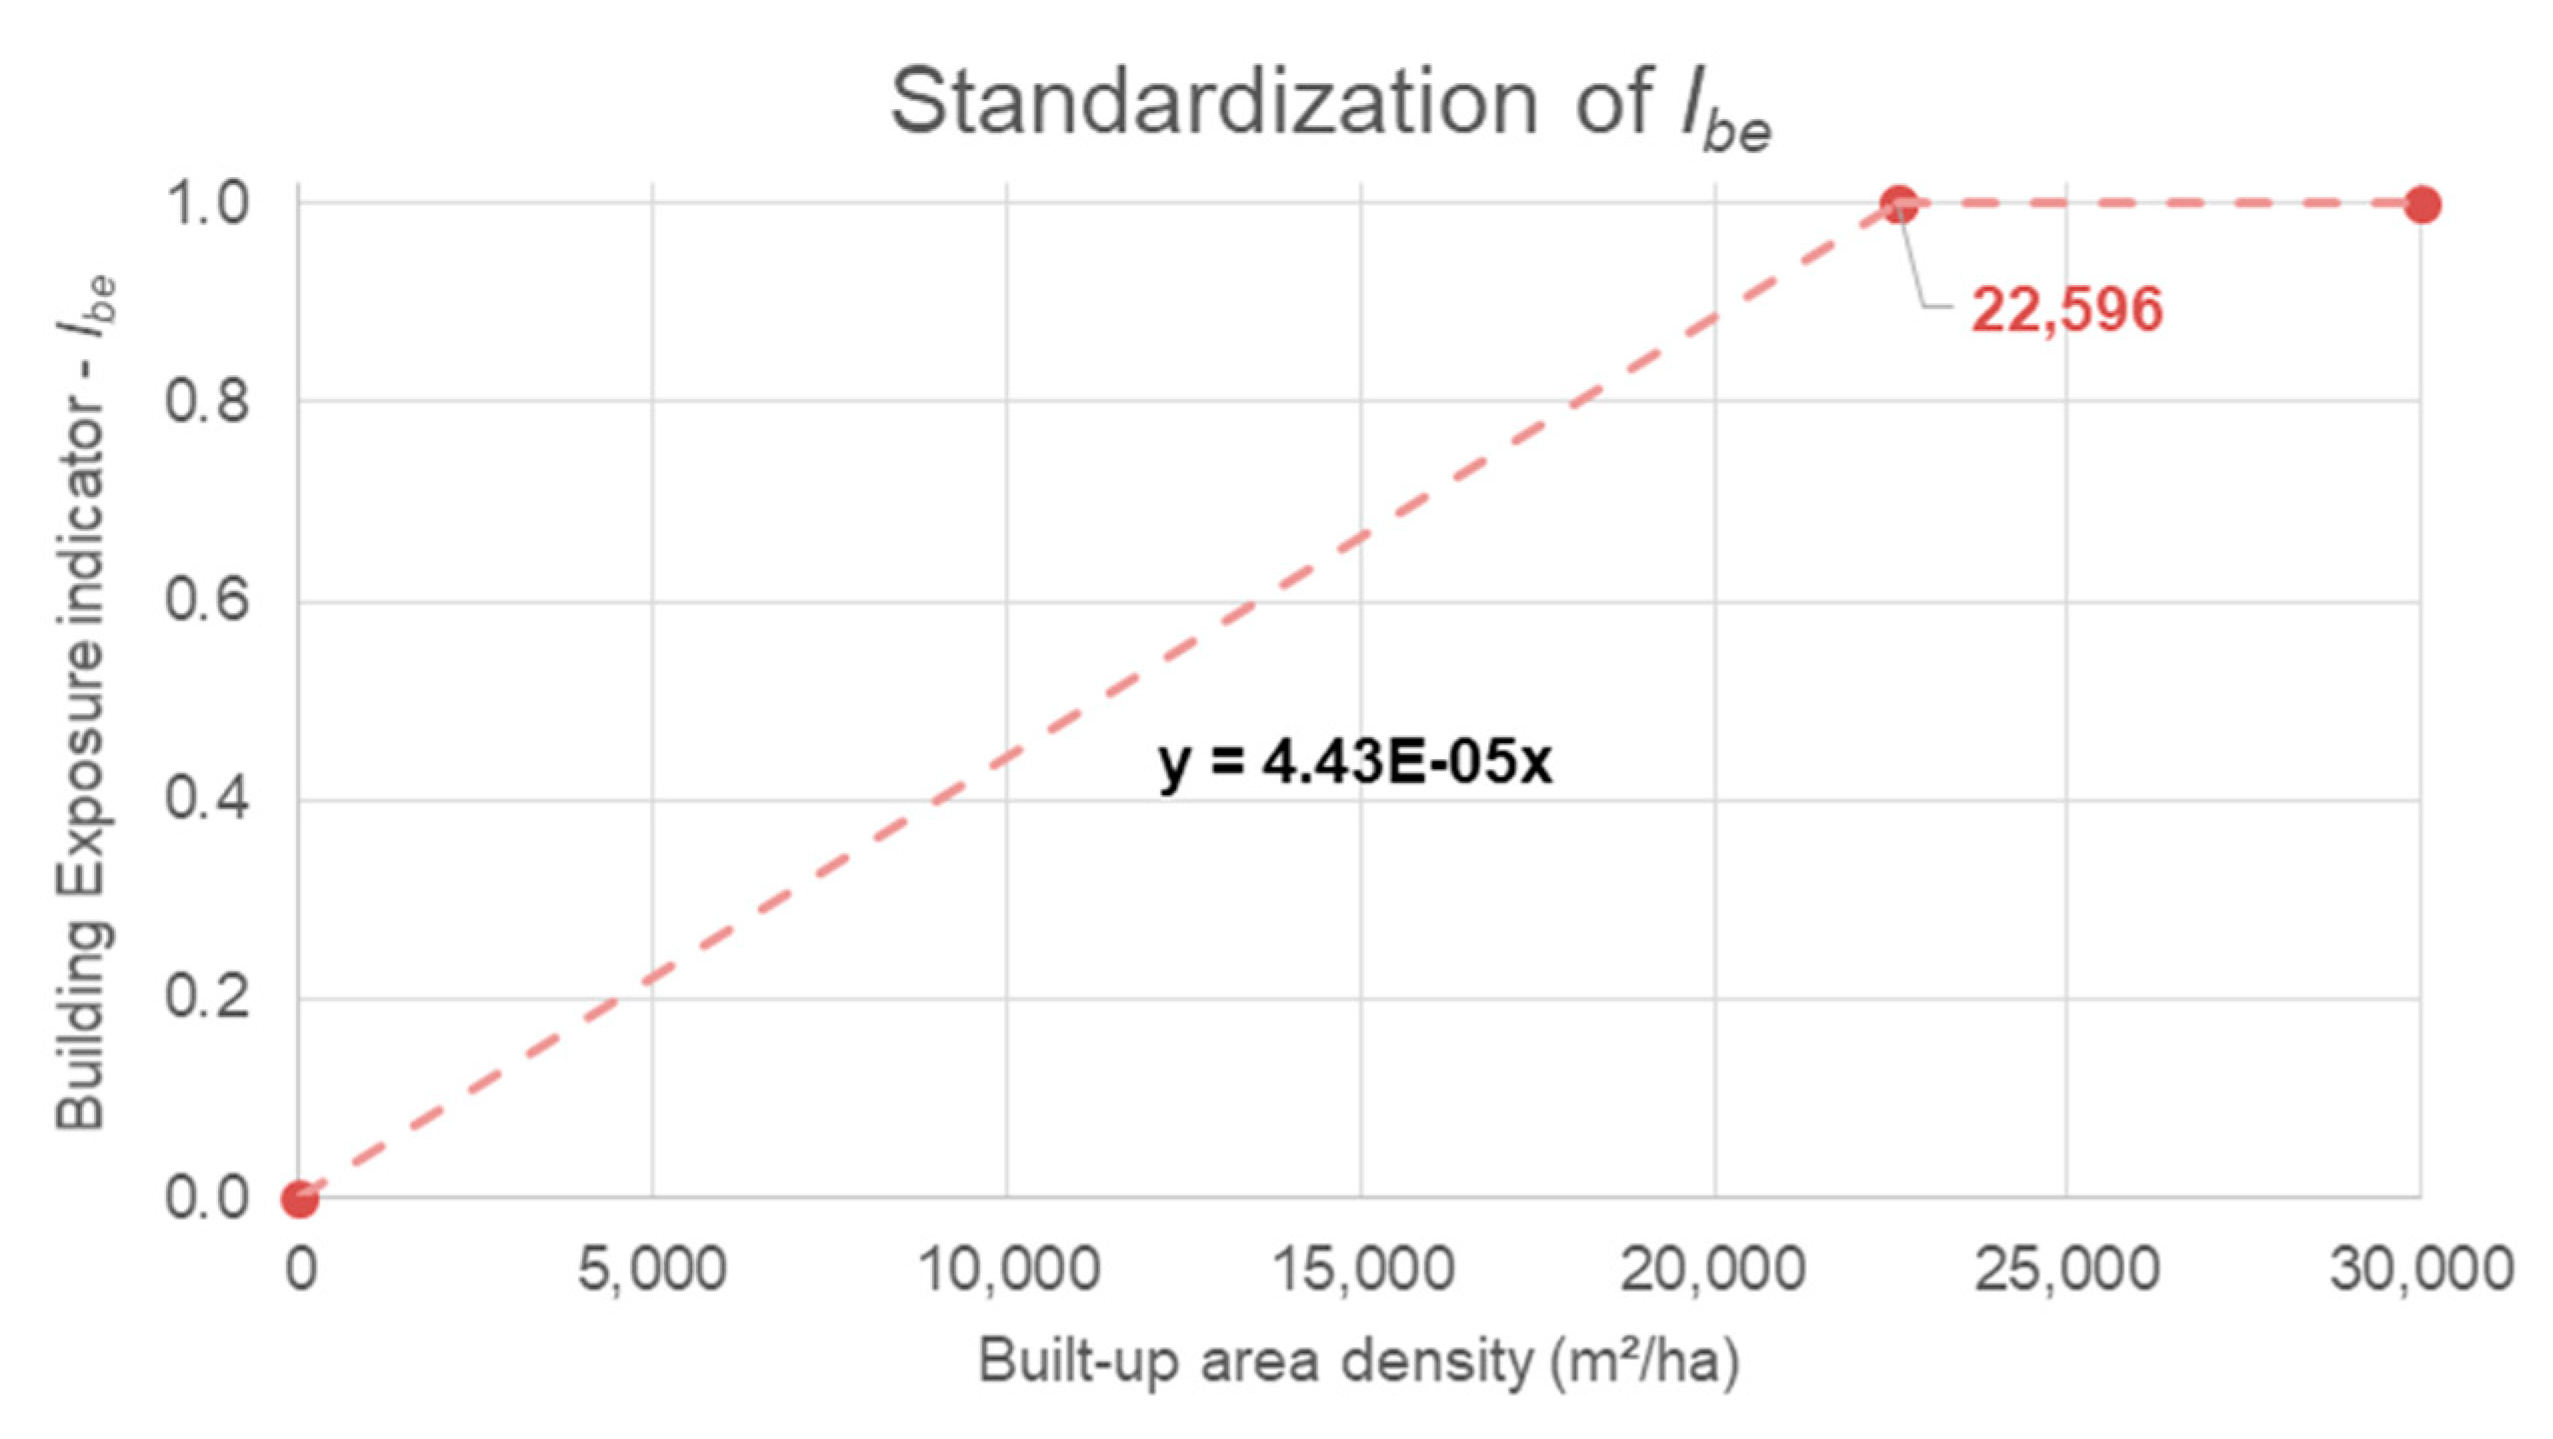
2.1.1. Ibe—Building Exposure Indicator
Represented by the density of the built-up area, in m2/ha, this indicator can indirectly estimate people’s exposure in a given area. When the density is higher, buildings are more vertical, indicating a higher people density, whether residential or commercial. To standardize the indicator, it was considered that the maximum exposure happens in the density value that refers to the third quartile of the whole sample. This method reduced possible flattening of the scale of evaluation due to the presence of extreme values. Other values were standardized by a linear function according to the graph presented in Figure 1, which shows the particular application in the Canal do Mangue catchment.
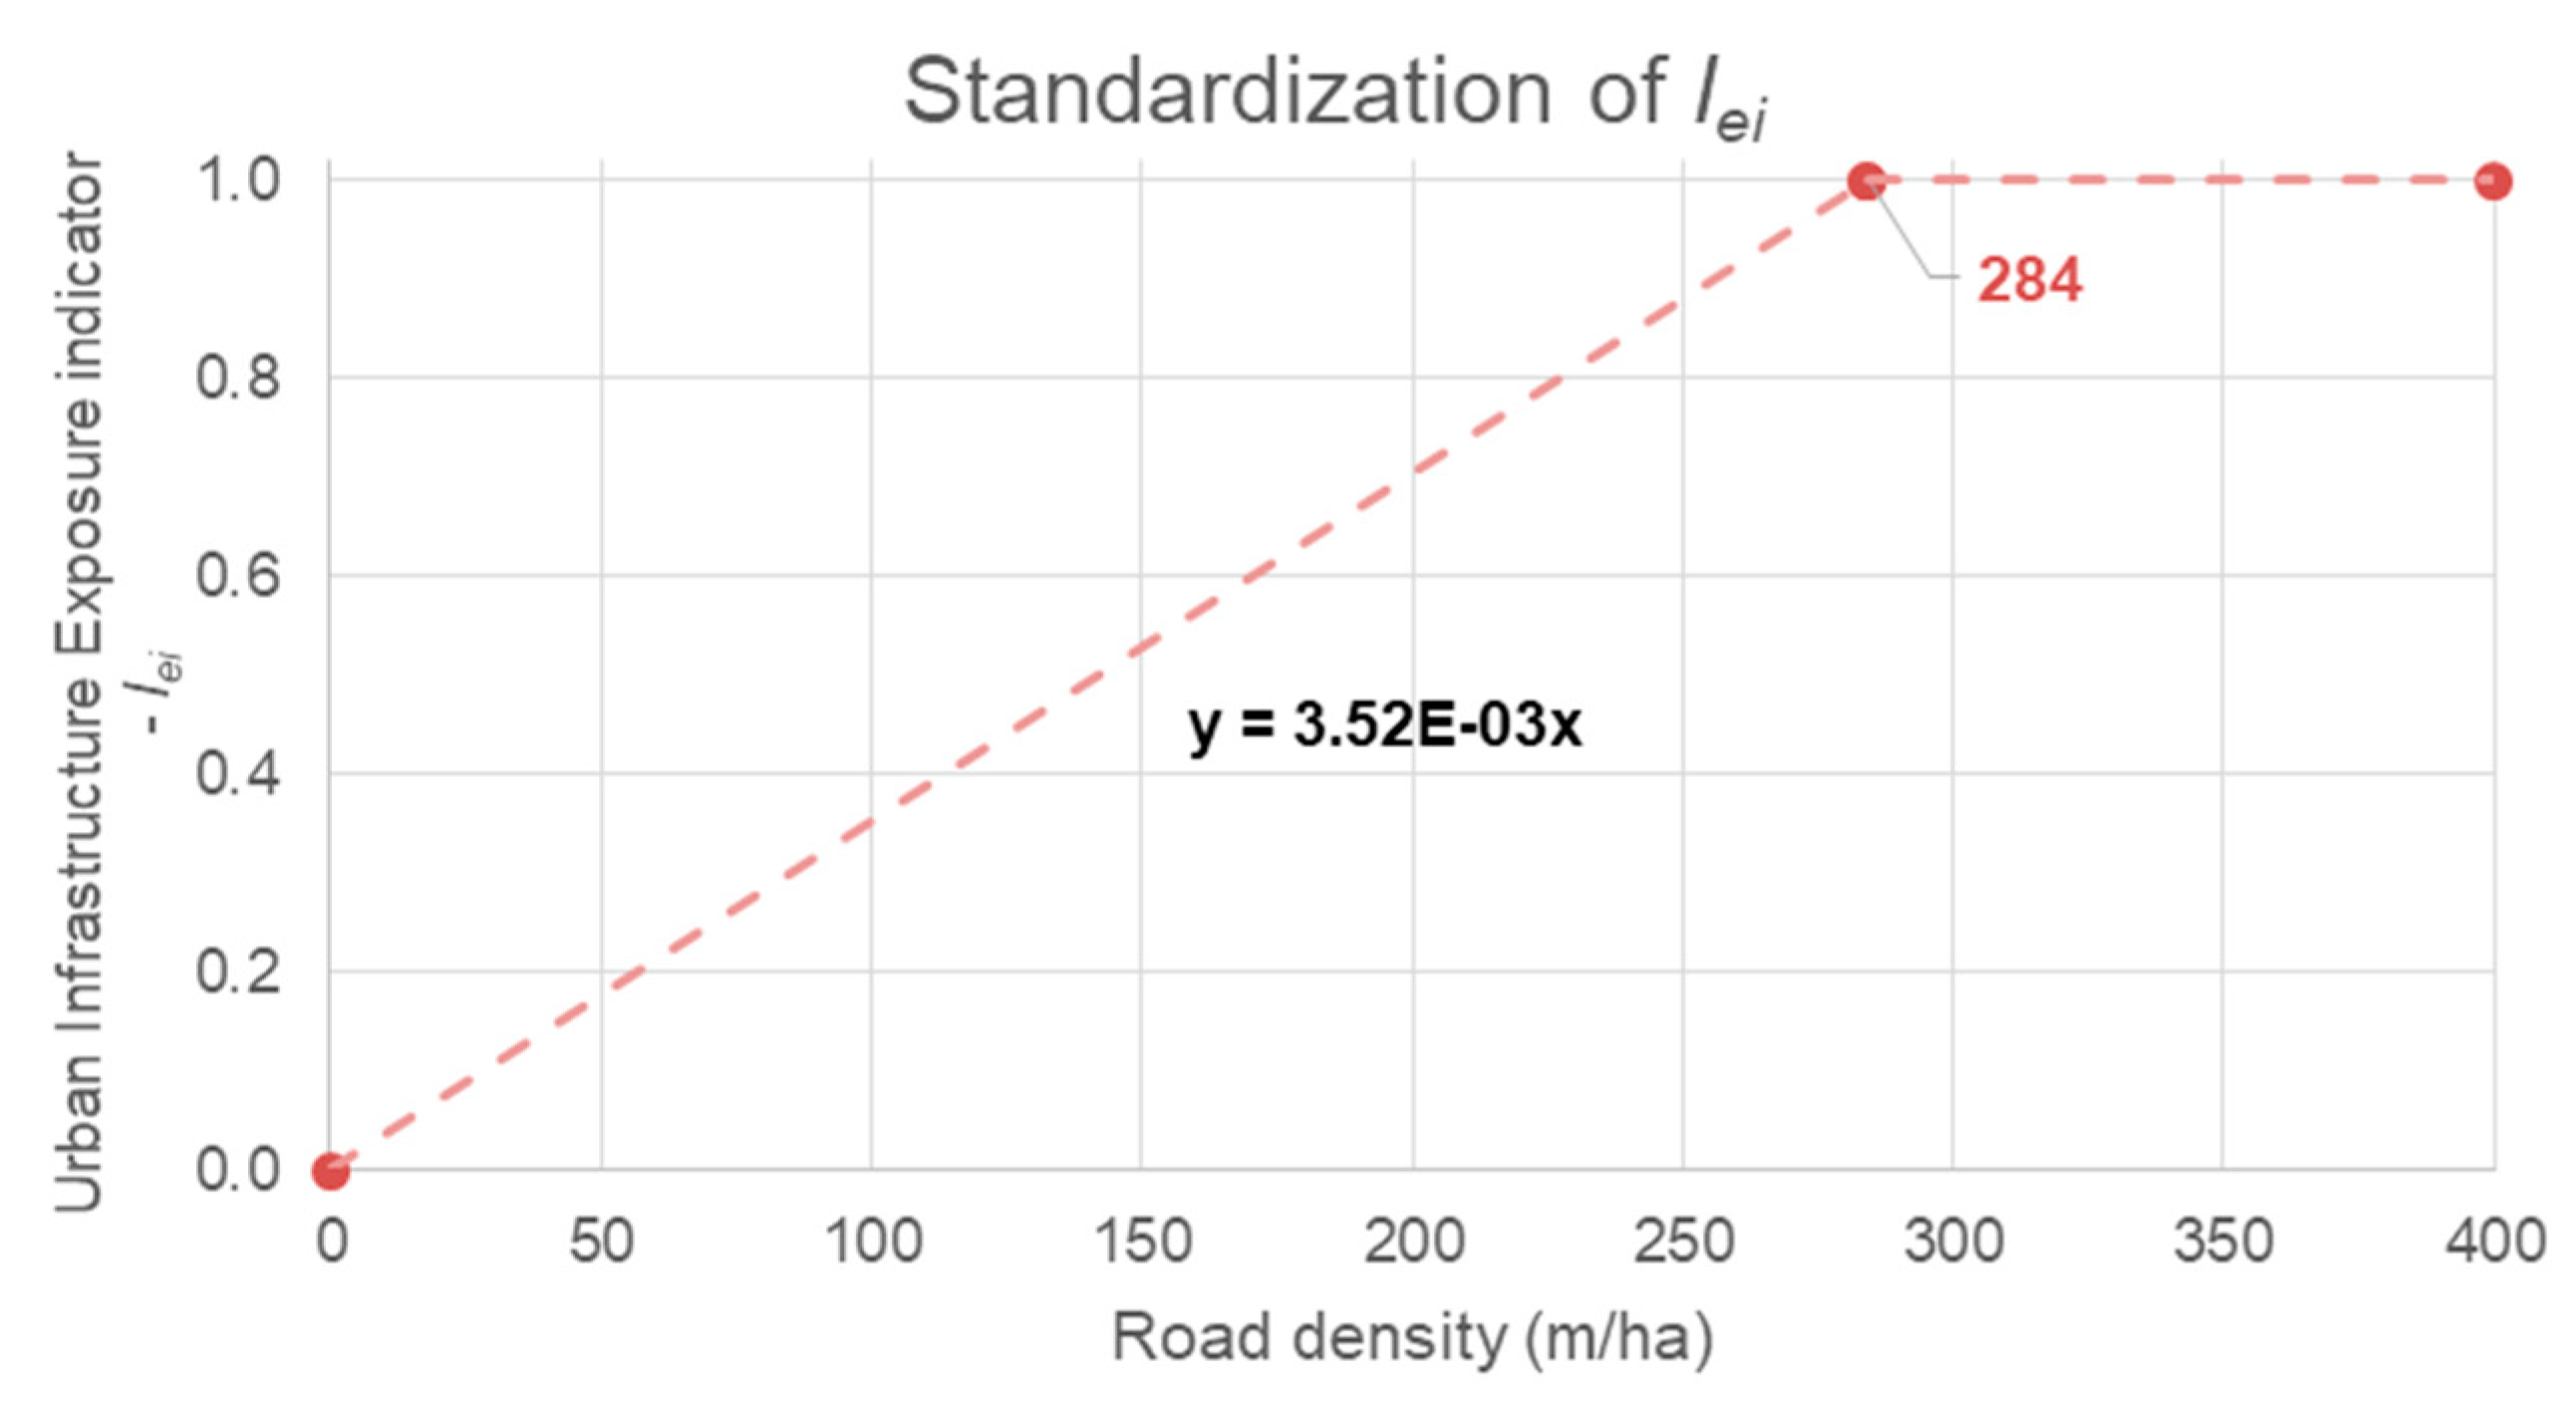
2.1.2. Iie—Urban Infrastructure Exposure Indicator
Represented by road density, in m/ha, this indicator is an indirect measure of urban infrastructure exposure in a given area. This means that the greater the density of the roads in a region, there will potentially be a greater coverage of infrastructure services, such as water supply, sewage, public lighting, communication services and others. Analogously to the Building Exposure indicator, the values were standardized for the application in the Canal do Mangue catchment considering the maximum exposure as the value of the third quartile of the sample, as shown in Figure 2. Therefore, it would be necessary to adapt standardization before using it in another study area.
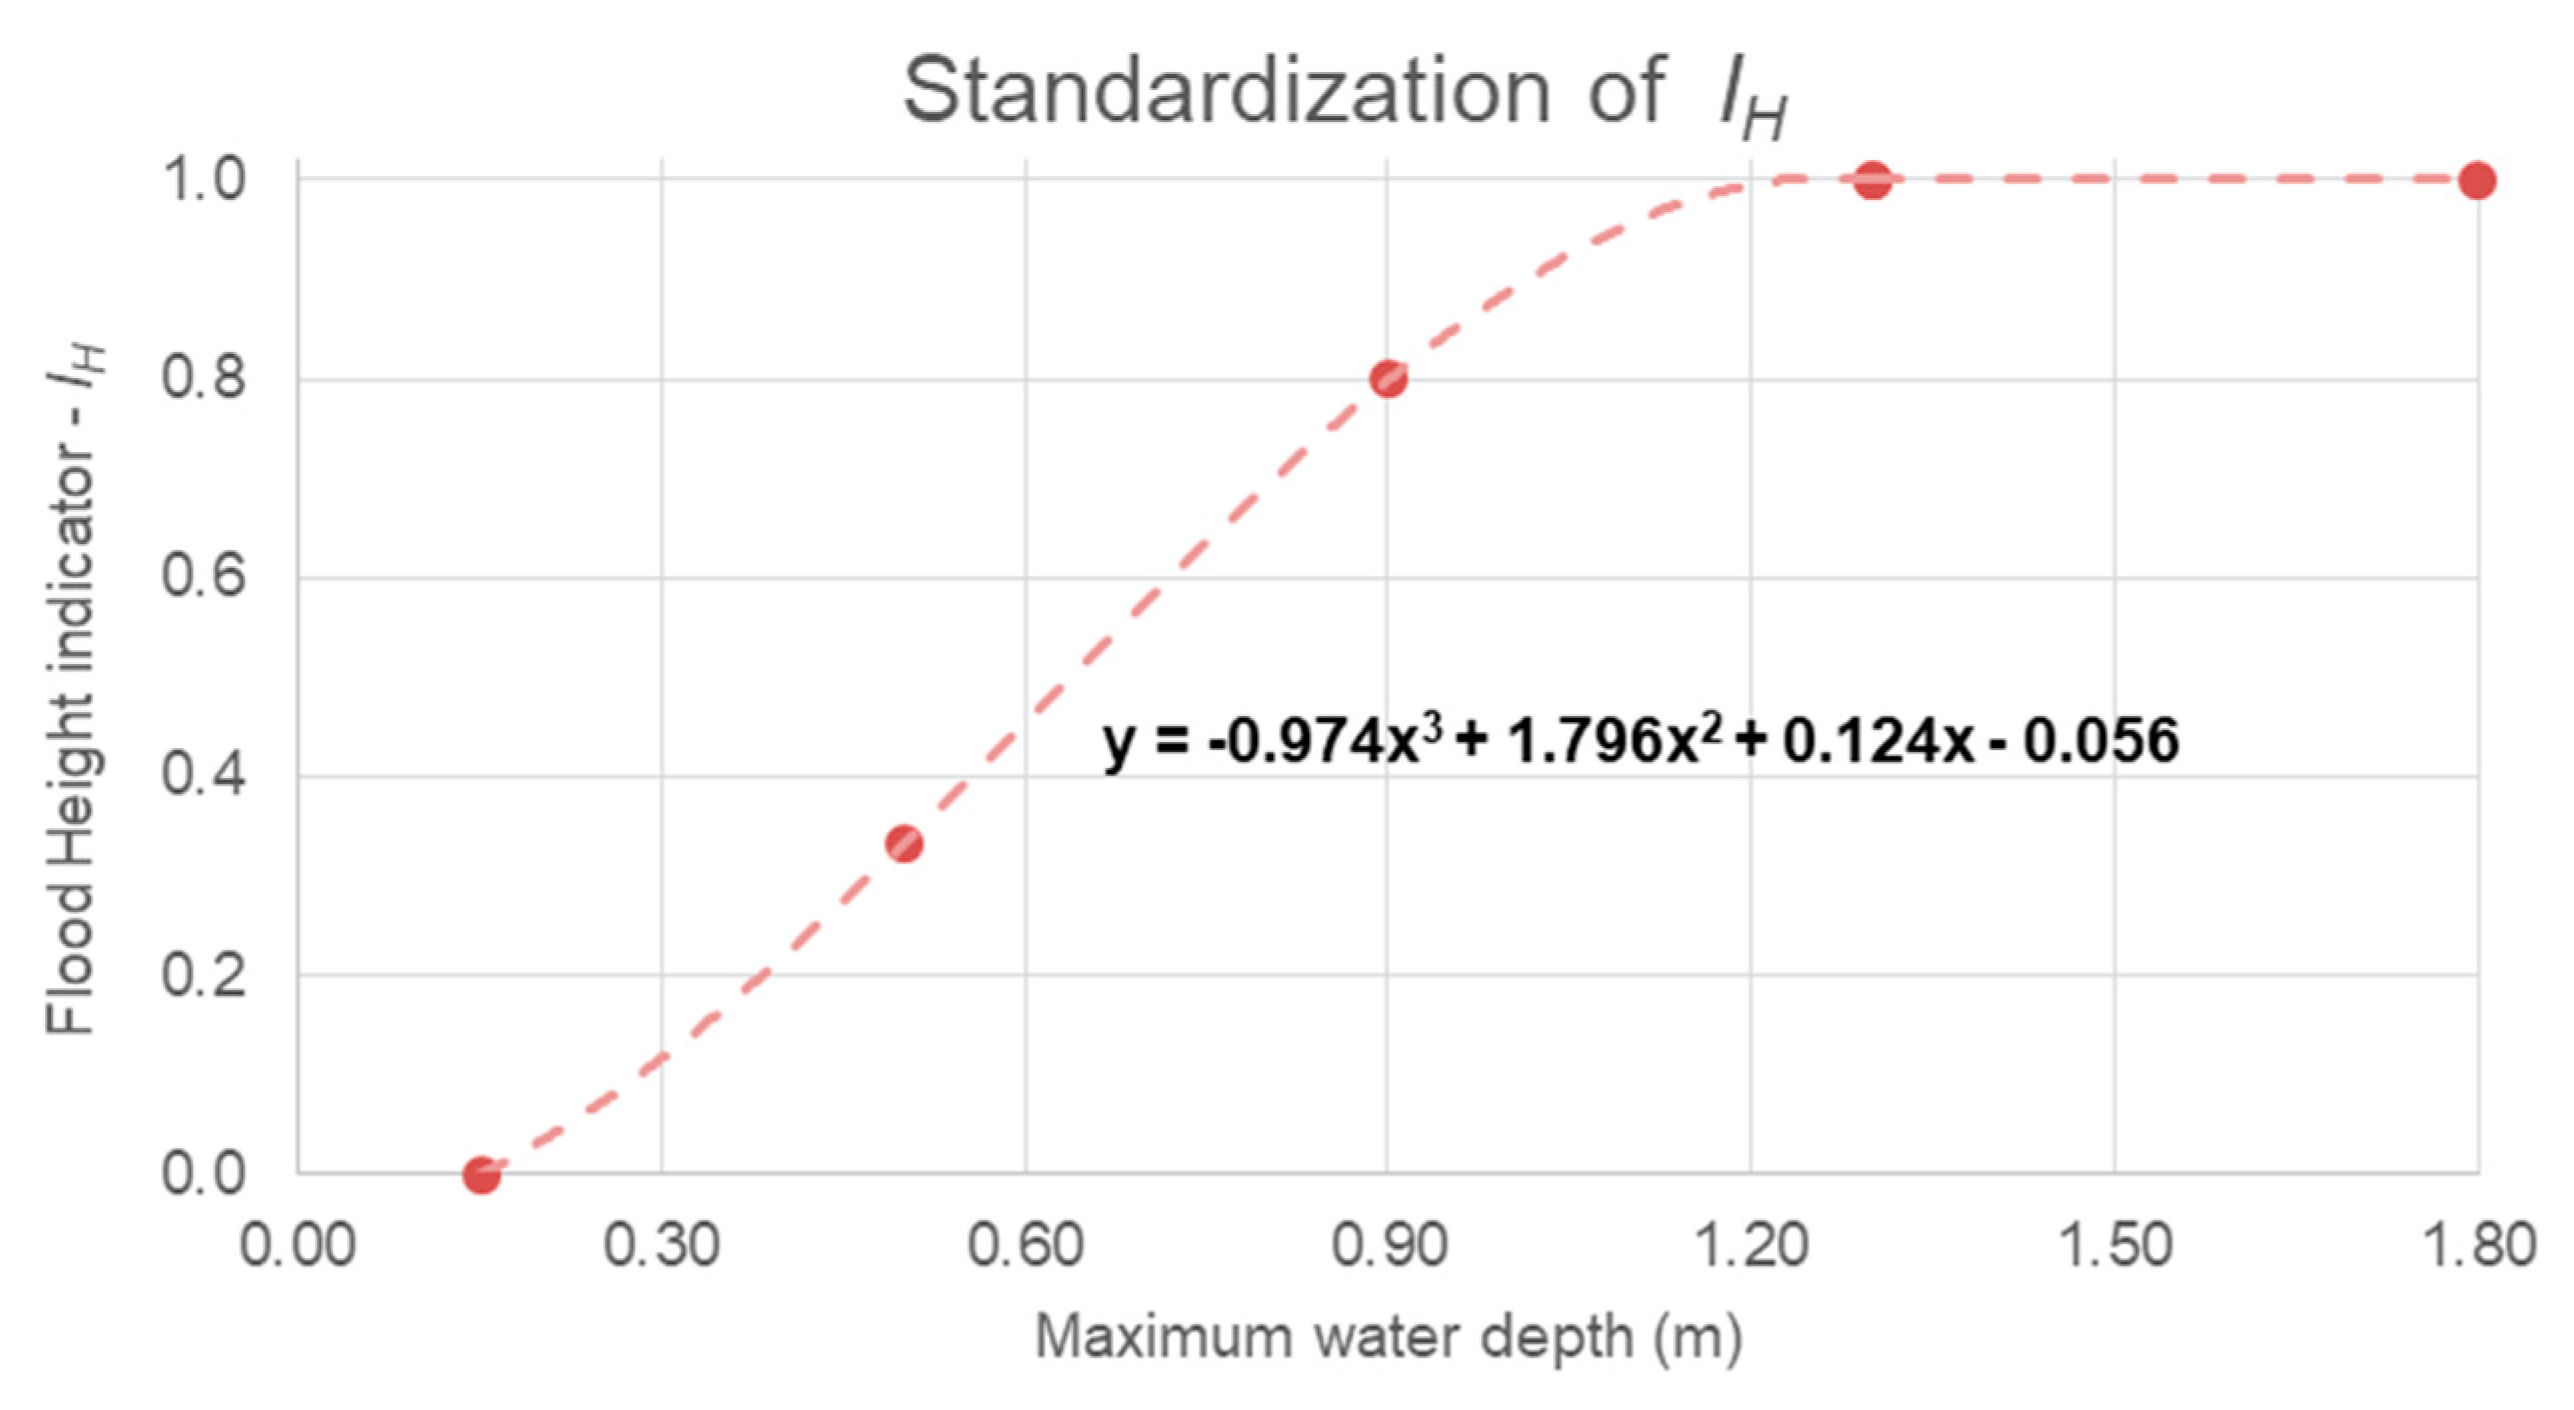
2.1.3. Ih—Flood Height Exposure Indicator
Represented by the maximum flood height, in the index, this indicator computes the parcel related to the potential damage associated with the flood event. This means that the indicator expresses the hazard. The greater the flood height, the greater the potential damage to goods and people exposed.
Flood Height indicator was also standardized by a reference height, adopted in this study as the value of 1.30 m, from which it is considered as the maximum potential damage, representing very significant damage. On the other hand, floods heights smaller than 0.15 m have no potential damage, resulting in a null value for the indicator. These values are adopted concerning local urban patterns.
The interval between these extreme values, which correspond to the maximum and minimum damages, are expressed as a polynomial curve, represented in the graph of Figure 3. When water levels are closer to the maximum damage, there is increased potential damage.
2.2. Risk to Resistance Capacity Index Integrated over Time
In order to obtain an index integrated over time, the first step is to define a project horizon for which the study is desired. Herein, a horizon of 50 years was adopted to score design alternatives, considering their capacity to maintain low flood risks over time [36].
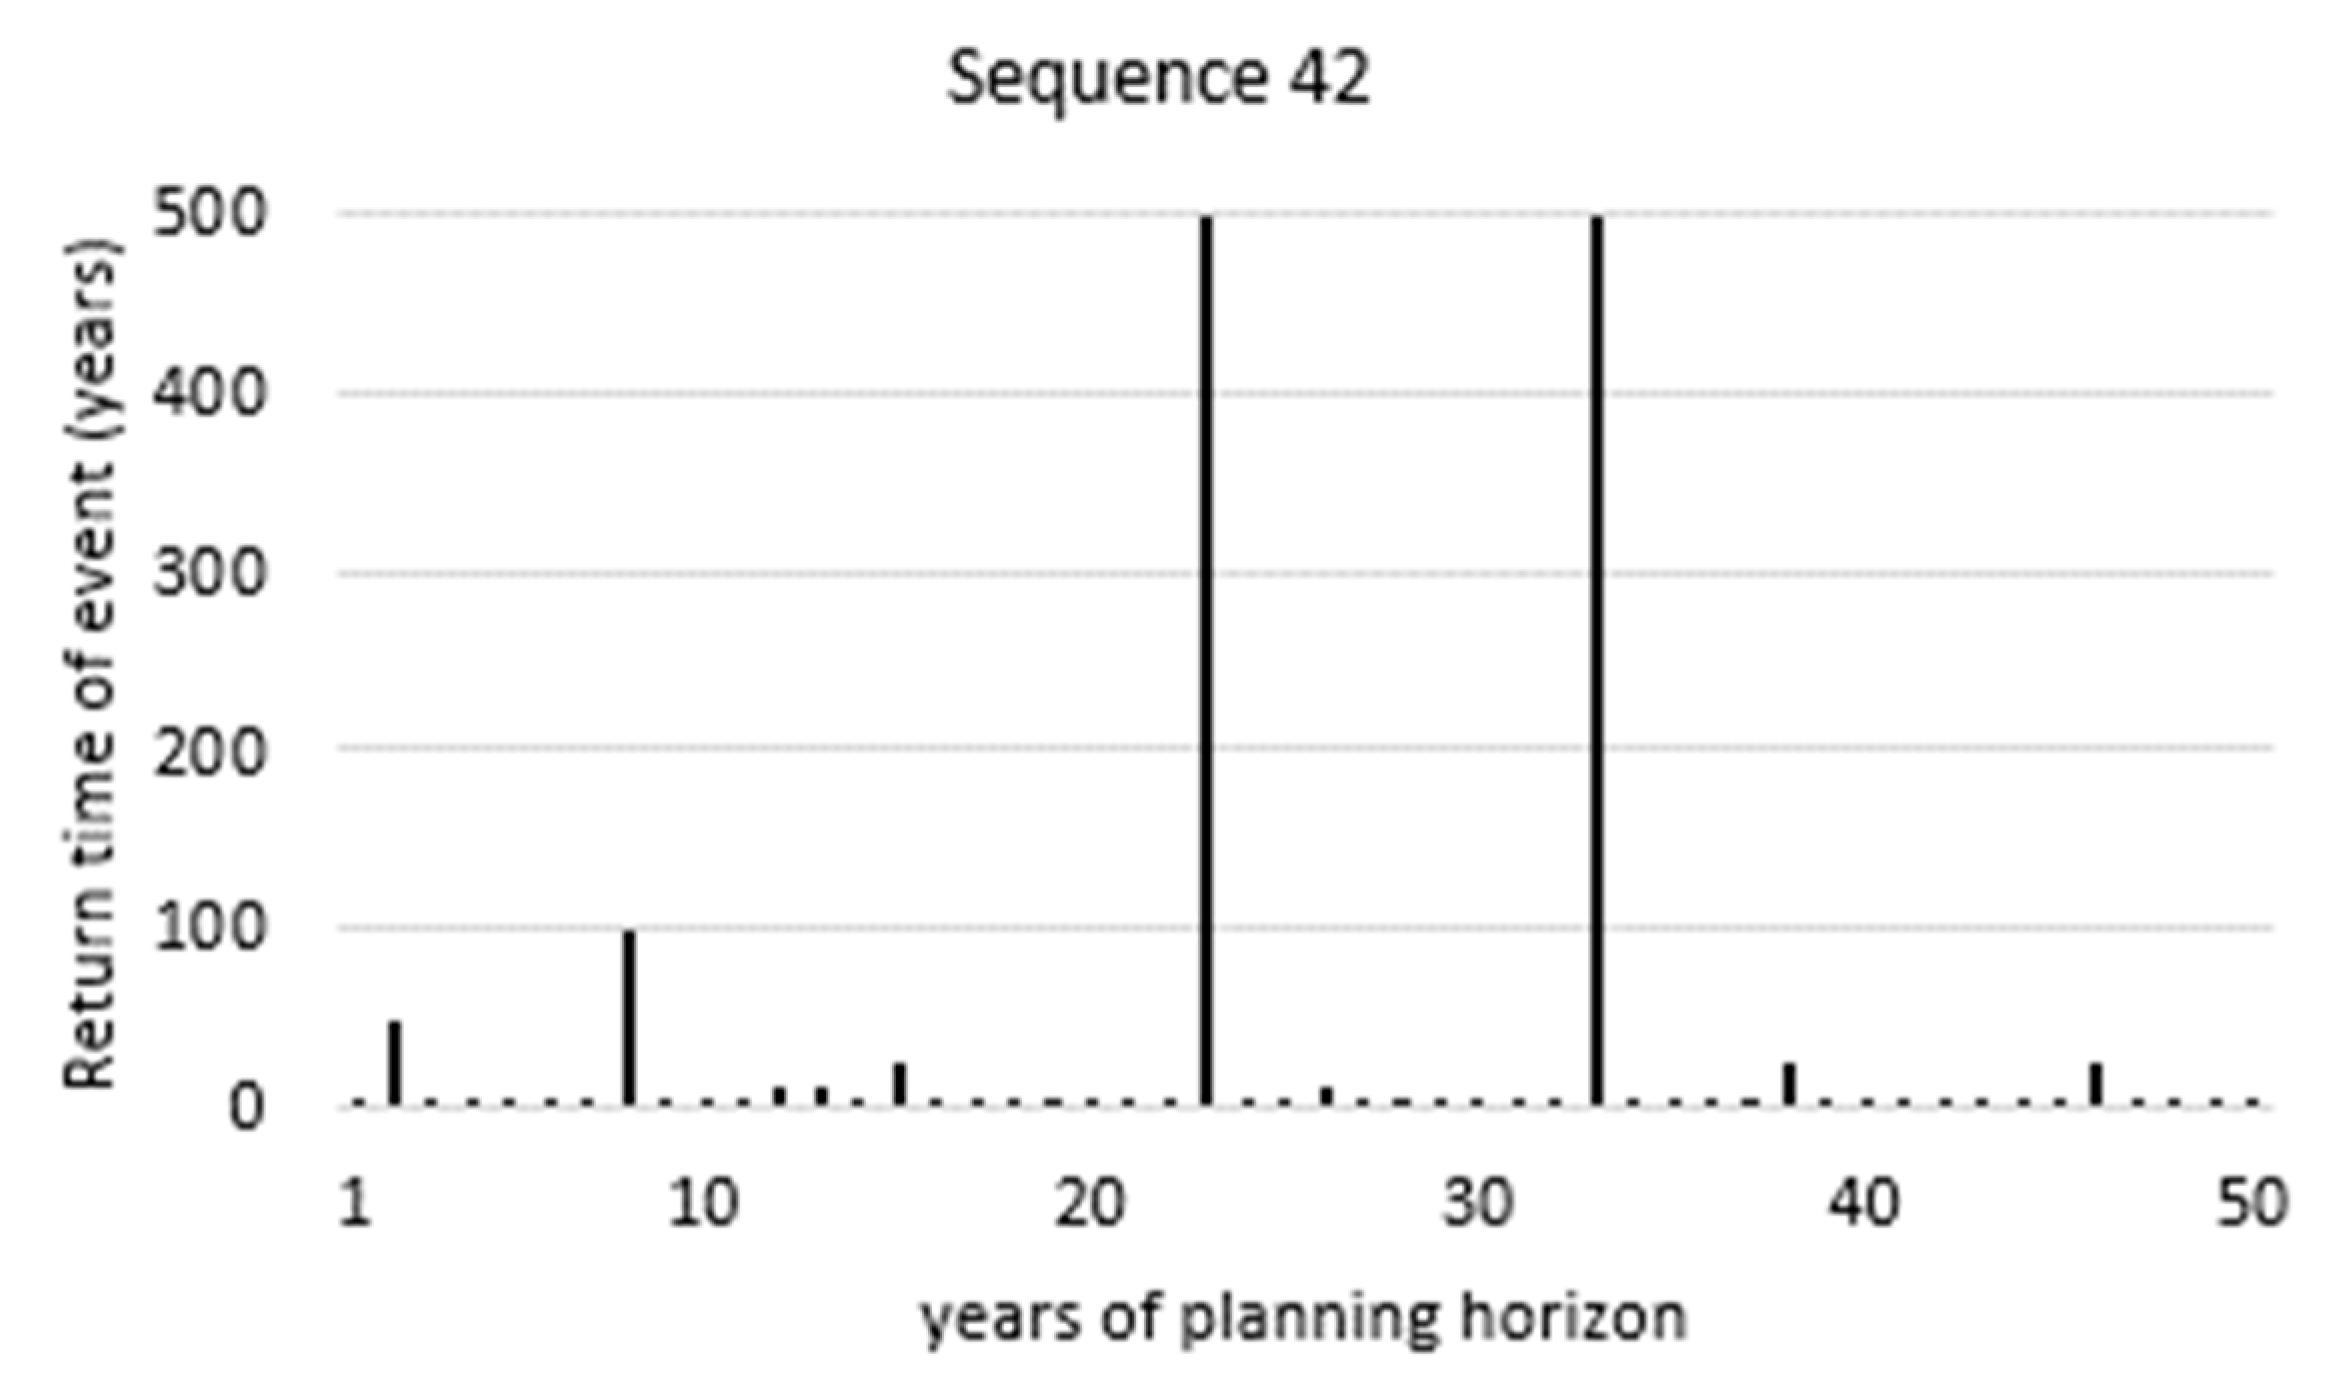
Afterwards, sequences of events were generated by random draws of return periods, based on their individual probabilities, to determine the worst rainfall in each year over the project horizon. As a methodological decision to restrict the number of combinations, the sample was limited to reference events, which, in this case, consisted of return periods equal to 1, 5, 10, 25, 50, 100, 500 and 1000 years. Figure 4 presents one example of the raffled sequences of events.
For the construction of a medium sequence, events were drawn to compose 10,000 sequences, which were organized according to the degree of criticality of the events. The ranking criteria adopted was the sum of the return periods over the project horizon. After that, the sequences were listed in increasing order of criticality. The middle third, composed of the sequences from 3333 to 6666, was used to establish a medium sequence. For this, we analysed the amount of events of each return period over the 50-year horizon and then calculated the averages of these amounts considering all the sequences of the middle third. Note that this procedure aims to determine how many events of each return period are most likely to occur over the project horizon. Thus, a single sequence was constructed considering these average amounts of events of each return period. This sequence corresponds to the probabilistic distribution and can be used to replace it. Therefore, it was appointed as a “medium sequence”. After defining this sequence of events, the Time-Integrated RCI was calculated for each cell (modelling unity) of the watershed domain, as presented in Equation (2).
where c is the cell identification and YPH refers to the number of years of the planning horizon (50, in this case). Therefore, the Time-Integrated RCIc corresponds to the average RCI over the project horizon for each cell.
2.3. Global Index for the Watershed
The index and the indicators presented in Section 2.1 and Section 2.2 were proposed spatially in the watershed, which makes the analysis quite interesting from the perspective of evaluating areas more vulnerable and more impacted by flood events. It is also important to identify areas that need intervention. However, in general, the spatial interpretation generates a difficulty for the comparison of projects’ efficiency, since the analysis tends to be visual.
For this reason, the authors proposed to complement the analysis, consolidating the results in a simple way into a single global value for the entire watershed. The global index (Equation (3)) was suggested as a weighted average of the RCI with the area to which it refers and it does not replace or discard the spatial evaluation of the results being used for a final comparative analysis.
where c is the cell identification, Ac the cell area and Aw the watershed area.
3. Case Study
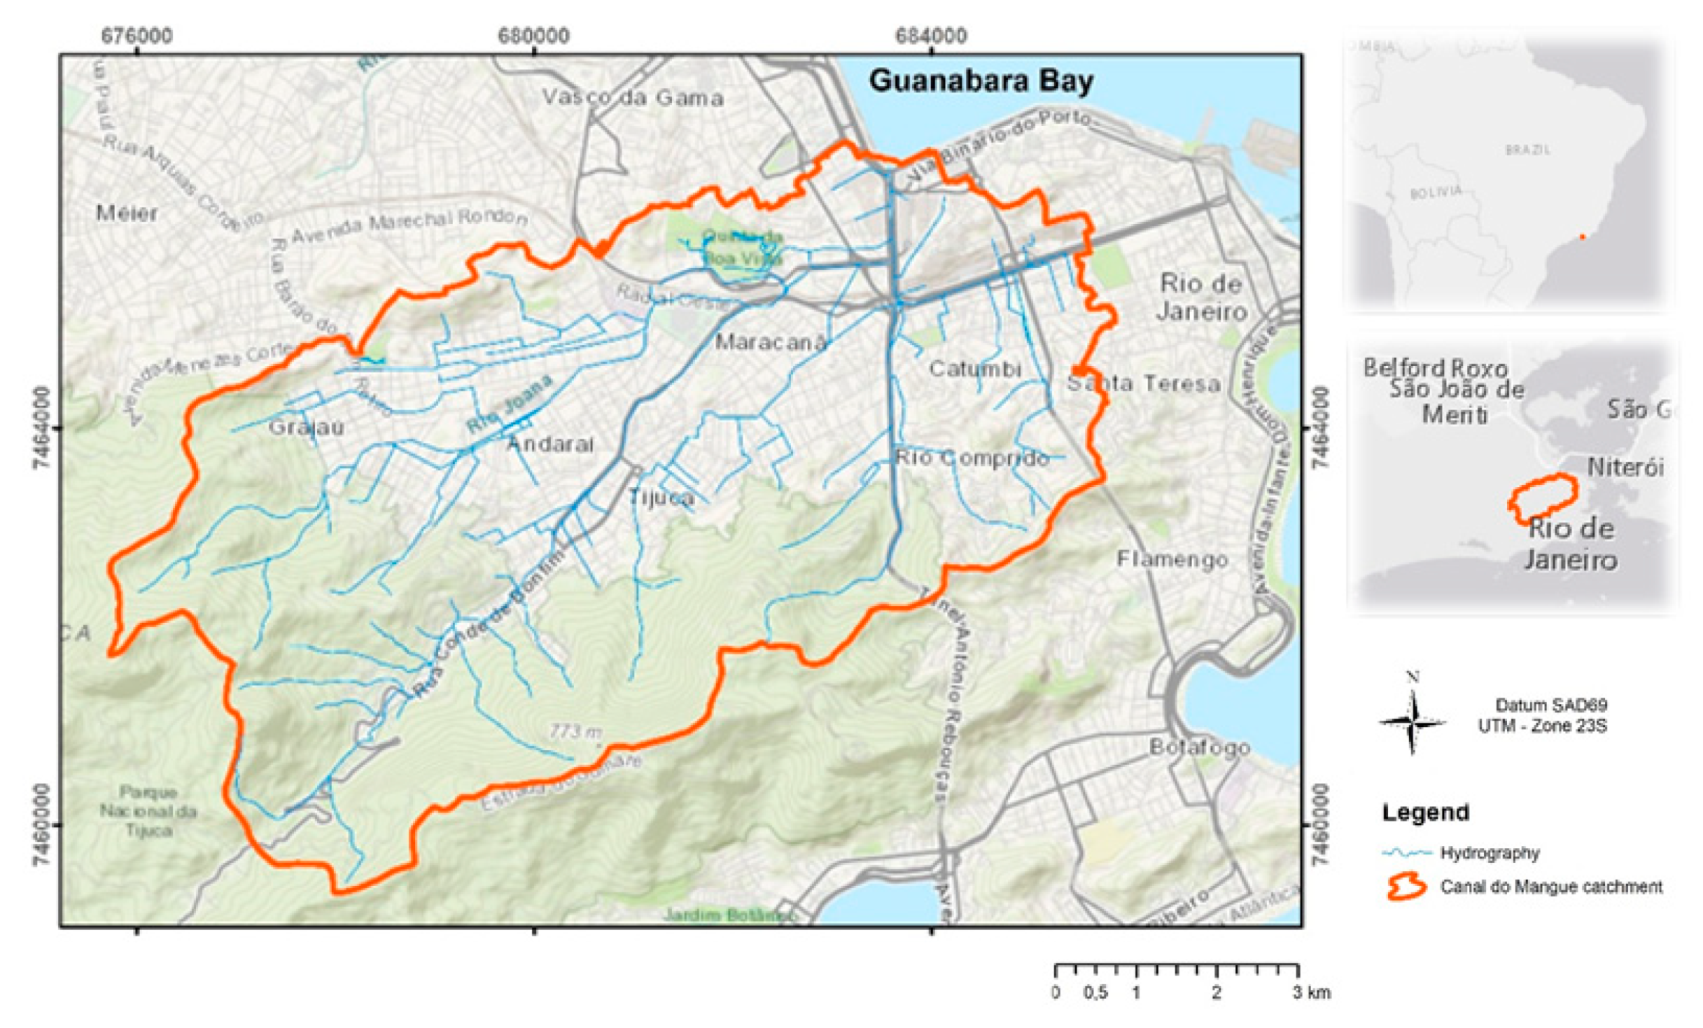
The Canal do Mangue catchment is located in the northern part of the city of Rio de Janeiro and has a drainage area of 45.4 km2, with discharge at Guanabara Bay, as presented in Figure 5. The main watercourses of the Canal do Mangue are the Maracanã, Joana, Trapicheiros, Comprido and Papa-Couve rivers. These rivers have their headwater in the Tijuca Massif or the Engenho Novo Range.
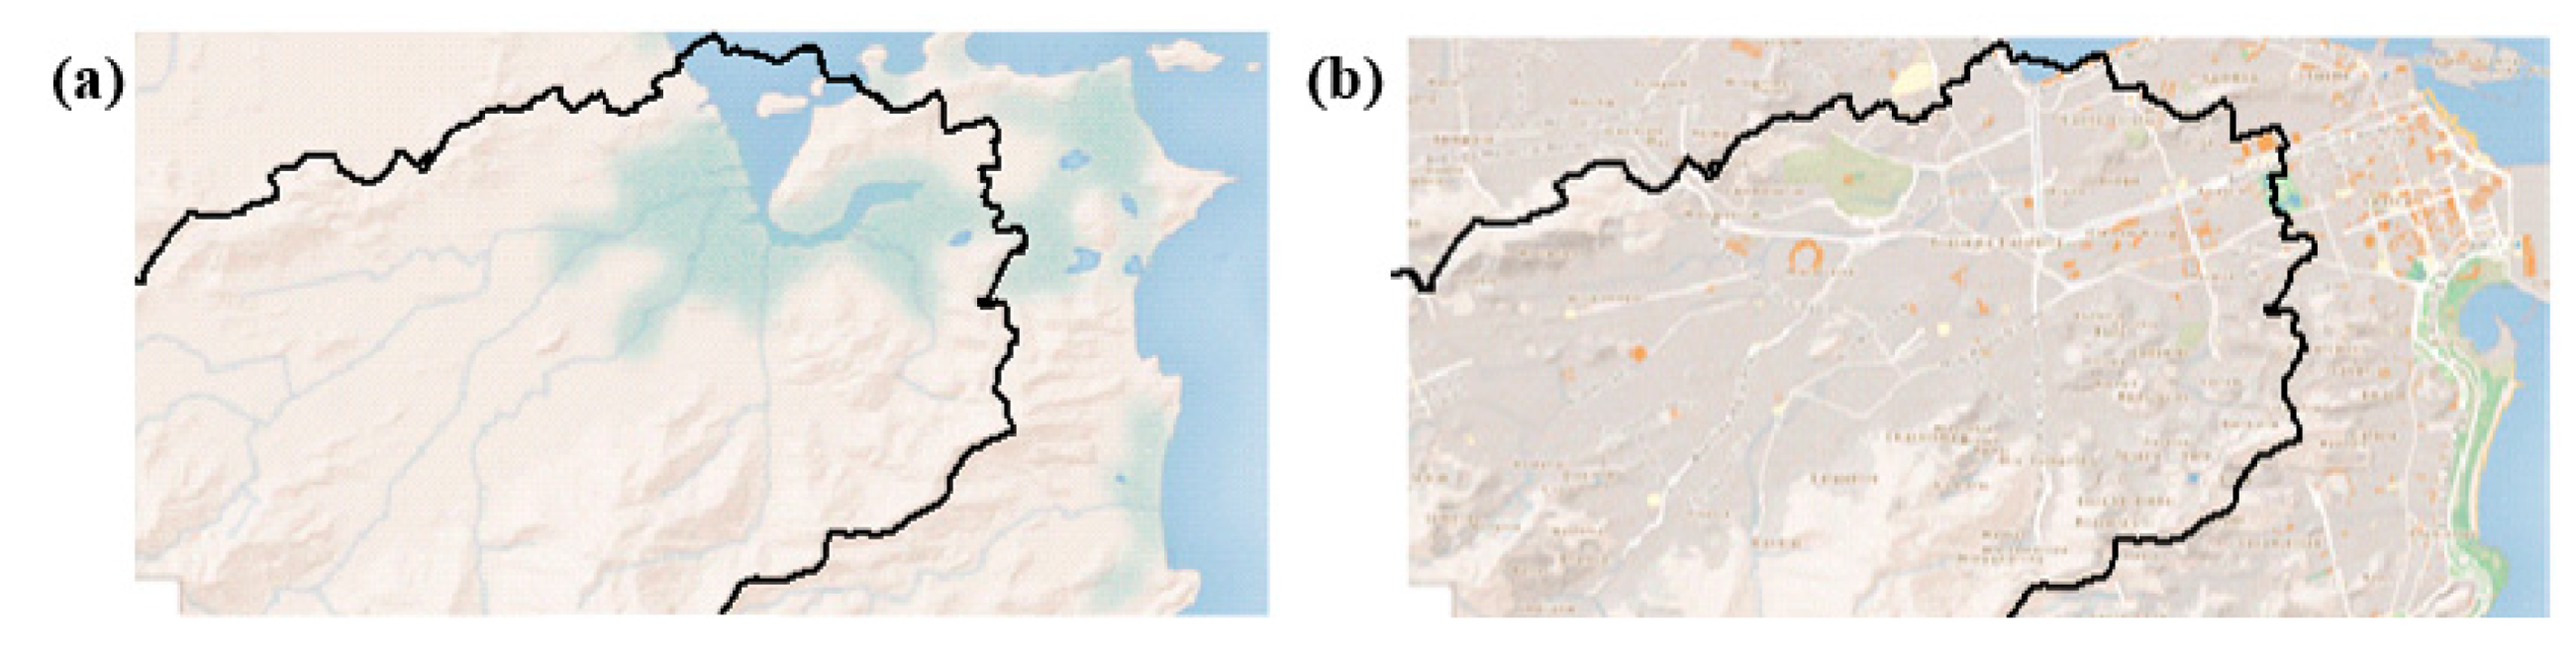
This watershed has suffered an enormous anthropic alteration of its surface and natural drainage system. The changes were aimed at the creation of landfills to allow the expansion of urbanization in the city of Rio de Janeiro. This led to profound modifications in the stormwater drainage systems of the Canal do Mangue catchment, both superficial and subterranean. These profound modifications can be seen in the artwork presented in Figure 6.
Currently, this watershed is highly urbanized, mainly in the lower areas, with a rate of urbanization of 81%. The forest remnant, found on the slopes, is located in regions of high declivity, favouring a very rapid runoff, with little capacity of cushioning and retention of rainwater precipitated in intense hydrological events.
In this context, the Canal do Mangue catchment has no space for zoning changes, making it impossible to remove people and property from areas with flood risks. In this kind of situation, control actions must be grounded on urban drainage compensatory techniques.
Therefore, the authors chose the Canal do Mangue catchment as the case study for the following motivations:
- Geographic importance, located between the central and northern zone of the city of Rio de Janeiro, densely occupied and highly modified by the process of urban occupation;
- Historical importance, presenting serious flood problems throughout the entire history of its occupation, being the subject of several studies and projects for flood mitigation and control, including one of the icons of urban flooding in Rio de Janeiro, Praça da Bandeira;
- Economic importance, presenting roadways of relevance to the whole city which have a high potential for impact on the generation of large congestion during heavy rainfalls with traffic interruption, as well as the existence of different patterns and levels of occupation, such as slums and noble neighbourhoods.
3.1. Flood Modelling
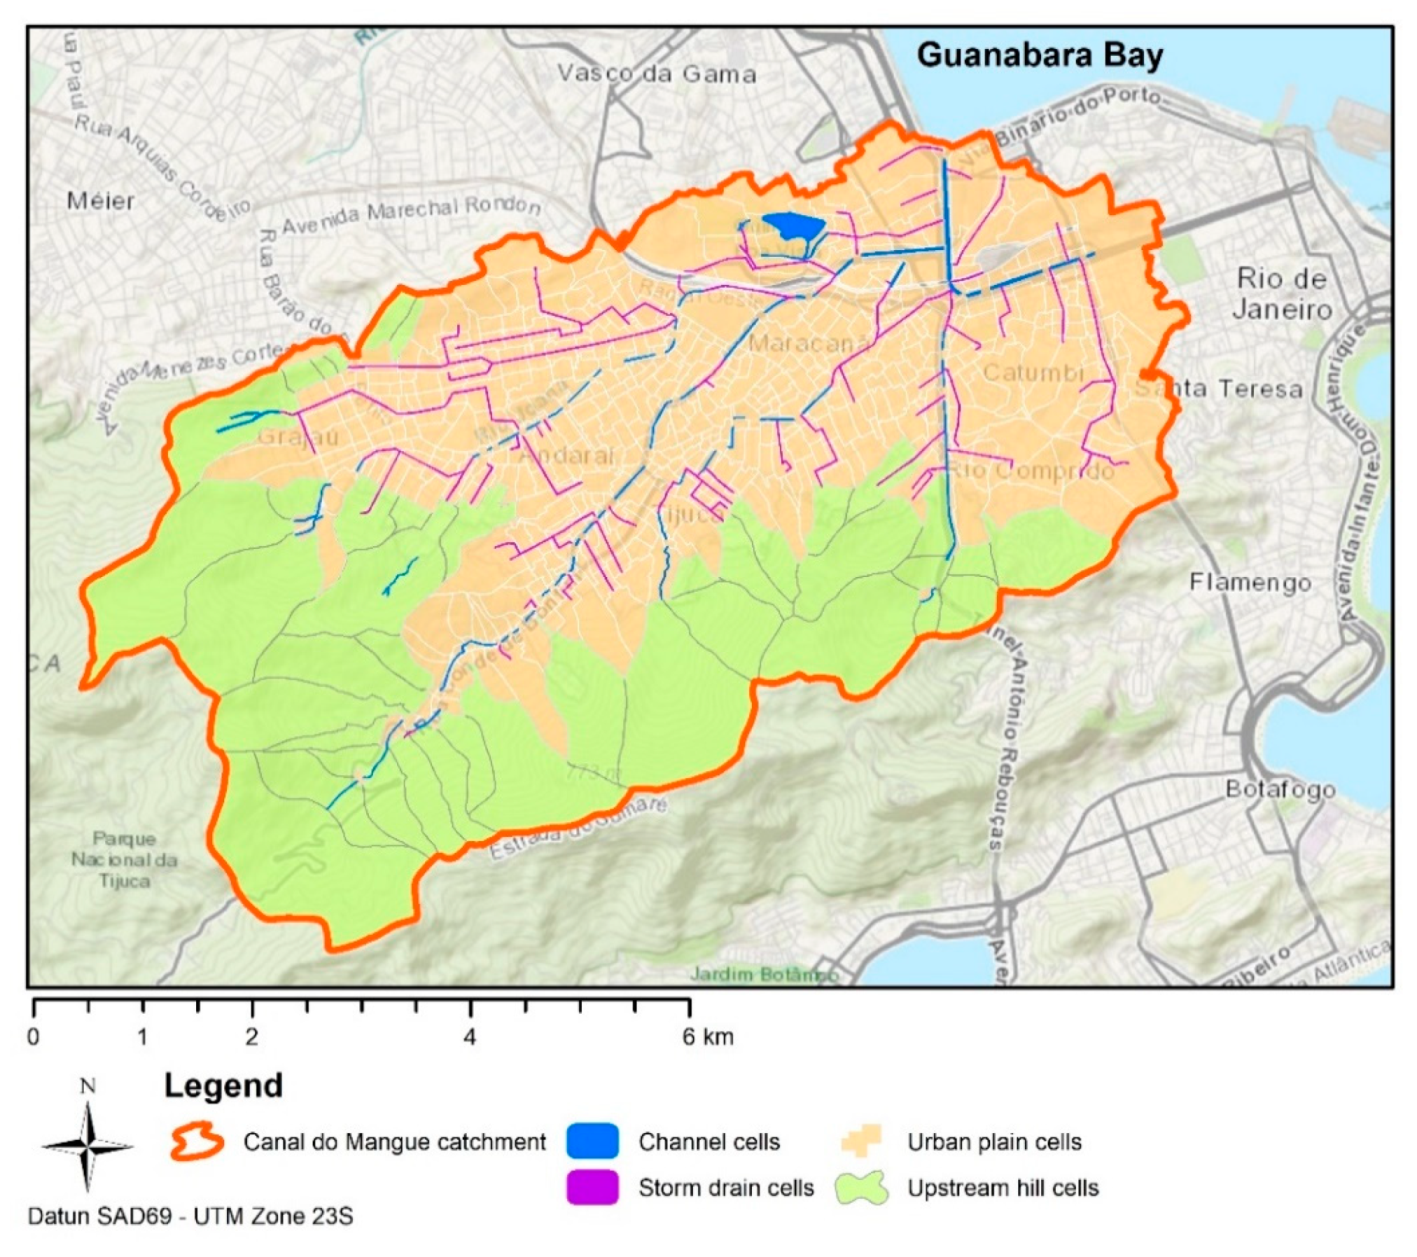
The choice of MODCEL to perform the hydrological–hydrodynamic simulations in the Canal do Mangue catchment was made based on its capacity to represent the entire hydrographic watershed functioning together as an interrelated system.
This model is based on the original work of Zanobetti and Lorgeré [39] and assumes that the watershed can be subdivided in various types of flow-cells, which interact with each other through 1D flow equations. Additionally, a dual drainage approach supports this model: surface flow, open channels and storm sewers can be linked, so the flow can occur simultaneously on both layers—surface and underground [40]. A more detailed description of MODCEL can be found in several published papers [41,42].
The Canal do Mangue watershed modelling base has 1.036 cells, containing 100 cells of rivers and channels, 204 cells of storm drains, 681 urbanized plain cells and 51 upstream hill cells, as identified in Figure 7. The spatial resolution of the surface cells varies from 7000 m2, for cells that represent central urban areas, to 1,500,000 m2, for cells that represent the upstream hills. Smaller cells represent rivers’ trenches and galleries. This scale flexibility allows for getting more accurate results in the area of interest.
3.2. Model’s Calibration and Validation
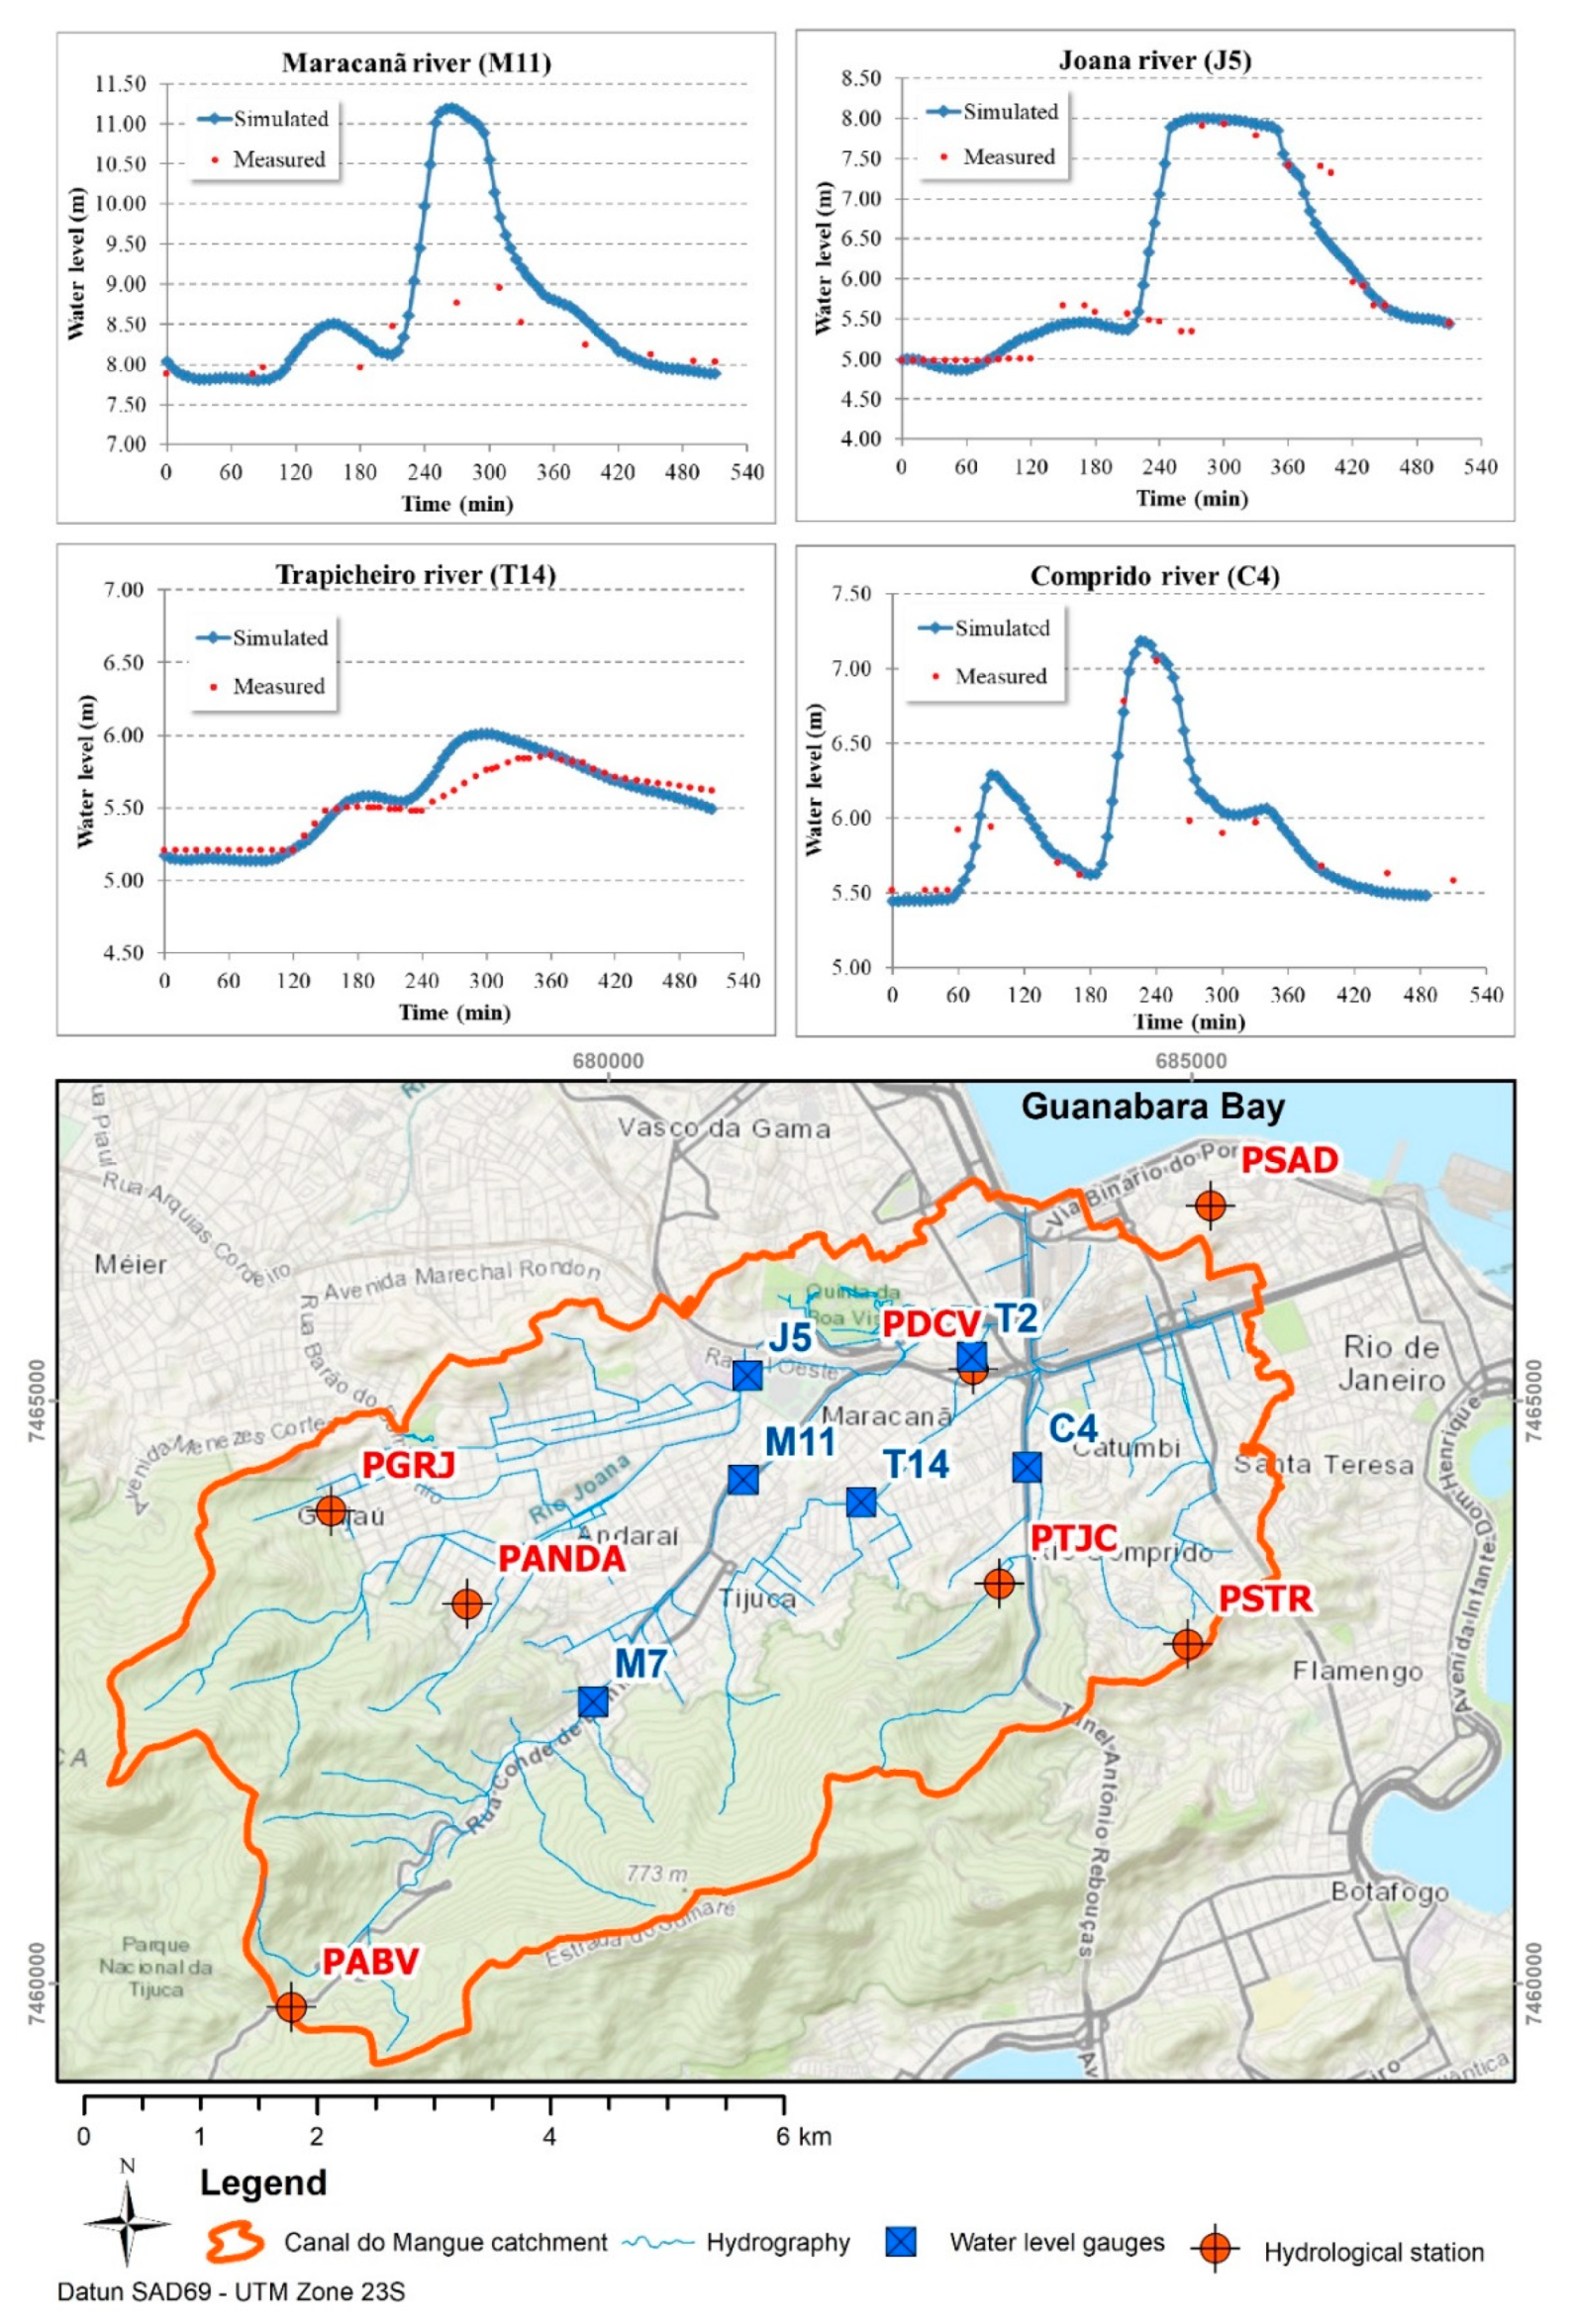
The model was calibrated and validated from data measured in two 24 h events, available at five stations of the Rio de Janeiro City Hall Alert System (Rio Alert), with data recorded every 15 minutes, plus two stations installed within the Flood Master Plan of the Canal do Mangue Catchment [43]. The total height of rainfall measured in each event is presented in Table 1.
For the spatialization of the rainfall measured at each station in the Canal do Mangue catchment, the Thiessen Polygons Method was applied to estimate the influence areas of each station. The influence areas were adapted to cell division. Both events were simulated and the water level results were compared with the measured data of fluvial stations installed during the elaboration of the Flood Master Plan of the Canal do Mangue Catchment. The first calibration attempt of the model used literature values for the input parameters. The main calibration parameters in this modelling system are the runoff and Manning coefficients, as well as other hydraulic parameters associated with classical equations used in the hydraulic links of MODCEL, such as orifices and broad crested weirs. The runoff coefficient was defined according to land use and land cover of the basin, distinguishing between urban and non-urban areas. For the Manning coefficients used in the links between channel and storm drains cells, the method proposed by Chow (1959) was applied. The values were defined according to the conditions presented in the stretch under analysis, identifying bed irregularities, abrupt transitions in the cross-section and the occurrence of accented meanders or vegetation in the main channel. After the simulation of the calibration scenario, the water level results were compared with the measured values. Then, the coefficients were changed within a physically acceptable range, aiming to approximate the modelled and measured levels. Afterward, the event chosen for the validation of the model was simulated and calibration was confirmed.
Figure 8 shows the localization of hydrological and fluvial (water level gauges) stations, as well as some of the final results of the calibration process. The measure data of water level in the Maracanã river (M11) seems to show data acquisition error. The measured point that makes the simulated result appear overestimated is not consistent with the expected hydraulic response in this river stretch. The water level behaviour would be similar to the Joana river response (J5) once both stations are located at a similar location in each sub-basin. Therefore, it is expected that water levels in the Maracanã river, at this point, reach 3.0 meters of height, corroborating simulated results. This whole process is described in detail in [37]. To increase the reliability of the simulation, it would be important to improve calibration and validation using more events and water gauges. However, this does not affect the proposed method.
3.3. Simulated Scenarios
The assessment of the benefits of an intervention plan to reduce flood damage is based on scenario forecasts. The construction of simulation scenarios allows for obtaining a set of responses from the watershed to intense rainfall events according to possible arrangements of interventions in the drainage system or even in the urban pattern.
Initially, for the study of a simulation scenario, the design hydrological event was defined with 25 years of recurrence time, agreeing with the technical instructions of Rio-Águas [44]. The design rainfall is 180 minutes long, distributed temporally according to the alternating-block method [45,46] and its height, as shown in Table 2.
Although designed for a 25-year event, the proposed scenarios aim to provide the operation of the drainage system in response to several hydrological events, considering three conditions: without interventions (C0), with concentrated measures (C1) and with distributed interventions (C2).
The scenario without interventions (C0) considered the hydraulic conditions of the watershed’s drainage system without any temporary storage measures for the outflows of the rain. From the mathematical model, which represents the urban catchment, several design rainfalls were simulated, allowing for the evaluation of the floods’ behaviour.
Subsequently, this model was adapted to simulate the introduction of large works to hold stormwater strategically located to remove part of the flood flows of main channels, reducing the peak flow and, thus, the hydraulic stress of stretches with low flow capacity (C1). In general, these interventions were limited to the implantation of four large reservoirs along the Joana and the Trapicheiros rivers, plus a transposition of the Maracanã river to the Joana river and the diversion of the latter one to Guanabara Bay. The reservoirs along the Joana river have a useful volume of 143,000 m3 and 50,000 m3, and can reduce the flow peak of a 25-year event by approximately 50% and 67%, respectively. With a more limited space, the reservoirs along the Trapicheiros river have a useful volume of 70,000 m3 and 18,000 m3. The former one can reduce the flow peak of a 25-year event by approximately 36%, while the latter has little impact on the hydrodynamics of the river since it is located in a very low area and is very close to the influence of the Canal do Mangue. However, it promotes a great reduction in the flood heights of a critical region (around Praça da Bandeira). The transposition of the Maracanã river has a significant impact on the reduction of the flow in its gutter. The peak of the transposed flow exceeds 50 m3/s, reducing the peak flow of the Maracanã river by 72%. Finally, the diversion of the Joana river to Guanabara bay is one of the main interventions planned for the catchment, with an excellent impact on the hydraulics of the system.
A second adaptation was carried out to introduce several smaller detention works (C2) instead of the large works proposed in the C1 scenario. These interventions were distributed throughout the watershed, from the foot of the slopes to the urban plains, and sought a more sustainable approach to storm water management. A set of 18 upstream reservoirs at the foothills with a total volume of 203.860 m3 and damping capacity of 49% was proposed. Furthermore, 31 reservoirs in squares were added to the C2 scenario, providing an extra reservation of 120.697 m3. In addition to the reservoirs, the installation of drainage systems with permeable pavement in large parking lots and open waterproof areas was also considered. Besides, an intervention was inserted in the Trapicheiros river that provides the opening of stretches in an undersized gallery. Finally, the transposition of the Maracanã river to the Joana river and the diversion of the latter one to Guanabara Bay proposed in the C1 scenario were also incorporated in this adaptation.
4. Results and Discussion
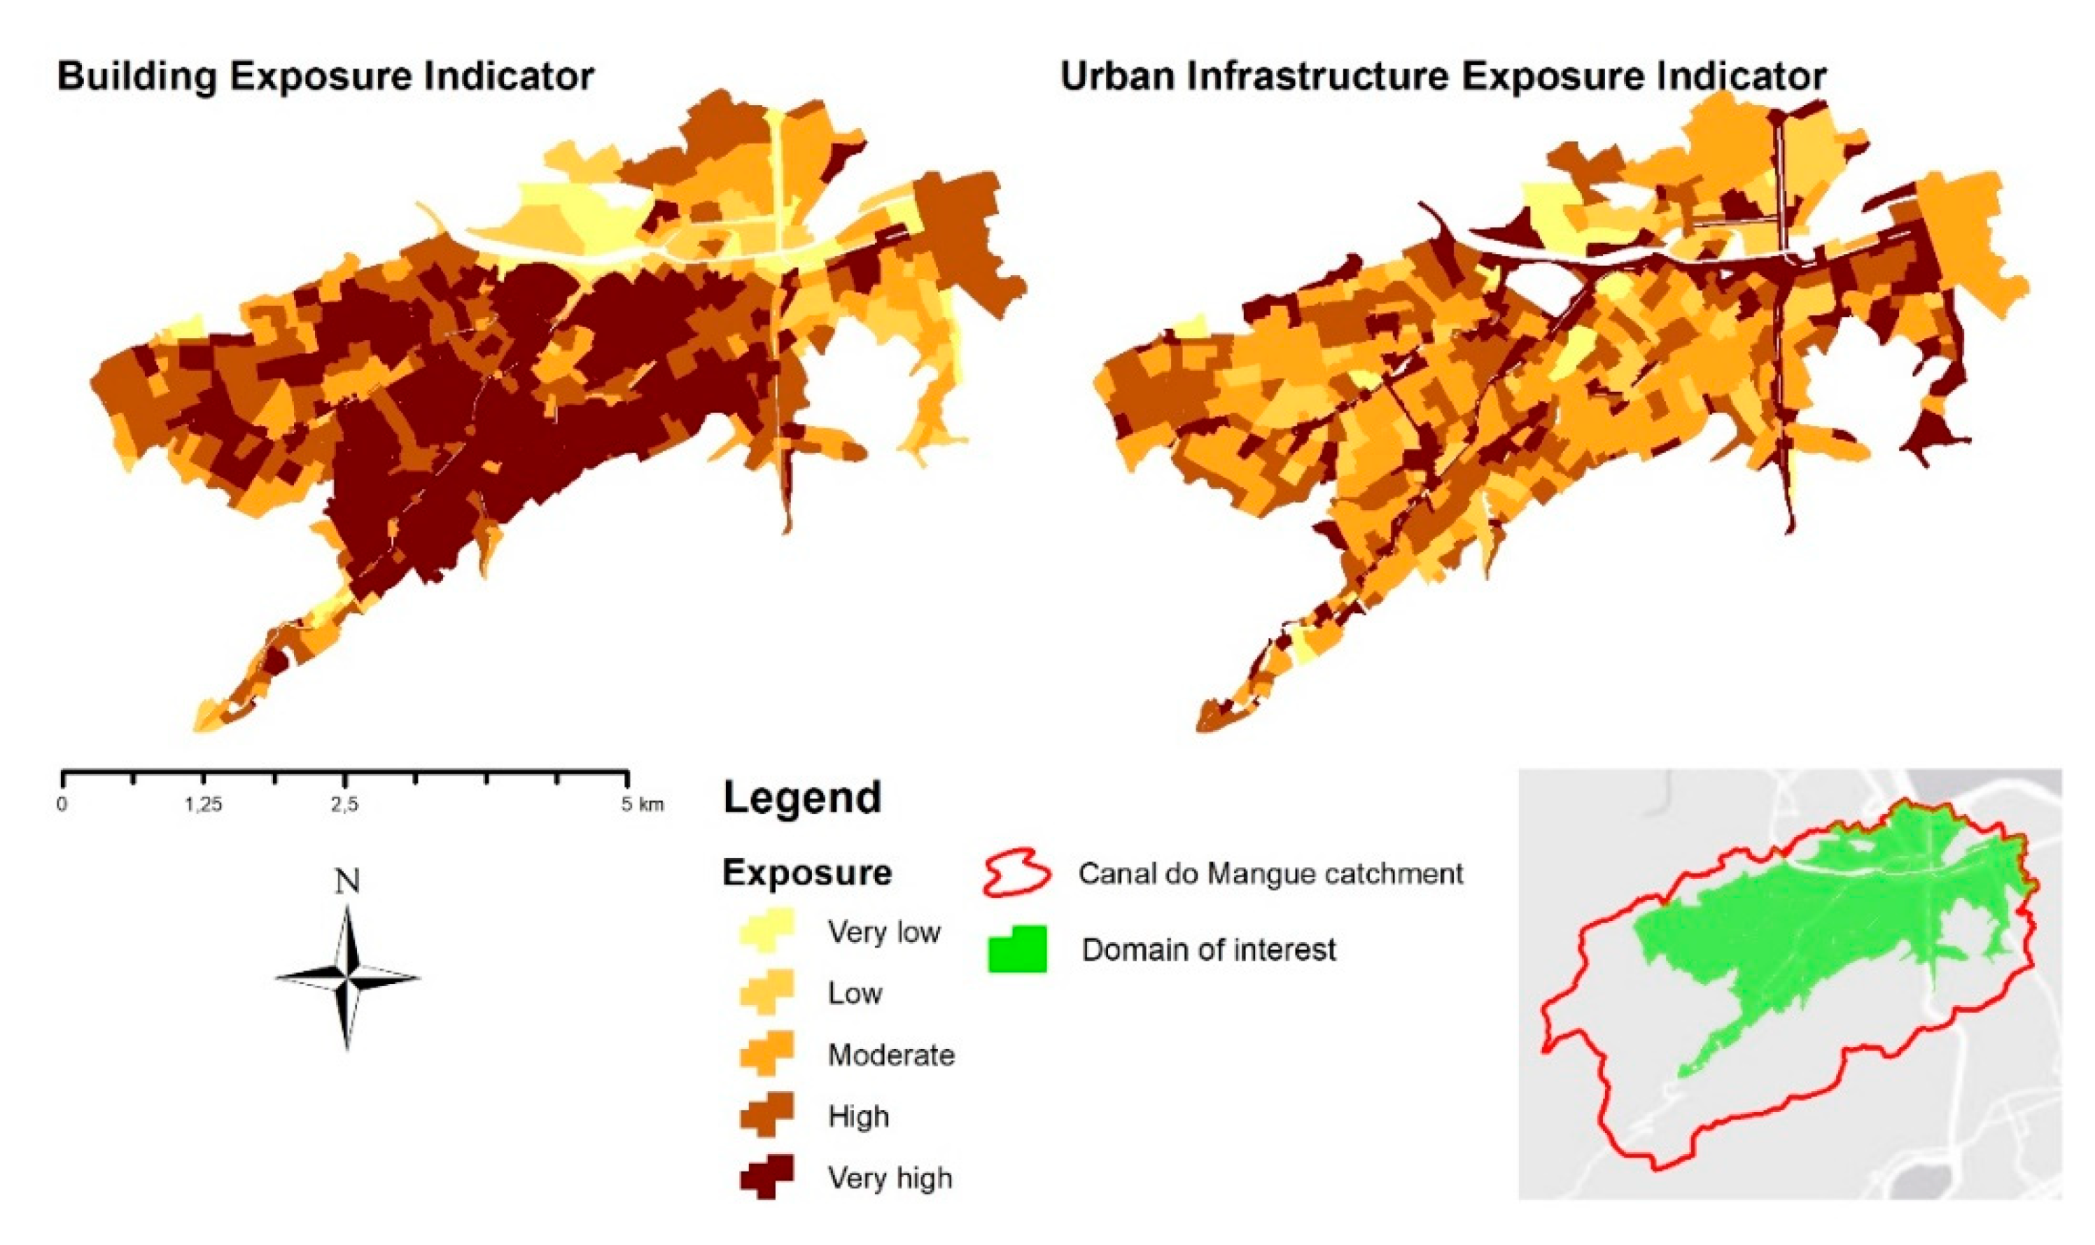
Exposure is estimated based on urban data using the density of the built-up area and roading as indicators of the potential damage. Thus, in denser areas, there are more goods and people exposed to the hazard of flooding.
The indicators proposed in this study consider a decimal system that was ranged in five classes: very low; low; moderate; high; very high. This classification aims to facilitate the decision-making process, promoting better communication and presentation of the results. Table 3 shows the qualitative range of the risk adopted.
The exposure indicators do not suffer variation with the rainfall event or with the condition of the drainage system since they only depend on the urban pattern. For this simple reason, these indicators are constant for all scenarios. Figure 9 presents the spatial distribution of Ibe and Iie in the Canal do Mangue catchment, calculated based on information provided by the Urban Development Information Office of the City of Rio de Janeiro.
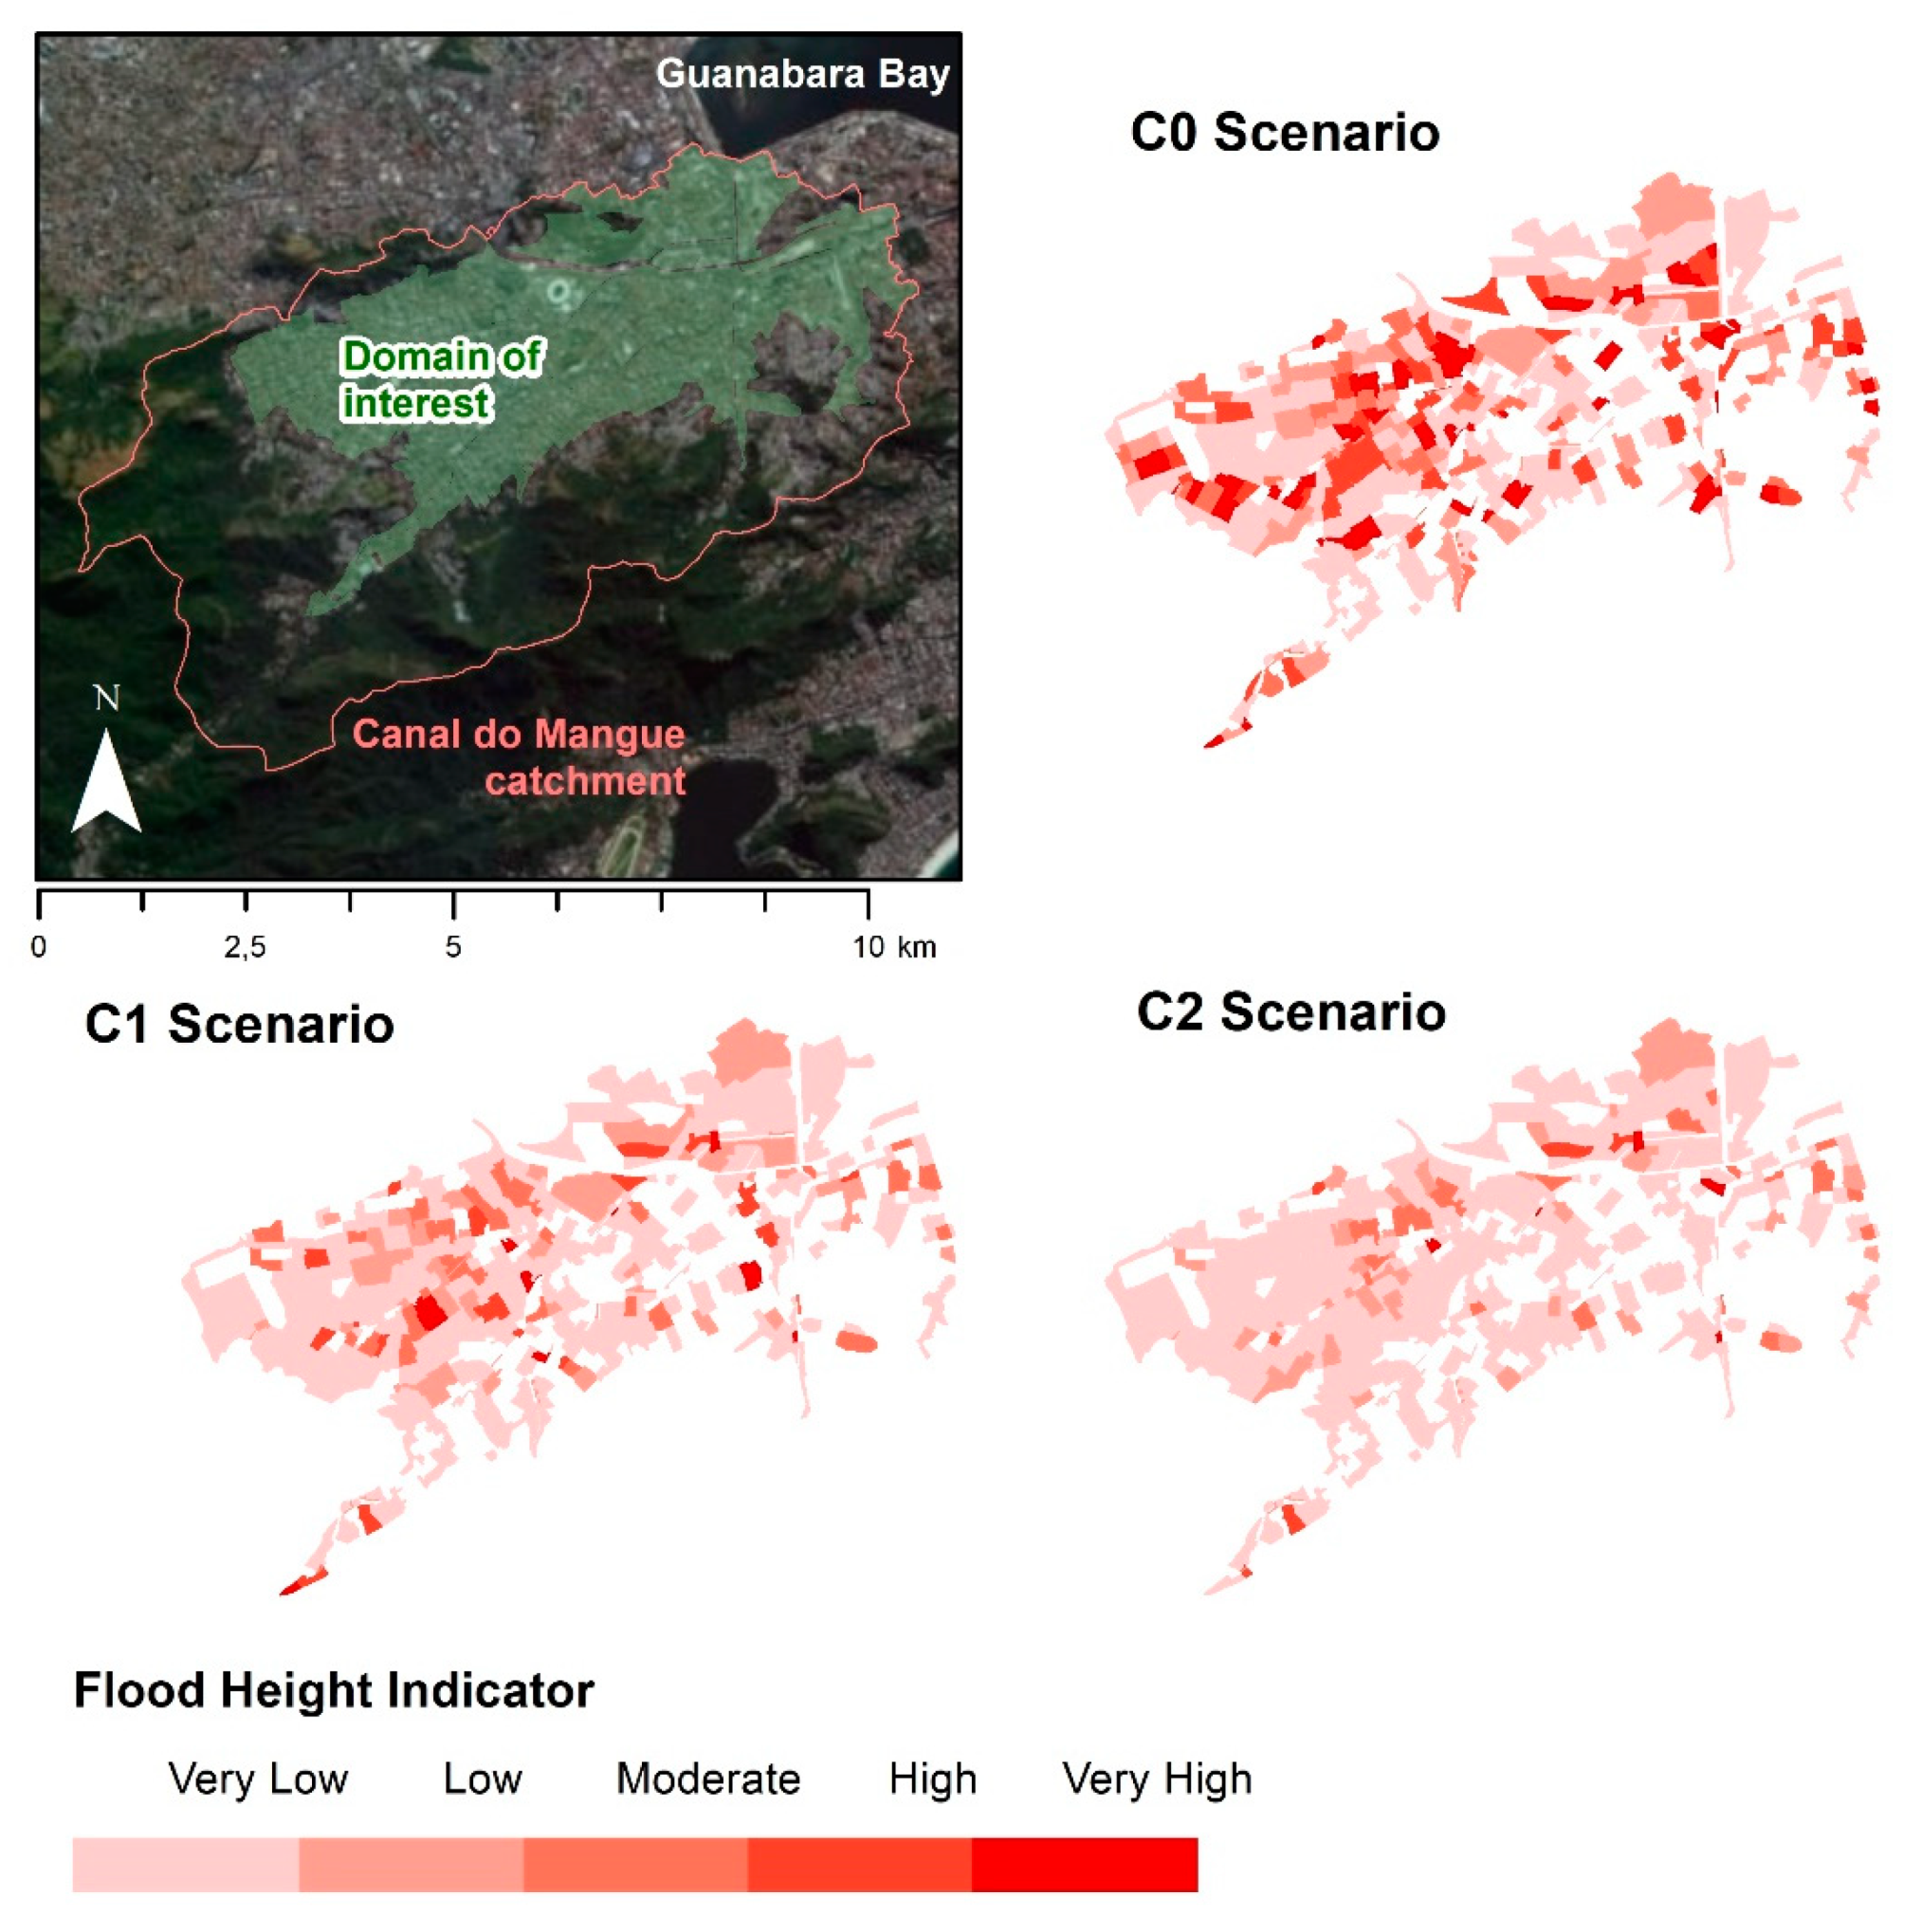
The exposure indicators are crossed with the hazard indicator, represented in this index by the Flood Height indicator (Ih). Figure 10 presents the hazard spatialization for each simulated scenario, considering a 25-year event. These maps show the impact of the proposed interventions, with a significant reduction on hazard indicator across the Canal do Mangue catchment. For scenario C2, the reduction is more sparse due to the greater distribution of detention measures.
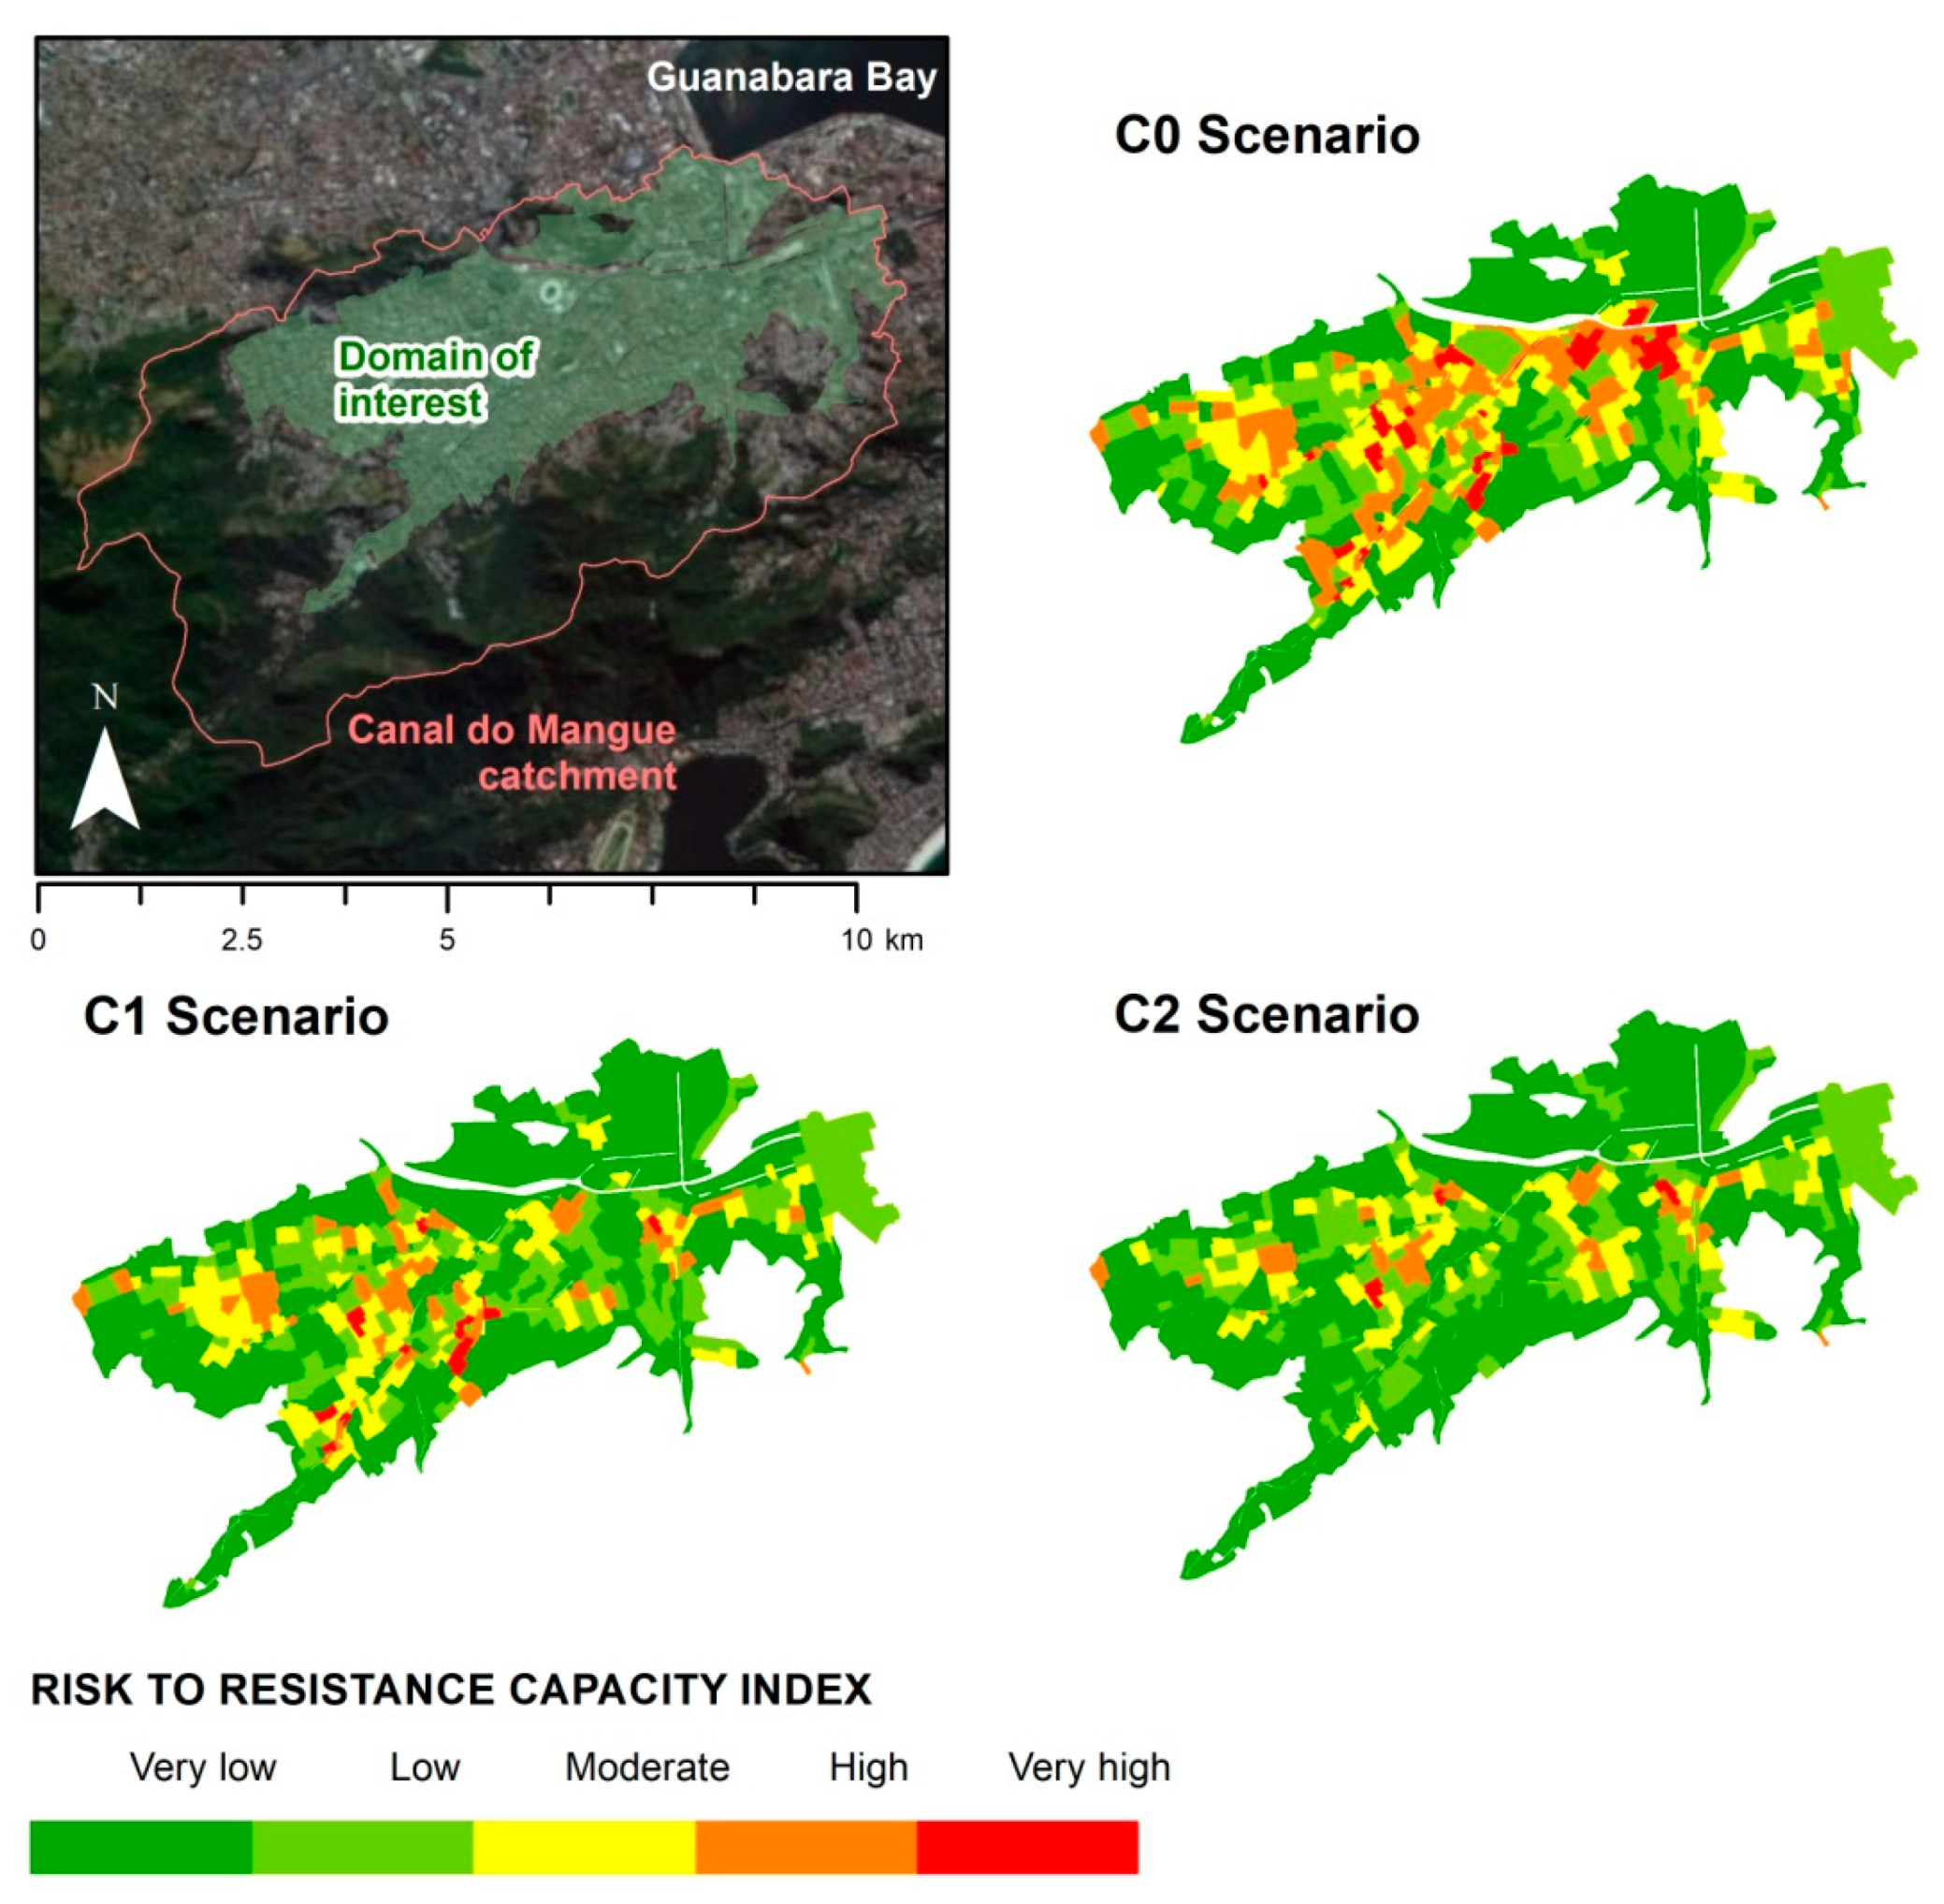
Finally, the Risk to Resistance Capacity index was obtained for each cell by crossing exposure and hazard indicators. Figure 11 presents the result for a 25-year event, which means the combination of Figure 9 and Figure 10. It is notable that the Canal do Mangue catchment has significant problems due to flood heights and the amount of assets exposed. It is also observed that in some areas, even with concentrated or distributed measures, the risk to resistance capacity remains classified as high or very high for a 25-year event. This result demonstrates the difficulty of designing flood mitigation measures in extremely occupied watersheds. In such cases, designing for a given return period may become unfeasible because of the limited space for interventions.
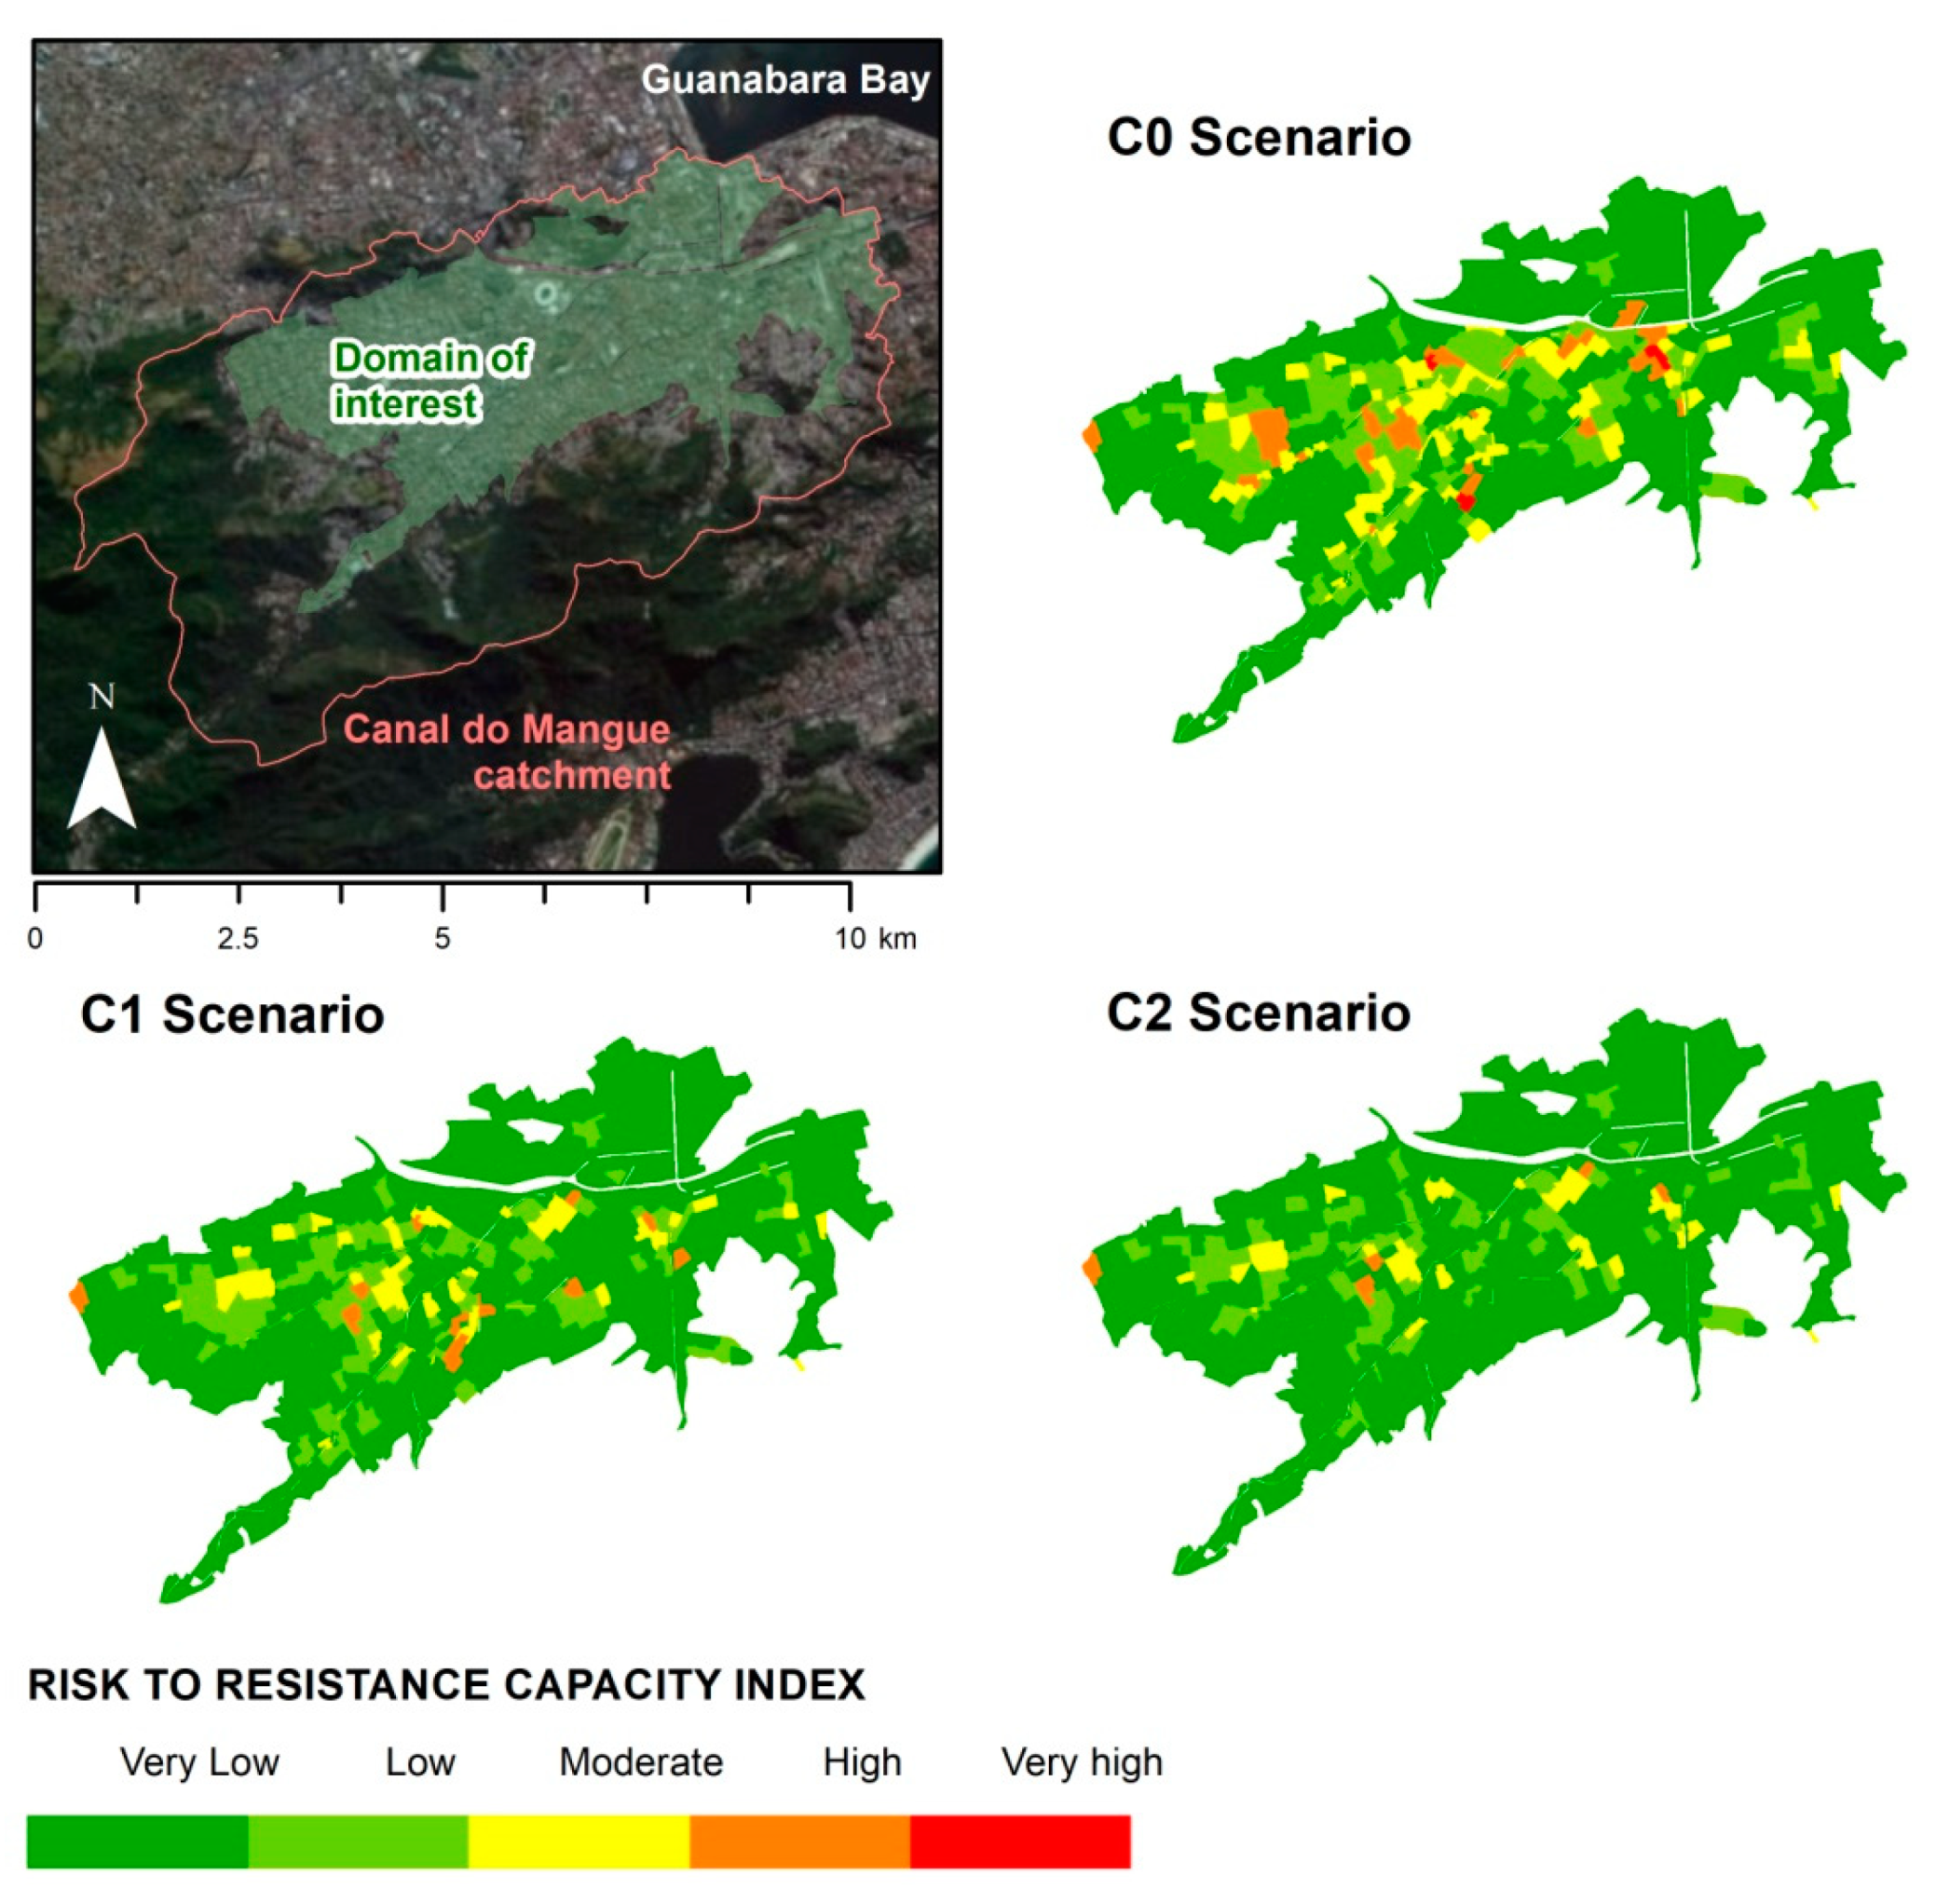
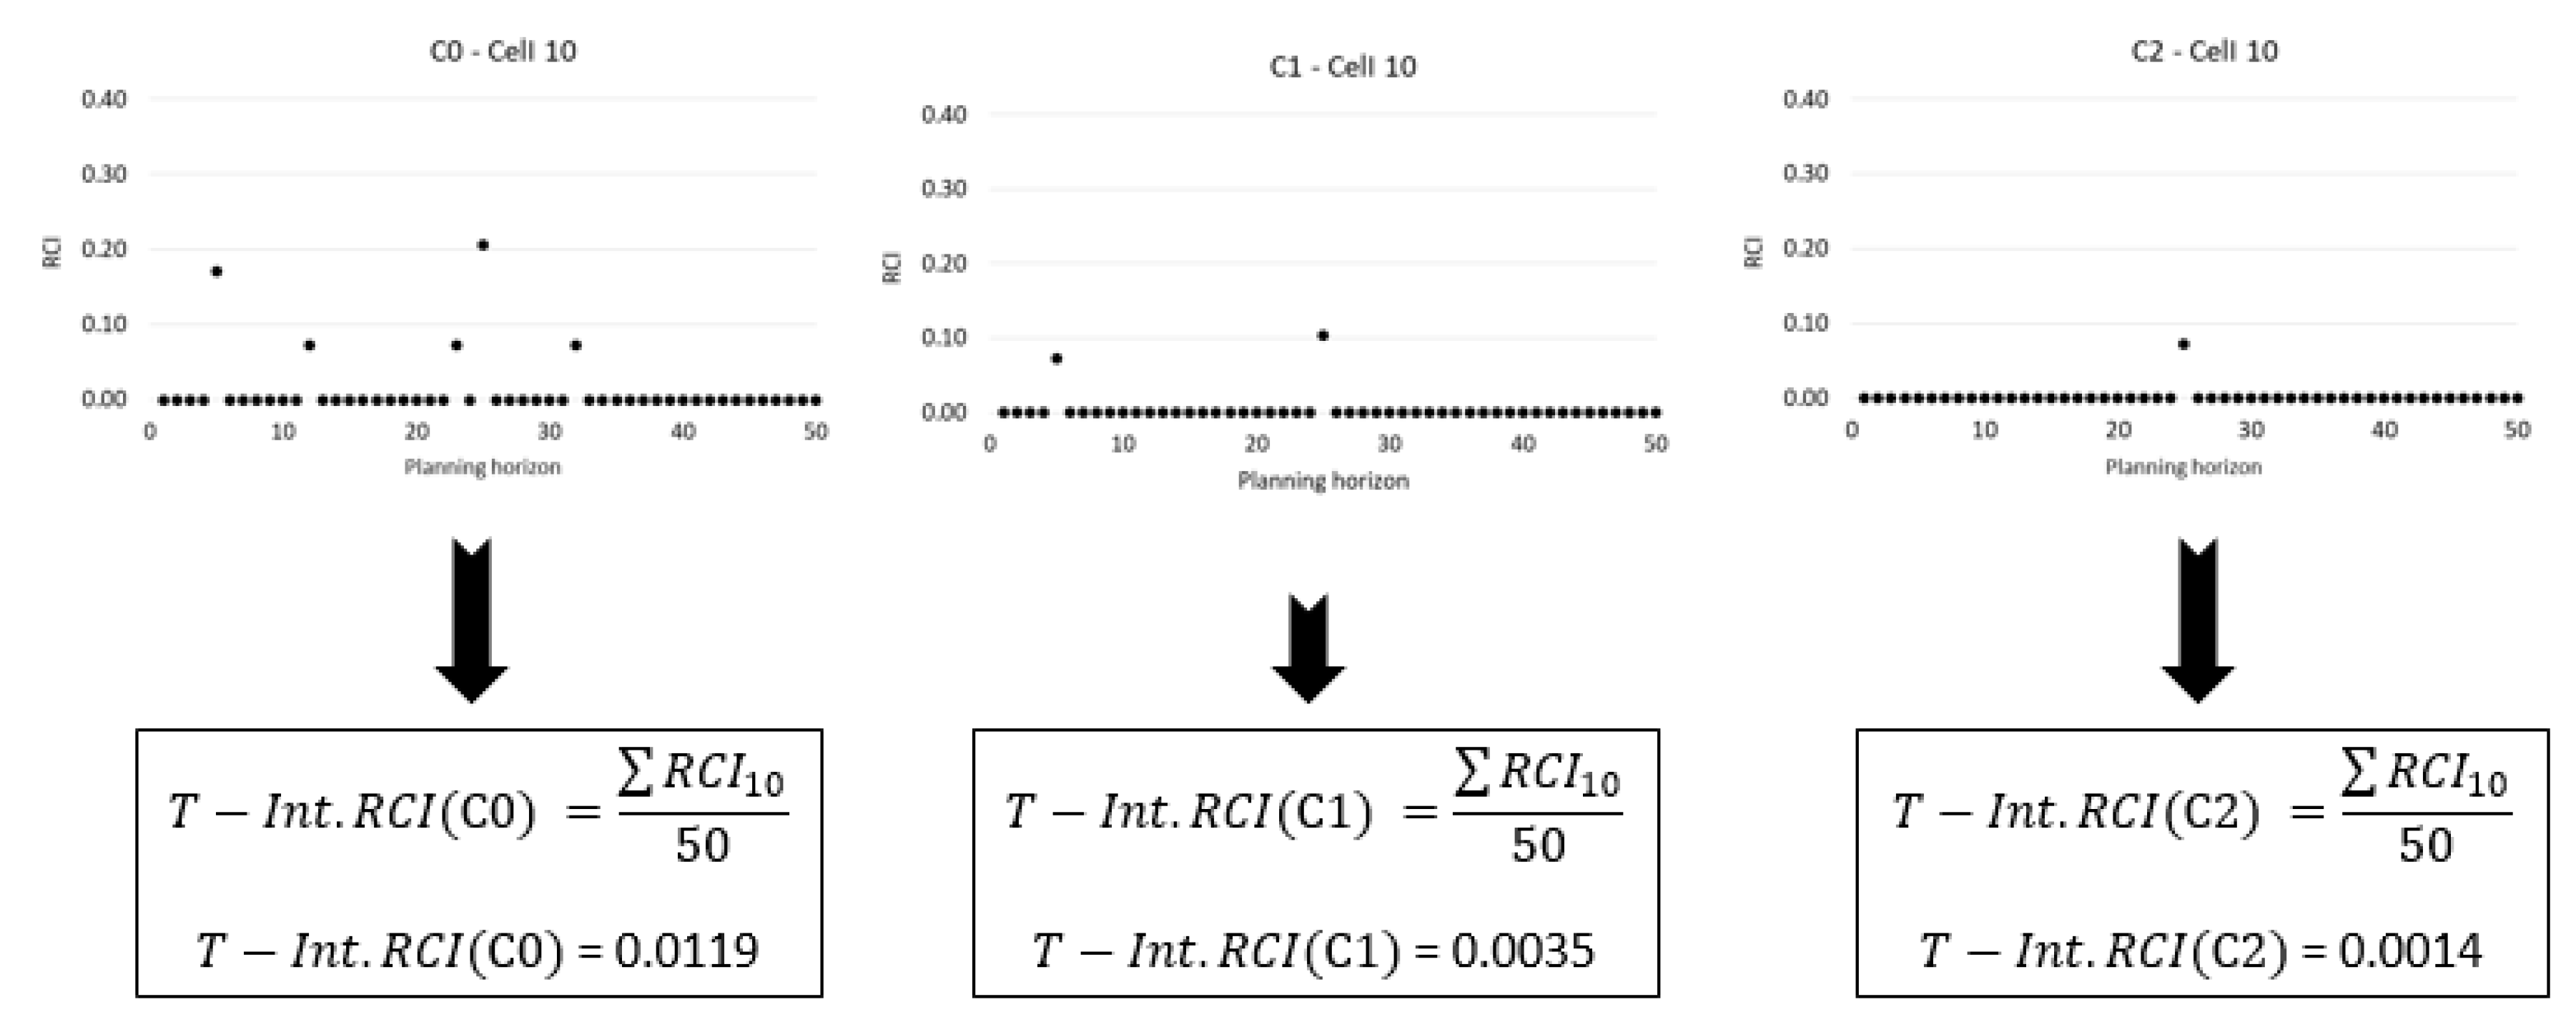
To better address risk evaluation in urban areas, a sequence of events may be indicated since it is capable of considering the probability of floods’ occurrence over a project horizon. With a time-integrated analysis, the critical points of the watershed are highlighted for a sequence of events that mimics reality, rather than planning for a single and specific event. Figure 12 presents this proposal and emphasizes that high frequency events, despite having a low impact, contribute to risk’s composition over time due to their recurrence. When comparing C1 or C2 scenarios with the C0 scenario, the remaining risk represents the residual risk over the 50-year project horizon, which is an important piece of information for flood risk management. An example of the application of Time-Integrated analysis for a specific cell is presented in Figure 13.
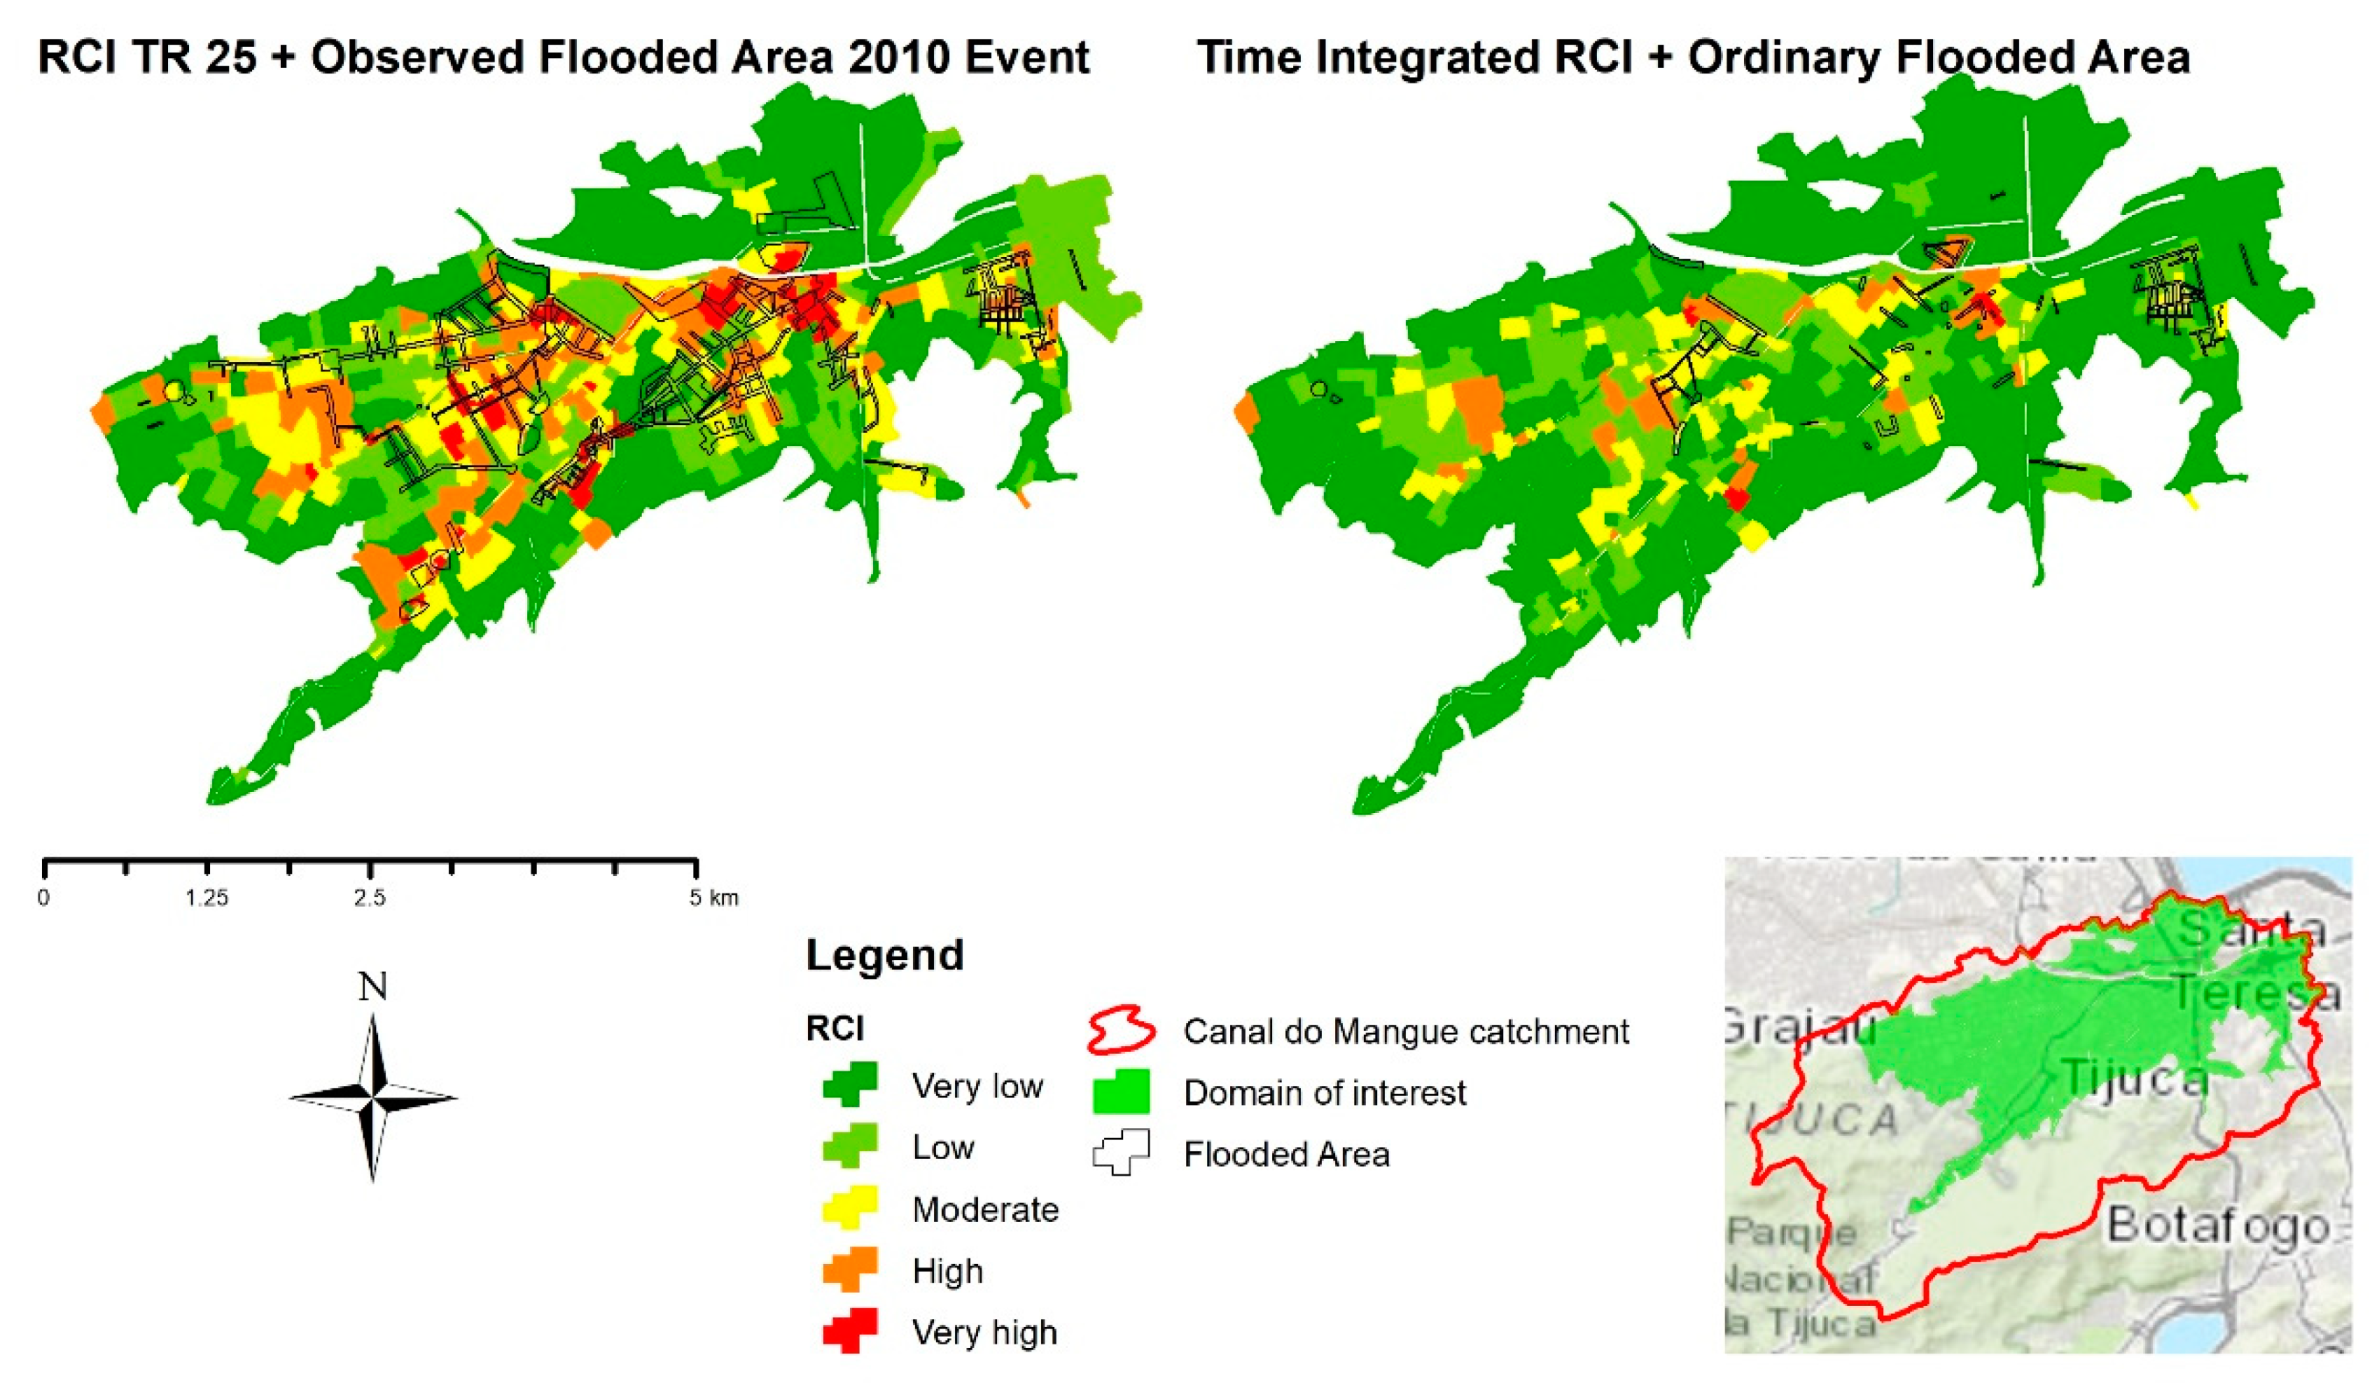
Figure 14 presents the overlapped results of RCI application and observed flood events, overlapping the 2010 event flooded area (equivalent to a 30 years’ storm) with the RCI that resulted from the 25 years’ storm, and the ordinary flooded area (observed and registered by municipal agencies) with the time-integrated RCI. This comparison indicates that the method is capable of representing the risk of local flooding from particular low-frequency events to long-term series of events.
Hence, the global index is calculated to compare the three scenarios. The results are presented in Table 4. Since time-integrated analysis considers events with return periods of less than 25 years, the risk values are expected to be lower. However, this result provides insights into the reality of the watershed in view of flood’s occurrence probability. As mentioned before, the global index should not be used alone in the evaluation since it consists of an average result and may suppress critical values. Despite that, this index is useful for comparing design scenarios. For instance, for a 25-year event, C1 and C2 measures can reduce the risk to resistance capacity by approximately 20% and 30%, respectively, compared to the current situation. When analysing over the 50-year horizon, the risk reductions are slightly higher (23% and 36%). These results highlight the better coverage of distributed measures in relation to concentrated ones, especially for high frequency events.
5. Conclusions
Cities and floods present a complex relation which involves social coexistence and losses. Flood control measures should integrate urban planning in a long scale approach aiming for the intersectoriality between other areas of urban planning and master plans. A time-integrated risk analysis provides subsidies to optimize this approach and prompts discussions about a flood control project based in just one map (RP event) versus the integral over a horizon of time for a basin in analysis.
The planning of urban interventions to reduce damages based on traditional risk management leads to the proposal of flood control measures with large structural solutions, which can provide good hydraulic results for the system considering a hydrological event of reference. However, by internalizing the residual risk, the concentration of the solutions in large structures can reduce the system’s resilience, putting it at risk of uncertainties that can stress the defensive measures, such as the occurrence of events with higher return periods than the design storm. The integrated risk evaluation presented in this paper allows the internalization of part of the residual risk, analysing potential impacts of low frequency hydrological events.
In water systems with high complexity and operational interoperability, several sets of interventions are presented as a good solution to reduce the potential damages of flood events. Thus, an analysis methodology is necessary to support decision processes that consider not only isolated events, but also planning horizons. This approach allows a better relationship between the sectorial urban plans. The integration of flood risk in time shows the real expected impact of flood control measures, whether they are structural or non-structural ones. The results demonstrate the difficulty of designing flood mitigation measures in extremely occupied watersheds and the importance of evaluating residual risks associated with proposed projects.
The case study was driven to illustrate the method application, showing coherent results. The more the measures are distributed over the basin, the greater the benefit is, since these measures tend to act on persistent flooding areas. In addition, the method is capable of comparing the real flood risk reduction due to interventions on drainage systems, especially important for very affected urban watersheds, where solutions cannot eliminate all flooding areas.
Better improvements in the proposed method can be achieved by applying it to other watersheds with different urban patterns and stages of development. Besides, it would be interesting in future works to incorporate the concept of resilience in the discussion of the time integrated RCI. The analysis of the recovery time, for instance, may corroborate with the results obtained by the proposed index.
Author Contributions
Conceptualization, O.M.R., L.F.G. and M.G.M.; Data curation, O.M.R., L.F.G. and F.M.M.; Formal analysis, O.M.R., L.F.G. and F.M.M.; Funding acquisition, A.N.H.; Investigation, O.M.R., L.F.G. and F.M.M.; Methodology, O.M.R., L.F.G. and M.G.M.; Resources, A.N.H.; Supervision, A.N.H. and M.G.M.; Validation, M.G.M.; Visualization, F.M.M.; Writing—original draft, O.M.R., L.F.G. and F.M.M.; Writing—review & editing, O.M.R., A.N.H. and M.G.M.
Funding
This research was funded by Coordenação de Aperfeiçoamento de Pessoal de Nível Superior- Brasil (CAPES) (Finance Code 001) and Conselho Nacional de Desenvolvimento Científico e Tecnológico (CNPq).
Acknowledgments
The authors wish to acknowledge the administrative support provided by the Programa de Engenharia Ambiental of UFRJ (PEA-POLI/EQ - UFRJ) and Programa de Engenharia Civil of UFRJ (PEC-COPPE/UFRJ) and the technical support provided by Aquafluxus Water Resources Environmental Consulting.
Conflicts of Interest
The authors declare no conflict of interest.
References
- Kirby, A. SuDS—Innovation or a tried and tested practice? Proc. Inst. Civ. Eng.-Munic. Eng. 2005, 158, 115–122. [Google Scholar] [CrossRef]
- Karnib, A.; Al-Hajjar, J.; Boissier, D. An expert system to evaluate the sensitivity of urban areas to the functioning failure of storm drainage networks. Urban Water 2002, 4, 43–51. [Google Scholar] [CrossRef]
- Miguez, M.G.; de Magalhães, L.P.C. Urban flood control, simulation and management—An integrated approach. Intech Open 2010, 2, 64. [Google Scholar]
- Fletcher, T.D.; Shuster, W.; Hunt, W.F.; Ashley, R.; Butler, D.; Arthur, S.; Trowsdale, S.; Barraud, S.; Semadeni-Davies, A.; Bertrand-Krajewski, J.L.; et al. SUDS, LID, BMPs, WSUD and more—The evolution and application of terminology surrounding urban drainage. Urban Water J. 2015, 12, 525–542. [Google Scholar] [CrossRef]
- AMEC Earth and Environmental Center. Georgia Stormwater Management Manual; Atlanta Regional Commission: Atlanta, GA, USA, 2001; Volume 2. [Google Scholar]
- Jose, R.; Wade, R.; Jefferies, C. Smart SUDS: Recognising the multiple-benefit potential of sustainable surface water management systems. Water Sci. Technol. 2015, 71, 245–251. [Google Scholar] [CrossRef] [PubMed]
- Coffman, L.S.; Cheng, M.; Weinstein, N.; Clar, M. Low-impact development hydrologic analysis and design. In Proceedings of the 25th Annual Conference on Water Resources Planning and Management, New York, NY, USA, 7–10 June 1998; pp. 1–8. [Google Scholar]
- Brown, R.R.; Keath, N.; Wong, T.H.F. Urban water management in cities: Historical, current and future regimes. Water Sci. Technol. 2009, 59, 847–855. [Google Scholar] [CrossRef] [PubMed]
- Keeley, M.; Koburger, A.; Dolowitz, D.P.; Medearis, D.; Nickel, D.; Shuster, W. Perspectives on the use of green infrastructure for stormwater management in cleveland and milwaukee. Environ. Manag. 2013, 51, 1093–1108. [Google Scholar] [CrossRef] [PubMed]
- Miguez, M.G.; Veról, A.P. A catchment scale Integrated Flood Resilience Index to support decision making in urban flood control design. Environ. Plan. B Urban Anal. City Sci. 2017, 44, 925–946. [Google Scholar] [CrossRef]
- Pender, G.; Néelz, S. Use of computer models of flood inundation to facilitate communication in flood risk management. Environ. Hazards 2007, 7, 106–114. [Google Scholar] [CrossRef]
- Kaufmann, M.; Van Doorn-Hoekveld, W.; Gilissen, H.K.; Van Rijswick, M. Analysing and Evaluating Flood Risk Governance in the Netherlands. Drowning in Safety? STAR-FLOOD Consortium: Utrecht, The Netherlands, 2016; ISBN 978-94-91933-11-0. [Google Scholar]
- Sayers, P.; Li, Y.; Galloway, G.; Penning-Rowsell, E.; Shen, F.; Kang, W.; Yiwei, C.; Quesne, T. Le. Flood Risk Management: A Strategic Approach; Asian Development Bank: Metro Manila, Philippines, 2013; ISBN 9789230011598. [Google Scholar]
- Kalyanapu, A.J.; Judi, D.R.; Mcpherson, T.N.; Burian, S.J. Annualised risk analysis approach to recommend appropriate level of flood control: Application to Swannanoa river watershed. J. Flood Risk Manag. 2015, 8, 368–385. [Google Scholar] [CrossRef]
- McBain, W.; Wilkes, D.; Retter, M. Flood Resilience and Resistance for Critical Infrastructure; CIRIA: London, UK, 2010. [Google Scholar]
- Jha, A.K.; Bloch, R.; Lamond, J. Cities and Flooding: A Guide to Integrated Urban Flood Risk Management for 21st Century; The World Bank: Washington, DC, USA, 2012; Volume 8, ISBN 978-0-8213-8866-2. [Google Scholar]
- Sörensen, J.; Persson, A.; Sternudd, C.; Aspegren, H.; Nilsson, J.; Nordström, J.; Jönsson, K.; Mottaghi, M.; Becker, P.; Pilesjö, P.; et al. Re-thinking urban flood management—Time for a regime shift. Water 2016, 8, 332. [Google Scholar]
- Zevenbergen, C.; Gersonius, B. Challenges in urban flood management. In Advances in Urban Flood Management; Taylor & Francis: New York, NY, USA, 2007; pp. 1–11. [Google Scholar]
- Plate, E.J. Flood risk and flood management. J. Hydrol. 2002, 267, 2–11. [Google Scholar] [CrossRef]
- Ludy, J.; Kondolf, G.M. Flood risk perception in lands “protected” by 100-year levees. Nat. Hazards 2012, 61, 829–842. [Google Scholar] [CrossRef]
- Murdock, H.; de Bruijn, K.; Gersonius, B.; Murdock, H.J.; De Bruijn, K.M.; Gersonius, B. Assessment of critical infrastructure resilience to flooding using a response curve approach. Sustainability 2018, 10, 3470. [Google Scholar] [CrossRef]
- Bertilsson, L.; Wiklund, K.; de Moura Tebaldi, I.; Rezende, O.M.; Veról, A.P.; Miguez, M.G. Urban flood resilience—A multi-criteria index to integrate flood resilience into urban planning. J. Hydrol. 2018. [Google Scholar] [CrossRef]
- Batica, J. Methodology for Flood Resilience Assessment in Urban Environments and Mitigation Strategy Development. Ph.D. Thesis, Université Nice Sophia Antipolis, Nice, France, 2015. [Google Scholar]
- Kazakis, N.; Kougias, I.; Patsialis, T. Assessment of flood hazard areas at a regional scale using an index-based approach and analytical hierarchy process: Application in rhodope-evros region, Greece. Sci. Total Environ. 2015, 538, 555–563. [Google Scholar] [CrossRef]
- Tehrany, M.S.; Pradhan, B.; Mansor, S.; Ahmad, N. Flood susceptibility assessment using GIS-based support vector machine model with different kernel types. Catena 2015, 125, 91–101. [Google Scholar] [CrossRef]
- Zhao, G.; Pang, B.; Xu, Z.; Peng, D.; Xu, L. Assessment of urban flood susceptibility using semi-supervised machine learning model. Sci. Total Environ. 2019, 659, 940–949. [Google Scholar] [CrossRef]
- Balica, S.F.; Douben, N.; Wright, N.G. Flood vulnerability indices at varying spatial scales. Water Sci. Technol. 2009, 60, 2571–2580. [Google Scholar] [CrossRef]
- Antwi, E.K.; Boakye-Danquah, J.; Barima Owusu, A.; Loh, S.K.; Mensah, R.; Boafo, Y.A.; Apronti, P.T. Community vulnerability assessment index for flood prone savannah agro-ecological zone: A case study of Wa West District, Ghana. Weather Clim. Extrem. 2015, 10, 56–69. [Google Scholar] [CrossRef] [Green Version]
- Zonensein, J.; Gomes Miguez, M.; Cesar, F.; Mascarenhas, B. Flood risk index as an urban management tool. In Proceedings of the 11th International Conference on Urban Drainage, Edinburgh, UK, 31 August–September 2008. [Google Scholar]
- Merz, B.; Kreibich, H.; Schwarze, R.; Thieken, A. Review article “assessment of economic flood damage”. Nat. Hazards Earth Syst. Sci. 2010, 10, 1697–1724. [Google Scholar] [CrossRef]
- Ouma, Y.; Tateishi, R.; Ouma, Y.O.; Tateishi, R. Urban flood vulnerability and risk mapping using integrated multi-parametric AHP and GIS: Methodological overview and case study assessment. Water 2014, 6, 1515–1545. [Google Scholar] [CrossRef]
- Kötter, T.; Vafeidis, A.; Moghadas, M.; Asadzadeh, A.; Fekete, A. A multi-criteria approach for assessing urban flood resilience in Tehran, Iran. Int. J. Disaster Risk Reduct. 2019, 35, 101069. [Google Scholar]
- Chen, K.-F.; Leandro, J. A conceptual time-varying flood resilience index for urban areas: Munich city. Water 2019, 11, 830. [Google Scholar] [CrossRef]
- Shivaprasad Sharma, S.V.; Roy, P.S.; Chakravarthi, V.; Srinivasa Rao, G. Flood risk assessment using multi-criteria analysis: A case study from Kopili river basin, Assam, India. Geomat. Nat. Hazards Risk 2018, 9, 79–93. [Google Scholar]
- Abhas, K.; Jha Todd, W.; Miner, Z.S.-G. Building Urban Resilience; Jha, A.K., Miner, T.W., Stanton-Geddes, Z., Eds.; The World Bank: Washington, DC, USA, 2013; ISBN 978-0-8213-8865-5. [Google Scholar]
- Miguez, M.G.; Raupp, I.P.; Veról, A.P. An integrated quantitative framework to support design of resilient alternatives to manage urban flood risks. J. Flood Risk Manag. 2018, 1–13. [Google Scholar] [CrossRef]
- Rezende, O.M. Quantitative Analysis of Flood Resilience for Urban Planning: Case of the Canal do Mangue in-Rio de Janeiro; Universidade Federal do Rio de Janeiro: Rio de Janeiro, Brazil, 2018. [Google Scholar]
- RICE. IMS imagineRio. Available online: https://imaginerio.org (accessed on 21 February 2019).
- Zanobetti, D.; Lorgeré, H. Le modèle mathématique du Delta du Mékong. Houille Blanche 1968, 5, 17–30. [Google Scholar] [CrossRef]
- Silva, B.M.G.; De Sousa, M.M.; Rezende, O.M.; Pitzer, A.C.J.; De França, L.B.R.; Miguez, M.G.; Arrais, C.M. Use of multilevel model for urban flood evaluation. In Proceedings of the XXII Simpósio Brasileiro de Recursos Hídricos, ABRHidro, Florianópolis, Brazil, 26 November–1 December 2017; pp. 1–8. [Google Scholar]
- Mascarenhas, F.C.B.; Miguez, M.G. Urban flood control through a mathematical cell model. Water Int. 2002, 27, 208–218. [Google Scholar] [CrossRef]
- Miguez, M.G.; Battemarco, B.P.; De Sousa, M.M.; Rezende, O.M.; Veról, A.P.; Gusmaroli, G. Urban flood simulation using MODCEL-an alternative quasi-2D conceptual model. Water 2017, 9, 445. [Google Scholar] [CrossRef]
- COPPETEC. Execução de Concepção e de Projetos de Obras Civis e Ações de Controle das Enchentes na Bacia Hidrográfica do Canal do Mangue; COPPETEC: Rio de Janeiro, Brazil, 2000. [Google Scholar]
- Rio-Águas Estudos Hidrológicos E Dimensionamento; Prefeitura Municipal do Rio de Janeiro: Rio de Janeiro, Brazil, 2010.
- US Department of the Interior, Bureau of Reclamation. Design of Small Dams, 3th ed.; Reclamation, B., Ed.; US Government Printing Office: Denver, CO, USA, 1987.
- Chow, V.; Maidment, D.R.; Mays, L.W. Applied Hydrology; Internatio; McGraw-Hill: Singapore, 1988; ISBN 007070242X. [Google Scholar]
Figure 1.
Standardization of the Building Exposure indicator (Ibe).

Figure 2.
Standardization of the Urban Infrastructure Exposure indicator (Iie).

Figure 3.
Standardization of the Flood Height indicator (Ih).

Figure 4.
Example of random sequence of events 1–1000 return period.

Figure 5.
Canal do Mangue catchment [37].
Figure 5.
Canal do Mangue catchment [37].

Figure 6.
Canal do Mangue region: (a) Natural condition and (b) Present condition [38].
Figure 6.
Canal do Mangue region: (a) Natural condition and (b) Present condition [38].

Figure 7.
Division of the Canal do Mangue catchment in flow cells.

Figure 8.
Localization of measuring stations and water level results of the calibration process.

Figure 9.
Spatial distribution of Building Exposure (Ibe) and Urban Infrastructure indicators (Iie).
Figure 9.
Spatial distribution of Building Exposure (Ibe) and Urban Infrastructure indicators (Iie).

Figure 10.
Flood Height indicator (Ih) for a 25-year event: (C0) without interventions, (C1) with concentrated measures and (C2) with distributed interventions.
Figure 10.
Flood Height indicator (Ih) for a 25-year event: (C0) without interventions, (C1) with concentrated measures and (C2) with distributed interventions.

Figure 11.
Risk to Resistance Capacity Index (RCI) for a 25-year event: (C0) without interventions, (C1) concentrated measures and (C2) distributed interventions.
Figure 11.
Risk to Resistance Capacity Index (RCI) for a 25-year event: (C0) without interventions, (C1) concentrated measures and (C2) distributed interventions.

Figure 12.
Risk to Resistance Capacity Index (RCI) considering a sequence of events over a 50-year horizon: (C0) without interventions, (C1) concentrated measures and (C2) distributed interventions.
Figure 12.
Risk to Resistance Capacity Index (RCI) considering a sequence of events over a 50-year horizon: (C0) without interventions, (C1) concentrated measures and (C2) distributed interventions.

Figure 13.
Example of RCI results in Cell 10 scenarios C0, C1 and C2.

Figure 14.
Comparative results of RCI RT 25 C0 and Time-integrated with flooded areas in the Canal do Mangue catchment.
Figure 14.
Comparative results of RCI RT 25 C0 and Time-integrated with flooded areas in the Canal do Mangue catchment.


Table 1.
Total rainfall in millimeters measured in 24 hours on the events selected for calibration and validation of the mathematical modelling.
Table 1.
Total rainfall in millimeters measured in 24 hours on the events selected for calibration and validation of the mathematical modelling.
| Station | PGRJ | PSTR | PSAD | PTJC | PABV | PDCV | PANDA |
|---|---|---|---|---|---|---|---|
| Calibration | 127.4 | 66.9 | 103.1 | 92.3 | 101.5 | 88.9 | 113.6 |
| Validation | 66.78 | 13.89 | 35.62 | 35.42 | 15.79 | 29.5 | 50.05 |
Table 2.
Design storm of the proposed hydrological event.
| T (min) | 30 | 60 | 90 | 120 | 150 | 180 | TOTAL |
|---|---|---|---|---|---|---|---|
| Rainfall (mm) | 4.59 | 7.50 | 10.90 | 60.87 | 19.28 | 5.69 | 108.84 |
Table 3.
Flood risk indicators classes.
| Classes | Indicator Value | |
|---|---|---|
| Very low | 0.00 | 0.20 |
| Low | 0.20 | 0.40 |
| Moderate | 0.40 | 0.60 |
| High | 0.60 | 0.80 |
| Very high | 0.80 | 1.00 |
Table 4.
Global index for the Canal do Mangue catchment.
| Scenario | 25-Year Event | Time-Integrated Analysis |
|---|---|---|
| C0 | 0.238 | 0.134 |
| C1 | 0.192 | 0.103 |
| C2 | 0.166 | 0.086 |
© 2019 by the authors. Licensee MDPI, Basel, Switzerland. This article is an open access article distributed under the terms and conditions of the Creative Commons Attribution (CC BY) license (http://creativecommons.org/licenses/by/4.0/).
Share and Cite
MDPI and ACS Style
Rezende, O.M.; Guimarães, L.F.; Miranda, F.M.; Haddad, A.N.; Miguez, M.G. A Time-Integrated Index for Flood Risk to Resistance Capacity. Water 2019, 11, 1321. https://doi.org/10.3390/w11071321
AMA Style
Rezende OM, Guimarães LF, Miranda FM, Haddad AN, Miguez MG. A Time-Integrated Index for Flood Risk to Resistance Capacity. Water. 2019; 11(7):1321. https://doi.org/10.3390/w11071321
Chicago/Turabian StyleRezende, Osvaldo M., Luciana F. Guimarães, Francis M. Miranda, Assed N. Haddad, and Marcelo G. Miguez. 2019. "A Time-Integrated Index for Flood Risk to Resistance Capacity" Water 11, no. 7: 1321. https://doi.org/10.3390/w11071321
Note that from the first issue of 2016, this journal uses article numbers instead of page numbers. See further details here.