Article

An Endorheic Lake in a Changing Climate: Geochemical Investigations at Lake Trasimeno (Italy)

1
Dipartimento di Fisica e Geologia, Università degli Studi di Perugia, Via Pascoli snc, 06100 Perugia, Italy
2
Arpa Umbria, Agenzia regionale per la protezione ambientale, Via Pievaiola 207/B-3 San Sisto, 06132 Perugia, Italy
3
Consiglio Nazionale delle Ricerche, Istituto di Ricerca per la Protezione Idrogeologica, Via della Madonna Alta 126, 06128 Perugia, Italy
4
Istituto Nazionale di Geofisica e Vulcanologia, sezione di Napoli Osservatorio Vesuviano, Via Diocleziano 328, 80124 Napoli, Italy
5
Istituto Nazionale di Geofisica e Vulcanologia, sezione di Bologna, Via Creti 12, 40128 Bologna, Italy
*
Author to whom correspondence should be addressed.
Water 2019, 11(7), 1319; https://doi.org/10.3390/w11071319
Submission received: 18 May 2019 / Revised: 17 June 2019 / Accepted: 24 June 2019 / Published: 26 June 2019
(This article belongs to the Section Water Quality and Contamination)

Abstract

:
Lake Trasimeno is a shallow, endorheic lake located in central Italy. It is the fourth Italian largest lake and is one of the largest endorheic basins in western Europe. Because of its shallow depth and the absence of natural outflows, the lake, in historical times, alternated from periods of floods to strong decreases of the water level during periods of prolonged drought. Lake water is characterised by a NaCl composition and relatively high salinity. The geochemical and isotopic monitoring of lake water from 2006 to 2018 shows the presence of well-defined seasonal trends, strictly correlated to precipitation regime and evaporation. These trends are clearly highlighted by the isotopic composition of lake water (δ18O and δD) and by the variations of dissolved mobile species. In the long term, a progressive warming of lake water and a strong increase of total dissolved inorganic solids have been observed, indicating Lake Trasimeno as a paradigmatic example of how climate change can cause large variations of water quality and quantity. Furthermore, the rate of variation of lake water temperature is very close to the rate of variation of land-surface air temperature, LSAT, suggesting that shallow endorheic lakes can be used as a proxy for global warming measurements.

1. Introduction

Lakes are dynamic systems that are very sensitive to climate change. In particular, endorheic lakes are very useful climatic indicators because of the high sensitivity of their physical, chemical and isotopic parameters to the variations of climatic factors such as precipitation, radiation and temperature [1,2,3,4]. In closed lakes, even relatively small changes in precipitation and evaporation can produce large fluctuations in water level and salinity. For that reason, variations in lake level, chemical and isotopic composition of lake water (δ18O and δD), deposition rate and composition of lake sediments can provide detailed records of climate changes on different time-scales. Apart from the Caspian sea, which is the largest endorheic basin of the world, Europe comprises relatively few terminal lakes of significant dimensions. One of the largest is Lake Trasimeno, located in Umbria (central Italy). Lake Trasimeno (Figure 1) is a shallow lake of remarkable naturalistic interest and a significant resource for the economy of the region [5,6]. The lake has a surface area of about 120.5 km2 and is the largest lake of peninsular Italy and the fourth largest by surface area in Italy (Figure 1); based on the measurements obtained for the last 50 years, the lake shows an average depth of about 4.7 m and an average water level at 257.1 m a.s.l. Because of its shallow depth and the absence of natural outflows, the lake caused periodical floods in the past, only partially attenuated by an artificial outlet (San Savino outlet in Figure 1) built during Roman times and restored at the end of the 19th century. On the other hand, during the periods of drought, the lake often experienced strong decreases of the water level (e.g., up to −2.63 m below hydrometric zero level in 1958).
In order to overcome the drying up caused by a strong drought period in the late 1950s, the catchment area has been artificially enlarged in the period 1957–62 connecting the Tresa, Rigo Maggiore, Moiano, and Maranzano river basins to the lake by means of the Anguillara channel [7] and in 1960, the hydrometric zero level wasset at 257.33 m a.s.l.. This large hydraulic work temporarily solved the crisis but other periods of very low water level have occurred during the last 50 years [5,8]. In particular the lake level decreased more than 1 m below the hydrometric zero level from 1970 to 1975 (after that drought period, the outlet threshold was raised to 257.50 m a.s.l. in 1983) and in the period 1989–2012, when it almost reached 2 m below hydrometric zero level. However the decrease of lake level has not been constant with time and during the last drought period the lake level showed numerous fluctuations. Finally during the rainy years 2013–2014, the lake level underwent a strong increase and, to prevent flooding of coastal areas, in January 2015, the artificial outlet was opened for some days after a total closure of about 30 years, during which evaporation was the only natural output of the system. During the periods of decreasing water level, the lake showed an increase of suspended solids, a progressive accumulation of dissolved salts and an increase of the total alkalinity of lake water [5].
At present, the lake can still be classified as a freshwater system (TDS = 0.8‰ in 2006) but, according to Ludovisi and Gaino [5], in a few centuries the lake will reach the TDS value of 5‰, the conventional threshold between fresh and saline waters [9]. Considering that both IPCC regional climate projections for southern Europe [10,11] and local studies [12,13] show a significant increase of the mean temperature and a decrease of runoff during the 21st century, lake Trasimeno will almost certainly experience other drought periods and strong water level changes in the coming decades [14]. In order to understand the quantitative and qualitative changes that could affect lake Trasimeno in the near future, it is very important to individuate the qualitative and quantitative long-term trends and distinguish them from the short-term variations. A long record of hydrologic data is available, allowing reliable studies on quantitative variations at lake Trasimeno [5,15], but only a few chemical datasets are available and some of them are incomplete or cover only short periods of observation. Also, isotopic data are scarce and the most recent date back to 1971 [16,17]. Furthermore most of the studies on water quality are focused on the assessment and monitoring of the trophic and ecological condition of the lake [18,19,20,21,22] and only a recent work [5] studied the relationships between water quality and meteorological regime, suggesting that the most evident change in the water quality of Trasimeno lake during the last decades is the salinity increase. In this work, new chemical and isotopic data (δ18O, δD and δ13C of dissolved carbon) collected from 2006 to 2018 and including both periods of drought (2006–2010) and relatively rainy periods (2012–2014) are presented in order (i) to explore the main geochemical processes affecting lake water composition, (ii) to investigate the relationships of lake water chemical and isotopic composition with seasonal water level changes and (iii) to individuate possible long-term geochemical, isotopic and temperature trends. The comparison of long-term variations with global variations of temperature could shed some light on the effects of climate change on shallow endorheic lakes, exploring the possibility of using them as indicators of climate trends.

2. Materials and Methods

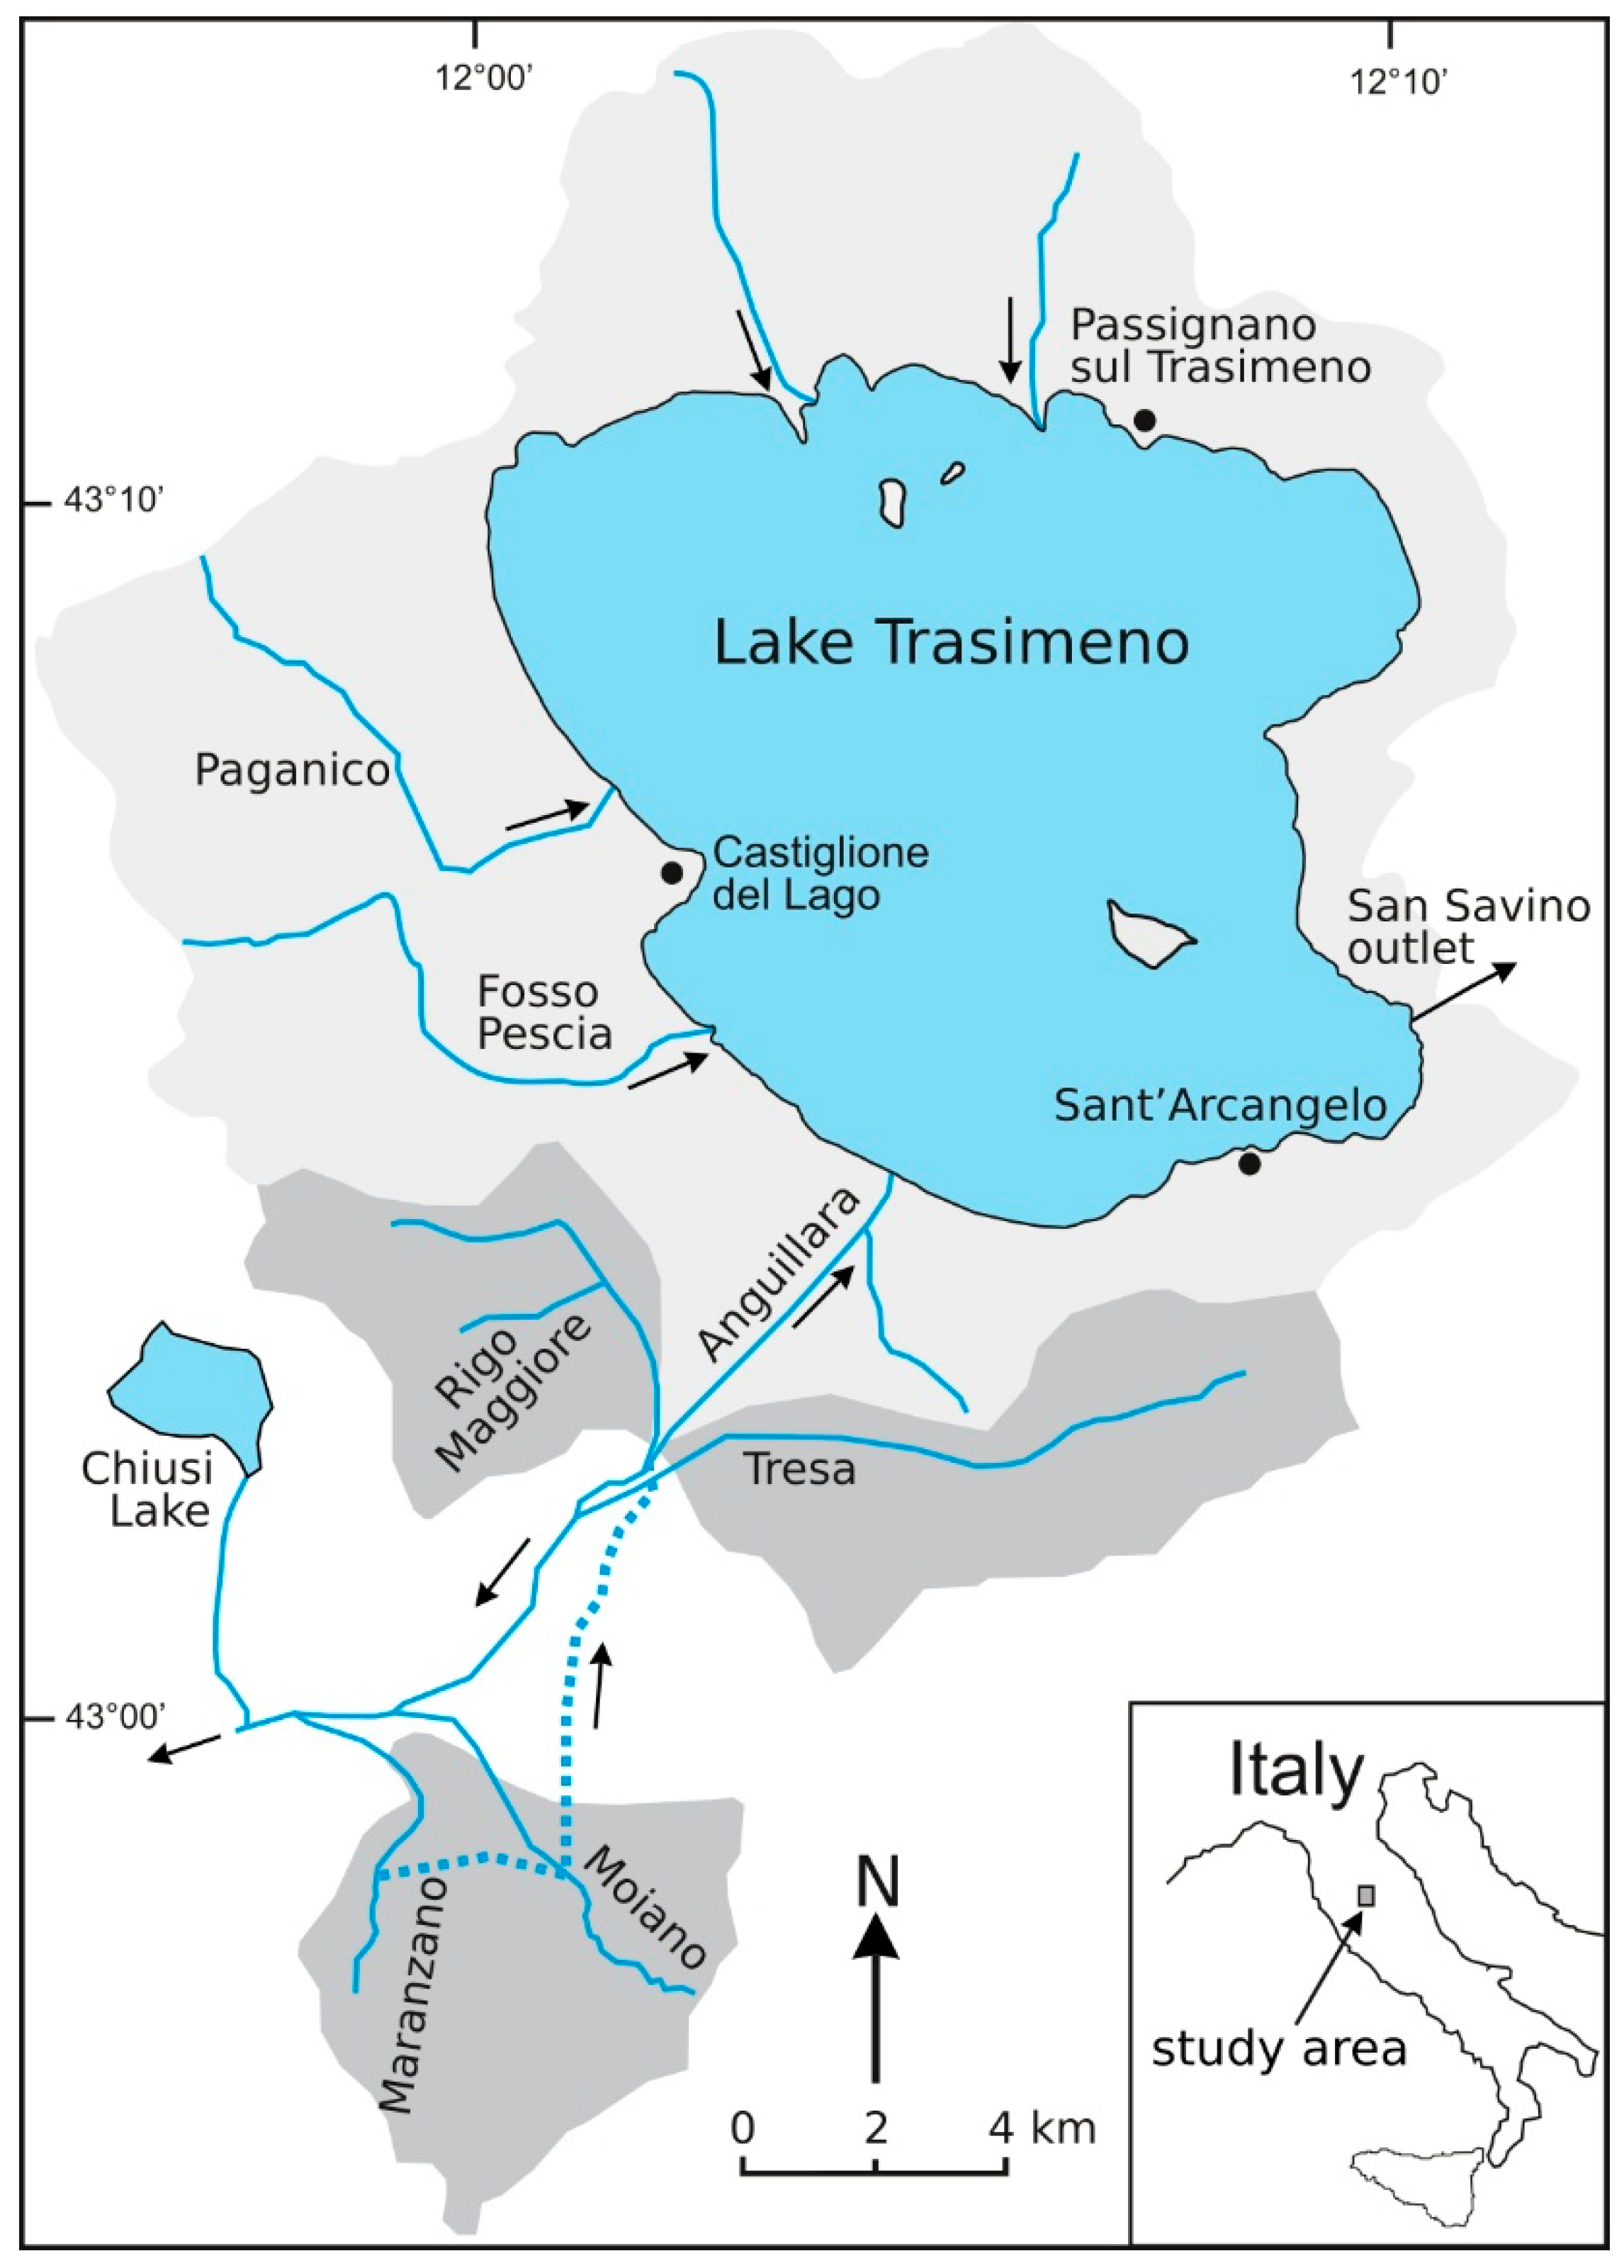
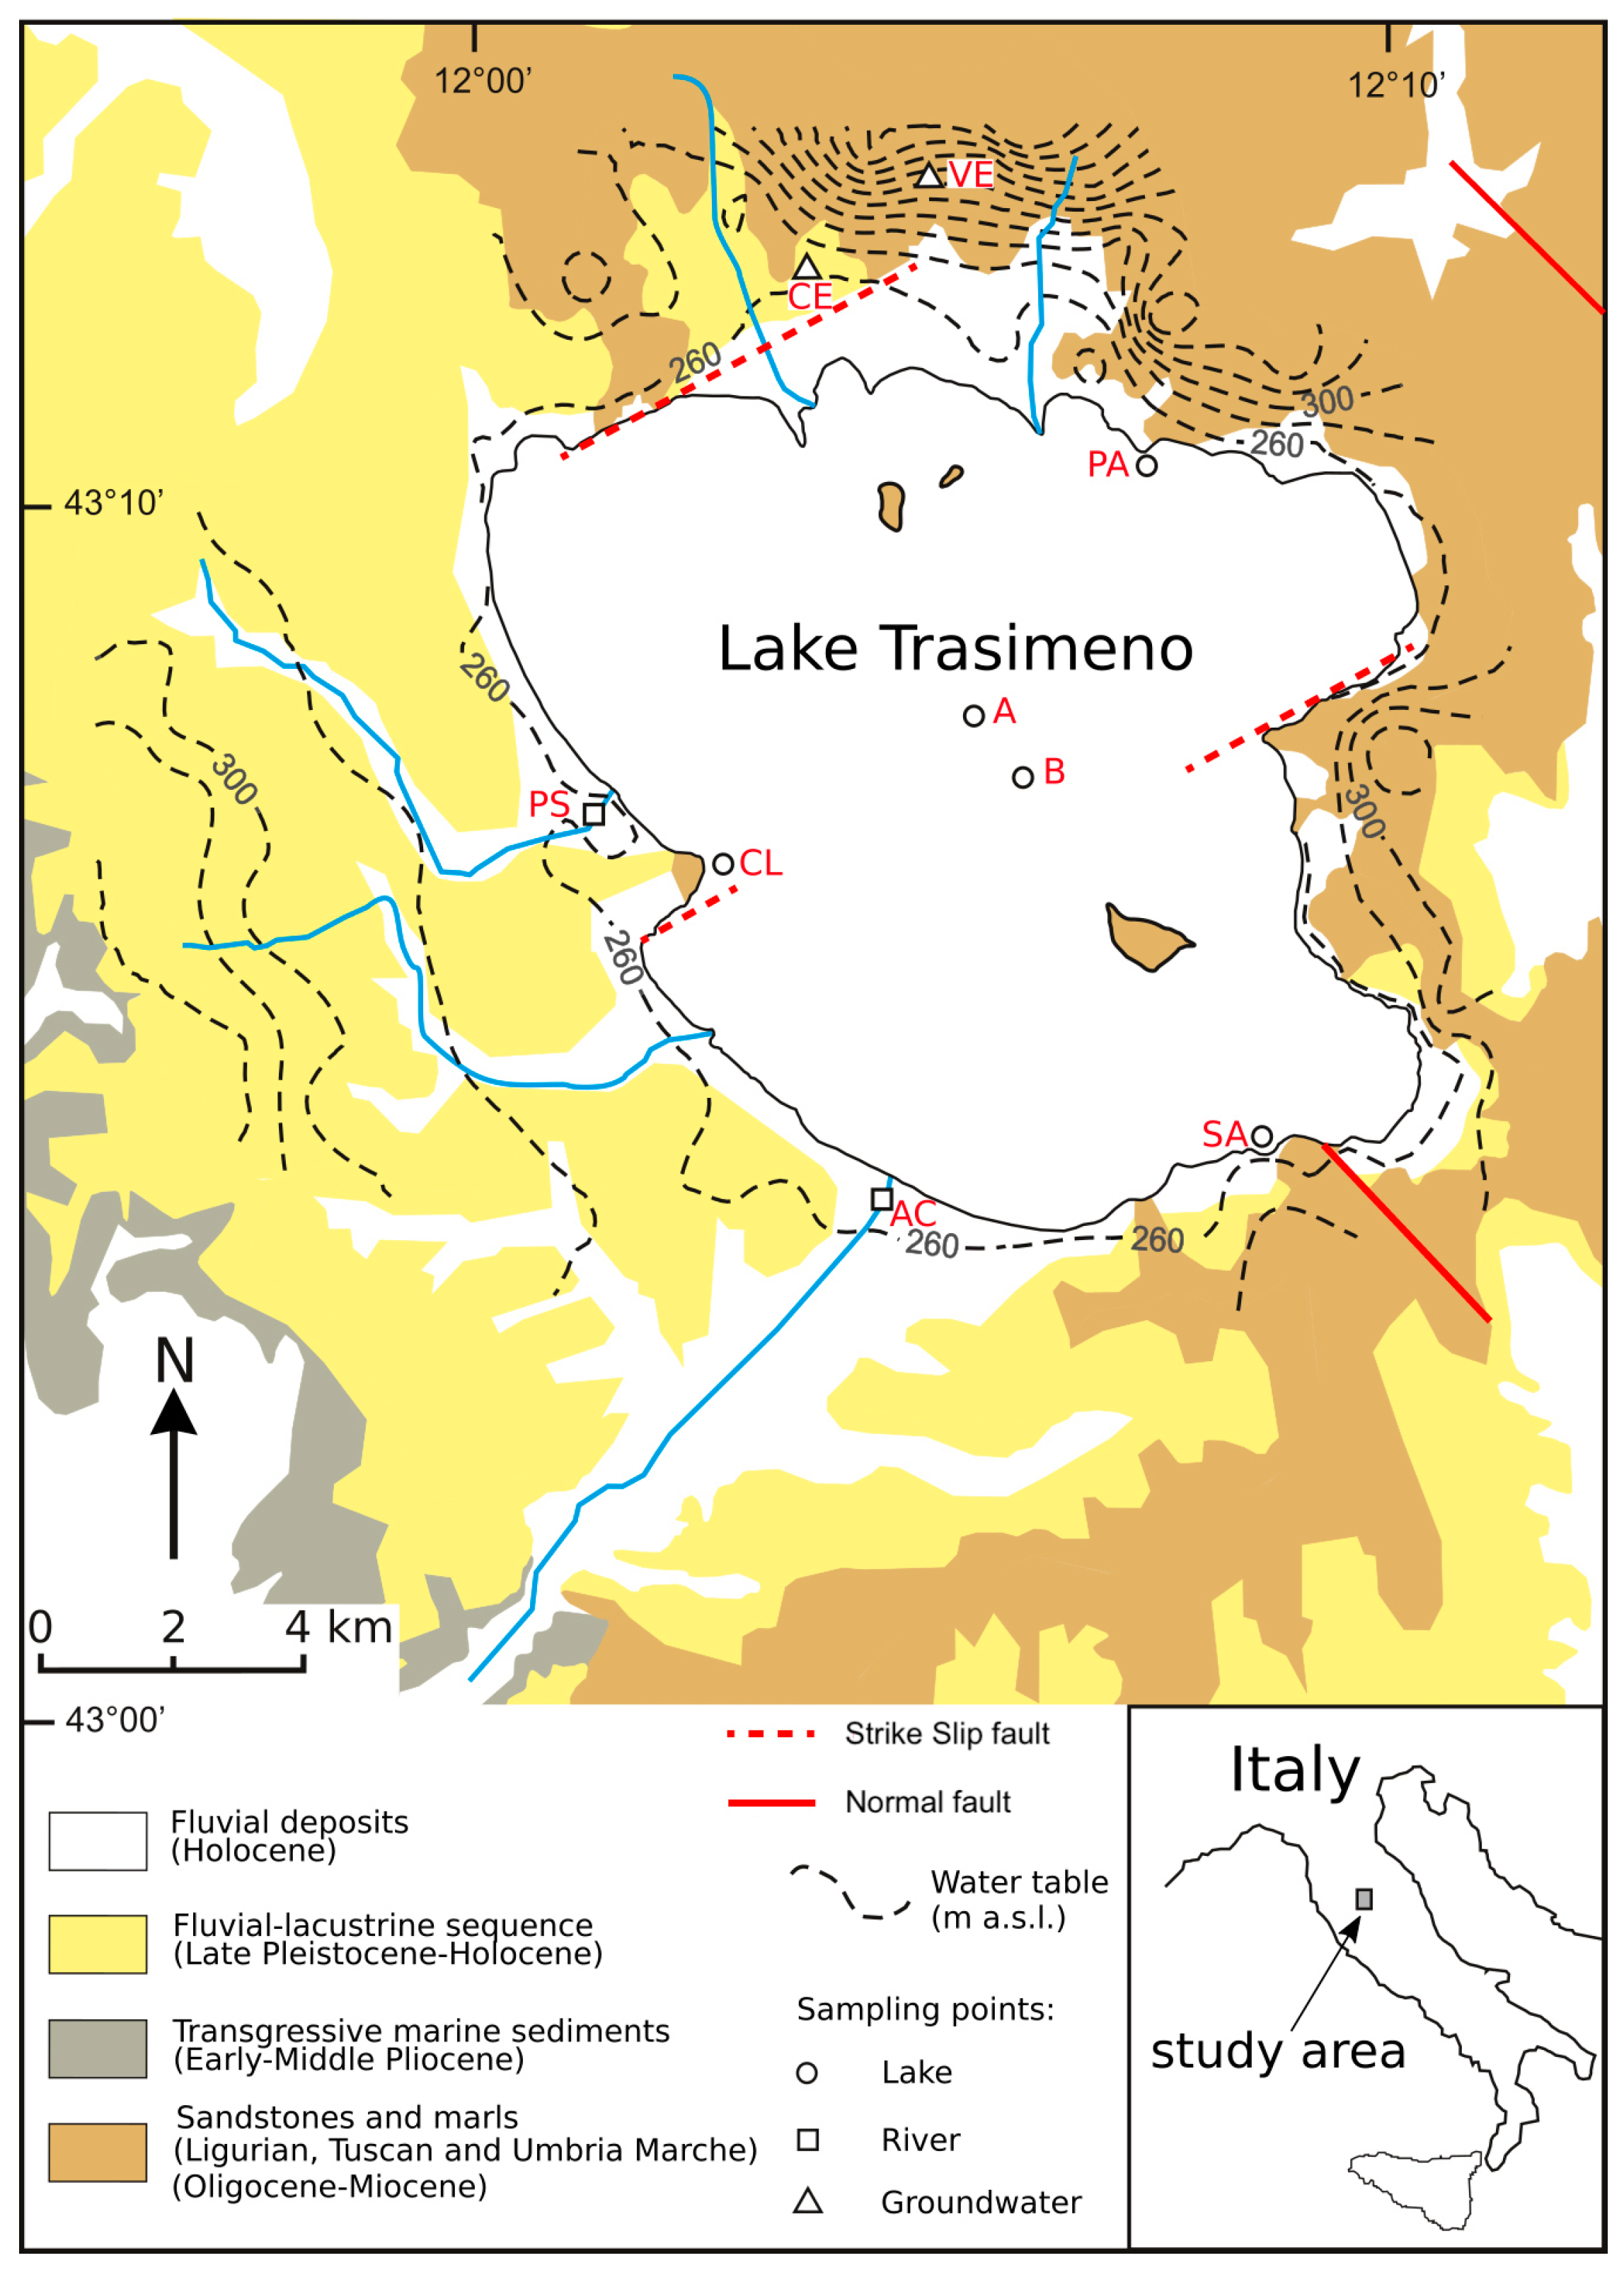
2.1. The Study Area: Geological, Hydrogeological and Hydrological Setting

The geological and structural setting of Lake Trasimeno (Figure 2) is related to the development of the Northern Apennine chain, a NE verging thrust belt interpreted as the result of convergence between the Alpine orogen and the African plate, starting in Oligocene-Early Miocene times [23]. The tectonic evolution of the Northern Apennines has been characterised by the contemporaneous activity and eastward migration of coupled compression, in the foreland, and extension, in the hinterland [24]. In the study area, the early compressional phase produced the overthrusting of the Tuscan nappe and Ligurian units on the Umbria-Marches units. The compressional phase ended in Late Serravallian time [25] and was followed by extensional deformations related to the opening of Northern Tyrrhenian Sea. The extensional phase started to develop in the inner (i.e., western) side of the Apennine belt from Middle Miocene time and reached the Trasimeno area in the Early-Middle Pliocene [26,27,28], generating a set of NW–SE normal faults and grabens that developed over the pre-existing compressional structures [28]. All the main tectonic units of Northern Apennines are present in the Lake Trasimeno area: Ligurian units (Eocene-Oligocene) crop out in a few places near Castiglione del Lago and overlay the Tuscan Unit turbidites (Macigno Fm., Oligocene-Early Miocene in age) that are extensively exposed in the eastern, southern and northern portion of the Lake Trasimeno basin. The Tuscan Unit, in turn, overlay the turbidites of the Rentella Unit (Oligocene-Early Miocene) and of the Umbria-Marche Unit (Marnoso-Arenacea Fm., Early/Middle Miocene in age) outcropping west of Lake Trasimeno [29]. The Tuscan turbidites and the Ligurian units are covered in the basinal zones by continental and shallow marine sediments composed from top to bottom by: fluvial deposits (Holocene), a lacustrine sequence up to 200 m thick and mainly made up by clay and silt (Middle Pleistocene-Holocene), a continental sequence composed by sands and gravels (Late Pliocene-Early Pleistocene) and a transgressive marine sequence (Early-Middle Pliocene). The Early Pliocene to Holocene sedimentary sequence reflect the complex evolution of the area during extensional tectonics. The Trasimeno area evolved as (i) a marine gulf in the continental shelf of the Tyrrhenian Sea during Early Pliocene, (ii) a fluvial plain during Early Pleistocene and (iii) a large tectonic depression, filled by a fresh water lake and characterised by a rather continuous subsidence from Middle Pleistocene to present-day [28]. At present, Lake Trasimeno represents the residue of the large lacustrine basin formerly filling the tectonic depressions of the area during Pleistocene [30]. Both the fluvial, lacustrine and marine deposits (Pliocene to Holocene) outcropping on the western side of the basin and the sandstones and marls (Oligocene-Miocene), outcropping north-east, east and south-east of the lake are characterised by low permeability (Figure 2). However, despite their low permeability, these formations host small aquifers [31,32] where all the infiltrating water radially flows towards the lake (Figure 2). Both piezometric and structural data suggest that the hydrogeological basin is practically coincident with the catchment area [15].
The lake surface area depends on lake level and varies from 116.5 km2 to 124.5 km2, with an average of 120.5 km2 while the catchment area, excluding the lake surface, is 264.5 km2 [15], with an average altitude of about 330 m a.s.l.. The annual rainfall on the lake is 700 mm and 730 mm on the catchment area, the mean air temperature is 14.5 °C, the average evaporation from the lake is 1030 mm while the evapotranspiration from the catchment area is 535 mm. The artificial withdrawal from the lake is about 10% of evaporation. The average water level of the lake results to be 257.1 m a.s.l., about 20 cm lower than reference water level (257.33 m a.s.l.) and the maximum depth of the lake with respect to the average water level is 5.5 m. The mean volume of water stored in the lake during the period 1984–2006 is 490 × 106 m3 and the average residence time (τ), computed for the same period as the ratio of the mass of water contained in the system and the output mass flow rate is 4.1 ± 0.2 yr. Because of the small extension of the basin with respect to the average surface area of the lake, the annual water inflows are frequently lower than evaporation losses and the water balance of the lake is strongly affected by the pluviometric regime [5,6]. Dragoni at al. [6] derived a simple relation between precipitation (P) and lake level changes (Δh):
Δh = 2.195 P − 1.538
According to Equation (1), the minimum amount of precipitation that is necessary to keep the average lake level unchanged (Δh = 0) is about 700 mm: for P > 700 mm, the lake level increases and for P < 700 mm the lake level decreases. The diagram of Figure 3 illustrates the variations of lake level and precipitations from 1960, when the hydrometric zero level has been set at 257.33 m a.s.l., to 2017. The diagram shows an increase in lake level from 1960 to 1965, caused by the enlargement of the catchment area, followed by the alternation of wet periods and drought crisis, characterised by very low lake levels. In January 2015, after the rainy years 2013–2014, in order to prevent flooding of coastal areas, the artificial outlet has been opened for some days after a total closure of about 30 years during which evaporation was the only natural output of the system. Since summer 2015, the lake level started to decrease again.

2.2. Sampling and Analyses

From March 2006 to June 2015, the waters of Lake Trasimeno were sampled at Castiglione del Lago (CL, 65 samples), Sant’Arcangelo (SA, 6 samples) and Passignano (PA, 4 samples). Water samples were taken at about 30–50 cm depth. In addition, in August 2007, lake waters were sampled at the centre of the lake along two vertical profiles, A and B in Figure 2, with a vertical spacing between samples of about 1 m (six samples along the profile A and four samples along profile B). The two major tributaries of the lake, Anguillara channel (AC) and Paganico stream (PS), were sampled in November 2006, May 2007, November 2007, March 2008 and August 2008 and two samples of groundwater were collected from the Vernazzano spring (VE) and Cerrete well (CE) in March 2008. Location of sampling points is shown in Figure 2. For each water sample, temperature, pH, Eh, electrical conductivity, silica, NH4+ and HCO3 were determined in the field. HCO3 concentration was determined by titration with HCl (0.01 N), silica and NH4+ concentrations were determined using 114410 and 114423 MQuant colorimetric test kits (detection limits 0.02 mg/L and 0.2 mg/L respectively). Water samples for chemical analyses were collected in 100 mL and 50 mL HDPE (high-density polyethylene) bottles. Both the aliquots were filtered upon sampling through 0.45 µm membrane filters and the 50 mL aliquot was subsequently acidified with 1% HCl. The chemical analyses were performed at the laboratory of Department of Physics and Geology of Perugia University. Ca and Mg were determined by atomic absorption flame spectroscopy, and Na and K were determined by atomic emission flame spectroscopy on the 50 mL acidified aliquot using an IL951 AA/AE spectrometer. F, Cl, NO3, PO43− and SO42− were determined by ion chromatography on the 100 mL filtered aliquot using a Dionex DX120 Ion Chromatography System equipped with an AS50 autosampler. All the laboratory analytical methods and the field determinations have an accuracy better than 2% and the total analytical error, evaluated by checking the charge balance, is about 2.5% on average.
Along the vertical profiles A and B (Figure 2), we collected ten samples (six along profile A and four along profile B) for the chemical analyses, following the same procedure of surface samples, and we measured temperature (resolution = 0.1 °C, accuracy = ±0.1 °C), pH (resolution = 0.01, accuracy = ±0.02 pH units), Eh (resolution = 0.1 mV, accuracy = ±0.5 mV), electrical conductivity (resolution = 1 µS/cm, accuracy = ±1%) and dissolved oxygen (DO; resolution = 0.01 mg/L, accuracy = ±1%) using a WTW MultiLine multiparametric probe.
Water samples for oxygen and hydrogen isotopic analyses were collected in 50 ml HDPE bottles and analysed by mass spectrometry. For the determination of δ13C of total dissolved inorganic carbon (δ13CTDIC, TDIC), all the dissolved carbon species were precipitated in the field as SrCO3 by adding an excess of SrCl2 and NaOH to 1000 mL of water. In the laboratory, carbonate precipitates were filtered, washed with distilled water and dried in a CO2-free atmosphere. Isotopic analyses were performed by mass spectrometry on the CO2 gas released from the precipitate by reaction with 100% H3PO4 under vacuum. Isotope analyses have been carried out at the Geochemistry Laboratory of INGV-Osservatorio Vesuviano using a Finnigan Delta plusXP continuous flow mass spectrometer coupled with GasbenchII device (analytical errors are ±1‰ for δD, ±0.08‰ for δ18O and ±0.06‰ for δ13C). Field data and the results of the chemical and isotopic analyses are reported in supplementary material (Tables S1 and S2 respectively). The chemical dataset (Table S2) has been complemented with the analyses of 54 samples (temperature, pH, Eh, conductivity, silica, P, PO43−, NH4+, NO3, DO and total alkalinity) carried out by ARPA-Umbria, the Environmental Protection Agency of Umbria, from July 2015 to January 2018, (data available at http://www.arpa.umbria.it/pagine/elenco-monitoraggi [35]). These samples were taken by ARPA at the centre of the lake, just about point A in Figure 2. Aqueous speciation calculations have been performed with the PHREEQC version 3 computer code [36] using the LLNL thermodynamic database [37].

3. Results

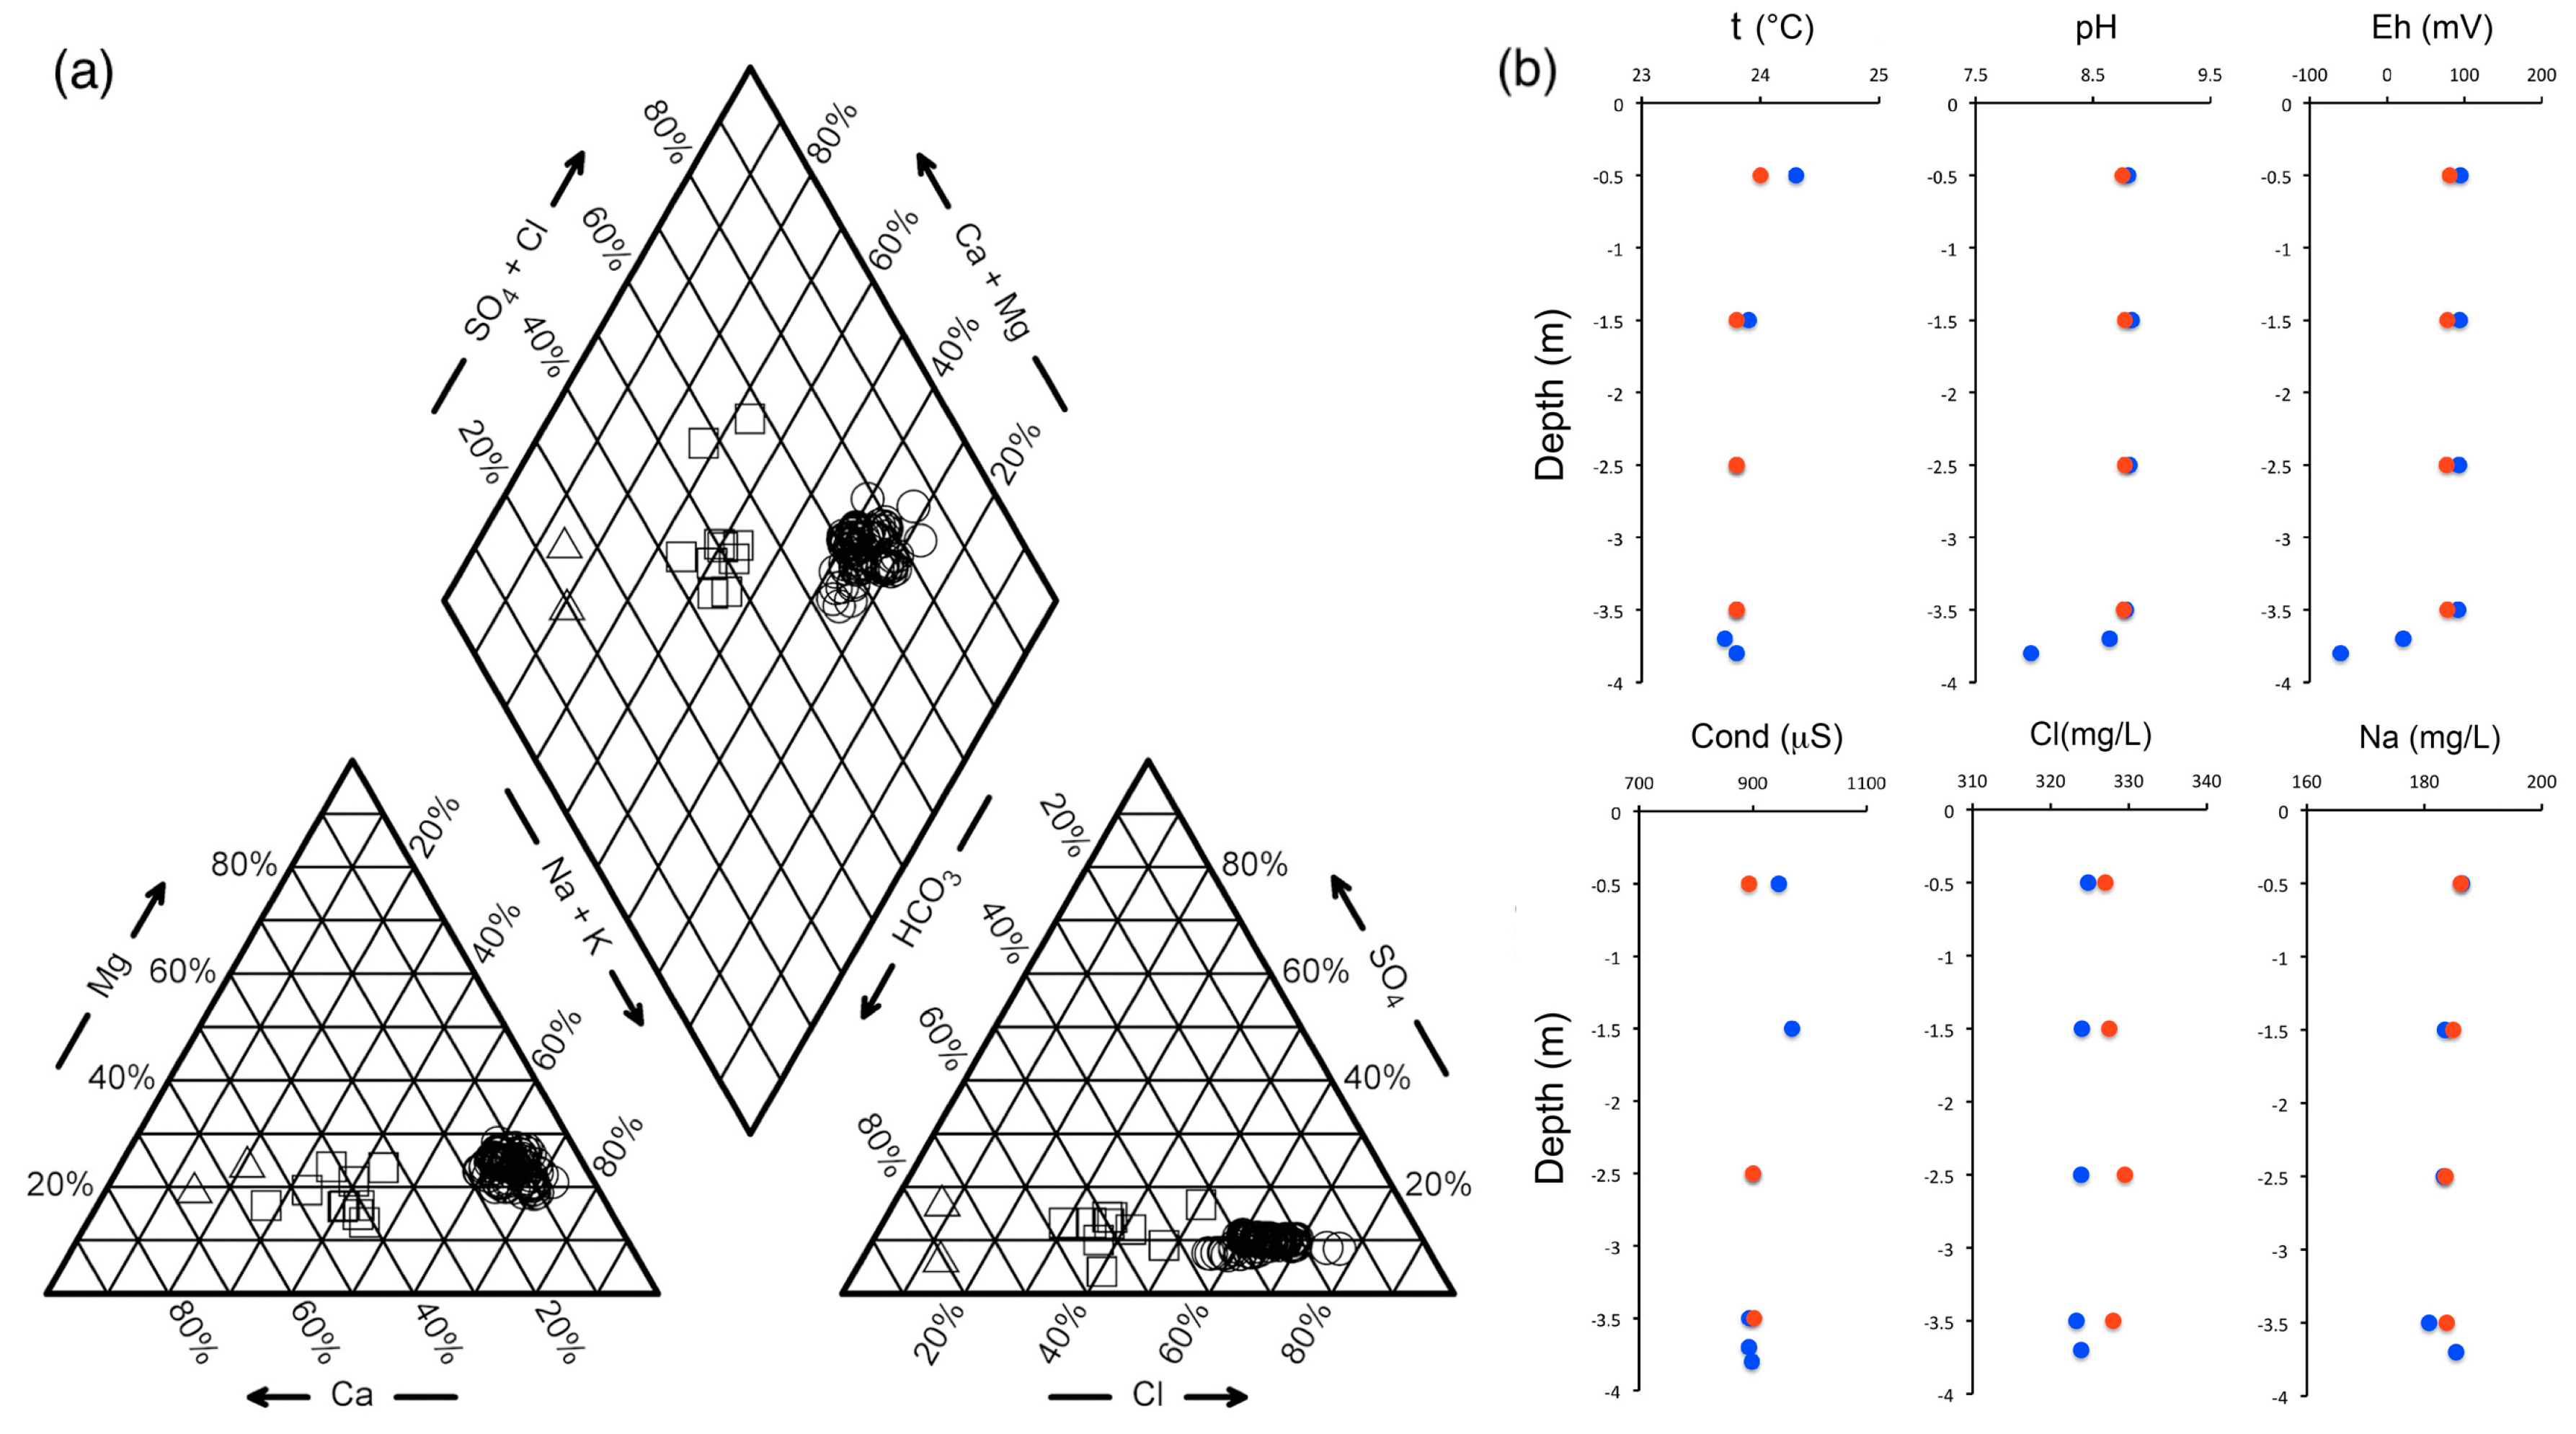
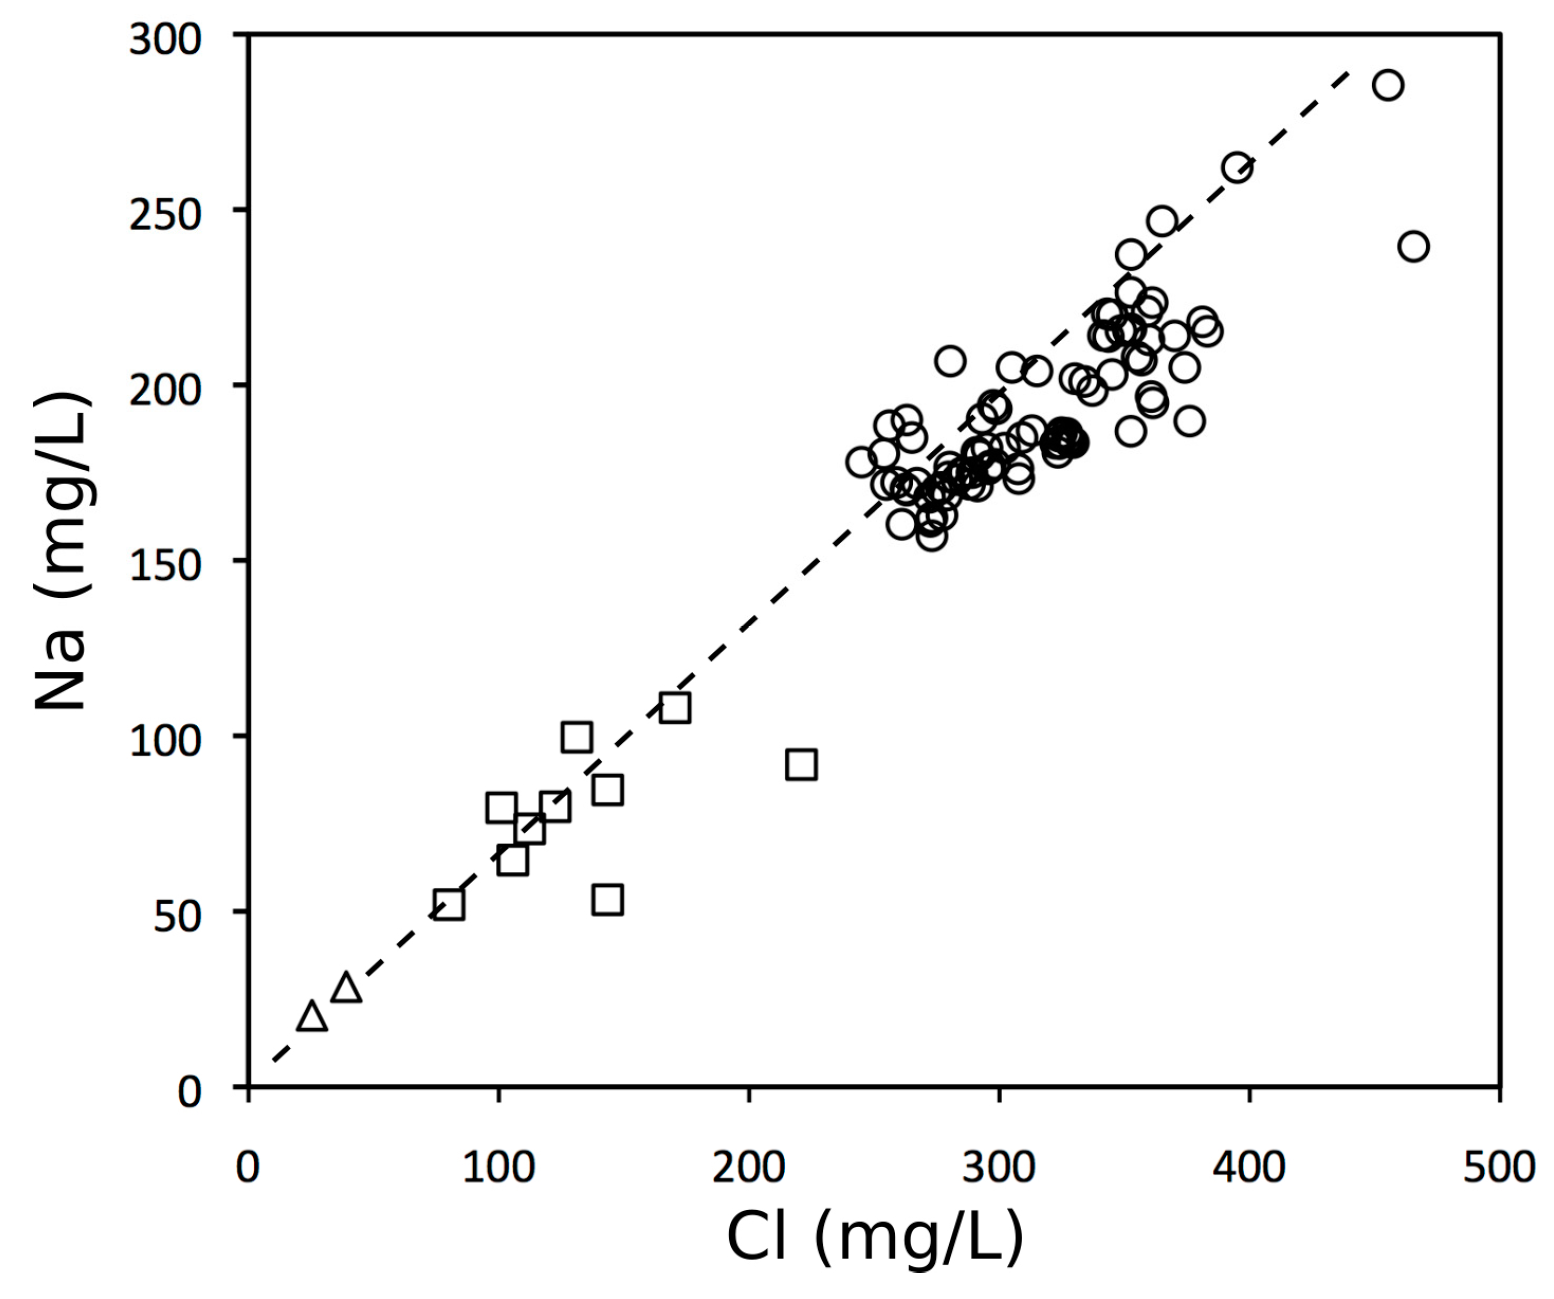
3.1. Chemical Composition of Lake Water, River Waters and Groundwater

Based on the Piper diagram (Figure 4a), it is possible to distinguish three main water groups: (1) lake waters, characterised by Na-Cl composition and total dissolved solids (TDS) comprised between 780 and 1060 mg/L; (2) river waters of the two main lake tributaries, Paganico river and Anguillara channel, characterised by (Na + K)/(Ca + Mg) molal ratios between 0.75 and 1.5, variable Cl and SO4 contents and average values of TDS of 810 mg/L and 615 mg/L respectively; (3) groundwater from Vernazzano spring and Cerrete well, showing a clear Ca-HCO3 composition and TDS of about 550–600 mg/L.
Figure 4b shows the variations with depth of some chemical and physical parameters measured in August 2007 along two vertical profiles located in the middle of the lake (A and B in Figure 2). Water temperature shows only a slight decrease (less than 1 °C) in the first 1.5 m and then remains constant down to the bottom. Eh and pH are practically constant for almost all the water column but show a sharp decrease in the last 0.5 m probably related to redox processes (sulfate reduction and total organic matter decomposition) occurring in bottom lake sediments. Finally, electric conductivity, Cl and Na don’t show any significant variation with depth. These data suggest that Trasimeno is a well-mixed lake where the winds, thanks to the shallow depth of water, can produce a mechanical mixture of the layers in all the water column.
The Na vs. Cl diagram (Figure 5) shows that chloride and sodium contents vary over a wide range of values.
Most lake and river samples are positioned along or below the halite dissolution line (corresponding to a Na/Cl weight ratio of 0.65 and to a molal ratio of 1; dashed line in Figure 5) and the variations of their Cl and Na concentrations are primarily due the effects of dilution during rainy periods, and evaporation during hot, dry periods. The samples showing Na/Cl ratios lower than the theoretical halite dissolution ratio are probably affected by adsorption reactions with clay minerals, hydroxides, and organic matter of bottom lake sediments, causing a relative depletion of Na. In contrast, groundwater sampled from Vernazzano spring and Cerrete well show a Na/Cl ratio higher than the halite dissolution ratio. These samples are representative of circulation in the fractured sandstones of the Oligocene-Miocene turbidites and their Na content mainly derives from the alteration of plagioclase.
The concentrations of nitrates are generally low both in groundwater and lake water: 40 samples are below the nitrate detection limit of 0.02 mg/L and the others range from 0.1 to 4.7 mg/L, lower than the maximum admissible concentration for surface water (50 mg/L) defined both by the Italian and European regulations [38,39]. Nitrate concentrations are higher in river waters, showing values up to 42.70 mg/L in Anguillara channel and 35.12 mg/L in Paganico River. A similar trend is shown by phosphates, which in lake water are generally lower than 0.01 mg/L, with a maximum value of 0.05 mg/L, while in river waters, their concentration ranges from 0.01 to 2.58 mg/L (Table S2 in supplementary material). The relatively high concentrations of nitrates and phosphates in river waters are related to the wide diffusion of agricultural lands and livestock breeding on the Trasimeno draining basin, while their concentrations in lake water are probably limited by phytoplankton and algal growth.

3.2. Aqueous Speciation Calculations

The average value of the logarithm of the partial pressure of CO2 (log10PCO2) and the saturation indexes (SI) of relevant mineral phases are reported in Table 1. Aqueous speciation calculations show that: lake waters are characterised by variable values of SIcalcite, ranging from 0.07 to 1.12 (0.75 on average), oversaturation with respect to ordered dolomite and undersaturation with respect to quartz, chalcedony and amorphous silica; river waters are characterised by similar saturation conditions with respect to calcite and dolomite but are close to equilibrium with quartz and/or chalcedony; groundwater samples are practically at equilibrium with calcite and slightly oversaturated with respect to dolomite and quartz. Oversaturation with respect to ordered dolomite [40,41] is related to kinetic factors preventing dolomite precipitation [42,43] and is commonly observed both on groundwater and surface water in central Italy [44]. All water samples are subsaturated, to different degrees, with respect to fluorite, gypsum and halite. Carbon dioxide partial pressure (PCO2) of lake waters range from 10−4.02 to 10−2.94 bar (average value = 10−3.38 bar), as expected from a lake in equilibrium with atmospheric carbon dioxide (10−3.39 bar assuming a CO2 concentration in atmosphere of 405 ppm). River waters are characterised by slightly higher PCO2 values, while groundwater samples show PCO2 values almost two orders of magnitude higher (10−1.86PCO2 ≤ 10−1.59 bar), probably related to dissolution of soil CO2.

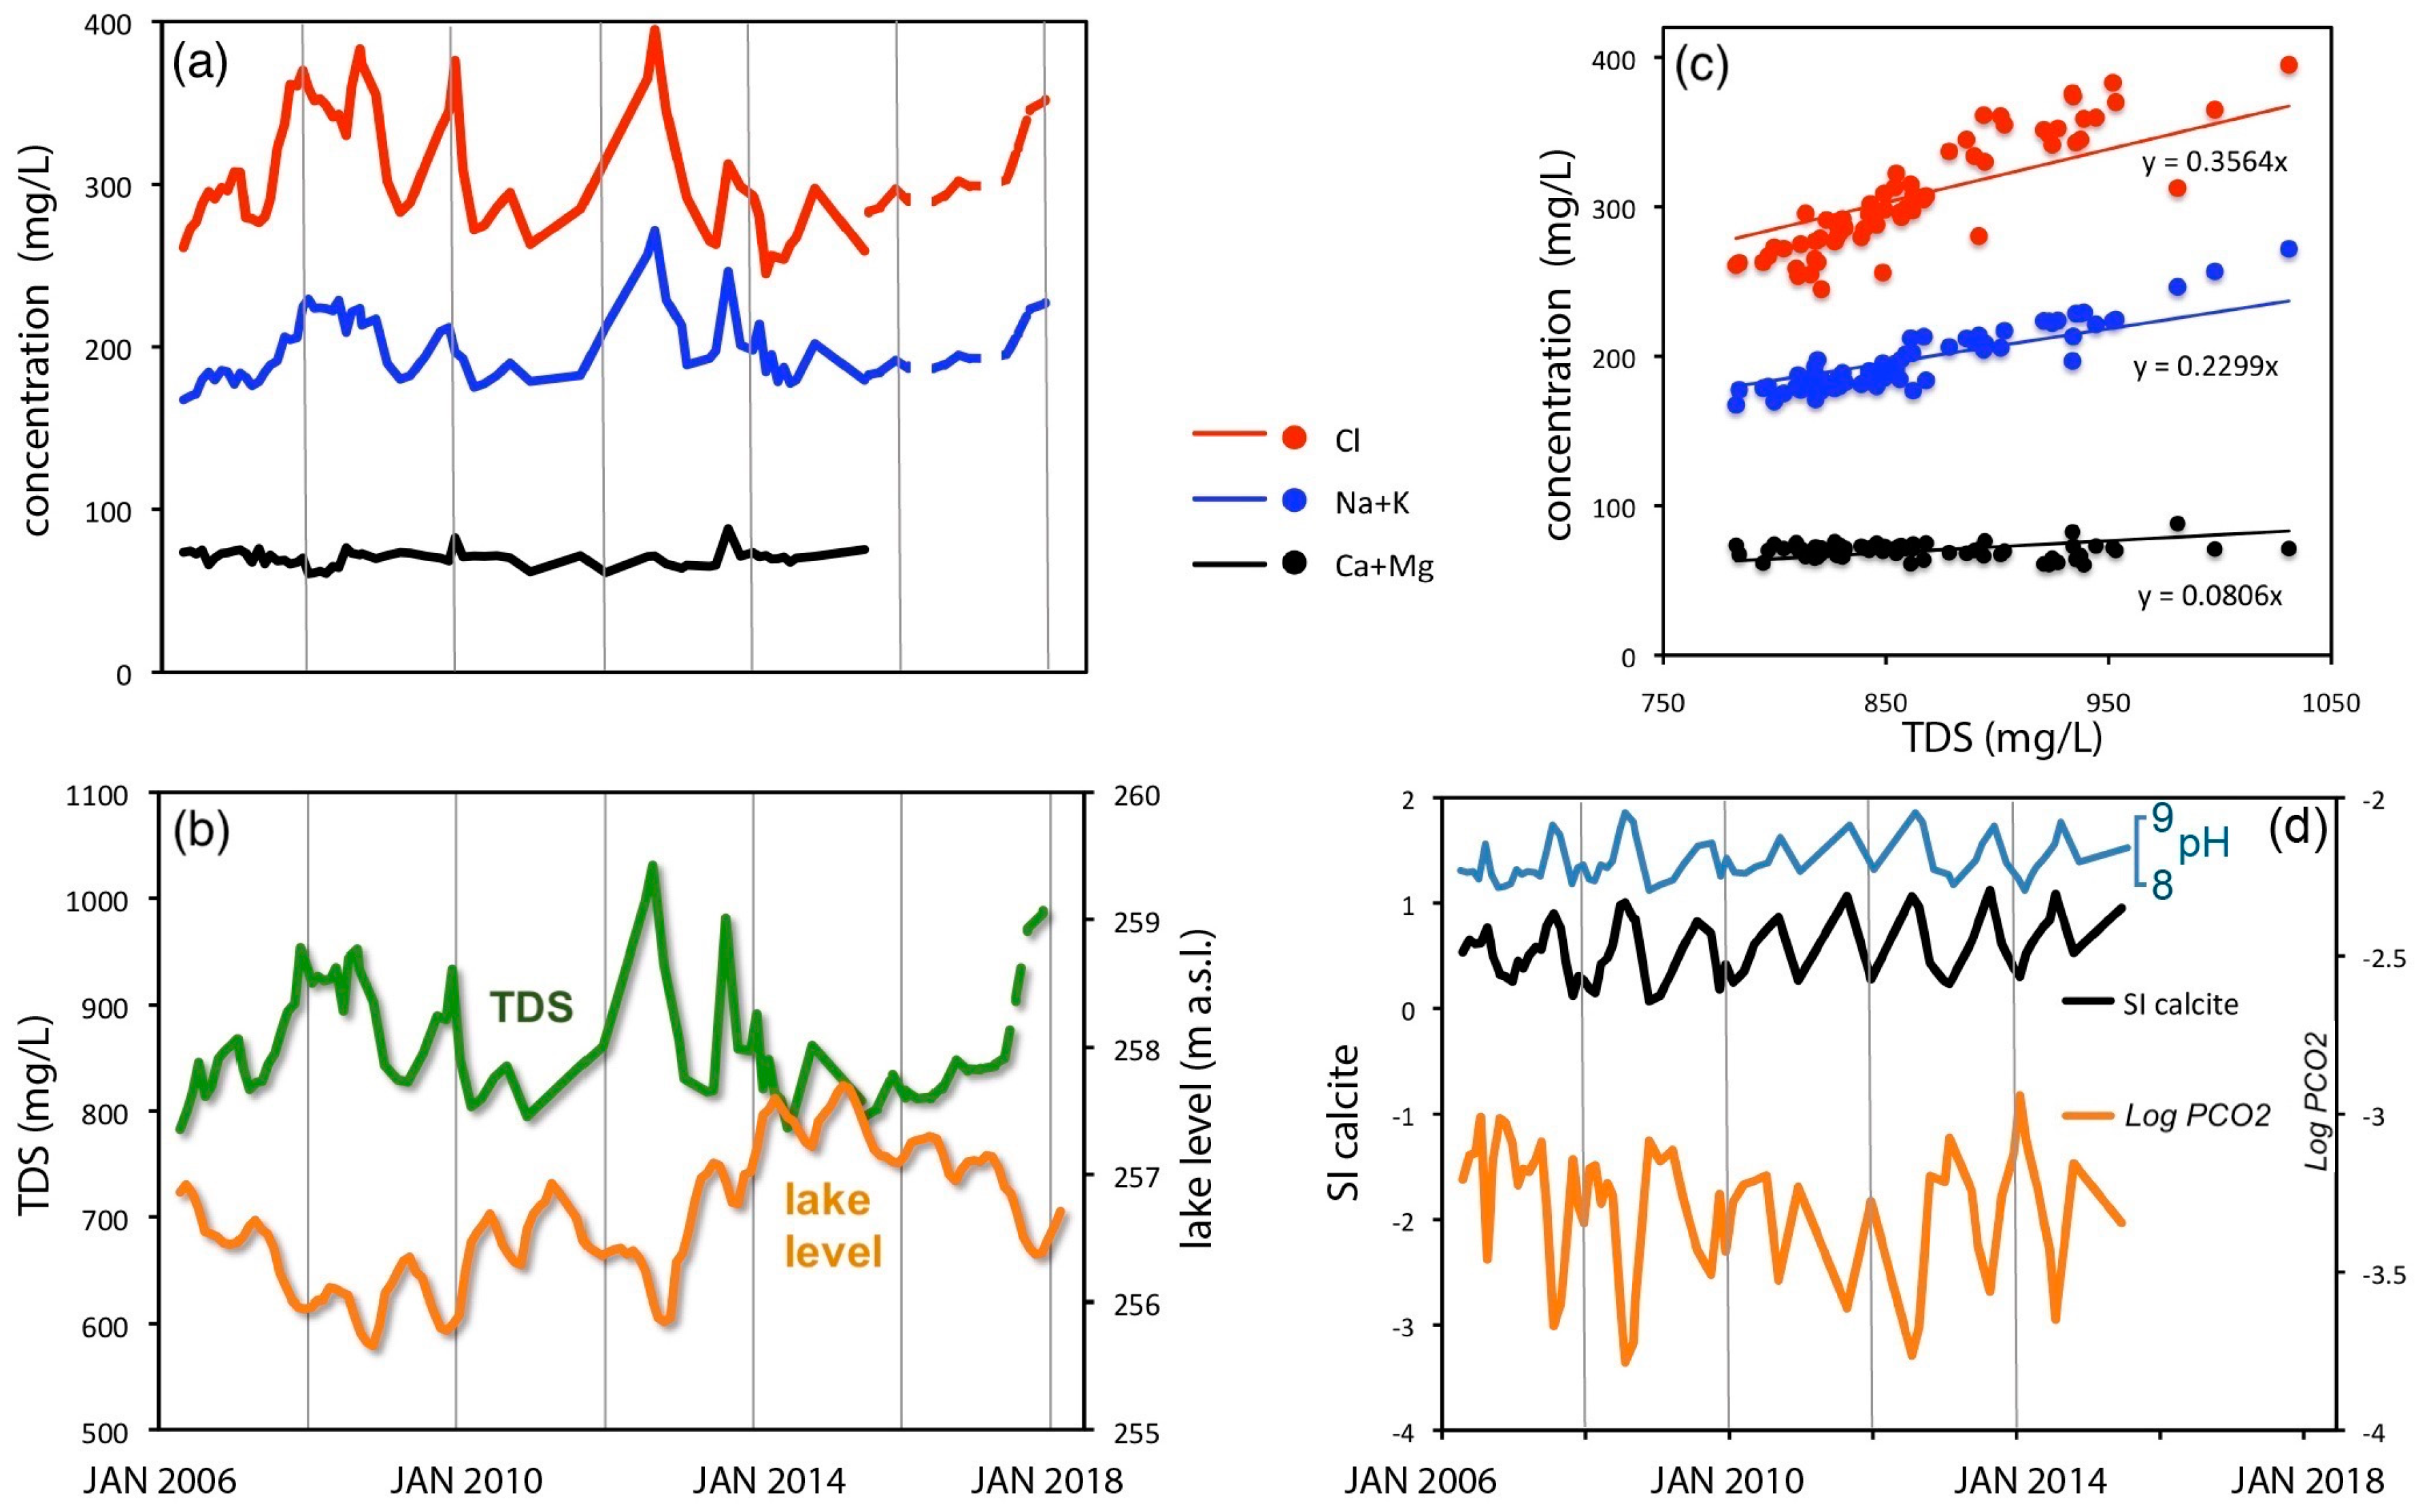
3.3. Chemical Variations of Lake Water from 2006 to 2018

Figure 6 shows the main variations in chemical composition of lake water during the period 2006–2018. In general, the concentration of the mobile species (Cl, Na and K) and TDS are inversely correlated to lake level and show a marked increase in the period 2006–2009, a decrease in 2010–2011, a peak during summer 2012, a substantial decrease during the rainy years 2013 and 2014, and finally an increase from 2015 to 2018 (Figure 6a,b). The variations of Na, K and Cl are clearly correlated to the TDS variations (Figure 6c) and are strongly influenced by the dilution effect caused by the variations of lake level. On the contrary, earth-alkaline metals are less affected by lake level variations and their concentrations seem to be primarily controlled by the solubility of carbonate minerals and by the seasonal variations of log10PCO2 (Figure 6d): SIcalcite and PCO2 are inversely correlated and their variations follow a seasonal trend with high PCO2 and relatively low values of SIcalcite (0–0.5) during the winter, lower PCO2 and very high SIcalcite values during the summer. A trend similar to that of SIcalcite and an inverse correlation with log10PCO2 is shown by pH, which is essentially controlled by carbonate equilibria. The cyclical behaviour of SIcalcite, PCO2 and pH is probably related to the seasonal variations of evaporation and photosynthesis. During the summer, PCO2 decreases in response to algal growth and photosynthesis, calcium concentration increases because of evaporation, and lake water becomes strongly oversaturated in calcite. In contrast, during the winter, PCO2 increases because respiration prevails over photosynthesis, calcium concentration decreases because of the dilution caused by rainwater and, as a result, calcite saturation index decreases.

3.4. Isotopic Composition of Water and Total Dissolved Inorganic Carbon

In the diagram of Figure 7a, the δ18O and δD values of lake water (in ‰ vs VSMOW), stream water and groundwater are compared to the Central Italy meteoric water line (CIMWL, δD = 7.05 δ18O + 5.61 [45]) and to the global meteoric water line (GMWL, δD = 8 δ18O + 10 [46]). The samples of lake water are characterised by low values of deuterium excess (d = δD − 8δ18O), ranging from −16.3‰ to −4.3‰ (−10‰ on average), plotted below CIMWL and GMWL and are fitted by a straight line with the following equation:
δD = 5.63δ18O − 6.73
The regression equation is characterised by a very high coefficient of determination (R2 = 0.9793) and a relatively low standard error of the estimate (SE = ±1.35‰). The slope of this straight line (5.63) is close, but slightly higher, than the slopes predicted on the basis of a steady state isotope balance model for surface waters at mid latitudes [47], ranging from three to five. Considering its deviation in slope from the GMWL and the low deuterium excess of the data, the regression line can be interpreted as a local evaporation line (LEL in Figure 7a). In contrast, groundwater samples plot along CIMWL, close to the δD and δ18O values of local rain water. The samples of stream water show an intermediate behaviour: part of the samples are characterised by δD and δ18O values very close to rain water but part of them align along LEL, suggesting that evaporation also plays a significant role on the isotopic composition of lake tributaries. The vertical profile of δ18O and δD (Figure 7b) show a quite homogeneous isotopic composition of lake water. As noted earlier, in Lake Trasimeno wind forces are strong enough to mix the water from top to bottom and thwart summer stratification. As for the carbon isotopes of dissolved carbonates (supplementary material—Table S2), lake water show a rather uniform composition with δ13CTDIC ranging from −3.90 ‰ to −1.38 ‰ vs PDB. These values are consistent with equilibration of lake water with atmospheric CO2 and carbonate minerals. In contrast, δ13CTDIC values of stream waters (from −8.60 ‰ to −11.10 ‰) and groundwater (from −12.50 ‰ to −14.50 ‰) are substantially lower, suggesting that organic carbon oxidation, along with calcite dissolution, is the main source of dissolved carbon during runoff and infiltration.

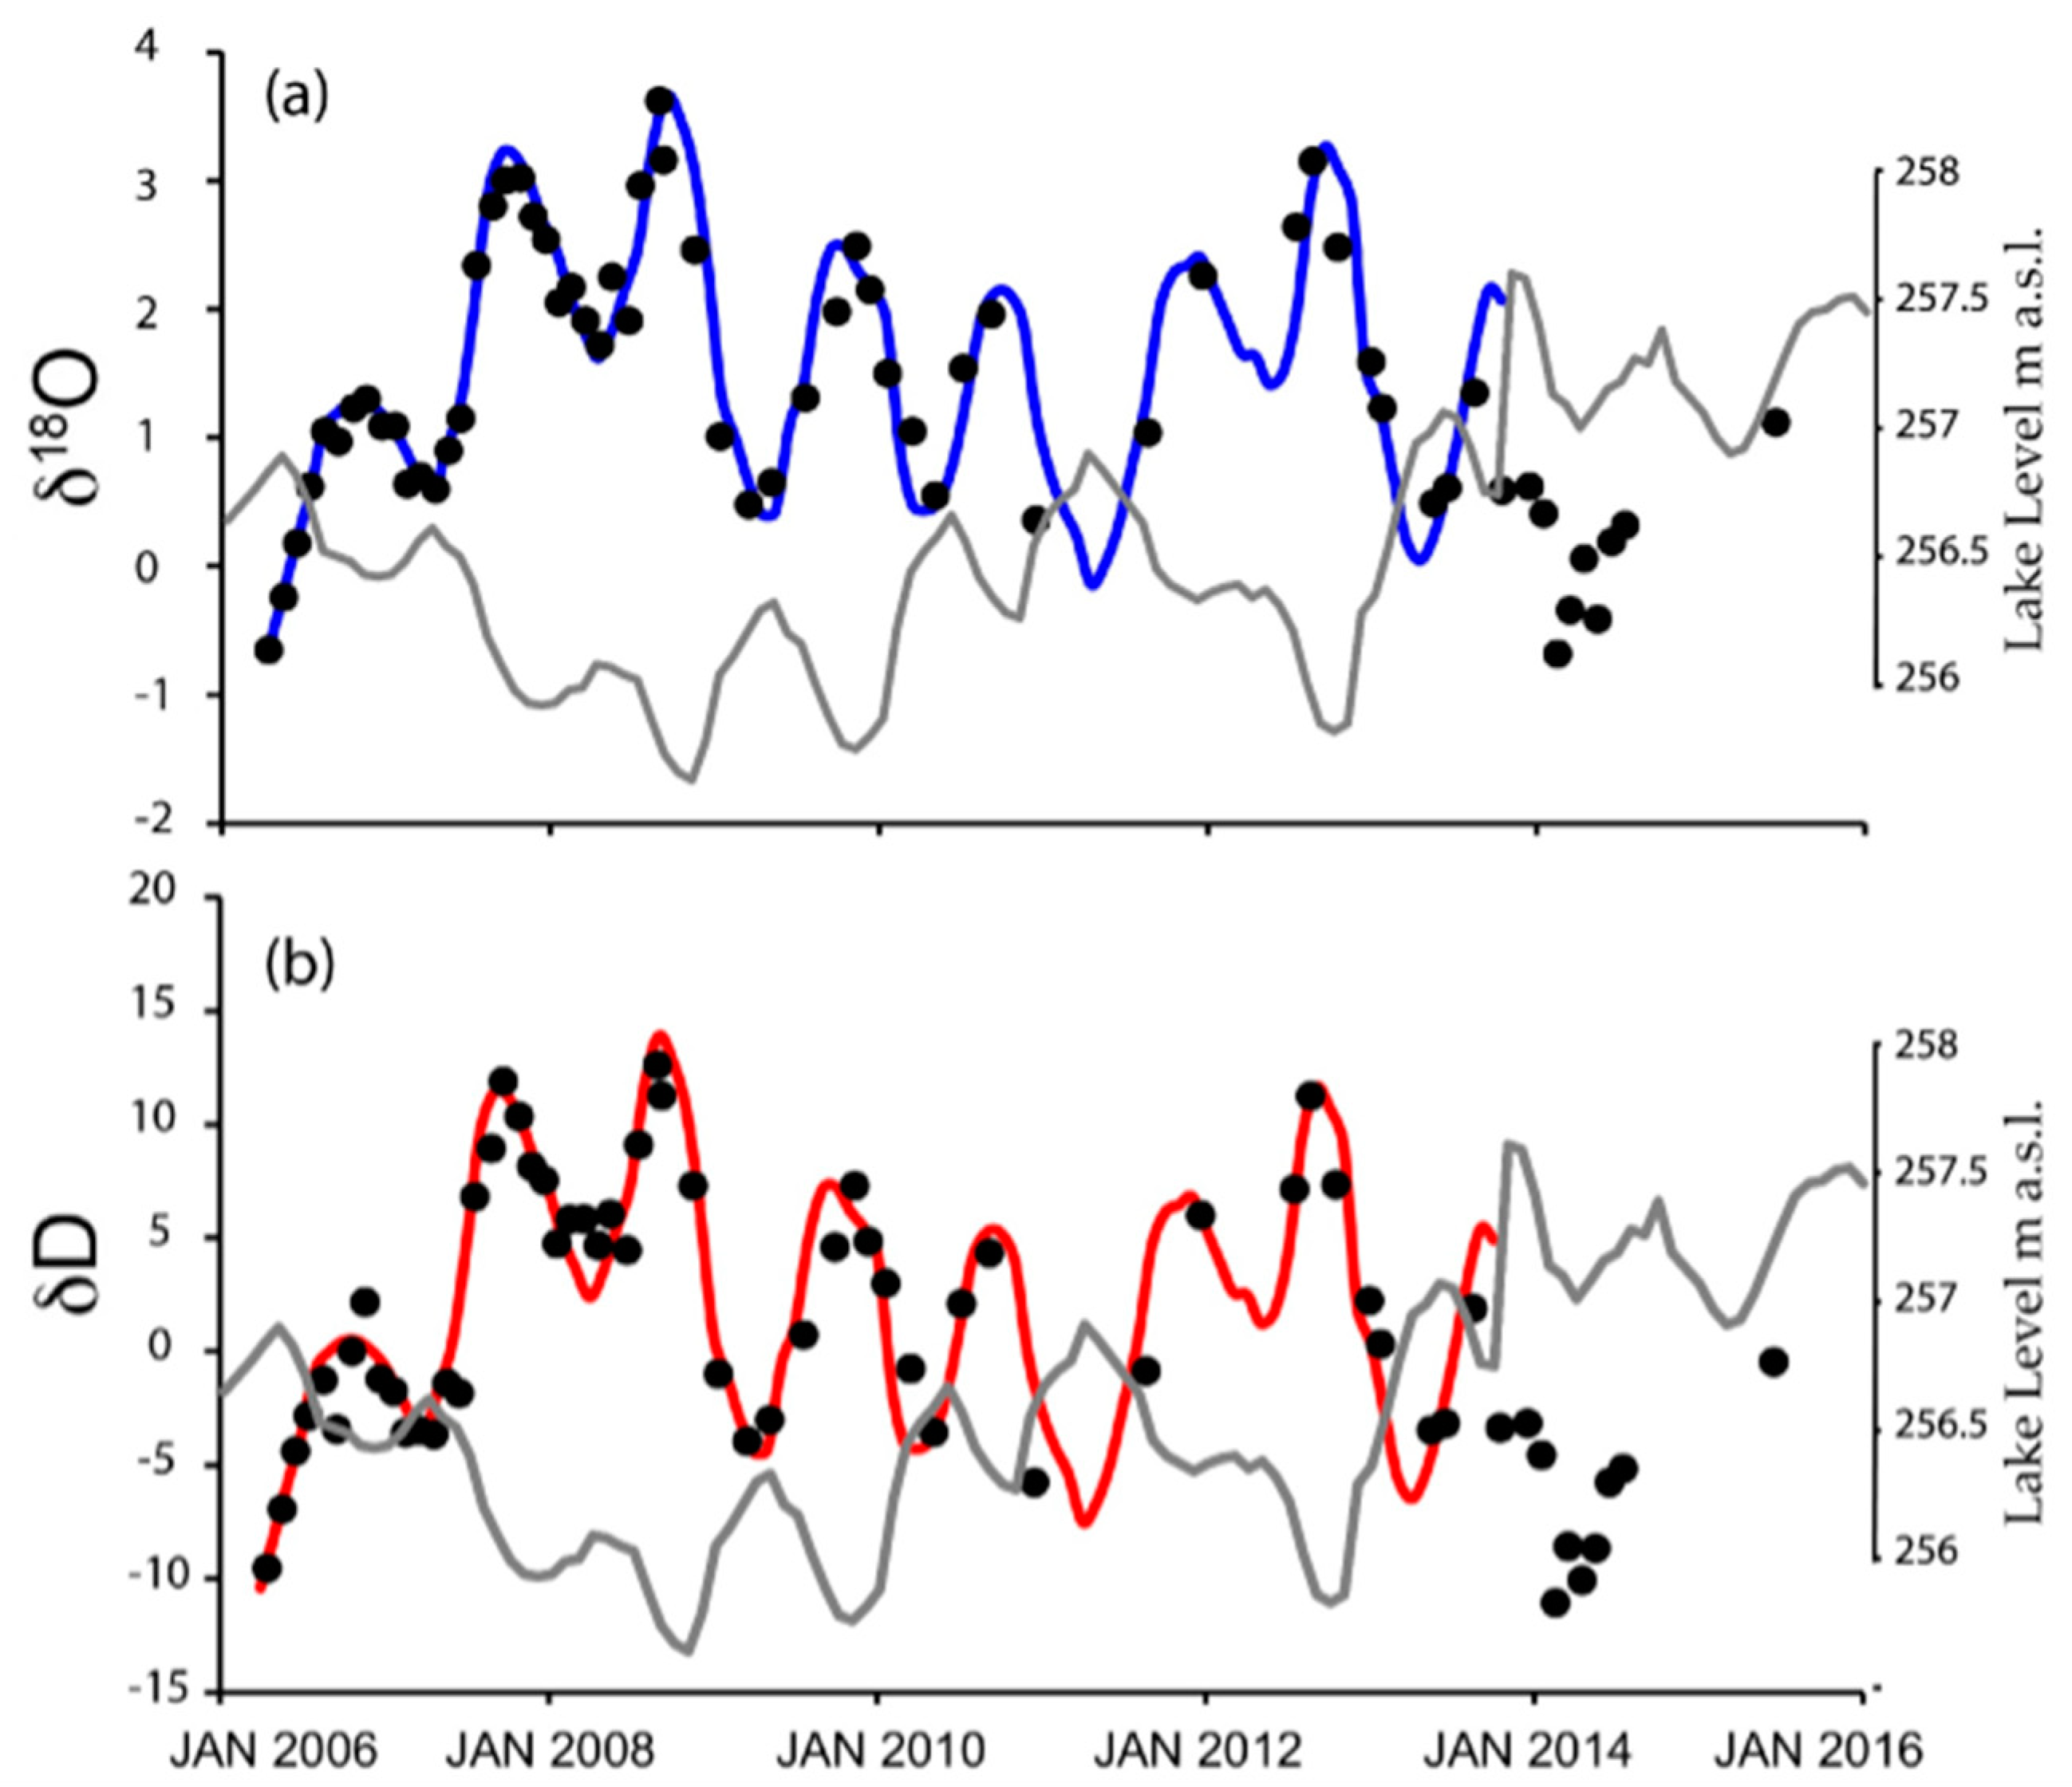
3.5. Isotopic Variations of Lake Water from 2006 to 2015

The variations of δD and δ18O values of lake water from 2006 to 2015 (Figure 8) show a marked seasonal effect with variations from winter to summer of about two delta units for δ18O and more than ten delta units for δD. Generally, the lower values characterise the December–January periods, while the higher values are measured at the end of the summer. In order to understand the relative weight of controlling parameters on the isotopic composition of lake water, the measured isotopic compositions are compared to the δD and δ18O values calculated on a monthly basis from a theoretical model based on a mass and isotope balance.
At each step (month), the δ18O and δD values of lake water were computed from:
VL = V0 + VP + VR + VG − VE − VW
and
δL = (δ0 × V0 + δP × VP + δR × VR + δG × VG − δE × VE − δ0 × VW)/VL
where VL is the volume of water in the lake at the end of each step of calculation, V0 is the initial volume, VP is the rainfall on the lake surface, VR and VG are the volumes of water supplied to the lake by runoff and groundwater respectively, VW is the volume of withdrawal and VE is the water loss by evaporation. At each step, VL is computed from the hypsographic curve of the lake [48], VP is computed from precipitation data [34], and VE, VR, VW and VG are computed through the hydrogeologic balance of the lake [15]. The hydrologic data used to calculate the isotopic mass balance are reported in the supplementary material (Table S3).
The average values of δ18OP and δ18OR (−7.06 and −7.22 ‰ vs VSMOW, respectively) have been computed from the equation relating oxygen isotopic composition of rainwater with latitude and elevation (h) in Italy [49]:
δ18O = −0.3 Lat + 6.45 – 0.0022h
considering the elevation of lake surface (257 m a.s.l.) for the computation of δ18OP and the average altitude of the catchment (310 m a.s.l.) for the computation of δ18OR.
δDP and δDR (−44.16 and −45.29 vs VSMOW) were computed from δ18OP and δ18OR using the CIMWL equation [45]
δD = 7.05 × δ18O + 5.61
The values of δ18OG (−6.32‰ vs VSMOW) and δDG (−40.55‰ vs VSMOW) were computed as the average of Vernazzano spring and Cerrete well and the values of δ18OE and δDE were computed at each step considering a simplified Craig–Gordon model for the isotope fractionation during evaporation [50,51,52,53]:
δE = (αV/L × δ0 − RH × δA + εV/L + εdiff)/(1 − RH − εdiff)
where RH is the relative humidity of atmosphere over the lake normalised to the temperature of the lake surface, αV/L is the equilibrium isotope fractionation factor between vapour (V) and liquid water (L) at the temperature of the lake surface, δA is the isotopic composition of atmospheric moisture over the lake, εV/L = αV/L − 1 and εdiff is the so-called transport (kinetic) or diffusion fractionation. Relative humidity has been derived from a RH vs t (°C) regression based on the data of the Castiglione del Lago weather station [54]:
RH = 0.97 − 0.0083 × t (°C)
The values of εdiff have been computed at each step using the software Hydrocalculator 1.03 [55] using the isotopic composition of lake water and of rainwater, the slope of LEL, T (°C) and RH as input parameters. The temperature dependence of αV/L has been estimated from the following empirical relations [56], for oxygen
1000 lnαL/V = −1000 lnαV/L= −7.685 + 6.7123 × 10³ × T−1 − 1.6664 × 10⁶ × T−2 + 0.35041 × 10⁹ × T−3
and for hydrogen
1000 lnαL/V = −1000 lnαV/L = 1158.8 × T3 × 10−9 − 1620.1×T2 × 10−6 + 794.84 × T × 10−3 − 161.04 × T−3 × 10⁹
with temperature (T) in kelvin.
Finally, the values of δ18OA were used as a fitting parameters and evaluated on a monthly basis in order to minimize the differences between observed and computed δ18O data (Figure 8a), while the values of δDA required to draw the δD theoretical curve of Figure 8b were computed from δ18OA using Equation (6). The theoretical curve fits quite well the experimental data for values of δ18OA ranging from −15 to −9.5‰ vs VSMOW. These values are between the typical values of air moisture at mid latitudes (−15‰ vs VSMOW [55]) and slightly heavier values, close to the composition of local evaporation.
The resulting theoretical curves, together with the measured data, are shown in Figure 8. While measured data are available from 2006 to 2015, the theoretical curves have been computed only until the month of October 2013 because there is no hydrologic dataset available after that period. Both the measured data and the theoretical curve clearly show that the variations of δ18O and δD are inversely correlated with lake level (grey curves in Figure 8). In general, seasonal variations are larger than long term trends; however, it is possible to individuate different time intervals characterised by different hydrologic characteristics. In the 2006–2009 time interval, both the theoretical curves and the experimental data are characterised by a progressive increase of δ18O and δD towards higher values. These isotopic trends correspond to a long period during which lake level decreased from values close to hydrometric zero level to values about 2 m lower. During this period, the water lost by evaporation was not balanced by precipitation. From winter 2009–2010 to winter 2011–2012, the isotopic composition does not show large trends but just a slight decrease of both δ18O and δD values. During this period, precipitation increased, overcoming, on average, the evaporative loss and causing the increase of the lake level. Finally, after a strong positive peak during summer–fall 2012, the δ18O and δD values started to decrease again, following a complex trend probably related to the strong and rapid variations of lake level during the rainy winters 2012–2013 and 2013–2014.
The monthly variations of isotopic composition of lake water (ΔD and Δ18O) are positively correlated to temperature (t °C) and evaporation (E) and inversely correlated to precipitation (P) (Table 2). Evaporation, which has a very strong correlation with temperature (r = 0.913), shows very high correlation coefficients both with ΔD and Δ18O (0.870 and 0.877, respectively) and can be considered as a summing parameter depending not only on temperature, but also on air humidity, atmospheric pressure and wind velocity. Table 2 also shows the two-sided p-value, or calculated probability, for each pair of variables (in brackets). Since p is always lower than 0.001, all the r values are statistically significant (significant at p = 0.001)
The multiple linear regressions of ΔD‰ and Δ18O‰ with temperature and precipitation are characterised by high coefficients of multiple determination, suggesting that most of the variability of the system can be interpreted in terms of variation of evaporation and precipitation.
∆D‰ = −2.03 × 10⁻² P + 3.19 × 10⁻²E − 1.35    (R2 = 0.870; SE = ±0.8‰)
18O‰ = −3.19 × 10⁻³ P + 5.69 × 10⁻³E − 0.26    (R2 = 0.885; SE = ±0.2‰)
with P and E in mm.
The variations of the isotopic composition of lake water allow one to distinguish the periods of prevailing evaporation from the periods when precipitation prevails over evaporation. Equations (11) and (12) can be used to compute E with a relatively small error, starting from the isotopic composition of lake water and precipitation. The latter can be estimated accurately, since it is continuously measured at several weather stations around the lake.

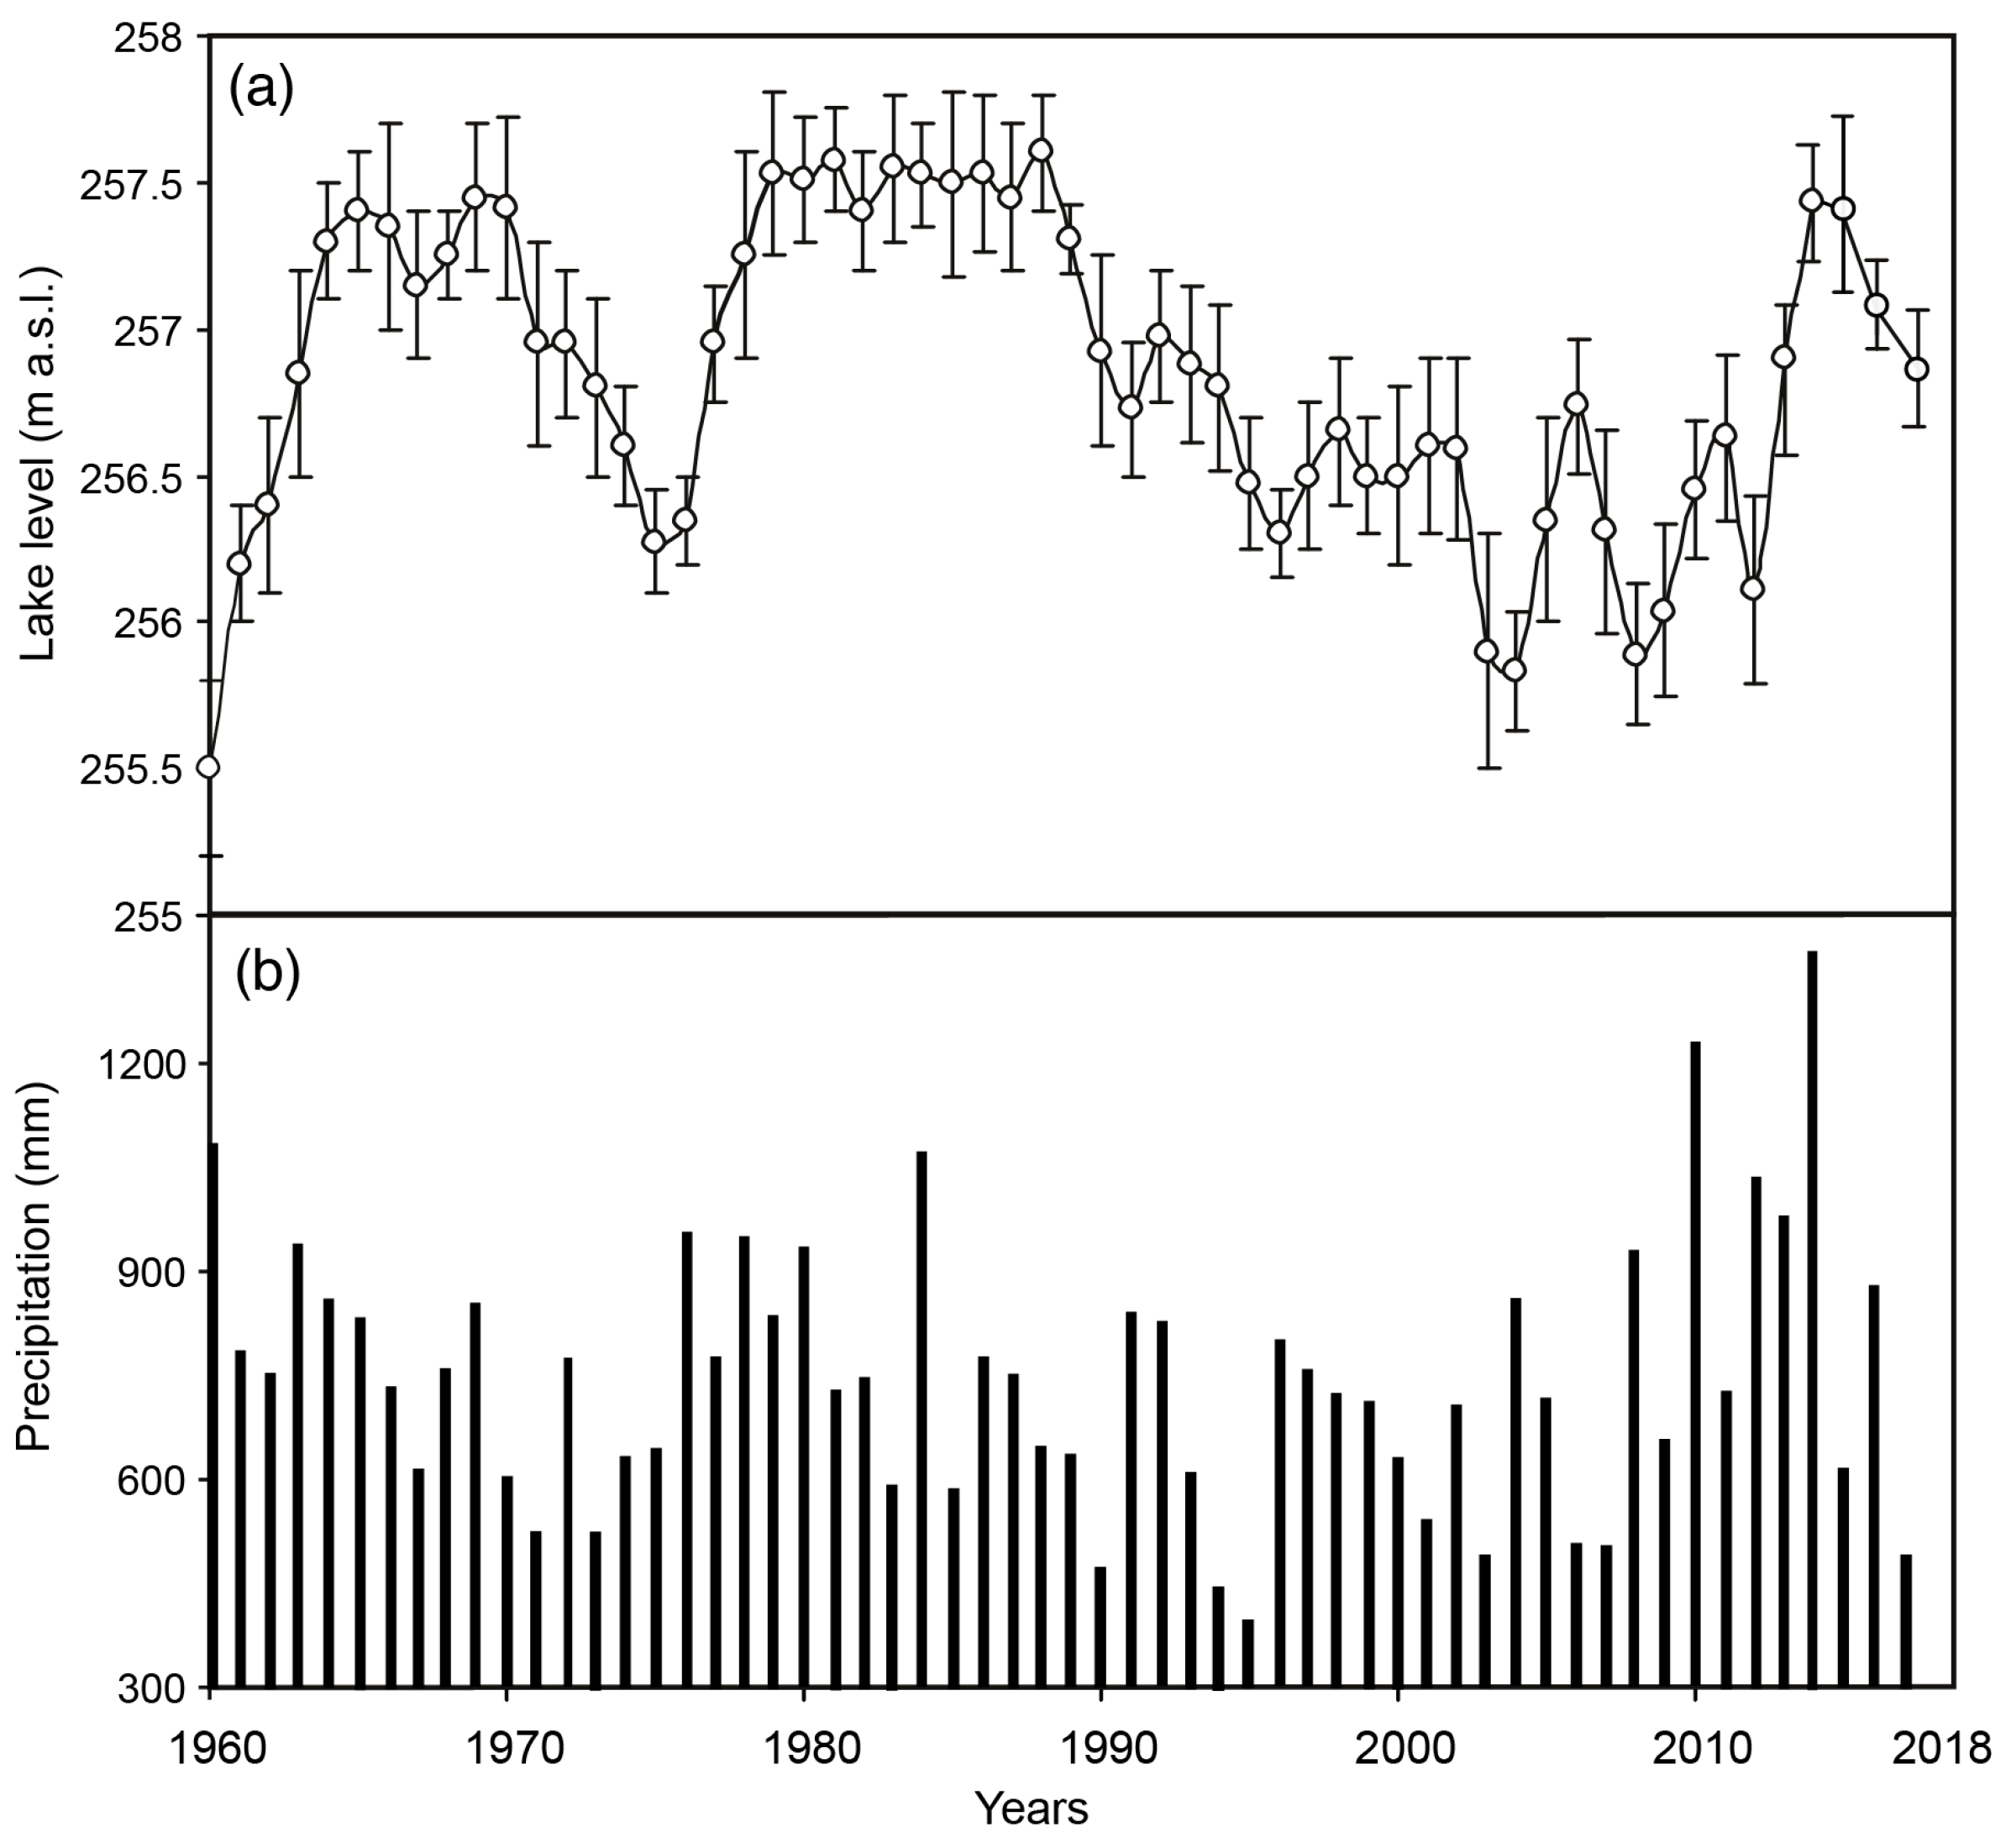
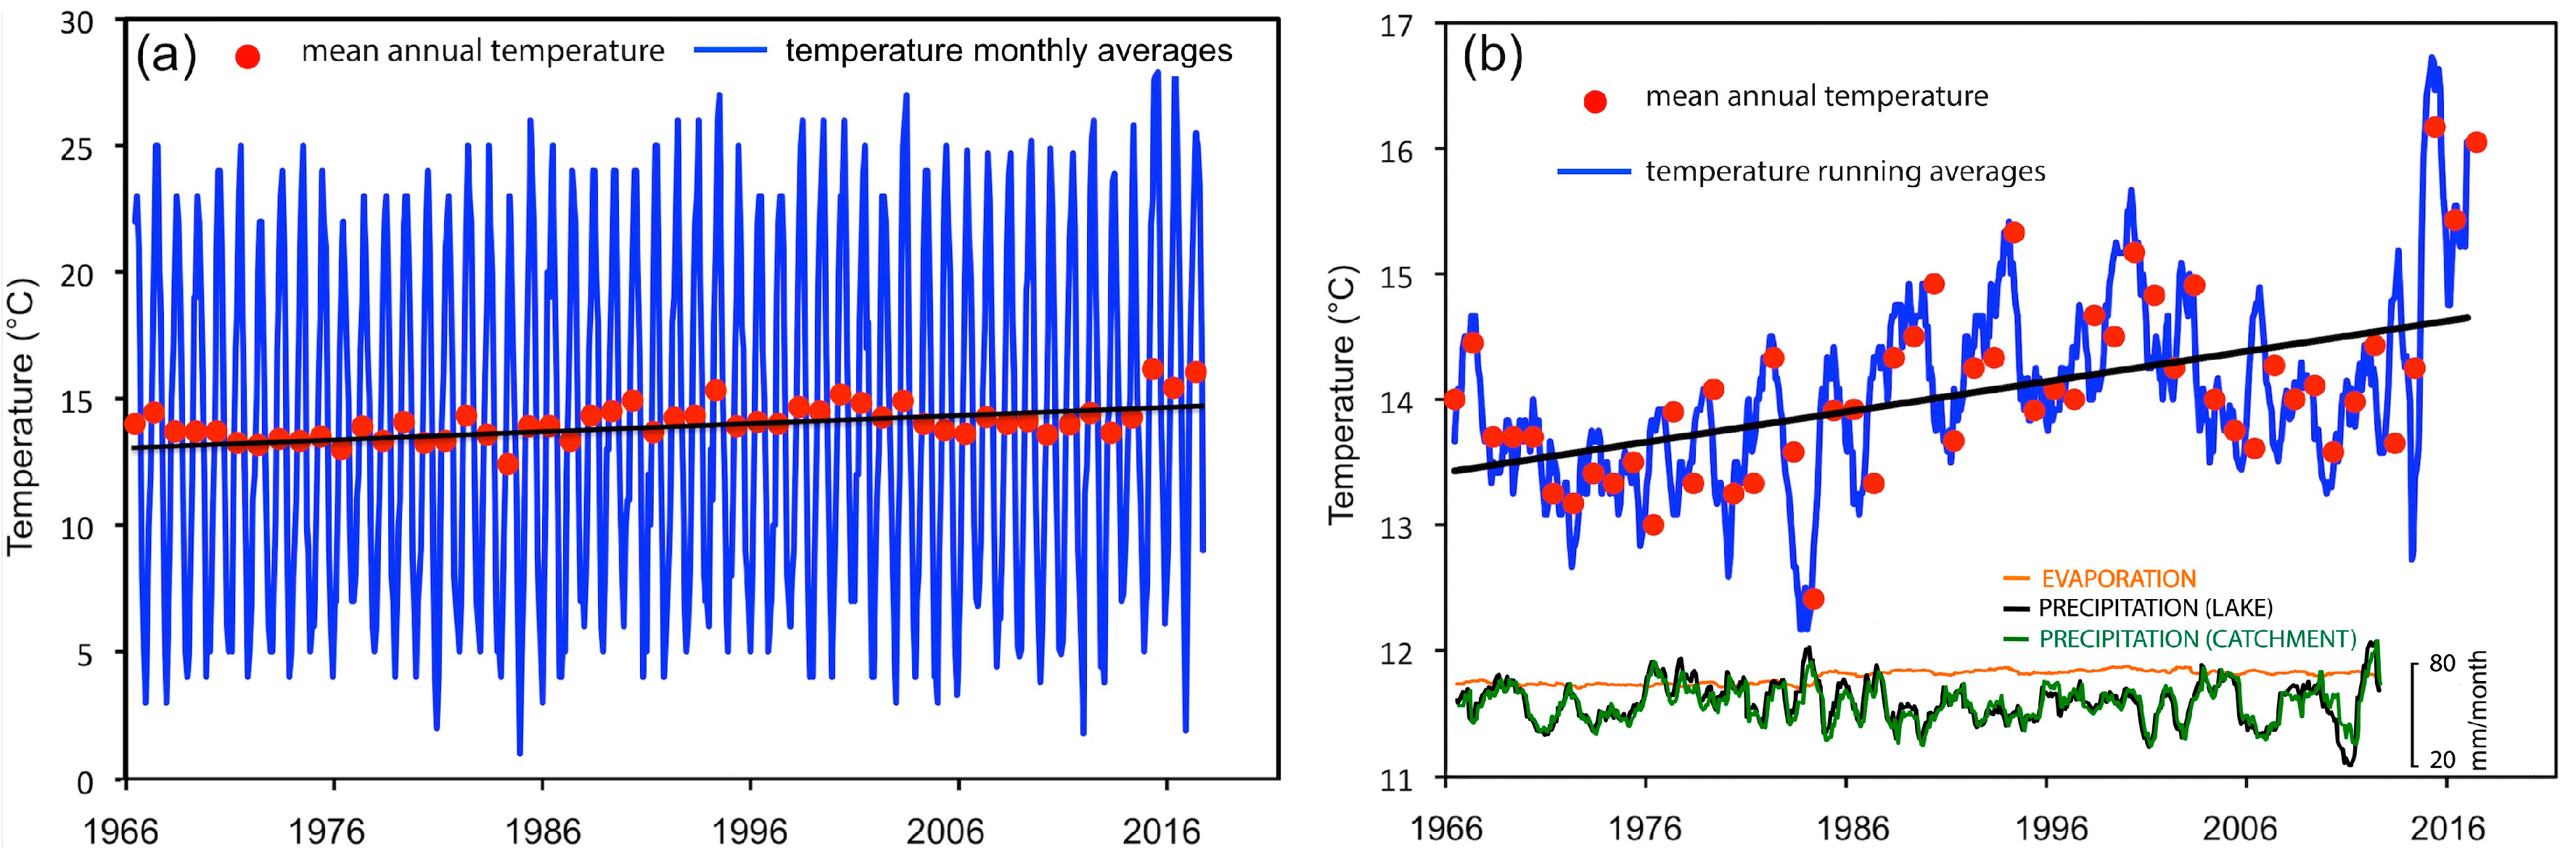
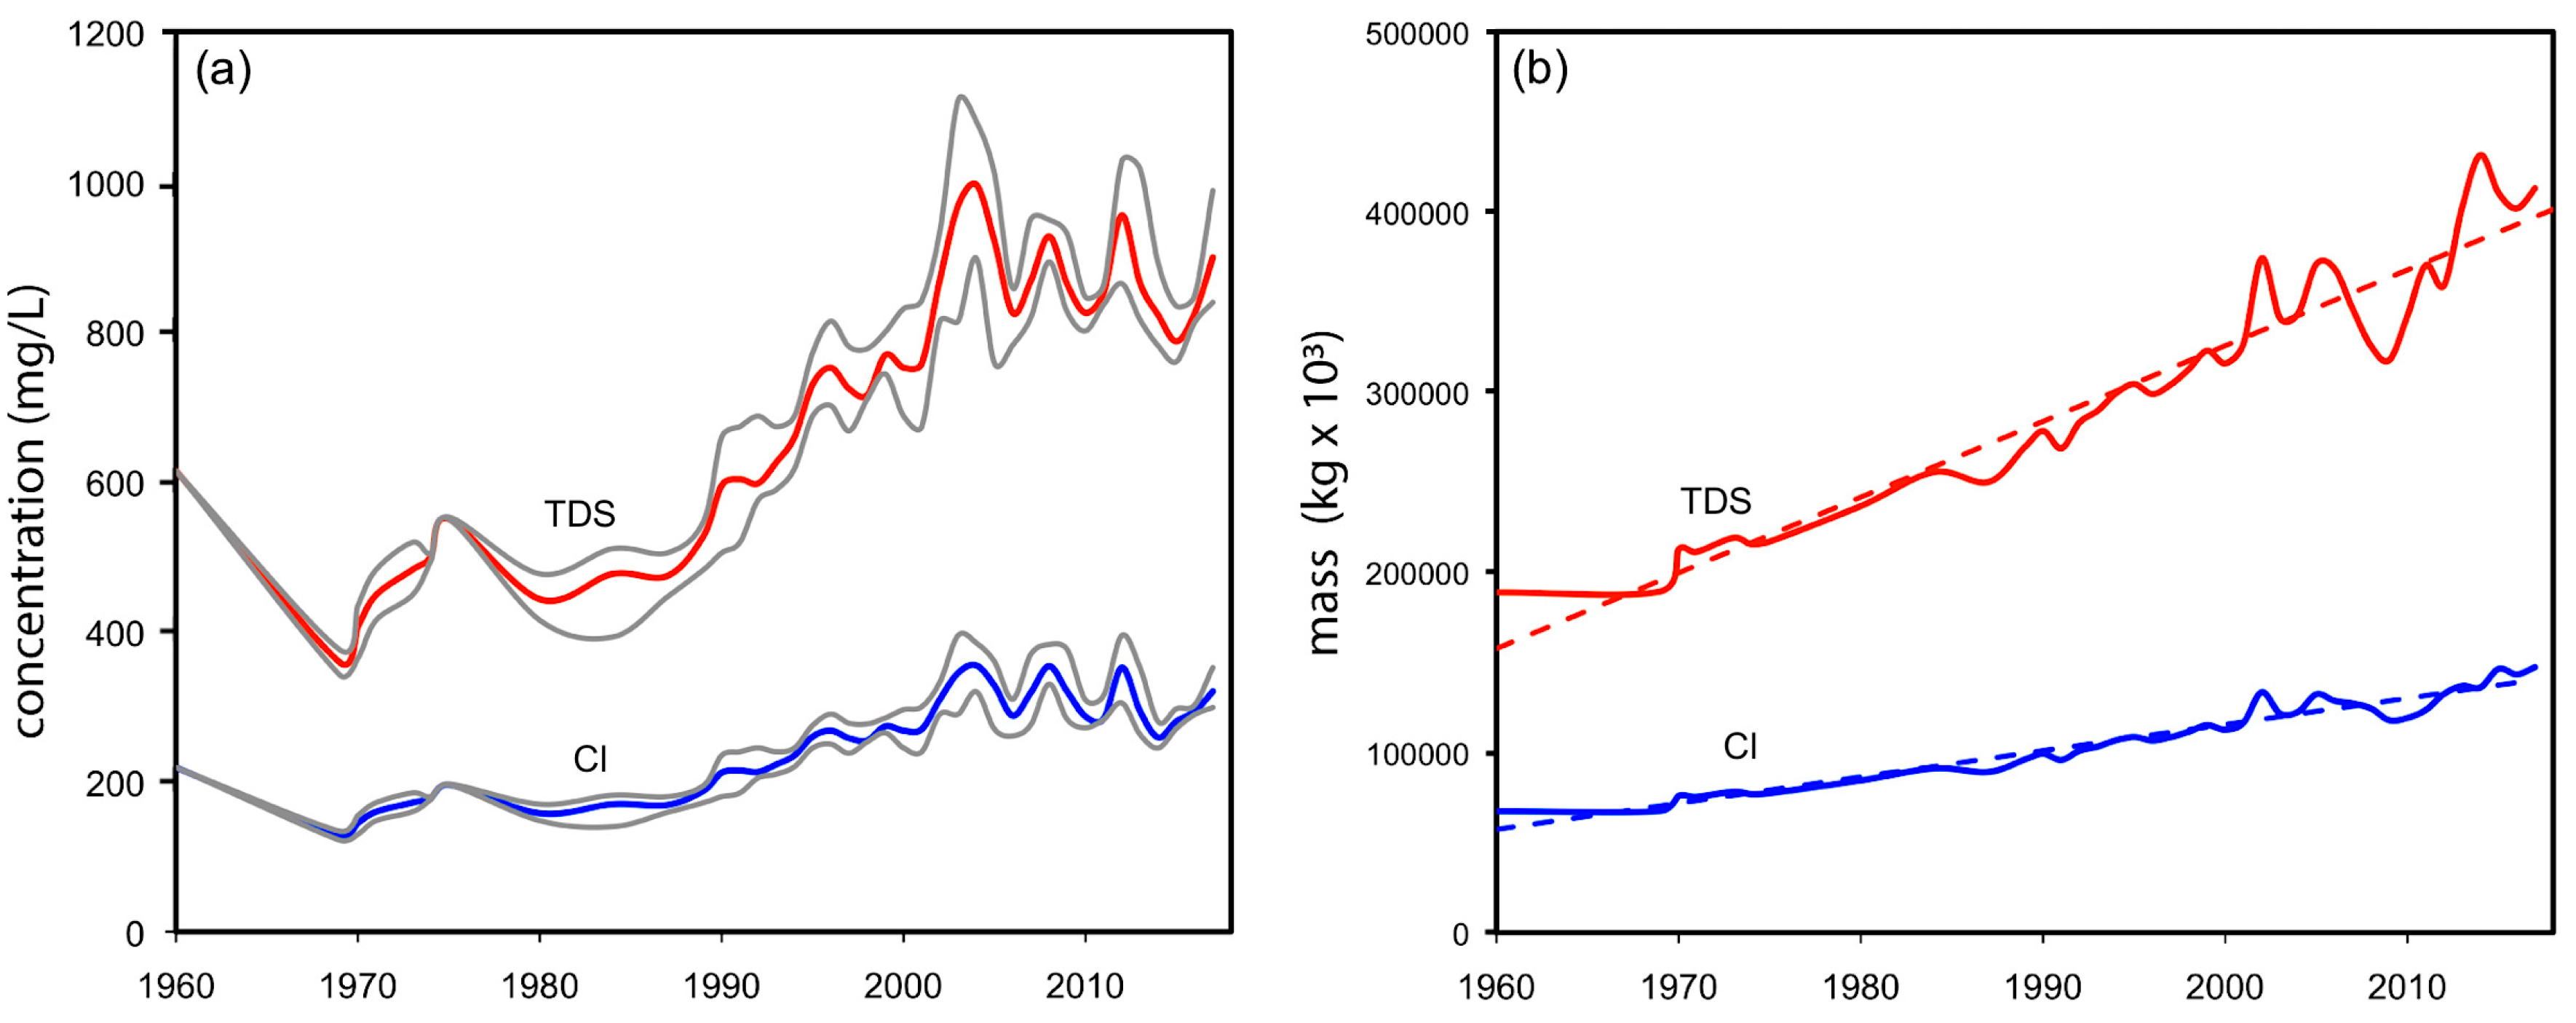
3.6. Long-Term Physical and Chemical Variations

In order to evaluate the long-term chemical and physical variations of lake water, the data of the 2006–2018 period have been integrated with all the available data for the subsequent period regarding the enlargement of the hydrologic basin [5,18,35,58,59,60,61]. All the data are from the period between 1966 and 2018, apart from a single analysis dating back to 1960 [58].
Water temperature is characterised by annual mean values ranging from 12.4 to 16.7 °C and well-defined seasonal trends with differences of about 20–25 °C between the months of January and August of each year (Figure 9a). The seasonal variations partly hide the long-term variations and, in order to smooth out short-term fluctuations, highlighting longer-term trends, we computed the 12-month running averages of lake water monthly temperatures (Figure 9b). The temperature curve clearly shows a long-term warming trend, although some short-term variations (in the order of a few years) also occur in the temperature record. Looking at the curve in detail, it is possible to identify several short-term cycles of warming and cooling with a period of about four years. Generally, at the end of each cycle, water temperature is slightly higher than the temperature at the end of the previous cycle, except for the periods 1966–1972 and 1981–1983, when the average temperature decreased. The three warmest years in the Trasimeno temperature record have all come in the 2010s and the ten warmest years on record have all come since 1990. The temperature of the lake increased by about 1.3 °C from 1966 to 2017 with an average rate, computed from a linear fit of the data, of about 0.0274 ± 0.0063 °C/y (Figure 9a,b). In the same period, lake evaporation also increased by about 9%, while precipitation shows a more complex pattern (Figure 9b). After a relatively dry period from the late 1960s to early 1970s, precipitation increased from the mid-1970s to mid-1980s to decrease again in the 1990s. In the last 20 years, very dry periods (e.g., 2006–2007, 2009, 2015–2018) alternated with extremely rainy years (e.g., 2010, 2012–2014; see also Figure 3).
The variations of water temperature are accompanied by significant chemical changes (Figure 10): in 1960, the catchment basin was artificially enlarged and the system was reset to TDS values of about 600 mg/L; during the 1960s, the TDS of lake water decreased to less than 400 mg/L, probably because of the inflow of less saline water from the new tributaries; since 1970, the effects of warming became evident and TDS started to increase passing from average values of about 400 mg/L in 1970 to more than 900 mg/L, with spikes higher than 1000 mg/L, after the year 2000. The saline content of the lake has more than doubled in the last 50 years with a rate of increase of about 10 mg/L. The rise of TDS is primarily caused by the increase of alkaline metals and chloride, that rose from about 150 to 300 mg/L in the last 50 years, with a rate of about 3 mg L−1 y−1 (Figure 10a).
While in the short term the chemical variations of the lake follow seasonal cycles and depends on the balance between precipitation and evaporation, in the long term, the accumulation effect related to the endorheic nature of the lake becomes prevalent. This feature is clearly shown by the increase of the total mass of solutes, computed by multiplying the concentration of dissolved species by the volume of the lake (Figure 10b), that in the last 50 years increased from about 2 × 10⁸ kg to 4 × 10⁸ kg. Dissolved species are transported to the lake by runoff and by rainwater falling directly on the lake. Since the only output of the system is evaporation, the mass of dissolved solids in the lake gradually increases. The largest contribution to the mass increase is due to mobile (conservative) species such as Cl and Na, while the mass of nonconservative species dissolved in lake water is partly limited by precipitation of solid phases (i.e., calcite) and/or biologic uptake. In the long term, the isotopic composition of oxygen also shows a considerable increase, with δ18O passing from 0.30 ± 0.15 ‰ in the 1968–1971 period [16,17] to 1.52 ± 1.12 ‰ in the 2006–2016 period. However, this is just a qualitative observation because the lack of isotopic data from 1972 to 2005 does not allow the definition of a reliable rate of variation of δ18O and δD.

4. Discussion

Lake Trasimeno is characterised by some peculiar features that make it particularly useful for the study of hydrologic and chemical variations related to climate change: (i) TDS is relatively low compared to other terminal basins [62] and lake water is undersaturated with respect to chlorides and sulfate minerals. As a consequence, the concentrations of dissolved ions, with the exception of calcium that is controlled by calcite precipitation, are not limited by the precipitation of solid phases and can be directly related to the changes of the hydrologic regime; (ii) its relatively shallow depth allows the complete mixing of lake water, inhibiting both chemical and thermal stratification. Consequently the chemical and isotopic composition and the temperature of water at shallow depth are representative of the whole water column.
The analyses of chemical and isotopic data and their comparison to the hydrologic parameters point out the presence of both short and long term trends, corresponding respectively to seasonal variations of the hydrologic regime and to pluriannual/secular irreversible changes of the physical and chemical features of the lake. The best indicators of the seasonal processes are the oxygen and hydrogen isotopic composition, the partial pressure of carbon dioxide, the saturation state with respect to calcite and the concentration of Cl and other mobile species, while long term processes are better highlighted by the total mass of dissolved ions and by the anomalies of the average temperature of water.
The significant variations of isotopic composition and concentration of mobile species induced by the seasonal variations of precipitation and evaporation suggest that water isotopes and concentration of Cl and Na can be used for detailed mass balances aimed to distinguish the variations of volume caused by evaporation from the variation caused by extraction of water for irrigation. In fact, while evaporation causes a strong variation of isotopic composition and an increase of mobile species concentration, water extraction does not cause any significant chemical or isotopic change. The knowledge and the quantification of these processes is very useful for the management of the lake during drought periods, but the estimation of evaporation rates is not a trivial task [63], being affected by several factors (sun radiant energy, albedo, heat-storage capacity of the lake). The results of our study show that at lake Trasimeno, the multiple regressions relating δ18O and δD to evaporation and precipitation (Equations (11) and (12)) can be used to compute evaporation rates on a monthly basis, starting from water isotopic composition and precipitation data.
In the long term, the main physical and chemical changes of the lake are the gradual increase of water temperature and evaporation and the consequent increase of the total mass of dissolved ions. The long-term increase of dissolved salts (both as concentration and total mass) is mainly produced by the increase of mobile species, which are shifting lake water towards a Na-Cl composition. These processes are probably related to the increase of land-surface air temperature (LSAT) that has occurred in the last 50 years [64]. In fact, the lake Trasimeno warming trend (0.0274 ± 0.0063 °C/y) is very close to the LSAT, and, in particular, it is slightly higher than the LSAT anomaly trends calculated for the period 1951–2012 (from 0.0175 ± 0.0037 to 0.0197 ± 0.0031 °C/y [64]) and very similar to the gradients computed for the period 1979–2012, that range from 0.0254 ± 0.0050 to 0.0273 ± 0.0047 °C/y [64]. The increase of lake evaporation (9% in about 50 years) is justified by the observed warming trend of the lake and is consistent with recent estimations of global lake evaporation [65].

5. Conclusions

Lake Trasimeno is an endorheic lake where the only natural output of the system is evaporation. Climate change is likely to have a significant effect on its hydrologic regime and on the quality of lake water. Lake level and the chemical and isotopic composition of the lake depend on several processes, many of which follow seasonal trends. The sum of these processes, particularly the increase of atmospheric temperature and the imbalance between inflows and evaporation, have effects both in the short and long term.
Lakes are sentinels of climate change [3] and their temperatures tend to coincide with regional air temperatures [66,67]. Warming rates observed for several inland water bodies around the globe, through in situ and/or by satellites measurements, are similar [66,67,68,69] or higher [68,69,70] than the rate of increase of land-surface air temperature (LSAT). These warming trends are dependent both on climatic drivers and local characteristics [68,70]. Combined geochemical/hydrologic investigations can help to distinguish between local and global factors affecting lake evolution.
The geochemical study of lake Trasimeno allowed us to distinguish (i) the short-term variations of lake level and composition (e.g., PCO2 variations, calcite precipitation during the warm season) correlated to the seasonal precipitation/evaporation cycle and depending on the local geomorphometric characteristics of the basin (e.g., elevation, lake surface area, runoff, depth and volume of the lake) from (ii) the long-term variation of lake temperature, accompanied by a significant increase of evaporation and a strong increase of total dissolved inorganic solids, mainly caused by the accumulation of mobile elements. The long-term warming of lake water and the consequent increase of evaporation can be qualitatively related to the variations of LSAT. In particular, the rate of variation of water temperature at lake Trasimeno is very close to the rate of variation of LSAT, and suggests that temperature of shallow, endorheic lakes can be used as a proxy for global warming measurements.

Supplementary Materials

The following material is available online at https://www.mdpi.com/2073-4441/11/7/1319/s1, Table S1: Field data, Table S2: Chemical and isotopic composition of sampled waters, Table S3: Hydrologic data.

Author Contributions

Conceptualization, F.F. and G.C.; methodology, F.F., G.C. and N.M.; software, M.M.; validation, F.F, S.C. and C.C.; formal analysis, F.F. and W.D.; investigation, C.C., M.D., N.M., S.C. and F.F.; resources, F.F.; data curation, N.M., S.C. and F.F.; writing—original draft preparation, F.F., N.M. and W.D.; supervision, F.F. and W.D.

Funding

This research received no external funding.

Acknowledgments

We would like to thank Andreja Sironić and two anonymous reviewers for their careful reading of our manuscript and their usefull suggestions. The authors wish to express their gratitude to Fausto Matteucci and Gian Luca Polidori for their support in the laboratory work.

Conflicts of Interest

The authors declare no conflict of interest.

References

  1. Mason, I.M.; Guzkowska, M.A.J.; Rapley, C.G.; Street-Perrott, F.A. The response of lake levels and areas to climate change. Clim. Chang. 1994, 27, 161–197. [Google Scholar] [CrossRef]
  2. Vance, R.E.; Wolfe, S.A. Geological indicators of water resources in semi-arid environments: Southwestern interior of Canada. In Geoindicators: Assessing Rapid Environmental Changes in Earth Systems; Berger, A.R., Iams, W.J., Eds.; A.A. Balkema: Rotterdam, The Netherlands, 1996; pp. 237–250. [Google Scholar]
  3. Adrian, R.; O’Reilly, C.M.; Zagarese, H.; Baines, S.B.; Hessen, D.O.; Keller, W.; Livingstone, D.M.; Sommaruga, R.; Straile, D.; Van Donk, E.; et al. Lakes as sentinels of climate change. Limnol. Oceanogr. 2009, 54, 2283–2297. [Google Scholar] [CrossRef] [PubMed]
  4. Cohen, A. Paleolimnology: The History and Evolution of Lake Systems, 1st ed.; Oxford University Press: Oxford, UK, 2003; 528p. [Google Scholar]
  5. Ludovisi, A.; Gaino, E. Meteorological and water quality changes in Lake Trasimeno (Umbria, Italy) during the last fifty years. J. Limnol. 2010, 69, 174–188. [Google Scholar] [CrossRef]
  6. Dragoni, W. Il Lago Trasimeno e le Variazioni Climatiche; Progetto informativo dell’assessorato all’Ambiente della Provincia di Perugia; Provincia di Perugia, Servizio Gestione e Difesa Idraulica: Perugia, Italy, 2004; 60p. [Google Scholar]
  7. Burzigotti, R.; Dragoni, W.; Evangelisti, C.; Gervasi, L. The role of lake Trasimeno (central Italy) in the history of hydrology and water management. In Proceedings of the Third IWHA Conference, Bibliotheca Alexandrina, Alexandria, Egypt, 11–14 December 2003. [Google Scholar]
  8. Gambini, E. Le Oscillazioni di Livello del Lago Trasimeno; Quaderni del Museo della Pesca 2; Edizioni Era Nova: Perugia, Italy, 1995; p. 139. [Google Scholar]
  9. Beadle, L.C. The Inland Waters of Tropical Africa; Longman: London, UK, 1974; 365p. [Google Scholar]
  10. IPCC. AR4 WG2. Climate Change 2007: Impacts, Adaptation and Vulnerability, Contribution of Working Group II to the Fourth Assessment Report of the Intergovernmental Panel on Climate Change; Parry, M.L., Canziani, O.F., Palutikof, J.P., van der Linden, P.J., Hanson, C.E., Eds.; Cambridge University Press: Cambridge, UK; New York, NY, USA, 2007; 976p. [Google Scholar]
  11. IPCC. AR5 WG2. Climate Change 2014: Impacts, Adaptation, and Vulnerability. Part B: Regional Aspects. Contribution of Working Group II to the Fifth Assessment Report of the Intergovernmental Panel on Climate Change; Barros, V.R., Field, C.B., Dokken, D.J., Mastrandrea, M.D., Mach, K.J., Bilir, T.E., Chatterjee, M., Ebi, K.L., Estrada, Y.O., Genova, R.C., et al., Eds.; Cambridge University Press: Cambridge, UK; New York, NY, USA, 2014; 688p. [Google Scholar]
  12. Dragoni, W. Some considerations on Climatic Changes, Water Resources and Water Needs in the Italian Region South of the 43° N. In Water, Environment and Society in Times of Climatic Change; Brown, N., Issar, A., Eds.; Kluwer: Dordrecht, The Netherlands, 1998; pp. 241–271. [Google Scholar]
  13. Cambi, C.; Dragoni, W. Groundwater yield, climatic changes and recharge variability: Considerations arising from the modelling of a spring in the Umbria – Marche Apennines. Hydrogéologie 2000, 4, 11–25. [Google Scholar]
  14. Ludovisi, A.; Gaino, E.; Bellezza, M.; Casadei, S. Impact of climate change on the hydrology of shallow Lake Trasimeno (Umbria, Italy): History, forecasting and management. Aquat. Ecosyst. Health 2013, 16, 190–197. [Google Scholar] [CrossRef]
  15. Dragoni, W.; Melillo, M.; Giontella, C. Bilancio idrico del Lago Trasimeno. In Tutela Ambientale del Lago Trasimeno; Martinelli, A., Ed.; ARPA Umbria: Perugia, Italy, 2012; pp. 70–85. [Google Scholar]
  16. Cortecci, G. Oxygen-isotope variations in sulfate ions in the water of some Italian lakes. Geochim. Cosmochim. Acta 1973, 37, 1531–1542. [Google Scholar] [CrossRef]
  17. Cortecci, G.; Dinelli, E. Sulfur isotopic composition of sulfate from Trasimeno, Chiusi, Montepulciano and Corbara lakes (central Italy). Miner. Petrogr. Acta 1999, 42, 17–28. [Google Scholar]
  18. Mearelli, M.; Lorenzoni, M.; Mantilacci, L. Il lago Trasimeno. Riv. Idrobiol. 1990, 29, 353–389. [Google Scholar]
  19. Giovanardi, F.; Poletti, A.; Micheli, A. Indagine sulla qualità della acque del lago Trasimeno—Idrochimica. Acqua-Aria 1995, 5, 519–526. [Google Scholar]
  20. Giovanardi, F.; Poletti, A.; Micheli, A. Indagine sulla qualità della acque del lago Trasimeno—Definizione dei livelli trofici. Acqua-Aria 1995, 6, 627–633. [Google Scholar]
  21. Cingolani, L.; Charavgis, F.; Bodo, G.; Neri, N. Monitoraggio qualitativo del reticolo superficiale del Lago Trasimeno. In Piano di Tutela delle Acque; Allegati/Monografia 6; ARPA Umbria—Regione Umbria: Perugia, Italy, 2012; 68p. [Google Scholar]
  22. Giardino, C.; Bresciani, M.; Villa, P.; Martinelli, A. Application of remote sensing in water resource management: The case study of Lake Trasimeno, Italy. Water Resour. Manag. 2010, 24, 3885–3899. [Google Scholar] [CrossRef]
  23. Doglioni, C.; Mongelli, F.; Pialli, G. Appenninic back arc lithospheric boudinage on the former alpine belt. Mem. Soc. Geol. Ital. 1998, 52, 457–468. [Google Scholar]
  24. Barchi, M. The Neogene-Quaternary evolution of the Northern Apennines: Crustal structure, style of deformation and seismicity. In The Geology of Italy: Tectonics and Life Along Plate Margins; Journal of the Virtual Explorer, Electronic Edition; Beltrando, M., Peccerillo, A., Mattei, M., Conticelli, S., Doglioni, C., Eds.; The Virtual Explorer Pty. Ltd.: Conder, Australia, 2010; Volume 36, p. 11. [Google Scholar] [CrossRef]
  25. Brozzetti, F.; Boncio, P.; Lavecchia, G. A new interpretation of the CROP03 seismic profile across the Northern Tiber Valley and inferences about the seismotectonics of the Citta’ di Castello-San Sepolcro area. In Proceedings of the Geoitalia 2001: 3. Forum italiano di scienze della terra, Chieti, Italy, 5–8 September 2001; Carmina, B., Orlando, A., Pasero, M., Eds.; Federazione Italiana di Scienze della Terra: Chieti, Italy, 2001; pp. 337–338. [Google Scholar]
  26. Pascucci, V.; Merlini, S.; Martini, I.P. Seismic stratigraphy of the Miocene-Pleistocene sedimentary basinsof the Northern Tyrrhenian Sea and western Tuscany (Italy). Basin Res. 1999, 4, 337–356. [Google Scholar] [CrossRef]
  27. Pauselli, C.; Barchi, M.R.; Federico, C.; Magnani, M.B.; Minelli, G. The crustal structure of the Northern Apennines (Central Italy): An insight by the Crop03 seismic line. Am. J. Sci. 2006, 306, 428–450. [Google Scholar] [CrossRef]
  28. Gasperini, L.; Barchi, M.R.; Bellucci, L.G.; Bortoluzzi, G.; Ligi, M.; Pauselli, C. Tectonostratigraphy of Lake Trasimeno (Italy) and the geological evolution of the Northern Apennines. Tectonophysics 2010, 492, 164–174. [Google Scholar] [CrossRef]
  29. ISPRA—Servizio Geologico d’Italia. Carta Geologica d’Italia Alla Scala 1:50.000, Foglio 310 Passignano sul Trasimeno; Barchi, M., Marroni, M., Eds.; Istituto Superiore per la Protezione e la Ricerca Ambientale: Rome, Italy, 2014; ISBN 8893110342. [Google Scholar]
  30. Ambrosetti, P.; Cattuto, C.; Gregori, L. Lineamenti geomorfologici dell’area a sud del Lago Trasimeno: Bacino di Tavernelle/Pietrafitta. Il Quat. 1989, 2, 57–64. [Google Scholar]
  31. Deffenu, L.; Dragoni, W. Caratteristiche idrogeologiche del Lago Trasimeno. Mem. Soc. Geol. Ital. 1978, 19, 295–302. [Google Scholar]
  32. Dragoni, W. Idrogeologia del Lago Trasimeno: Sintesi, problemi, aggiornamenti. Geogr. Fis. Dinam. Quat. 1982, 5, 192–206. [Google Scholar]
  33. Cardellini, C.; Frondini, F.; Peruzzi, L. Caratteristiche idrogeochimiche degli acquiferi nel bacino del Lago Trasimeno (Italy). In Proceedings of the 2nd International Workshop Aquifer Vulnerability and Risk, and 4th Congress on the Protection and Management of Groundwater, Parma, Italy, 21–23 September 2005; Reggia di Colorno: Colorno, Italy, 2005; p. 7. [Google Scholar]
  34. Club Velico Trasimeno. Available online: http://www.clubvelicotrasimeno.it/Home.aspx (accessed on 20 December 2018).
  35. ARPA Umbria—Elenco Monitoraggi. Available online: http://www.arpa.umbria.it/pagine/elenco-monitoraggi (accessed on 10 December 2018).
  36. Parkhurst, D.L. User’s Guide to PHREEQC: A Computer Program for Speciation, Reaction-Path, Advective-Transport, and Inverse Geochemical Calculations; Water-Resources Investigations Report 95-4227; U.S. Geological Survey, Earth Science Information Center, Open-File Reports Section: Lakewood, CO, USA, 1995; 143 p.
  37. Wolery, T.J. Calculation of Chemical Equilibrium between Aqueous Solution and Minerals - The EQ3/6 Software Package; Lawrence Livermore National Laboratory Report UCRL-52658; Lawrence Livermore National Laboratory: Livermore, CA, USA, 1979; 41 p.
  38. Italian Republic. Decreto legislativo 3 aprile 2006, n. 152, Norme in materia ambientale. Gazzetta Ufficale 2006, 88, 13–374. [Google Scholar]
  39. European Union. Directive 2000/60/EC of the European Parliament and of the Council of 23 October 2000 establishing a framework for Community action in the field of water policy. Off. J. 2000, L 327, 1–73. [Google Scholar]
  40. Reeder, R.J.; Nakajima, Y. The nature of ordering and ordering defects in dolomite. Phys. Chem. Miner. 1982, 8, 29–35. [Google Scholar] [CrossRef]
  41. Zucchini, A.; Comodi, P.; Katerinopoulou, A.; Balic-Zunic, T.; McCammon, C.; Frondini, F. Order-disorder-reorder process in thermally treated dolomite samples: A combined powder and singlecrystal X-ray diffraction study. Phys. Chem. Miner. 2012, 39, 319–328. [Google Scholar] [CrossRef]
  42. Land, L.S. Failure to precipitate dolomite at 25 °C from dilute solution despite 1000 fold oversaturation after 32 years. Aquat. Geochem. 1998, 4, 361–368. [Google Scholar] [CrossRef]
  43. Arvidson, R.S.; Mackenzie, F.T. The dolomite problem: Control of precipitation kinetics by temperatureand saturation state. Am. J. Sci. 1999, 299, 257–288. [Google Scholar] [CrossRef]
  44. Frondini, F. Geochemistry of regional aquifer systems hosted by carbonate-evaporite formations in Umbria and southern Tuscany (central Italy). Appl. Geochem. 2008, 23, 2091–2104. [Google Scholar] [CrossRef]
  45. Longinelli, A.; Selmo, E. Isotopic composition of precipitation in Italy: A first overall map. J. Hydrol. 2003, 70, 75–88. [Google Scholar]
  46. Craig, H. Isotopic variations in meteoric waters. Science 1961, 133, 1702–1703. [Google Scholar] [CrossRef] [PubMed]
  47. Gibson, J.J.; Birks, S.J.; Edwards, T.W.D. Global prediction of δA and δ2H-δ18O evaporation slopes for lakes and soil water accounting for seasonality. Glob. Biogeochem. Cycles 2008, 22, GB2031. [Google Scholar] [CrossRef]
  48. Brabanti, L.; Carollo, A.; Libera, V. Carta Batimetrica del Lago Trasimeno; Istituto Italiano di Idrobiologia: Pallanza, Italy, 1968. [Google Scholar]
  49. Giustini, F.; Brilli, M.; Patera, A. Mapping oxygen stable isotopes of precipitation in Italy. J. Hydrol. Reg. Stud. 2016, 8, 162–181. [Google Scholar] [CrossRef] [Green Version]
  50. Craig, H.; Gordon, L.I. Deuterium and oxygen-18 variations in the ocean and marine atmosphere. In Stable Isotopes in Oceanographic Studies and Paleo-Temperatures; Tongiorgi, E., Ed.; Lab. Geol. Nucl.: Pisa, Italy, 1965; pp. 9–130. [Google Scholar]
  51. Gat, J.R.; Mook, W.G.; Meijer, H.A.J. Atmospheric Water. In Environmental Isotopes in the Hydrological Cycle: Principles and Applications; IAEA-UNESCO Series; IHP-V Technical Documents in Hydrology, No.39, Vol. II; Mook, W.G., Ed.; UNESCO: Paris, France, 2001; Volume 2, p. 113. [Google Scholar]
  52. Rozanski, K.; Froehlich, K.; Mook, W.G. Surface Water. In Environmental Isotopes in the Hydrological Cycle: Principles and Applications; IAEA-UNESCO Series; IHP-V Technical Documents in Hydrology, N.39, Vol. III; Mook, W.G., Ed.; UNESCO: Paris, France, 2001; Volume 3, p. 117. [Google Scholar]
  53. Gibson, J.J.; Birks, S.J.; Yi, Y. Stable isotope mass balance of lakes: A contemporary perspective. Quat. Sci. Rev. 2016, 131, 316–328. [Google Scholar] [CrossRef]
  54. Regione Umbria. Servizio Idrografico Regionale. Available online: http://www.regione.umbria.it/ambiente/servizio-idrografico (accessed on 20 December 2018).
  55. Skrzypek, G.; Mydłowski, A.; Dogramaci, S.; Hedley, P.; Gibson, J.J.; Grierson, P.F. Estimation of evaporative loss based on the stable isotope composition of water using Hydrocalculator. J. Hydrol. 2015, 523, 781–789. [Google Scholar] [CrossRef] [Green Version]
  56. Horita, J.; Wesolowski, D.J. Liquid-vapor fractionation of oxygen and hydrogen isotopes of water from the freezing to the critical temperature. Geochim. Cosmochim. Acta 1994, 58, 3425–3437. [Google Scholar] [CrossRef]
  57. Wessa, P. Multivariate Correlation Matrix (v1.0.11) in Free Statistics Software (v1.2.1), Office for Research Development and Education. 2016. Available online: http://www.wessa.net/Patrick.Wessa/rwasp_pairs.wasp/ (accessed on 2 April 2019).
  58. Mannelli, G.; Mancini, P. Forme di inquinamento delle acque del Lago Trasimeno. Riv. Idrobiol. 1962, 2, 113–126. [Google Scholar]
  59. Tiberi, O. Fluoruri e cloruri nel lago Trasimeno. Riv. Idrobiol. 1980, 19, 37–59. [Google Scholar]
  60. Tiberi, O. Analisi di componenti abiotiche nei sedimenti del lago Trasimeno. Riv. Idrobiol. 1991, 30, 303–337. [Google Scholar]
  61. Tiberi, O.; Taticchi-Viganò, M.I.; Di Giovanni, M.V. Ragguagli sulle condizioni fisiche, chimiche, planctologiche del Lago Trasimeno (febbraio 1969–febbraio 1970). Riv. Idrobiol. 1971, 10, 39–233. [Google Scholar]
  62. Yapiyev, V.; Sagintayev, Z.; Inglezakis, V.J.; Samarkhanov, K.; Verhoef, A. Essentials of endorheic basins and lakes: A review in the context of current and future water resource management and mitigation activities in Central Asia. Water 2017, 9, 798. [Google Scholar] [CrossRef]
  63. Finch, J.W.; Hall, R.L. Evaporation from Lakes. In Encyclopedia of Hydrological Sciences, Part 4 Hydrometeorology; Anderson, M.G., McDonnell, J.J., Eds.; John Wiley & Sons, Inc.: Hoboken, NJ, USA, 2006. [Google Scholar]
  64. Hartmann, D.L.; Klein Tank, A.M.G.; Rusticucci, M.; Alexander, L.V.; Brönnimann, S.; Charabi, Y.; Dentener, F.J.; Dlugokencky, E.J.; Easterling, D.R.; Kaplan, A.; et al. Observations: Atmosphere and Surface. In Climate Change 2013: The Physical Science Basis. Contribution of Working Group I to the Fifth Assessment Report of the Intergovernmental Panel on Climate Change; Stocker, T.F., Qin, D., Plattner, G.-K., Tignor, M., Allen, S.K., Boschung, J., Nauels, A., Xia, Y., Bex, V., Midgley, P.M., Eds.; Cambridge University Press: Cambridge, UK; New York, NY, USA, 2013; pp. 159–254. [Google Scholar]
  65. Wang, W.; Lee, X.; Xiao, W.; Liu, S.; Shultz, N.; Wang, Y.; Zang, M.; Zhao, L. Global lake evaporation accelerated by changes in surface energy allocation in a warmer climate. Nat. Geosci. 2018, 11, 410–414. [Google Scholar] [CrossRef]
  66. Livingstone, D.M.; Lotter, A.F. The relationship between air and water temperatures in lakes of the Swiss Plateau: A case study with palaeolimnological implications. J. Paleolimnol. 1998, 19, 181–198. [Google Scholar] [CrossRef]
  67. Schneider, P.; Hook, S.J. Space observations of inland water bodies show rapid surface warming since 1985. Geophys. Res. Lett. 2010, 37, L22405. [Google Scholar] [CrossRef]
  68. Sharma, S.; Gray, D.K.; Read, J.S.; O’Reilly, C.M.; Schneider, P.; Qudrat, A.; Gries, C.; Stefanoff, S.; Hampton, S.E.; Hook, S.; et al. A global database of lake surface temperatures collected by in situ and satellite methods from 1985–2009. Sci. Data 2015, 2, 150008. [Google Scholar] [CrossRef] [PubMed]
  69. Austin, J.; Colman, S. A century of temperature variability in Lake Superior. Limnol. Oceanogr. 2008, 53, 2724–2730. [Google Scholar] [CrossRef]
  70. O’Reilly, C.M.; Sharma, S.; Gray, D.K.; Hampton, S.E.; Read, J.S.; Rowley, R.J.; Schneider, P.; Lenters, J.D.; McIntyre, P.B.; Kraemer, B.M.; et al. Rapid and highly variable warming of lake surface waters around the globe. Geophys. Res. Lett. 2015, 42. [Google Scholar] [CrossRef]
Figure 1. Location of the study area and main features of the Lake Trasimeno basin. The light grey area indicates the natural catchment of lake Trasimeno and the dark grey areas indicate the river basins artificially connected to the lake after 1957. The blue dotted line represents the artificial waterway connecting the Moiano and Maranzano river basins to the Anguillara channel.
Water 11 01319 g001
Figure 2. Geolithological map [28,29,32]. In the same map are also reported the elevation of the water table [33] and the location of sampling points (CL—Castiglione del Lago, SA—Sant’Arcangelo, PA—Passignano, AC—Anguillara Channel, PS—Paganico stream, VE—Vernazzano well, CE—Cerrete spring; A and B are the locations of the vertical profiles).
Water 11 01319 g002
Figure 3. (a) Annual average, maximum, and minimum levels of Lake Trasimeno and (b) annual precipitations from 1960 to 2017; 1960–2003 data are taken from [5] and [6]; 2004–2017 data are taken from www.clubvelicotrasimeno.it [34].
Water 11 01319 g003
Figure 4. (a) Piper diagram. Open circles refer to lake water samples, squares refer to river waters and triangles to groundwater samples; (b) variations of temperature, pH, Eh, electrical conductivity, Cl and Na along the vertical profiles A (blue circles) and B (red circles).
Water 11 01319 g004
Figure 5. Na vs. Cl diagram. Open circles refer to lake water samples, squares refer to river waters and triangles to groundwater samples. Dashed line represents the theoretical dissolution ratio (Na/Cl = 0.65 by weight) of halite.
Water 11 01319 g005
Figure 6. Variations of concentration of Cl, Na + K, Ca + Mg (a), TDS and lake level (b) over time. Solid lines refer to the new data presented in this work and dashed lines refer to the data of ARPA-Umbria for the period July 2015–January 2018; (c) binary plots of Cl, Na + K, Ca + Mg vs TDS; (d) variations of pH, log10PCO2 and saturation index of calcite.
Water 11 01319 g006
Figure 7. (a) δD vs δ18O diagram. Delta notation for stable hydrogen and oxygen isotopes in permil relative to Vienna Standard Mean Ocean Water (VSMOW). LEL, Local Evaporation Line; CIMWL, Central Italy Meteoric Water Line [45]; GMWL, Global Meteoric Water Line [46]. Isotopic composition of rainwater is from [45]; (b) variations of δ18O and δD along the vertical profiles A (blue dots) and B (red dots).
Water 11 01319 g007
Figure 8. Variations of δ18O (a) and δD (b) in lake water from 2006 to 2015. Data in permil relative to VSMOW. Black dots refer to the analytical data while blue (δ18O) and red (δD) solid lines represent the theoretical values. The theoretical values are presented only up to October 2013 because after this date the hydrologic data are incomplete, making it impossible to apply the isotopic mass balance. In both diagrams are also shown the lake level variations (grey line).
Water 11 01319 g008
Figure 9. (a) Mean annual temperatures of lake water (red dots) and simple fit of the data (black lines) compared to the monthly average temperature of lake water from 1966 to 2018 (blue curve); (b) 12-month running averages (blue curve) of monthly temperature from 1966 to 2018, compared to mean annual temperatures of lake water (red dots) and simple fit of the data (black lines). Temperatures from April 2006 to January 2015 are from this study; data from July 1966 to March 2006 are taken from Ludovisi and Gaino [5]; data from July 2015 to January 2018 are from ARPA-Umbria [35]. At the bottom of Figure 9b, the 12-month running averages of monthly evaporation, precipitation on the lake and precipitation on the basin from 1966 to 2013 are shown.
Water 11 01319 g009
Figure 10. (a) Average values of TDS (red curve) and Cl (blue curve) from 1961 to 2018. Grey curves indicate the range of variation of the two variables; (b) total mass of dissolved ions (red) and total mass of chloride (blue) from 1961 to 2018, dotted lines represent the linear best fit of the data. Our dataset is completed with data from Ludovisi and Gaino [5], Mearelli et al. [18], ARPA-Umbria [35], Mannelli and Mancini [58], Tiberi [58,59]) and Tiberi et al. [60].
Water 11 01319 g010
Table 1. Saturation indexes (SI)* with respect to relevant mineral phases and log PCO2. The average and the standard deviation values (in brackets) are reported for each phase.
SamplesCalciteDolomite (Ordered)GypsumFluoriteHaliteQuartzChalcedonyAmorphous Silicalog10
PCO2
Lake0.75
(0.29)
2.94
(0.65)
−2.31
(0.08)
−2.05
(0.12)
−5.79
(0.09)
−0.32
(0.35)
−0.60
(0.35)
−1.68
(0.35)
−3.34
(0.22)
Groundwater−0.11
(0.14)
0.44
(0.14)
−2.03
(0.31)
−2.75
(0.68)
−7.68
(0.31)
0.56
(0.14)
0.28
(0.14)
−0.82
(0.15)
−1.73
(0.19)
Rivers0.59
(0.26)
1.93
(0.46)
−1.97
(0.28)
−2.35
(0.19)
−6.58
(0.22)
0.20
(0.30)
−0.08
(0.30)
1.17
(0.30)
−2.61
(0.17)
* SI = log10(IAP/Ksp), where IAP is the ionic activity product and Ksp is the solubility product. For each mineral phase: if SI = 0, the solution is in equilibrium (IAP = Ksp); if SI < 0, the solution is undersaturated (IAP < Ksp); if SI > 0, the solution is supersaturated (IAP > Ksp).
Table 2. Pearson correlation matrix of ∆D‰, ∆18O‰, and controlling variables temperature (t °C), precipitation (P) and evaporation (E); for all pairs of data series, correlation coefficients (r) and p-values (in brackets) are shown. Computations are based on Free Statistics Software v1.2.1 [57].
Variablet (°C)P (mm)E (mm)∆D‰18O‰
t (°C)1
(0.000)
−0.352
(0.001)
0.913
(0.000)
0.788
(0.000)
0.798
(0.000)
P (mm) 1
(0.000)
−0.367
(0.001)
−0.632
(0.000)
−0.638
(0.000)
E (mm) 1
(0.000)
0.870
(0.000)
0.877
(0.000)
∆D‰ 1
(0.000)
0.994
(0.000)
∆18O‰ 1
(0.000)

