Development of the Wetland Condition Index (WCI) by Combining the Landscape Development Intensity Index (LDI) and the Water Environment Index (WEI) for Humid Regions of China


Abstract
:1. Introduction
2. Methodology
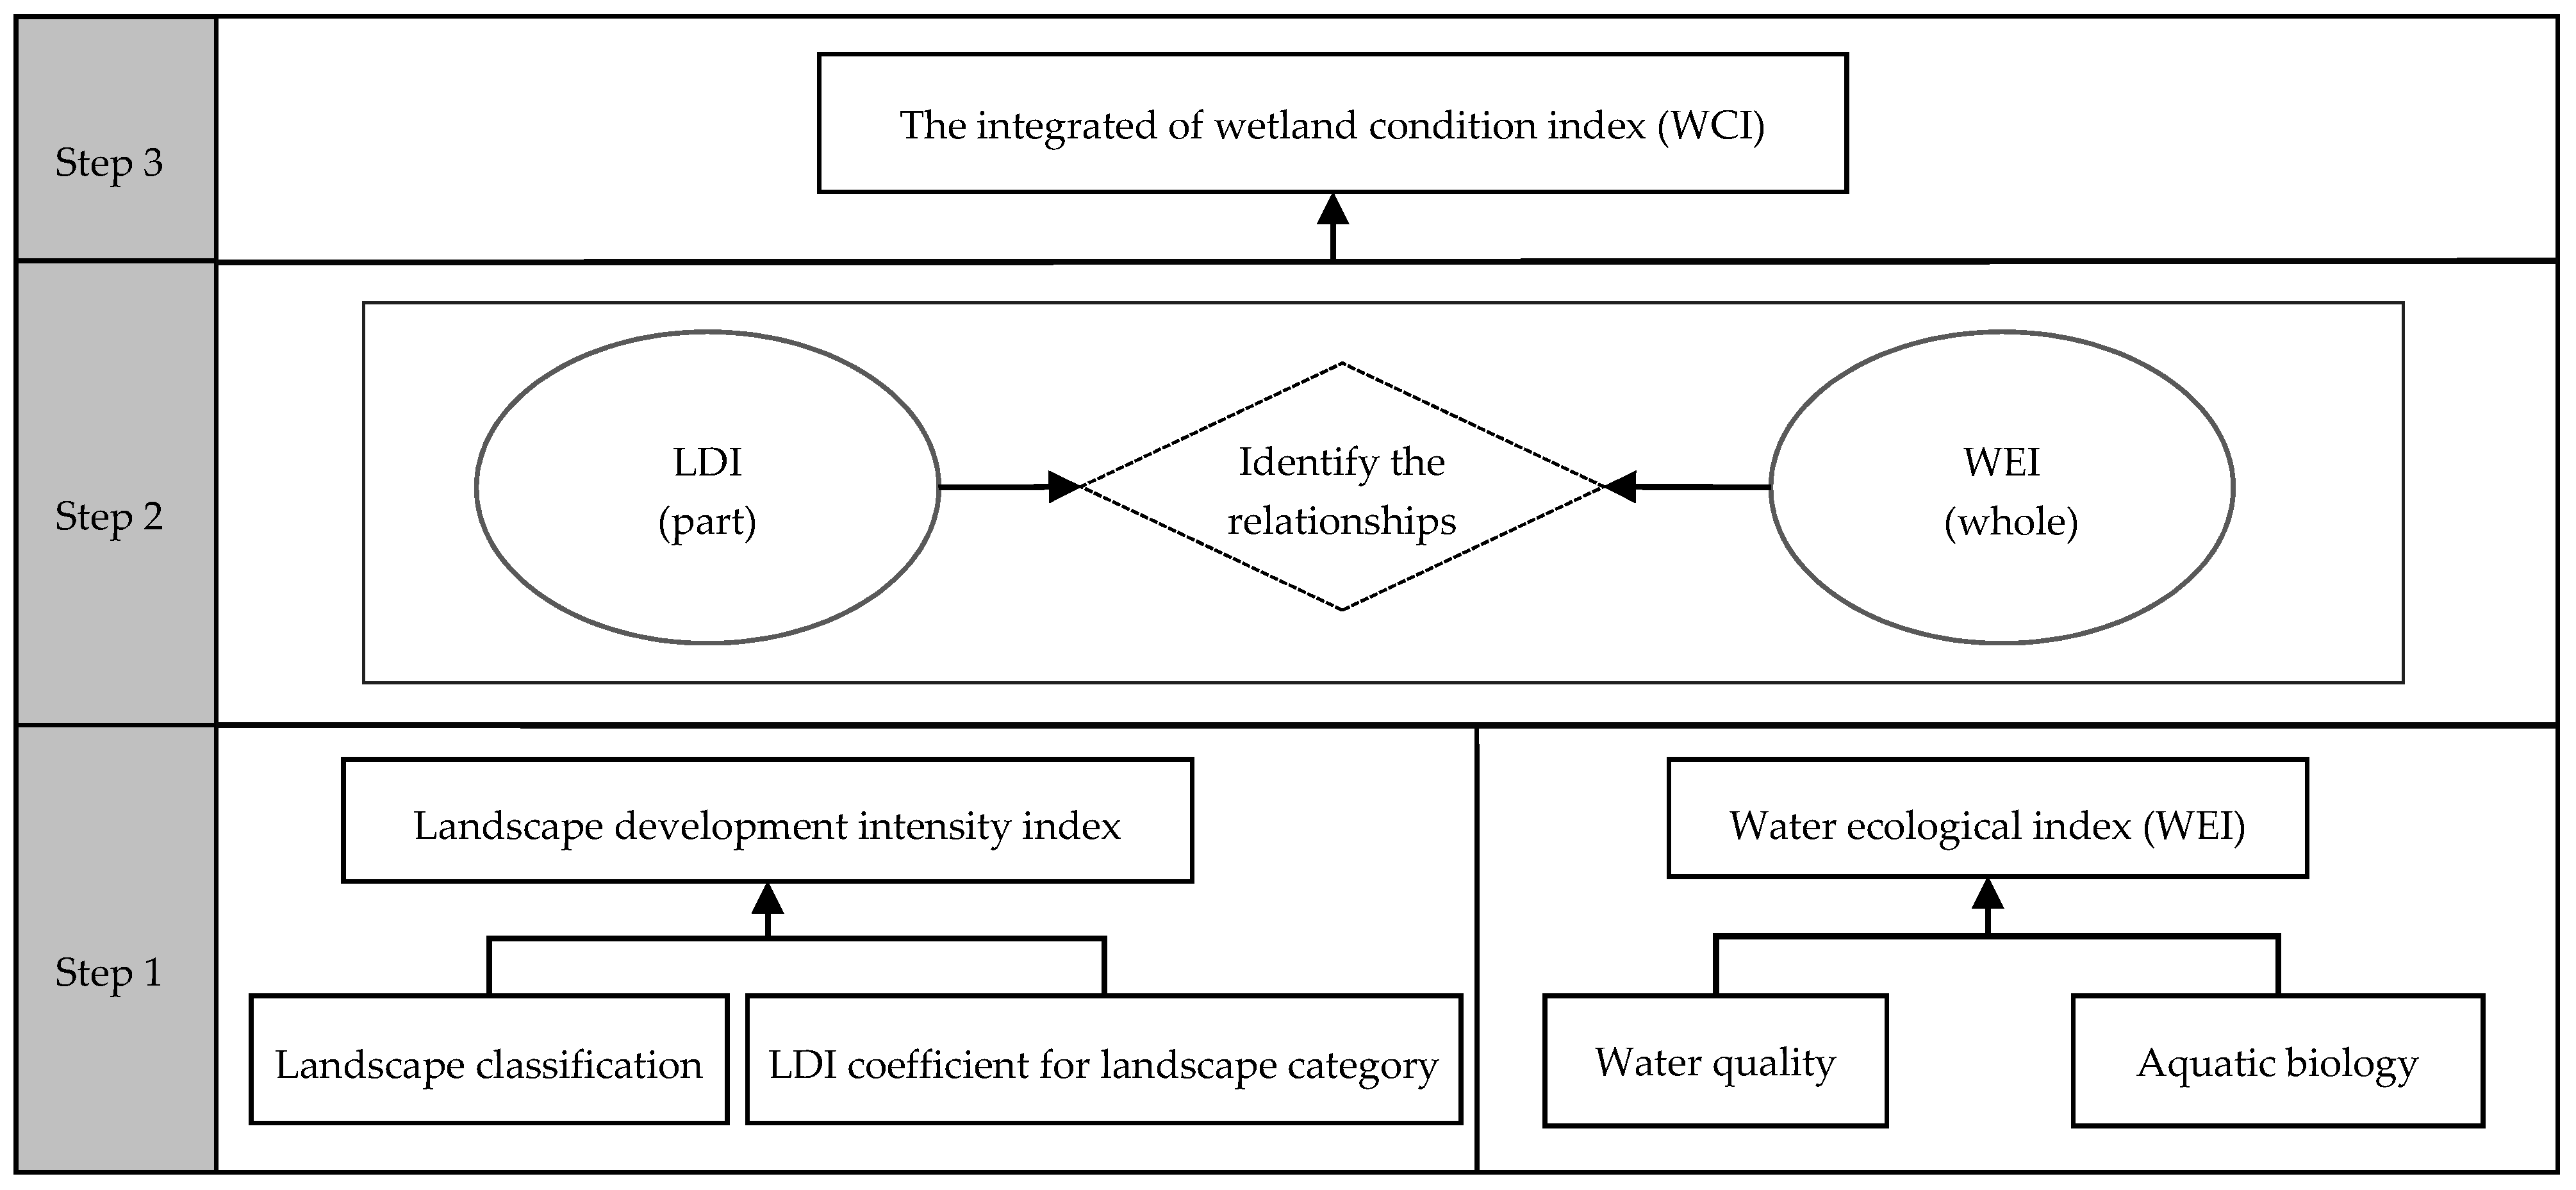
2.1. Basic Idea
2.2. The Landscape Development Intensity Index (LDI)
2.3. The Water Environment Index (WEI)
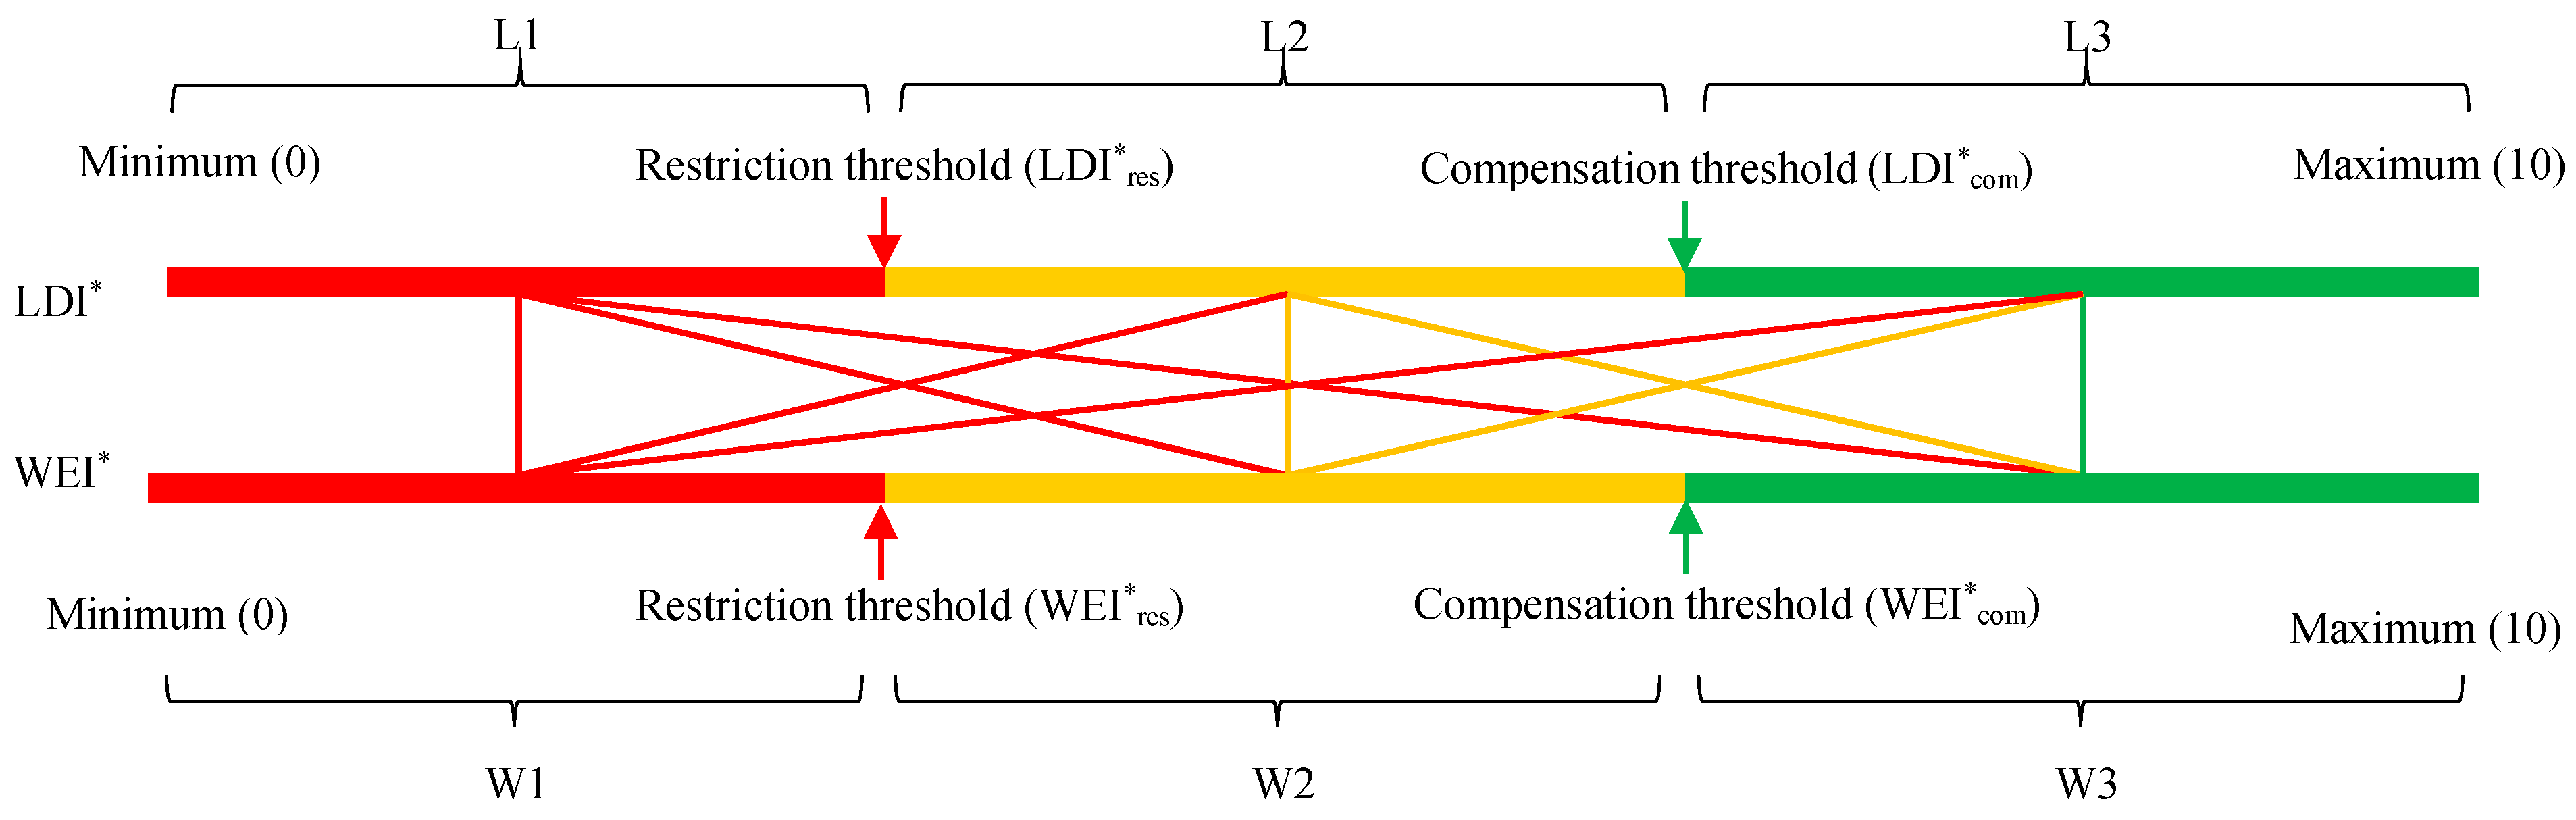
2.4. Construction of the Wetland Condition Index (WCI)
- When the LDI* is less than the restriction threshold, the LDI* is the restricting factor of the WCI regardless of the value of the WEI*, and the WCI will be equal to the LDI*.
- If the WEI* is less than the restriction threshold, the WEI* is the restricting factor of WCI regardless of the value of the LDI*; then, the WCI will be equal to the WEI*. For example, if a wetland is downstream of livestock farms, the landscape in the wetland watershed is in a natural state with no buildings or agriculture, but the water quality of the wetland is poor because of the livestock wastewater, not the landscape structure or quality. In this situation, the WCI is determined by the water quality, and is equal to WEI*.
- If the LDI* is between the restriction and compensation thresholds, the WEI* is between the restriction and compensation threshold, and the WCI will be equal to the sum of the LDI* and WEI* with the same weights.
- If the LDI* and WEI* are both higher than the compensation threshold, then the WCI will be higher than the sum of the LDI* and WEI*. In this case, the quality of the wetland is high enough to provide compensatory ecological functions.
3. Case Study
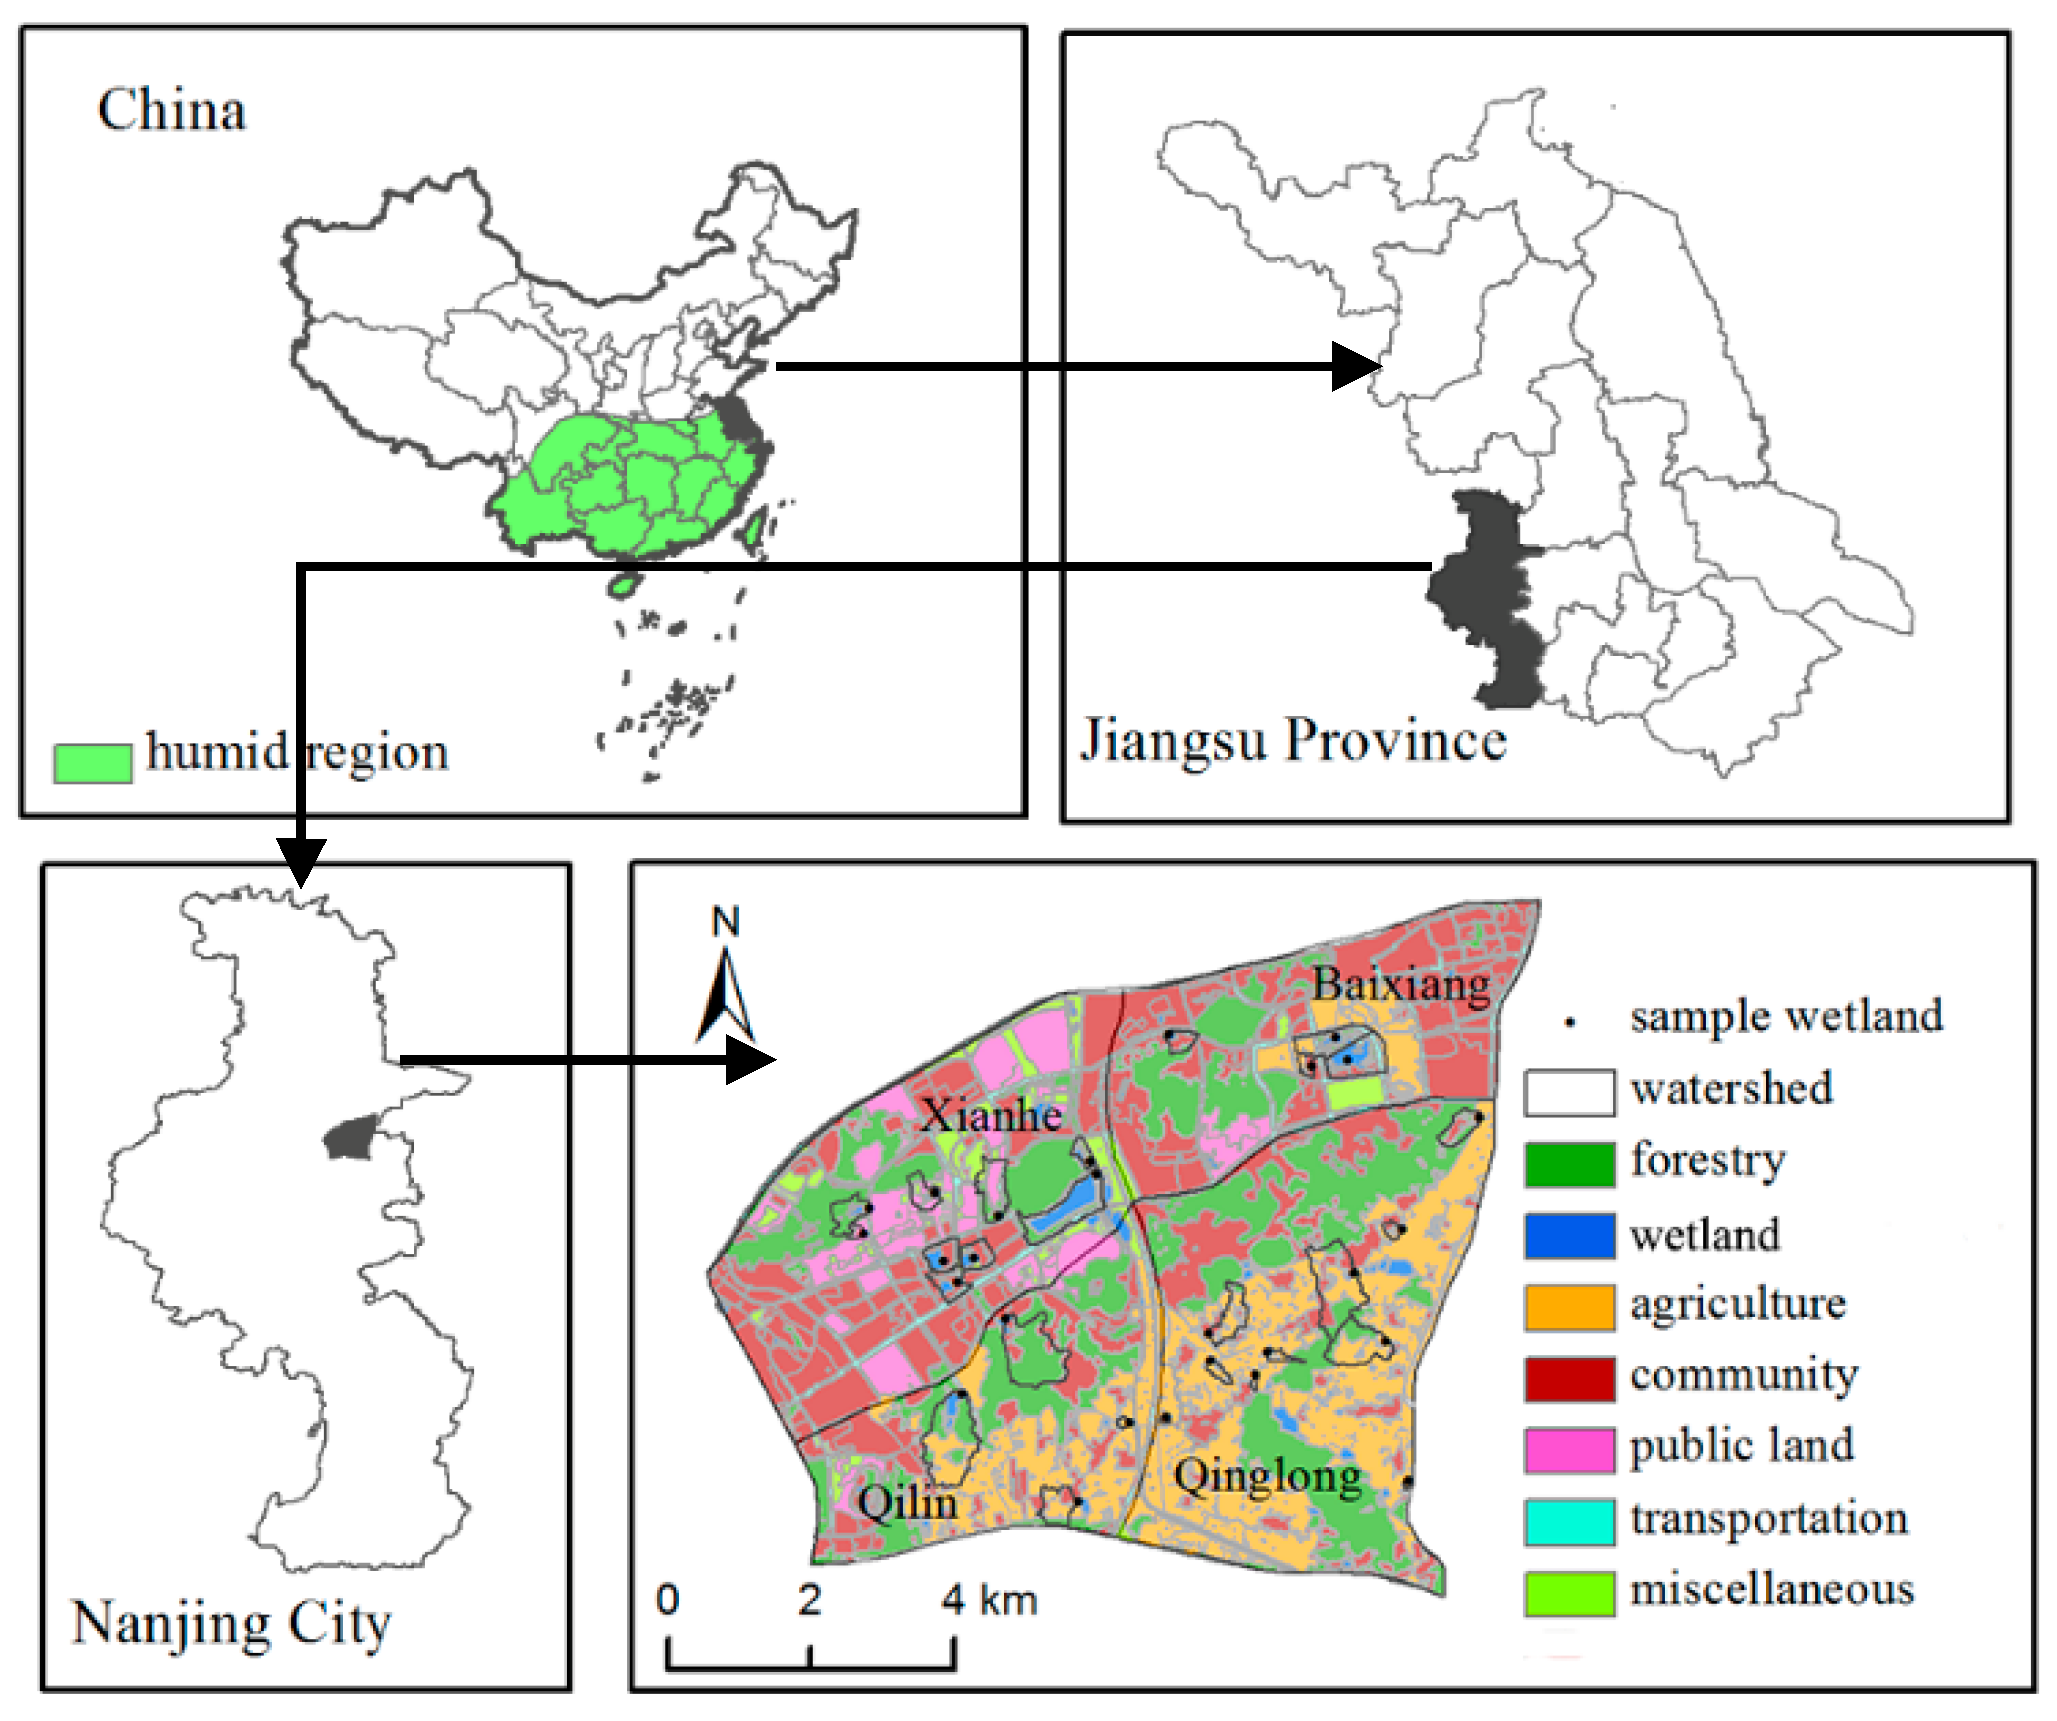
3.1. Xianlin Sub-City
3.2. Data Collection and Analysis
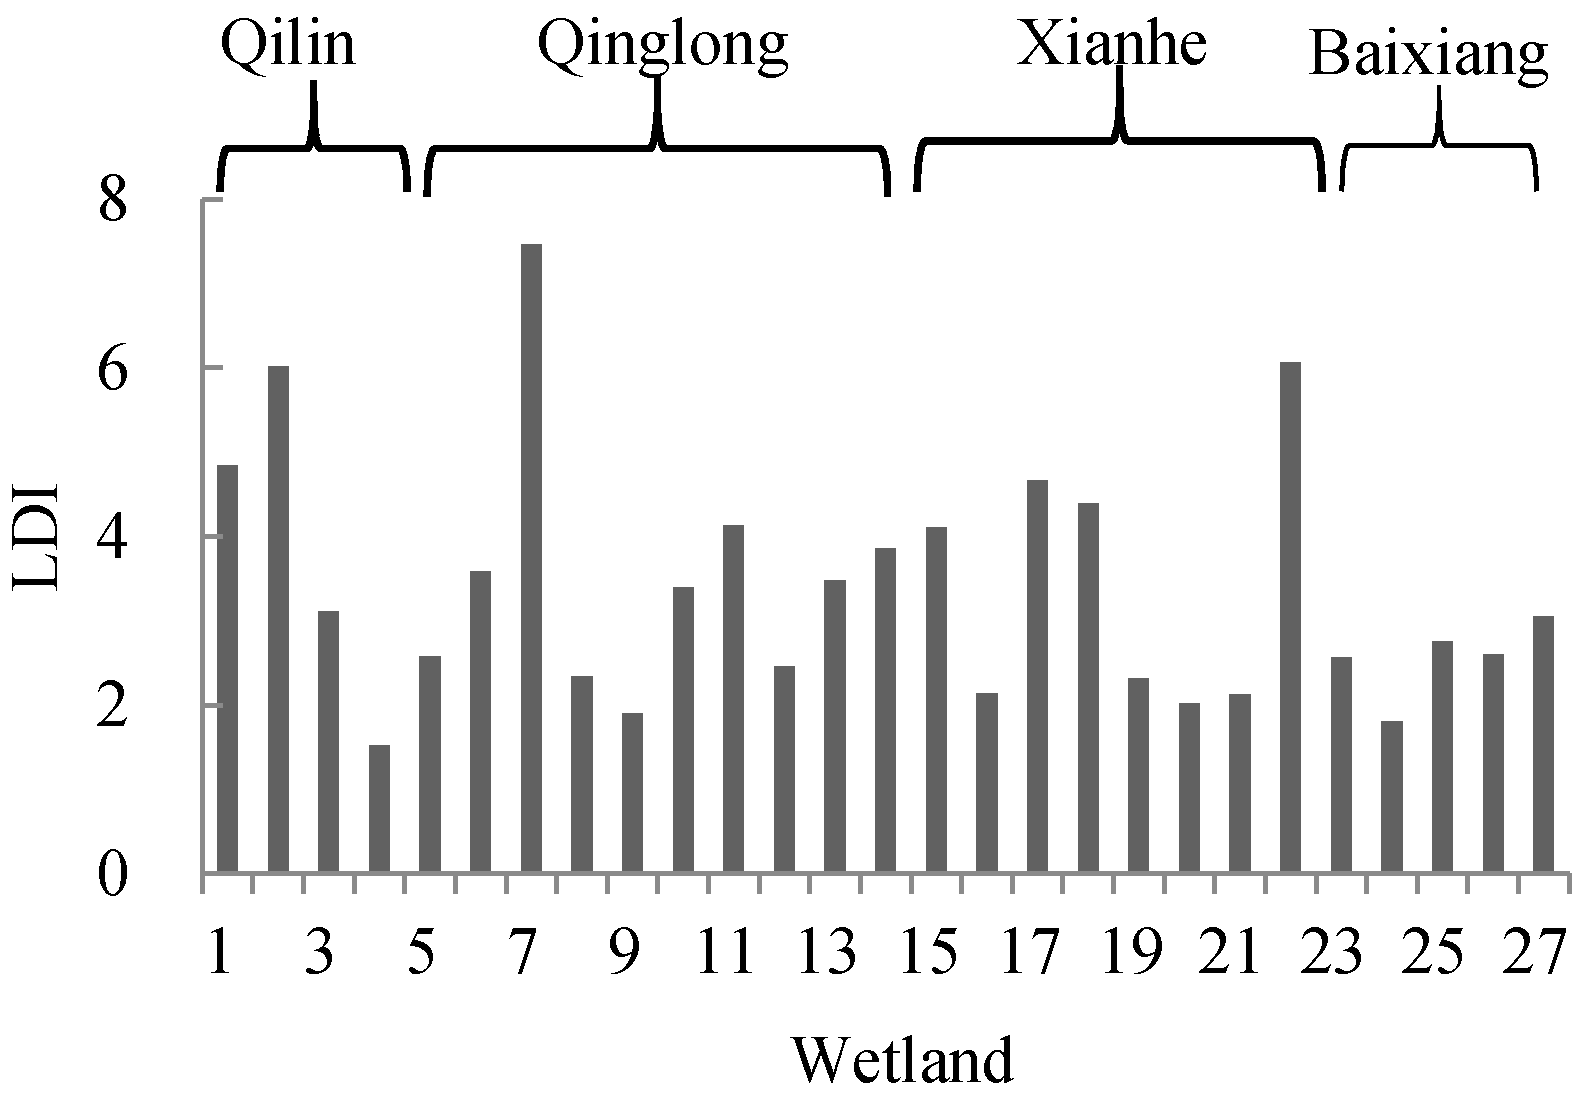
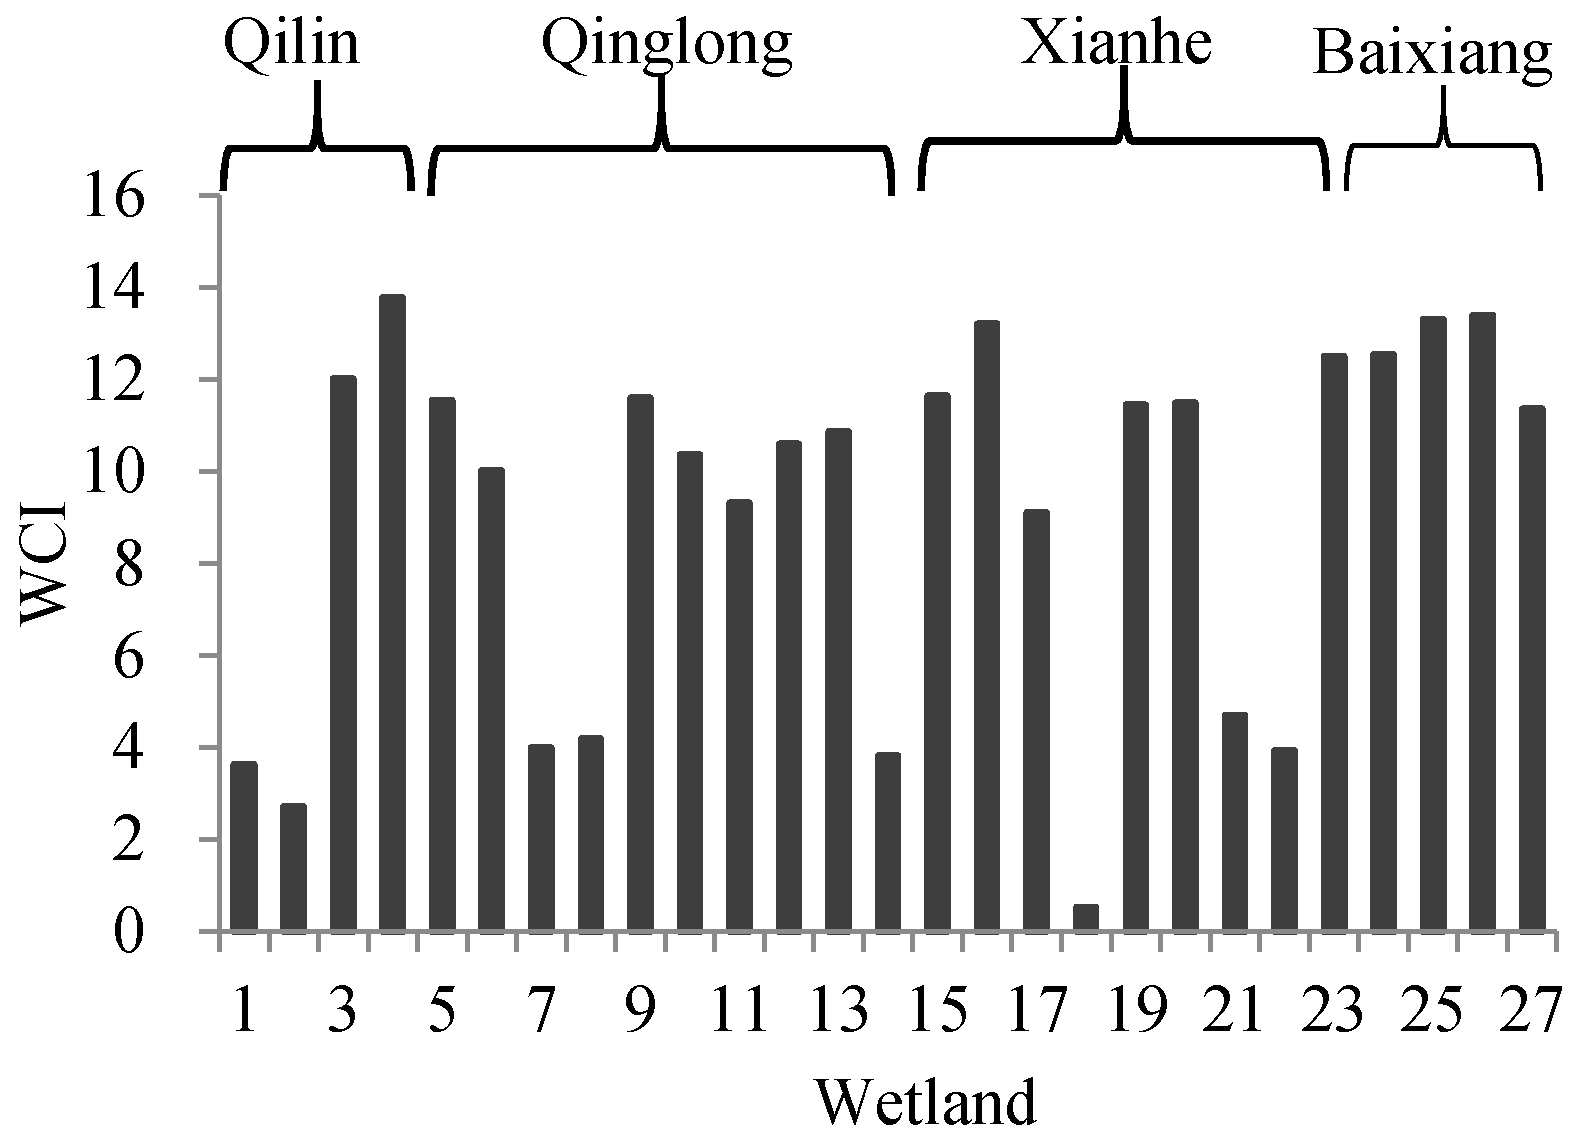
3.3. Landscape Development Intensity of the Xianlin Sub-City
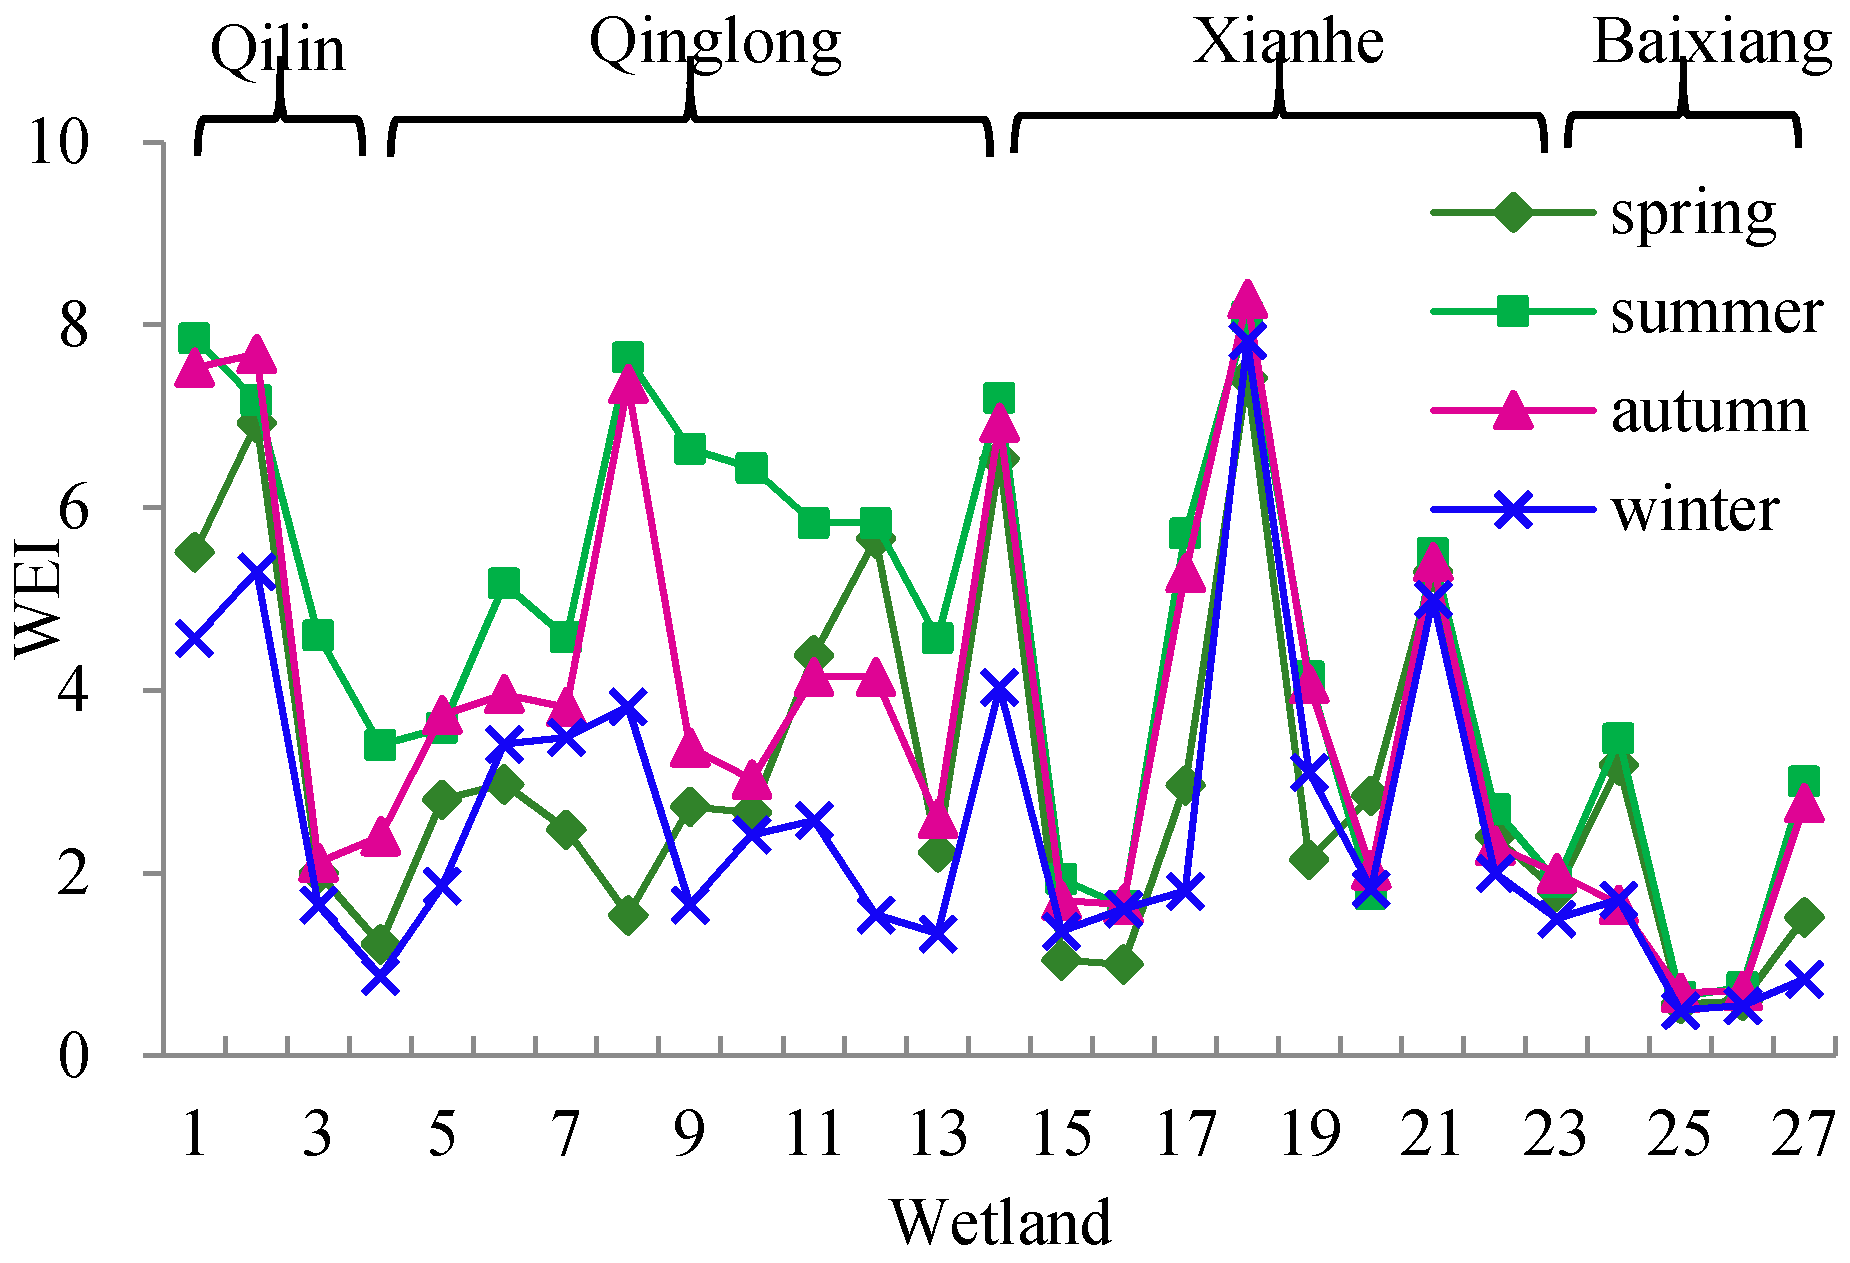
3.4. Water Environment Index of the Xianlin Sub-City
3.5. Wetland Condition Index of the Xianlin Sub-City
4. Discussion
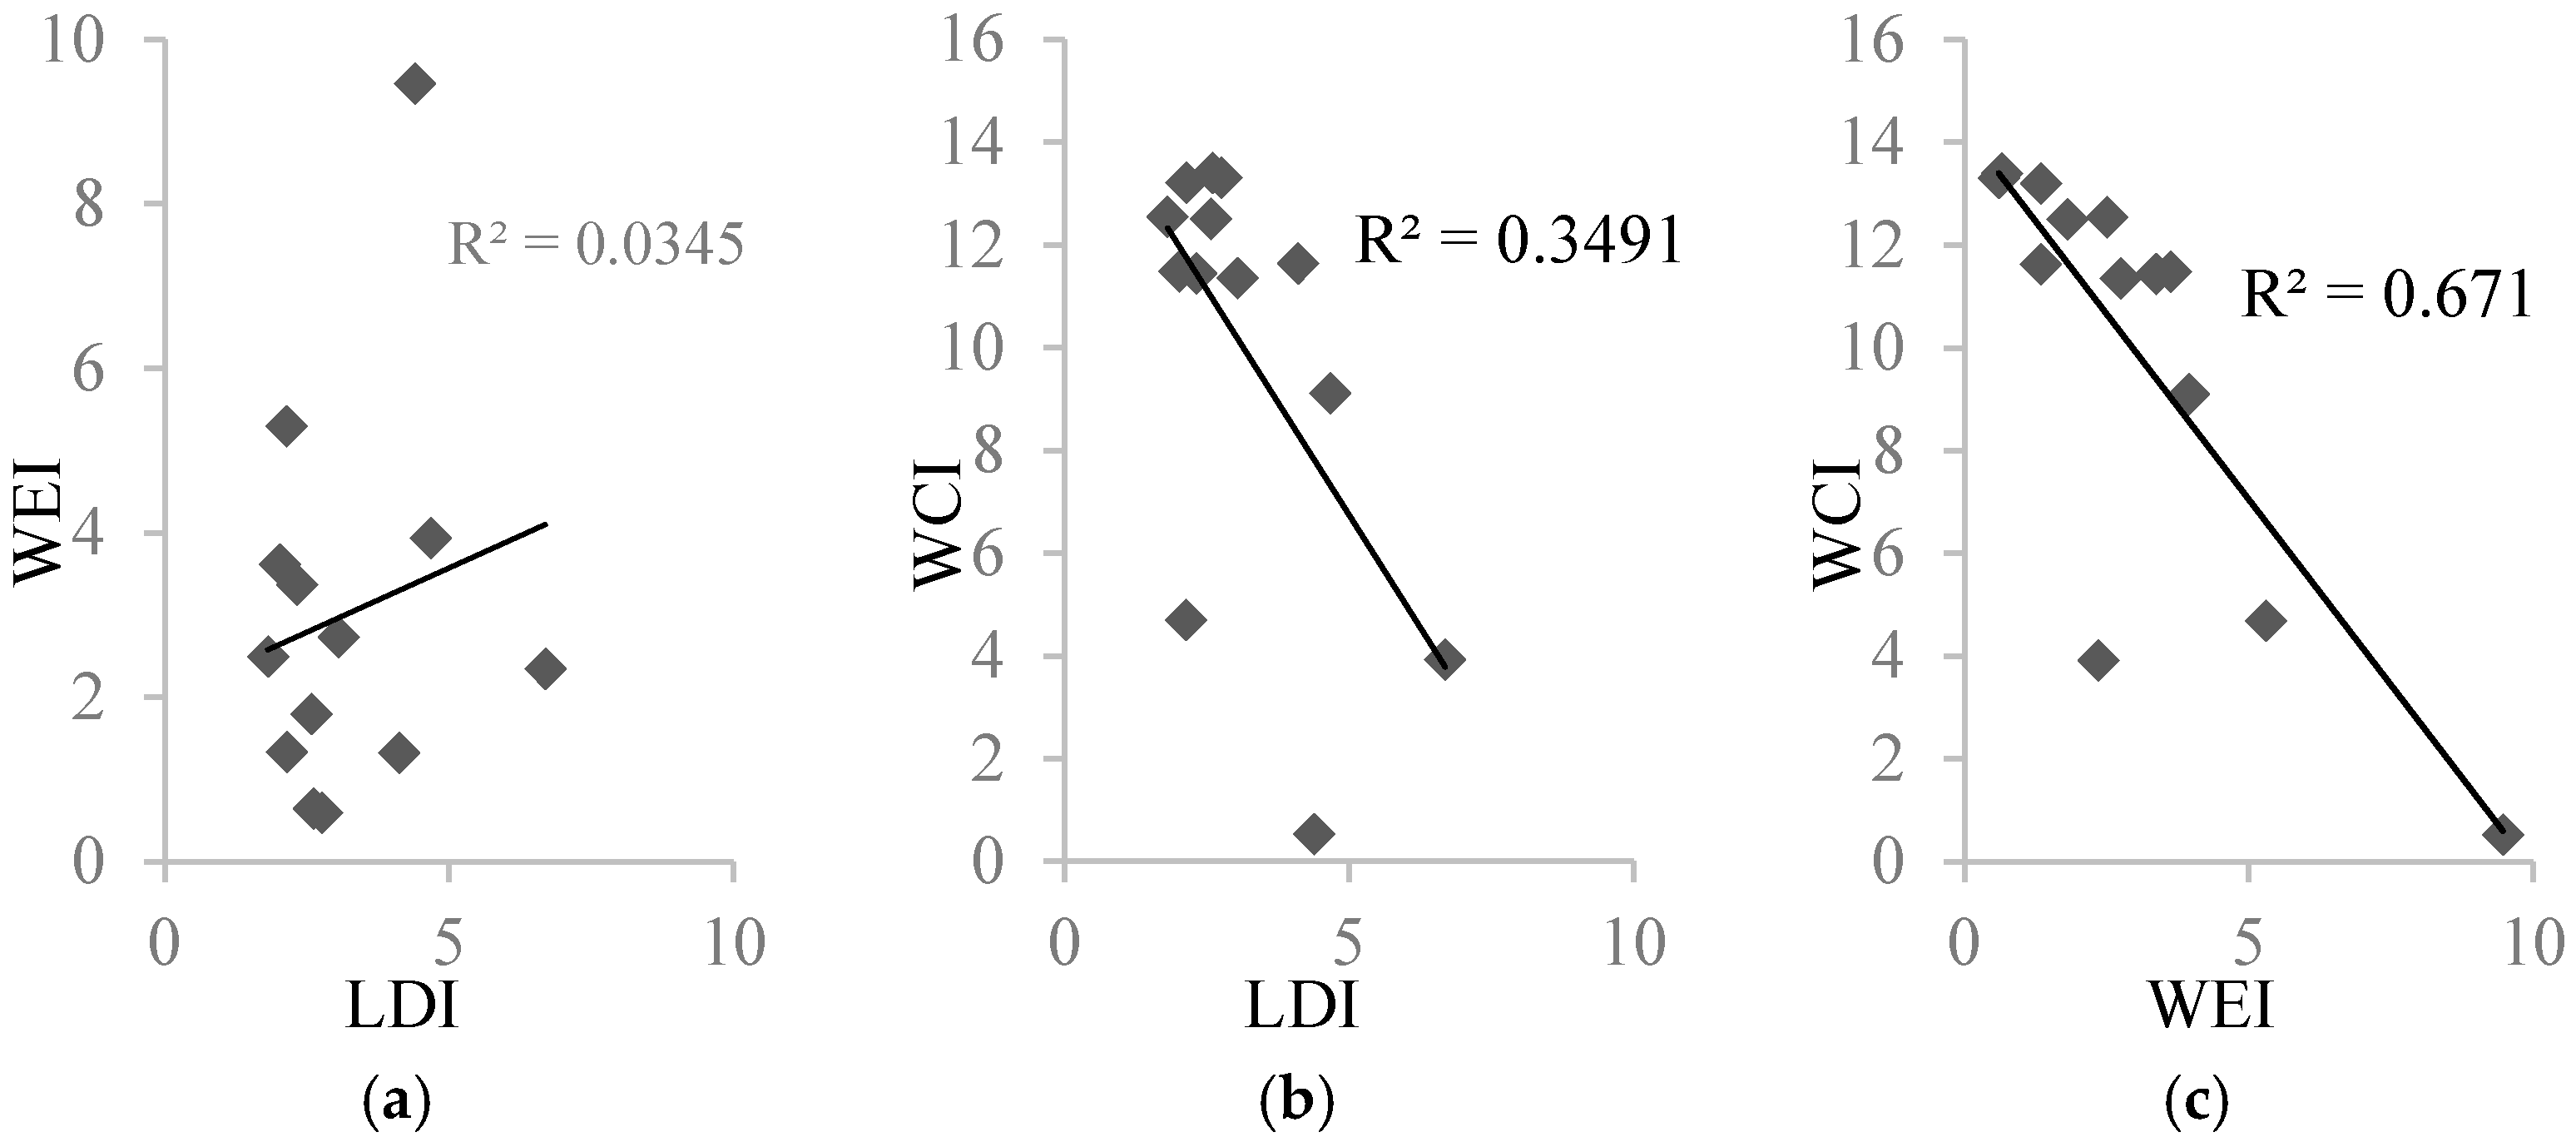
4.1. Comparison of the WEI, LDI, and WCI
4.2. Comparing WCI to IBI and HGM
4.3. Evaluation of the WCI
5. Conclusions
- To more accurately represent the conditions, the LDI and WEI should be integrated. Combining the WEI and LDI should consider the relationship between them. We developed a threshold weighting method to reduce the uncertainty and increase the reliability when assessing wetland conditions.
- The LDI is not suitable for artificial wetland conditions, especially in the urbanized regions in China. The WCI can identify and assess the wetland conditions, regarding the restoration and management of wetland.
- As the WCI has some advantages, we recommend the WCI as an alternative or complementary tool to assess the wetland conditions in the humid regions of China. However, there are several limitations of the WCI. First, the WEI is more about wetland water quality than ecological attributes. Thus, more ecological variables, such as aquatic vegetative and habitat variables, should be considered to calculate the WCI in the future. Second, more comparative studies, such as the IBI and HGM, should be conducted to improve the performance of the WCI.
Author Contributions
Funding
Acknowledgments
Conflicts of Interest
References
- Nahlik, A.M.; Fennessy, M.S. Carbon storage in US wetlands. Nat. Commun. 2016, 7, 13835. [Google Scholar] [CrossRef] [Green Version]
- Marazzi, L.; Gaiser, E.E.; Eppinga, M.B.; Sah, J.P.; Zhai, L.; Castañeda-Moya, E.; Angelini, C. Why Do We Need to Document and Conserve Foundation Species in Freshwater Wetlands? Water 2019, 11, 265. [Google Scholar] [CrossRef]
- Jiang, H.; He, C.; Luo, W.; Yang, H.; Sheng, L.; Bian, H.; Zou, C. Hydrological Restoration and Water Resource Management of Siberian Crane (Grus leucogeranus) Stopover Wetlands. Water 2018, 10, 1714. [Google Scholar] [CrossRef]
- Costanza, R.; de Groot, R.; Sutton, P.; van der Ploeg, S.; Anderson, S.J.; Kubiszewski, I.; Farber, S.; Turner, R.K. Changes in the global value of ecosystem services. Glob. Environ. Chang. 2014, 26, 152–158. [Google Scholar] [CrossRef]
- Davidson, N.C. How much wetland has the world lost? Long-term and recent trends in global wetland area. Mar. Freshw. Res. 2014, 65, 936–941. [Google Scholar] [CrossRef]
- Hu, S.; Niu, Z.; Chen, Y.; Li, L.; Zhang, H. Global wetlands: Potential distribution, wetland loss, and status. Sci. Total Environ. 2017, 586, 319–327. [Google Scholar] [CrossRef] [PubMed]
- Max Finlayson, C. Forty years of wetland conservation and wise use. Aquat. Conserv. Mar. Freshw. Ecosyst. 2012, 22, 139–143. [Google Scholar] [CrossRef]
- Smardon, R. Wetlands and Sustainability. Water 2014, 6, 3724–3726. [Google Scholar] [CrossRef] [Green Version]
- McLaughlin, D.L.; Cohen, M.J. Realizing ecosystem services: Wetland hydrologic function along a gradient of ecosystem condition. Ecol. Appl. 2013, 23, 1619–1631. [Google Scholar] [CrossRef] [PubMed]
- Hargiss, C.L.M.; DeKeyser, E.S.; Norland, J.E.; Ell, M.J. Comparing tiers of a multi-tiered wetland assessment in the Prairie Pothole Region. Wetl. Ecol. Manag. 2017, 25, 639–647. [Google Scholar] [CrossRef]
- Chen, H.S. Establishment and Applied Research on a Wetland Ecosystem Evaluation Model in Taiwan. Sustainability 2015, 7, 15785–15793. [Google Scholar] [CrossRef] [Green Version]
- De Troyer, N.; Mereta, S.T.; Goethals, P.L.M.; Boets, P. Water Quality Assessment of Streams and Wetlands in a Fast Growing East African City. Water 2016, 8, 123. [Google Scholar] [CrossRef]
- Ndayisaba, F.; Nahayo, L.; Guo, H.; Bao, A.; Kayiranga, A.; Karamage, F.; Nyesheja, E.M. Mapping and Monitoring the Akagera Wetland in Rwanda. Sustainability 2017, 9, 174. [Google Scholar] [CrossRef]
- Kachroud, M.; Trolard, F.; Kefi, M.; Jebari, S.; Bourrié, G. Water Quality Indices: Challenges and Application Limits in the Literature. Water 2019, 11, 361. [Google Scholar] [CrossRef]
- Brown, M.T.; Vivas, M.B. Landscape development intensity index. Environ. Monit. Assess. 2005, 101, 289–309. [Google Scholar] [CrossRef]
- Chen, T.-S.; Lin, H.-J. Application of a landscape development intensity index for assessing wetlands in Taiwan. Wetlands 2011, 31, 745–756. [Google Scholar] [CrossRef]
- Chen, T.-S.; Lin, H.-J. Development of a framework for landscape assessment of Taiwanese wetlands. Ecol. Indic. 2013, 25, 121–132. [Google Scholar] [CrossRef]
- Chaves, H.M.; Alipaz, S. An integrated indicator based on basin hydrology, environment, life, and policy: The watershed sustainability index. Water Resour. Manag. 2007, 21, 883–895. [Google Scholar] [CrossRef]
- Lane, C.R.; Brown, M.T. Diatoms as indicators of isolated herbaceous wetland condition in Florida, USA. Ecol. Indic. 2007, 7, 521–540. [Google Scholar] [CrossRef]
- Pratt, B.; Chang, H. Effects of land cover, topography, and built structure on seasonal water quality at multiple spatial scales. J. Hazard. Mater. 2012, 209, 48–58. [Google Scholar] [CrossRef] [PubMed]
- Mack, J.J. Landscape as a predictor of wetland condition: An evaluation of the landscape development index (LDI) with a large reference wetland dataset from Ohio. Environ. Monit. Assess. 2006, 120, 221–241. [Google Scholar] [CrossRef]
- Shuster, W.D.; Bonta, J.; Thurston, H.; Warnemuende, E.; Smith, D. Impacts of impervious surface on watershed hydrology: A review. Urban Water J. 2005, 2, 263–275. [Google Scholar] [CrossRef]
- Nikoo, M.R.; Kerachian, R.; Malakpour-Estalaki, S.; Bashi-Azghadi, S.N.; Azimi-Ghadikolaee, M.M. A probabilistic water quality index for river water quality assessment: A case study. Environ. Monit. Assess. 2011, 181, 465–478. [Google Scholar] [CrossRef]
- Kotze, D. The application of a framework for assessing ecological condition and sustainability of use to three wetlands in Malawi. Wetl. Ecol. Manag. 2011, 19, 507–520. [Google Scholar] [CrossRef]
- Rooney, R.C.; Bayley, S.E.; Creed, I.F.; Wilson, M.J. The accuracy of land cover-based wetland assessments is influenced by landscape extent. Landsc. Ecol. 2012, 27, 1321–1335. [Google Scholar] [CrossRef] [Green Version]
- Margriter, S.C.; Bruland, G.L.; Kudray, G.M.; Lepczyk, C.A. Using indicators of land-use development intensity to assess the condition of coastal wetlands in Hawai ‘i. Landsc. Ecol. 2014, 29, 517–528. [Google Scholar] [CrossRef]
- Faber-Langendoen, D.; Kudray, G.; Nordman, C.; Sneddon, L.; Vance, L.; Byers, E.; Rocchio, J.; Gawler, S.; Kittel, G.; Menard, S. Ecological Performance Standards for Wetland Mitigation: An Approach Based on Ecological Integrity Assessments; NatureServe: Arlington, VA, USA, 2008. [Google Scholar]
- Martínez-López, J.; Carreño, M.; Martínez-Fernández, J.; Esteve, M. Wetland and landscape indices for assessing the condition of semiarid Mediterranean saline wetlands under agricultural hydrological pressures. Ecol. Indic. 2014, 36, 400–408. [Google Scholar] [CrossRef]
- Chen, W.; Cao, C.; Liu, D.; Tian, R.; Wu, C.; Wang, Y.; Qian, Y.; Ma, G.; Bao, D. An evaluating system for wetland ecological health: Case study on nineteen major wetlands in Beijing-Tianjin-Hebei region, China. Sci. Total Environ. 2019, 666, 1080–1088. [Google Scholar] [CrossRef]
- Sun, T.; Lin, W.; Chen, G.; Guo, P.; Zeng, Y. Wetland ecosystem health assessment through integrating remote sensing and inventory data with an assessment model for the Hangzhou Bay, China. Sci. Total Envoron. 2016, 566–567, 627–640. [Google Scholar] [CrossRef]
- Proctor, J.D.; Larson, B.M.H. Ecology, Complexity, and Metaphor. BioScience 2005, 55, 1065–1068. [Google Scholar] [CrossRef]
- Fischer, C.; Preonas, L. Combining policies for renewable energy: Is the whole less than the sum of its parts? Resour. Future Discuss. Pap. 2010. [Google Scholar] [CrossRef]
- Zhang, F.; Wang, J.; Wang, X. Recognizing the Relationship between Spatial Patterns in Water Quality and Land-Use/Cover Types: A Case Study of the Jinghe Oasis in Xinjiang, China. Water 2018, 10, 646. [Google Scholar] [CrossRef]
- Reiss, K.C.; Hernandez, E.; Brown, M.T. Application of the landscape development intensity (LDI) index in wetland mitigation banking. Ecol. Model. 2014, 271, 83–89. [Google Scholar] [CrossRef]
- Boyacioglu, H.; Boyacioglu, H. Surface water quality assessment by environmetric methods. Environ. Monit. Assess. 2007, 131, 371–376. [Google Scholar] [CrossRef]
- Pinto, U.; Maheshwari, B. A framework for assessing river health in peri-urban landscapes. Ecohydrol. Hydrobiol. 2014, 14, 121–131. [Google Scholar] [CrossRef]
- Poe, A.C.; Piehler, M.F.; Thompson, S.P.; Paerl, H.W. Denitrification in a constructed wetland receiving agricultural runoff. Wetlands 2003, 23, 817–826. [Google Scholar] [CrossRef]
- Davidson, N.; Finlayson, C. Earth observation for wetland inventory, assessment and monitoring. Aquat. Conserv. Mar. Freshw. Ecosyst. 2007, 17, 219–228. [Google Scholar] [CrossRef]
- Li, Y.; Liu, H.; Hao, J.; Zheng, N.; Cao, X. A quantitative method and case analysis for assessing water health. Huan Jing Ke Xue 2012, 33, 346–351. [Google Scholar] [PubMed]
- Xu, F.-L.; Zhao, Z.-Y.; Zhan, W.; Zhao, S.-S.; Dawson, R.W.; Tao, S. An ecosystem health index methodology (EHIM) for lake ecosystem health assessment. Ecol. Model. 2005, 188, 327–339. [Google Scholar] [CrossRef]
- Tan, E.; Hsu, T.-C.; Huang, X.; Lin, H.-J.; Kao, S.-J. Nitrogen transformations and removal efficiency enhancement of a constructed wetland in subtropical Taiwan. Sci. Total Environ. 2017, 601–602, 1378–1388. [Google Scholar] [CrossRef] [PubMed]
- Müller, S.; Mitrovic, S.M. Phytoplankton co-limitation by nitrogen and phosphorus in a shallow reservoir: Progressing from the phosphorus limitation paradigm. Hydrobiologia 2015, 744, 255–269. [Google Scholar] [CrossRef]
- Chislock, M.F.; Doster, E.; Zitomer, R.A.; Wilson, A. Eutrophication: Causes, consequences, and controls in aquatic ecosystems. Nat. Educ. Knowl. 2013, 4, 10. [Google Scholar]
- Ministry of Ecology and Environment (MEE). Environmental Quality Standards for Surface Water (GB 3838-2002); China Environmental Science Press: Beijing, China, 2002; p. 2. (In Chinese)
- Graham, M.H. Confronting multicollinearity in ecological multiple regression. Ecology 2003, 84, 2809–2815. [Google Scholar] [CrossRef]
- Heard, G.W.; Scroggie, M.P.; Malone, B.S. Classical metapopulation theory as a useful paradigm for the conservation of an endangered amphibian. Biol. Conserv. 2012, 148, 156–166. [Google Scholar] [CrossRef]
- Tornwall, B.; Sokol, E.; Skelton, J.; Brown, B.L. Trends in stream biodiversity research since the river continuum concept. Diversity 2015, 7, 16. [Google Scholar] [CrossRef]
- Murphy, M.T. Source-sink dynamics of a declining eastern kingbird population and the value of sink habitats. Conserv. Biol. 2001, 15, 737–748. [Google Scholar] [CrossRef]
- Dai, J.; Wu, S.; Wu, X.; Xue, W.; Yang, Q.; Zhu, S.; Wang, F.; Chen, D. Effects of water diversion from yangtze river to lake taihu on the phytoplankton habitat of the wangyu river channel. Water 2018, 10, 759. [Google Scholar] [CrossRef]
- Sun, Y.; Liu, H.; Li, Y.; Cai, C.; Li, Y. Assessment of water environment functions in urban wetlands by using the hydrogeomorphic model: A case study of Nanjing Xianlin. Acta Ecol. Sin. 2016, 36, 3032–3041. [Google Scholar]
- Jingfeng, H.; Hongyu, L.; Hebing, H.; Jing, A. A study of the urban wetland water quality heterogeneity at differing scales. Energy Procedia 2011, 11, 4377–4383. [Google Scholar]
- Ongley, E.D.; Xiaolan, Z.; Tao, Y. Current status of agricultural and rural non-point source pollution assessment in china. Environ. Pollut. 2010, 158, 1159–1168. [Google Scholar] [CrossRef] [PubMed]
- Lu, H.; Xie, H.L. Impact of changes in labor resources and transfers of land use rights on agricultural non-point source pollution in Jiangsu Province, China. J. Environ. Manag. 2018, 207, 134–140. [Google Scholar] [CrossRef]
- Sutula, M.A.; Stein, E.D.; Collins, J.N.; Fetscher, A.E.; Clark, R. A practical guide for the development of a wetland assessment method: The California experience 1. J. Am. Water Resour. Assoc. 2006, 42, 157–175. [Google Scholar] [CrossRef]
- Kolka, R.K.; Nelson, E.; Trettin, C. Conceptual assessment framework for forested wetland restoration: The Pen Branch experience. Ecol. Eng. 2000, 15, S17–S21. [Google Scholar] [CrossRef]
- Stander, E.K.; Ehrenfeld, J.G. Rapid assessment of urban wetlands: Do hydrogeomorphic classification and reference criteria work? Environ. Manag. 2009, 43, 725–742. [Google Scholar] [CrossRef]
- Brinson, M.M. Changes in the functioning of wetlands along environmental gradients. Wetlands 1993, 13, 65–74. [Google Scholar] [CrossRef]
- Karr, J.R. Biological integrity: A long-neglected aspect of water resource management. Ecol. Appl. 1991, 1, 66–84. [Google Scholar] [CrossRef] [PubMed]
- Whigham, D.F. Ecological issues related to wetland preservation, restoration, creation and assessment. Sci. Total Environ. 1999, 240, 31–40. [Google Scholar] [CrossRef]
- Jumbe, A.S.; Nandini, N. Heavy metals analysis and sediment quality values in urban lakes. Am. J. Environ. Sci. 2009, 5, 678. [Google Scholar] [CrossRef]
- Brown, J.S.; Sutula, M.; Stransky, C.; Rudolph, J.; Byron, E. Sediment contaminant chemistry and toxicity of freshwater urban wetlands in southern California 1. J. Am. Water Resour. Assoc. 2010, 46, 367–385. [Google Scholar] [CrossRef]


| Equations | Requirements about LDI* Paired with WEI* | Illustration |
|---|---|---|
| L1W2 | Li and Wi represent the ranges of and respectively, as described in Figure 2. | |
| L1W3 | ||
| L1W1 and LDI* < WEI* | ||
| W1L2 | ||
| W1L3 | ||
| W1L1 and WEI* < LDI* | ||
| L2W2 | ||
| L2W3 | ||
| L3W2 | ||
| L3W3 |
| WCI Constituent | Good Condition (Compensation Threshold) | Poor Condition (Restriction Threshold) | Source | |
| LDI* | 8 | 5 | [15] | |
| WEI* | TN (mg/L) | 0.2 | 1.5 | [44] |
| TP (mg/L) | 0.02 | 0.3 | [44] | |
| PB (g/m3) | 0.04 | 4.10 | [44] | |
| Sub-Region | Development Stage | Total Wetland Rate (%) | Total Area (km2) | Sampled Wetland | Average Area of the Sampled Watershed (km2) | Average Area of Sampled Wetland (km2) |
|---|---|---|---|---|---|---|
| Xianhe | urbanization | 4.08 | 21.2 | 9 | 0.19 | 0.05 |
| Baixiang | urbanization | 3.35 | 15.0 | 4 | 0.20 | 0.05 |
| Qinglong | moderate urbanization | 4.41 | 24.7 | 10 | 0.16 | 0.01 |
| Qilin | Moderate urbanization | 3.86 | 13.9 | 4 | 0.40 | 0.04 |
| Water Index | Spring (n = 27) | Summer (n = 27) | Autumn (n = 27) | Winter (n = 27) | Average |
|---|---|---|---|---|---|
| D (Depth) (mm) | 953 b ± 346 | 1158 a ± 336 | 1039 ab ± 381 | 817 b ± 405 | 992 ± 362 |
| TP (mg/L) | 0.26 ab ± 0.24 | 0.39 a ± 0.37 | 0.27 ab ± 0.22 | 0.13 b ± 0.15 | 0.26 ± 0.27 |
| TN (mg/L) | 1.01 b ± 1.42 | 2.65 a ± 1.98 | 1.30 b ± 0.12 | 1.86 ab ± 2.14 | 1.71 ± 1.80 |
| PB (g/m3) | 8.76 ab ± 8.02 | 11.73 a ± 9.43 | 8.90 a ± 6.80 | 4.50 b ± 3.60 | 8.47 ± 6.96 |
| WEI | 3.05 a ± 0.85 | 4.51 b ± 0.79 | 3.75 a ± 0.81 | 2.52 a ± 1.11 | 3.56 ± 0.87 |
© 2019 by the authors. Licensee MDPI, Basel, Switzerland. This article is an open access article distributed under the terms and conditions of the Creative Commons Attribution (CC BY) license (http://creativecommons.org/licenses/by/4.0/).
Share and Cite
Wang, G.; Li, Y.; Liu, H.; Wright, A.L. Development of the Wetland Condition Index (WCI) by Combining the Landscape Development Intensity Index (LDI) and the Water Environment Index (WEI) for Humid Regions of China. Water 2019, 11, 620. https://doi.org/10.3390/w11030620
Wang G, Li Y, Liu H, Wright AL. Development of the Wetland Condition Index (WCI) by Combining the Landscape Development Intensity Index (LDI) and the Water Environment Index (WEI) for Humid Regions of China. Water. 2019; 11(3):620. https://doi.org/10.3390/w11030620
Chicago/Turabian StyleWang, Gang, Yufeng Li, Hongyu Liu, and Alan L. Wright. 2019. "Development of the Wetland Condition Index (WCI) by Combining the Landscape Development Intensity Index (LDI) and the Water Environment Index (WEI) for Humid Regions of China" Water 11, no. 3: 620. https://doi.org/10.3390/w11030620