Article

Long-Term Water Quality Changes as a Result of a Sustainable Restoration—A Case Study of Dimictic Lake Durowskie

by
Renata Dondajewska
1,*,
Katarzyna Kowalczewska-Madura
1,
Ryszard Gołdyn
1,
Anna Kozak
1,
Beata Messyasz
2 and
Sławek Cerbin
2
1
Department of Water Protection, Faculty of Biology, Adam Mickiewicz University, Umultowska 89, 61-614 Poznań, Poland
2
Department of Hydrobiology, Faculty of Biology, Adam Mickiewicz University, Umultowska 89, 61-614 Poznań, Poland
*
Author to whom correspondence should be addressed.
Water 2019, 11(3), 616; https://doi.org/10.3390/w11030616
Submission received: 18 February 2019 / Revised: 18 March 2019 / Accepted: 22 March 2019 / Published: 25 March 2019
(This article belongs to the Special Issue Water Quality of Freshwater Ecosystems in a Temperate Climate)

Abstract

:
Nature-based solutions in lake restoration enable gradual ecosystem reconstruction without drastic and expensive intervention. Sustainable lake restoration involves limited external interference strong enough to initiate and maintain positive changes in the ecosystem. It was introduced in Lake Durowskie, an urban, flow-through lake situated in Western Poland, using hypolimnetic aeration, phosphorus precipitation with small doses of chemicals and biomanipulation in 2009, and is continued until today. Oxygen conditions in the lake hypolimnion after initial deterioration were gradually improved, and finally a shortening of the duration and range of oxygen deficits was observed. Nitrogen transformations were induced in the hypolimnion by water aeration as well, reducing ammonium N (30% during 2013–2017 in comparison to 2008) and increasing nitrates (90% in 2013–2017 in comparison to 2008). Phosphorus content was diminished (19% during 2015–2017 in relation to 2008 for SRP) due to effective iron-binding and a smaller amount of fresh organic matter being decomposed. Its reduction was related to lower phytoplankton biomass, expressed in a decrease of chlorophyll-a concentrations (55% reduction during 2013–2017 in comparison to 2008) and an increase in water transparency (two-fold during 2013–2017 in relation to 2008) throughout the nine years of treatment. A long-term restoration program, based on non-aggressive, multiple in-lake techniques was applied and, despite the lack of a reduction in total external loading, was able to suppress progressive eutrophication.

1. Introduction

It is estimated that almost a half of European lakes remain below the good ecological state (GES), required by the Water Framework Directive [1] as necessary to achieve in the coming years [2]. It is therefore essential for them to take protective and/or restoration measures to fulfill this obligation. However, the costs of restoration are too high to be implemented on a large scale, thus only a small number of lakes are currently under recovery treatment [3]. A new approach to lake restoration is urgently needed, using internal mechanisms of ecosystems to support the return to good ecological status. Traditional methods of lake restoration, consisting of a one-off, very intense interference of the ecosystem, bring only a short-term water quality improvement [4,5]. Meanwhile, nature-based solutions enable gradual ecosystem reconstruction without drastic and expensive human intervention. This term has been adopted by International Union for Conservation of Nature, to name all actions undertaken to “protect, sustainable manage, and restore natural or modified ecosystems (…) simultaneously providing human well-being and biodiversity benefits”. It has a multidimensional potential, covering different human activities, including restoration of degraded ecosystems. As “nature-based”, the restoration shall be site-specific, applied at landscape scale and maintain biodiversity (www.iucn.org). Such ecological approach is represented by sustainable lake restoration, which involves limited external interference, but strong enough to initiate and then maintain positive changes in the ecosystem [6]. Water quality improvement leads to increase of biodiversity (ecological benefits) and to social benefits as well, by means of increasing safety for local communities using lake water for drinking/recreation/fish production.
Several methods are usually used at the same time to limit the effectiveness of feedbacks coming from the lake ecosystem to maintain its current degraded state [6]. Some nature-based solutions are used in Polish lakes, contributing to sustainable restoration, such as phosphorus inactivation using small precisely calculated doses of native chemical compounds, e.g., magnesium chloride and/or iron sulfate, deep water oxygenation using wind aerators, biomanipulation with predatory fish fry stocking, enrichment of water overlying the sediments with nitrates from the tributaries, increasing the redox potential of the sediment–water interphase and activating the denitrification process [7,8,9,10,11].
It is taken for granted in lake restoration manuals that the maximum limitation of external nutrient loading is crucial prior to the commencement of restoration [12,13]. In many cases, however, radical and rapid elimination of the external loads is not possible, especially in the case of non-point sources related to agriculture. Even a change in the way of farming or the use of biogeochemical barriers requires years for the system to be developed and the nutrient reserves in the soil to be reduced. Waiting for a decrease of loading from the catchment results in the persistence of hypereutrophy in a lake, hence the application of restoration measures after this time would be much more difficult than at the beginning, when the ecosystem resilience “remembers” the state before degradation [14,15]. Application of several years of sustainable restoration at the beginning of deterioration can easily check ecosystem degradation and maintain good lake water quality.
Lake Durowskie is an example of a gradual improvement in the water quality of inflowing riverine waters. The city of Gołańcz, situated in the upper part of the lake catchment, was equipped with a modern wastewater treatment plant; nevertheless, nutrients deposited in the bottom sediments of lakes in the course of the Struga Gołaniecka are still exerting a strong impact on this river as well as on the water quality of Lake Durowskie. The aim of the local authorities was to recover and maintain a good ecological status of the lake, despite the continuous flow of excessive external loads of nutrients, primarily to preserve the ecosystem services of this lake. The goal of the studies conducted during 2008–2017 was to assess whether sustainable, inexpensive restoration can stop the progressive degradation and restore good water quality, enabling safe recreation for the local community. Additionally, long-term studies were able to determine the longevity of restoration results, usually unattainable for traditional restoration methods.

2. Materials and Methods

2.1. Study Site

Lake Durowskie is an urban lake situated in the Wielkopolska Region (Western Poland) in the city of Wągrowiec (17°12’1’’ E, 52°49’6’’ N). This dimictic, flow-through, postglacial ribbon-type lake is located in the course of River Struga Gołaniecka, which is a tributary of the River Wełna (River Odra basin). This watercourse, with total length of 28 km, supplies Lake Durowskie with nutrients from the catchment, including a cascade of hypereutrophic lakes situated above (i.e., Lakes Kobyleckie, Bukowieckie, Grylewskie and Laskownickie). The lake surface area is 143 ha, maximum depth 14.6 m, mean depth 4.6 m and volume 11,322,900 m3. Maximum length is 4340 m, whilst the length of the shoreline is 10,515 m [9]. The lake is surrounded by forests in the northern part, and by urban areas in the south, thus recreational pressure (swimming, sailing, and angling) is severe. A promenade connecting the recreational centers runs along the whole eastern and southern shore line. There are numerous piers for fishing and jetties along the beaches and marinas. The total catchment surface of Durowskie Lake is 236.1 km2 (covered mainly by rural areas). The adjacent catchment area reaches 1581 ha, 58.3% being occupied by farmlands, 33.5% by forests and 8.2% by urban areas [16].
Progressive eutrophication of Durowskie Lake was observed at the turn of 20th and 21st century, with summer water blooms dominated by cyanobacteria, low transparency, oxygen depletion and the presence of hydrogen sulfide in deeper layers of the water column. Therefore, sustainable restoration was begun in 2009 using three methods: (i) hypolimnetic water aeration with the use of two wind-driven aerators; (ii) phosphorus inactivation in the water column using low doses of iron sulfate (PIX type coagulant) and magnesium chloride; and (iii) biomanipulation, based on pike and pikeperch fry stocking to increase the contribution of predatory fish in the lake ichthyofauna. Aerators were installed in two parts of the lake, one in the deepest part adjacent to the city, the second one at a 12 m depth in the part surrounded by forest [6] (Figure 1). The operation of aerators was based on oxygenation of the hypolimnetic water above the surface of the lake and its re-delivery to the bottom after oxygenation [17]. The small doses, i.e., 4–15 kg of iron sulfate per ha, used for restoration did not coagulate the suspended solids, but inactivated orthophosphates in the water column. The treatment was repeated 3–5 times during the vegetation season, eliminating P from the water column. Pike stocking was conducted irregularly, with a greater quantity of fry in 2011, i.e., 100,000 specimens. The highest amount of pikeperch fry was introduced in 2010, namely 114,000 specimens [6].

2.2. Methods

Sampling was conducted monthly from April 2008 to December 2017. Water samples prior to the restoration (2008) were taken at Station I only, while during restoration (2009–2017) at two stations and from the inflow of the Struga Gołaniecka. Both lake stations were located near the aerators: Station I at the deepest place (14.6 m) in the southern part of the lake, while Station II in the northern part at a depth of 12.0 m. Samples for the physicochemical and biological analyses were taken from epi-, meta- and hypolimnion, i.e., at Station I from a depth of 1 m, 7 m and 12 m, while at Station II from a depth of 1 m, 5 m and 8 m. Field measurements (water temperature, oxygen concentration, water saturation with oxygen, conductivity and pH) were conducted using a YSI 556 MPS-meter. Water transparency was measured with a Secchi disc. The concentrations of ammonium nitrogen (N-NH4), nitrate nitrogen (N-NO3), nitrite nitrogen (N-NO2), organic nitrogen (Norg), orthophosphates (SRP) and total phosphorus (TP) were analyzed with the spectrophotometric method according to Polish standards [18]. Concentration of chlorophyll-a was analyzed after filtration through Whatman GF/C filters using the spectrophotometric method with acetone extraction [19], and suspended solids using the weighting method.
Basic statistical calculations were made using STATISTICA version 10.0 software. The non-parametric Kruskall–Wallis test (K-W test) was used to determine the significance of value changes throughout the analyzed period. To relate the environmental variables in riverine and lake waters, a redundancy analysis was carried out using CANOCO 4.5 software.

3. Results

3.1. The Quality of Durowskie Lake Waters

3.1.1. Basic Water Characteristics

Durowskie Lake is a dimictic lake, thermally stratified in summer. Typical water mixing in the water column was observed in spring and autumn. The epilimnion usually reached a depth of 3 m, while the metalimnion down to 7–8 m at Station I and 6 m at Station II. The hypolimnion covered the deepest layer of water, reaching the bottom (Table 1). Mean temperature of the epilimnetic waters usually exceeded 20 °C and even 23 °C in 2012 and 2016. In the metalimnion, mean temperature varied from 11.6 to 16.4 °C, while in the hypolimnion from 5.9 to 8.5 °C, wherein warmer waters were noted at shallower Station II. The functioning of aerators did not affect the stability of thermal stratification, however, an increase in the temperature of hypolimnetic waters was observed. At Station I (depth 12 m) median water temperature was 6.0–6.1 °C in 2009–2011, and 6.5–7.2 °C in 2014–2017, whilst at Station II these values were 6.4–6.8 °C and 6.8–7.9 °C, respectively. This tendency was statistically significant at Station I (K-W test, p < 0.01) for years 2009–2017. Water temperatures noted in 2008 were not taken into consideration due to the lack of data from the entire year (only for the period April–November).
The oxygen concentration in the water column at both stations varied within wide limits from zero to ca. 20 mgO2 L−1. The highest content in each year was usually noted in early spring, with the maximum in March 2012 (Figure 2). The range and duration of oxygen depletion (less than 3 mgO2 L−1) in deep water layers changed from in time. The anoxic zone near the bottom was permanent in 2008, even in spring and autumn, indicating very short and incomplete water mixing. In 2009, deficits were already noted at the depth of 3 m in summer; however, in subsequent years, they were stated in a narrower layer of the water column, and in 2017 were noted only at 7–8 m depth. The duration of oxygen depletion shortened, from April to October at the beginning of the studies, while from June to October in 2017. The concentration of oxygen did not change linearly in subsequent years but fluctuated; however, it showed a tendency to decrease in the epilimnion and increase in meta- and hypolimnion (Figure 3). An increase in the metalimnion, especially at Station I, was confirmed by K-W test (p < 0.05) for layers 6–9 m at Station I and for 7 m at Station II. Nevertheless, the increase in the hypolimnion was not statistically significant.
The pH of Lake Durowskie waters varied within wide limits, 6.51–9.07 at Station I and 6.33–8.98 at Station II, with highest values in the epilimnion and lowest near the bottom (Figure 4). Median values fluctuated in all water layers in subsequent years slightly decreasing in time, however, only at the depth of 10 m at Station II was the decreasing tendency statistically significant (K-W test with p < 0.01).
A wide range of water conductivity was also noted in Lake Durowskie, with 322–969 µS cm−1 at Station I and 310–914 µS cm−1 at Station II. The highest annual variability was noted during 2010–2012 (Figure 5), and in 2008—prior to the restoration. The years 2009 and 2013–2014 were characterized by conductivity varying from ca. 600 to 750 µS cm−1, while during 2015–2016 a wider range starting from 350 µS cm−1 was noted again. In all water layers representing the epilimnion, metalimnion and hypolimnion at both stations, there was a statistically significant increase in conductivity over time (K-W test with p < 0.05).

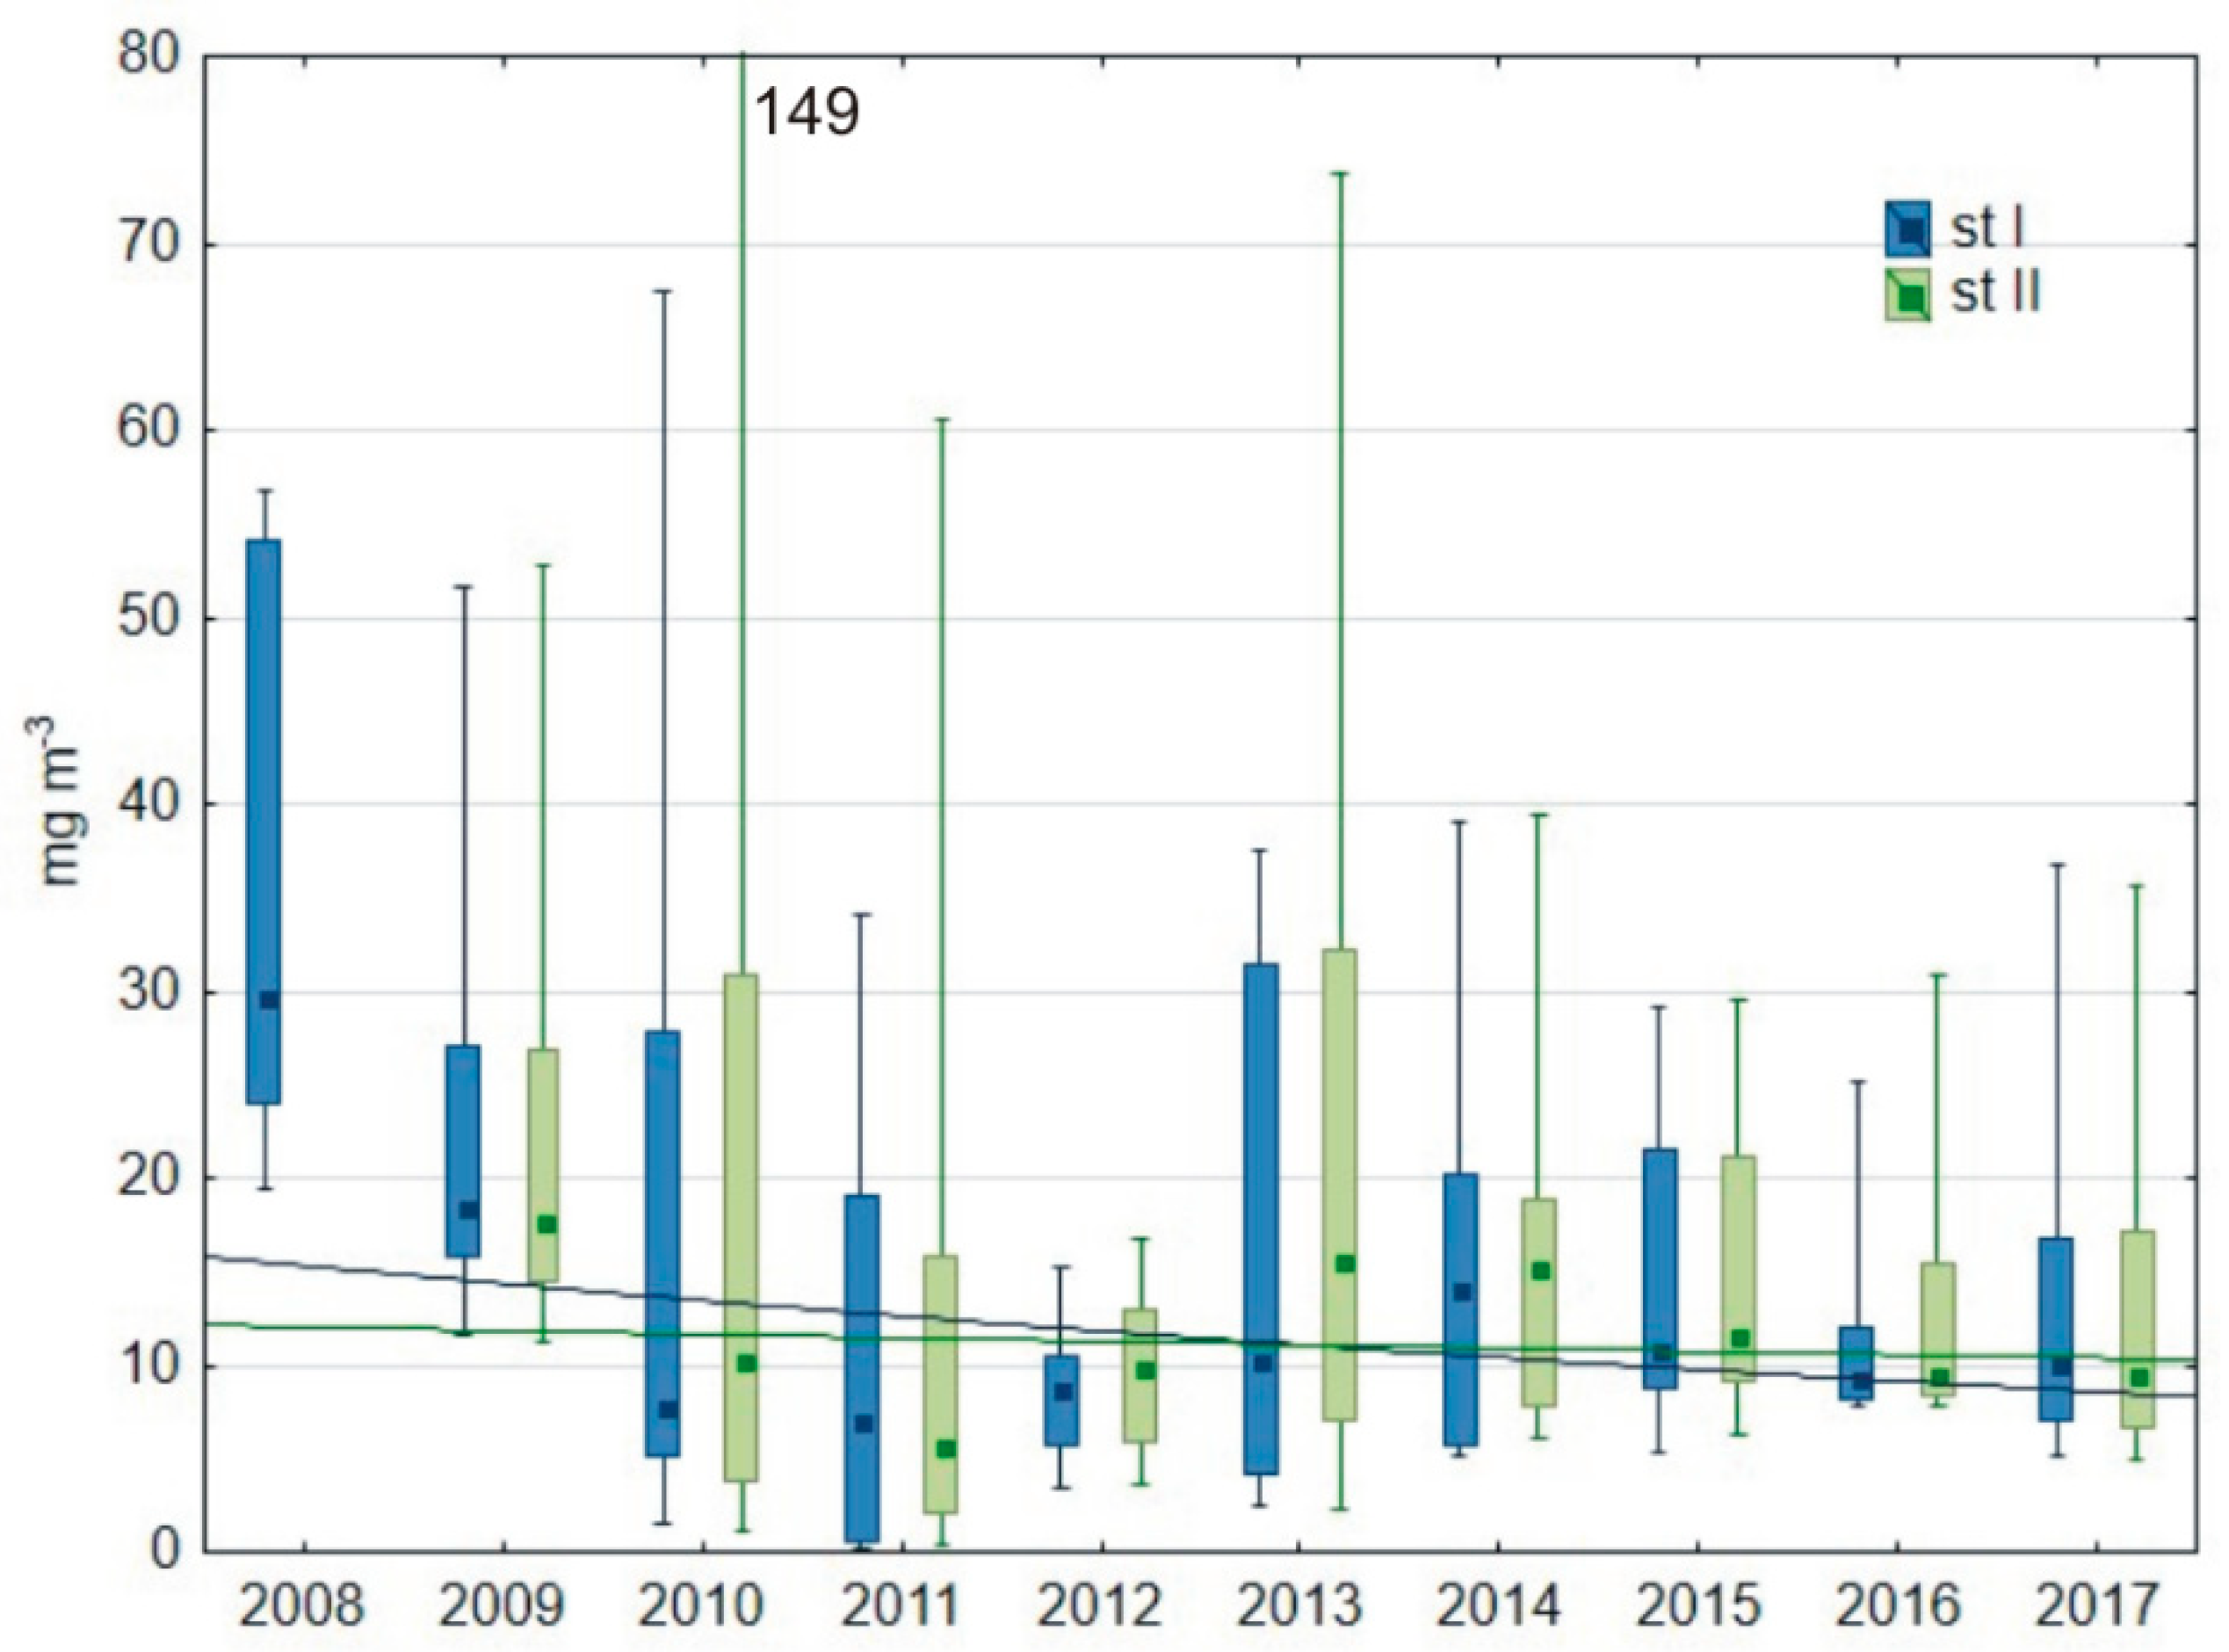
3.1.2. Water Transparency and Chlorophyll-a Content

Water transparency increased gradually throughout the research period, which was confirmed statistically at Station I (K-W test, p < 0.05). It was only 1.6 m maximally in 2008, with a median of 0.9 m (Figure 6), while during 2010–2011 it reached 3.8 m, with a median reaching 2.5 m. It was fluctuated in the following years, however, the upward trend continued, especially at Station I (Figure 6). The highest value was recorded in winter 2014, amounting to 5.4 m. The lowest values of about 0.5 m were found in the first half of the research period; later, the minimum values were about 1 m. They were associated with spring water blooms, while in summer they were around 1.5 m. Overall, Secchi disc values increased over twofold during 2014–2017 in comparison to 2008.
A decrease of chlorophyll-a concentrations was noted in Lake Durowskie in the following years, especially in the epilimnion (Figure 7). This tendency was statistically significant at a depth of 1 m at Station I as well as at a depth of 7 m, and in the surface waters at Station II (K-W test, p < 0.01). The concentration decreased exponentially in the first years of restoration. In subsequent years, it fluctuated, however, the median remained around 10 mg m−3. Maximum values in the second half of the research period were below 35 mg m−3 during spring water bloom, while the minimum in the autumn and winter reached 5 mg m−3. A decrease in chlorophyll-a concentration was 55% during 2013–2017 in relation to 2008 at Station I.

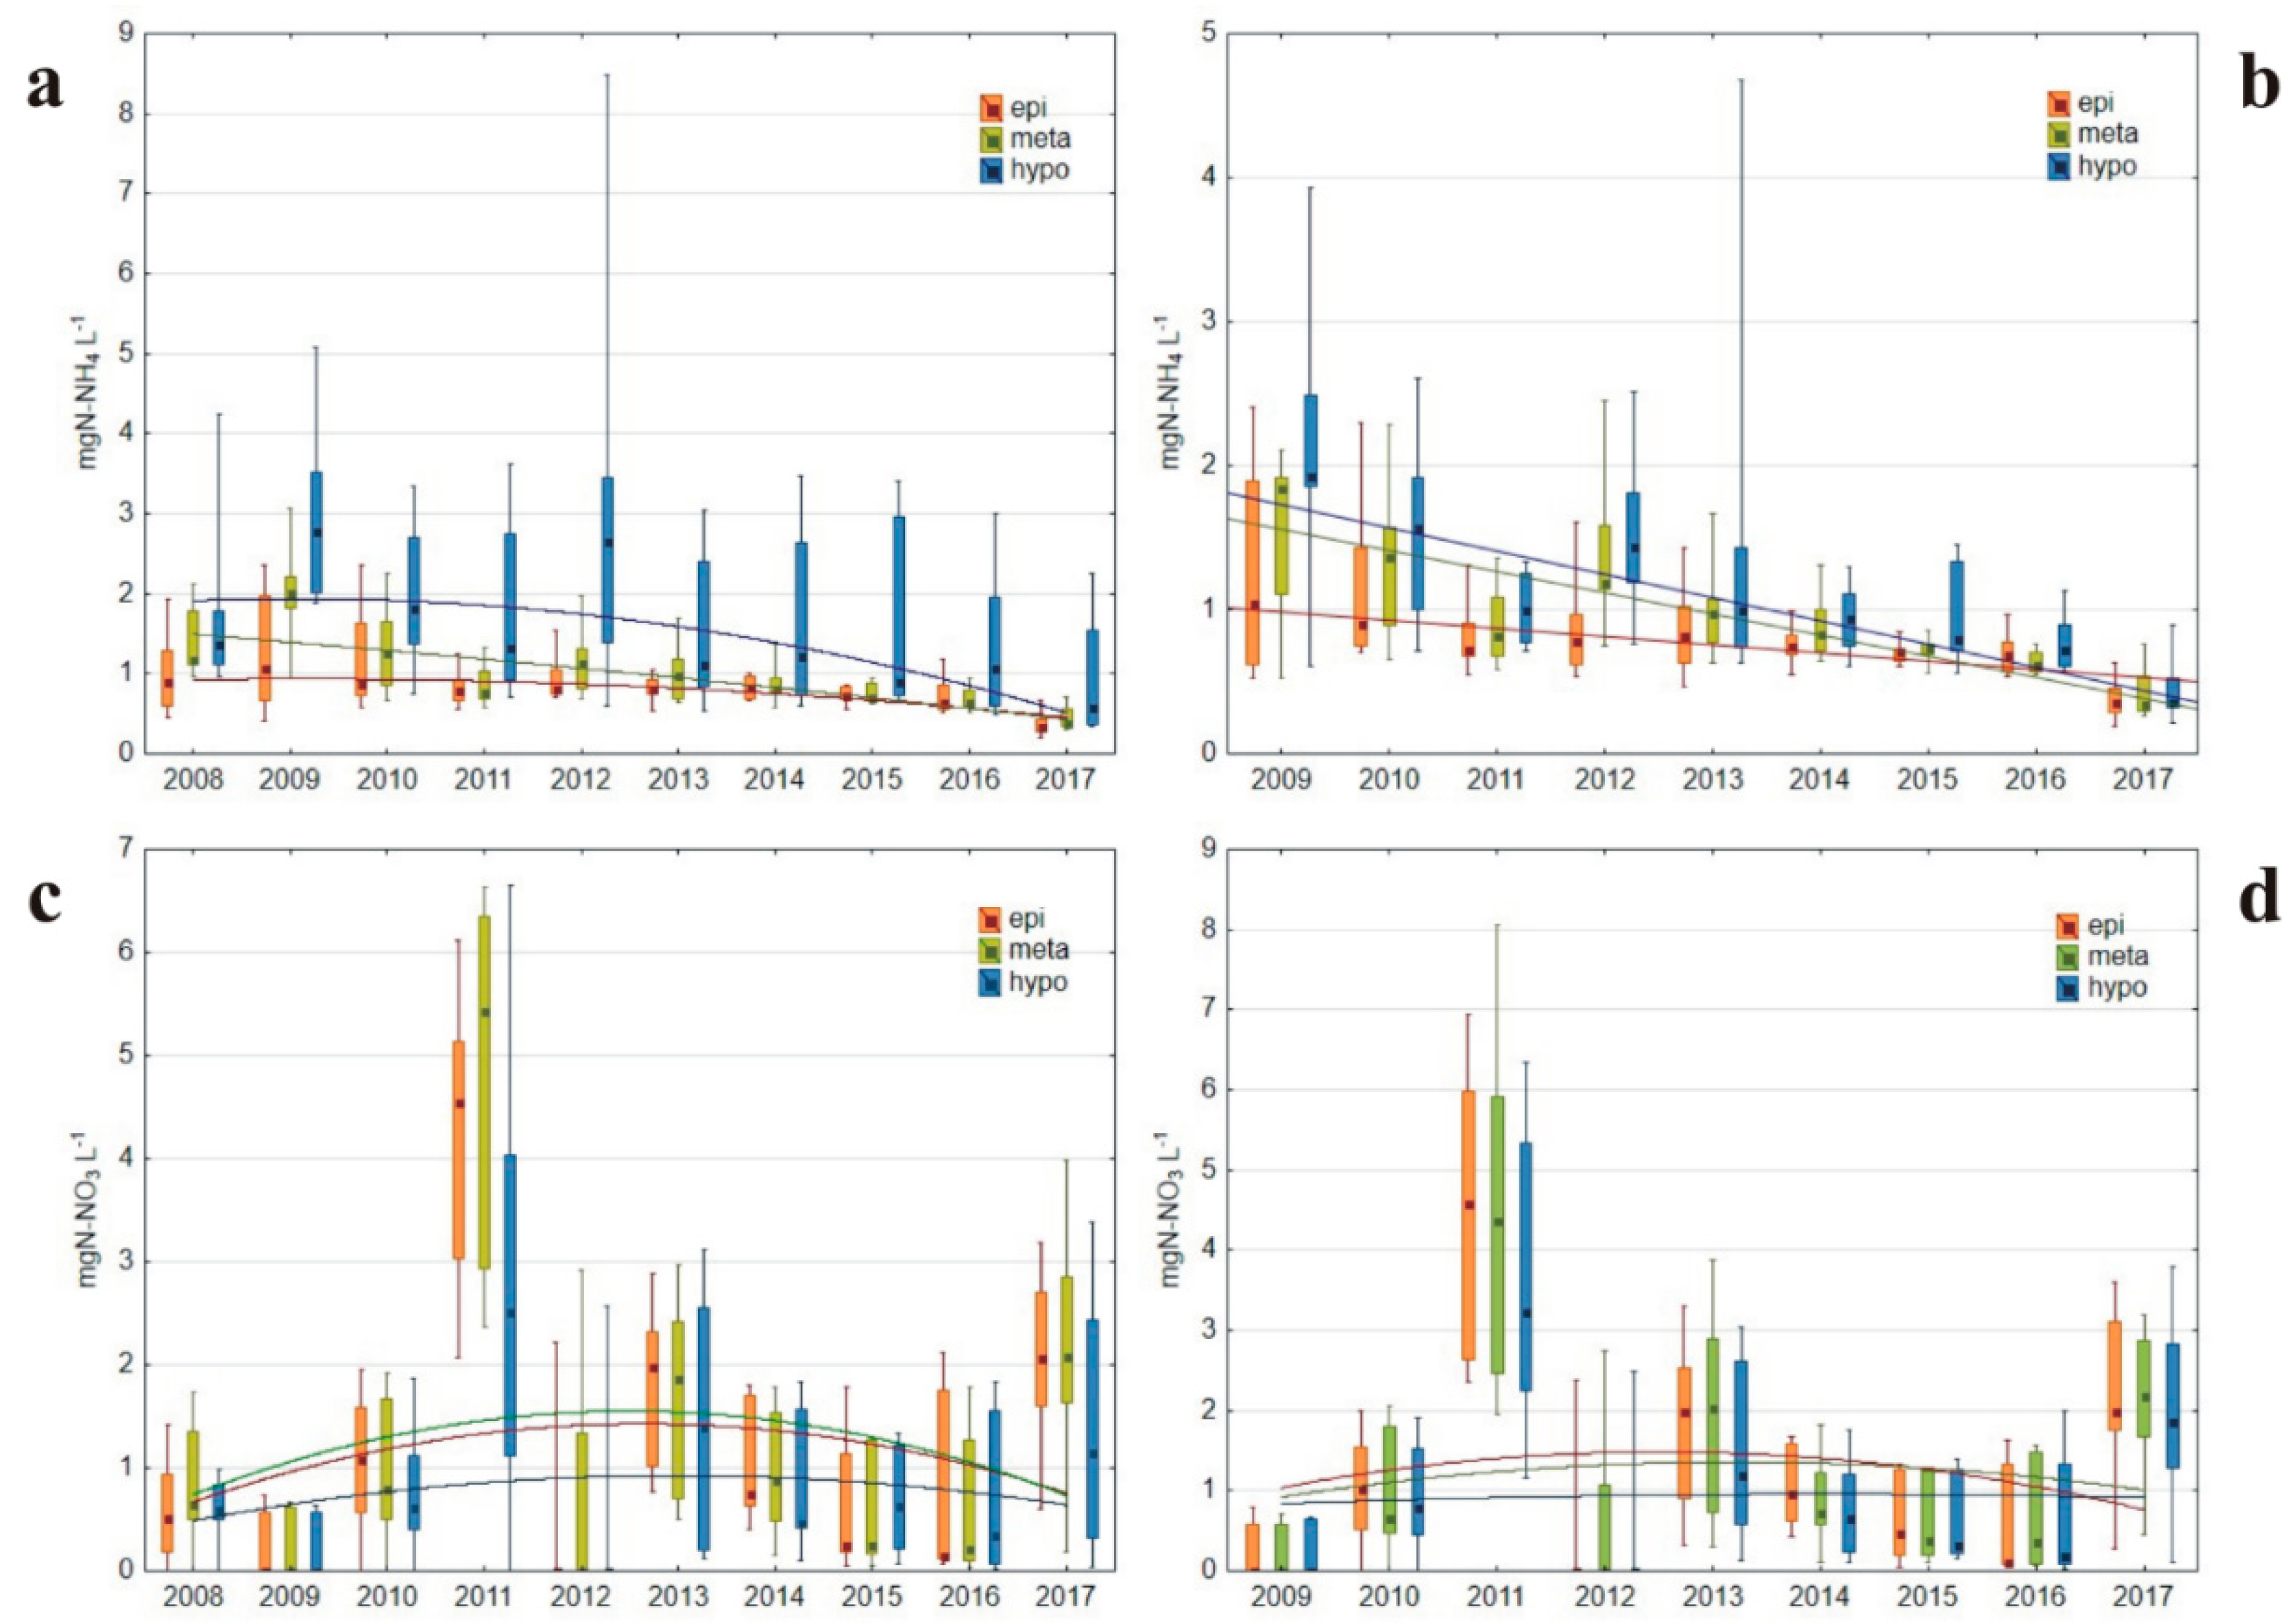
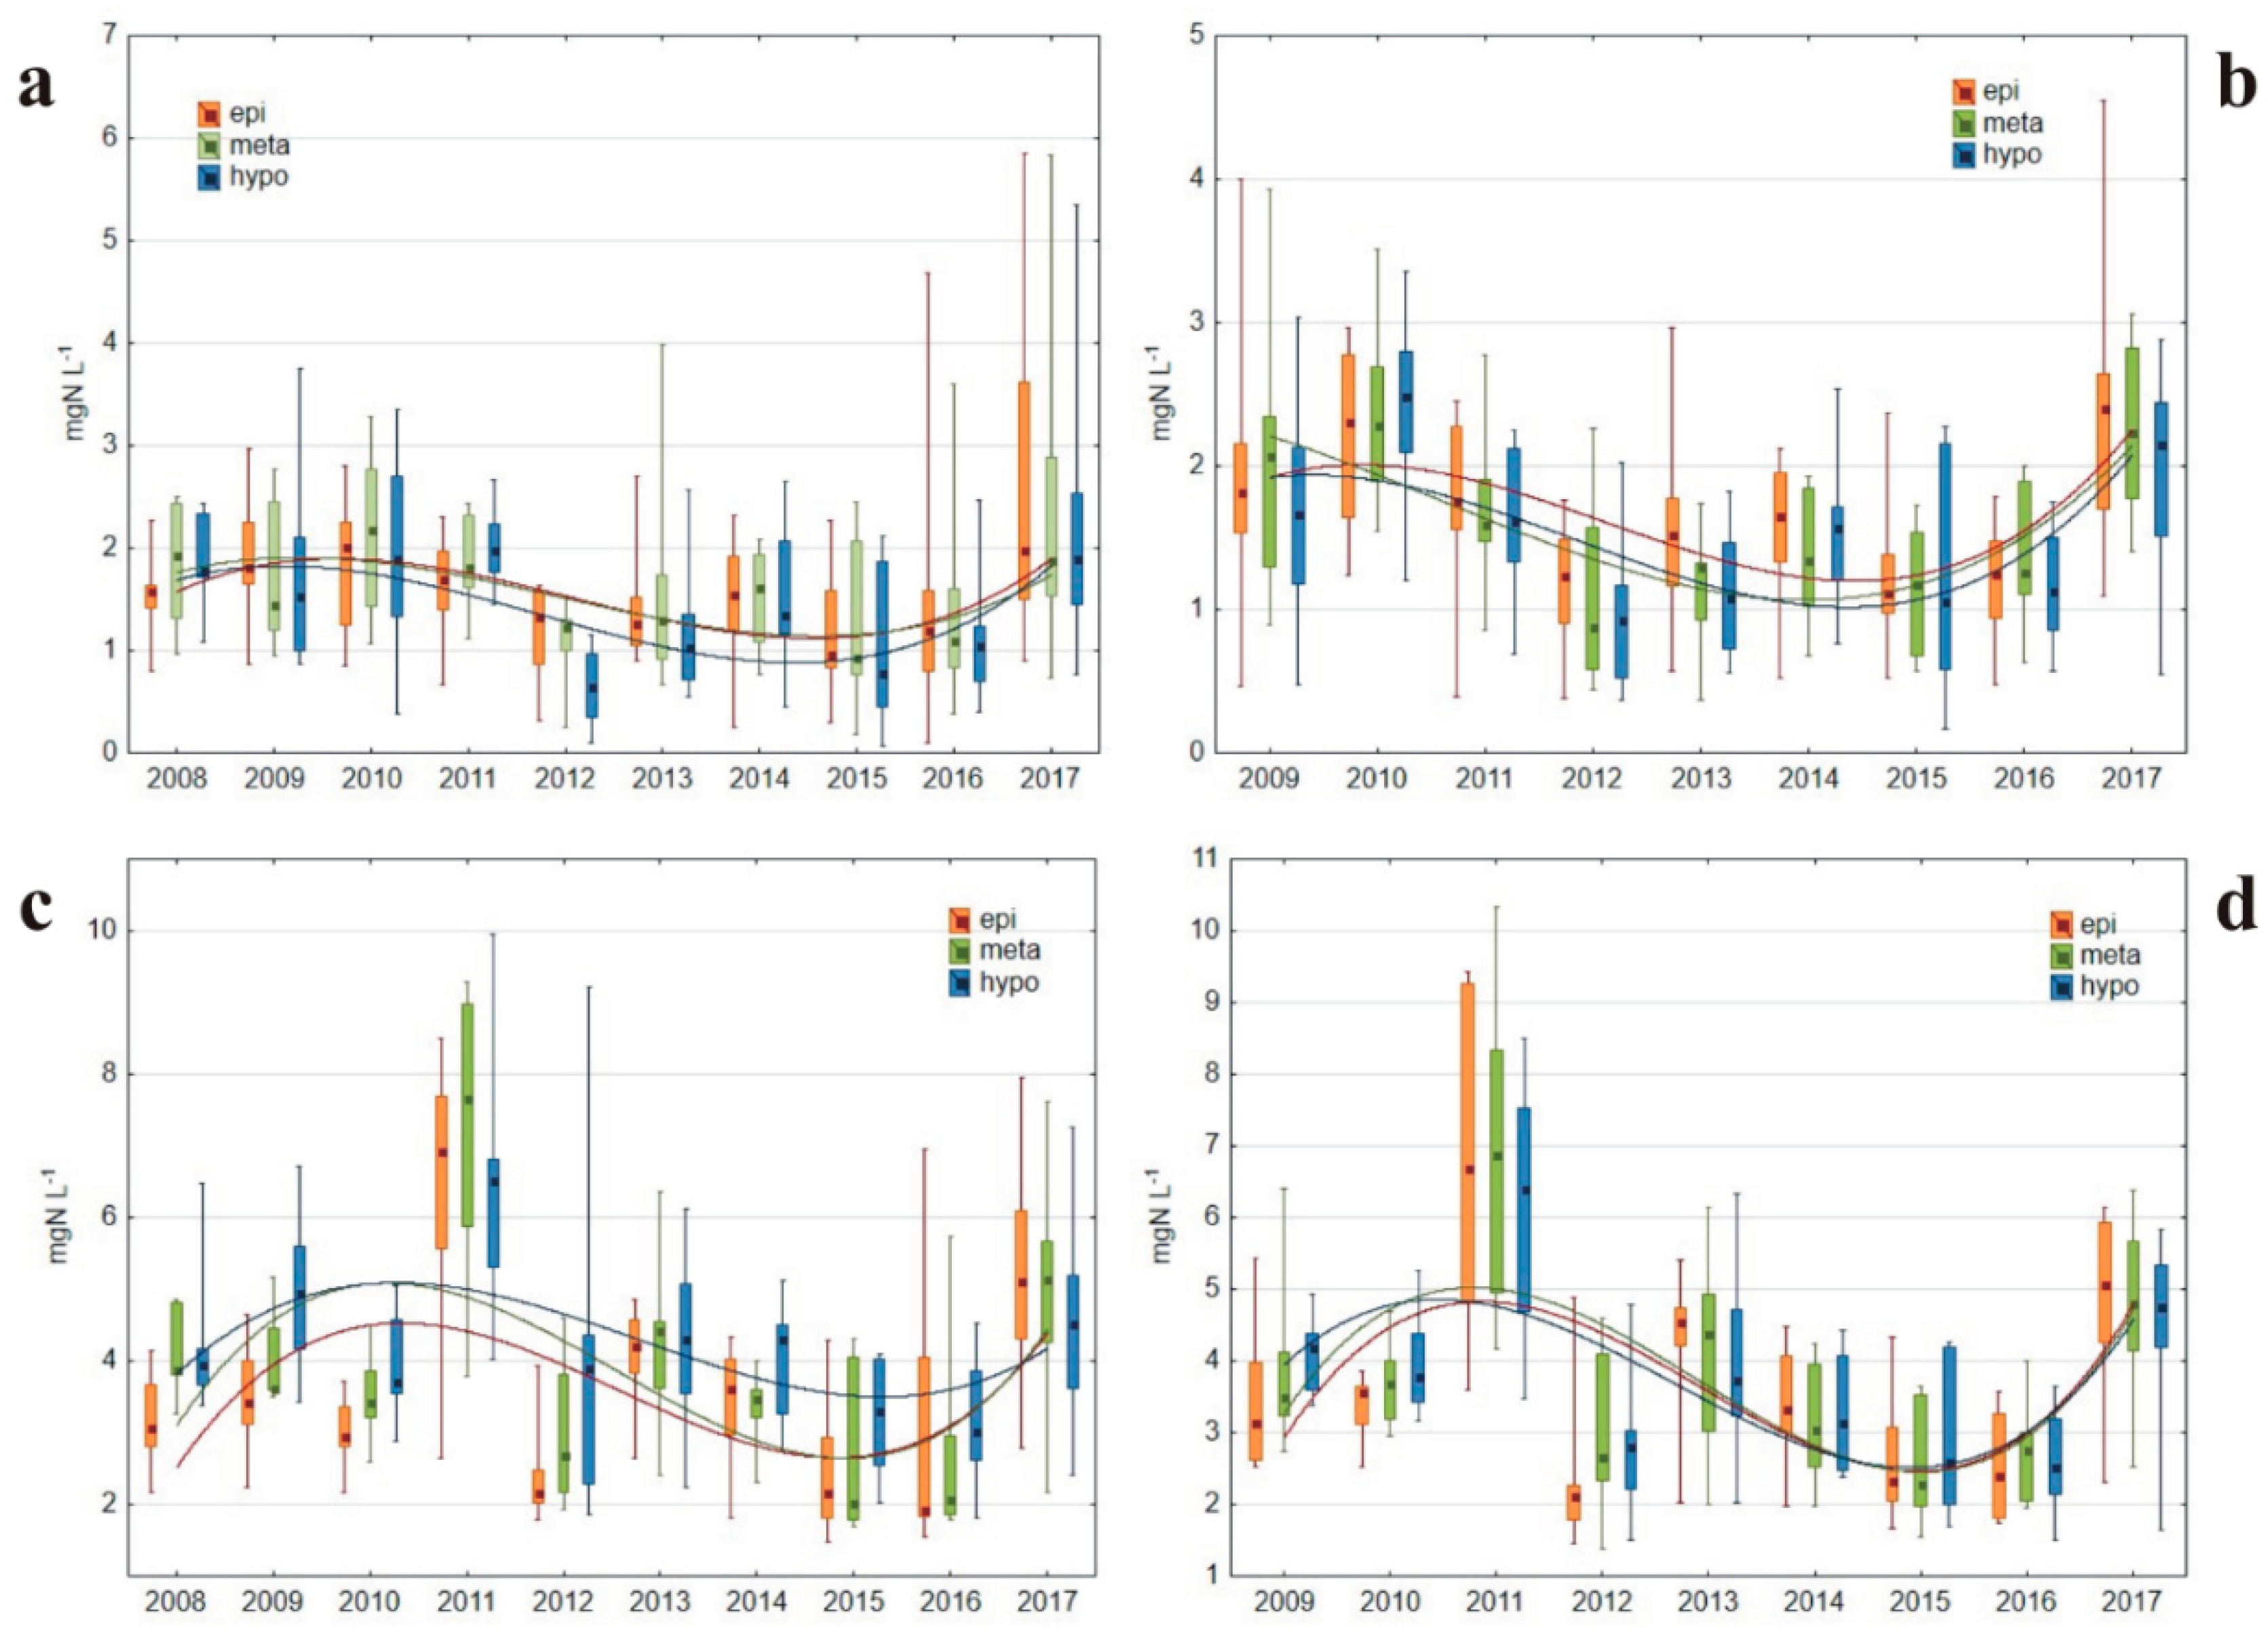
3.1.3. Nitrogen Concentrations

Among nitrogen compounds, mineral ones, mainly ammonium N and nitrates were dominant. The mean contribution of mineral forms in total N was 60.5%, while the highest was 72.4% in 2011. It is characteristic that, as a result of the beginning of restoration, concentration of ammonium nitrogen increased very markedly, especially in the hypolimnion (Figure 8a,b). It reached maximum values at the end of summer thermal stratification, especially at deeper Station I, maximally up to 8.49 mgN-NH4 L−1 (2012). During restoration a statistically significant decrease of ammonium N content in subsequent years was observed in all water layers at both stations (K-W test, p < 0.01). Median reduction in the epilimnion was from over 1 mgN L−1 in 2009 to less than 0.4 mgN L−1 in 2017, while in the hypolimnion—from over 1.9 to less than 0.6 mgN L−1. It was thus on average about 30% lower during 2013–2017 in comparison to 2008. Nitrate concentration, on the other hand, fluctuated during the research period. During 2008–2010 and 2014–2016, it was less than 2 mgN-NO3 L−1, with a median usually below 1 mgN-NO3 L−1. It increased dramatically in 2011, reaching maximally 6.6 and 8.0 mgN-NO3 L−1 at Stations I and II, respectively, thus the median exceeded 4 mgN-NO3 L−1, especially in epi- and metalimnion (Figure 8c,d). A second period of nitrate content increase was noted in 2017 with medians ca. 2 mgN-NO3 L−1. As a result, the average nitrate concentration during 2013–2017 was ca. 90% higher than in 2008.
Organic nitrogen also fluctuated throughout the study period. A slight decreasing trend was observed at both stations (K-W test, p < 0.01), especially between 2008 and 2016. During 2008–2011, medians of organic N content varied from 1.46 to 2.49 mgN L−1, diminishing during 2012–2016 to 0.65–1.66 mgN L−1 (Figure 9a,b). The year 2017 was characterized by another increase, clearly marked in maximum concentrations reaching 5.86 and 4.55 mgN L−1 at Stations I and II, respectively.
Due to the reduction of ammonium N and organic N concentrations during the analyzed period, total N content diminished as well (K-W test, p < 0.01); however, two crucial peaks were noted in 2011 and 2017 (Figure 9c,d). Maximum total N reached ca. 10 mgN L−1 and median around 7 mgN L−1 in 2011. A gradual decrease was observed during 2013–2016, when median values dropped from 3.7–4.5 mgN L−1 to 1.9–3.0 mgN L−1.

3.1.4. Phosphorus Concentrations

SRP concentrations increased significantly in the first few years of restoration, especially in the hypolimnion at deeper Station I (Figure 10a). The maximal value of 0.06 mgP L−1 in 2008 rose to 0.23 mgP L−1 in 2012, while in the following years it decreased systematically to 0.08 mgP L−1. Median changed from 0.002 mgP L−1 in 2008 through 0.088 mgP L−1 in 2012 and finally decreased to 0.002 mgP L−1 again in 2017. Temporal changes at Station II were similar (Figure 10b); however, during 2011–2014 medians were higher in the epilimnion in comparison to the meta- and hypolimnion. Nevertheless, the SRP concentrations increased from maximally 0.04 mgP L−1 in 2009 to 0.08 mgP L−1 in 2012, and dropped again to less than 0.03 mgP L−1 in 2017. This decrease of SRP content was statistically significant at both stations in all water layers (K-W test, p < 0.01). In comparison to 2008, SRP concentration reduction during 2015–2017 was 19% in water column, and even higher in epilimnion (65%).
Similar to SRP, TP concentrations also increased significantly during the first few years of restoration. This was particularly evident in the hypolimnion at Station I, where the median increased from 0.05 mg L−1 in 2008 to 0.12 mg L−1 in 2012. It decreased again to 0.06 mg L−1 in subsequent years. A similar trend of changes was also observed in the epilimnion and metalimnion, although the range of changes was much smaller (Figure 10c). At Station II, concentrations in all three thermal layers were similar, and changes in the entire study period showed fluctuations. In the first years of restoration, concentrations increased, then decreased, but in the last two years again slightly increased (Figure 10d). Interestingly, the maximum concentrations at both stations at the end of the study period were higher than at the beginning. Nevertheless, the median values were lower at the end of the study than at the beginning.

3.2. The Quality of River Struga Gołaniecka Waters

Spring and summer were characterized by higher water temperature (maximum over 25 °C) and pH (over 8), lower oxygen concentration (usually less than 10 mgO2 L−1) and conductivity (less than 600 μS cm−1). During winter the temperature fell to ca. 1 °C and oxygen content reached maximum values (usually over 15 mgO2 L−1, Table 2).
A decreasing tendency throughout the research period was noted for chlorophyll-a concentration (K-W test, p < 0.05). Maximum values during 2009–2010 were over 80 mg m−3, decreasing to ca. 50 mg m−3 during 2011–2014, and finally to less than 30 mg m−3 during 2016–2017.
Ammonium N concentration increased in winter each year, reaching ca. 2 mgN-NH4 L−1 (maximally 3.03 mgN-NH4 L−1 in 2013), while in the vegetation season it diminished to 0.5–1.0 mgN-NH4 L−1. A slight decrease was noted during the analyzed period, although it was not statistically significant. Nitrate N fluctuated, showing two distinct maxima in 2011 and 2017 and a smaller third in 2013, exciding 10, 8 and 5 mgN-NO3 L−1, respectively. Its concentrations were low in other years, less than 1.7 mgN-NO3 L−1. These peaks influenced TN concentrations. Medians were usually 2.6–3.7 mgN L−1, but sometimes exceeded 5 mgN L−1 (2011, 2013, and 2017), together with maximum annual values (Table 2). A slight, statistically significant (K-W test, p < 0.05) decrease of organic N was also noted.
SRP and TP concentration fluctuated in the River Struga Gołaniecka over time. First, it increased during 2010–2013, and decreased in the following years. This tendency was statistically significant (K-W test, p < 0.01) in the case of SRP, while for TP an increase was noted (K-W test, p < 0.05), especially during 2015–2017. Maximum SPR concentrations reached almost 0.070 mgP L−1 in 2012, while TP—0.200 mgP L−1 in 2017.

4. Discussion

Freshwater ecosystems are characterized by both top-down (TD) and bottom-up (BU) regulation, as nutrients play an important limiting role for primary production [20] and higher trophic levels may also influence the lower ones through trophic cascade [21]. A combination of both these pervasive ways of ecosystem productivity control occurs in every lake and might be applied in water quality management [22]. Sustainable lake restoration links the reduction of nutrient concentrations with the chemical method, supported by water aeration (BU), and biomanipulation, aiming to change fish fauna, influencing the plankton community (TD). Combining the “classic” in-lake restoration methods, i.e., biological and physicochemical, into a consistent restoration program increases the chance of success; nevertheless, it is still quite uncommon. Single cases, mainly from European lakes [23], have proved that such an approach results in water quality improvement, both in shallow and in deep lakes. The Lake Durowskie case study follows this approach and is an example of long-term lake restoration, applying multiple methods on a non-aggressive level, harmless to biota.

4.1. Oxygen Conditions As a Result of Hypolimnetic Aeration

Hypolimnetic anoxia is a common phenomenon in summer-stratified lakes, however, in the course of eutrophication, it lengthens in time and extends in water volume, resulting in a number of processes of further lake water degradation, e.g., increased release of phosphorus from sediments [24], as well as ammonia N [25] and compounds associated with taste, odor and color, e.g., hydrogen sulfide, iron and manganese [26]. The depletion of dissolved oxygen in bottom waters also affects fish fauna and zooplankton by the reduction of cold-water and a dark habitat [27]. Water aeration or oxygenation is used to combat the adverse effects of eutrophication, although several studies have questioned its efficiency [28,29,30], indicating that there is no increase in dissolved oxygen content in the hypolimnion. This effect results from a very high oxygen demand in deep water layers and sediment–water interphase due to a multiannual organic matter sedimentation. A similar outcome was observed in Lake Durowskie. After initial deterioration, oxygen conditions in the lake hypolimnion gradually improved. The deep oxygen deficit occurred less and less during summer, and its range from the bottom included an increasingly smaller part of the water column. A similar shortening of the duration and range of oxygen deficits has been observed as an effect of hypolimnetic aeration in other lakes [31,32]. Initially, oxygen supplied by a pulverizing aerator to the sediment–water interphase caused the intensification of organic matter mineralization. The oxygen demand for microorganisms was greater than the oxygen supply capacity of the aerator. Therefore, in the initial period, the oxygen deficit even deepened. However, the reduced phytoplankton biomass in subsequent years delivered to the bottom less and less amounts of fresh organic matter, further decreasing oxygen demand [29].
It is of paramount importance that the type of aerator used in Lake Durowskie fulfills the requirements of sustainable restoration. A pulverizing aerator is characterized by high specific capacity, aeration intensity adjusted to changes in wind direction and force, but most of all—the use of a renewable energy source [17]. Its application in lake restoration together with other methods results in water quality improvement of i.a. Swarzędzkie Lake [33,34] and contributed to changes in the TN:TP ratio, indicating phosphorus deposition in sediments in other lakes [30]. Nevertheless, hypolimnetic aeration seems to be a supportive, rather than the main restoration method, helping to alleviate eutrophication symptoms, thus its combination with other methods is crucial.

4.2. Nitrogen Transformations in Relation to Oxygen and Temperature

The presence of low concentrations of oxygen above the bottom even during summer—ranging 0–2 mg O2 L−1—favored the nitrification process, leading to the reduction of ammonium nitrogen concentration and increasing the concentration of nitrates. Ammonia N release in the anoxic hypolimnion of eutrophic and hypertrophic lakes exceeds 15 mgNm−2d−1, and its accumulation in deep water layers results from the lack of nitrification and decreased assimilation [25]. Low oxygen concentrations due to water aeration allow oxidizing ammonium N to nitrates, which in turn provide substrate for denitrification [31]. An intense denitrification process in the initial period of restoration was indicated by the total depletion of nitrates in the hypolimnion of the lake. Respiratory denitrification is considered as an important nitrogen removal pathway [35], which can be accelerated by artificial aeration [31]. The process of fermentative dissimilatory nitrate reduction to ammonium (DNRA) might well be responsible for ammonium N content decrease, although it is believed that it is favored in nitrate-limited environments rich in labile carbon, reductive conditions and higher temperature [31,35,36], thus it might contribute to the diminishment of ammonium N only at the beginning of restoration process. Low concentration of oxygen in the water overlying the sediment, however, allowed the annamox process to take place, i.e., the reduction of ammonium nitrogen to N2 [37]. The presence and growing importance of this process in subsequent years of the restoration was demonstrated by the decreasing concentration of ammonium nitrogen in the hypolimnion. However, little is known about annamox in freshwaters, but its crucial role in deep, large, oligotrophic lakes is suspected [35]. As the oxygen content increased, the role of DNRA and denitrification in nitrogen removal decreased in favor of nitrification, which was confirmed by growing concentrations of nitrates in lake water, including the hypolimnion. Both ammonium N and nitrates correlated with oxygen content in the hypolimnion (r = −0.52, p < 0.01 and r = 0.357, p < 0.01, respectively).
Nitrogen cycling in lake waters is microbe-mediated, thus strongly related to water temperature. Observed transformations, therefore, corresponded not only to changes in oxygen concentrations but to temperature increase in the hypolimnion as well. The change of hypolimnetic temperature was slight (ca. 1 °C in the case of medians); nevertheless it definitely influenced the microorganisms and their activity in the sediment–water interphase. Nitrogen transformations were accelerated, as the correlation between ammonium N/nitrates and temperature was noted (r = 0.347, p < 0.01 and r = −0.360, p < 0.01, respectively). Such changes are often observed during hypolimnetic aeration/oxygenation [29,31,38] and may stimulate the decomposition of organic matter, resulting in further increased oxygen demand. Long-term treatment, including water aeration and other measures aiming at the reduction of fresh organic matter deposition in the sediments are required to suppress the potential effects of elevated temperature.
As the concentration of individual nitrogen forms depends on many microbiological processes in sediments and in water, which are affected by temperature and oxygen content and additionally depend on the load carried to the lake with inflow waters, their concentration in the lake varies with time depending on these various factors. Therefore, they are subject to linear but not polynomial changes, however with a tendency to decrease fluctuations over time as the ecosystem stabilizes.

4.3. Phosphorus–Oxygen–Chlorophyll-a Interactions

The changes of SRP concentrations at the deeper Station I remained under the influence of internal P loading, especially in the case of the hypolimnion. The release of phosphorus from bottom sediments was much higher at the beginning of lake restoration (2010–2013) as a result of more intense and longer oxygen depletion in sediments during the vegetation season in comparison to the following years (2014–2016), when low oxygen concentrations were present [9]. The reduction of iron compound as well as other metals, and the release of phosphates adsorbed on them are a consequence of the lack of oxygen in the sediment–water interphase [39]. An additional factor stimulating internal P loading during the first years of restoration was the aforementioned large amount of fresh organic matter of planktonic origin deposited in sediments prior to the treatment, as well as phytoplankton inflowing with the River Struga Gołaniecka, also sedimented and decomposed by sediment bacteria. The latter was indicated by high chlorophyll-a concentrations in riverine waters, especially in 2009–2010, diminishing gradually as the water flowed through the lake. Hypolimnetic aeration resulted in oxygenation-induced stimulation of mineralization [29]. A decrease of chlorophyll-a content during the restoration indicated that fresh organic matter deposition was reduced as well, due to the less available orthophosphates in the lake waters, inactivated by chemicals, and the decrease of external SRP loading. Consequently, internal P loading depending on aerobic microbial decomposition of organic matter decreased, although the oxygen concentration increased. This was confirmed by the decrease of P content in the waters overlying the sediments in subsequent years [9]. Such an additional feedback, related to less internal P loading impact on the phytoplankton biomass, is probably one of the most important mechanisms regulating water quality improvement, especially in the case of water transparency.
The reduction of SRP concentrations at both stations was a result of its inactivation with the use of small doses of iron sulfate and magnesium chloride, aiming at only SRP precipitation, not entire suspended solids. The treatment was repeated 3–5 times during the vegetation season, eliminating excessive SRP available for phytoplankton. This kind of treatment mitigates the potentially negative impact of chemical compounds on biota as well as lessening the costs of restoration [33]. Apart from iron coagulant, magnesium chloride was also added to bind both orthophosphates and ammonium N in insoluble ammonium- magnesium monophosphate, so-called struvite (MgNH4PO4·6H2O), deposited in sediments [11]. A simultaneous diminishment in SRP and ammonium N content in all water layers and at both stations indicated the success of the restoration treatments. Further P accumulation in sediments could be controlled by nitrates—as their content in the hypolimnion increased—due to: (i) maintaining a high redox potential of sediments; (ii) decreasing the sulfate reduction and hydrogen sulfide formation; and (iii) allowing iron to bind phosphorus effectively as iron phosphate or via adsorption to ferric oxide hydroxides [39]. A positive influence of nitrate treatment has been stated, e.g., in Lake Uzarzewskie, in which cold nitrate-rich waters are directed into hypolimnion [7].
Hypolimnetic aeration also affected phosphorus concentrations in the hypolimnion [28] by increasing both oxygen and temperature in deep waters. Both SRP and TP concentrations in the lake hypolimnion were negatively correlated with oxygen content (r = −0.39 and −0.32, respectively, p < 0.01), a common relation in freshwater, resulting from P retention in sediments during aerobic conditions on oxidized iron compounds. The high sensitivity of iron to redox conditions indicates the need of water aeration/oxygenation during P precipitation with this inactivating agent [40], and many applications of different Fe compounds have confirmed that lowering P concentrations without additional aeration or destratification is usually unsuccessful [41,42,43]. SRP and TP correlation with the temperature of the hypolimnion was positive (r = 0.279 and 0.298, respectively, p < 0.01), indicating a possible increase of P content in deep water layers due to its aeration. This phenomenon is true as it is not only oxygen that controls P release, and this paradigm—valid for many years—has been questioned [44,45]. Temperature accelerates many alternative mechanisms of P release, e.g., decomposition of organic matter or accumulation/release of bacterial P, therefore its increase affects P concentrations. As previously mentioned, restoration techniques combined in “sustainable restoration” aim at the reduction of organic matter deposition and thus the suppression of increased temperature impact. This is of paramount importance in the light of climate changes, believed to be manifested in freshwater temperature boost, influencing both internal P loading and phytoplankton (especially cyanobacteria) proliferation [46,47,48]. Adverse changes induced by global warming are crucial mainly for shallow lakes and shallow parts of deeper lakes as well, thus of lesser importance in Lake Durowskie with its steeply sloped lake basin and limited range of epilimnion. Nevertheless, future studies should focus on the shallower northern part of the lake fed by the River Struga Gołaniecka and one more small stream, with a depth less than 5 m, as recent findings suggest that such parts of freshwater reservoirs are considered to be much more important in internal P loading and deterioration of water quality [49]. The northern zone of the lake together with the River Struga Gołaniecka might be responsible for the less well defined results of lake restoration, including fluctuations in TP content at Station II.
As the influence of the River Struga Gołaniecka on the concentration of phosphorus at Station II is much more pronounced than at Station I, the changes of phosphorus over time can overlap with the variable release from the bottom sediments, causing clear polynomial fluctuations.

4.4. The Influence of River Struga Gołaniecka on Lake Waters

Nitrate concentrations were strongly correlated with their content in the inflowing River Struga Gołaniecka (r = 0.917 for Station I and r = 0.926 for Station II, p < 0.05). The high variability of nitrate amounts in both lake and riverine waters resulted from year-to-year changes in precipitation. Increased rainfalls caused greater flushing of nitrates from the soils of the agricultural river catchment [50]. Nevertheless, an annual shift in time in relation to precipitation was observed, i.e., nitrate content corresponded to the rainfall from the previous year (r = 0.805, p < 0.05) as a result of the retention effect of lakes situated in a cascade along the course of the River Struga Gołaniecka (Figure 11). Very high nitrate concentrations occurring periodically in the river (up to 10.5 mgN L−1) distinctly influenced the lake content of TN (r = 0.934, p < 0.01).
SRP at Station II varied in particular years in correlation with concentrations of SRP in the inflowing River Struga Gołaniecka (r = 0.975, p < 0.01), which were, on the other hand, weakly correlated with precipitation (r = 0.380) (Figure 12). Medians at Station II were always lower than in the river due to multiple physical, chemical and biological processes, e.g., phosphate sorption on suspended solids, sedimentation, uptake by phytoplankton and further deposition with organic matter to sediments [51,52]. At neither Station I nor Station II were TP concentrations statistically correlated with phosphorus concentrations in inflowing riverine waters (r = 0.388 at Station I and 0.075 at Station II), although a distinct relation between TP and precipitation was observed at Station II (r = 0.647, p < 0.05), indicating the role of external sources of phosphorus in the river catchment, including strongly eutrophicated lakes situated in the river course.
Canonical RDA analysis indicated that only a few water quality features in the lake were statistically dependent on the water quality of the inflowing River Struga Gołaniecka (Figure 13). Apart from the aforementioned nitrates, these included temperature, conductivity and oxygen concentration at Station II and SRP at Station I. The relationship in the case of temperature resulted in fact not from the impact of riverine water temperature, but rather from the influence of air temperature on both river and lake waters. This correlation was strong, despite the summer thermal stratification, thus values noted in cold months as well as in the epilimnetic waters in summer (similar to river temperature) had a decisive impact. In the case of oxygen content, the lack of any relation between inflowing waters and Station I derived from the deficits noted in the lake hypolimnion, while a much stronger correlation was found for the shallower Station II, hence the impact of anaerobic zone was less pronounced. These dependencies are not direct, as in the case of temperature, but they arise from atmospheric influence (oxygen diffusion into water) on the one hand, and phytoplankton impact (oxygen production in photosynthesis) on the other hand. The latter factor also contributed to the separate oxygen content at Station I as a lower amount of phytoplankton biomass in the southern part of the lake was responsible for less oxygen in the water, in comparison to the Struga Gołaniecka and Station II. Conductivity at Station II was clearly dependent on ion content in the inflowing river due to the short distance between those two points. During the water flow through the lake to Station I some of the ions were assimilated by biota and underwent many physical and chemical processes, thus water conductivity decreased. Long-term fluctuations of this water quality variable resulted from water discharge related to precipitation. Similar to the case of nitrates, the strength of this relationship increased after taking into account the annual shift of rainfall data (r = 0.542 at Station I and r = 0.653 at Station II).

4.5. Supportive Role of Biomanipulation in Water Quality Improvement

Physicochemical methods of lake restoration were supported in Lake Durowskie by the biological method, i.e., biomanipulation, mainly based on pike fry stocking, aiming at the increase of food pressure on zooplanktivorous and benthivorous fish hatch. As a result of this biomanipulation predation on large zooplankton, fish-induced resuspension and nutrient translocation from sediments to water via feeding and extraction should be lower [22]. Increasing Secchi depth as a consequence of chlorophyll-a reduction indicated that intense changes of fish fauna had occurred as well as a top-down effect as it was expected. This result is strengthened by stocking repeated annually. Changes in phytoplankton structure were noted as early as 2010, as cyanobacteria domination was eliminated in favor of diatoms, dinophytes and chrysophytes. Reconstruction of this community composition favored the larger species, not grazed by crustaceans, whose number increased due to the biomanipulation measures [16]. The effect of biomanipulation could be deepened by hypolimnetic oxygenation, as already noted in stratified lakes where improved oxygen conditions allow some fish fauna (e.g., perch) to forage over a larger sediment surface, thus passing through the benthic phase before becoming piscivores was easier [5].

5. Conclusions

Combining physicochemical and biological methods of lake restoration in a sustainable, cost-effective manner in an urban, dimictic, flow-through lake resulted in water quality improvement. Both nitrogen and phosphorus concentrations decreased over the course of nine years of treatment aimed at bottom-up (nutrient reduction) and top-down (biomanipulation) control of primary production. The changes in water chemistry influenced biota, especially planktonic communities, which was manifested in increased Secchi depth and lower chlorophyll-a concentrations. Diminished fresh organic matter deposition influenced mineral nutrients in deep water layers. Nitrogen transformations were also induced in the hypolimnion by water aeration, decreasing ammonium N and increasing nitrates as the oxygen conditions were slightly improved. At the same time, the duration and range of oxygen depletion zones were reduced. The long-term restoration program, based on non-aggressive, multiple in-lake techniques applied despite the lack of total external loading reduction, allowed the progressive eutrophication to be suppressed. However, it is essential that the program is continued throughout the following years in the light of predicted climate changes as well as potential variability in the amount of future external loading. Together with the in-lake restoration, monitoring actions shall be conducted, involving some remote systems as well, to map the chlorophyll-a and water transparency, allowing more rapid reaction to water quality deterioration by means of phosphorus precipitation.

Author Contributions

Conceptualization, R.D. and R.G.; Methodology and investigation, R.D., K.K.M., B.M., S.C., and R.G.; Writing—original draft preparation, R.D.; Writing—review and editing, R.G.; and Formal analysis, A.K.

Funding

This research received financial support from the Wągrowiec Municipality.

Acknowledgments

The authors would like to thank to Robert Kippen for the proofreading.

Conflicts of Interest

The authors declare no conflict of interest.

References

  1. EU Directive 2000/60/EC of the European parliament and of the council of 23 October 2000 establishing a framework for community action in the field of water policy. Off. J. Eur. Communities 2000, L327, 1–72.
  2. European Environment Agency. European Waters. Assessment of Status and Pressures 2018; Report no 7/2018; European Environment Agency: Luxembourg, 2018. [Google Scholar] [CrossRef]
  3. Verdonschot, P.F.M.; Spears, B.M.; Feld, C.K.; Brucet, S.; Keizler-Vlek, H.; Borja, A.; Elliott, M.; Kernan, M.; Johnson, R.K. A comparative review of recovery processes in rivers, lakes, estuarine and coastal waters. Hydrobiologia 2013, 704, 453–474. [Google Scholar] [CrossRef]
  4. Annadotter, H.; Cronberg, G.; Aagren, R.; Lundstedt, B.; Nilsson, P.-A.; Ströbeck, S. Multiple techniques for lake restoration. Hydrobiologia 1999, 395/396, 77–85. [Google Scholar] [CrossRef]
  5. Jeppesen, E.; Sammalkorpi, I. Lakes. In Handbook of Ecological Restoration, Vol. 2, Restoration in Practice; Perrow, M.R., Davy, A.J., Eds.; Cambridge University Press: Cambridge, UK, 2002; pp. 297–324. [Google Scholar]
  6. Gołdyn, R.; Podsiadłowski, S.; Dondajewska, R.; Kozak, A. The sustainable restoration of lakes—towards the challenges of the Water Framework Directive. Ecohydrol. Hydrobiol. 2014, 14, 68–74. [Google Scholar] [CrossRef]
  7. Dondajewska, R.; Kozak, A.; Kowalczewska-Madura, K.; Budzyńska, A.; Gołdyn, R.; Podsiadłowski, S.; Tomkowiak, A. The response of a shallow hypertrophic lake to innovative restoration measures—Uzarzewskie lake case study. Ecol. Eng. 2018, 121, 72–82. [Google Scholar] [CrossRef]
  8. Kowalczewska-Madura, K.; Dondajewska, R.; Gołdyn, R.; Podsiadłowski, S. The influence of restoration measures on phosphorus internal loading from the sediments of a hypereutrophic lake. Environ. Sci. Pollut. Res. 2017, 24, 14417–14429. [Google Scholar] [CrossRef] [Green Version]
  9. Kowalczewska-Madura, K.; Dondajewska, R.; Gołdyn, R.; Kozak, A.; Messyasz, B. Internal phosphorus loading from the bottom sediments of the dimictic lake during its sustainable restoration. Water Air Soil Pollut. 2018, 229, 280. [Google Scholar] [CrossRef]
  10. Kowalczewska-Madura, K.; Dondajewska, R.; Gołdyn, R. Internal phosphorus loading in eutrophic lakes in Western Poland. In The Handbook of Environmental Chemistry. Polish River Basins and Lakes—Part I: Hydrology and Hydrochemistry; Korzeniewska, E., Harnisz, M., Eds.; Springer: Berlin/Heidelberg, Germany, 2019; in press. [Google Scholar]
  11. Dondajewska, R.; Gołdyn, R.; Kowalczewska-Madura, K.; Kozak, A.; Romanowicz-Brzozowska, W.; Rosińska, J.; Budzyńska, A.; Podsiadłowski, S. Hypertrophic lakes and the results of their restoration in Western Poland. In The Handbook of Environmental Chemistry. Polish River Basins and Lakes—Part II: Biological Status of Water Management; Korzeniewska, E., Harnisz, M., Eds.; Springer: Berlin/Heidelberg, Germany, 2019; in press. [Google Scholar]
  12. Jeppesen, E.; Søndergaard, M.; Liu, Z. Lake restoration. In Routledge Handbook of Ecological and Environmental Restoration; Allison, S.K., Murphy, S.D., Eds.; Routlege: London, UK; New York, NY, USA, 2017; pp. 226–242. [Google Scholar]
  13. O’Sullivan, P.E.; Reynolds, C.S. Lakes Handbook: Lake Restoration and Rehabilitation; Blackwell Publishing: Malden, MA, USA, 2005; Volume 2. [Google Scholar]
  14. Carpenter, S.R.; Cottingham, K.L. Resilience and restoration of lakes. Ecol. Soc. 1997, 1, 2. [Google Scholar] [CrossRef]
  15. Gunderson, L.H. Ecological resilience—In theory and application. Annu. Rev. Ecol. Syst. 2000, 31, 425–439. [Google Scholar] [CrossRef]
  16. Gołdyn, R.; Messyasz, B.; Domek, P.; Windhorst, W.; Hugenschmidt, C.; Nicoara, M.; Plavan, G. The response of Lake Durowskie ecosystem to restoration measures. Carpath. J. Earth Environ. 2013, 8, 43–48. [Google Scholar]
  17. Podsiadłowski, S.; Osuch, E.; Przybył, J.; Osuch, A.; Buchwald, T. Pulverizing aerator in the process of lake restoration. Ecol. Eng. 2018, 121, 99–103. [Google Scholar] [CrossRef]
  18. Elbanowska, H.; Zerbe, J.; Siepak, J. Physico-Chemical Water Analyses; AMU Press: Poznań, Poland, 1999. (In Polish) [Google Scholar]
  19. Wetzel, R.G.; Likens, G.E. Limnological Analyses, 2nd ed.; Springer-Verlag Inc.: New York, NY, USA, 1991. [Google Scholar]
  20. McQueen, D.J.; Post, J.R.; Mills, E.L. Trophic relationships in freshwater pelagic ecosystems. Can. J. Fish. Aquat. Sci. 1986, 43, 1571–1581. [Google Scholar] [CrossRef]
  21. Carpenter, S.R.; Kitchell, J.F.; Hodgson, J.R. Cascading trophic interactions and lake productivity. Bioscience 1985, 35, 634–639. [Google Scholar] [CrossRef]
  22. Taylor, J.M.; Vanni, M.J.; Flecker, A.S. Top-down and bottom-up interactions in freshwater ecosystems: Emerging complexities. In Trophic Ecology: Bottom-Up and Top-Down Interactions Across Aquatic and Terrestrial Systems; Hanley, T.C., La Pierre, K.J., Eds.; Cambridge University Press: Cambridge, UK, 2015; pp. 55–85. [Google Scholar] [CrossRef]
  23. Jeppesen, E.; Søndergaard, M.; Lauridsen, T.L.; Davidson, T.A.; Liu, Z.; Mazzeo, N.; Trochine, C.; Özkan, K.; Jensen, H.S.; Trolle, D.; et al. Biomanipulation as a restoration tool to combat eutrophication: Recent advances and future challenges. Adv. Ecol. Res. 2012, 47, 411–488. [Google Scholar] [CrossRef]
  24. Søndergaard, M.; Jensen, J.P.; Jeppesen, E. Role of sediments and internal loading of phosphorus in shallow lakes. Hydrobiologia 2003, 506–509, 135–145. [Google Scholar] [CrossRef]
  25. Beutel, M.W. Inhibition of ammonia release from anoxic profundal sediments in lakes using hypolimnetic oxygenation. Ecol. Eng. 2006, 28, 271–279. [Google Scholar] [CrossRef]
  26. Singleton, V.L.; Little, J.C. Designing hypolimnetic aeration and oxygenation systems—A review. Environ. Sci. Technol. 2006, 40, 7512–7520. [Google Scholar] [CrossRef]
  27. Ekau, W.; Auel, H.; Pörtner, H.-O.; Gilbert, D. Impacts of hypoxia on the structure and processes in pelagic communities (zooplankton, macro-invertebrates and fish). Biogeosciences 2010, 7, 1669–1699. [Google Scholar] [CrossRef] [Green Version]
  28. Gächter, R.; Müller, B. Why the phosphorus retention of lakes does not necessarily depend on the oxygen supply to their sediment surface. Limnol. Oceanogr. 2003, 48, 929–933. [Google Scholar] [CrossRef] [Green Version]
  29. Liboriussen, L.; Søndergaard, M.; Jeppesen, E.; Thorsgaard, I.; Grünfeld, S.; Jakobsen, T.S.; Hansen, K. Effects of hypolimnetic oxygenation on water quality: Results from five Danish lakes. Hydrobiologia 2009, 625, 157–172. [Google Scholar] [CrossRef]
  30. Siwek, H.; Włodarczyk, M.; Czerniawski, R. Trophic state and oxygen conditions of waters aerated with pulverising aerator: The results from seven lakes in Poland. Water 2019, 10, 219. [Google Scholar] [CrossRef]
  31. Holmroos, H.; Horppila, J.; Laakso, S.; Niemistö, J.; Hietanen, S. Aeration-induced changes in temperature and nitrogen dynamics in a dimictic lake. J. Environ. Qual. 2016, 45, 1359–1366. [Google Scholar] [CrossRef]
  32. Grochowska, J.; Gawrońska, H. Restoration effectiveness of a degraded lake using multi-annual artificial aeration. Pol. J. Environ. Stud. 2004, 13, 671–691. [Google Scholar]
  33. Rosińska, J.; Kozak, A.; Dondajewska, R.; Gołdyn, R. Cyanobacterial blooms before and during the restoration process of a shallow urban lake. J. Environ. Manag. 2017, 198, 340–347. [Google Scholar] [CrossRef] [PubMed]
  34. Rosińska, J.; Kozak, A.; Dondajewska, R.; Kowalczewska-Madura, K.; Gołdyn, R. Water quality response to sustainable restoration measures—Case study of urban Swarzędzkie Lake. Ecol. Indic. 2018, 84, 437–449. [Google Scholar] [CrossRef]
  35. Burgin, A.J.; Hamilton, S.K. Have we overemphasized the role of denitrification in aquatic ecosystems? A review of nitrate removal pathways? Front. Ecol. Environ. 2007, 5, 89–96. [Google Scholar] [CrossRef]
  36. Nizzoli, D.; Carraro, E.; Nigro, V.; Viaroli, P. Effect of organic enrichment and thermal regime on denitrification and dissimilatory nitrate reduction to ammonium (DNRA) in hypolimnetic sediments of two lowland lakes. Water Res. 2010, 44, 2715–2724. [Google Scholar] [CrossRef] [PubMed]
  37. Op den Camp, H.J.M.; Jetten, M.S.M.; Strous, M. Annamox. In Biology of the Nitrogen Cycle; Bothe, H., Ferguson, S.J., Newton, W.E., Eds.; Elsevier: Amsterdam, The Netherlands, 2007; pp. 245–262. [Google Scholar]
  38. Prepas, E.E.; Burke, J.M. Effects of hypolimnetic oxygenation on water quality in Amiska Lake, Alberta, a deep stratified lake with high internal phosphorus loading rates. Can. J. Fish. Aquat. Sci. 1997, 54, 2111–2120. [Google Scholar] [CrossRef]
  39. Søndergaard, M.; Wolter, K.D.; Ripl, E. Chemical treatment water and sediments with special references to lakes. In Handbook of Ecological Restoration. Vol. 1. Principles of Restoration; Perrow, M.R., Davy, A.J., Eds.; Cambridge University Press: Cambridge, UK, 2002. [Google Scholar]
  40. Cooke, G.D.; Welch, E.B.; Martin, A.B.; Fulmer, D.G.; Hyde, J.B.; Schrieve, G.D. Effectiveness of Al, Ca and Fe salts to control of internal loading in shallow and deep lakes. Hydrobiologia 1993, 253, 323–335. [Google Scholar] [CrossRef]
  41. Boers, P.; Van der Does, J.; Quaak, M.; Van der Vlugt, J. Phosphorus fixation with iron (III) chloride: A new method to combat internal phosphorus loading in shallow lakes? Arch. Hydrobiol. 1994, 129, 339–351. [Google Scholar]
  42. Jaeger, D. Effects of hypolimnetic water aeration and iron-phosphate precipitation on the trophic level of Lake Krupunder. Hydrobiologia 1994, 275–276, 433–444. [Google Scholar] [CrossRef]
  43. Deppe, T.; Benndorf, J. Phosphorus reduction in shallow hyper-eutrophic reservoir by in-lake dosage of ferrous iron. Water Res. 2002, 36, 4525–4534. [Google Scholar] [CrossRef]
  44. Hupfer, M.; Lewandowski, J. Oxygen controls the phosphorus release from lake sediments—A long-lasting paradigm in limnology. Int. Rev. Hydrobiol. 2008, 93, 415–432. [Google Scholar] [CrossRef]
  45. Nygrén, N.A.; Tapio, P.; Horppila, J. Will the oxygen-phosphorus paradigm persist?—Expert views of the future of management and restoration of eutrophic lakes. Environ. Manag. 2007, 60, 947–960. [Google Scholar] [CrossRef] [PubMed]
  46. Pearl, H.W.; Hall, N.S.; Calandrino, E.S. Controlling harmful cyanobacterial blooms in world experiencing anthropogenic and climate-induced change. Sci. Total Environ. 2011, 409, 1739–1745. [Google Scholar] [CrossRef] [PubMed]
  47. Napiórkowska-Krzebietke, A.; Dunalska, J.A.; Zębek, E. Taxa-specific eco-sensitivity in relation to phytoplankton bloom stability and ecologically relevant lake state. Acta Oecol. 2017, 81, 10–21. [Google Scholar] [CrossRef]
  48. Mantzouki, E.; Lürling, M.; Fastner, J.; de Senerpont Domis, L.; Wilk-Woźniak, E.; Koreivienė, J.; Seelen, L.; Teurlincx, S.; Verstijnen, Y.; Krztoń, W.; et al. Temperature effects explain continental scale distribution of cyanobacterial toxins. Toxins 2018, 10, 156. [Google Scholar] [CrossRef] [PubMed]
  49. Tammeorg, O.; Möls, T.; Niemistö, J.; Holmroos, H.; Horppila, J. The actual role of oxygen deficit in the linkage of the water quality and benthic phosphorus release: Potential implications for lake restoration. Sci. Total Environ. 2017, 599–600, 732–738. [Google Scholar] [CrossRef]
  50. Saunders, D.L.; Kalff, J. Nitrogen retention in wetlands, lakes and rivers. Hydrobiologia 2001, 443, 205–212. [Google Scholar] [CrossRef]
  51. Pűtz, K.; Benndorf, J. The importance of pre-reservoirs for the control of eutrophication of reservoirs. Water Sci. Technol. 1998, 37, 317–324. [Google Scholar] [CrossRef]
  52. Straškraba, M.; Tundisi, J.G.; Duncan, A. State-of-the-art of reservoir limnology and water quality management. Comp. Reserv. Limnol. Water Qual. Manag. 1993, 77, 213–288. [Google Scholar]
Figure 1. The location of sampling stations and aerators on Lake Durowskie and sampling station on River Struga Gołaniecka.
Water 11 00616 g001
Figure 2. Changes of oxygen concentration (in mgO2 L−1) in Lake Durowskie waters in 2008–2017 at: Station I (a); and Station II (b).
Water 11 00616 g002
Figure 3. Box plot with min-max concentrations of oxygen in selected water layers at both stations representing: epilimnion (a); metalimnion (b); and hypolimnion (c). The lines indicate trendlines for each station.
Water 11 00616 g003
Figure 4. Box plot with min-max of pH in selected water layers representing epilimnion, metalimnion and hypolimnion at both stations. The lines indicate trendlines for each layer.
Water 11 00616 g004
Figure 5. Box plot with min-max of conductivity in selected water layers representing epilimnion, metalimnion and hypolimnion at both stations. The lines indicate trendlines for each layer.
Water 11 00616 g005
Figure 6. Box plot with min-max of Secchi depth in Lake Durowskie at both stations. The lines indicate trendlines for each station.
Water 11 00616 g006
Figure 7. Box plot with min-max of chlorophyll-a in epilimnion at both stations I. The lines indicate exponential trendlines for each station.
Water 11 00616 g007
Figure 8. Box plot with min-max of mineral nitrogen compounds in selected water layers: ammonium N at Station I (a) and Station II (b); and nitrate nitrogen at Station I (c) and Station II (d). The lines indicate binomial trendlines for water layers in (a,c,d), and linear trend in (b).
Water 11 00616 g008
Figure 9. Box plot with min-max of nitrogen compounds in selected water layers: organic N at Station I (a) and Station II (b); and total N at Station I (c) and Station II (d). The lines indicate polynomial trendlines for water layers.
Water 11 00616 g009
Figure 10. Box plot with min-max of phosphorus compounds in selected water layers: SRP at Station I (a) and Station II (b); and total P at Station I (c) and Station II (d). The lines indicate binomial trendlines for water layers at a and b, and polynomial trendlines for water layers at c and d.
Water 11 00616 g010
Figure 11. The dependence of nitrate concentrations at Station I, II and River Struga Gołaniecka (RSG) on the sum of annual precipitation from the previous year (first year on horizontal axis).
Water 11 00616 g011
Figure 12. The dependence of SRP and TP concentrations in lake water at both stations on the content in River Struga Gołaniecka (RSG) and annual precipitation.
Water 11 00616 g012
Figure 13. RDA biplot illustrating the influence of the River Struga Gołaniecka (Nos. 3) on mean values of water quality variables in the depth profile of the lake at Station I (Nos. 1) and Station II (Nos. 2).
Water 11 00616 g013
Table 1. Range of individual thermal layers of water in subsequent years of research (m) and mean water temperature in the period June–August (°C) at two stations compared to the average air temperature in the same period (°C).
Range of Water Layers (m)2008200920102011201220132014201520162017
Station Iepi temp.0–4 19.40–4
20.3
0–3
20.9
0–3
20.8
0–2
22.5
0–3
21.3
0–3
20.9
0–3
20.0
0–3
23.1
0–3
20.9
meta
temp.
5–8
11.6
5–8
13.0
4–6
13.9
4–7
13.6
3–6
16.4
4–7
12.5
4–8
13.1
4–8
14.0
4–7
14.1
4–7
12.9
hypo
temp.
9–14
8.1
9–14
6.3
7–14
6.8
8–14
6.6
7–14
8.2
8–14
5.9
9–14
6.9
9–14
7.5
8–14
6.9
8–14
7.7
Station IIepi
temp.
na0–4
20.9
0–2
20.7
0–3
21.2
0–2
23.4
0–2
21.7
0–3
20.5
0–3
19.6
0–3
23.1
0–4
20.2
meta
temp.
na5–7
13.4
3–6
14.6
4–6
15.3
3–6
16.3
3–6
15.4
4–6
14.1
4–6
15.3
4–6
14.3
5–6
12.2
hypo
temp.
na8–12
7.0
7–12
7.6
7–12
7.7
7–12
8.4
7–12
7.1
7–12
8.1
7–12
8.5
7–12
7.5
7–12
8.5
Mean air temperature 118.918.319.218.718.619.218.919.618.918.7
na, not applicable; 1 data from Poznań-Ławica Airport (weatheronline.com).
Table 2. The variability of medians and maximum values of water quality characteristics in the River Struga Gołaniecka flowing into Lake Durowskie.
Parameter200920102011201220132014201520162017
temperature
(°C)
13.3
22.1
9.8
27.1
7.8
22.2
10.8
25.6
15.4
25.7
15.2
25.5
10.0
20.9
12.8
23.9
11.0
21.4
oxygen
(mgO2 L−1)
8.2
17.7
9.7
16.1
10.7
17.5
9.5
15.9
10.5
16.2
9.7
16.8
11.0
13.9
7.6
18.3
9.7
15.7
pH8.3
9.2
8.4
9.0
8.5
8.6
8.0
8.8
8.3
8.9
8.1
8.6
7.7
8.5
8.2
8.9
7.8
8.4
conductivity
(μS cm−1)
685
791
587
744
716
903
566
792
700
796
710
746
647
715
598
687
820
859
chlorophyll-a
(mg m−3)
26.5
88.9
41.9
51.8
8.1
54.7
25.3
38.0
18.6
47.8
26.5
45.2
28.9
38.5
19.5
30.3
19.6
28.6
ammonium N
(mgN-NH4 L−1)
0.99
2.59
1.24
2.76
0.88
2.26
1.03
3.03
1.02
1.79
0.91
2.07
0.86
2.37
0.97
1.93
0.54
1.22
nitrates
(mgN-NO3 L−1)
0
0.88
0.77
3.04
2.82
10.51
0
1.00
2.44
5.57
1.22
2.72
0.34
1.26
0.19
1.62
2.94
8.08
organic N
(mgN L−1)
1.6
3.9
2.0
3.5
1.8
3.2
1.4
1.8
1.1
3.6
1.7
2.2
1.2
2.3
1.3
1.7
2.0
3.7
TN
(mgN L−1)
3.7
5.2
3.7
4.1
5.7
11.8
2.5
4.1
5.7
7.2
4.4
5.0
2.6
4.6
2.7
4.3
5.6
11.1
SRP
(mgP L−1)
0.011
0.025
0.025
0.058
0.023
0.056
0.022
0.069
0.019
0.029
0.003
0.020
0.004
0.011
0.006
0.039
0.007
0.022
TP
(mgP L−1)
0.050
0.072
0.061
0.122
0.046
0.080
0.049
0.121
0.046
0.101
0.027
0.067
0.030
0.175
0.028
0.125
0.048
0.200

