Evaluation of TRMM Precipitation Dataset over Himalayan Catchment: The Upper Ganga Basin, India
by
 , and
, and
Anoop Kumar Shukla
1 ,
,
Chandra Shekhar Prasad Ojha
1, 
Rajendra Prasad Singh
2,3,*,
Lalit Pal
1 and
Dafang Fu
2,3,* 1
Civil Engineering Department, Indian Institute of Technology, Roorkee-247667, Uttarakhand, India
2
School of Civil Engineering, Southeast University (SEU), Sipai Lou 2#, Nanjing-210096, China
3
SEU-Monash University Joint Research Centre for Future Cities, Nanjing-210096, China
*
Authors to whom correspondence should be addressed.
Water 2019, 11(3), 613; https://doi.org/10.3390/w11030613
Submission received: 10 February 2019
/
Revised: 12 March 2019
/
Accepted: 18 March 2019
/
Published: 25 March 2019
(This article belongs to the Special Issue Urban Water Accounting)
Abstract
:Satellite based rainfall estimation techniques have emerged as a potential alternative to ground based rainfall measurements. The Tropical Rainfall Measuring Mission (TRMM) precipitation, in particular, has been used in various climate and hydrology based studies around the world. While having wide possibilities, TRMM rainfall estimates are found to be inconsistent with the ground based rainfall measurements at various locations such as the southwest coast and Himalayan region of India, northeast parts of USA, Lake Victoria in Africa, La Plata basin in South America, etc. In this study, the applicability of TRMM estimates is evaluated over the Upper Ganga Basin (Himalayan catchment) by comparing against gauge-based India Meteorological Department (IMD) gridded precipitation records. Apart from temporal evaluation, the ability of TRMM in capturing spatial distribution is also examined using three statistical parameters namely correlation coefficient (r), mean absolute error (MAE) and relative bias (RBIAS). In the results, the dual nature of bias is evident in TRMM precipitation with rainfall magnitude falling in the range from 100 to 370 mm representing positive bias, whereas, rainfall magnitude above 400 mm, approximately, representing negative bias. The Quantile Mapping (QM) approach has been used to correct the TRMM dataset from these biases. The raw TRMM precipitation is found to be fairly correlated with IMD rainfall for post-monsoon and winter season with R2 values of 0.65 and 0.57, respectively. The R2 value of 0.41 is obtained for the monsoon season, whereas least correlation is found for the pre-monsoon season with an R2 value of 0.24. Moreover, spatial distribution of rainfall during post-monsoon and winter season is captured adequately; however, the limited efficiency of TRMM is reflected for pre-monsoon and monsoon season. Bias correction has satisfactorily enhanced the spatial distribution of rainfall obtained from TRMM for almost all the seasons except for monsoon. Overall, the corrected TRMM precipitation dataset can be used for various climate analyses and hydrological water balance based studies in the Himalayan river basins.
1. Introduction
Water resources management is a crucial part of a country’s socio-economic development. Rainfall is a basic input to all the fresh water resources available on the Earth. Proper information on rainfall and its variability in space and time is required for efficient watershed planning and management [1]. Rainfall monitoring methods provide information on rainfall locations, time, duration, amount, variability and distribution. Apart from in-situ methods, rainfall datasets can be derived from satellite based sensors viz. rain radars, visible (VIS), infrared (IR) and microwave (MW). The National Center for Atmospheric Research (NCAR) has broadly categorized rainfall datasets into three categories: gauge datasets (e.g., Global Precipitation Climatology Centre (GPCC), Asian Precipitation-Highly Resolved Observational Data Integration Towards Evaluation (APHRODITE) etc.), satellite-only datasets (e.g., CICS High-Resolution Optimally Interpolated Microwave Precipitation from Satellites (CHOMPS)) and merged satellite-gauge products (e.g., Global Precipitation Climatology Project (GPCP), Tropical Rainfall Measuring Mission (TRMM) 3B42, TRMM 3B43) [2]. Precise observation of rainfall is a challenging task owing to its wide variability in space-time scales [3,4,5]. The in-situ methods of rainfall observation involve several challenges, especially in countries like India having diverse geographic features and a developing economic status. It is difficult to access and properly maintain a rain gauge station in places having extreme environmental conditions. In addition, the rain gauge network is relatively sparse with uneven distribution in tropical arid regions of developing countries such as India.
The satellite based rainfall estimation techniques have proven to be a potential alternative to in-situ rainfall measurement [6,7,8,9,10,11,12,13]. The main advantage of satellite based rainfall estimation over rain gauge based estimation is that they provide homogenous rainfall information in space and time over a region. The data can be acquired even for inaccessible areas thus reducing the time and cost of observation. However, satellite based rainfall estimation is a complex process and involves challenges with respect to spatiotemporal resolutions, maintenance of accuracy, calibration, and validation [14,15]. To date, TRMM satellite derived rainfall data has been used for various applications in the field of climatology, atmospheric, environmental and agricultural sciences and watershed management [9,16,17]. It has been used for applications such as rainfall-runoff modelling [15], daily hydrological modelling [18,19], to assess the diurnal variability of rainfall over a region [5], for water balance computations in a catchment [20], for soil moisture estimation [21], to determine the vegetation characteristics [22], to determine the climatic characteristics of rainfall [23], to understand the hydrology of a region [24], for hydro-meteorological applications [25], and for validation of satellite data to gauge data [26,27,28]. The most important advantage of TRMM rainfall products is that it provides important information on distribution, frequency and intensity of rainfall over a tropical region. The rainfall estimates are provided with high spatial and temporal resolutions, which are very useful for validation of tropical precipitation in climate models. Apart from precipitation based analysis, satellite-based lightning data provided by TRMM at high spatial resolution was used in a few past studies analyzing spatiotemporal patterns in lightning activities at the regional scale. Xu and Zasper [29] examined the regional scale lightning activity over central and eastern foothills of the Tibetan plateau. Sen Roy et al. [30] studied the diurnal patterns in lightning activity at the regional scale in tropical Asia.
Despite the areal coverage and advanced retrieval algorithm, numerous studies have shown that satellite estimates of precipitation differ from ground-based estimates [23,31,32,33,34,35,36,37,38]. The TRMM rainfall performance in particular, is found to be affected by the climatology of a region. Areas with high snow content are problematic due to the sensitivity to the surface emissivity in passive microwave sensors, which produces signals similar to those of precipitation [39]. Satellite-based precipitation datasets also show different performances in warm and cold seasons [40]. Complex emissivity from a cold place and area covered in ice, especially in winter, may be recognized as a rain event, which could lead to missed precipitation by TRMM sensors [41]. Precipitation at high elevations specifically in the winter months can be in solid form, and this complicates the retrievals from the TRMM multisatellite sensors. The TRMM multisatellite spaceborne sensors give an indirect measure of precipitation, based on passive sensors at multiple wavelengths (infrared and microwave) and radar. The passive microwave sensor precipitation retrieval on the TRMM multisatellite could misidentify the ice cover over the mountaintops as raining clouds [42]. The passive microwave is also not able to observe the orographic enhancement in the liquid phase over the complex terrain, leading to underestimation of the actual precipitation (over land, only scattering from solid hydrometeors is used) [43]. Further, the TRMM satellite radar does not detect very low rainfall rates (<0.7 mm h−1) and low to moderate levels of snowfall rate. In the events characterized by such low precipitation rates, TRMM underestimates the total monthly or yearly precipitation leading to a negative bias [44]. As snow typically falls in high elevation and mountainous terrains, there is therefore a tendency for retrievals from the TRMM multisatellite to underestimate precipitation in such regions [45,46]. Rain gauges are still considered as the most direct and accurate way for precipitation measurement and therefore, have been used for the validation of satellite precipitation estimates over the Himalayan region, usually for a large time scale [6,7].
The accuracy and error characteristics of TRMM products in comparison with gauge measurements were evaluated in many regions, such as in Xinjiang [47], Qinghai-Tibetan Plateau [48,49] and Poyang Lake regions in China [50]; Mainland China [51,52]; South Korea [53]; Japan [53]; India [54] and in four regions with distinct climate and topography in Iran [55]. Numerous case studies have been conducted on Indian sub-continent including Himalayas to compare the TRMM products with rain gauge-based precipitation data [11,12,54,56,57,58,59,60,61,62,63,64]. The results of these studies showed that the quality of satellite rainfall products varies with region, season and elevation. Generally, while the TRMM 3B42 product performs reasonably well over most regions (it depicts the overall rainfall spatial patterns with only small biases compared to gauge data), it generally underestimates rainfall in regions of intense convection over land. Nair et al. [56] evaluated the TRMM 3B42-V6 precipitation estimates over the Maharashtra state of India through comparison with rain gauge-based observations from a dense network. Study results represent variability in performance of TRMM precipitation over different climate regimes. Fairly accurate estimates were obtained over regions of moderate rainfall, whereas, regions of sharp gradient in rainfall are found to be inaccurate. They further concluded that 3B42-V6 is unable to resolve heavy orographic precipitation which is usually observed in the Himalayan region. Uma et al. [62] compared TRMM 3B42 precipitation products with an IMD gridded dataset at a spatial resolution of 1° × 1° over entire India. The comparison showed high disagreement at the considered resolution, however, satisfactory correlation could be obtained when all the datasets at average scale in India are analyzed. Bharti and Singh [64] validated the TRMM 3B42-V7 rainfall amounts with IMD gauge-based measurements over the northwest Himalayan region by dividing it into different elevation ranges. Results revealed that the satellite products overestimated the rainfall over the region falling below the elevation of 3100 m and underestimate over the region falling below 3100 m. The satellite-based estimates exhibit comparatively better performance for 1000–2000 m elevations but aggravates over higher-altitude regions. Overall, TRMM product underestimated the monsoon rainfall over higher elevations of northwest Himalayas. Prakash et al. [12] validated TRMM 3B42 (V7 and RT) and Global Satellite Mapping of Precipitation (GSMaP) against gauge-based IMD precipitation for the monsoon season over India. The two datasets were found to be performing well for large-scale monsoon rainfall, however, biased estimates are obtained at the regional scale. Both the types of TRMM datasets were observed to be overestimating the rainfall over the majority of India except for orographic regions such as the northwest and northeast Himalayan region and southern peninsular India.
Among these studies, Prakash et al. [11,12] and Bharti and Singh [64] have considered the latest TRMM 3B42-V7 version of the dataset which uses an improved algorithm over the previous version (3B42-V6). Remaining studies have evaluated the performance of the older version of TRMM precipitation dataset viz. 3B42-V6, which has already been documented for poor performance [10,11]. In addition, a number of studies comparing TRMM rainfall data vs. rain gauge-based data at the catchment scale and evaluating hydrological processes using TRMM rainfall data in simulation and water balance analysis provide useful information for hydrology research and water management purposes [20,65,66,67]. In these studies, TRMM precipitation estimates are found to be affected by different errors such as overestimation of low intensity rainfall and underestimation of high intensity rainfall, seasonal variation in performance with better performance in some seasons and poor in others, varying accuracy in different climate regimes, limited performance at daily time steps, etc. The limited ability of TRMM satellite estimates to resolve precipitation over Himalayan topography is documented in most past studies. Further, owing to the spatial variability in performance of TRMM precipitation estimates over the Indian sub-continent, Prakash et al. [11] have emphasized over the need for application of region specific bias correction of the dataset before its integration in hydrological studies. Krishnamurti et al. [68] have demonstrated a regression based approach for correction of TRMM (3B42-V6) precipitation estimates over India to assimilate a corrected dataset in weather forecast models. However, the results obtained from the proposed technique were not satisfactory for the orographic regions like the southwest coast and along the foot hills of Himalayas in India. So far, no study has examined the reliability of bias correction techniques for performance enhancement of TRMM precipitation over the Himalayan region of India. Therefore, the present study aims to evaluate the performance of TRMM 3B43-V7 precipitation estimates against gauge-based IMD precipitation records over a Himalayan catchment (Upper Ganga basin) for different seasons. In addition, the raw TRMM precipitation dataset is bias corrected and compared against IMD to examine the efficiency of bias correction techniques in improving the performance of satellite based TRMM precipitation estimates over the Himalayan region.
Researchers have used different techniques to apply corrections to the satellite precipitation datasets at different geographic locations. A few of the widely used methods are the Linear Correction method [69,70], Local Intensity Scaling method [71,72], Power Transformation method [71,73], the Quantile Mapping (QM) method [74,75,76,77,78], etc. The QM method, also named Distribution Mapping or the Quantile–Quantile method, is considered superior than other aforementioned techniques as it adjusts the entire cumulative distribution of estimated data to the cumulative distribution of rain gauge data using a transfer function. Some comparison studies indicated that the QM method had the best skill in reducing the systematic bias of regional climate model precipitation estimates [79]. In particular, the nonparametric QM approach is highly valued for bias adjustment, because it does not rely on any predetermined function and as such provides more flexibility. In addition, from a hydrological modeling perspective, it was found that the sophisticated QM method resulted in better hydrological performance than that of the simpler scaling method [80,81]. The approach has found many applications in the recent literature implying its effectiveness in bias correction of precipitation estimates [82,83,84,85]. Considering the adequacy of the QM method, it is used in the present study to correct errors involved in TRMM precipitation estimates. The focus of this study is to evaluate and improve the accuracy of the TRMM product at high elevations and mountainous terrains by using ground-based estimates. Overall, comprehensive evaluation of TRMM precipitation estimates is performed in past studies but none of them have attempted to provide an approach for correction of TRMM estimates especially over the Himalayan region. Further, there exists a lack of a study aimed at assessing the efficiency of such correction methods. In view of the above considerations, this work is aimed at: (i) Assessing the error characteristics of the latest version of satellite based TRMM (3B43-V7) precipitation against the gauge-based IMD gridded precipitation dataset over Himalayan catchment (Upper Ganga basin). (ii) Understanding the nature of bias in the dataset for different seasons and perform bias correction using available bias correction techniques separately for each season. (iii) Examining the efficiency of the bias correction approach in enhancing the performance of TRMM precipitation estimates over the study region.
2. Materials and Methods
2.1. Study Area
The Ganga River is the longest river of India and ranks among the world’s top 20 rivers by amount of water discharge. The Ganga begins at the confluence of the Bhagirathi and Alaknanda Rivers, which meet at Dev Prayag in the Tehri Garhwal district of Uttarakhand State of India within the mountain range of the Himalayas. The Bhagirathi River has been considered as a true source of Ganga, which rises at the foot of Gangotri Glacier, at Gaumukh. The Ganga River is divided into three zones, viz. Upper Ganga basin, Middle Ganga basin and Lower Ganga basin. The study area, Upper Ganga basin (UGB) is located in northern India, which covers an area of around 22,292 km2 up to Haridwar (Figure 1). The elevation ranges from 7799 m in the Himalayan mountain peaks to 255 m in the plains. The Upper Ganga river basin is situated in the Uttarakhand state, India with geographical coordinates 29°45’ to 31°22’ N latitude and 77°57′ to 80°05′ E longitude, having an aerial extent of about 22,292 km2.
In general, the climate in this region is dependent on the geographical altitude and can be divided into the following zones: Frozen (>4800 m); Glacier (4000–4800 m); Alpine (3000–4000 m); Cold (2400–3000 m); Cool temperate (1800–2400 m); and Warm temperate (900–1800 m) [86]. About 433 km2 of total area of the basin is under glacier landscape and 288 km2 is under a fluvial landscape. Bhilangana, Asiganga, Dhauli Ganga, Pindar and Mandakini are the major tributaries of the Ganga River falling within the Upper Ganga basin. The annual average rainfall in the basin ranges between 650 to 1800 mm and a major part of rainfall is received from the southwest monsoon that prevails from June to late September. The precipitation pattern in this region is highly un-even and the average annual rainfall is about 1279 mm. Major soil groups identified in the river basin are: Clay Loam soils, Sandy Clay Loam soils, Glaciers and Rock Outcrops and Water Bodies with areal extent of 52.2%, 25.0%, 22.8% and 0.1% respectively. The geographical location, 35 TRMM and 32 IMD grid position of the study area i.e., Upper Ganga river basin are given in Figure 1.
2.2. Data Used
Gridded daily precipitation for the UGB was acquired from the India Meteorological Department (IMD), Pune, Ministry of Earth Sciences, Govt. of India. The dataset is developed using station observed daily rainfall data from about 7000 rain gauge stations spread across the entirety of India. Station data at daily time steps are interpolated into a regular grid using the Shepard interpolation method and rigorous quality-checks are applied to develop the dataset at finer spatial resolution of 0.25° × 0.25° (~25 km) [87,88]. This gauge-based gridded rainfall dataset essentially reproduces orographic rainfall gradient more realistically due to the finer spatial resolution [11,12,88]. Therefore, a gauge-based IMD precipitation dataset should be the more appropriate dataset for evaluation of satellite based precipitation estimates. In this study, gridded monthly precipitation based on the direct daily gauge measurement for the time period from January 1998 to December 2013 (corresponding to TRMM precipitation dataset) were used (regarded as IMD in the subsequent text). With this spatial resolution, 32 grid points fall within the boundary of the Upper Ganga basin. Daily rainfall values were aggregated to monthly data from January 1998 to December 2013 for validation of satellite based rainfall estimates (TRMM).
Several versions of the TRMM data-processing algorithms have been released since the launch in 1997. The TRMM Multisatellite Precipitation Analysis (TMPA) system produces estimates of quasiglobal precipitation (50° N and 50° S latitude) that utilize multisatellite and gauge data for bias correction [89,90]. TMPA provides three-hourly precipitation datasets of the global tropical and subtropical regions with a spatial resolution of 0.25° latitude × 0.25° longitude. The latest monthly multisatellite and gauge precipitation algorithm 3B43 version 7 was released in mid-2011. The 3B43 merged precipitation product is based on a combination of microwave, infrared and radar information from TRMM and other precipitation-relevant satellite sensors, infrared data from geostationary satellites (TRMM multisatellite) and ground-observed data merged in the Global Precipitation Climatology Centre (GPCC) [91]. TRMM 3B43-V7 data were downloaded from the NASA Goddard Earth Sciences Data and Information Services Center website (http://mirador.gsfc.nasa.gov/). In this study, we used the TRMM 3B43-V7 (monthly) precipitation product between January 1998 and December 2013 for comparison with the gridded IMD precipitation dataset.
3. Data Preparation and Methodology
3.1. Data Processing
The rainfall rate variable from the TRMM 3B43-V7 dataset was obtained in NetCDF format at monthly time steps. To ensure consistency between the two datasets, TRMM records were resampled to the IMD grid location using the Spline interpolation technique. The datasets used in this study are summarized in Table 1. The rainfall in the region is highly seasonal with the majority of rainfall received in the monsoon season (June–September) called the Indian Summer Monsoon (ISM). Western disturbances in the north also bring considerable rainfall in the northwest regions of the Indian subcontinent during the winter season (January–February). Therefore, various analyses in the present study were performed separately for four seasons namely pre-monsoon (March–May), monsoon (June–September), post-monsoon (October–December) and winter (January–February) and at an annual scale. The detailed methodology is explained in Figure 2.
3.2. Bias Correction
Panofsky and Brier [92] proposed a quantile mapping based bias correction method in which distribution of monthly TRMM precipitation is mapped over gridded IMD observed data. The approach has found its application in various past studies involving hydrological analysis and climate change impact assessment owing to its simplicity of application [74,93,94,95,96]. Mathematically, the approach can be expressed for a variable p as
where, Fo is CDF (Cumulative Distribution Function) of observed rainfall provided by IMD, Fc is CDF of TRMM estimates rainfall, pc is TRMM precipitation and pcorr is bias corrected TRMM precipitation.
In the process, the CDF value corresponding to a given TRMM precipitation amount is identified from the CDF plot of TRMM. Subsequently, the value of precipitation is traced corresponding to that same CDF value from the CDF plot of IMD precipitation. A basic assumption involved in this method is that the climate is stationary over time i.e., variance of skew of distribution remained unaffected. The method adjusts the entire distribution of TRMM precipitation by matching it with IMD precipitation (i.e., all moments are corrected) [96].
3.3. Statistical Evaluation
To quantify the discrepancy between the satellite data and the ground-based rainfall estimates, three statistical measures namely the correlation coefficient (r), mean absolute error (MAE), and relative bias (RBIAS), were used. All the measures were estimated on a pixel-by-pixel basis within the UGB. We calculated these quantities using monthly averages over the study period from January 1998 to December 2013. The Pearson correlation coefficient (r) gives the degree of linear association between two variables, so it was used to define how well the TRMM 3B43-V7 precipitation product corresponds to the IMD estimates. A perfect positive fit is reflected by an absolute correlation coefficient value of 1, whereas a weak linear correlation is indicated by correlation coefficient that is close to zero. This coefficient is defined as Equation (2).
where Gi and Si are the ground-based and satellite-based precipitation estimates, respectively, on month i and n is the total number data point computed at each individual pixel.
The root mean square error (RMSE) is one of the most common estimates of error. However, the RMSE is sensitive to the occasional large error, for example, in our study, extreme precipitation events, and was found to be heavily influenced by such events. As a result, RMSE does not reflect the bias properly. Instead, we used the MAE, which is less sensitive to extremes and provides a stable estimate of the differences in the temporal precipitation data. This is defined as Equation (3).
The relative bias (RBIAS) denotes the absolute bias divided by the precipitation and has the advantage that it is independent of the amount of precipitation. A positive bias indicates an overestimation of satellite precipitation, whereas a negative value implies an underestimation. The relative bias is defined as Equation (4).
4. Results
In this section, first temporal and spatial evaluation of TRMM precipitation for the study area is discussed. As evident from Figure 1, TRMM grid points are located at the edges of the IMD grids. A comparative analysis of TRMM and IMD rainfall requires resampling of the data to a common grid point. As a result, daily time of observed rainfall is obtained at corresponding IMD grid points. TRMM 3B43 V7 provides satellite based estimates of rainfall in terms of instantaneous rainfall intensity in mm/s. On the other hand, IMD rainfall dataset are available in terms of accumulated rainfall depth in a day at resolution of 0.25° × 0.25°. Subsequently, TRMM rainfall estimates available in terms of rainfall intensity (in mm/s) are converted to daily rainfall volume in mm.
4.1. Temporal Evaluation of TRMM Precipitation
In the literature, TRMM rainfall estimates are found to be biased over the Indian sub-continent with the nature of bias varying from region to region [11,12,64]. Similar attributes are also observed in the present study as monthly rainfall estimates of TRMM precipitation are not consistent in magnitude with IMD precipitation. A comparison of cumulative distribution function (CDF) of monthly precipitation from IMD and TRMM is shown in Figure 3a. As can be seen in the plot, the nature of bias in TRMM rainfall in not systematic over the entire range of rainfall depths. The precipitation volume corresponding to a given CDF value is higher for TRMM than that for IMD in the low to medium magnitude precipitation and lower for high magnitude precipitation. It indicates an inconsistent bias in TRMM estimates where a positive bias is evident in the range from about 100 to 370 mm, whereas, negative bias is present for monthly precipitation above 400 mm, approximately. This shows that TRMM has continuously underestimated the rainfall volume specifically during heavy storm events. For weak and medium intensity storm events, TRMM has overestimated the precipitation compared to that of IMD precipitation events. Moreover, the correlation between precipitation from the two datasets is weak, with the R2 value being 0.46 for monthly estimates (Figure 3b). In the study region, heavy storm events mainly occur during monsoon season and the other seasons remain comparatively dry. The results show different nature of error in TRMM estimates for different orders of precipitation magnitude. Therefore, it is required to apply correction methods and quantify the accuracy of corrected TRMM precipitation separately for each individual season.
A seasonal comparison of rainfall from IMD and TRMM is presented using scatter plots of monthly estimates for respective seasons in Figure 4. As evident from the figure, TRMM rainfall estimates represent better agreement with IMD rainfall during post-monsoon and winter seasons, having R2 values of 0.57 and 0.55, respectively. However, precipitation estimates of TRMM for monsoon rainfall are not as well correlated with IMD precipitation, as the R2 value for the monsoon season is 0.41. This again highlights the feeble performance of TRMM in estimating high intensity rainfall during heavy storm events in the monsoon season. The tendency of TRMM to underestimate high intensity rainfall is also reflected in Figure 4 as scatter points corresponding to high intensity precipitation are falling away from the 45° line in the lower half of the plot. The worst correlation (R2 = 0.24) between IMD and TRMM precipitation is obtained in the pre-monsoon season. The pre-monsoon season is driest among all the seasons and the majority of non-rainy days are present during this month. In that case, the formation of clouds with no rainfall event may be captured by the satellite as a rainy day which may result in erroneous precipitation estimate, especially during the pre-monsoon season.
A non-uniform bias is evident in TRMM precipitation estimates as obtained from the comparison of CDF and scatter plots of IMD precipitation with that of TRMM precipitation. In order to use TRMM precipitation in different hydrological analyses in the UGB, it is required to be corrected for such biases. In this study, the quantile to quantile mapping (CDF matching) method given by Panofsky and Brier [92] has been used for bias correction. The approach is used in various past studies involving climate change impact on water resources owing to its simplicity. As different seasons are found to be affected with different nature of biases i.e., negative bias in the monsoon season and positive bias in the post-monsoon season, corrections are applied separately for different seasons at monthly time steps. A comparison of the CDF of IMD and bias corrected TRMM monthly precipitation over the period 1998–2013 is shown in Figure 5a. As can be seen, the CDF of bias corrected TRMM precipitation matches well with that of IMD precipitation for the entire distribution. Further, an overall increase in correlation has also been observed from 0.46 to 0.54, exhibiting improvement in the performance of TRMM precipitation estimates post bias correction (Figure 5b).
Seasonal evaluation of bias corrected TRMM precipitation against IMD is represented in the form of scatter plots in Figure 6. Overall, a significant improvement in monthly precipitation has been observed post bias correction in all the seasons. The correlation between the two precipitation datasets for the post-monsoon and winter season has improved from 0.57 and 0.55 to 0.65 and 0.64, respectively. The R2 value for the pre-monsoon season also improved from 0.24 to 0.32 post bias correction, but remained lesser than the other seasons. Although the improvement in R2 value for the monsoon season has been marginal i.e., from 0.41 to 0.47. Overall, bias correction has significantly improved the TRMM rainfall estimates especially for pre-monsoon, post-monsoon and winter and the corrected rainfall can be used as a climate input for various hydrological studies.
An evaluation of the adequacy of bias corrected TRMM precipitation estimates at different locations across the basin is carried out by randomly selecting a grid point in four zones of the UGB. At each grid point, the time series of bias corrected TRMM precipitation is compared with IMD rainfall series and raw TRMM precipitation. The grid point selected in north, west, south and east zone of the basin are designated as Grid-1, Grid-2, Grid-3 and Grid-4, respectively (Figure 7). At Grid-1, the time series of uncorrected TRMM precipitation fairly matches with that of IMD precipitation till the year 2003. After the year 2003, TRMM rainfall remained more or less consistent in magnitude, whereas IMD rainfall has experienced an increase in magnitude. The gap between IMD and TRMM precipitation rainfall kept on increasing over the years after 2003. The discrepancy in the two datasets may possibly be due to the fact that the northern part of the UGB mainly lies in the Greater Himalayan region. The Greater Himalayan region is characterized by mountainous topography with an elevation value ranging from about 4000 to 7500 m and a climate with sub-zero temperatures. The inferior performance of TRMM precipitation estimates in highly uneven topography is highlighted by various past studies [42,43,44,45,46]. The rain gauge network of IMD is very sparse in northern parts and an inadequate network of ground observed record is not able to capture the orographic effect on the rainfall pattern. The satellite based measurements of precipitation may prove to be superior than the ground based records in such regions. Bias correction reduced the gap between TRMM and IMD precipitation resulting in a consistent increase in TRMM precipitation over the entire period. However, this increase in corrected TRMM rainfall estimates have also resulted in a slight overestimation for the period before 2003.
At Grid-2 located in the western region of the Upper Ganga basin, a systematic negative bias is observed in TRMM precipitation magnitude over the entire study period (Figure 7). As bias correction is applied for correcting systematic negative bias, TRMM precipitation magnitudes have increased and are found fairly consistent with IMD records over the entire period. Similar results are also obtained at Grid-3 located in the southern part of the basin. The uncorrected precipitation of TRMM is fairly matching with that of the station observed IMD over the entire period. For a few years i.e., 2006–2010, the magnitude of TRMM precipitation is found to marginally higher than IMD precipitation. Bias correction has reduced the gap in these years whereas for the remaining years the precipitation magnitude remained more or less unchanged. At Grid-4 located in the eastern zone of the basin, TRMM has highly underestimated the precipitation especially during wet seasons up to the year 2008. After this year, satellite estimates are comparable with that of IMD precipitation records. However, bias correction has considerably improved the raw TRMM estimate over the entire study period. Among the four grids, Gird-1 (north) and Grid-4 (east) are located in higher elevation regions in the upstream of the catchment, whereas, Grid-2 (west) and Grid-3 (south) are located at lower-altitudes in the downstream. The comparison of time series of the two datasets shows that the performance of raw TRMM precipitation estimates at grid points located at higher altitudes is poorer than that of grid points located at lower elevations. The inadequate performance of TRMM estimates over higher altitudes (northern and eastern region) is because of great topographical variations in the Greater Himalayan region. In summary, TRMM precipitation estimates are found to be fairly matching with IMD precipitation for the western and southern regions. However, a significant difference has been identified between precipitation from TRMM and IMD in the northern and eastern regions. The correction method applied for removing bias from the TRMM precipitation dataset has considerably reduced the gap between the two estimates. The performance of TRMM precipitation estimates were found to vary across the basin, with fairly accurate precipitation estimates in some regions to inconsistent estimates in the other.
4.2. Spatial Evaluation of TRMM Precipitation
Results of the comparison between the time series of IMD and TRMM precipitation at different locations in the basin have shown that the performance of TRMM estimates vary in space too. This encourages for the analysis of the capability of TRMM estimates in representing spatial distribution of precipitation over the region. The spatial variations in accuracy of TRMM precipitation were analyzed for each season, separately. A spatial map of average annual precipitation from IMD, TRMM (uncorrected) and corrected TRMM is shown in Figure 8. The spatial inconsistency in IMD and TRMM precipitation estimates is evident from Figure 8a,b, where average annual rainfall as recorded by IMD (2000–2800 mm) in the eastern region is much higher than TRMM precipitation estimates (1400–1800 mm). In contrast, average annual values of precipitation from TRMM at grid points located in northern parts of the basin is higher than that of IMD. In addition, the annual precipitation at grid points falling in southern and western regions is more or less similar in magnitude for both TRMM and IMD (Figure 8a,b). The results indicate that the spatial distribution of precipitation represented by TRMM is significantly different from IMD. Figure 8c also shows the spatial distribution of average annual precipitation of TRMM obtained after bias correction. As evident from the figure, spatial distribution of bias corrected TRMM precipitation is fairly consistent with IMD precipitation in terms of annual accumulated volume. Evidently, the spatial patterns in TRMM are also adequately corrected by the bias correction approach used in the present study. Subsequently, annual accumulated volume of precipitation from TRMM can be used in hydrological analyses to be carried out at annual temporal resolution. However, the ability of the TRMM mission in capturing spatial patterns in precipitation at monthly and seasonal time steps is required to be examined in order to decide the credibility of usage of TRMM precipitation for rigorous hydrological analyses in the Upper Ganga basin.
In the present study, the adequacy of TRMM precipitation in capturing spatial variability of seasonal rainfall as represented by IMD precipitation was analyzed for four seasons viz. pre-monsoon, monsoon, post-monsoon and winter. Three statistical parameters namely correlation coefficient (r), mean absolute error (MAE) and relative bias (RBIAS) were used to evaluate seasonal precipitation obtained from satellite products against station-based IMD precipitation at each individual grid point. Further, improvement in precipitation estimates after bias correction was also identified for different seasons. The statistical indicators were computed using monthly values of TRMM precipitation in a given season against corresponding monthly values of IMD precipitation. Figure 9 shows the value of r, MAE and RBIAS for the pre-monsoon season at each grid for raw and bias corrected TRMM precipitation. As can be seen in Figure 9a, pre-monsoon rainfall from TRMM is well correlated with IMD precipitation in almost the entire basin with the value of r falling in range 0.6–1.0 except for southern parts. At grid points located in the southern region, correlation coefficient values for pre-monsoon precipitation are varying in range 0.2–0.4. These results indicate existence of poor correlation between TRMM and IMD precipitation in the southern region during the pre-monsoon season. Further, only a slight improvement in correlation is observed in pre-monsoon precipitation after bias correction with more or less the same spatial pattern.
The MAE computed between TRMM and IMD precipitation for pre-monsoon season at each grid point is shown in Figure 9b. For grid points located in northern and central parts of the basin, negative absolute error is observed in TRMM precipitation with values falling in the range −80 mm to 0. On the other hand, MAE for grid points in the eastern and western regions of the basin is found to be positive which shows that the value of IMD precipitation in the pre-monsoon season at these locations is higher than that of TRMM. Bias correction of pre-monsoon rainfall has significantly reduced the MAE between the two precipitation datasets. The MAE value at almost all grids across the basin has reduced to almost zero after applying bias correction. A spatial map of relative bias computed at each grid point for pre-monsoon precipitation is shown in Figure 9c. In the analysis, similar patterns are observed in RBIAS as that in MAE across the basin. The value of RBIAS lies in the range −60 to −20 mm for the northern region and 0 to 60 mm for eastern and western regions. As obtained for MAE, relative bias has also reduced to zero for almost all grid points. Overall, significant improvement has been obtained in precipitation estimates during the pre-monsoon season in terms of rainfall volume. However, correlation between two precipitation datasets has improved slightly post bias correction. Bias correction has fairly improved precipitation estimates in terms of magnitude, however, temporal patterns are not well refined.
The results of TRMM precipitation evaluation for the monsoon season is shown in Figure 10. In Figure 10a, TRMM precipitation values are well correlated with IMD precipitation at all almost all grid points with r values ranging between 0.6 and 0.8. Precipitation at grid points located in the eastern region is found to be weakly correlated with r values falling in the range 0–0.2. As obtained in previous results, correlation between TRMM and IMD precipitation is enhanced on applying bias correction. Further, MAE between the two precipitation datasets is found to have both negative and positive values on the basin (Figure 10b). The grid points falling in southern and central regions have negative MAE whereas, grids located in eastern and northern parts have positive MAE. Negative MAE shows that TRMM precipitation magnitude is higher than that of IMD and positive MAE indicates TRMM precipitation is lower than IMD precipitation at those grids. Bias correction has reduced the MAE values to zero at almost all grids in monsoon precipitation. Spatial patterns observed in MAE are also replicated in RBIAS between TRMM and IMD precipitation as can be seen in Figure 10c. The relative bias in monsoon precipitation has also reduced to zero post bias correction. In the post-monsoon season, TRMM precipitation estimates are found to be highly correlated with IMD at almost all grids, which further improved post bias correction except for a few grid points in southern regions (Figure 11). As evident from Figure 11a, the correlation coefficient (r) value at most of the grid points lies in the range 0.8–1.0 for the post-monsoon season. Additionally, the MAE value at all the grids is obtained to be negative, falling between −60 mm and 0 representing overestimating tendency of TRMM. On applying bias correction, the MAE value got reduced to the range −20 mm to 0 at most grid points (Figure 11b). Similarly, values of RBIAS computed for the post-monsoon season are found to negative, lying in the range −160 to 0. Bias correction has reduced this relative bias to fall in the range −20 to 0 at most grid points.
In the winter season, correlation of precipitation from the two datasets is found to be higher (r = 0.8–1.0) at grid points located in western and southern parts of the basin (Figure 12a). For the eastern region, correlation gets weaker with the r value falling in range between 0.4 and 0.6. The performance of bias corrected satellite precipitation remained more of less same as that of raw precipitation data as no significant improvement is observed in correlation coefficient values post bias correction for winter precipitation. TRMM precipitation estimates are found to be lower than IMD precipitation for grid points located in western and southern regions as MAE at these grid point is positive (Figure 12b). On the other hand, TRMM is underestimating the precipitation in eastern and northern regions with MAE lying between −150 and 0. The gap between precipitation estimates from two datasets fairly reduced after applying bias correction and MAE values reduced to fall in the range −50–0. Accordingly, significant improvement is also observed in relative bias post bias correction TRMM precipitation (Figure 12c).
Overall, TRMM precipitation is found to be highly inconsistent with that of IMD precipitation especially for the pre-monsoon, monsoon and post-monsoon seasons. Raw precipitation estimates of TRMM shows high discrepancy from IMD precipitation as values of MAE and relative bias are observed to be high in almost all seasons. Although bias correction has significantly reduced the gap between two precipitation datasets, the performance is not consistent for all seasons. In the monsoon season, correlation is found to be reduced at most grid points, whereas, in the winter season almost no improvement is observed in correlation values. Bias correction has reduced the gap between two datasets in terms of precipitation magnitude, however, precipitation consistency remains unaffected. Therefore, the use of TRMM precipitation data for studies involving hydrological analyses may result in erroneous conclusions.
5. Discussions
Satellite based rainfall measurement missions have certainly emerged as a potential source of observed rainfall records for various hydro-climatic studies across the world. With the ability to remotely estimate the rainfall events, the approach is particularly advantageous for regions with inaccessible terrains and sparse network of in-situ measurement stations. Technical advancement in satellite based observations has provided us with rainfall estimates at fine spatial resolutions with fairly homogeneous coverage in space and time. TRMM is one such rainfall measurement mission providing high resolution estimates of rainfall records and has found application in various studies including rainfall-runoff modelling, temporal and spatial variability analysis of rainfall, water balance components estimation, etc. While having wide possibilities, TRMM rainfall estimates are found to be inconsistent with the ground based rainfall measurements at various locations. Consequently, the application of TRMM rainfall records requires proper validation with the ground based rainfall measurement and appropriate corrections wherever necessary. In the present study, the applicability of TRMM rainfall over a Himalayan catchment is examined in terms of temporal patterns and spatial variability of rainfall in the region. Considering the seasonal behavior of rainfall over the Indian sub-continent, different analyses are carried out separately for four seasons viz. pre-monsoon, monsoon, post-monsoon and winter season.
The comparison of CDF for monthly rainfall from TRMM and ground based IMD reveals the dual nature of bias in TRMM rainfall. The rainfall magnitude falling in the range from 100 to 370 mm represent positive bias, whereas, consistent negative bias is present in months with rainfall magnitude above 400 mm, approximately. It shows that TRMM is consistently underestimating for months with heavy rainfall events, whereas, overestimating for months having low to medium range rainfall magnitude in the Himalayan region. Only a small window of rainfall magnitude is present (about 350 to 400 mm) where TRMM estimates are comparable with IMD records. Several studies in the past have documented the limitations of TRMM rainfall estimates especially for extreme events [99,100,101]. Chen et al. [10] found it to underestimate low intensity rainfall and overestimate high intensity rainfall. In the present study, contrasting results are obtained as high magnitude rainfall is underestimated, whereas, low magnitude rainfall is overestimated by TRMM over the Himalayan catchment. Apart from low magnitude rainfall, TRMM estimates are also underestimating for months with a medium rainfall magnitude range. The months having rainfall magnitude falling in the medium range mainly belong to the winter season. The inability of TRMM to capture the medium range of rainfall may possibly be due to fact that precipitation during winter season occurs in the form of snowfall. Moreover, more than 30% of land in UGB is covered with snow or glacier. The inferior performance of TRMM over regions with high snow content and complex terrain is discussed in many past studies [39,41,89,102,103]. Various reasons provided in these studies are scattering of microwave signals in snow covered regions, sensitivity of TRMM Microwave Imager to sub-freezing temperature, multiple scattering of microwave signals in mountainous terrain, etc.
The biases in TRMM precipitation are corrected using the QM approach separately for different seasons. However, the efficiency in terms of correction with IMD rainfall was not uniform for all the seasons. Where the correlation between TRMM and IMD rainfall has improved significantly for pre-monsoon, winter and post-monsoon season, a marginal change in R2 value from 0.41 to 0.47 has been obtained for the monsoon season. Similarly, the performance of TRMM in terms of time series of rainfall also varied at different locations in the basin. At grid points located in southern and western regions, the raw precipitation time series from TRMM are fairly consistent with IMD. However, a significant gap was found in precipitation estimates from the two sources at grid points located in northern and eastern regions. The northern and eastern zones of the basin mainly fall in the higher elevation regions of the Himalayas. Snow covered areas and cold weather complicates the surface emissivity patterns which may be falsely detected as precipitation by passive microwave sensors used in TRMM satellites. The passive microwave sensors are also found inefficient in resolving the orographic enhancement in the liquid phase over highly uneven terrain [42,43]. Since the Himalayan region is characterized with all such climatic and topographic features, the inferior performance of satellite-based TRMM precipitation estimates over the study region may be attributed to the limited retrieval ability of existing passive microwave sensors and algorithms used to convert microwave signals into precipitation estimates.
Later, the gap was reduced to an acceptable extent on applying a correction method for removal of bias. The results suggest that the direct use of TRMM estimates for analysis of temporal patterns may produce misleading conclusions. Additionally, raw precipitation estimates from TRMM may not useful for hydrological studies especially for catchments falling in the Himalayan region. However, the performance of TRMM estimates can be fairly improved by applying an adequate bias correction approach, making them useful for various hydro-meteorological analyses in the region. The ability of TRMM to capture spatially variability of precipitation over UGB is also examined using various statistical indicators. In accordance with the results obtained from temporal analysis, TRMM is found to be fairly capable in capturing spatial distribution of rainfall during post-monsoon and winter seasons. On the other hand, limited efficiency of TRMM for the monsoon season is also reflected in terms of representing spatial variations. Bias correction, however, has satisfactorily enhanced the spatial distribution of rainfall obtained from TRMM for almost all the seasons except for monsoon. Only a slight improvement is obtained for monsoon season post bias correction compared to the other seasons.
In summary, raw TRMM precipitation estimates are subjected to non-uniform bias and inadequate representation of spatial variability in precipitation compared to in-situ measurement in the UGB. The application of the dataset for hydrologic studies in the region requires rigorous evaluation against ground based measurements. Biases can be effectively removed using QM based bias correction techniques. For regions having seasonal precipitation patterns, the QM approach is found particularly efficient when applied separately to each individual season. In this approach, satellite based estimates from TRMM gets replicated on IMD precipitation records, thus reducing the gaps between the two datasets. Accordingly, bias corrected TRMM precipitation dataset can be used for various climate analyses and hydrological water balance based studies in the UGB.
6. Conclusions
Developing countries like India experience the problem of relatively sparse and uneven distribution of rain gauge networks. The problem further aggregates in Himalayan region owing to its highly uneven topography and extreme slopes. In such scenarios, it becomes difficult to analyze spatial and temporal variability of rainfall and examine the overall water balance in the region. Remotely sensed rainfall estimation has proved to be a potential alternative to ground based rainfall measurement as satellite based rainfall measurements has vast spatial and temporal coverage. Tropical Rainfall Measuring Mission (TRMM) is one such mission which provides remotely sensed datasets of precipitation and has been widely used in the literature for various hydrometeorology studies. The present study evaluates monthly rainfall datasets of TRMM precipitation against station based rainfall measurements in the UGB. The adequacy of TRMM precipitation for its use in further hydrological studies in the basin is examined on different spatial and temporal scales.
In the first step, TRMM daily rainfall is resampled to IMD grid points to maintain spatial homogeneity using the spline interpolation technique. In comparison of CDF of TRMM and IMD precipitation, positive bias was evident from CDF plot for low and medium magnitude precipitation, however, the precipitation corresponding to a given CDF value in high precipitation range is higher in the case of IMD than that in TRMM. The monthly precipitation estimates are also compared for four different seasons viz. pre-monsoon, monsoon, post-monsoon and winter. In the analysis, TRMM precipitation in the monsoon season are found to be negatively biased, whereas, systematic positive bias is present in the post-monsoon season. Subsequently, bias correction is applied separately for each season. The performance of TRMM precipitation has fairly improved on applying bias correction, however, not consistent through various seasons and regions. The gap between TRMM and IMD precipitation has significantly reduced for pre-monsoon, post-monsoon and winter seasons, whereas, marginal change is evident for the monsoon season. Moreover, discrepancy in precipitation estimates also varyies spatially where performance of TRMM precipitation estimates is poor for grid points located in northern and eastern regions. Considering these results, use of raw TRMM precipitation for hydrological studies in UGB may result in erroneous conclusions. However, adequate estimates of precipitation can be obtained by applying bias correction to the TRMM dataset using methodology proposed in the study.
Author Contributions
In this research work, data collection, analysis and manuscript preparation were carried out by A.K.S. and L.P. under the joint supervision of C.S.P.O., D.F. and R.P.S. Their expert advice and review helped improve the paper.
Funding
This research received no external funding.
Acknowledgments
The Authors are thankful to the India Meteorological Department (IMD), Ministry of Earth Sciences, Government of India for providing the gauge-based rainfall data used for validation purposes. The satellite data used in this study were acquired as part of the activities of NASA’s Science Mission Directorate, and are archived and distributed by the Goddard Earth Sciences (GES) Data and Information Services Center (DISC). We are highly grateful towards GES DISC, NASA.
Conflicts of Interest
The authors declare no conflict of interest.
References
- Petty, G.W. The status of satellite-based rainfall estimation over land. Remote Sens. Environ. 1995, 51, 125–137. [Google Scholar] [CrossRef]
- National Center for Atmospheric Research (NCAR) Staff (Ed.) The Climate Data Guide: Precipitation Data Sets: Overview & Comparison Table; A Community Resource by Climate and Global Dynamics Laboratory; NCAR: Boulder, CO, USA, 2014; Available online: https://climatedataguide.ucar.edu/climate-data/precipitation-data-sets-overview-comparison-table (accessed on 20 January 2019).
- Kidd, C. Satellite rainfall climatology: A review. Int. J. Climatol. 2001, 21, 1041–1066. [Google Scholar] [CrossRef]
- Villarini, G.; Mandapaka, P.V.; Krajewski, W.F.; Moore, R.J. Rainfall and sampling uncertainties: A rain gauge perspective. J. Geophys. Res. Atmos. 2008, 113. [Google Scholar] [CrossRef] [Green Version]
- Fenta, A.A. Assessing Diurnal Variability of Rainfall: A Remote Sensing Based Approach; University of Twente Faculty of Geo-Information and Earth Observation (ITC): Enschede, The Netherlands, 2010. [Google Scholar]
- Bookhagen, B.; Burbank, D.W. Topography, relief, and TRMM-derived rainfall variations along the Himalaya. Geophys. Res. Lett. 2006, 33, L08405. [Google Scholar] [CrossRef]
- Bookhagen, B.; Burbank, D.W. Toward a complete Himalayan hydrological budget: Spatiotemporal distribution of snowmelt and rainfall and their impact on river discharge. J. Geophys. Res. Earth Surf. 2010, 115, F03019. [Google Scholar] [CrossRef]
- Mitra, A.K.; Bohra, A.K.; Rajeevan, M.N.; Krishnamurti, T.N. Daily Indian precipitation analysis formed from a merge of rain-gauge data with the TRMM TMPA satellite-derived rainfall estimates. J. Meteorol. Soc. Jpn. Ser. II 2009, 87, 265–279. [Google Scholar] [CrossRef]
- Mitra, A.K.; Momin, I.M.; Rajagopal, E.N.; Basu, S.; Rajeevan, M.N.; Krishnamurti, T.N. Gridded daily Indian monsoon rainfall for 14 seasons: Merged TRMM and IMD gauge analyzed values. J. Earth Syst. Sci. 2013, 122, 1173–1182. [Google Scholar] [CrossRef]
- Chen, S.; Hong, Y.; Cao, Q.; Gourley, J.J.; Kirstetter, P.E.; Yong, B.; Tian, Y.; Zhang, Z.; Shen, Y.; Hu, J.; et al. Similarity and difference of the two successive V6 and V7 TRMM multisatellite precipitation analysis performance over China. J. Geophys. Res. Atmos. 2013, 118, 13060–13074. [Google Scholar] [CrossRef]
- Prakash, S.; Mitra, A.K.; AghaKouchak, A.; Pai, D.S. Error characterization of TRMM Multisatellite Precipitation Analysis (TMPA-3B42) products over India for different seasons. J. Hydrol. 2015, 529, 1302–1312. [Google Scholar] [CrossRef]
- Prakash, S.; Mitra, A.K.; Rajagopal, E.N.; Pai, D.S. Assessment of TRMM-based TMPA-3B42 and GSMaP precipitation products over India for the peak southwest monsoon season. Int. J. Climatol. 2016, 36, 1614–1631. [Google Scholar] [CrossRef]
- Shukla, A.K.; Shukla, S.; Ojha, R. Geospatial Technologies for Rainfall and Atmospheric Water Vapor Measurement over Arid Regions of India. In Sustainable Water Resources Management; American Society of Civil Engineers: Reston, VA, USA, 2017; pp. 263–292. [Google Scholar] [CrossRef]
- Schouppe, M.; Ghazi, A. European Commission Research for Global Climate Change Studies: Towards Improved Water Observations and Forecasting Capability. In Measuring Precipitation from Space; Springer: Dordrecht, The Netherlands, 2007; pp. 3–6. [Google Scholar]
- Ymeti, I. Rainfall Estimation by Remote Sensing for Conceptual Rainfall-Runoff Modeling in the Upper Blue Nile Basin; ITC: Enschede, The Netherlands, 2007. [Google Scholar]
- Seed, A.; Austin, G.L. Variability of summer Florida rainfall and its significance for the estimation of rainfall by gages, radar, and satellite. J. Geophys. Res. Atmos. 1990, 95, 2207–2215. [Google Scholar] [CrossRef]
- Michaelides, S.; Levizzani, V.; Anagnostou, E.; Bauer, P.; Kasparis, T.; Lane, J.E. Precipitation: Measurement, remote sensing, climatology and modeling. Atmos. Res. 2009, 94, 512–533. [Google Scholar] [CrossRef]
- Collischonn, B.; Collischonn, W.; Tucci, C.E.M. Daily hydrological modeling in the Amazon basin using TRMM rainfall estimates. J. Hydrol. 2008, 360, 207–216. [Google Scholar] [CrossRef]
- Haberlandt, U.; Kite, G.W. Estimation of daily space–time precipitation series for macroscale hydrological modelling. Hydrol. Process. 1998, 12, 1419–1432. [Google Scholar] [CrossRef]
- Li, X.H.; Zhang, Q.; Xu, C.Y. Suitability of the TRMM satellite rainfalls in driving a distributed hydrological model for water balance computations in Xinjiang catchment, Poyang lake basin. J. Hydrol. 2012, 426, 28–38. [Google Scholar] [CrossRef]
- Bindlish, R.; Jackson, T.J.; Wood, E.; Gao, H.; Starks, P.; Bosch, D.; Lakshmi, V. Soil moisture estimates from TRMM Microwave Imager observations over the Southern United States. Remote Sens. Environ. 2003, 85, 507–515. [Google Scholar] [CrossRef]
- Lee, K.H.; Anagnostou, E.N. A combined passive/active microwave remote sensing approach for surface variable retrieval using Tropical Rainfall Measuring Mission observations. Remote Sens. Environ. 2004, 92, 112–125. [Google Scholar] [CrossRef]
- Islam, M.N.; Uyeda, H. Use of TRMM in determining the climatic characteristics of rainfall over Bangladesh. Remote Sens. Environ. 2007, 108, 264–276. [Google Scholar] [CrossRef]
- Krajewski, W.F.; Smith, J.A. Radar hydrology: Rainfall estimation. Adv. Water Resour. 2002, 25, 1387–1394. [Google Scholar] [CrossRef]
- Anagnostou, E.N. Overview of overland satellite rainfall estimation for hydro-meteorological applications. Surv. Geophys. 2004, 25, 511–537. [Google Scholar] [CrossRef]
- Ciach, G.J.; Krajewski, W.F.; Anagnostou, E.N.; Baeck, M.L.; Smith, J.A.; McCollum, J.R.; Kruger, A. Radar rainfall estimation for ground validation studies of the Tropical Rainfall Measuring Mission. J. Appl. Meteorol. 1997, 36, 735–747. [Google Scholar] [CrossRef]
- Diro, G.T.; Grimes, D.I.F.; Black, E.; O’Neill, A.; Pardo-Iguzquiza, E. Evaluation of reanalysis rainfall estimates over Ethiopia. Int. J. Climatol. 2009, 29, 67–78. [Google Scholar] [CrossRef] [Green Version]
- Franchito, S.H.; Rao, V.B.; Vasques, A.C.; Santo, C.M.; Conforte, J.C. Validation of TRMM precipitation radar monthly rainfall estimates over Brazil. J. Geophys. Res. Atmos. 2009, 114. [Google Scholar] [CrossRef] [Green Version]
- Xu, W.; Zipser, E.J. Diurnal variations of precipitation, deep convection, and lightning over and east of the eastern Tibetan Plateau. J. Clim. 2011, 24, 448–465. [Google Scholar] [CrossRef]
- Roy, S.S.; Balling, R.C. Diurnal variations in summertime lightning activity in Tropical Asia. Int. J. Climatol. 2013, 33, 1830–1836. [Google Scholar] [CrossRef] [Green Version]
- Bitew, M.M.; Gebremichael, M. Evaluation of satellite rainfall products through hydrologic simulation in a fully distributed hydrologic model. Water Resour. Res. 2011, 47. [Google Scholar] [CrossRef] [Green Version]
- Duan, Z.; Bastiaanssen, W.G.M. First results from Version 7 TRMM 3B43 precipitation product in combination with a new downscaling–calibration procedure. Remote Sens. Environ. 2013, 131, 1–13. [Google Scholar] [CrossRef]
- Hunink, J.E.; Immerzeel, W.W.; Droogers, P. A High-resolution Precipitation 2-step mapping Procedure (HiP2P): Development and application to a tropical mountainous area. Remote Sens. Environ. 2014, 140, 179–188. [Google Scholar] [CrossRef]
- Javanmard, S.; Yatagai, A.; Nodzu, M.I.; BodaghJamali, J.; Kawamoto, H. Comparing high-resolution gridded precipitation data with satellite rainfall estimates of TRMM_3B42 over Iran. Adv. Geosci. 2010, 25, 119–125. [Google Scholar] [CrossRef] [Green Version]
- Nesbitt, S.W.; Anders, A.M. Very high resolution precipitation climatologies from the Tropical Rainfall Measuring Mission precipitation radar. Geophys. Res. Lett. 2009, 36. [Google Scholar] [CrossRef] [Green Version]
- Ojo, J.S.; Omotosho, T.V. Comparison of 1-min rain rate derived from TRMM satellite data and raingauge data for microwave applications in Nigeria. J. Atmos. Sol.-Terr. Phys. 2013, 102, 17–25. [Google Scholar] [CrossRef]
- Shukla, A.K.; Ojha, C.S.P.; Garg, R.D.; Singh, R.P. Calibration of TRMM rainfall climatology over Uttarakhand State, India during 1998–2012. In Proceedings of the 2016 IEEE International Geoscience and Remote Sensing Symposium (IGARSS), Beijing, China, 10–15 July 2016; pp. 609–612. [Google Scholar] [CrossRef]
- Tian, Y.; Peters-Lidard, C.D.; Choudhury, B.J.; Garcia, M. Multitemporal analysis of TRMM-based satellite precipitation products for land data assimilation applications. J. Hydrometeorol. 2007, 8, 1165–1183. [Google Scholar] [CrossRef]
- Mahmud, M.R. Run-off Modeling and Mapping Using Rainfall and Evapotranspiration Estimates from Remote Sensing Satellite Data in Peninsular Malaysia; Universiti Teknologi Malaysia: Johor Bharu, Malaysia, 2011. [Google Scholar]
- AghaKouchak, A.; Behrangi, A.; Sorooshian, S.; Hsu, K.; Amitai, E. Evaluation of satellite-retrieved extreme precipitation rates across the central United States. J. Geophys. Res. Atmos. 2011, 116. [Google Scholar] [CrossRef]
- Gebregiorgis, A.S.; Hossain, F. Understanding the dependence of satellite rainfall uncertainty on topography and climate for hydrologic model simulation. IEEE Trans. Geosci. Remote Sens. 2013, 51, 704–718. [Google Scholar] [CrossRef]
- Dinku, T.; Connor, S.J.; Ceccato, P. Comparison of CMORPH and TRMM-3B42 over mountainous regions of Africa and South America. In Satellite Rainfall Applications for Surface Hydrology; Springer: Dordrecht, The Netherlands, 2010; pp. 193–204. [Google Scholar]
- Shige, S.; Kida, S.; Ashiwake, H.; Kubota, T.; Aonashi, K. Improvement of TMI rain retrievals in mountainous areas. J. Appl. Meteorol. Climatol. 2013, 52, 242–254. [Google Scholar] [CrossRef]
- Anders, A.M.; Roe, G.H.; Hallet, B.; Montgomery, D.R.; Finnegan, N.J.; Putkonen, J. Spatial patterns of precipitation and topography in the Himalaya. Spec. Pap.-Geol. Soc. Am. 2006, 398, 39–53. [Google Scholar]
- Condom, T.; Rau, P.; Espinoza, J.C. Correction of TRMM 3B43 monthly precipitation data over the mountainous areas of Peru during the period 1998–2007. Hydrol. Process. 2011, 25, 1924–1933. [Google Scholar] [CrossRef]
- Shukla, A.K.; Ojha, C.S.P.; Garg, R.D. Satellite-based estimation and validation of monthly rainfall distribution over Upper Ganga river basin. Int. Arch. Photogramm. Remote Sens. Spat. Inf. Sci. 2014, 40, 399. [Google Scholar] [CrossRef]
- Yong, B.; Ren, L.L.; Hong, Y.; Wang, J.H.; Gourley, J.J.; Jiang, S.H.; Chen, X.; Wang, W. Hydrologic evaluation of Multisatellite Precipitation Analysis standard precipitation products in basins beyond its inclined latitude band: A case study in Laohahe basin, China. Water Resour. Res. 2010, 46. [Google Scholar] [CrossRef] [Green Version]
- Chen, F.; Li, X. Evaluation of IMERG and TRMM 3B43 monthly precipitation products over mainland China. Remote Sens. 2016, 8, 472. [Google Scholar] [CrossRef]
- Ma, Y.; Tang, G.; Long, D.; Yong, B.; Zhong, L.; Wan, W.; Hong, Y. Similarity and error intercomparison of the GPM and its predecessor-TRMM Multisatellite Precipitation Analysis using the best available hourly gauge network over the Tibetan Plateau. Remote Sens. 2016, 8, 569. [Google Scholar] [CrossRef]
- Tang, G.; Ma, Y.; Long, D.; Zhong, L.; Hong, Y. Evaluation of GPM Day-1 IMERG and TMPA Version-7 legacy products over Mainland China at multiple spatiotemporal scales. J. Hydrol. 2016, 533, 152–167. [Google Scholar] [CrossRef]
- Tang, G.; Zeng, Z.; Long, D.; Guo, X.; Yong, B.; Zhang, W.; Hong, Y. Statistical and hydrological comparisons between TRMM and GPM level-3 products over a midlatitude basin: Is day-1 IMERG a good successor for TMPA 3B42V7? J. Hydrometeorol. 2016, 17, 121–137. [Google Scholar] [CrossRef]
- Guo, H.; Chen, S.; Bao, A.; Behrangi, A.; Hong, Y.; Ndayisaba, F.; Hu, J.; Stepanian, P.M. Early assessment of integrated multi-satellite retrievals for global precipitation measurement over China. Atmos. Res. 2016, 176, 121–133. [Google Scholar] [CrossRef]
- Kim, K.; Park, J.; Baik, J.; Choi, M. Evaluation of topographical and seasonal feature using GPM IMERG and TRMM 3B42 over Far-East Asia. Atmos. Res. 2017, 187, 95–105. [Google Scholar] [CrossRef]
- Prakash, S.; Mitra, A.K.; Pai, D.S.; AghaKouchak, A. From TRMM to GPM: How well can heavy rainfall be detected from space? Adv. Water Resour. 2016, 88, 1–7. [Google Scholar] [CrossRef]
- Sharifi, E.; Steinacker, R.; Saghafian, B. Assessment of GPM-IMERG and other precipitation products against gauge data under different topographic and climatic conditions in Iran: Preliminary results. Remote Sens. 2016, 8, 135. [Google Scholar] [CrossRef]
- Nair, S.; Srinivasan, G.; Nemani, R. Evaluation of multi-satellite TRMM derived rainfall estimates over a western state of India. J. Meteorol. Soc. Jpn. Ser. II 2009, 87, 927–939. [Google Scholar] [CrossRef]
- Wu, L.; Zhai, P. Validation of daily precipitation from two high-resolution satellite precipitation datasets over the Tibetan Plateau and the regions to its east. Acta Meteorol. Sin. 2012, 26, 735–745. [Google Scholar] [CrossRef]
- Rahman, M.M.; Arya, D.S.; Goel, N.K.; Mitra, A.K. Rainfall statistics evaluation of ECMWF model and TRMM data over Bangladesh for flood related studies. Meteorol. Appl. 2012, 19, 501–512. [Google Scholar] [CrossRef]
- Roy, S.S.; Saha, S.B.; Fatima, H.; Bhowmik, S.R.; Kundu, P.K. Evaluation of short-period rainfall estimates from Kalpana-1 satellite using MET software. J. Earth Syst. Sci. 2012, 121, 1113–1123. [Google Scholar] [CrossRef]
- Guo, J.; Zhai, P.; Wu, L.; Cribb, M.; Li, Z.; Ma, Z.; Wang, F.; Chu, D.; Wang, P.; Zhang, J. Diurnal variation and the influential factors of precipitation from surface and satellite measurements in Tibet. Int. J. Climatol. 2014, 34, 2940–2956. [Google Scholar] [CrossRef]
- Müller, M.F.; Thompson, S.E. Bias adjustment of satellite rainfall data through stochastic modeling: Methods development and application to Nepal. Adv. Water Resour. 2013, 60, 121–134. [Google Scholar] [CrossRef] [Green Version]
- Uma, R.; Kumar, T.L.; Narayanan, M.S.; Rajeevan, M.; Bhate, J.; Kumar, K.N. Large scale features and assessment of spatial scale correspondence between TMPA and IMD rainfall datasets over Indian landmass. J. Earth Syst. Sci. 2013, 122, 573–588. [Google Scholar] [CrossRef] [Green Version]
- Xue, X.; Hong, Y.; Limaye, A.S.; Gourley, J.J.; Huffman, G.J.; Khan, S.I.; Dorji, C.; Chen, S. Statistical and hydrological evaluation of TRMM-based Multi-satellite Precipitation Analysis over the Wangchu Basin of Bhutan: Are the latest satellite precipitation products 3B42V7 ready for use in ungauged basins? J. Hydrol. 2013, 499, 91–99. [Google Scholar] [CrossRef]
- Bharti, V.; Singh, C. Evaluation of error in TRMM 3B42V7 precipitation estimates over the Himalayan region. J. Geophys. Res. Atmos. 2015, 120, 12458–12473. [Google Scholar] [CrossRef]
- Kneis, D.; Chatterjee, C.; Singh, R. Evaluation of TRMM rainfall estimates over a large Indian river basin (Mahanadi). Hydrol. Earth Syst. Sci. 2014, 18, 2493–2502. [Google Scholar] [CrossRef] [Green Version]
- Stampoulis, D.; Anagnostou, E.N. Evaluation of global satellite rainfall products over continental Europe. J. Hydrometeorol. 2012, 13, 588–603. [Google Scholar] [CrossRef]
- Su, F.; Hong, Y.; Lettenmaier, D.P. Evaluation of TRMM Multisatellite Precipitation Analysis (TMPA) and its utility in hydrologic prediction in the La Plata Basin. J. Hydrometeorol. 2008, 9, 622–640. [Google Scholar] [CrossRef]
- Krishnamurti, T.N.; Mishra, A.K.; Simon, A.; Yatagai, A. Use of a dense rain-gauge network over India for improving blended TRMM products and downscaled weather models. J. Meteorol. Soc. Jpn. Ser. II 2009, 87, 393–412. [Google Scholar] [CrossRef]
- Boushaki, F.I.; Hsu, K.L.; Sorooshian, S.; Park, G.H.; Mahani, S.; Shi, W. Bias adjustment of satellite precipitation estimation using ground-based measurement: A case study evaluation over the southwestern United States. J. Hydrometeorol. 2009, 10, 1231–1242. [Google Scholar] [CrossRef]
- Lin, A.; Wang, X.L. An algorithm for blending multiple satellite precipitation estimates with in situ precipitation measurements in Canada. J. Geophys. Res. Atmos. 2011, 116. [Google Scholar] [CrossRef] [Green Version]
- Teutschbein, C.; Seibert, J. Is bias correction of regional climate model (RCM) simulations possible for non-stationary conditions? Hydrol. Earth Syst. Sci. 2013, 17, 5061–5077. [Google Scholar] [CrossRef] [Green Version]
- Ajaaj, A.A.; Mishra, A.K.; Khan, A.A. Comparison of BIAS correction techniques for GPCC rainfall data in semi-arid climate. Stoch. Environ. Res. Risk Assess. 2016, 30, 1659–1675. [Google Scholar] [CrossRef]
- Leander, R.; Buishand, T.A.; van den Hurk, B.J.; de Wit, M.J. Estimated changes in flood quantiles of the river Meuse from resampling of regional climate model output. J. Hydrol. 2008, 351, 331–343. [Google Scholar] [CrossRef]
- Wood, A.W.; Leung, L.R.; Sridhar, V.; Lettenmaier, D.P. Hydrologic implications of dynamical and statistical approaches to downscaling climate model outputs. Clim. Chang. 2004, 62, 189–216. [Google Scholar] [CrossRef]
- Sun, F.; Roderick, M.L.; Lim, W.H.; Farquhar, G.D. Hydroclimatic projections for the Murray-Darling Basin based on an ensemble derived from Intergovernmental Panel on Climate Change AR4 climate models. Water Resour. Res. 2011, 47. [Google Scholar] [CrossRef] [Green Version]
- Themeßl, V.; Rojas, R.; Zambrano-Bigiarini, M.; Levizzani, V.; De Roo, A. Validation of satellite-based precipitation products over sparsely gauged African river basins. J. Hydrometeorol. 2012, 13, 1760–1783. [Google Scholar] [CrossRef]
- Bennett, J.C.; Grose, M.R.; Corney, S.P.; White, C.J.; Holz, G.K.; Katzfey, J.J.; Post, D.A.; Bindoff, N.L. Performance of an empirical bias-correction of a high-resolution climate dataset. Int. J. Climatol. 2014, 34, 2189–2204. [Google Scholar] [CrossRef]
- Yang, Z.; Hsu, K.; Sorooshian, S.; Xu, X.; Braithwaite, D.; Verbist, K.M. Bias adjustment of satellite-based precipitation estimation using gauge observations: A case study in Chile. J. Geophys. Res. Atmos. 2016, 121, 3790–3806. [Google Scholar] [CrossRef]
- Chen, J.; Brissette, F.P.; Chaumont, D.; Braun, M. Finding appropriate bias correction methods in downscaling precipitation for hydrologic impact studies over North America. Water Resour. Res. 2013, 49, 4187–4205. [Google Scholar] [CrossRef] [Green Version]
- Piani, C.; Weedon, G.P.; Best, M.; Gomes, S.M.; Viterbo, P.; Hagemann, S.; Haerter, J.O. Statistical bias correction of global simulated daily precipitation and temperature for the application of hydrological models. J. Hydrol. 2010, 395, 199–215. [Google Scholar] [CrossRef]
- Thiemig, V.; Rojas, R.; Zambrano-Bigiarini, M.; De Roo, A. Hydrological evaluation of satellite-based rainfall estimates over the Volta and Baro-Akobo Basin. J. Hydrol. 2013, 499, 324–338. [Google Scholar] [CrossRef]
- Xie, P.; Xiong, A.Y. A conceptual model for constructing high-resolution gauge-satellite merged precipitation analyses. J. Geophys. Res. Atmos. 2011, 116. [Google Scholar] [CrossRef] [Green Version]
- Sheffield, J.; Wood, E.F.; Chaney, N.; Guan, K.; Sadri, S.; Yuan, X.; Olang, L.; Amani, A.; Ali, A.; Demuth, S.; et al. A drought monitoring and forecasting system for sub-Sahara African water resources and food security. Bull. Am. Meteorol. Soc. 2014, 95, 861–882. [Google Scholar] [CrossRef]
- Shen, Y.; Zhao, P.; Pan, Y.; Yu, J. A high spatiotemporal gauge-satellite merged precipitation analysis over China. J. Geophys. Res. Atmos. 2014, 119, 3063–3075. [Google Scholar] [CrossRef] [Green Version]
- Zhang, X.; Tang, Q. Combining satellite precipitation and long-term ground observations for hydrological monitoring in China. J. Geophys. Res. Atmos. 2015, 120, 6426–6443. [Google Scholar] [CrossRef] [Green Version]
- State of Environment (SoE) Report. 2012. Available online: http://www.ucost.in/document/publication/books/env-books.pdf (accessed on 24 January 2019).
- Rajeevan, M.; Bhate, J.; Kale, J.D.; Lal, B. High resolution daily gridded rainfall data for the Indian region: Analysis of break and active. Curr. Sci. 2006, 91, 296–306. [Google Scholar]
- Pai, D.S.; Sridhar, L.; Rajeevan, M.; Sreejith, O.P.; Satbhai, N.S.; Mukhopadhyay, B. Development of a new high spatial resolution (0.25 × 0.25) long period (1901–2010) daily gridded rainfall data set over India and its comparison with existing data sets over the region. Mausam 2014, 65, 1–18. [Google Scholar]
- Huffman, G.J.; Bolvin, D.T.; Nelkin, E.J.; Wolff, D.B.; Adler, R.F.; Gu, G.; Hong, Y.; Bowman, K.P.; Stocker, E.F. The TRMM multisatellite precipitation analysis (TMPA): Quasi-global, multiyear, combined-sensor precipitation estimates at fine scales. J. Hydrometeorol. 2007, 8, 38–55. [Google Scholar] [CrossRef]
- Huffman, G.J.; Adler, R.F.; Bolvin, D.T.; Nelkin, E.J. The TRMM Multi-satellite Precipitation Analysis (TMPA). In Satellite Rainfall Applications for Surface Hydrology; Hossain, F., Gebremichael, M., Eds.; Springer: Dordrecht, The Netherlands, 2010. [Google Scholar]
- Schneider, U.; Becker, A.; Finger, P.; Meyer-Christoffer, A.; Ziese, M.; Rudolf, B. GPCC’s new land surface precipitation climatology based on quality-controlled in situ data and its role in quantifying the global water cycle. Theor. Appl. Climatol. 2014, 115, 15–40. [Google Scholar] [CrossRef]
- Panofsky, H.A.; Brier, G.W. Some Applications of Statistics to Meteorology; Pennsylvania State University: State College, PA, USA, 1958; pp. 114–116. [Google Scholar]
- Fowler, H.J.; Blenkinsop, S.; Tebaldi, C. Linking climate change modelling to impacts studies: Recent advances in downscaling techniques for hydrological modelling. Int. J. Climatol. 2007, 27, 1547–1578. [Google Scholar] [CrossRef]
- Cayan, D.R.; Maurer, E.P.; Dettinger, M.D.; Tyree, M.; Hayhoe, K. Climate change scenarios for the California region. Clim. Chang. 2008, 87, 21–42. [Google Scholar] [CrossRef]
- Maurer, E.P.; Hidalgo, H.G. Utility of daily vs. monthly large-scale climate data: An intercomparison of two statistical downscaling methods. Hydrol. Earth Syst. Sci. 2008, 12, 551–563. [Google Scholar] [CrossRef]
- Li, H.; Sheffield, J.; Wood, E.F. Bias correction of monthly precipitation and temperature fields from Intergovernmental Panel on Climate Change AR4 models using equidistant quantile matching. J. Geophys. Res. Atmos. 2010, 115. [Google Scholar] [CrossRef] [Green Version]
- Li, L.; Hong, Y.; Wang, J.; Adler, R.F.; Policelli, F.S.; Habib, S.; Irwin, D.; Korme, T.; Okello, L. Evaluation of the real-time TRMM-based multi-satellite precipitation analysis for an operational flood prediction system in Nzoia Basin, Lake Victoria, Africa. Nat. Hazards 2009, 50, 109–123. [Google Scholar] [CrossRef]
- Hashemi, H.; Nordin, M.; Lakshmi, V.; Huffman, G.J.; Knight, R. Bias correction of long-term satellite monthly precipitation product (TRMM 3B43) over the conterminous United States. J. Hydrometeorol. 2017, 18, 2491–2509. [Google Scholar] [CrossRef]
- Jamandre, C.A.; Narisma, G.T. Spatio-temporal validation of satellite-based rainfall estimates in the Philippines. Atmos. Res. 2013, 122, 599–608. [Google Scholar] [CrossRef]
- Chen, Y.; Ebert, E.E.; Walsh, K.J.; Davidson, N.E. Evaluation of TRMM 3B42 precipitation estimates of tropical cyclone rainfall using PACRAIN data. J. Geophys. Res. Atmos. 2013, 118, 2184–2196. [Google Scholar] [CrossRef] [Green Version]
- Xia, T.; Wang, Z.J.; Zheng, H. Topography and data mining based methods for improving satellite precipitation in mountainous areas of China. Atmosphere 2015, 6, 983–1005. [Google Scholar] [CrossRef]
- Sakolnakhon, K. Comparison the Estimate Rainfall from Global Satellite Mapping of Precipitation (GSMaP)to Ground-based Precipitation data over Thailand. In Proceedings of the 1st Joint Project Team Meeting for Sentinel Asia STEP3 (JPTM2013), Grand Millennium Hotel, Bangkok, Thailand, 27–29 September 2013. [Google Scholar]
- Milewski, A.; Elkadiri, R.; Durham, M. Assessment and comparison of TMPA satellite precipitation products in varying climatic and topographic regimes in Morocco. Remote Sens. 2015, 7, 5697–5717. [Google Scholar] [CrossRef]
Figure 1.
Map showing the location of India Meteorological Department (IMD) and Tropical Rainfall Measuring Mission (TRMM) grid points in the Upper Ganga basin.
Figure 1.
Map showing the location of India Meteorological Department (IMD) and Tropical Rainfall Measuring Mission (TRMM) grid points in the Upper Ganga basin.

Figure 2.
Flow chart of the methodology.

Figure 3.
Consistency analysis of rainfall estimated from TRMM with station observed rainfall from IMD through (a) comparison between empirical cumulative distribution functions (CDFs) and (b) scatter plot of monthly rainfall from the two datasets over the Upper Ganga Basin.
Figure 3.
Consistency analysis of rainfall estimated from TRMM with station observed rainfall from IMD through (a) comparison between empirical cumulative distribution functions (CDFs) and (b) scatter plot of monthly rainfall from the two datasets over the Upper Ganga Basin.

Figure 4.
Scatter plot of IMD precipitation against raw TRMM precipitation representing correlation for four seasons (pre-monsoon, monsoon, post-monsoon and winter) in the Upper Ganga basin.
Figure 4.
Scatter plot of IMD precipitation against raw TRMM precipitation representing correlation for four seasons (pre-monsoon, monsoon, post-monsoon and winter) in the Upper Ganga basin.

Figure 5.
Consistency analysis of bias corrected rainfall estimated from TRMM with station observed rainfall from IMD through (a) comparison between empirical CDFs and (b) scatter plot of monthly rainfall from the two datasets over the Upper Ganga Basin.
Figure 5.
Consistency analysis of bias corrected rainfall estimated from TRMM with station observed rainfall from IMD through (a) comparison between empirical CDFs and (b) scatter plot of monthly rainfall from the two datasets over the Upper Ganga Basin.

Figure 6.
Scatter plot of IMD precipitation against bias corrected TRMM precipitation representing correlation for four seasons (pre-monsoon, monsoon, post-monsoon and winter) in the Upper Ganga basin.
Figure 6.
Scatter plot of IMD precipitation against bias corrected TRMM precipitation representing correlation for four seasons (pre-monsoon, monsoon, post-monsoon and winter) in the Upper Ganga basin.

Figure 7.
Comparison of time series of IMD, TRMM and bias corrected TRMM precipitation at Grid-1 (North), Grid-2 (West), Grid-3 (South) and Grid-4 (East) in the Upper Ganga basin.
Figure 7.
Comparison of time series of IMD, TRMM and bias corrected TRMM precipitation at Grid-1 (North), Grid-2 (West), Grid-3 (South) and Grid-4 (East) in the Upper Ganga basin.

Figure 8.
Spatial plot of average annual precipitation obtained from (a) IMD, (b) TRMM and (c) bias corrected TRMM.
Figure 8.
Spatial plot of average annual precipitation obtained from (a) IMD, (b) TRMM and (c) bias corrected TRMM.

Figure 9.
Spatial plot of performance evaluation parameters namely (a) correlation coefficient (r) (b) mean absolute error (MAE) and (c) relative bias (RBIAS), before (left) and after (right) bias correction of TRMM precipitation for the pre-monsoon season.
Figure 9.
Spatial plot of performance evaluation parameters namely (a) correlation coefficient (r) (b) mean absolute error (MAE) and (c) relative bias (RBIAS), before (left) and after (right) bias correction of TRMM precipitation for the pre-monsoon season.

Figure 10.
Spatial plot of performance evaluation parameters namely (a) correlation coefficient (r) (b) MAE and (c) RBIAS, before (left) and after (right) bias correction of TRMM precipitation for the monsoon season.
Figure 10.
Spatial plot of performance evaluation parameters namely (a) correlation coefficient (r) (b) MAE and (c) RBIAS, before (left) and after (right) bias correction of TRMM precipitation for the monsoon season.

Figure 11.
Spatial plot of performance evaluation parameters namely (a) correlation coefficient (r) (b) MAE and (c) RBIAS, before (left) and after (right) bias correction of TRMM precipitation for the post-monsoon season.
Figure 11.
Spatial plot of performance evaluation parameters namely (a) correlation coefficient (r) (b) MAE and (c) RBIAS, before (left) and after (right) bias correction of TRMM precipitation for the post-monsoon season.

Figure 12.
Spatial plot of performance evaluation parameters namely (a) correlation coefficient (r) (b) MAE and (c) RBIAS, before (left) and after (right) bias correction of TRMM precipitation for winter season.
Figure 12.
Spatial plot of performance evaluation parameters namely (a) correlation coefficient (r) (b) MAE and (c) RBIAS, before (left) and after (right) bias correction of TRMM precipitation for winter season.


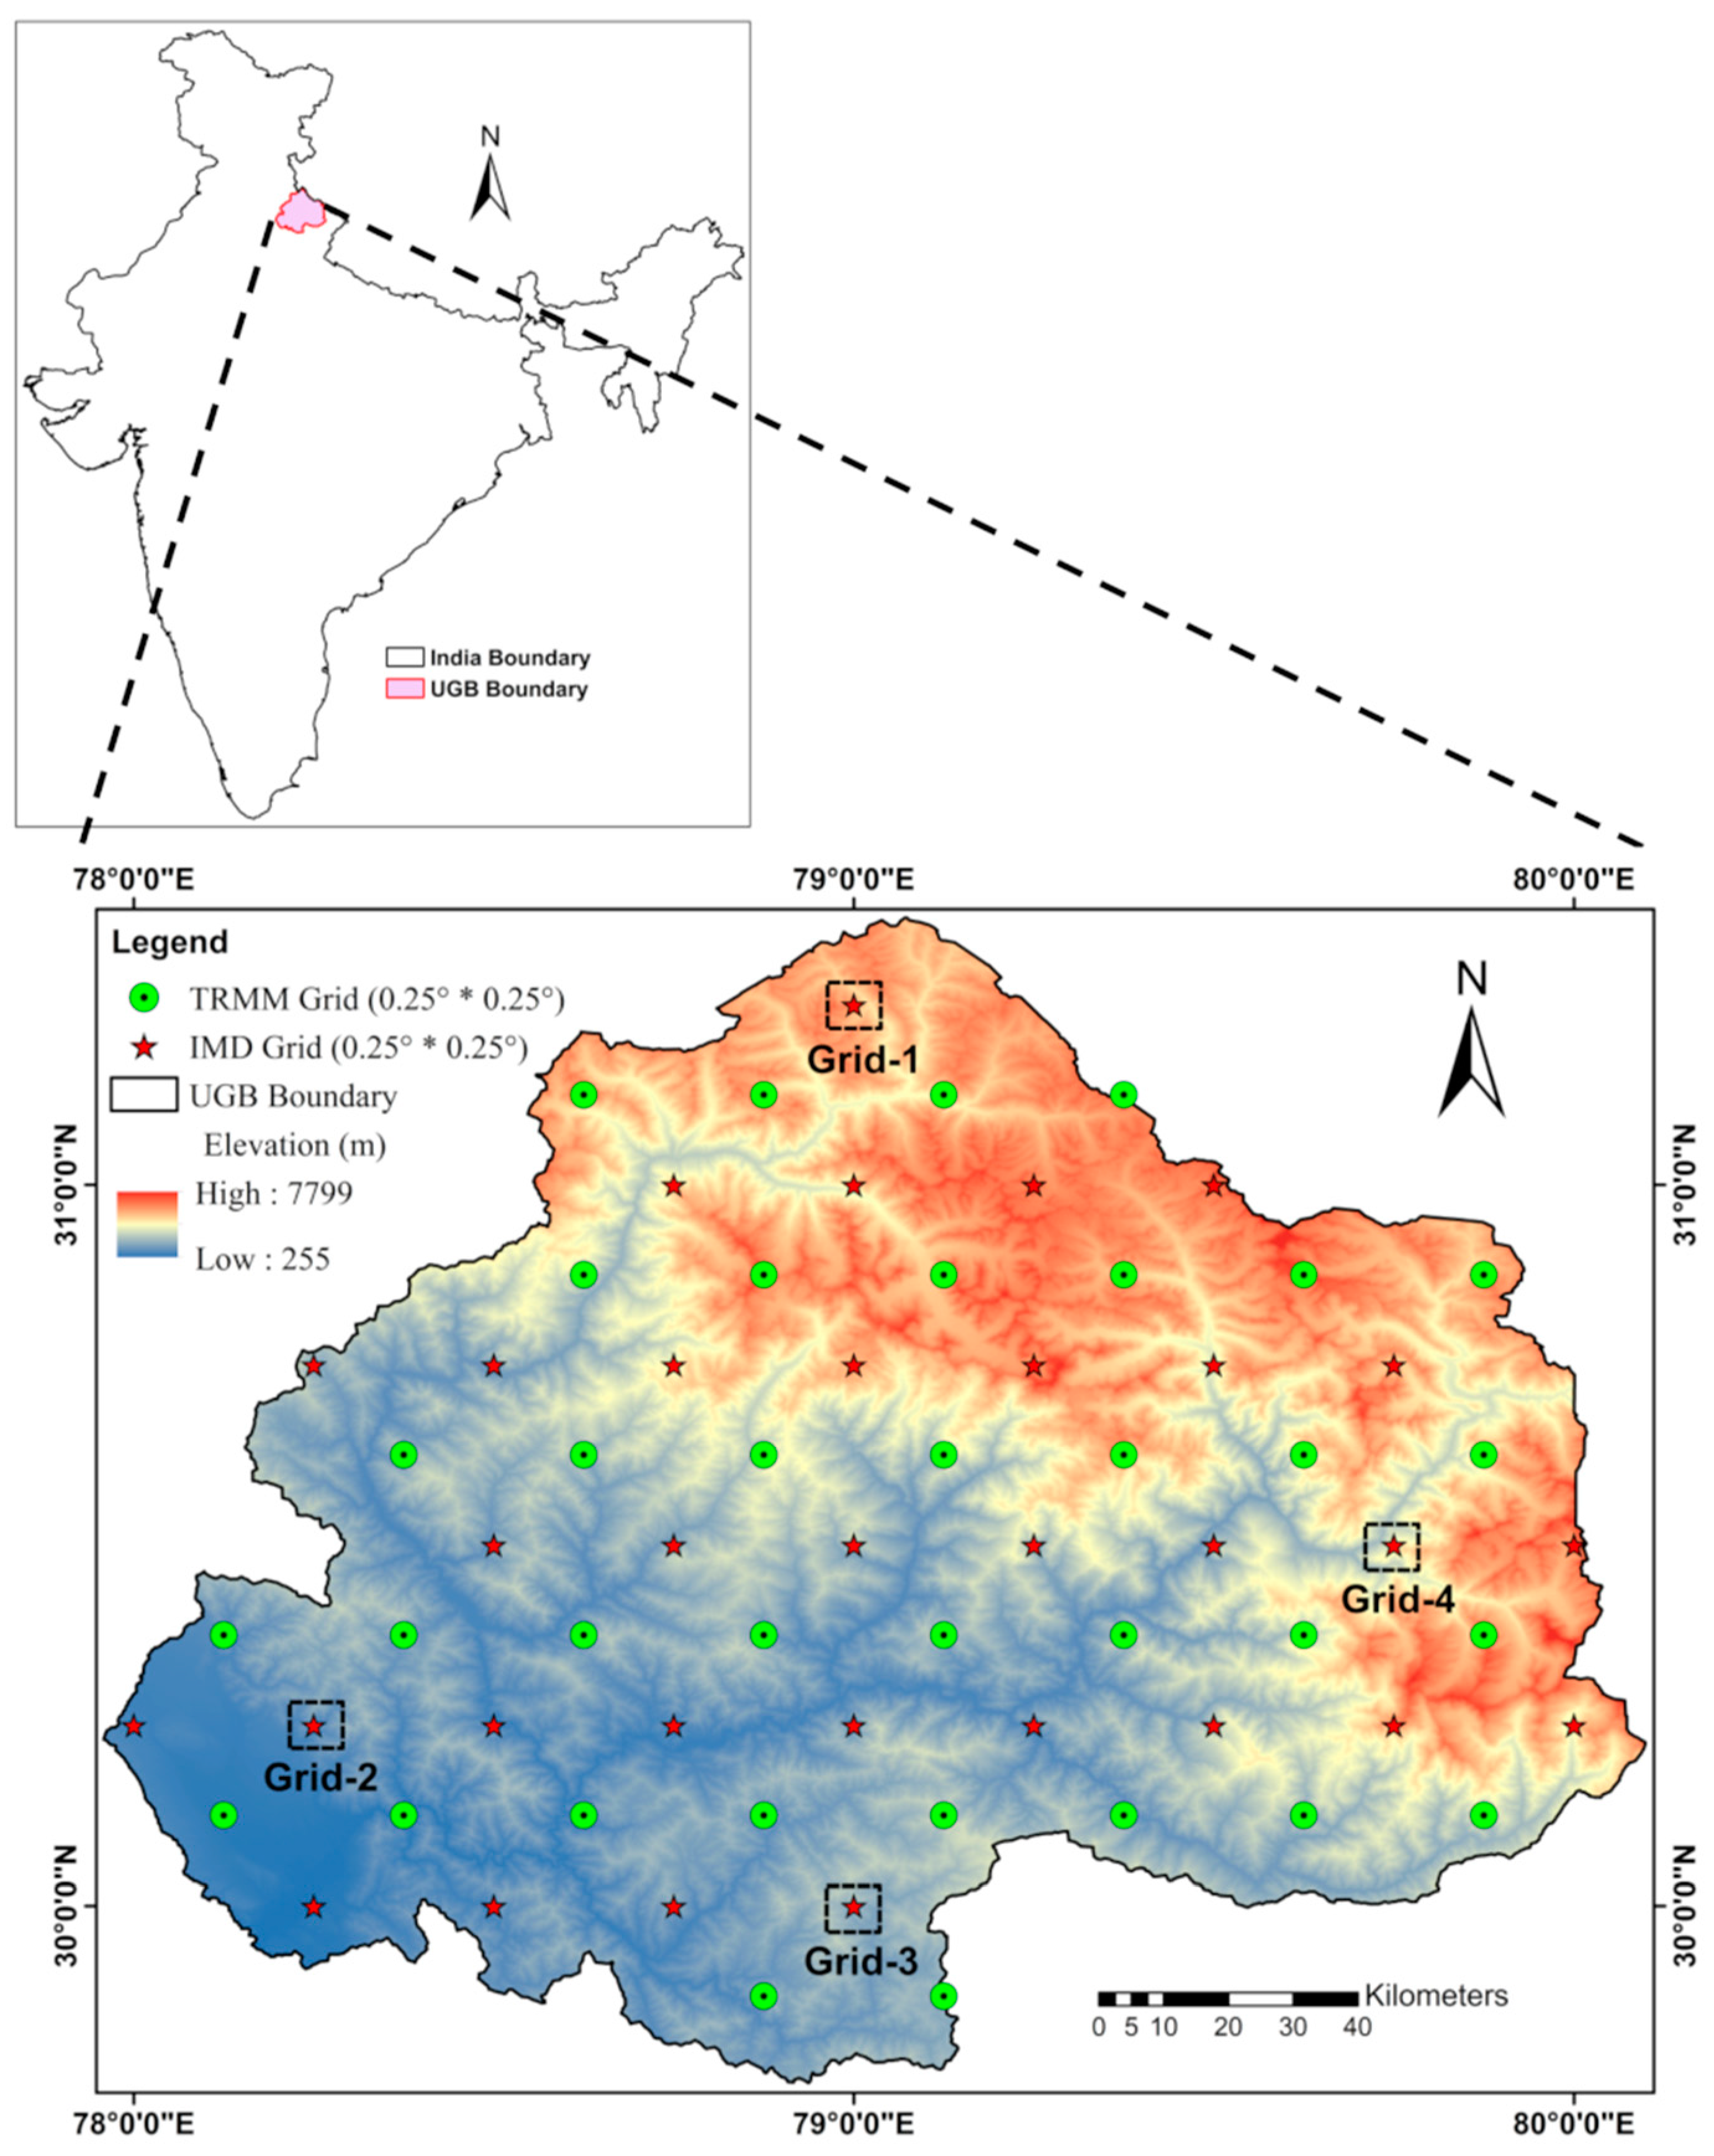
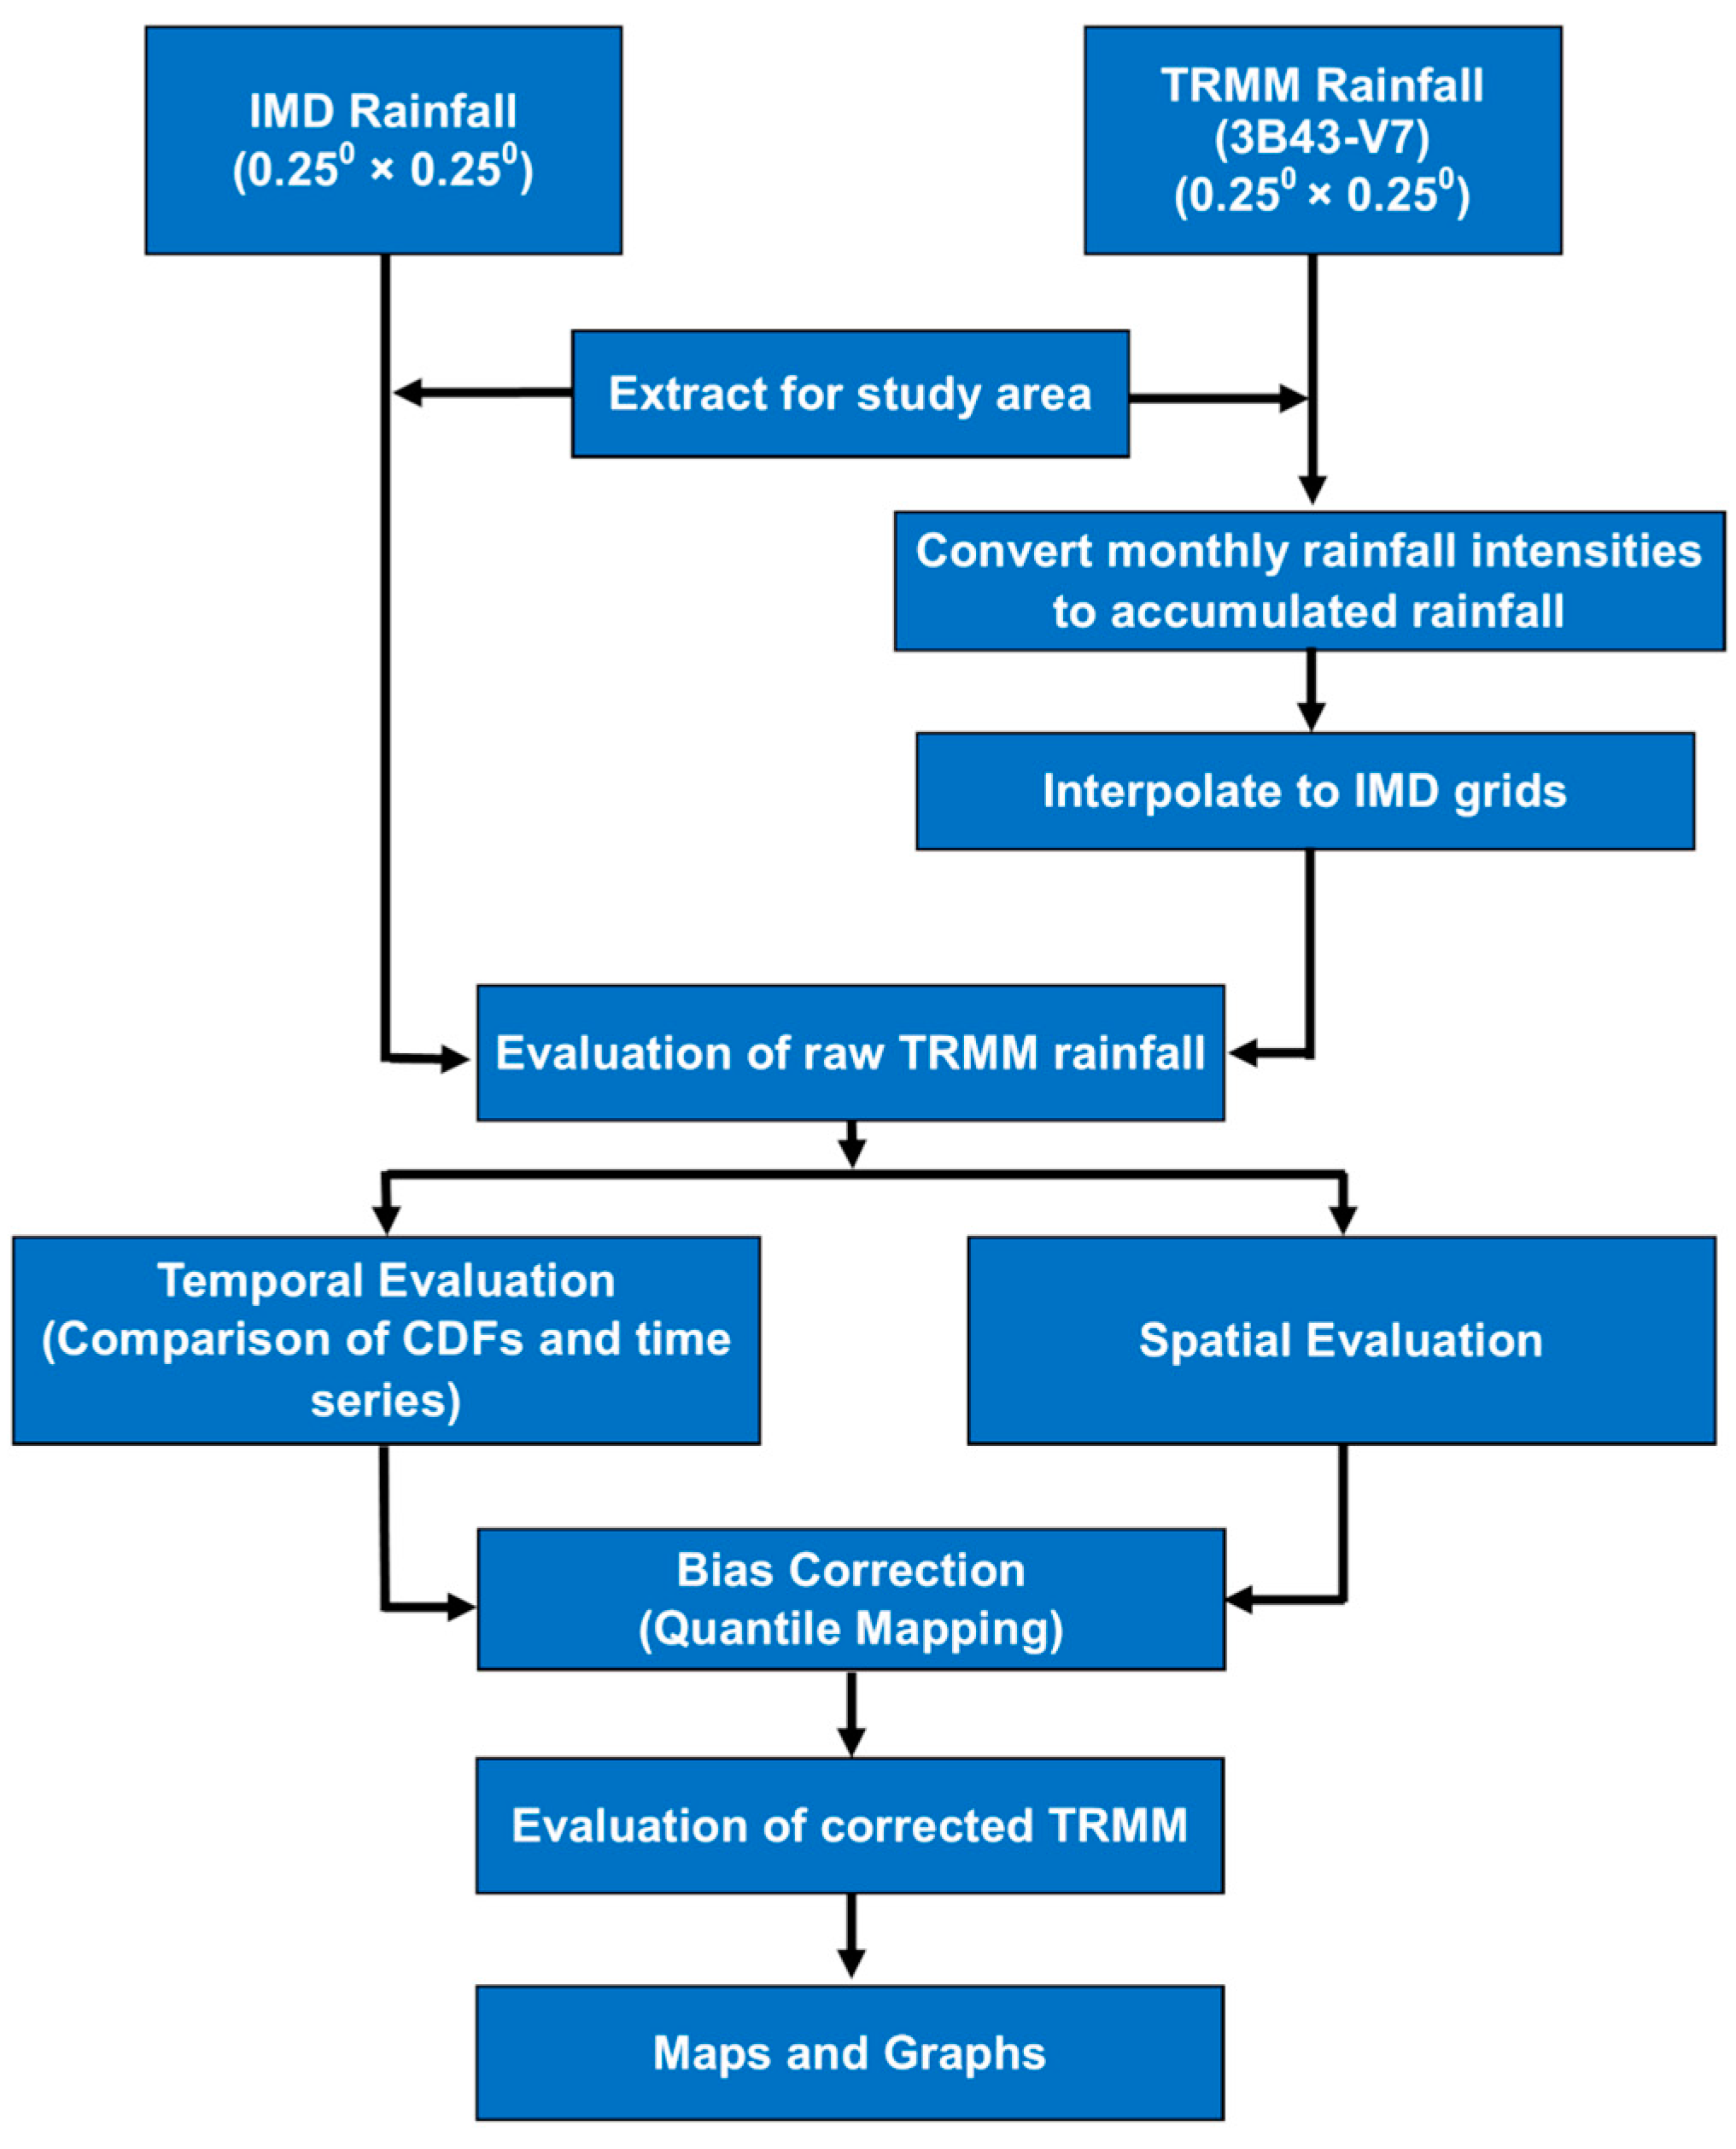
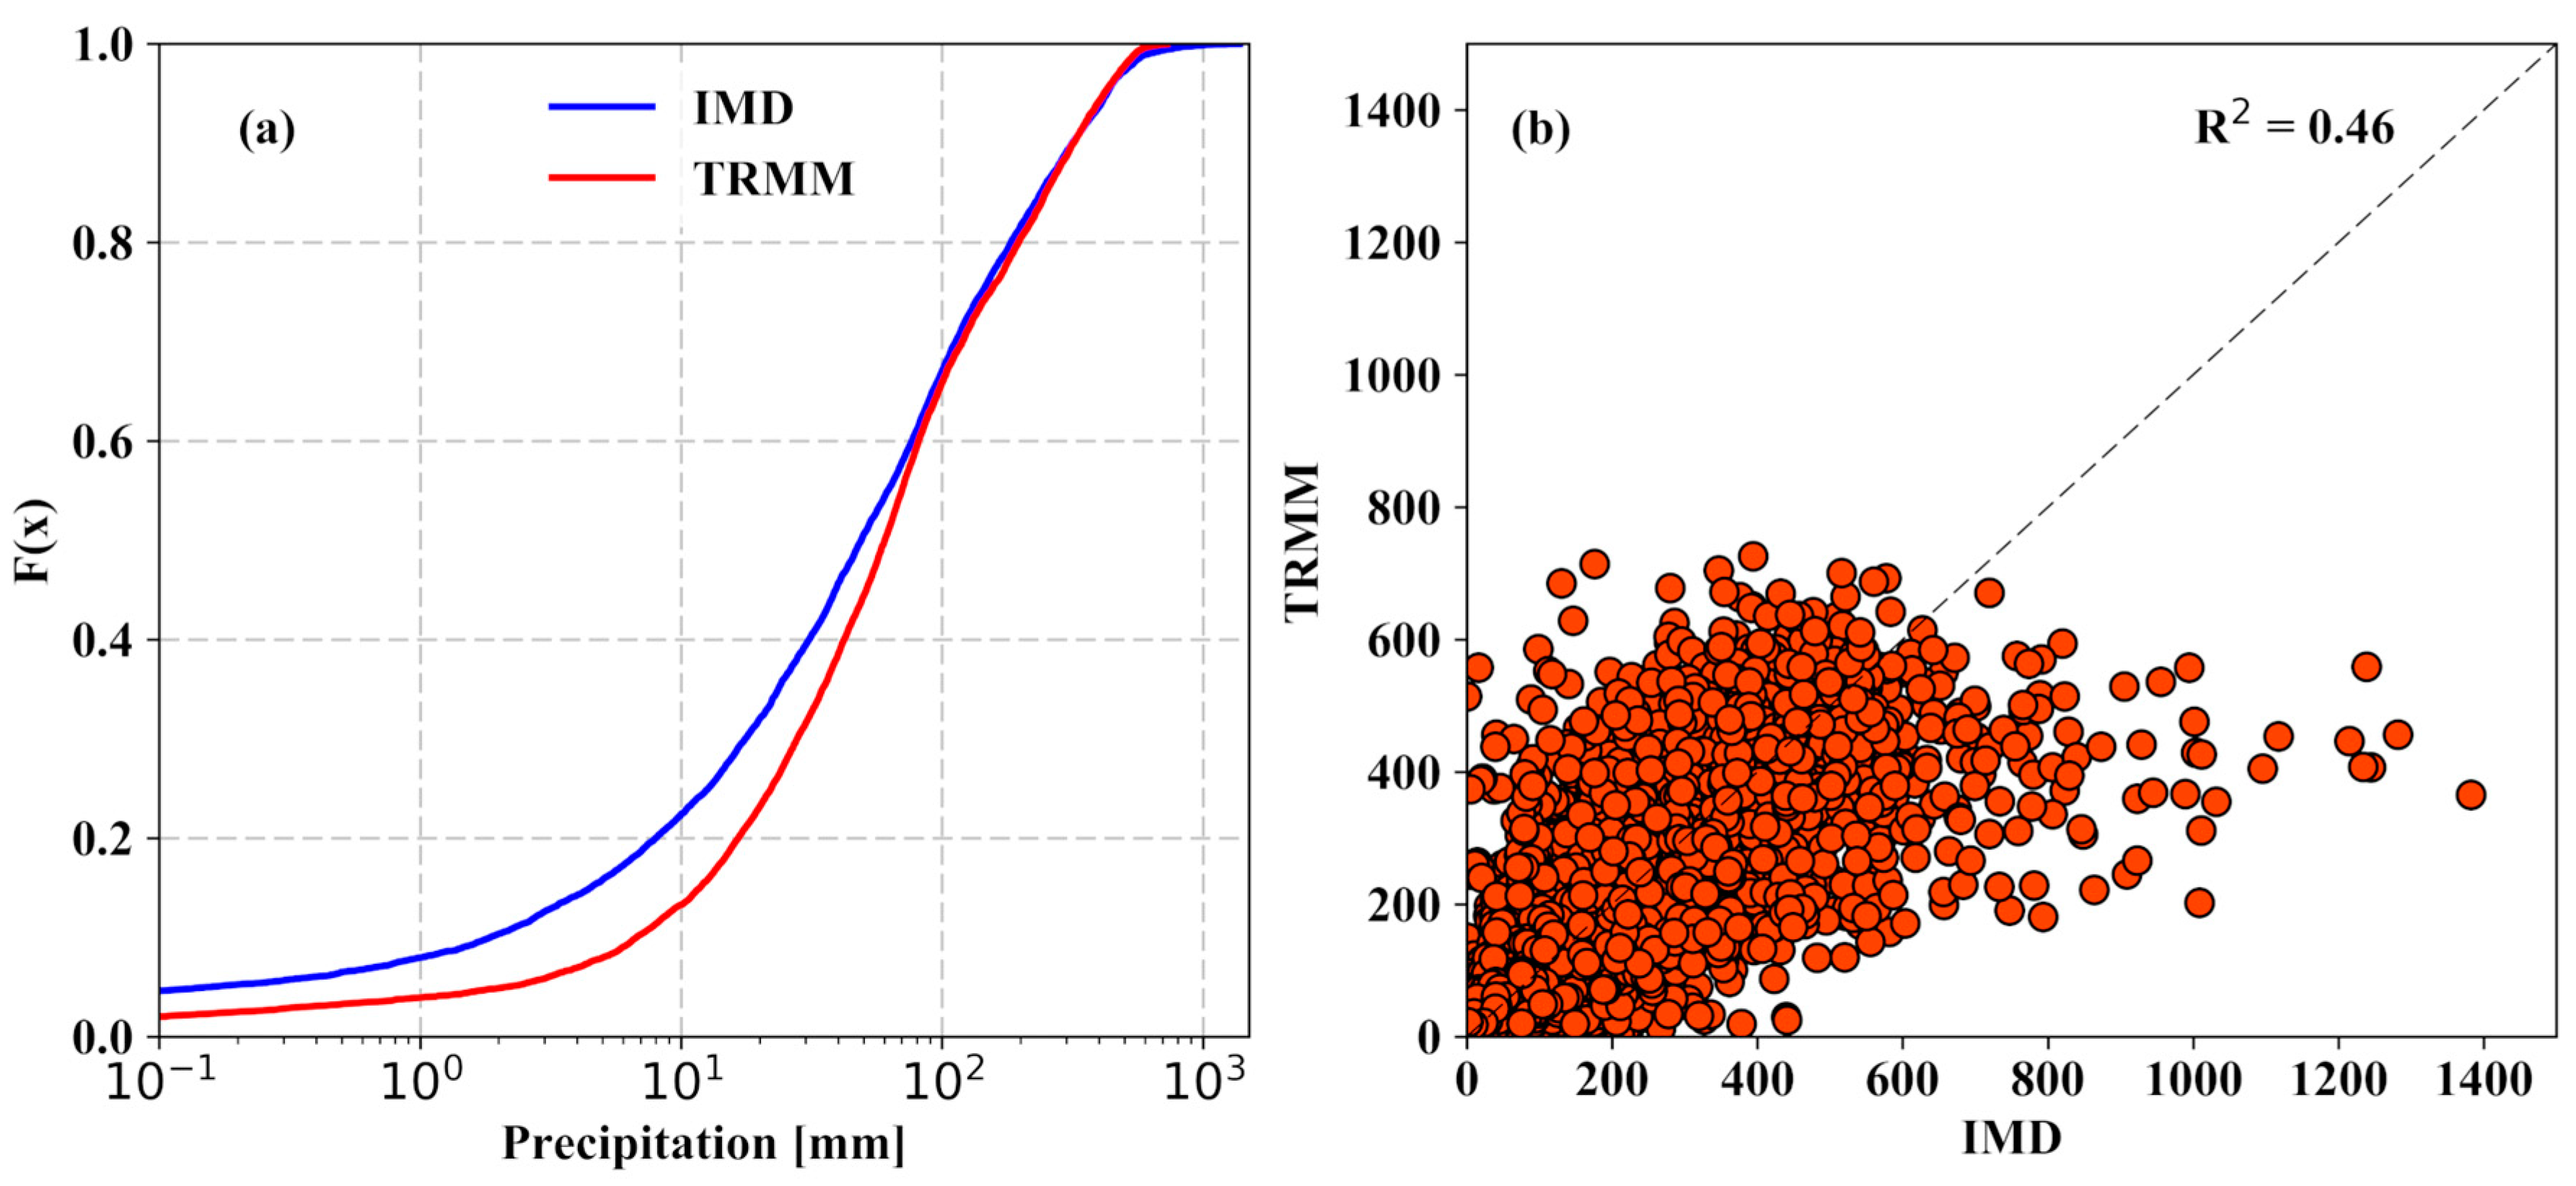
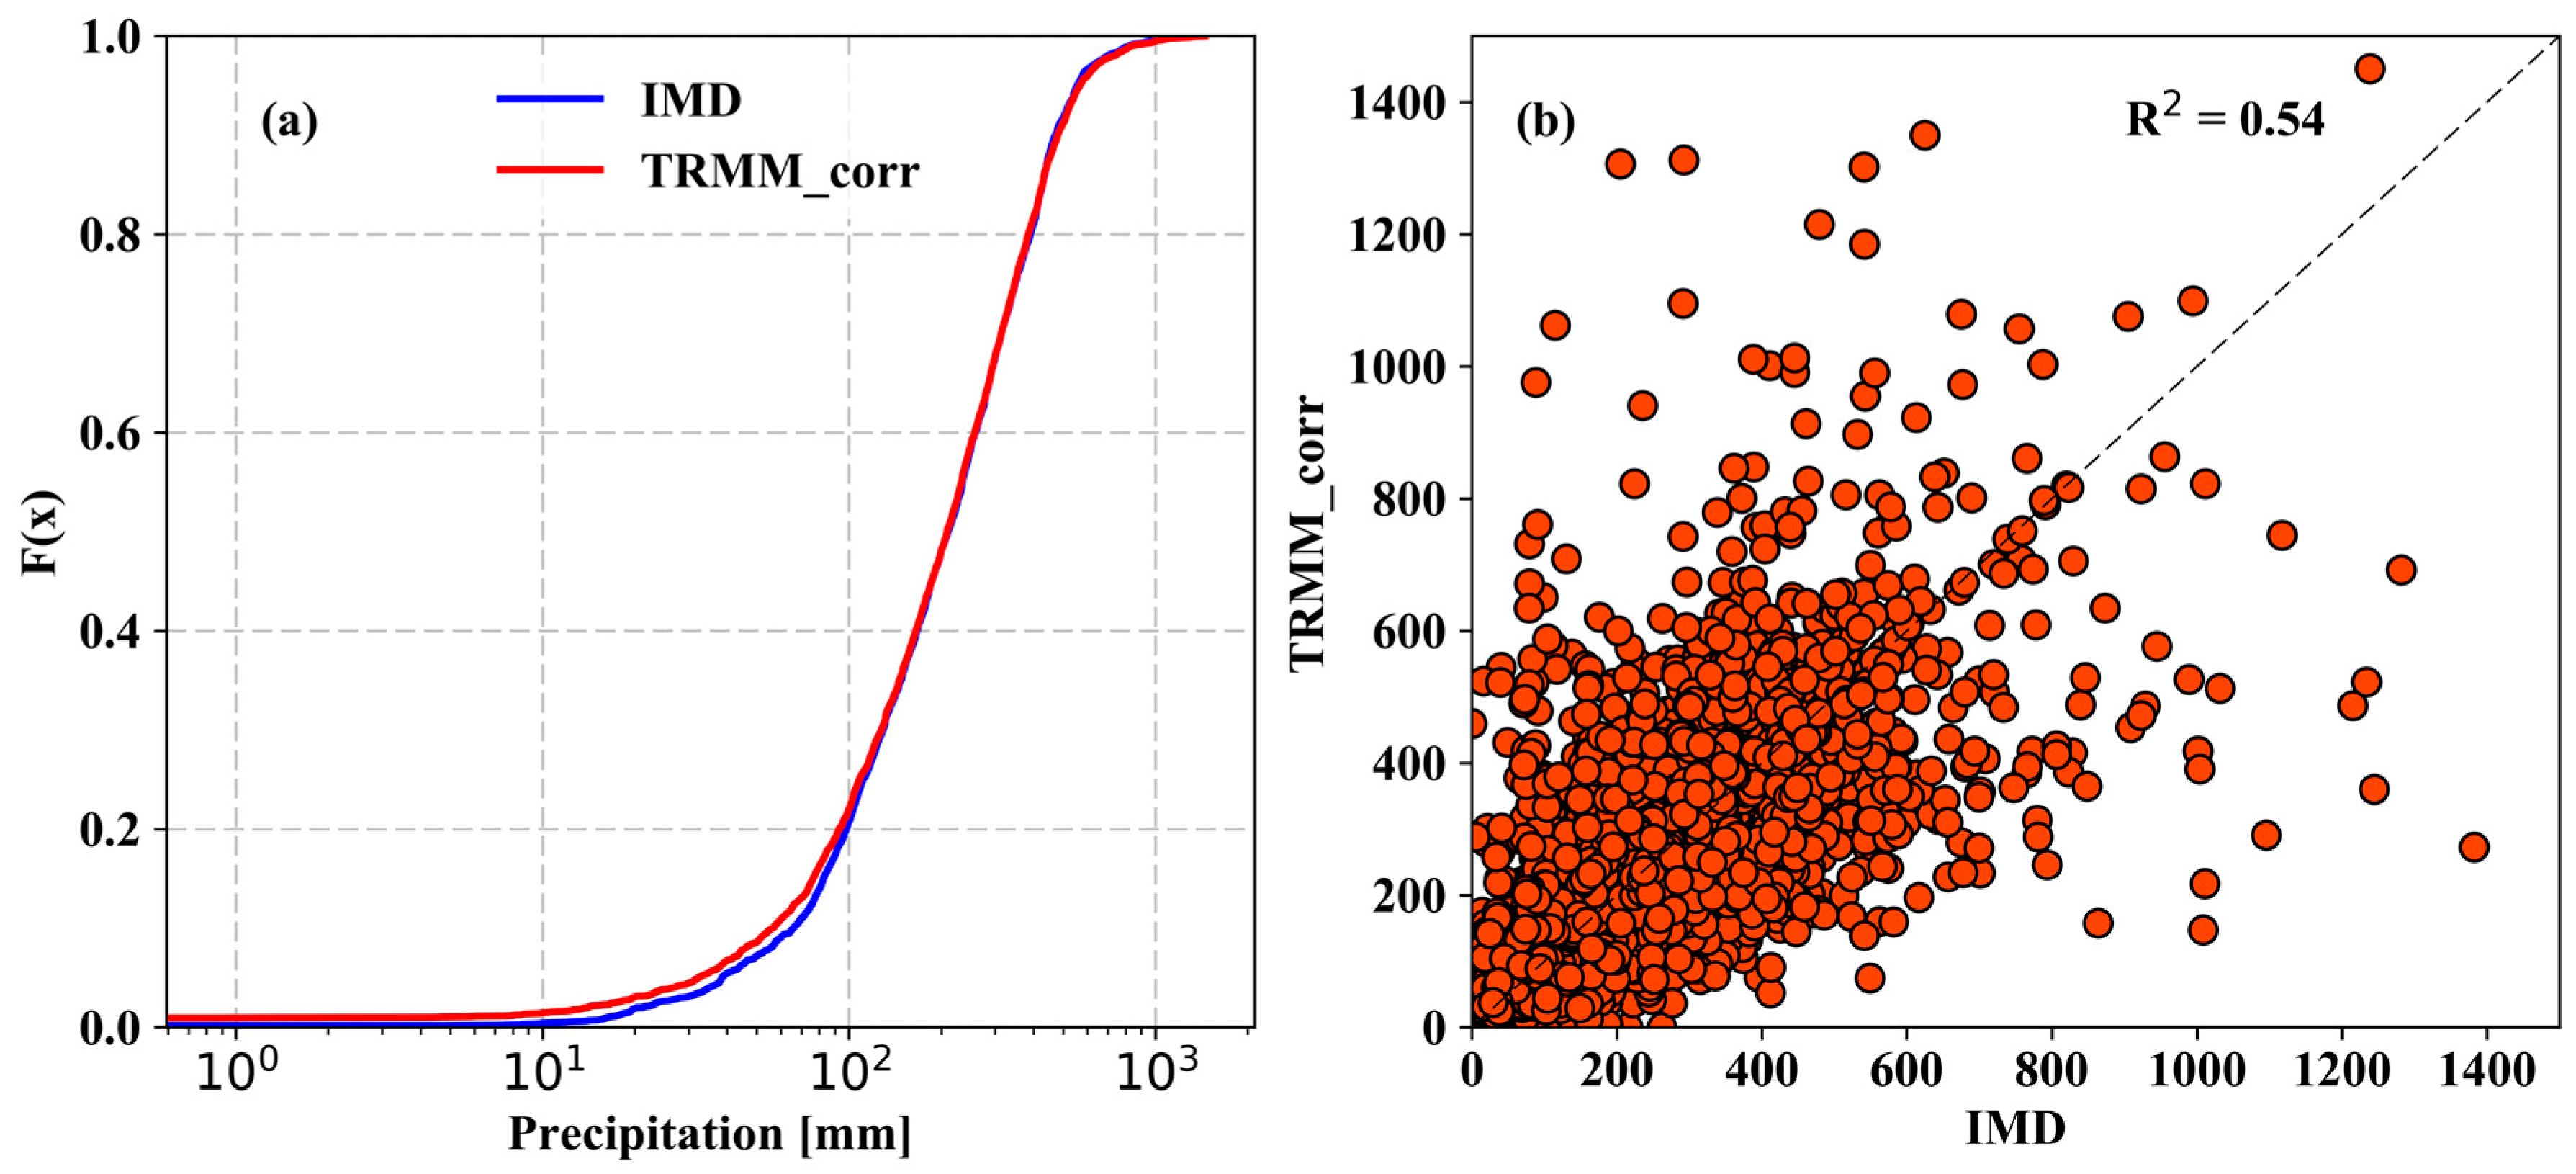
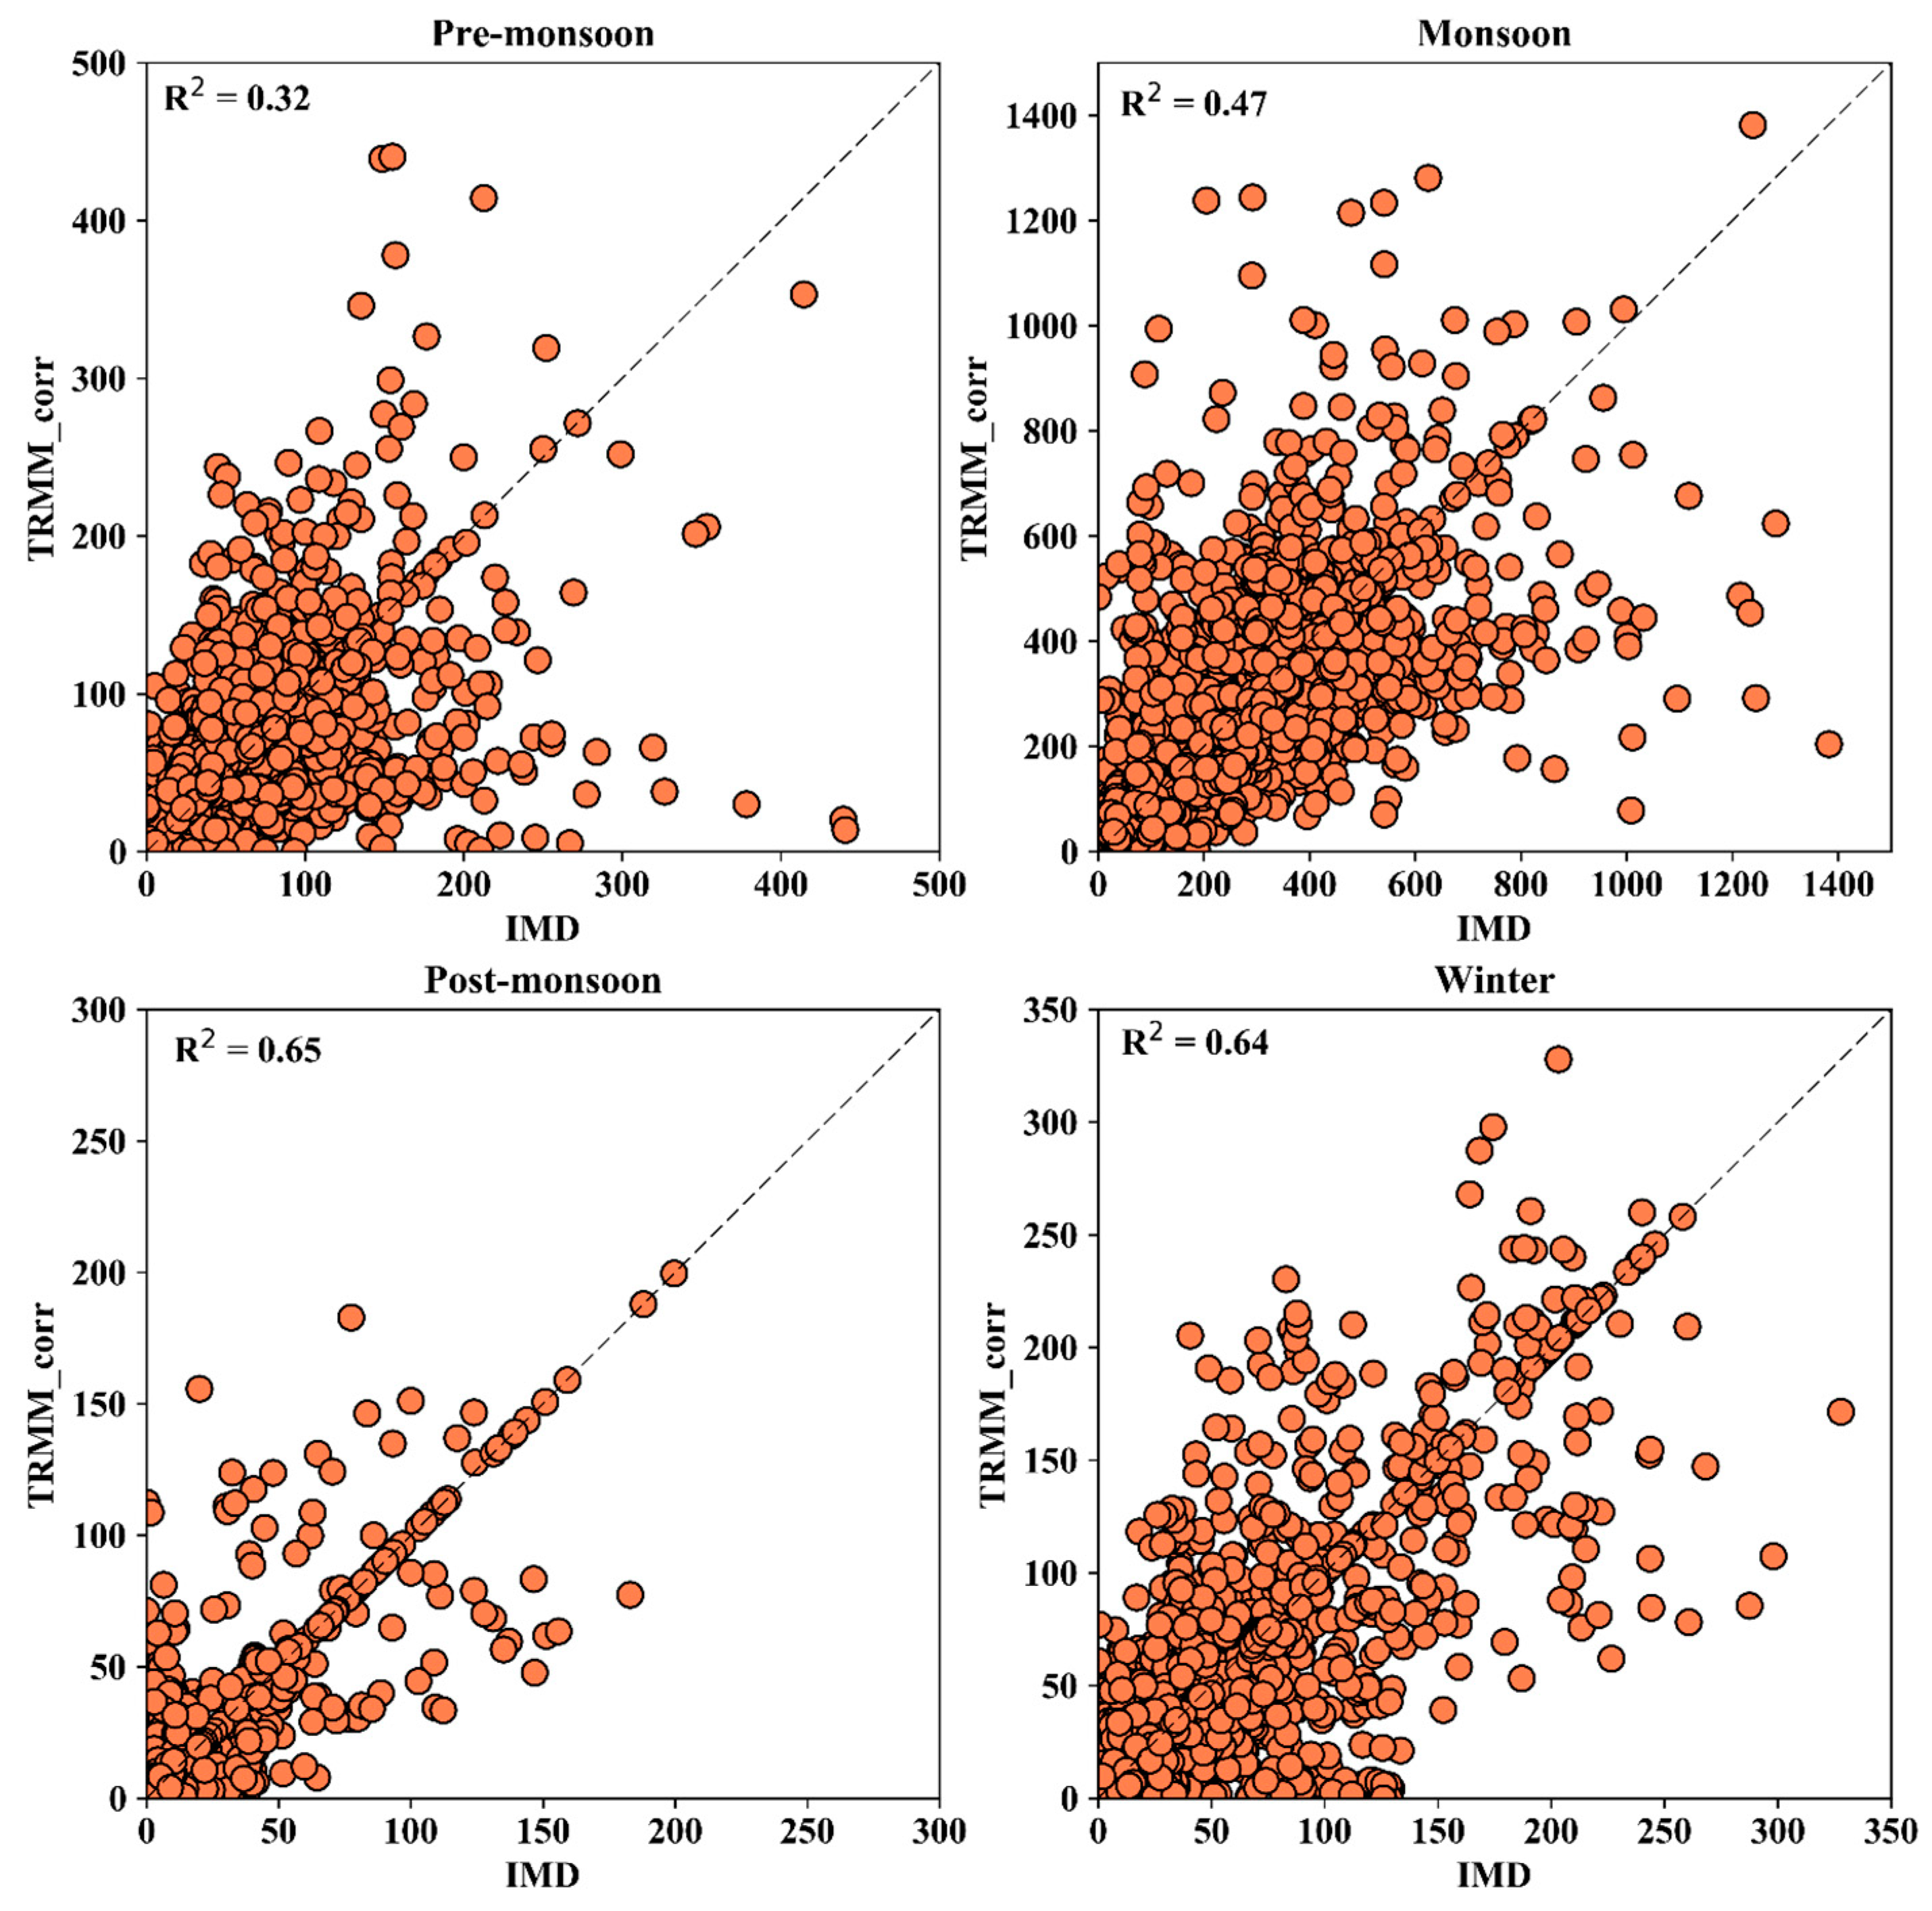
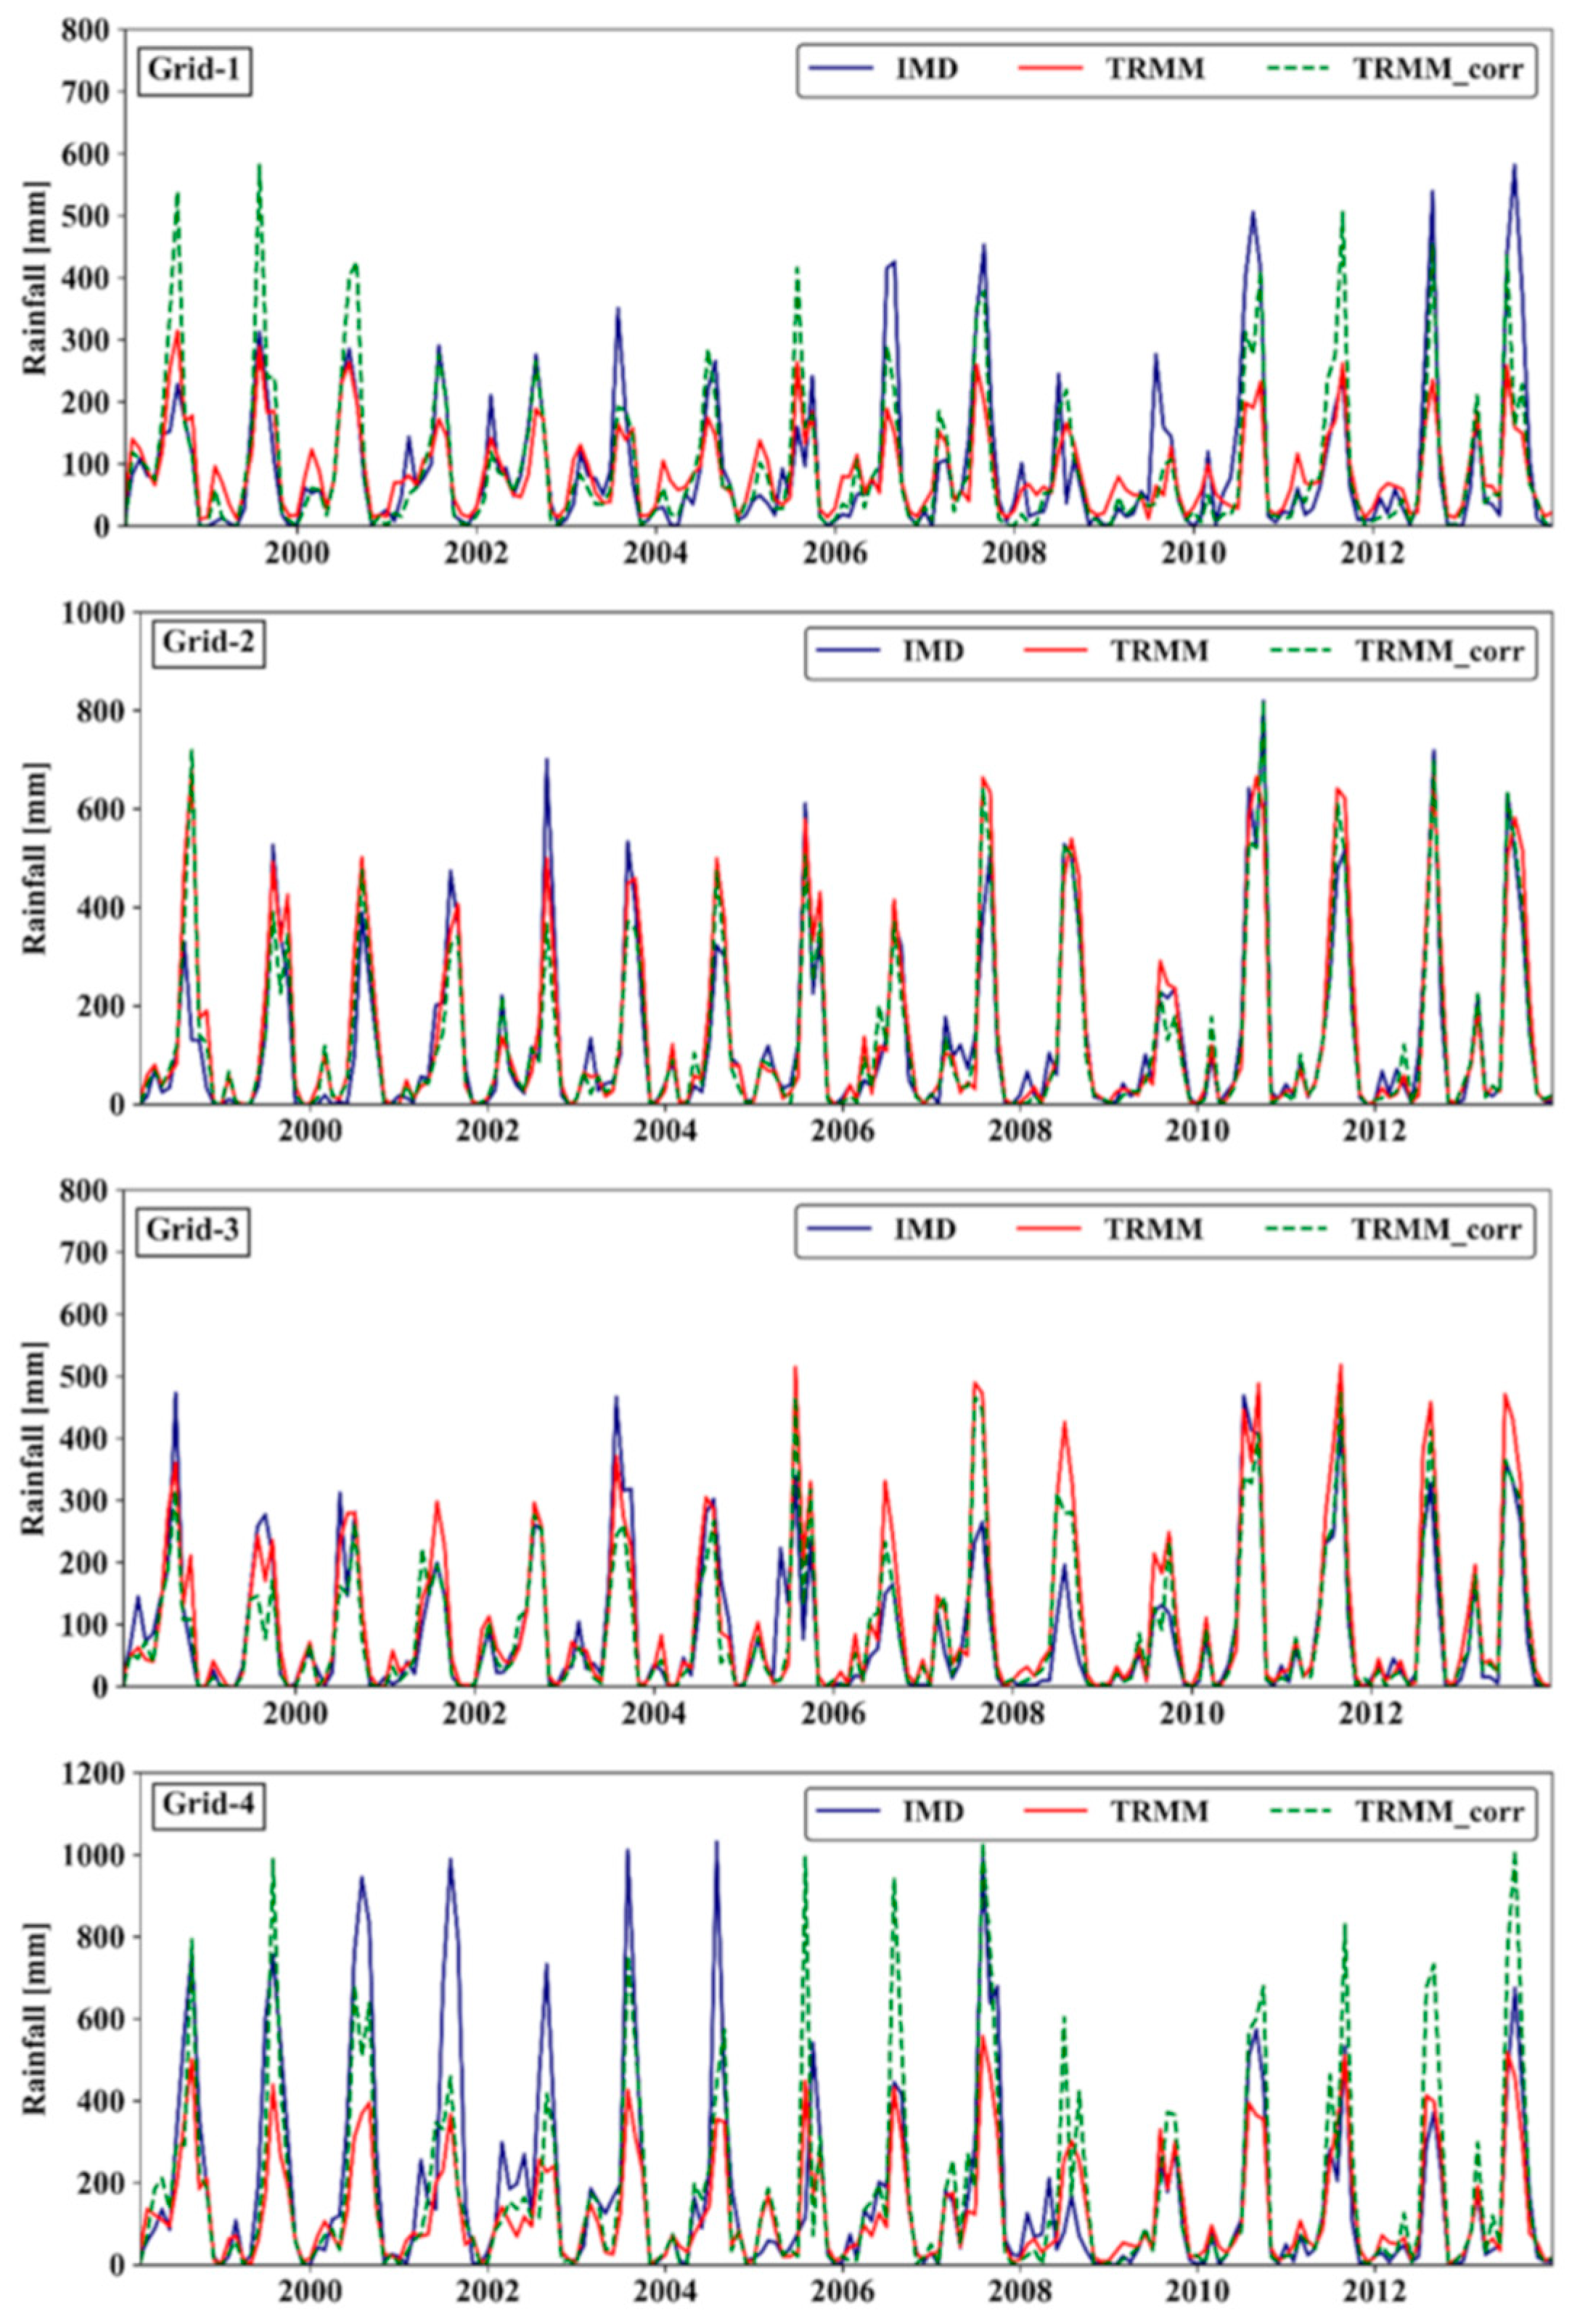
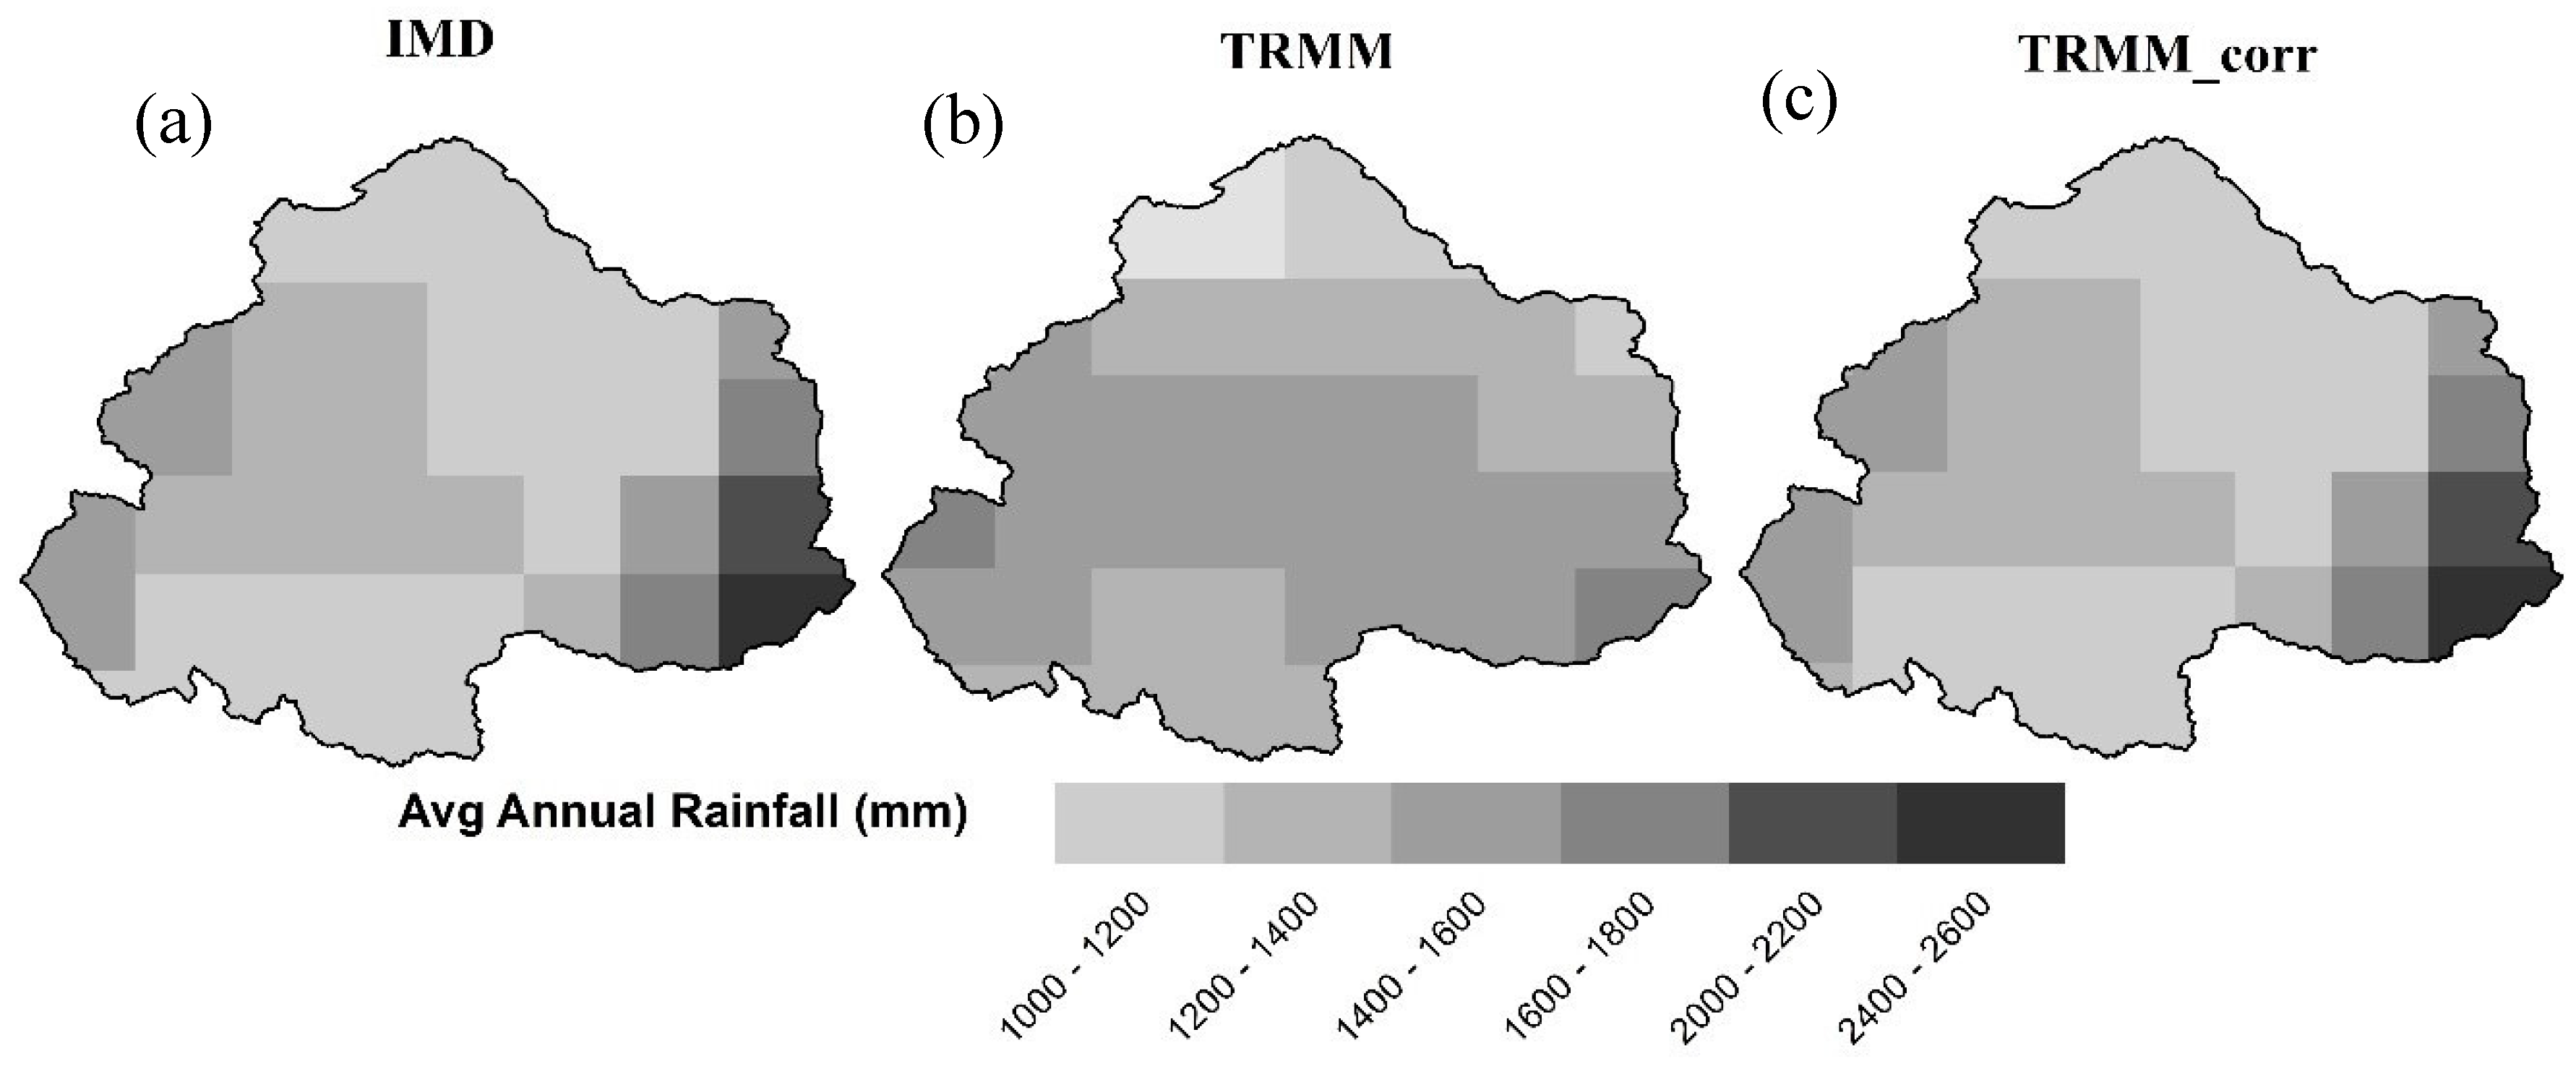
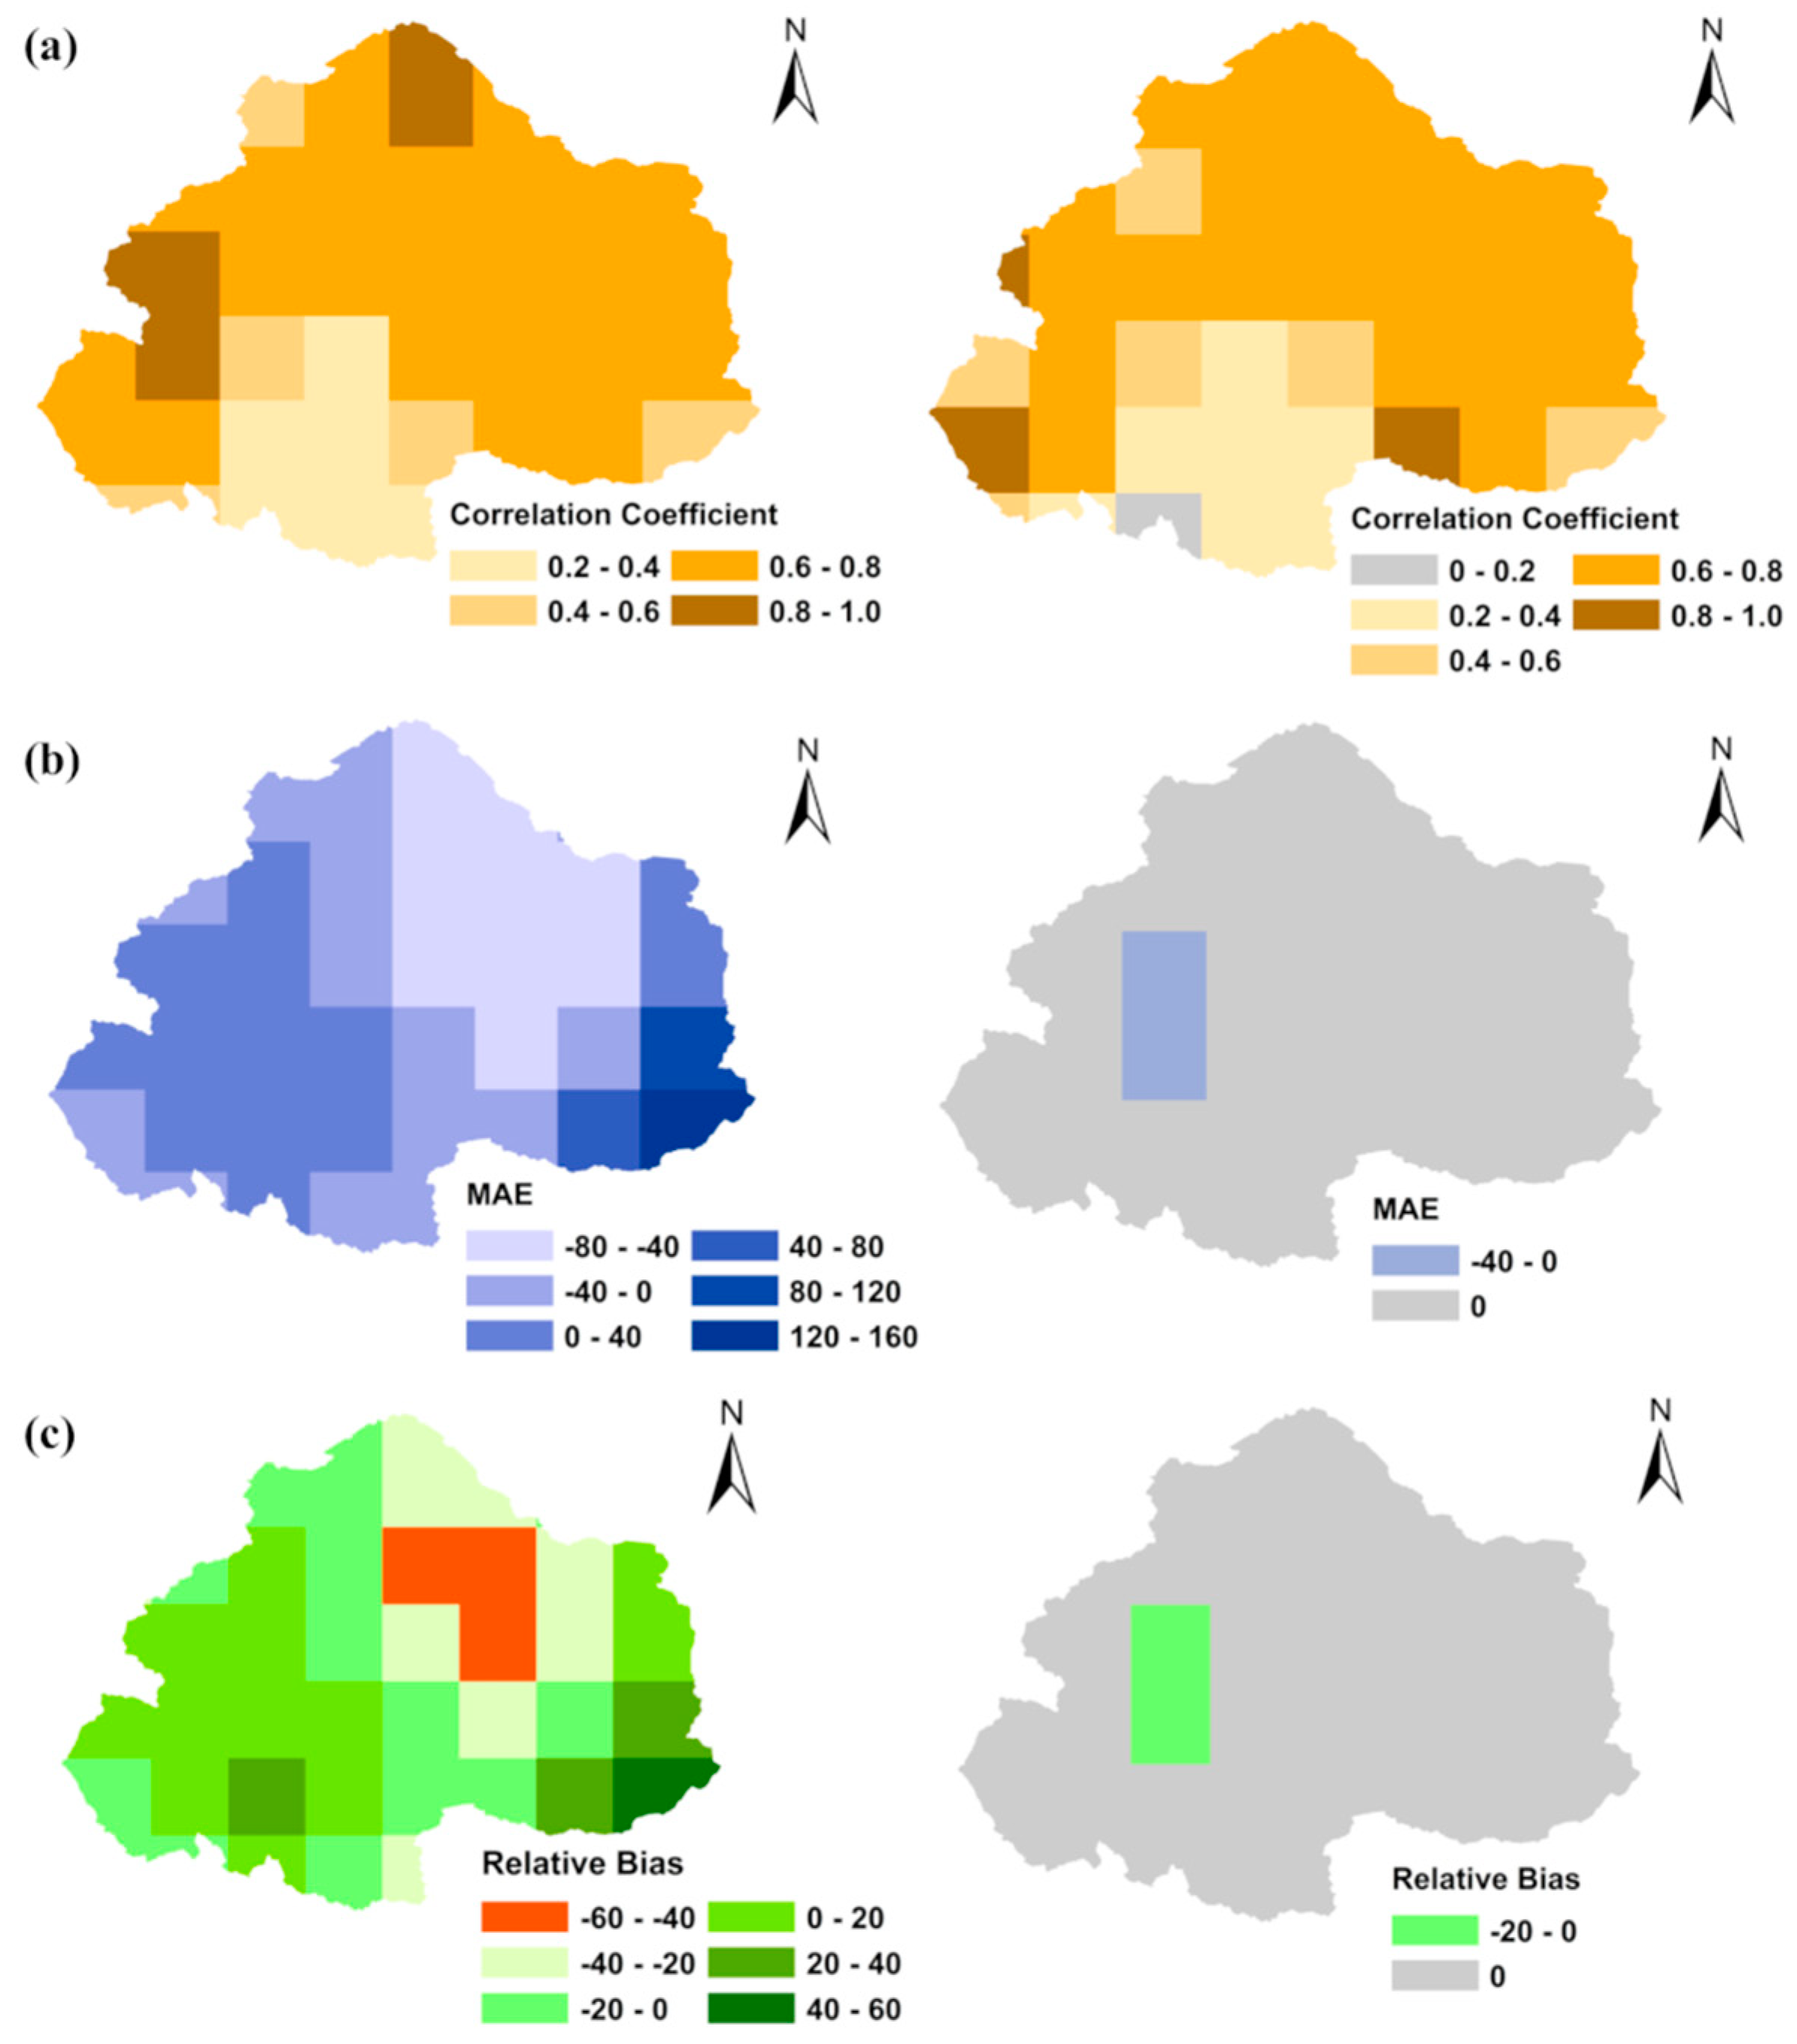
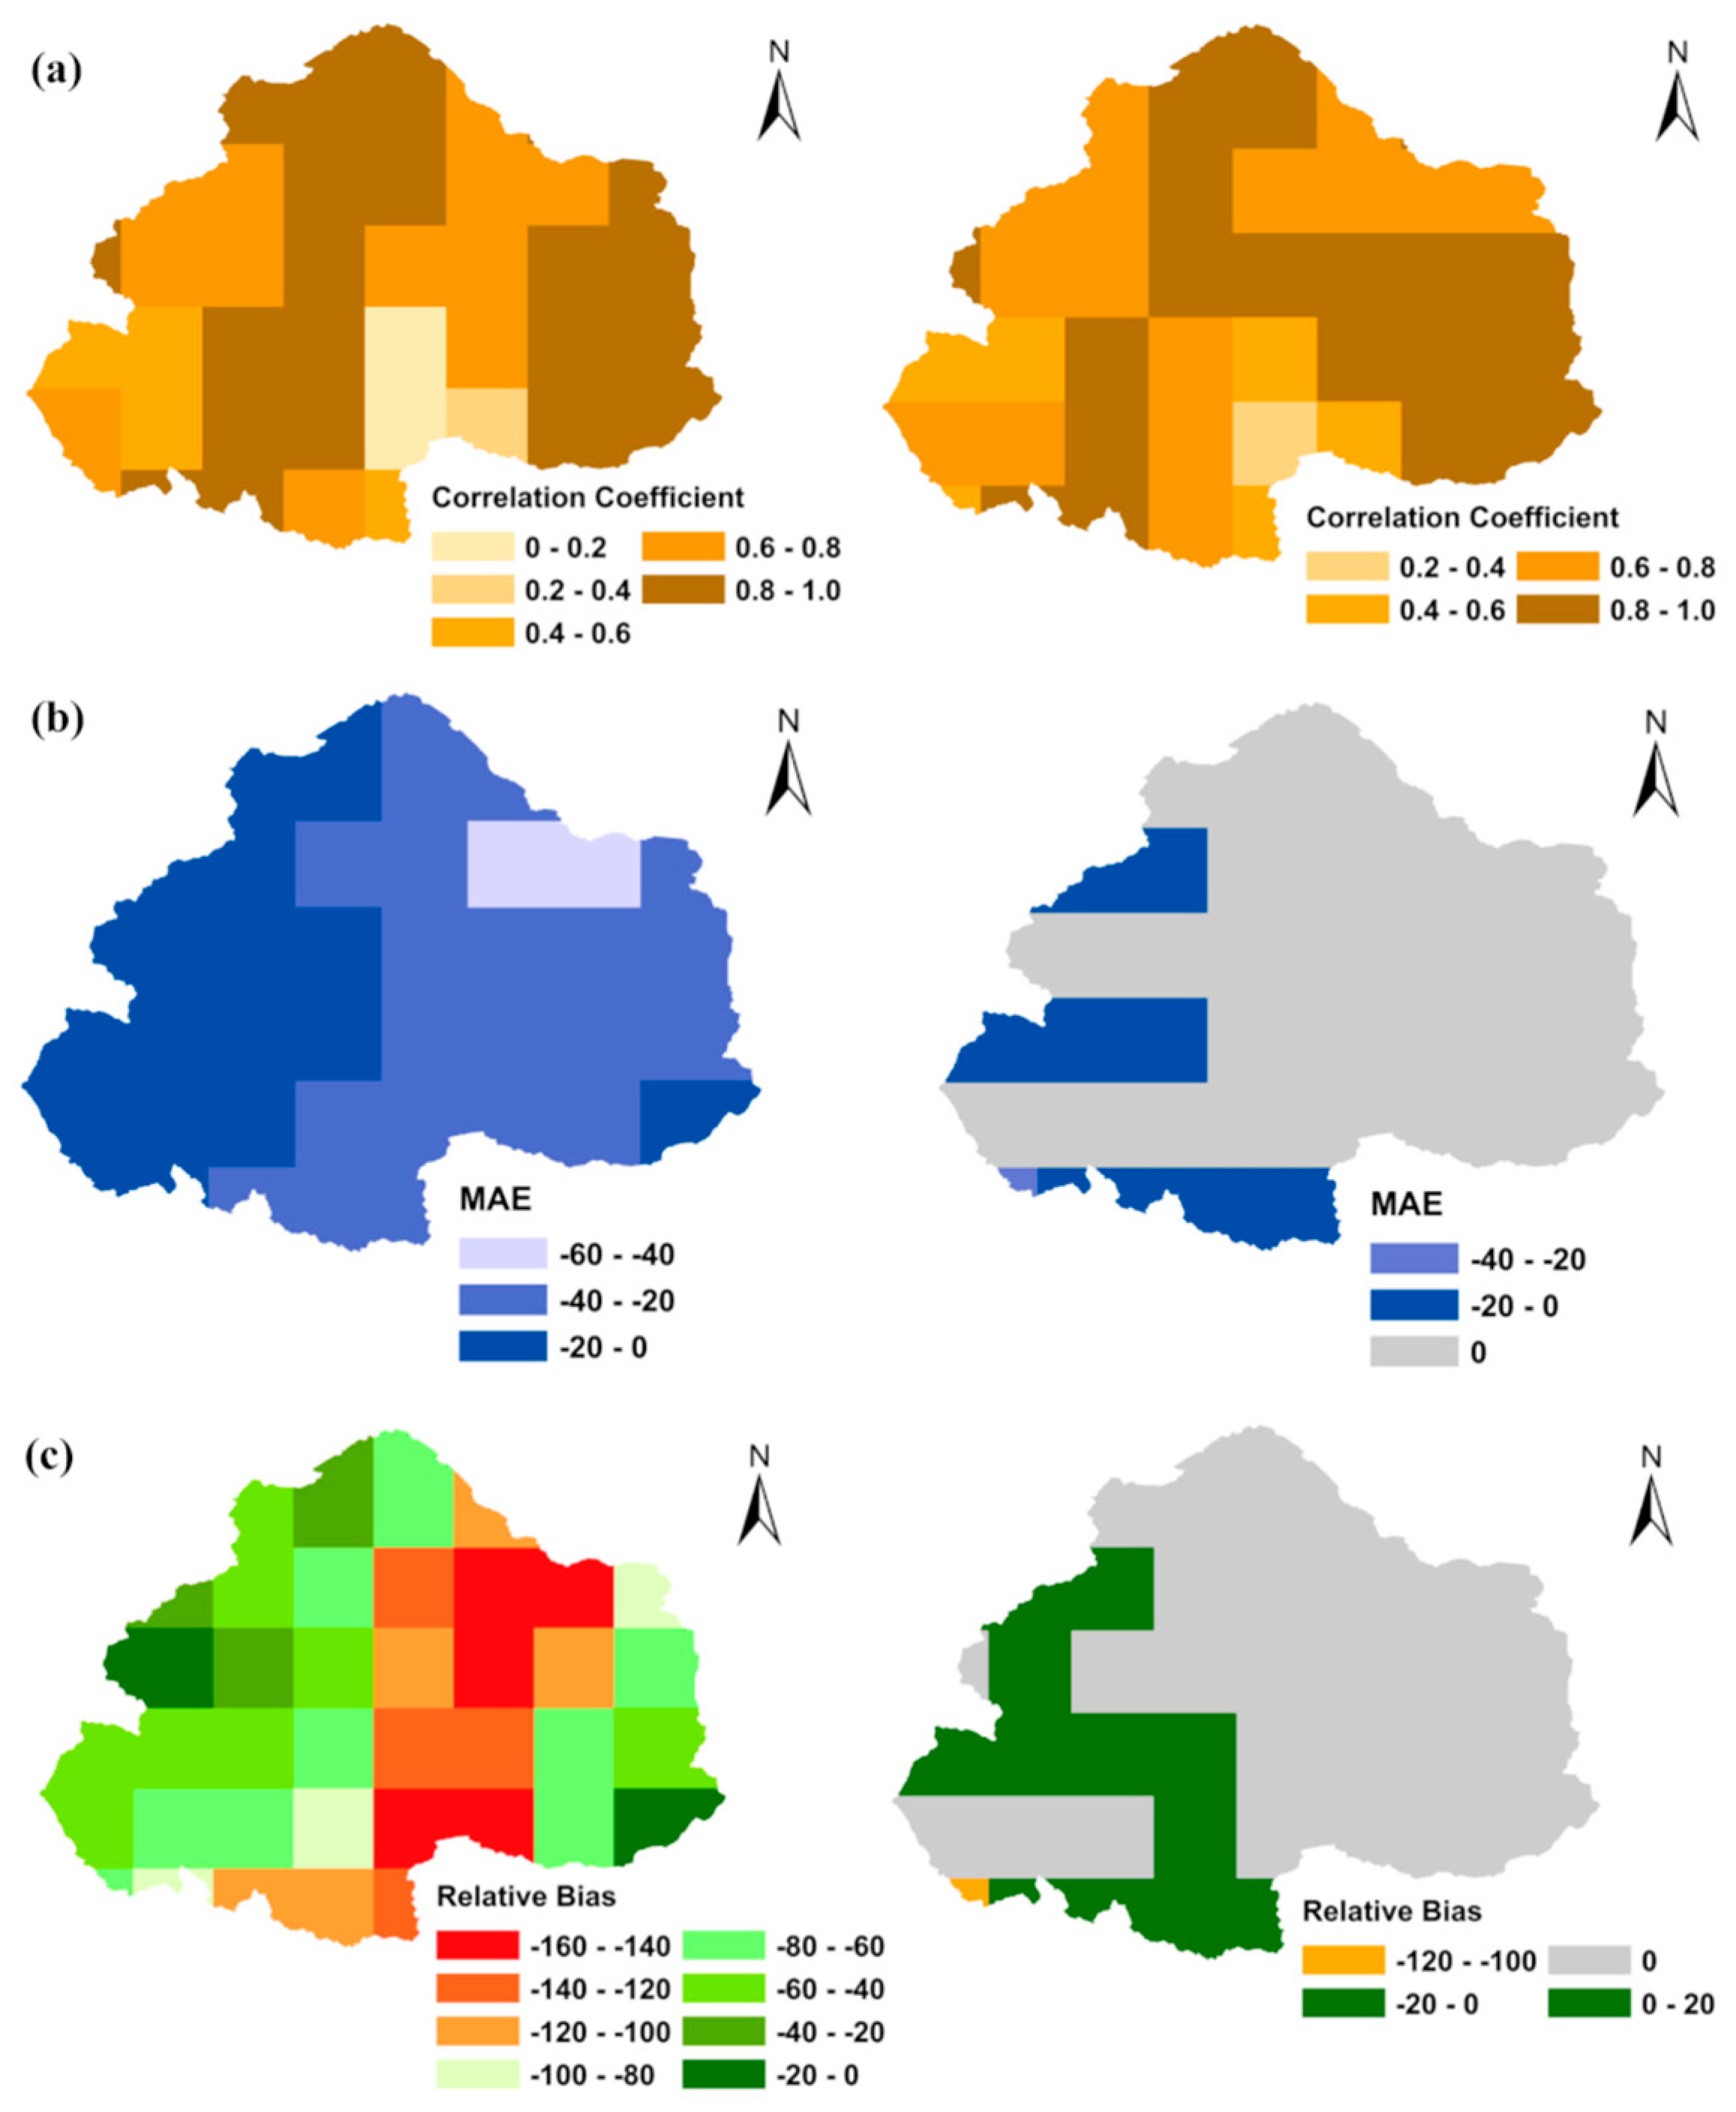
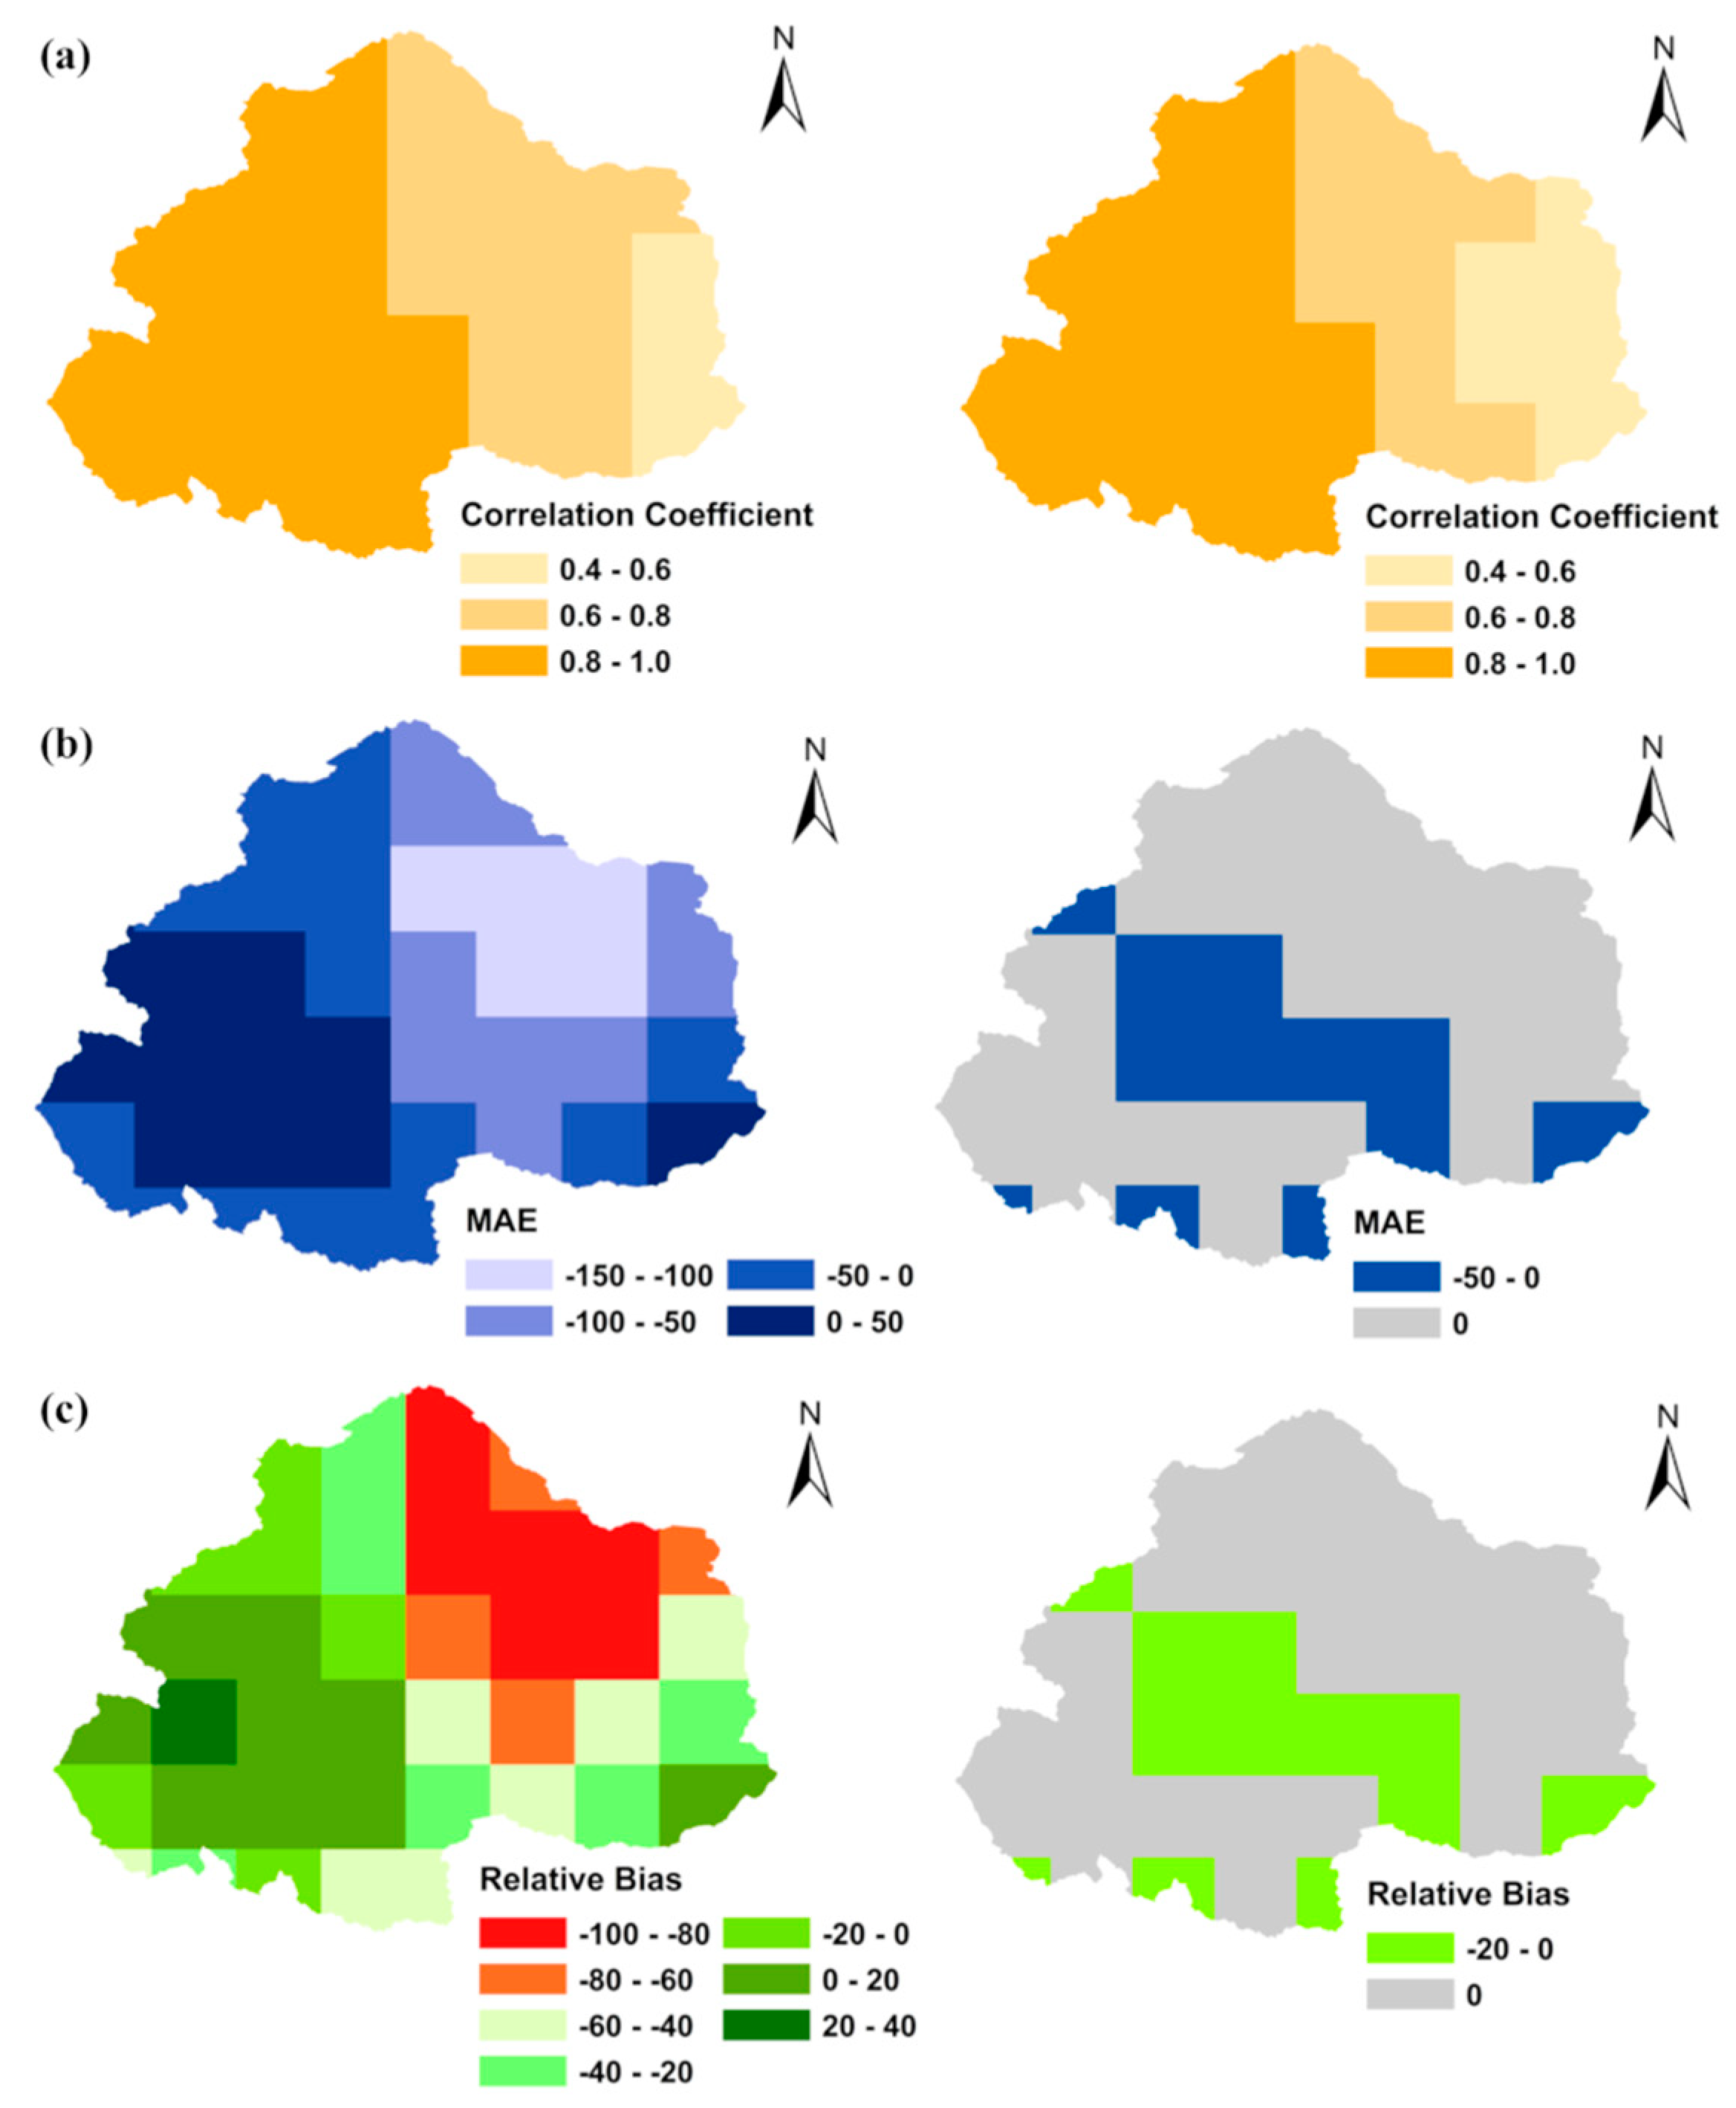
Table 1.
Details of the datasets used in this study.
| Dataset | Data Type | Native Grid Size | Resampled Grid Size | Time Span |
|---|---|---|---|---|
| TRMM | Precipitation | 0.25° × 0.25° | 0.25° × 0.25° | 1998–2013 |
| IMD (Observed) | Precipitation | 0.25° × 0.25° | 0.25° × 0.25° | 1998–2013 |
© 2019 by the authors. Licensee MDPI, Basel, Switzerland. This article is an open access article distributed under the terms and conditions of the Creative Commons Attribution (CC BY) license (http://creativecommons.org/licenses/by/4.0/).
Share and Cite
MDPI and ACS Style
Shukla, A.K.; Ojha, C.S.P.; Singh, R.P.; Pal, L.; Fu, D. Evaluation of TRMM Precipitation Dataset over Himalayan Catchment: The Upper Ganga Basin, India. Water 2019, 11, 613. https://doi.org/10.3390/w11030613
AMA Style
Shukla AK, Ojha CSP, Singh RP, Pal L, Fu D. Evaluation of TRMM Precipitation Dataset over Himalayan Catchment: The Upper Ganga Basin, India. Water. 2019; 11(3):613. https://doi.org/10.3390/w11030613
Chicago/Turabian StyleShukla, Anoop Kumar, Chandra Shekhar Prasad Ojha, Rajendra Prasad Singh, Lalit Pal, and Dafang Fu. 2019. "Evaluation of TRMM Precipitation Dataset over Himalayan Catchment: The Upper Ganga Basin, India" Water 11, no. 3: 613. https://doi.org/10.3390/w11030613
Note that from the first issue of 2016, this journal uses article numbers instead of page numbers. See further details here.