The Importance of Detailed Groundwater Monitoring for Underground Structure in Karst (Case Study: HPP Pirot, Southeastern Serbia)


Faculty of Mining and Geology, University of Belgrade, 11000 Belgrade, Serbia
*
Author to whom correspondence should be addressed.
Water 2019, 11(3), 603; https://doi.org/10.3390/w11030603
Submission received: 27 February 2019
/
Revised: 19 March 2019
/
Accepted: 20 March 2019
/
Published: 22 March 2019
(This article belongs to the Special Issue Hydraulic Behavior of Karst Aquifers)
Abstract
:The establishment of detailed monitoring of quantitative and qualitative parameters of groundwater in the zone of possible interactions between a water-conveyance tunnel and the geologic/hydrogeologic environment is of the utmost importance for assessing the risk of adverse effects and of tunnel performance. The water-conveyance tunnel of the Pirot Hydropower Plant (HPP Pirot) is a good example of applying detailed monitoring in complex geologic/hydrogeologic conditions resulting from the presence of an underground structure. The research scheduling was conditional upon the operating regime of the tunnel (whether it is in or of operation—online or offline). While the tunnel was operating (online), monitoring was conducted at observation wells along the tunnel (approx 15 m distant), a control gate (water losses), springs, and a stream in the vicinity of the tunnel. Areas of the potential hydraulic instability were indicated by synchronous measurements of water level and temperature changes in the observation wells and at the control gate. While the tunnel was offline (empty tunnel) it was possible to access the tunnel, and in situ monitoring proved to be of great importance. Observations of quantitative parameters pointed out hydraulically critical tunnel zones, whilst the qualitative characteristics of groundwater revealed their potential aggressiveness to the concrete lining of the tunnel. The applied methodology shows that a detailed observation program should be an important task of sustainable tunnel management.
1. Introduction
The presence of an underground structure in a karst can have a considerable impact on the natural status of groundwater and, conversely, the groundwater can affect the structure (the two are in constant interaction). In general, karst areas are risky for constructing underground tunnels, particularly with regard to tunnel stability and water containment [1]. Anthropogenic interventions in such terrains can cause numerous environmental problems, like changes in water quality and quantity, and in groundwater and surface water regimes [2]. These changes occur, not only in the construction phase, but also while the structures are in service. In most cases, the structures cannot be completely isolated and there is constant interaction with the geologic/hydrogeologic environment. Problems become even more pronounced if such projects are built in complex hydrogeologic systems, with epigenetic, as well as hypogenic karstic systems [3].
Complex geologic/hydrogeologic conditions require a comprehensive research approach to the interaction of groundwater and the water transported by a pressurized tunnel. Most studies dealing with this subject matter consider the problem of rapid groundwater inflow into a tunnel [4,5,6,7,8,9] and issues of structural stability [10,11].
The water-conveyance tunnel of Hydropower Plant (HPP) Pirot is a good example of extensive monitoring adapted to complex hydrogeologic conditions, regarding the operating conditions of the tunnel and potential hydraulically active zones.
2. Study Area
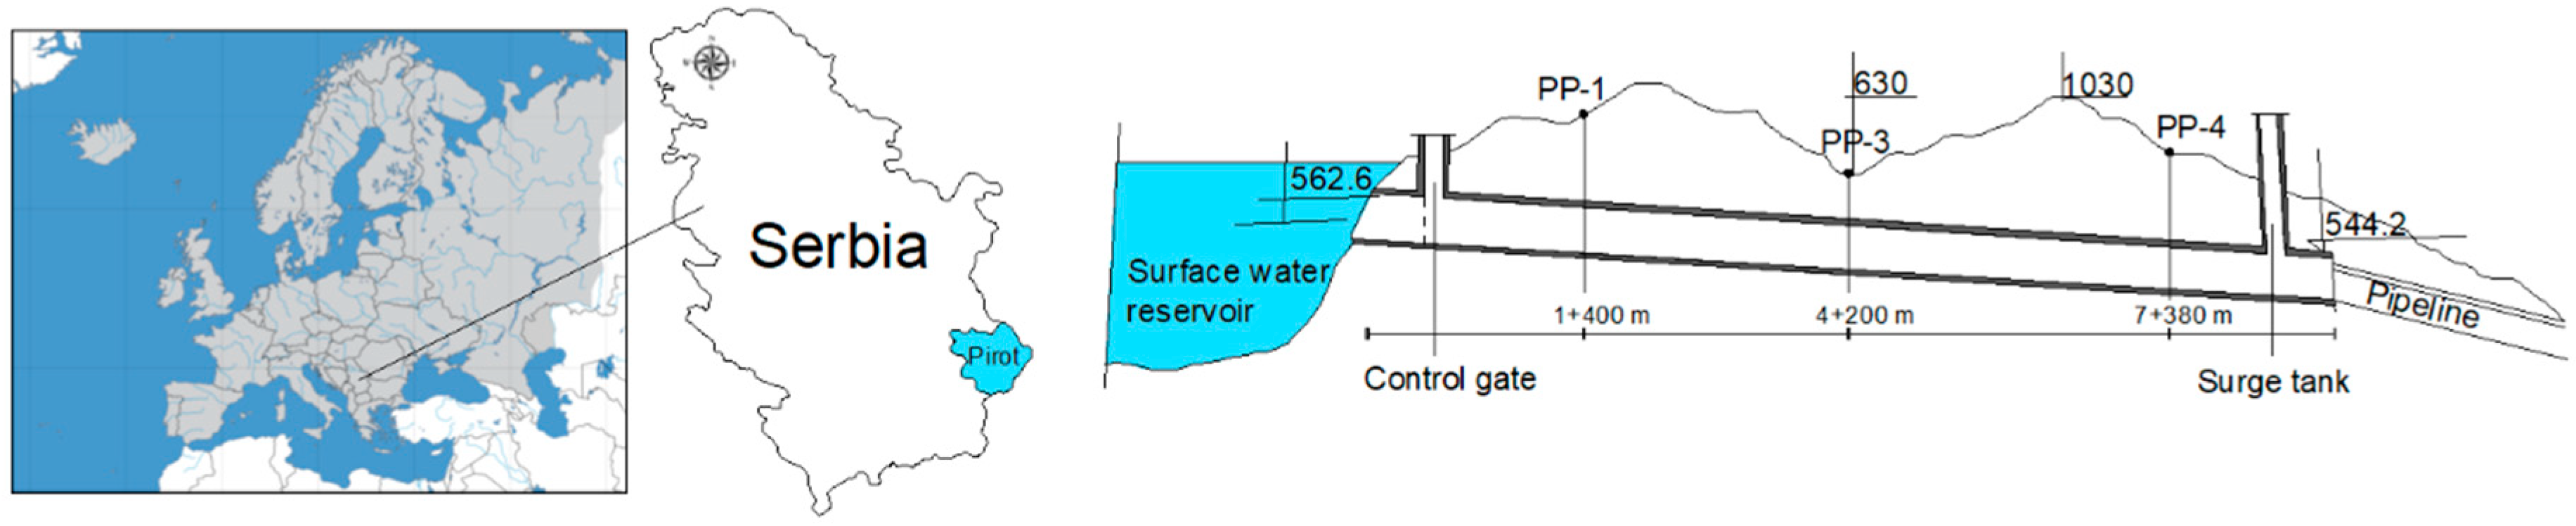
The water-conveyance tunnel of HPP Pirot (Southeastern Serbia) is used to transport stored water under pressure to the powerhouse. The tunnel is 9093 m long, its diameter is 4.5 m and the gradient 2.51 ‰. It was constructed by standard excavation (first and last parts) and tubing (1/4 and 3/4) with concrete lining (Figure 1). Three observation wells, PP-1, PP-3 and PP-4, were deep-drilled along the tunnel and the screens installed within the tunnel zone. The HPP has a gravity dam and is usually operated 4–5 h/day. Surface water reservoir is located at an elevation of 612 m, occupies an area of 5.53 km and has a total volume of 170 × 106 m3.
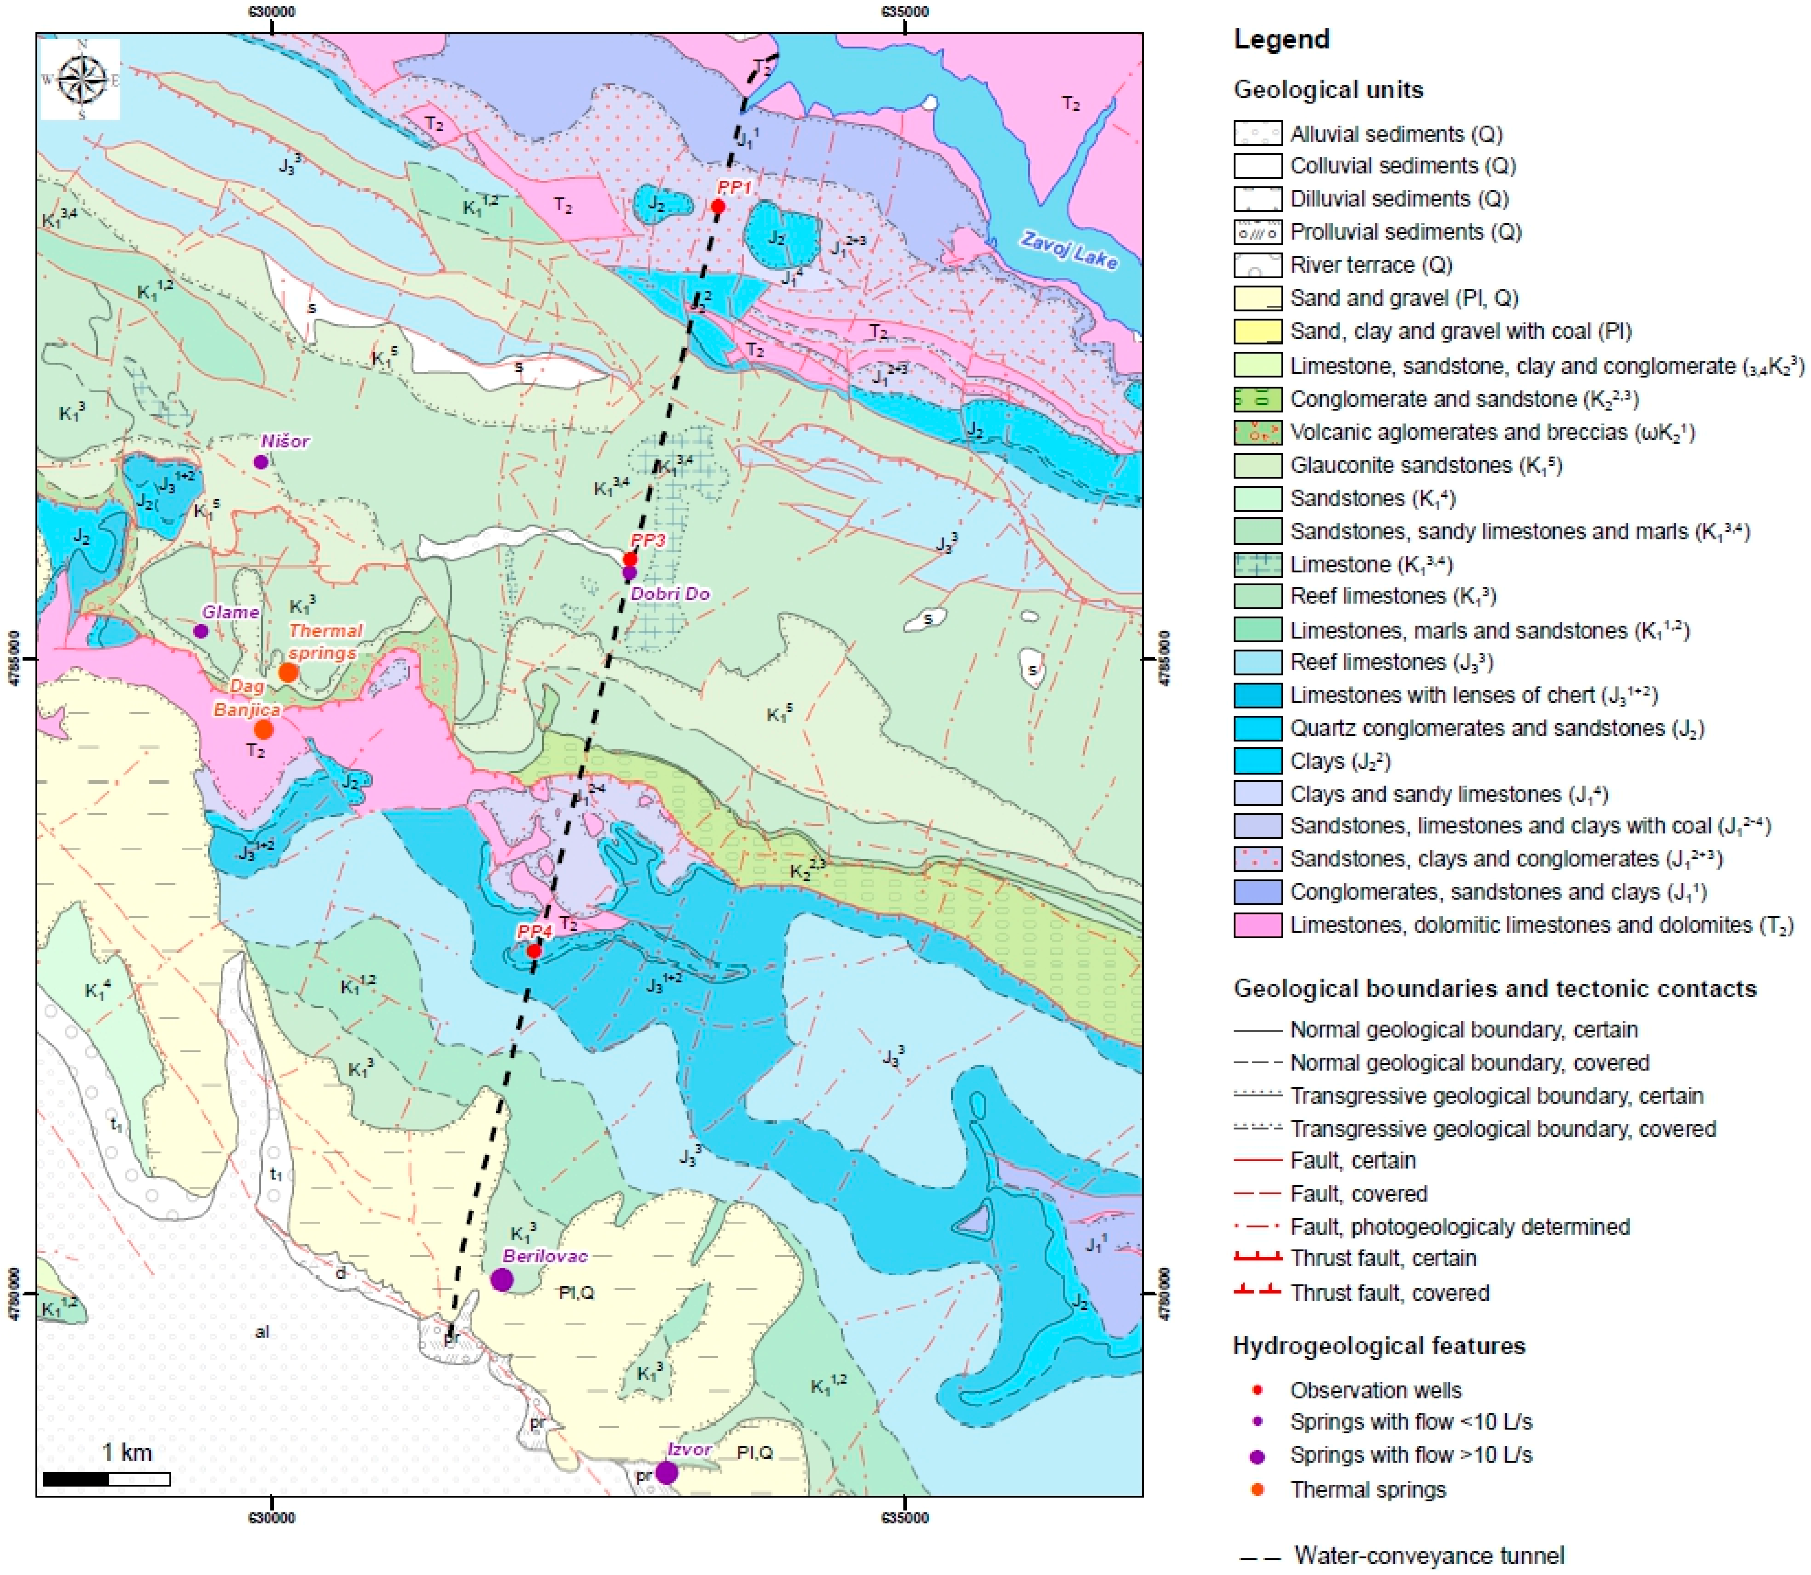
In geological terms, the tunnel was built through the contact of two regionally important tectonic units (Getic and Danubian), which are represented by a system of east-vergent thrusts. The most significant is the Vidlič thrust, which the tunnel intersects (Figure 2). The study area is mostly built up of carbonate sediments of the Triassic, Jurassic and Cretaceous ages. The Triassic deposits are represented by limestones, dolomites, conglomerates and sandstones, whilst the Jurassic deposits are represented by sandstones, clays, conglomerates and marble limestones. The most frequent deposits of the Cretaceous age are limestones, marls and sandstones. The Mesozoic complex is transgressively overlain by Pliocene sand, and marly clays. (Figure 2).
The complex geological structure of the terrain has led to the development of a complex hydrogeologic system, where there is a hypogenic karst aquifer in addition to the local hydrogeologic system. Based on the structural type of porosity, the karst aquifer is dominant. Other aquifer types are less developed. The typical contact springs are Berilovac and Izvor, which are the main drainage points of the local aquifer. The epikarst zone is mostly drained through shallow springs within the karst massif (Nišor, Glame, Dobri Do), while the thermal spring Dag Banjica represents the drainage point of a deeper hydrogeologic system characterized by hypogenic conditions.
3. Materials and Methods
Research activities and the selection of methods depended on the operating regime of the water-conveyance tunnel. The campaign lasted for 108 days and included the months of September, October and November 2016. Quantitative and qualitative groundwater data were collected in two primary stages (Table 1), while the tunnel was in operation (Phases A and C) and out of operation (Phase B). Phase A illustrates the state when the tunnel and the hydrogeologic environment were under pressure, while phase C reflects the state when only the tunnel was under pressure.
During the campaign, the monitoring program included all springs (Berilovac, Izvor, Dag Banjica, Glame, Dobri Do and Nišor), the observation wells along the tunnel (PP-1, PP-3 and PP-4), a surface water reservoir and the Dobrodolska River. Monitoring within the tunnel and at the control gate was conducted while the tunnel was out of operation.
Summary losses of the fully charged tunnel were monitored at the control gate following the standard procedure [12], by maintaining the water level at the control gate for one hour and then evacuating the water via a bypass for 30 min. Observation of summary losses lasted for seven hours.
Frequent monitoring of the observation wells along the tunnel, as well as at the control gate, was performed using a TD-Diver with a 2 min sampling interval. Vertical probing of water conductivity and temperature was also undertaken during characteristic periods (operating regime, discharging and charging of the tunnel).
While the tunnel was empty, monitoring of quantitative and qualitative parameters included all leakage points in concrete lining fissures and internal boreholes. Quantitative monitoring was performed by continuous gauging of pressure and leakage, and consecutive hydrometric measurements along characteristic sections of the tunnel.
Qualitative prospecting was carried out in situ, using a multi parameter probe (for pH, oxidation-reduction potential—ORP, electrical conductivity—EC, dissolved oxygen—O2, and temperature—T), and included all leakage points where groundwater seeped into the tunnel. On the basis of the conducted prospecting, 10 characteristic sampling points were selected for chemical analyses of the water. Groundwater was sampled on three occasions and a total of 25 samples from the tunnel were analyzed (in some places sampling was not possible because the amount of water decreased over time). The primary chemical composition of the groundwater (HCO3−, Cl−, SO4−, Na+, K+, Ca2+, Mg2+) was determined by standard analytical methods under laboratory conditions.
Potentially threatened/critical zones of the tunnel in terms of groundwater aggressiveness and the tunnel’s structural stability were identified on the basis of the chemical composition of the groundwater sampled from the tunnel. The aggressiveness analyses were based on EU standard EN 206-1 [13], US Department of Transportation standard (CDT 2003) [14], and the Larson–Skold (LSkl) index [15,16].
4. Results and Discussion
Monitoring of the studied springs did not reveal any distinct changes in quantitative and qualitative parameters. Hence, it was not possible to clearly determine their hydraulic connection with the tunnel. The main changes in the quantitative and qualitative parameters of groundwater were detected at observation well PP-3, Table 2.
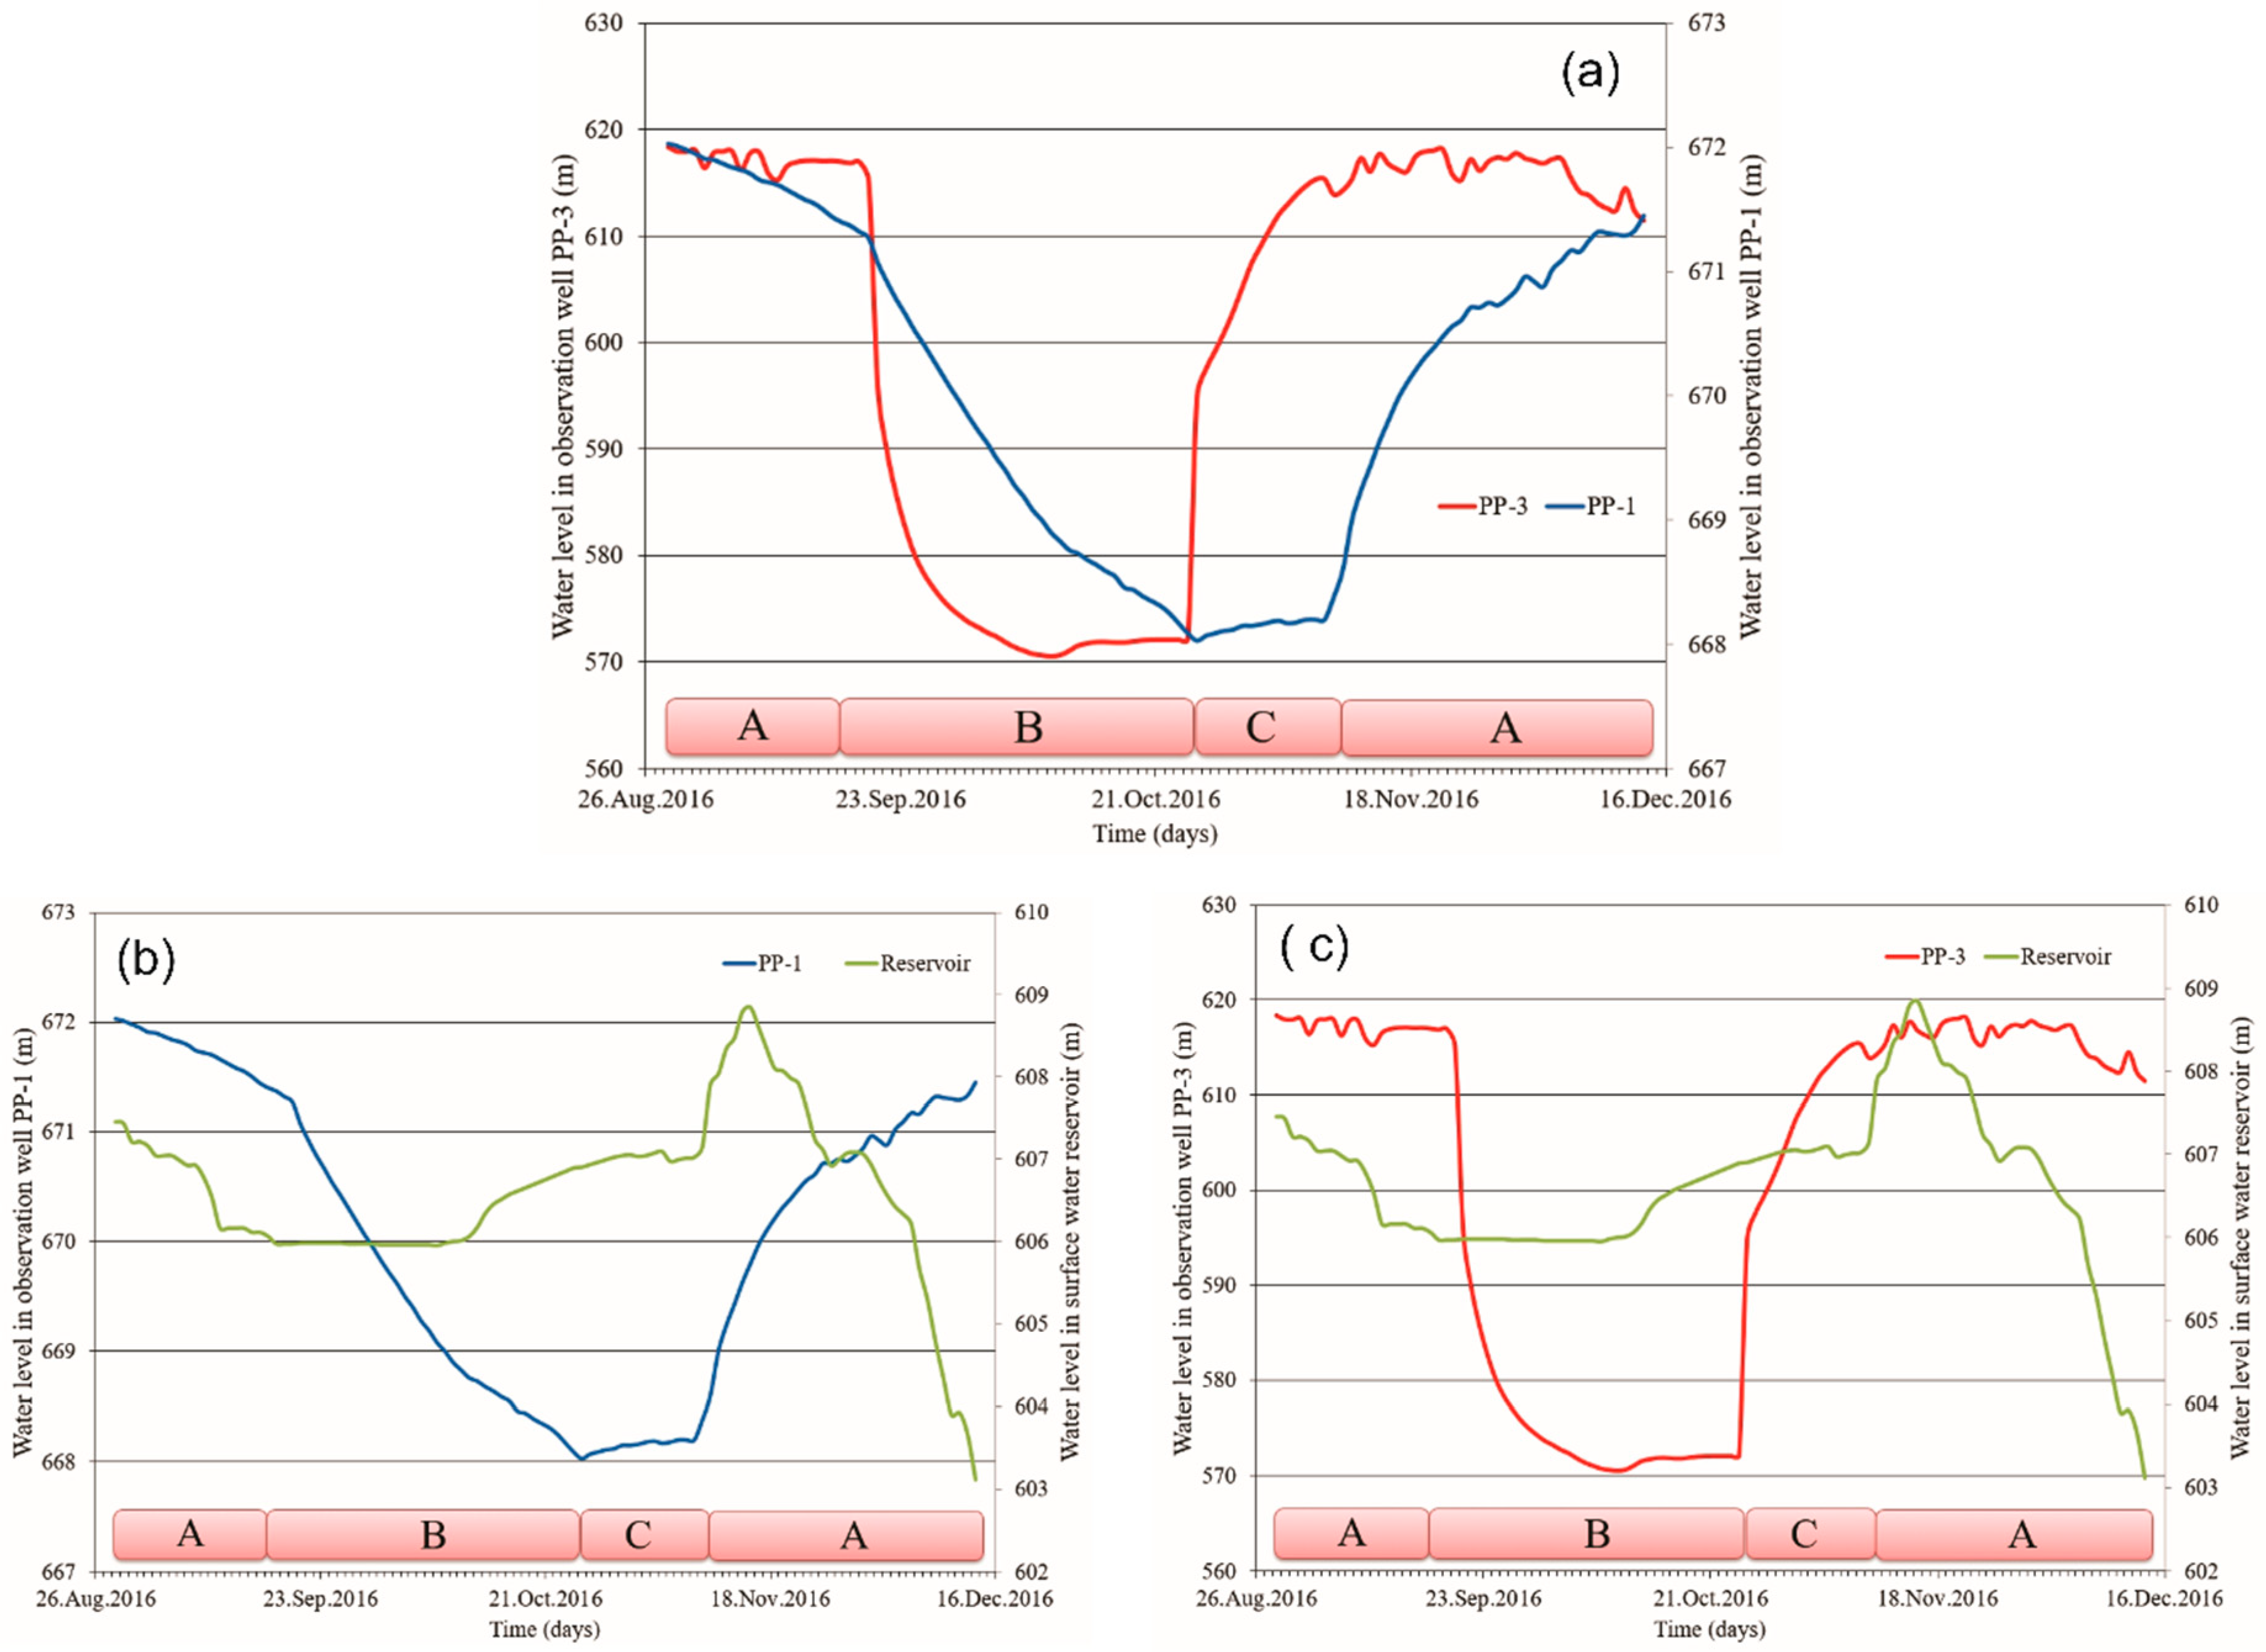
However, despite the fact that the greatest changes were detected at observation well PP-3, a comparative analysis of that well and PP-1 indicated that the groundwater level largely depended on the operating regime of the tunnel. Parallel plots showed different levels of hydraulic interaction between the hydrogeologic setting and the tunnel in the considered zones/sections (Figure 3). Even though PP-1 was the closest to the reservoir (corresponding to tunnel section 1 + 400 m), the measured data indicated a naturally very high water table, detected above the water level of the storage reservoir. The relatively small changes in groundwater level at PP-1 are primarily a result of specific geologic and hydrogeologic conditions on the location of this observation well (fractured aquifer, low productivity), featuring sandstones, claystones and conglomerates (age J12+3). However, these changes are also indicative of the hydraulic behavior of the tunnel and the hydrogeologic environment.
The relatively large changes in groundwater level at PP-3 of 43.03 m are a result of the geologic and hydrogeologic conditions on the location of that observation well. The terrain is built up of highly karstified limestones (ages K13 and K13+4), within the zone of the Dobri Do syncline, with the thinnest package of strata that overlie the tunnel (only 70 m). The location corresponds to tunnel section 4 + 200 m.
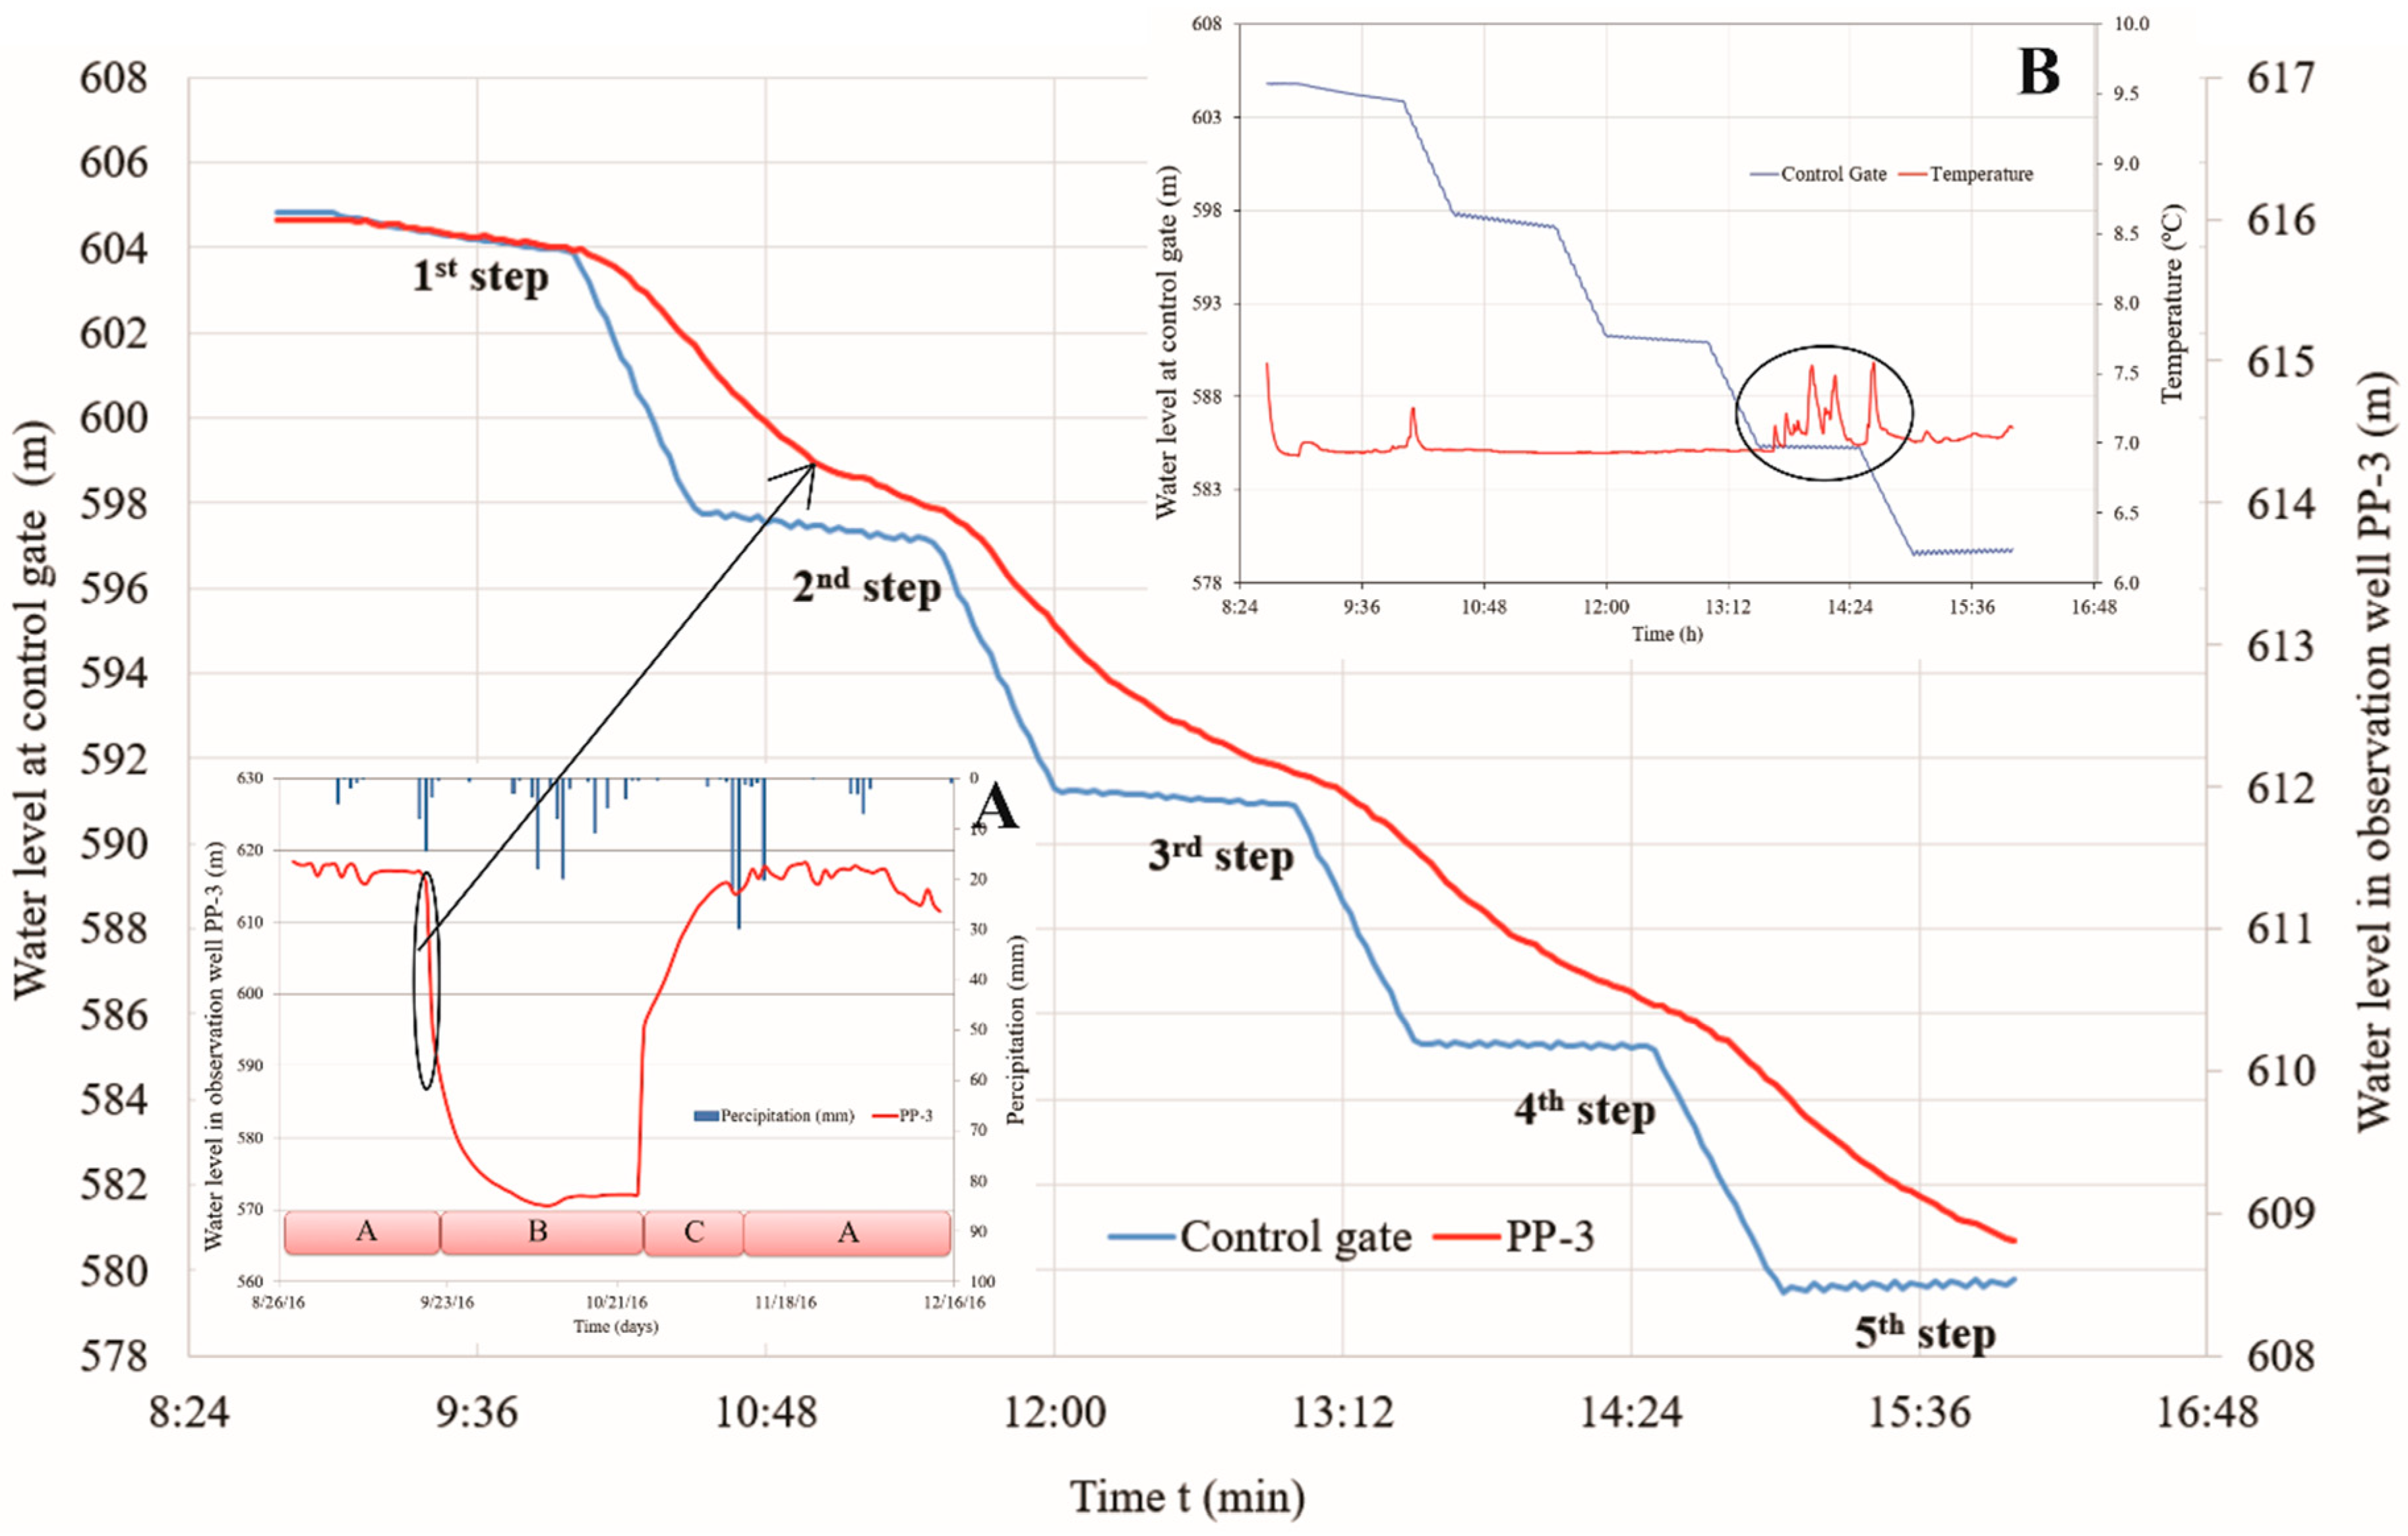
Particularly pronounced changes in groundwater level at PP-3 were detected when the tunnel was offline (out of operation). The summary water losses in the tunnel were reflected in a continuous decrease in the water level in the observation well, as well as at the control gate (Figure 4). The decrease in the groundwater level at PP-3 during the measurement process (7 h) was Δh = 7.49 m, which is indicative of intensive interaction of the water in the tunnel and the hydrogeologic environment within the zone of observation well PP-3. Seepage of groundwater of elevated temperature was detected in step IV of groundwater level holding (Figure 4B). A stable water temperature regime at PP-3 (9.7 °C) indicated that the temperature rise at the control gate did not originate from this zone.
The recession part of the diagram (Figure 3 and Figure 4) reflects the state of a discharged hydrogeologic environment in the central zone of the tunnel and the creation of quasi-natural conditions. As a result of rainfall, the groundwater level increased by 1 m at PP-3, which indicated a well karstified zone. In addition to the active hydraulic connection of the transported water and the groundwater, the propagation of precipitation at PP-3 was rapid.
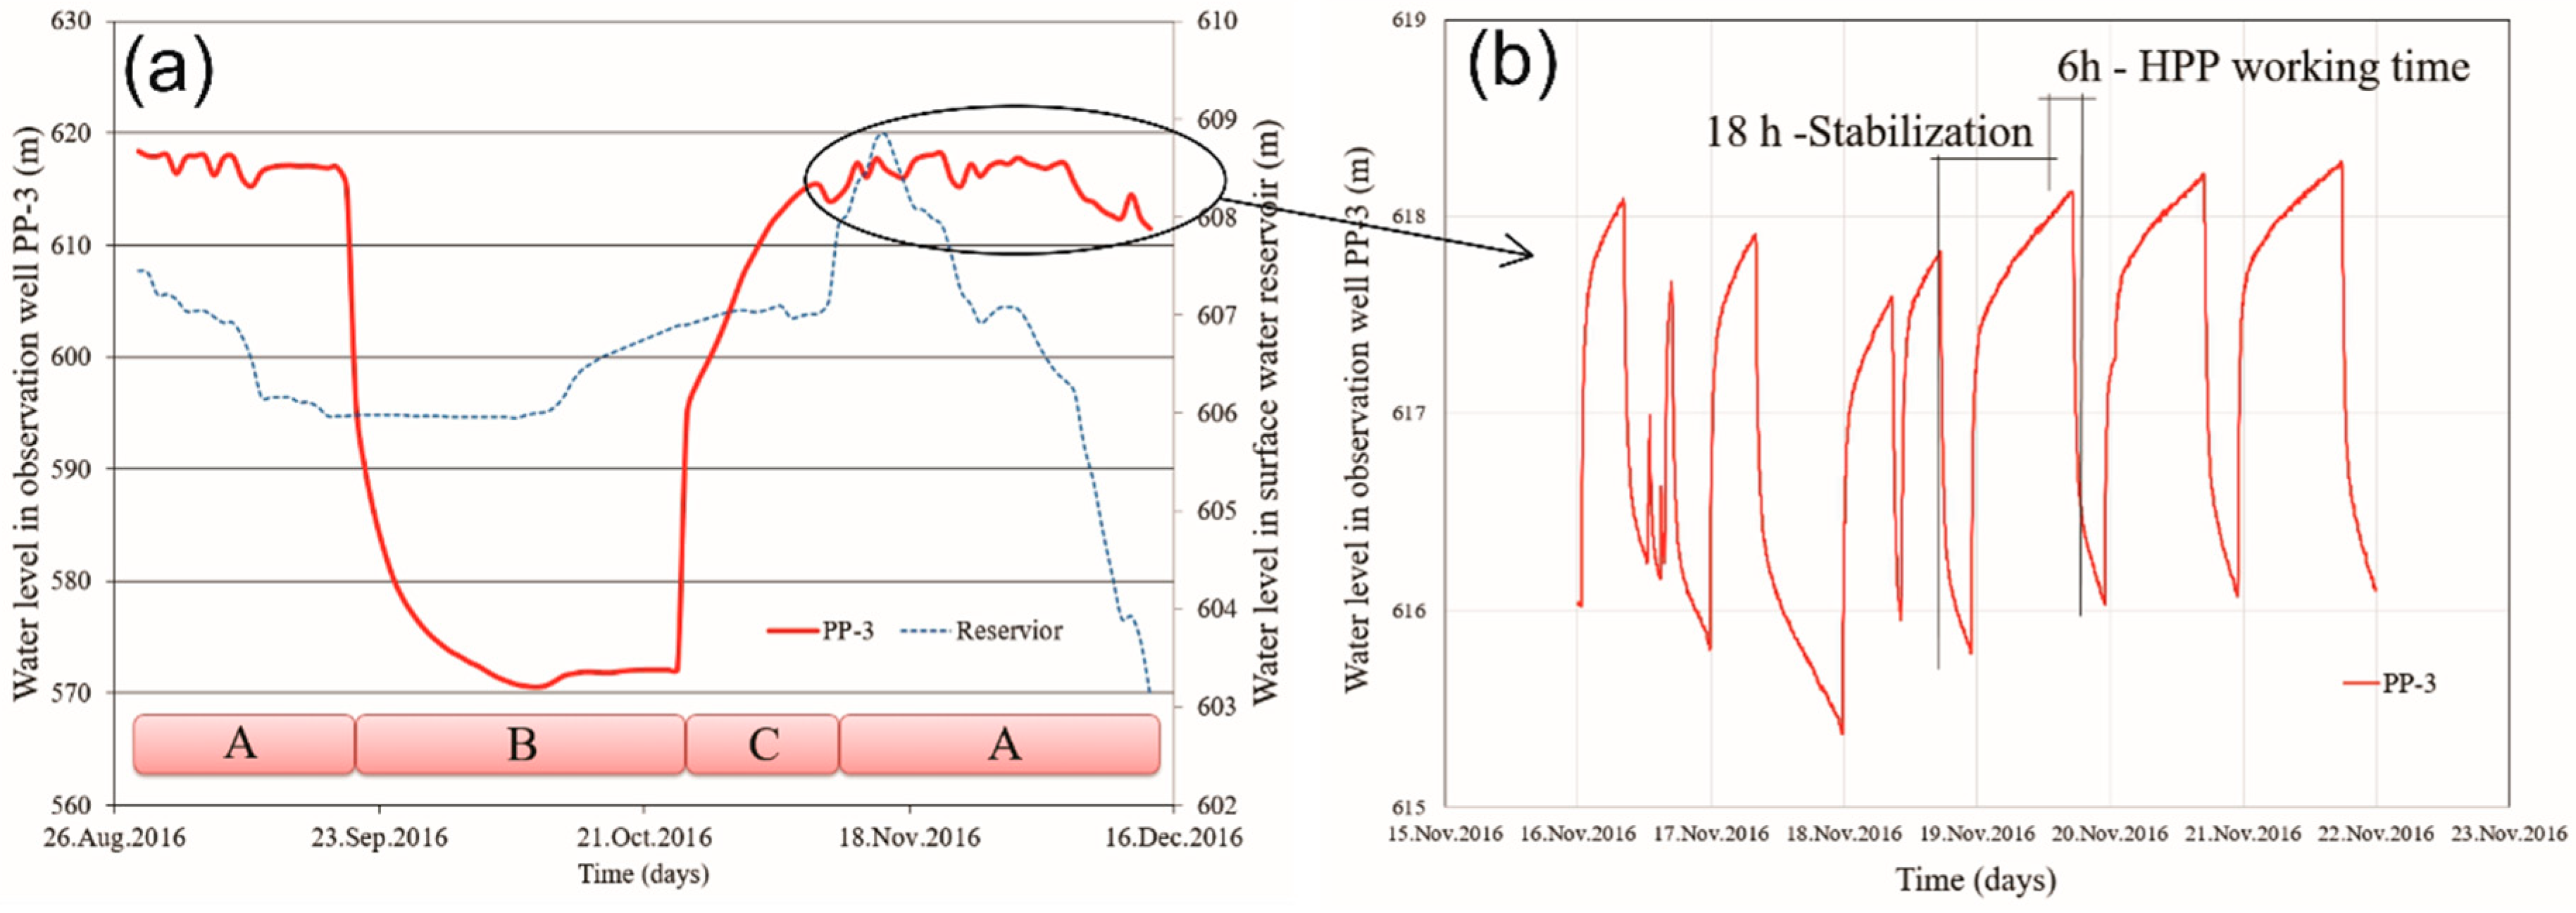
The high reactivity of observation well PP-3 was apparent while the tunnel was being recharged, at which time the pressure in the hydrogeologic environment stabilized. However, there was a particularly high reactivity (instant response of observation well PP-3) while the tunnel was online, when both the tunnel and the hydrogeologic environment were under the influence of the pressure of the transported water (Figure 5).
In the full operating mode of the HPP (4–5 h/day), at PP-3 the transport of water relieved the pressure not only in the tunnel but within the hydrogeologic environment as well. The pressure decrease caused groundwater to seep into the tunnel. After the HPP was placed offline, the pressure stabilized again and the water from the tunnel seeped into the hydrogeologic environment within that zone. Analyses indicated a potentially unstable zone, which is under constant hydraulic load.
In addition to pronounced groundwater level fluctuations at PP-3, there were also changes in groundwater quality. Vertical probing of EC in observation well PP-3 indicated mixing process of highly-mineralized (Total dissolved solids—TDS) groundwater (detected at sampling point 4 + 230 m in the tunnel, EC: 5000–10,200 μS/cm) and the water transported by the tunnel, whose mineral content was much lower (Table 3). When the tunnel was in full operating mode and the pressure of the transported water seeping into the hydrogeologic environment was constant, the TDS pattern changed (EC increased with depth). Conversely, while the tunnel and the hydrogeologic environment were being recharged (Phase C), there was EC inversion as a result of tunnel water (low TDS) seeping into the hydrogeologic environment and “pushing” the higher-TDS water towards the surface. Stabilization through diffusion re-established the usual pattern, with water of lower density closer to the surface (Table 3).
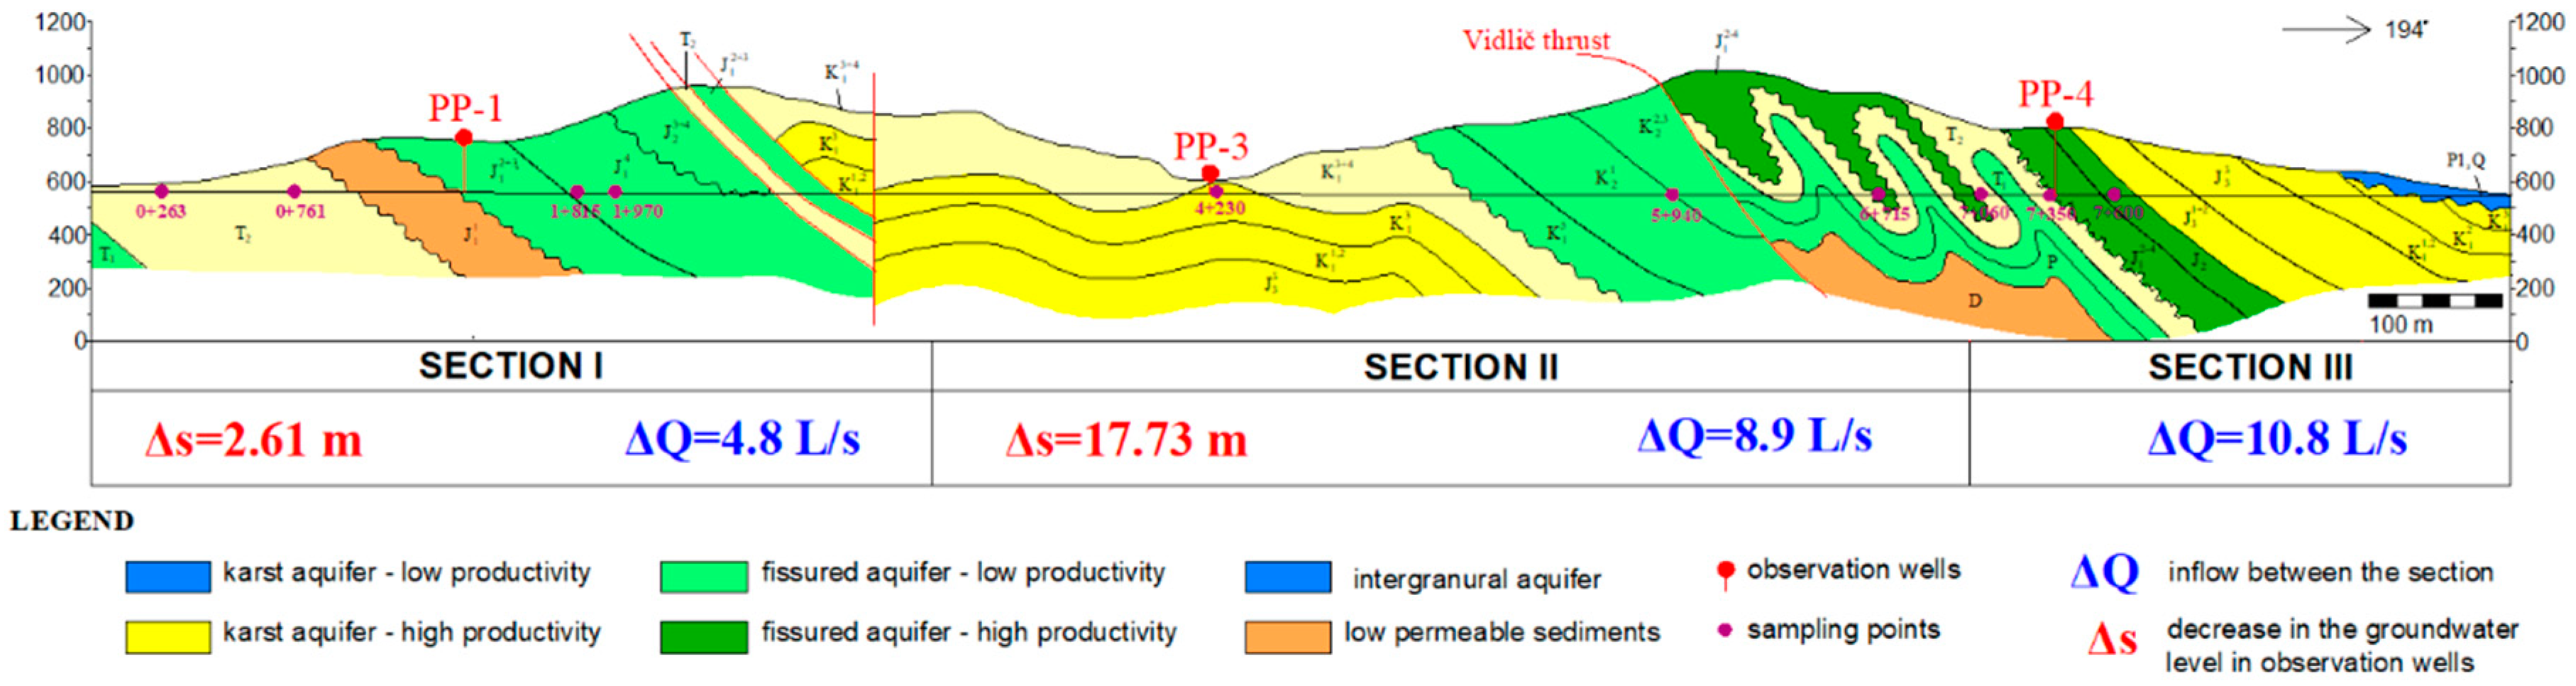
During the course of the investigations in the tunnel, data from consecutive hydrometric measurements were used to identify characteristic tunnel sections (Sections I, II and III) between four observation points (0 + 030, 3 + 160, 6 + 560 and 8 + 530 m). The three sections represent inflows or, more precisely, the differences in inflow between the beginning and end of each tunnel section, and the corresponding observation well (PP-1, PP-3 or PP-4) (Figure 6).
The rate of inflow into Section I indicates seepage mostly from the fractured aquifer (less than 5 L/s) and a much higher groundwater level (65 m at PP-1) relative to the water level of the reservoir, with a difference of 3.18 m when the tunnel was completely empty.
The rate of inflow into Section II was up to 9 L/s and the groundwater level was generally about 11 m higher than the water level of the reservoir when the tunnel was online. The difference between the online and offline status was greatest (43.03 m) at this observation well. A characteristic of Section II is that it had the highest rate of drainage of the karstified zone above the tunnel.
There was constant inflow into Section III of the tunnel from the hydrogeologic environment, with a rate increase of 10.8 L/s. At tunnel section 7 + 350 m, concentric outflow was registered in the bottom of the tunnel, resulting in an increased overall groundwater inflow into this Section. The groundwater level changes at observation well PP-4 suggested that it was not representative and was therefore excluded from the study. High levels of groundwater and low EC values (130 µS/cm) in PP-4 indicates that it is rainwater and that this observation well is not in interaction with the tunnel.
The physical and chemical parameters of the groundwater in the tunnel varied: EC range 243–10,200 µS/cm, ORP −277 to 458 mV, and pH 7–9.1 (alkaline water). Water temperatures were from 8.35 to 17 °C. The higher range (>12 °C, from 5 + 940 to 7 + 600 m) was measured in the deeper part of the rock mass along the contact of the main tectonic units (Vidlič thrust). Measurements of water losses at the control gate (Figure 4) showed an elevated water temperature, which may be a result of groundwater inflow from this section. The presence of diverse groundwater characteristics and water types, from Na–Cl through Na–HCO3 to Ca(Mg)–HCO3, indicated that the heterogeneity of the bedrock and changes in the tunnel’s operating regime had a considerable influence on the hydrochemical conditions. In the final stages of tunnel prospecting, the highest EC and water temperatures, and the lowest ORP were recorded when the natural groundwater regime was restored.
At tunnel section 4 + 230 m, which corresponds to the location of observation well PP-3, the water samples were of the Na–Cl–SO4 type, with extremely high ionic concentrations: Na: 2100 mg/L, Cl: 2310 mg/L and SO4: 1700 mg/L. When pressurized water was transported down the tunnel, the concentrations near PP-3 increased and altered the natural qualitative and quantitative parameters of the groundwater. High concentrations of these ions were also detected in water samples from tunnel sections 1 + 815 m and 1 + 970 m, which correspond to the location of observation well PP-1. This indicated that there was interaction in the entire section of the tunnel from 1 + 815 to 4 + 230 m and was corroborated by the qualitative and quantitative parameters of the groundwater sampled from PP-1, in which a significant increase in the Cl ion concentration was detected while the tunnel was being charged. This section of the tunnel, nearly 2500 m long, was identified as the zone in which the tunnel hydraulically interacts with the hydrogeologic environment.
Based on the standards used to define the level of groundwater aggressiveness to the concrete lining of the tunnel, the most aggressive water, in terms of high chloride and sulfate ion concentrations (Table 4), was sampled at 4 + 230 m of the tunnel. In addition, the water samples from 1 + 970 m exhibited a high sulfate aggressiveness to the tunnel lining. Consequently, these two sections of the tunnel are considered to be the most threatened, from a structural stability perspective.
5. Conclusions
The described monitoring concept for quantitative and qualitative parameters can be applied to identify critical zones with the most significant changes, indicative of potential tunnel lining instability. Monitoring of the physicochemical parameters of groundwater and the determination of their variations can be a good indicator of the interaction between the groundwater and the transported water. In situ measurement of groundwater temperature in the tunnel can facilitate understanding on how the groundwater circulates when the tunnel is offline (i.e., groundwater inflow from deeper parts of the hydrogeologic system is detected).
Groundwater inflow into the tunnel could be detected through water temperature monitoring at the control gate, while summary water losses were gauged. Measurements of water levels in the observation wells and at the tunnel control gate also indicated that there was a hydraulic link between the tunnel and the hydrogeologic environment. In addition, synchronous measurements served to identify the tunnel sections where water level changes were particularly pronounced. The analysis of the total water losses from the tunnel showed that they were relatively acceptable and that their distribution along the tunnel was not uniform. The closer assessment of the zone with the highest water losses pointed to the part of the tunnel where the concrete lining was unstable. Comprehensive tunnel investigations require the determination of the chemical composition of the groundwater that seeps into the tunnel. Hydrochemical data were used to examine their potentially aggressive properties, as well as understand the complexity of the hydrogeologic system.
The establishment of proper monitoring of quantitative and qualitative parameters provides key results for assessing water-conveyance tunnel stability and performance. The proposed research concept is especially useful in the case of complex hydrogeologic systems in karsts.
Author Contributions
Conceptualization, M.Č.I. and I.J.; Methodology, M.Č.I. and I.J.; Investigation, M.Č.I., A.M., M.Ć. and I.J.; Resources, M.Č.I.; Data Curation, M.Č.I., A.M.; Writing-Original Draft Preparation, M.Č.I.; Writing-Review & Editing, M.Č.I.; Visualization, M.Č.I.; Supervision, M.Č.I.
Funding
This research received no external funding.
Conflicts of Interest
The authors declare no conflict of interest.
References
- Marinos, P. Tunnelling and mining in karstic terrane; an engineering challenge. In Geotehnical & Environmental Applications of Karst Geology & Hydrology; Beck, B.F., Herring, J.G., Eds.; CRC Press: Boca Raton, FL, USA, 2001; pp. 3–12. ISBN 90-5809-190-2. [Google Scholar]
- Milanovic, P. Geological Engineering in Karst; Energoprojekt: Belgrade, Serbia, 1999; ISBN 86-83163-02-4. [Google Scholar]
- Klimchouk, A. Hypogene Speleogenesis: Hydrogeological and Morphogenetic Perspective; Special Paper no. 1; National Cave and Karst Research Institute: Carlsbad, CA, USA, 2007; 106p. [Google Scholar]
- Zhang, L.; Franklin, J.A. Prediction of Water Flow into RockTunnels: An Analytical Solution Assuming a Hydraulic Conductivity Gradient. Int. J. Rock Mec. Min. Sci. Geomech. Abstr. 1993, 30, 37–46. [Google Scholar] [CrossRef]
- Font-Capó, J.; Vázquez-Suñé, E.; Carrera, J.; Martí, D.; Carbonell, R.; Pérez-Estaun, A. Groundwater inflow prediction in urban tunneling with a tunnel boring machine (TBM). Eng. Geol. 2011, 121, 46–54. [Google Scholar] [CrossRef]
- Najafi, M.R.; Nabipour, M. The effect of step on the hydraulic characteristics of the subcritical free surface flow in conveyance tunnel. Tunn. Undergr. Space Technol. 2012, 28, 212–217. [Google Scholar] [CrossRef]
- Hassani, A.N.; Katibeh, H.; Farhadian, H. Numerical analysis of steady-state groundwater inflow into Tabriz line 2 metro tunnel, northwestern Iran, with special consideration of model dimensions. Bull. Eng. Geol. Environ. 2015, 75, 1617–1627. [Google Scholar] [CrossRef]
- Zarei, H.R.; Uromeihy, A.; Sharifzadeh, M. Evaluation of hight lokal groundwater inflow to a rock tunnel by charactization of geological features. Tunn. Undergr. Space Technol. 2011, 26, 364–373. [Google Scholar] [CrossRef]
- Chen, Y.F.; Hong, J.M.; Zheng, H.K.; Li, Y.; Hu, R. Evaluation of groundwater leakage into a drainage tunnel in Jinping-I Arch Dam foundation in Southwestern China: A case study. Rock Eng. 2016, 49, 961–979. [Google Scholar] [CrossRef]
- Shin, J.H.; Kim, S.H.; Shin, Y.S. Long-term mechanical and hydraulic interaction and leakage evaluation of segmented tunnels. Soil Found. 2012, 52, 38–48. [Google Scholar] [CrossRef]
- Cardarelli, E.; Marrone, C.; Orlando, L. Evaluation of tunnel stability using integrated geophysical methods. J. Appl. Geophys. 2003, 52, 93–102. [Google Scholar] [CrossRef]
- Andjelković, V.; Lazarević, Ž.; Nedović, V.; Stojanović, Z. Application of the pressure grouting in the hydraulic tunnels. Tunn. Undergr. Space Technol. 2013, 37, 165–179. [Google Scholar] [CrossRef]
- EN 206-1. European Standardization Committee, Concrete—Part 1: Specification, Performance, Production and Conformity, EN 206-1; NSAI: Northwood, Dublin, Ireland, 2002. [Google Scholar]
- California Department of Transportation; Materials Engineering and Testing Services; Cossosion Technology Branch. Corrosion Guidelines; The California Department of Transportation: Sacramento, CA, USA, 2003.
- Al-Husseini, A.H.E. Study of potential Corrosion and Scaling for Treated Water of Two Water Treatment plants in Al-Hilla City. J. Babylon Univ. Eng. Sci. 2012, 4, 234–241. [Google Scholar]
- Leitz, F.; Guerra, K. Water Chemistry Analysis for Water Conveyance, Storage and Desalination Projects Manuals and Standards Program; Technical Service Center, Water Treatment Group: Denver, CO, USA, 2013.
Figure 1.
Geographic position of the study area and schematic representation of the longitudinal section of the tunnel, including elevations.
Figure 1.
Geographic position of the study area and schematic representation of the longitudinal section of the tunnel, including elevations.

Figure 2.
Geological map of the study area.

Figure 3.
(a) Comparative plots of groundwater levels in observation wells PP-1 and PP-3, (b) Comparative plots of groundwater levels in observation well PP-1 and the water level in surface water reservoir, (c) Comparative plots of groundwater levels in observation well PP-3 and the water level in surface water reservoir, by phase (A, B and C).

Figure 4.
Comparative diagram of groundwater level in PP-3 and at the control gate (CG) while there were water losses from the tunnel, showing the entire period of monitoring of groundwater level in PP-3 (A) and water temperature at the control gate (B).
Figure 4.
Comparative diagram of groundwater level in PP-3 and at the control gate (CG) while there were water losses from the tunnel, showing the entire period of monitoring of groundwater level in PP-3 (A) and water temperature at the control gate (B).

Figure 5.
(a) Changes of groundwater level at PP-3 (b) Operating time—HPP work time and pressure stabilization.
Figure 5.
(a) Changes of groundwater level at PP-3 (b) Operating time—HPP work time and pressure stabilization.

Figure 6.
Hydrogeological section along the tunnel with groundwater sampling points (including groundwater inflow rates and comparative decreases in groundwater levels at the observation wells, relative to the tunnel sections).
Figure 6.
Hydrogeological section along the tunnel with groundwater sampling points (including groundwater inflow rates and comparative decreases in groundwater levels at the observation wells, relative to the tunnel sections).


Table 1.
Observation periods.
| Phase | Tunnel Mode | Beginning–End of Observation | Duration of Phase |
|---|---|---|---|
| A | Tunnel online, pressurized | 28 August 2016–19 September 2016 | 23 days |
| B | Tunnel offline | 19 September 2016–24 October 2016 | 35 days |
| C | Tunnel back online | 24 October 2016–13 December 2016 | 83 days |
| A |
Table 2.
Changes in water levels in the reservoir and observation wells PP-1 and PP-3, by operating phase of the tunnel.
Table 2.
Changes in water levels in the reservoir and observation wells PP-1 and PP-3, by operating phase of the tunnel.
| PHASE | A | B | C | A |
|---|---|---|---|---|
| ΔS(m)/Reservoir | 1.48 | 0.92 | 1.01 | 4.78 |
| ΔS (m)/PP-1 | 0.76 | 3.18 | 0.51 | 2.85 |
| ΔS (m)/PP-3 | 3.18 | 43.03 | 42.14 | 2.85 |
Table 3.
Change in EC as a function of depth at PP-3 in the various phases.
| Phase | A | B | C | A |
|---|---|---|---|---|
| Depth (m) | EC (µS/cm) | |||
| 15 | 672 | 1261 | ||
| 20 | 681 | 1267 | ||
| 25 | 689 | 1268 | ||
| 30 | 695 | 1263 | ||
| 35 | 697 | 1711 | 1265 | |
| 40 | 709 | 1700 | 1444 | |
| 45 | 787 | 1605 | 1517 | |
| 50 | 1077 | 727 | 1325 | 1517 |
| 55 | 1519 | 730 | 843 | 1523 |
| 60 | 1581 | 1818 | 566 | 1705 |
| 65 | 1585 | 1833 | 489 | 1764 |
Table 4.
Classification of the aggressiveness of groundwater sampled from HPP Pirot tunnel.
| Parameter | Threshold Value | Reference | Number of Aggressive Waters/Sampling Points | Sampling Points in Tunnel (m) |
|---|---|---|---|---|
| pH | ≤6.5 | [9] | 0 | - |
| Mg (mg/L) | >300 | [9] | 0 | - |
| SO4 (mg/L) | ≥200 | [9] | 2 | 1 + 970, 4 + 230 |
| Cl (mg/L) | >500 | [10] | 1 | 4 + 230 |
| LSki | >1.2 | [11,12] | 1 | 4 + 230 |
© 2019 by the authors. Licensee MDPI, Basel, Switzerland. This article is an open access article distributed under the terms and conditions of the Creative Commons Attribution (CC BY) license (http://creativecommons.org/licenses/by/4.0/).
Share and Cite
MDPI and ACS Style
Čokorilo Ilić, M.; Mladenović, A.; Ćuk, M.; Jemcov, I. The Importance of Detailed Groundwater Monitoring for Underground Structure in Karst (Case Study: HPP Pirot, Southeastern Serbia). Water 2019, 11, 603. https://doi.org/10.3390/w11030603
AMA Style
Čokorilo Ilić M, Mladenović A, Ćuk M, Jemcov I. The Importance of Detailed Groundwater Monitoring for Underground Structure in Karst (Case Study: HPP Pirot, Southeastern Serbia). Water. 2019; 11(3):603. https://doi.org/10.3390/w11030603
Chicago/Turabian StyleČokorilo Ilić, Marina, Ana Mladenović, Marina Ćuk, and Igor Jemcov. 2019. "The Importance of Detailed Groundwater Monitoring for Underground Structure in Karst (Case Study: HPP Pirot, Southeastern Serbia)" Water 11, no. 3: 603. https://doi.org/10.3390/w11030603
Note that from the first issue of 2016, this journal uses article numbers instead of page numbers. See further details here.