A Study on the Motion of Partial Air Cushion Support Catamaran in Regular Head Waves

College of Shipbuilding Engineering, Harbin Engineering University, Harbin 150001, China
*
Author to whom correspondence should be addressed.
Water 2019, 11(3), 580; https://doi.org/10.3390/w11030580
Submission received: 11 January 2019
/
Revised: 13 March 2019
/
Accepted: 14 March 2019
/
Published: 20 March 2019
(This article belongs to the Special Issue Applications of Computational Fluid Dynamics for Marine and Offshore Engineering)
Abstract
:In this paper, the motion of partial air cushion support catamaran (PACSCAT) sailing in regular waves was firstly investigated by the experimental method. The monitored histories of heave, pitch, midship acceleration, and air cushion pressure in towing tests are performed to analyze the influence of air cushion on the periodicity feature of hull body motion. Subsequently, using the finite volume method (FVM)-based CFD software Star-ccm, numerical simulations are carried out for the PACSCAT model with a simplification of the air cushion system. The detailed flow information of wave evolution, pressure, and velocity distribution is investigated. The calculated oscillation characteristics of different motion parameters are compared with those from experiment and show good agreement. The numerical method also has good capacity in the prediction of amplitude response of heave and midship acceleration; however, large error is found when calculating resistance and amplitude response of pitch.
1. Introduction
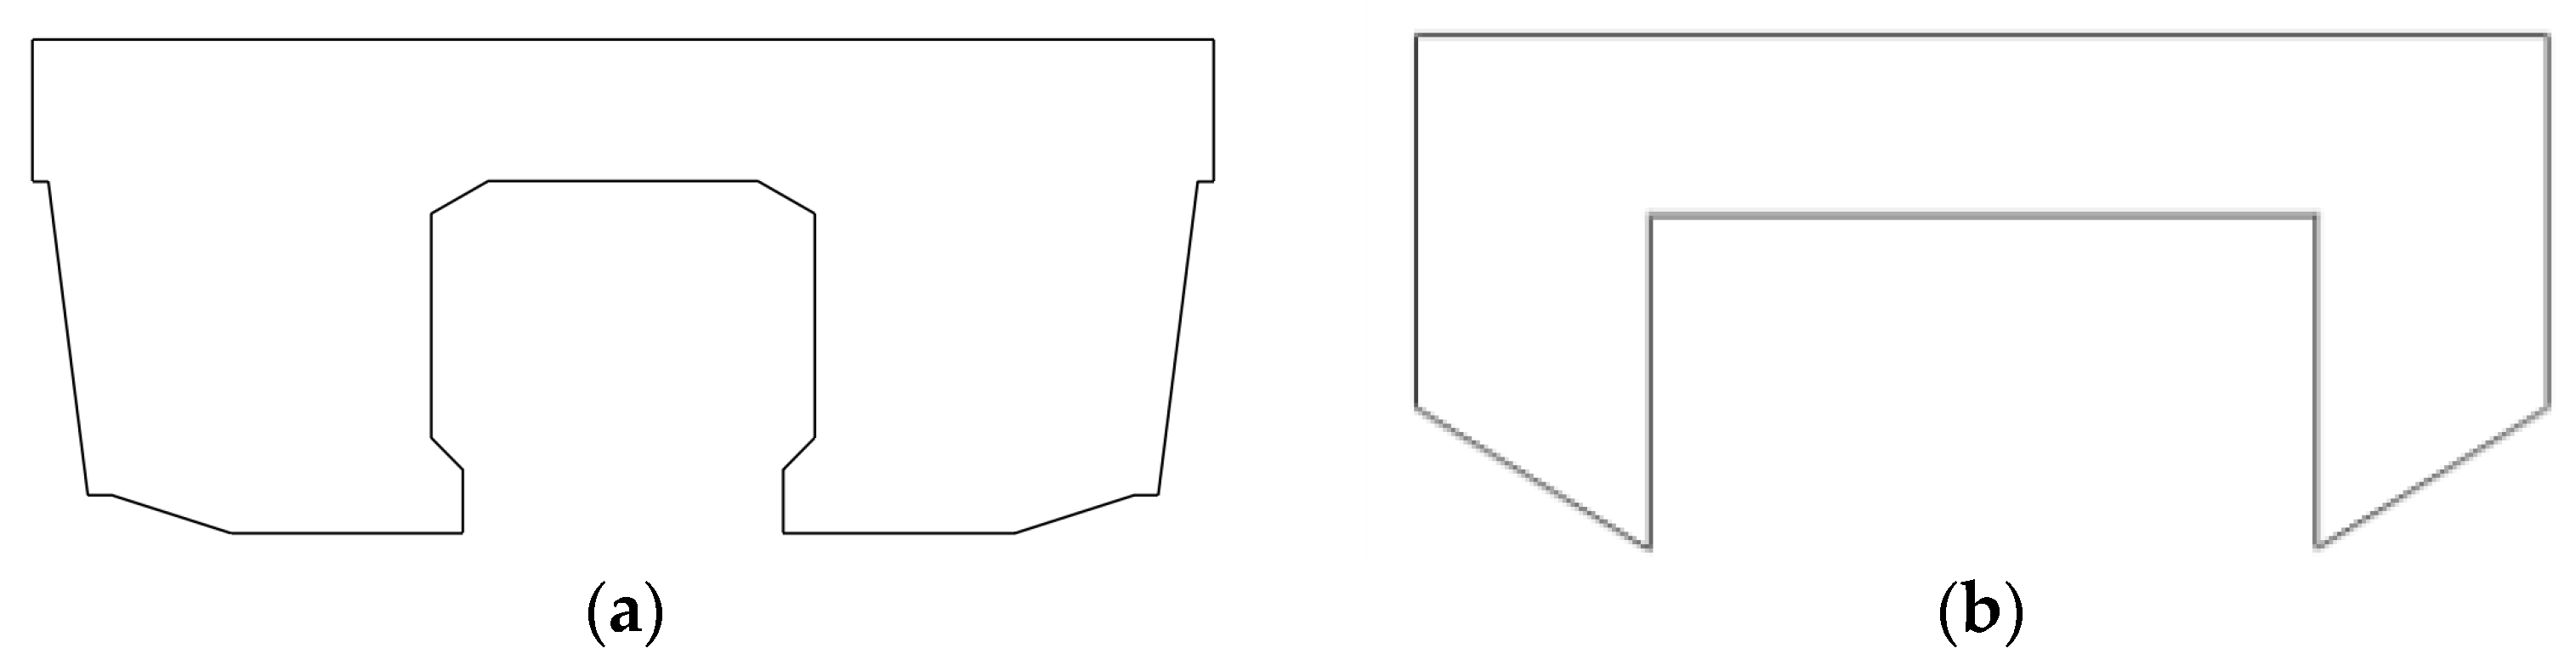
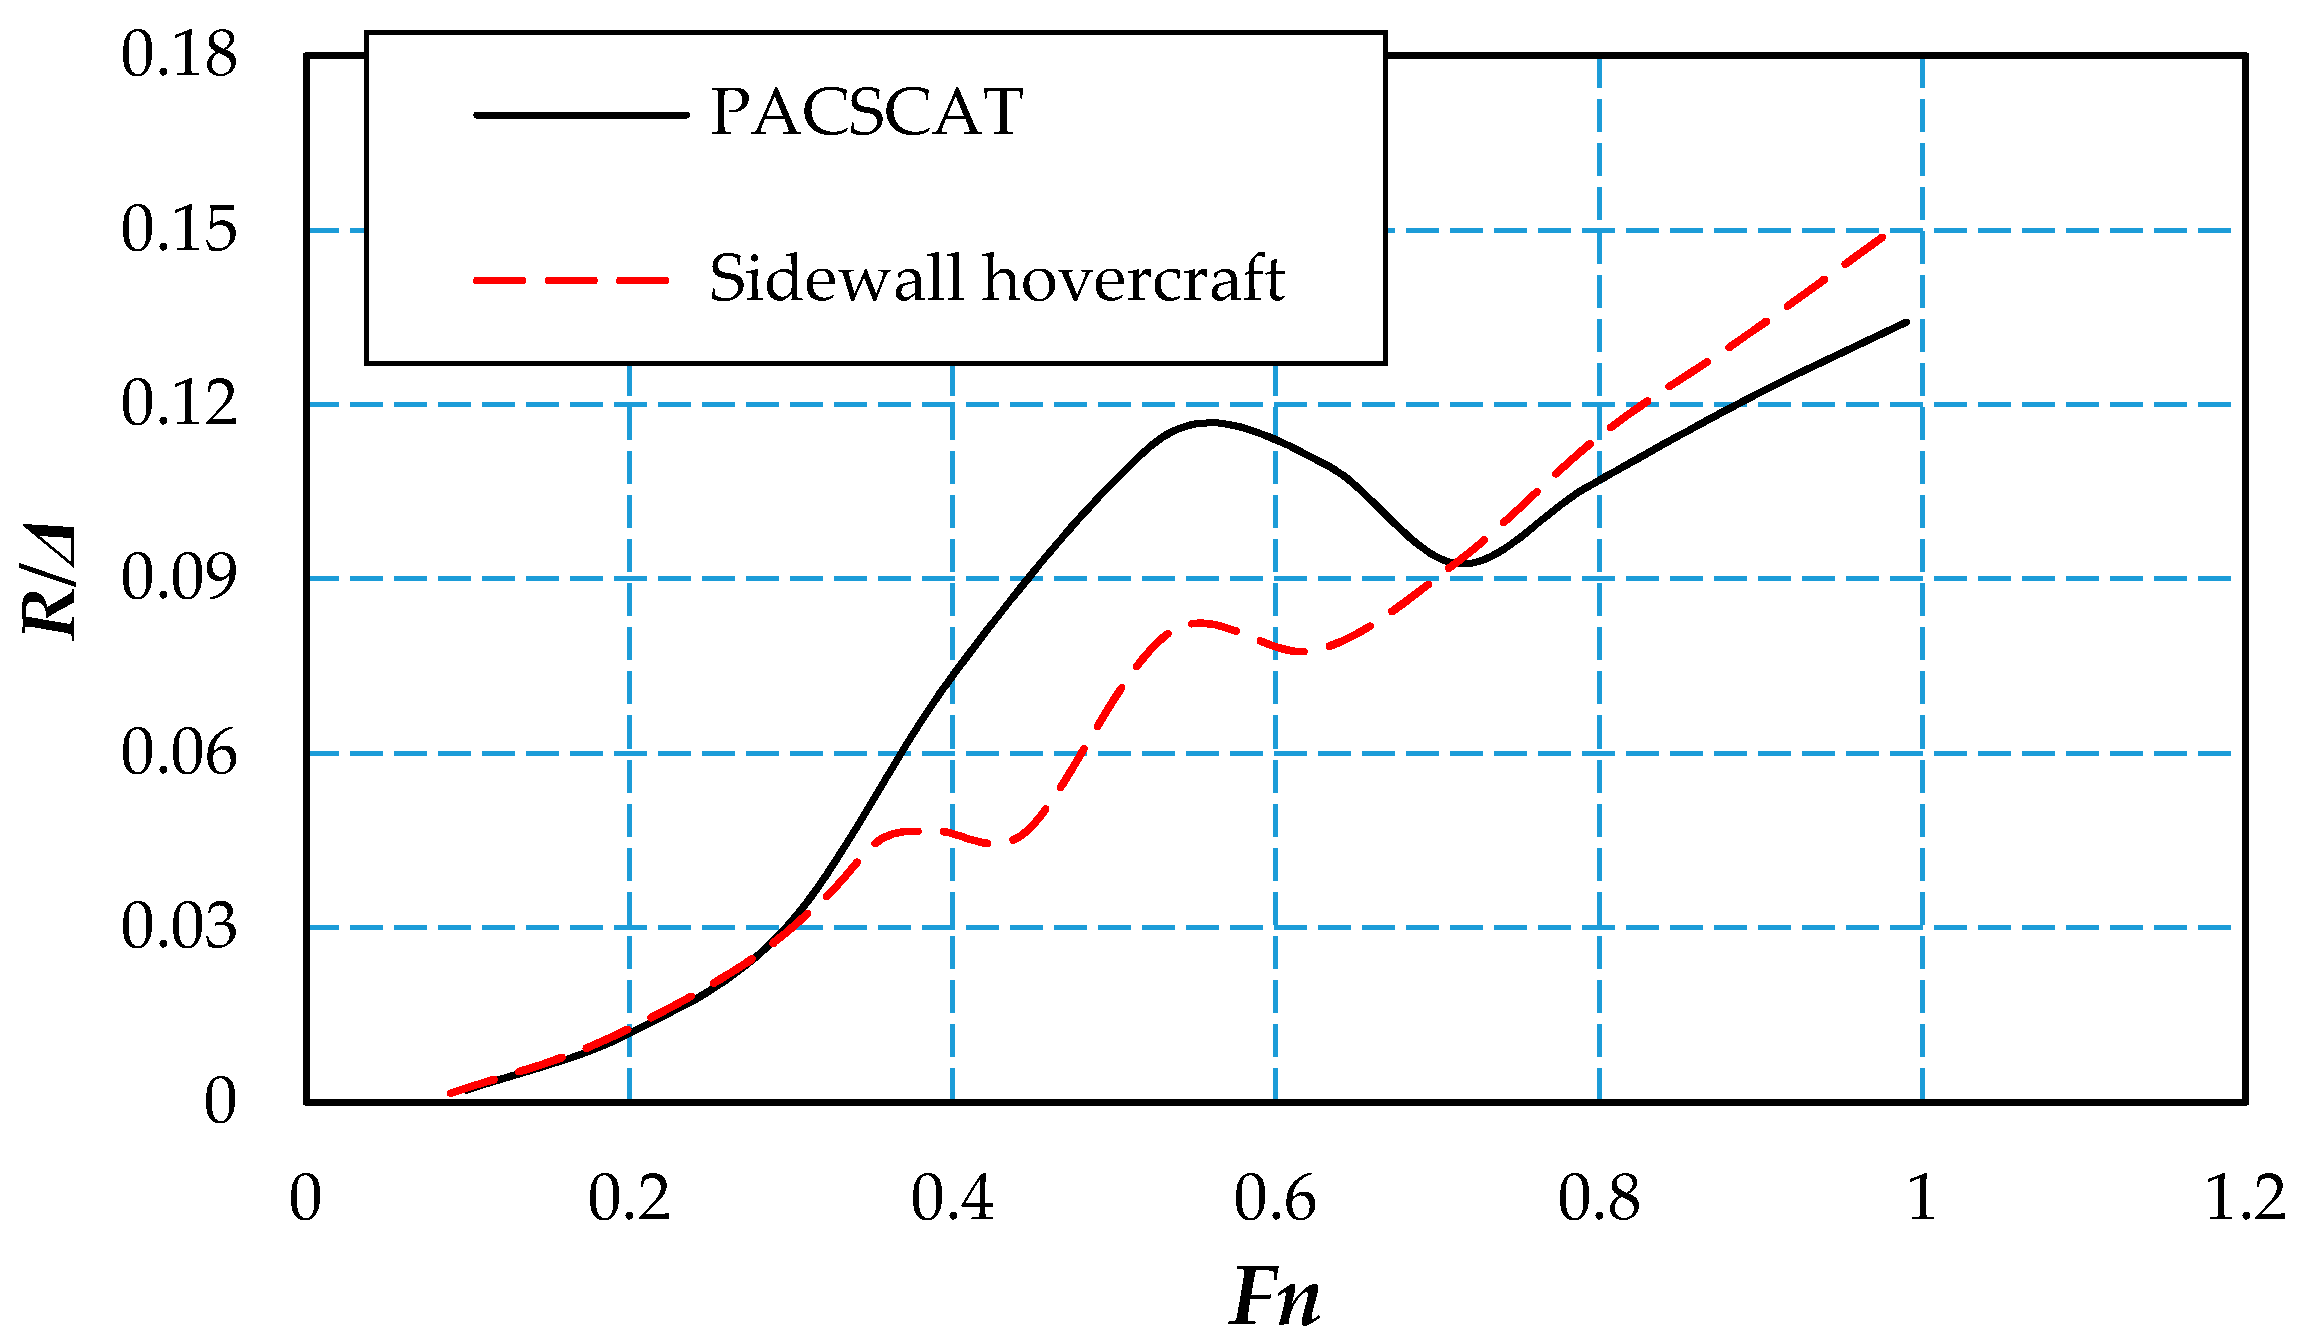
The partial air cushion support catamaran (PACSCAT) is a kind of new high-performance vessel, which is developed based on a thin catamaran and partially supported by air cushion. This ship contains the characteristics of a conventional high-speed displacement ship and hovercraft, and combines the advantages of a catamaran and air cushion technology during navigation. Benefitting from this, the requirements of high speed and variable draft can be satisfied as load and speed are kept in a good balance. PACSCAT has excellent hull lines and a wide side-hull. Its cushion lifting power accounts for less than 10% of the total, while the hull supported by air cushion accounts for 25%–50%. Compared with the sidewall hovercraft, PACSCAT has a wider side-hull (Figure 1), which means that the jet pump or the water propeller can be used as propulsion system, of which the propulsive efficiency can be improved significantly compared with an air propeller. In terms of resistance (Figure 2), PACSCAT does not show any more advantages than a sidewall hovercraft, but at a higher speed stage or in rough sea states, it possesses better sea-keeping performance. In addition, PACSCAT has excellent sitting pier performance—the side-hull has a flat bottom, making it more convenient to land in the shallow. That is to say, this hull form is very applicative when designing ship-borne landing craft, such as dock landing ship or amphibious assault ship. At present, the PACSCAT and other cushion-supported ships have drawn worldwide attention—the United States, Sweden [1], and other countries have developed new types of naval warship with cushion effect, while the British Ministry of Defense selects PACSCAT as the main landing craft for future naval transport operations [2].
Generally, the hull behavior of PACSCAT in waves become more complex than a conventional ship because of the coupling effect of air cushion and waves. Emergence of the wave trough may increase high-pressure air leakage under the side-hull, and periodic sway of the hull body in waves would also lead to non-uniform air leakage from the fore and aft air bag. The direct consequence of air leakage is the variation of air cushion lift, which would, in turn, affect the hull body motion. Thus, it is necessary to consider the influence of air cushion pressure on hull behavior when investigating the motion characteristics of PACSCAT in regular waves.
So far, many researchers have focused on the research of similar types of ships navigating in waves. For instance, the motion of a sidewall hovercraft in the coastal state was studied by Dhanak [3]. Tore et al. found that the cobble phenomenon of sidewall hovercraft in regular waves was caused by the flexible strain of the tail gas sealing device, and discussed the influence of the main factors on the characteristics of the tail gas sealing [4]. Joost analyzed the motion and resistance characteristics of a sidewall hovercraft in regular waves by means of theoretical and experimental methods [5]. Manhar studied the effect of near-shore wave on sidewall hovercraft motion and air cushion pressure [3]. Lawren discussed the hydrodynamic performance of a sidewall hovercraft in near-shore head sea [6]. Reynolds et al. analyzed the motion of the cushion-supported ship by solving the motion equations [7]. Wu et al. used the strip theory to process interpolation calculation on added mass and damping factor of the sidewall hovercraft; the results of the coupled motion of roll and heave in beam sea were also presented [8].
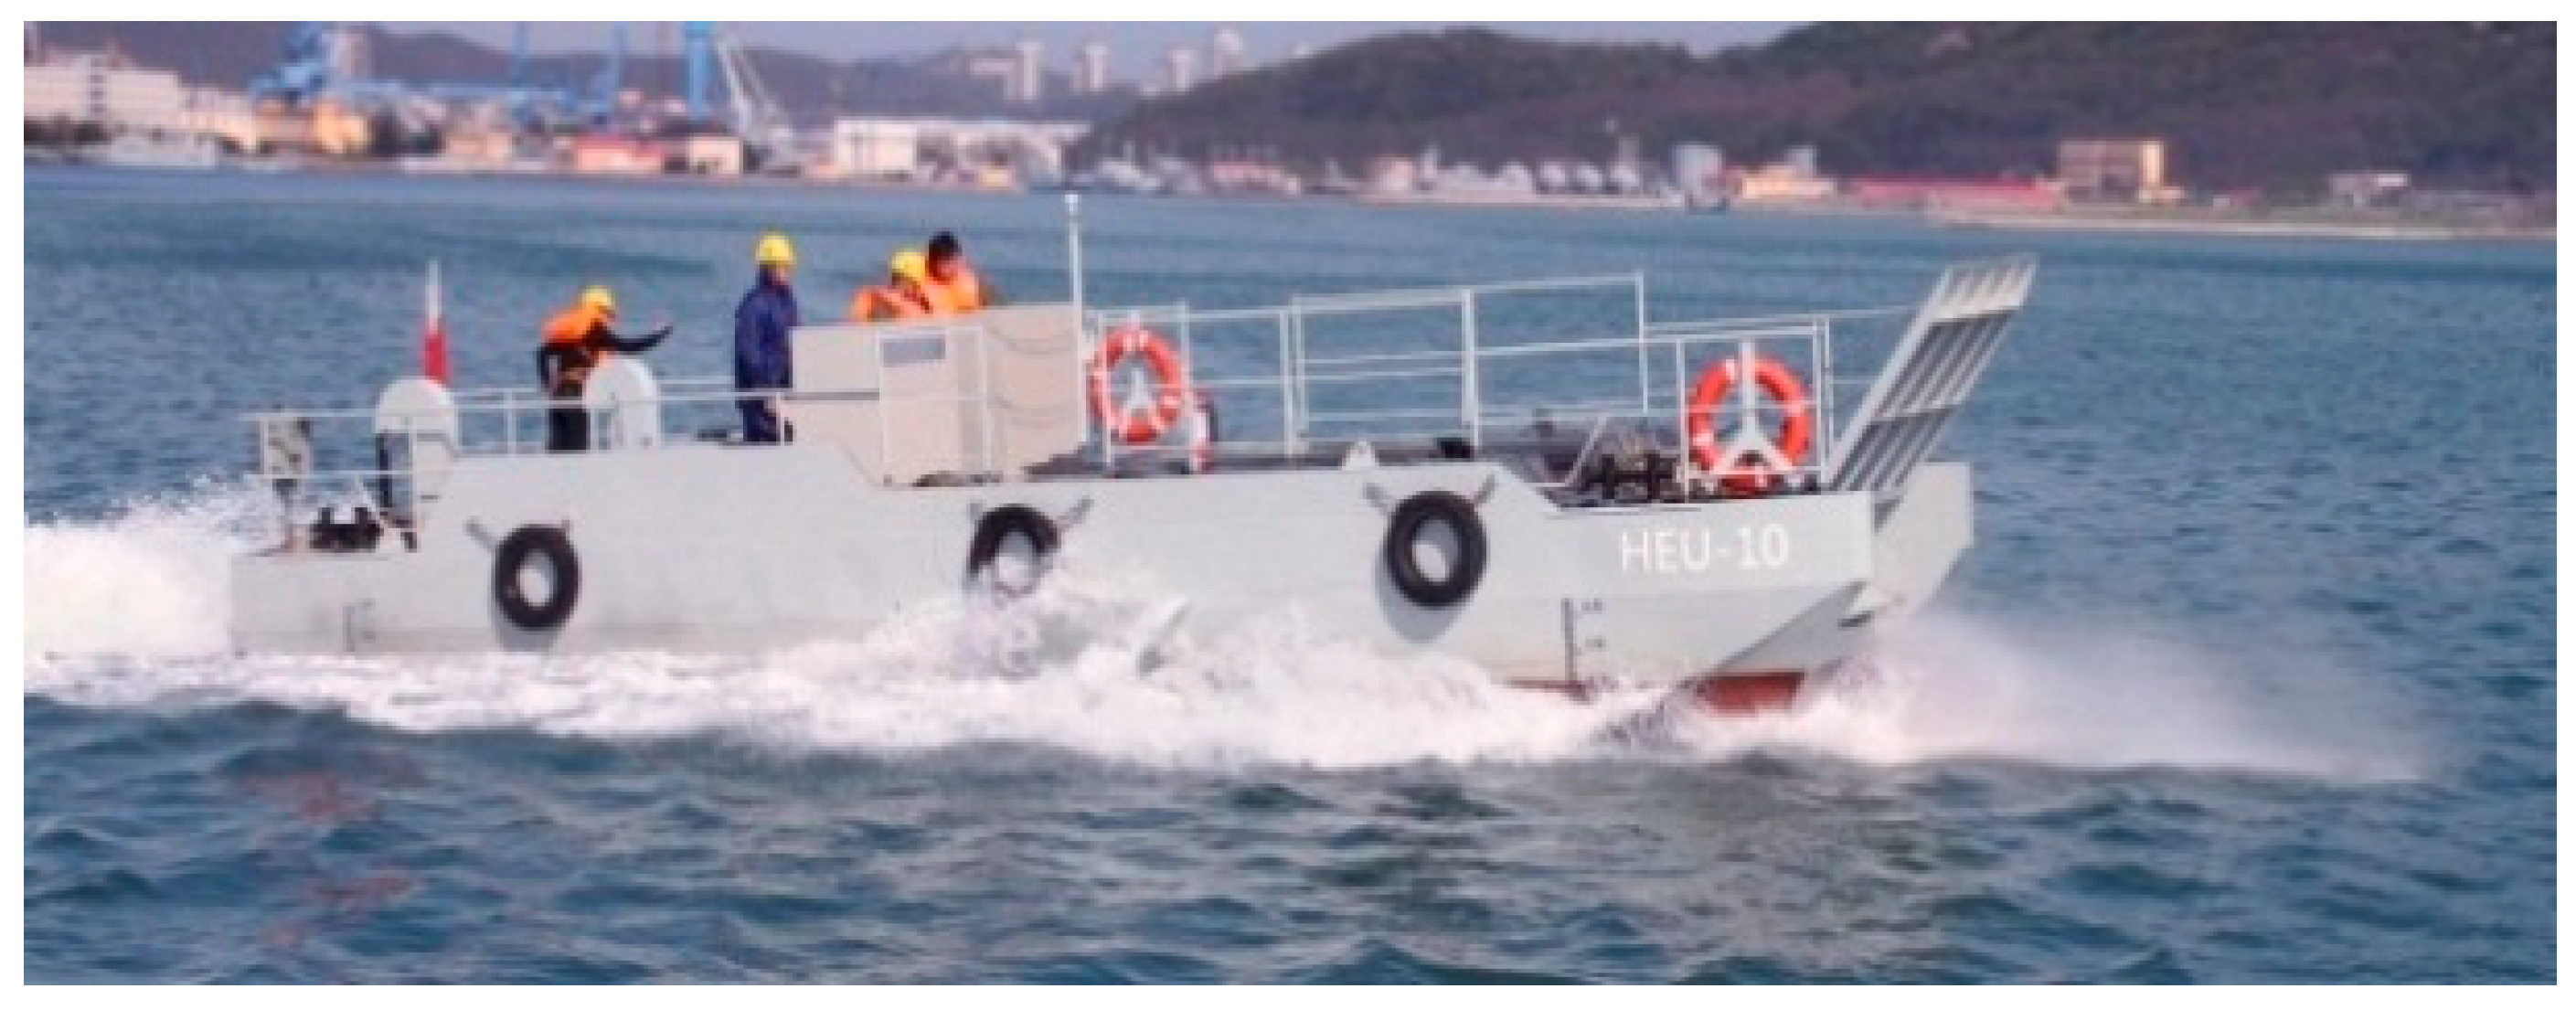
In 2010, Harbin Engineering University (HEU) begun the research of PACSCAT based on the sidewall hovercraft technology and improved its resistance and sea-keeping performance by a series of hull form optimizations and model tests. Guo et al. utilized a numerical method to investigate the seakeeping performance of PACSCT, which combines the 2.5D theory for solving hydrodynamics problem with simplified wave-equation for solving aerodynamic of pressurized air [9]; their method was further improved to evaluate the waves due to pulsating pressure of air cushion [10]; the related studies were also performed for SES (surface effect ship) [11] and T-craft [12]. In order to verify the implementation effect of the developed technology, HEU designed and built a 12 m long aluminous test craft (Figure 3), based on which the experiment could be implemented in real scale and reliable trial data could be recorded—their work laid a good foundation for further investigation.
The investigation presented in this paper is about some work at the preliminary research stage of PACSCAT. Firstly, geometric characteristics of PACSCAT model, design of the air cushion system, and the experimental set up are described; furthermore, the results of motion parameters and air cushion pressure are given for operation conditions with different wave lengths and speeds. Then, a brief introduction of the numerical method is presented, followed by a mesh convergence study. Using the numerical tools, the simulation of forward motion in waves is carried out, and the calculated results of flow information and motion parameters are presented and compared with the experimental results.
2. Model Experiments
2.1. Hull Geometry
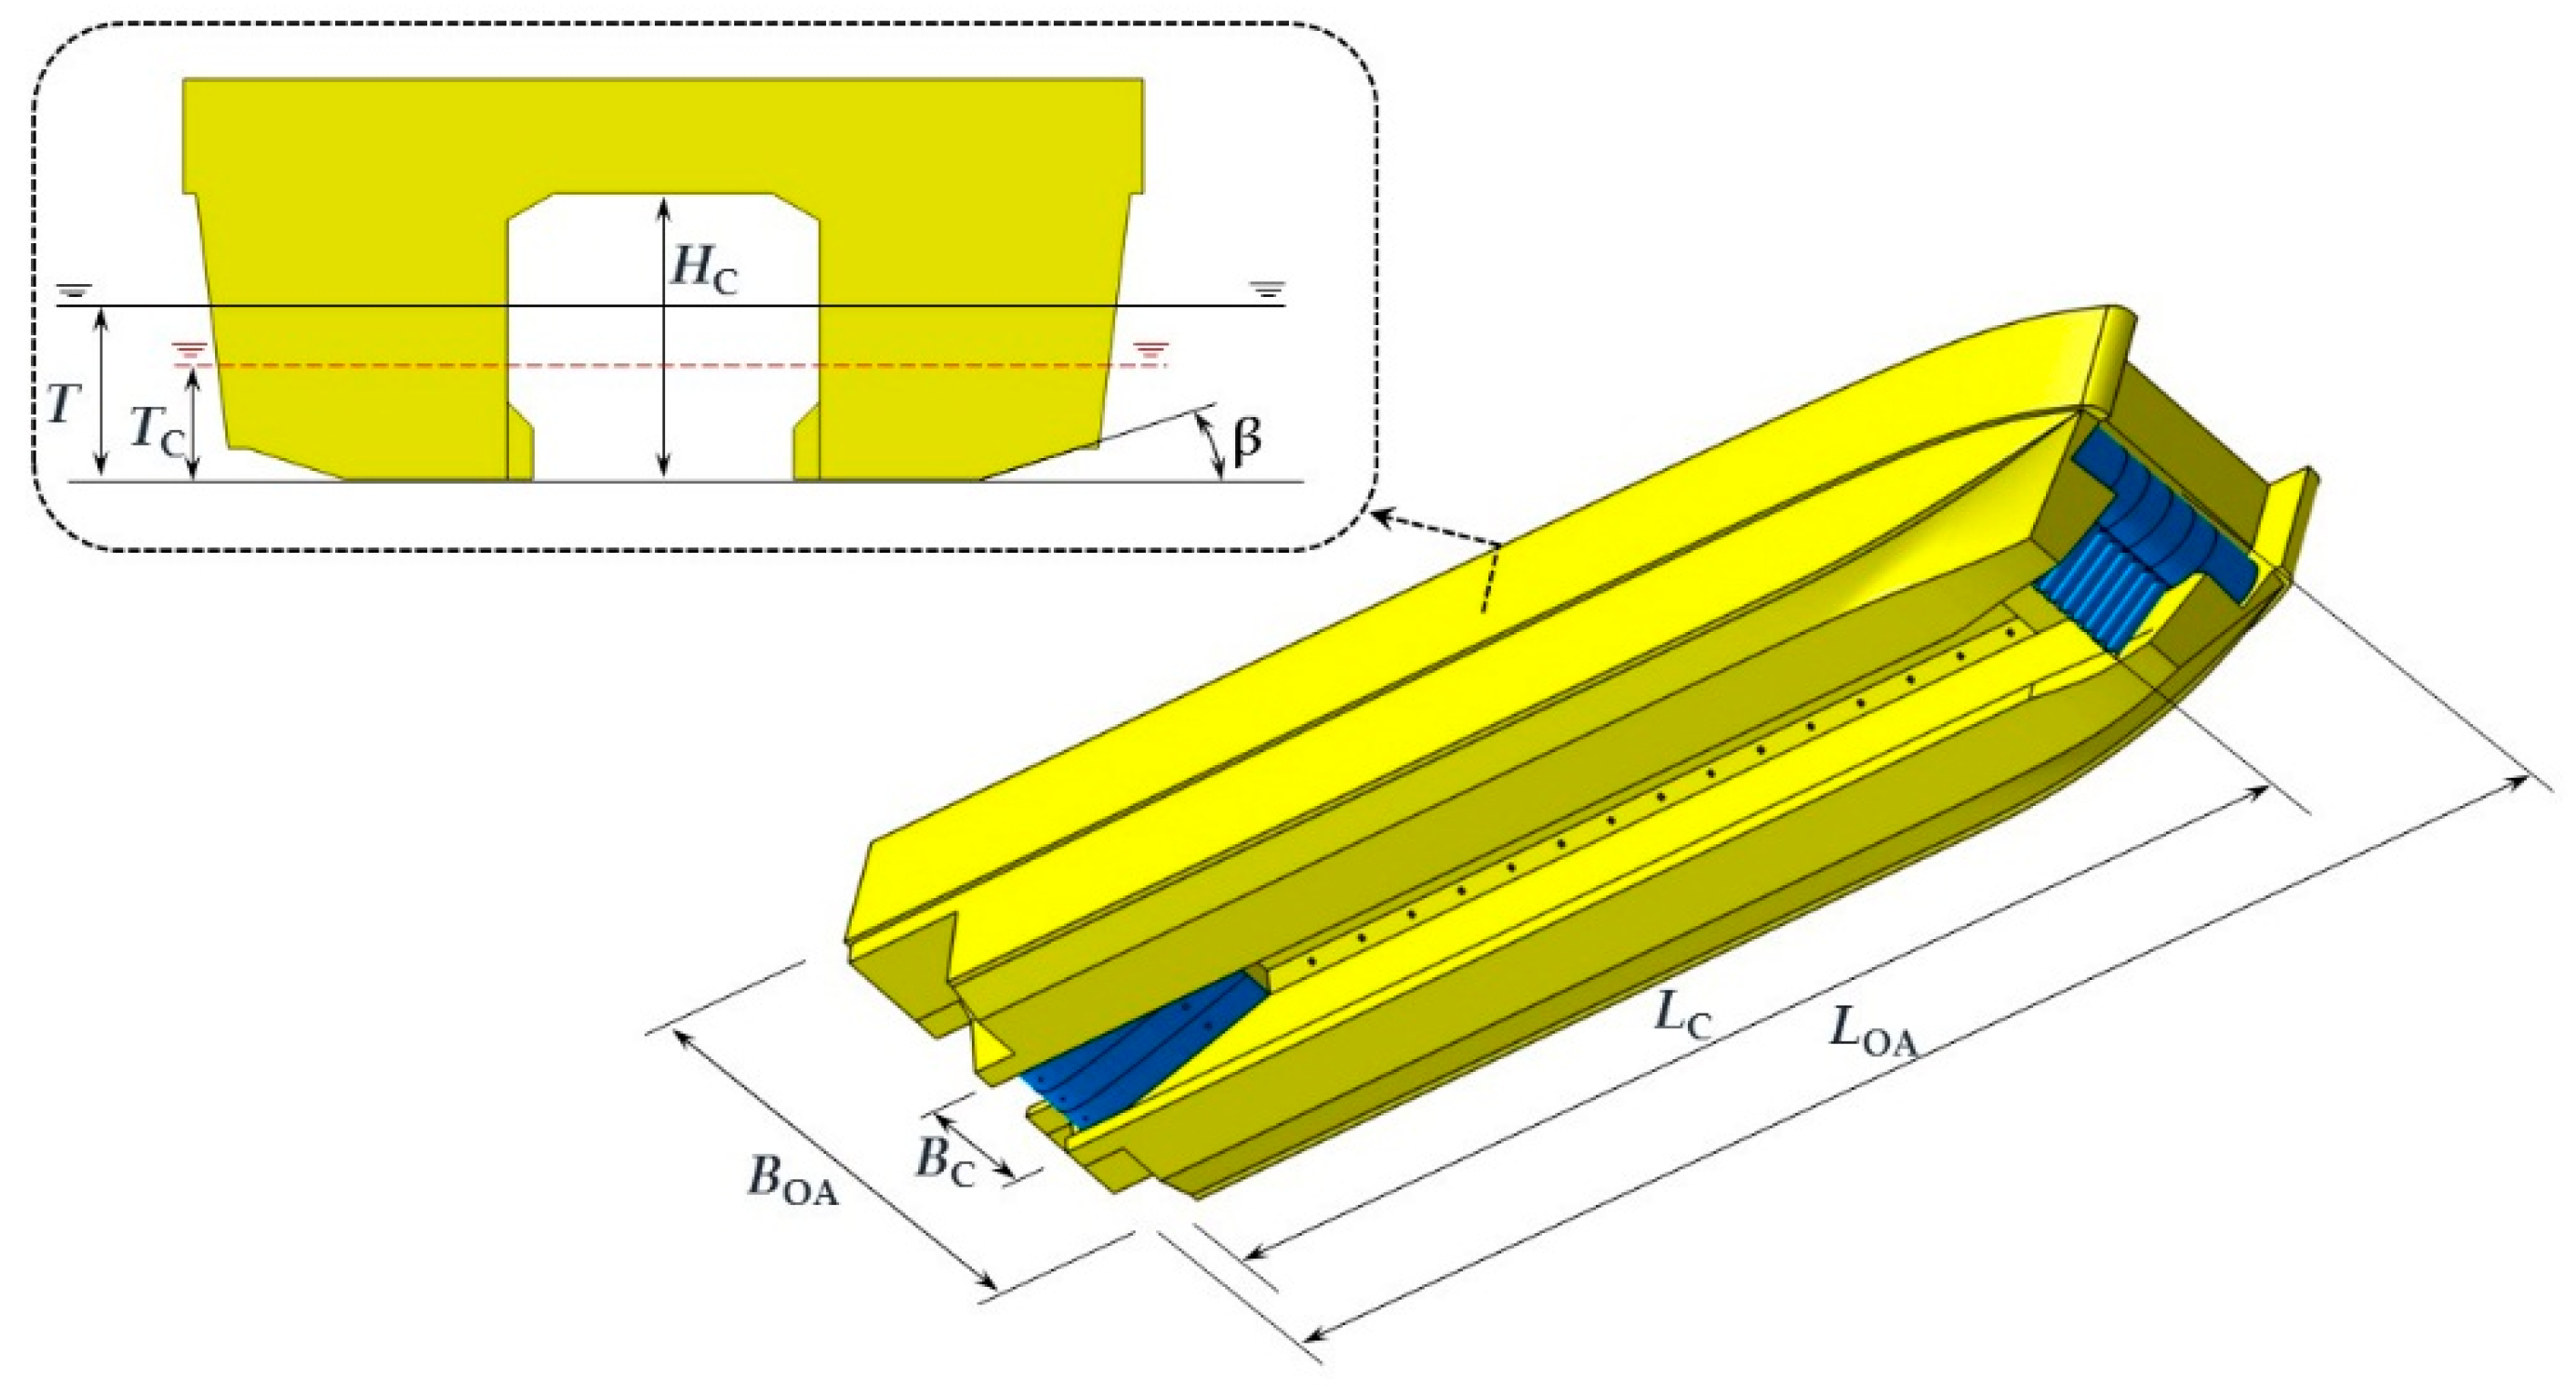
The hull geometry of PACSCAT investigated in this paper is shown in Figure 4, a 1:10 scaled model was built of solid wood for the towing test. Table 1 summarizes the main dimensions of the experimental model, in which the air cushion length is the distance between the lowest point of bow and stern seal, while the air cushion beam is the largest span between side-hulls. The two side-hulls are the main underwater structures and provide the most buoyancy and hydrodynamic forces. To land in the shallow water, the inner shell of the side-hull bottom is flat, while, taking into account sea keeping performance, the outer shell is gradually raised until intersecting with the broadside.
2.2. Experimental Conditions and Devices
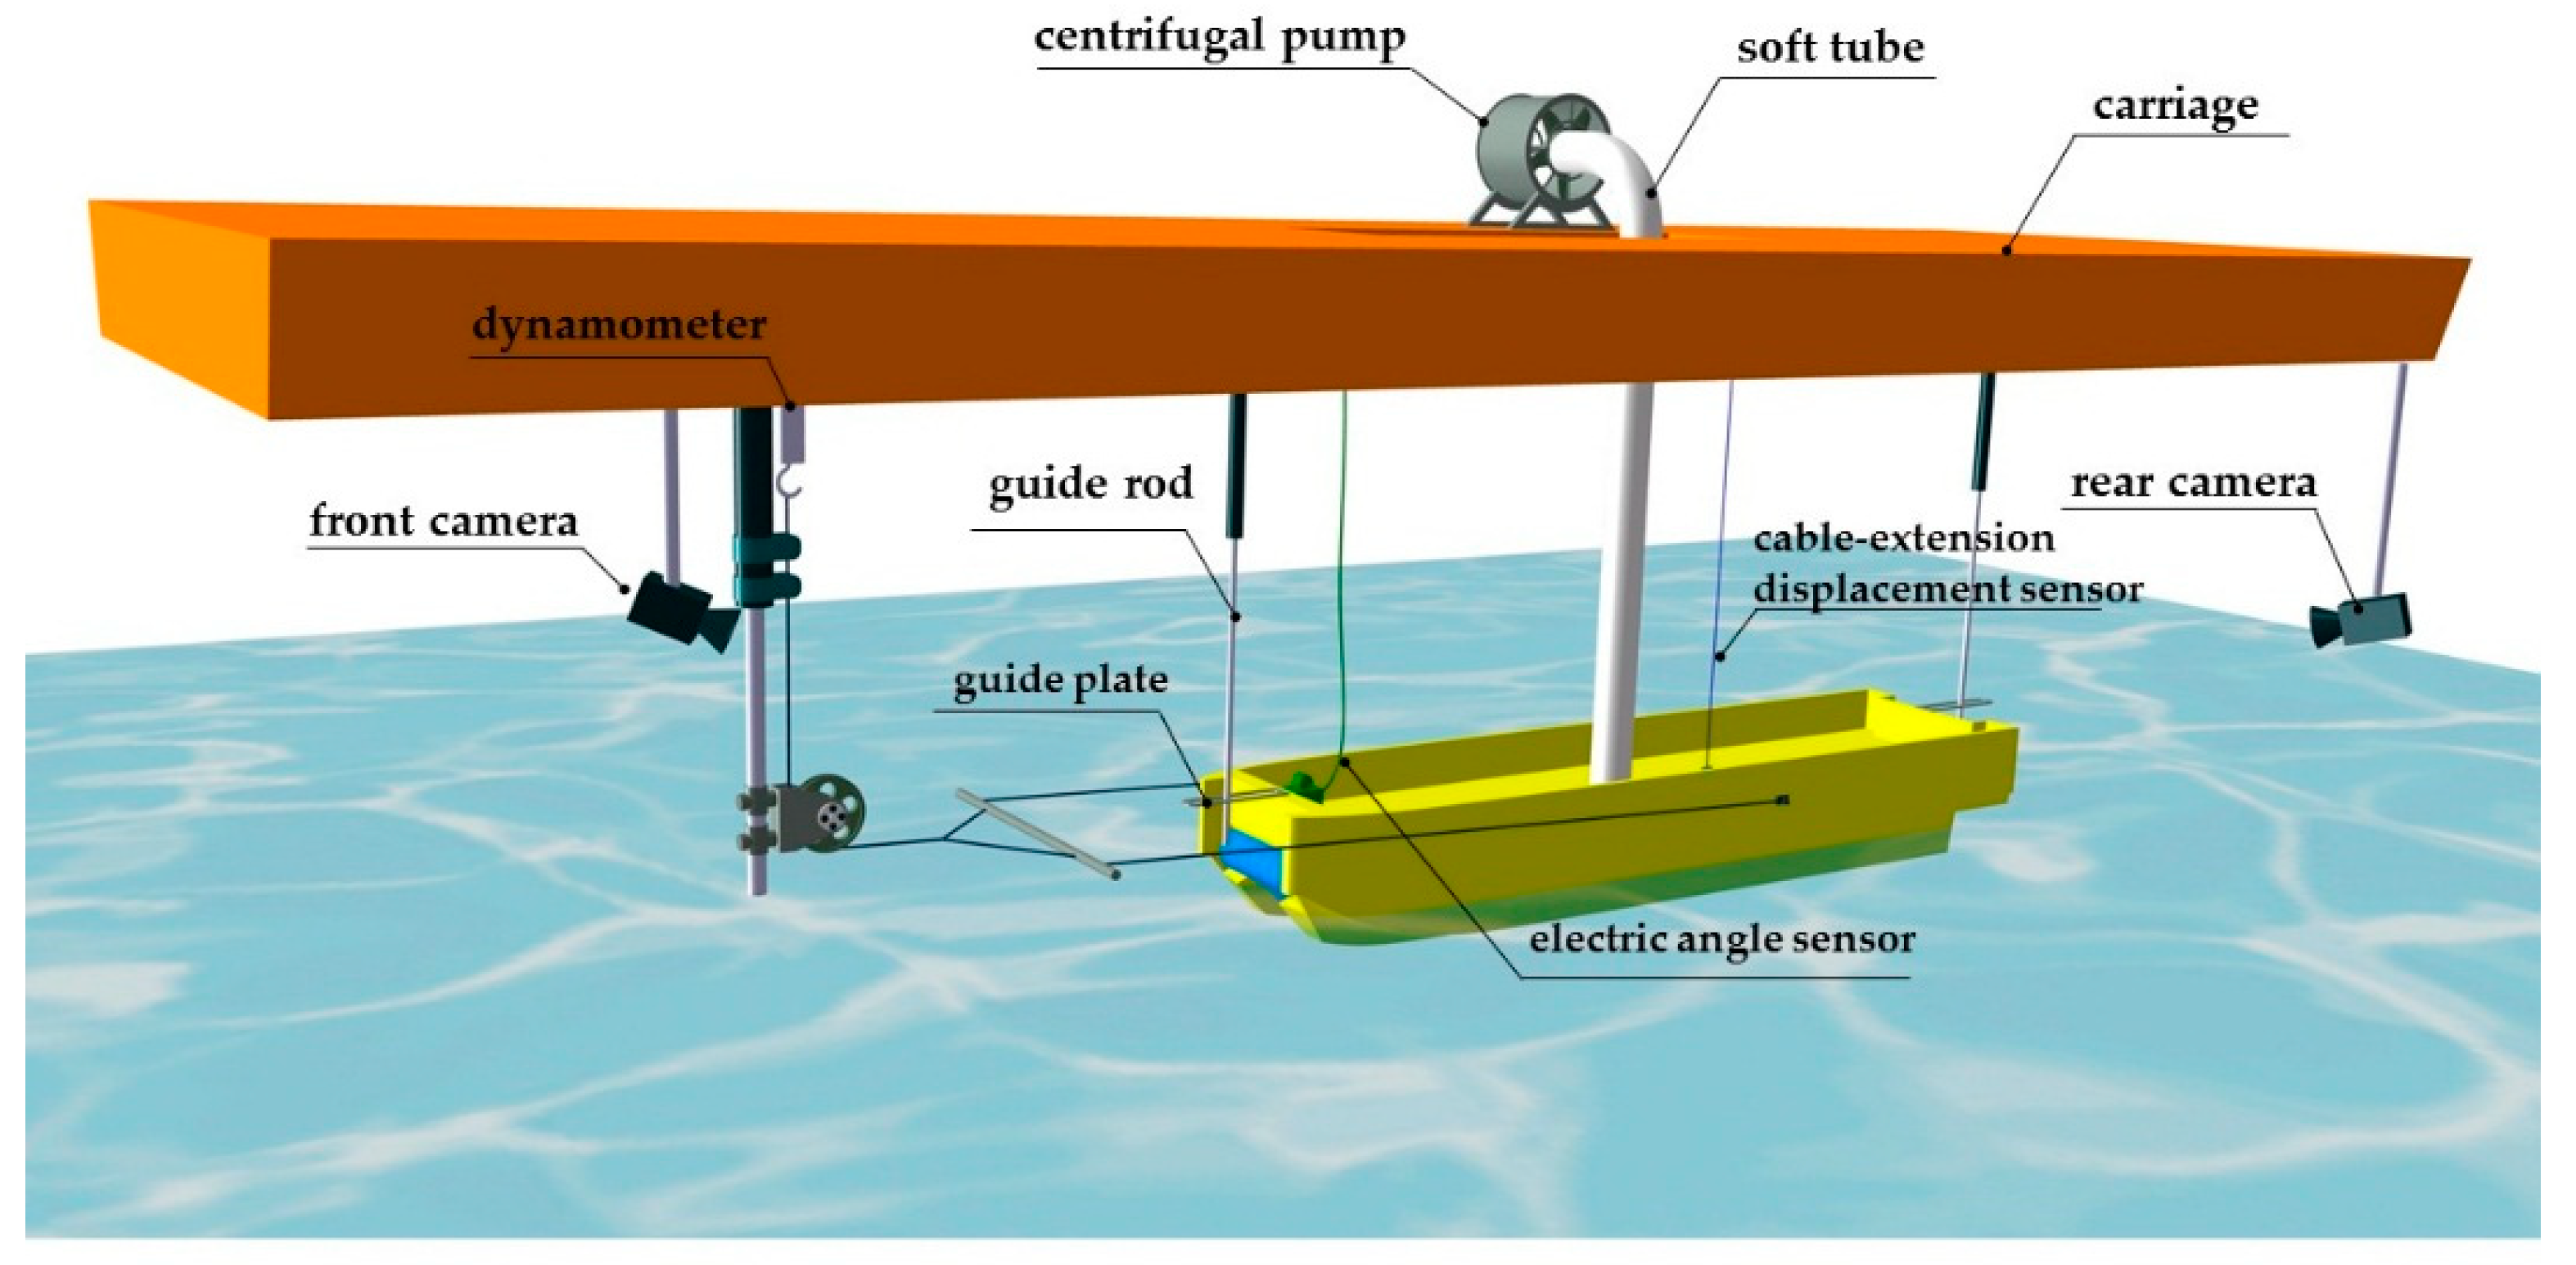
The PACSCAT model is tested in the towing tank of China Special Vehicle Research Institute, the dimensions of which are 510 m × 6.5 m × 6.8 m in length, width, and depth, respectively. A regular wave is created by a wave-maker, of which the created wave length could range from 0.5 to 15 m, while the wave height could range from 0.03 m to 0.5 m. Figure 5 shows a sketch of experimental setup, the PACSCAT model is attached to the carriage platform with two degrees of freedom (heave and pitch), guide rods fixed on the carriage are inserted in the guide plates mounted on both fore and aft deck. To avoid the trimming moment created by towing force, the towing point on the broadside is aligned with the center of gravity. In the tests, resistance is measured by a tension sensor (model: BLM-1M, range: 0–2000 N) mounted on the carriage; an electric angle sensor (model: 02111102-000, range: ±60°) mounted on the fore deck and a cable-extension displacement sensor (model: FWP-1.2, range: 0–1.2 m) mounted on the gravity center are used to measure pitch and heave motion, respectively. The acceleration is measured by an acceleration sensor mounted at the midship (model: FML-A, range: ±5 g). In addition, to monitor the air cushion pressure, three pressure sensors (model: XJTU-WINNER, range: 0–1 Kpa, reference pressure: 1 atm) named P1–P3 are embedded in the bow, midship, and stern region, respectively, of the connection deck.
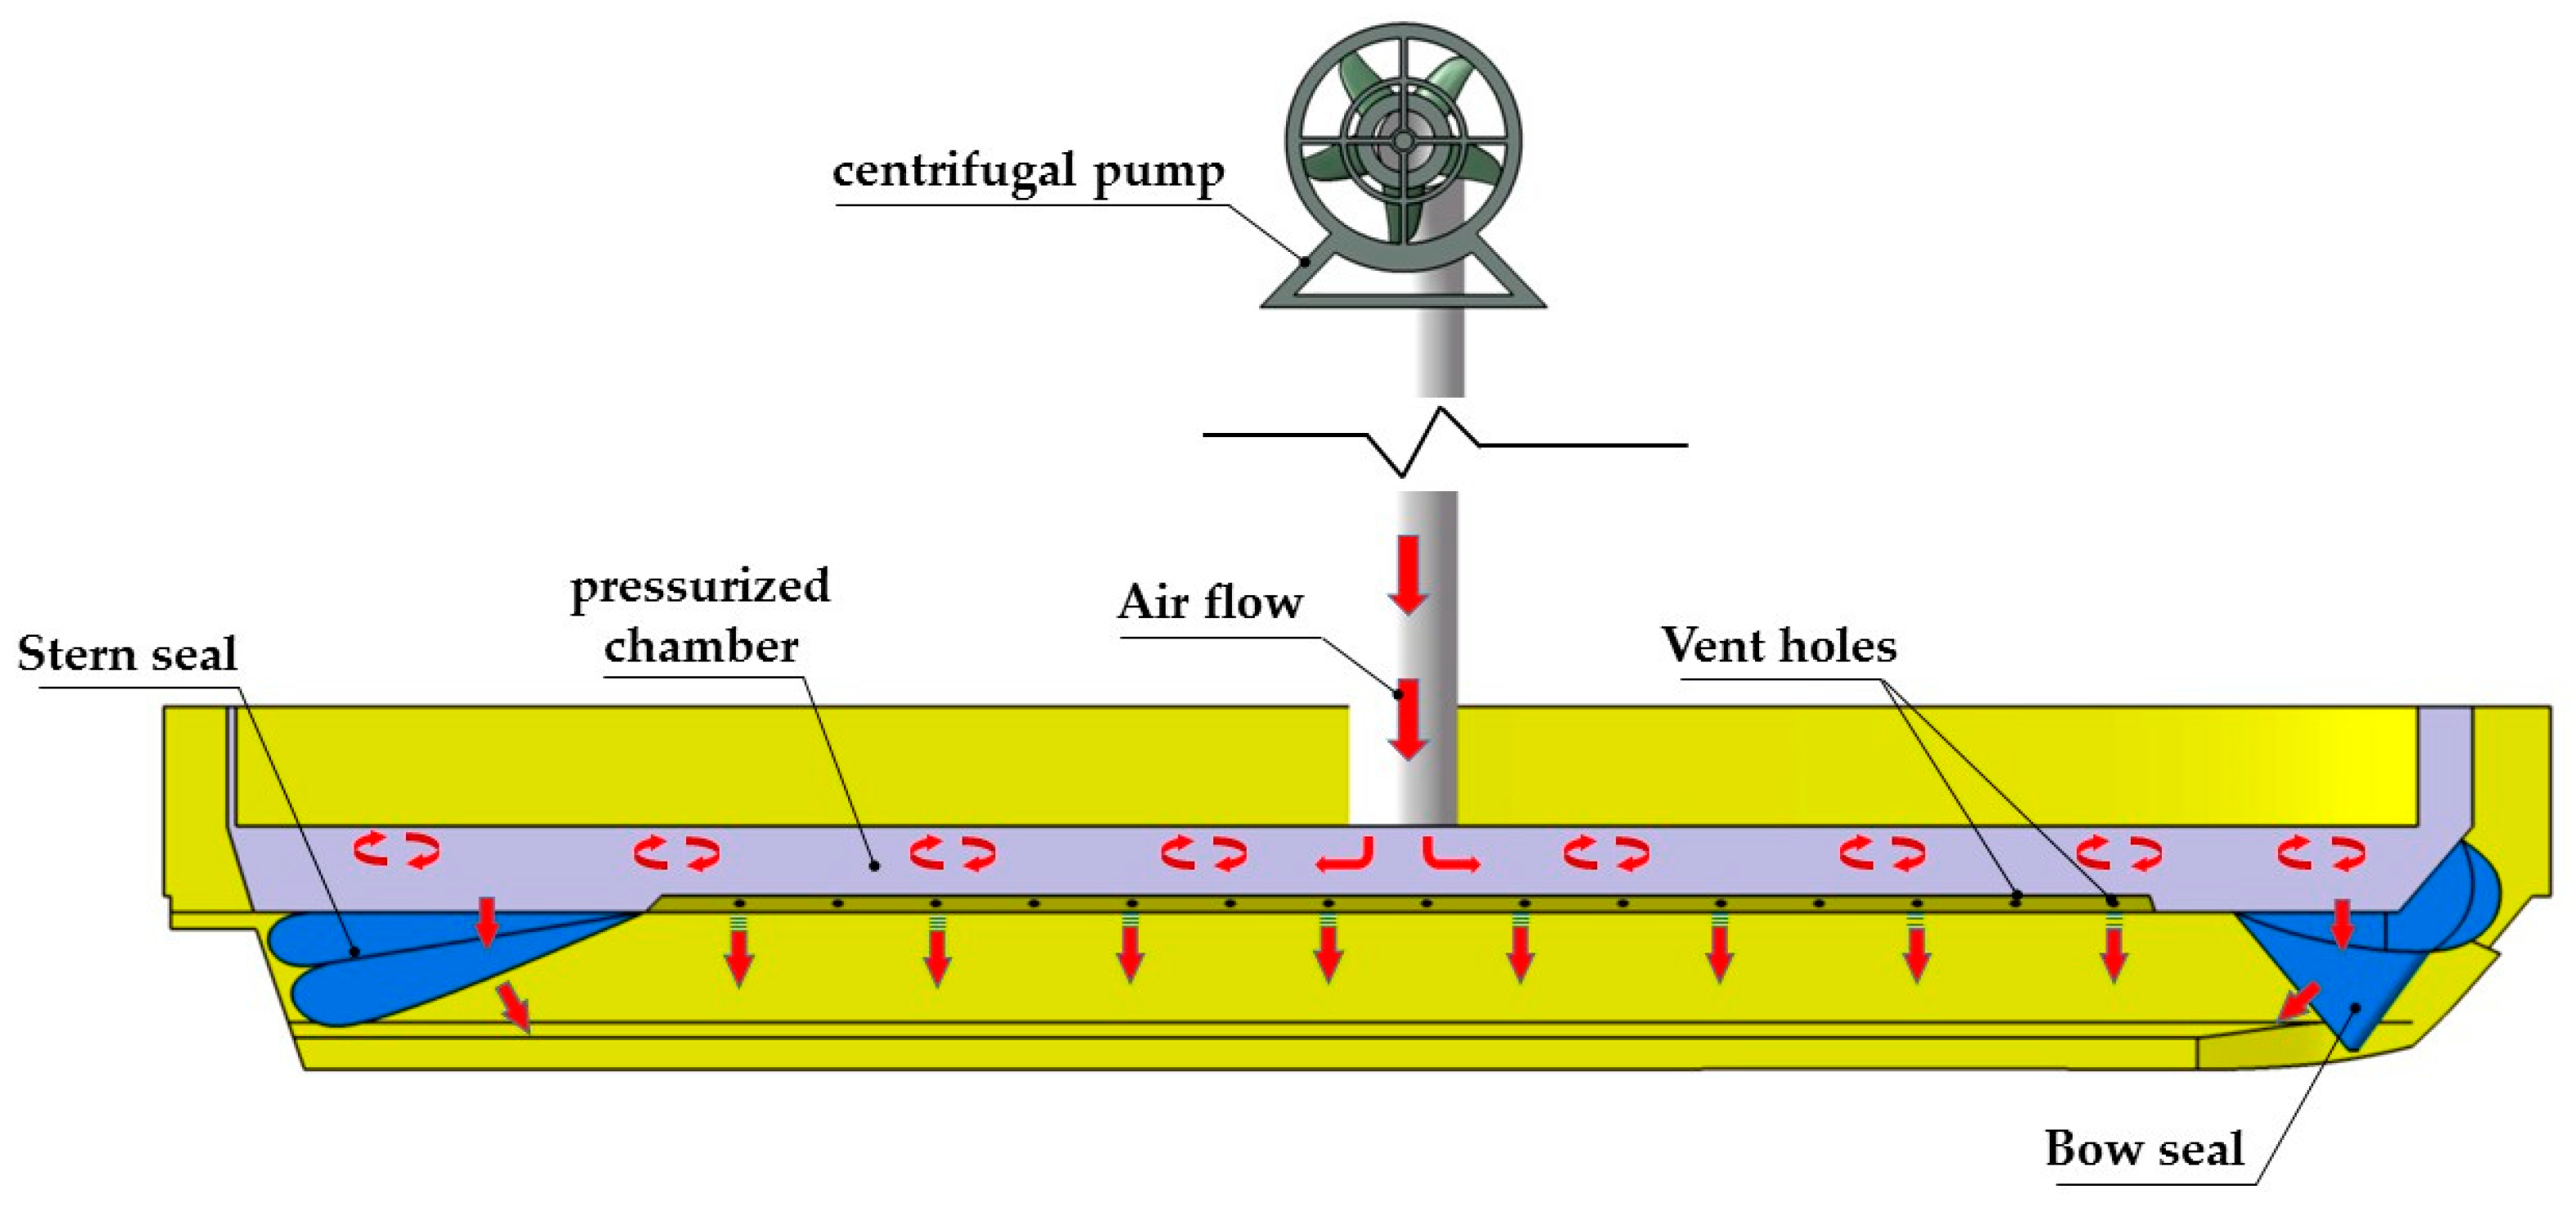
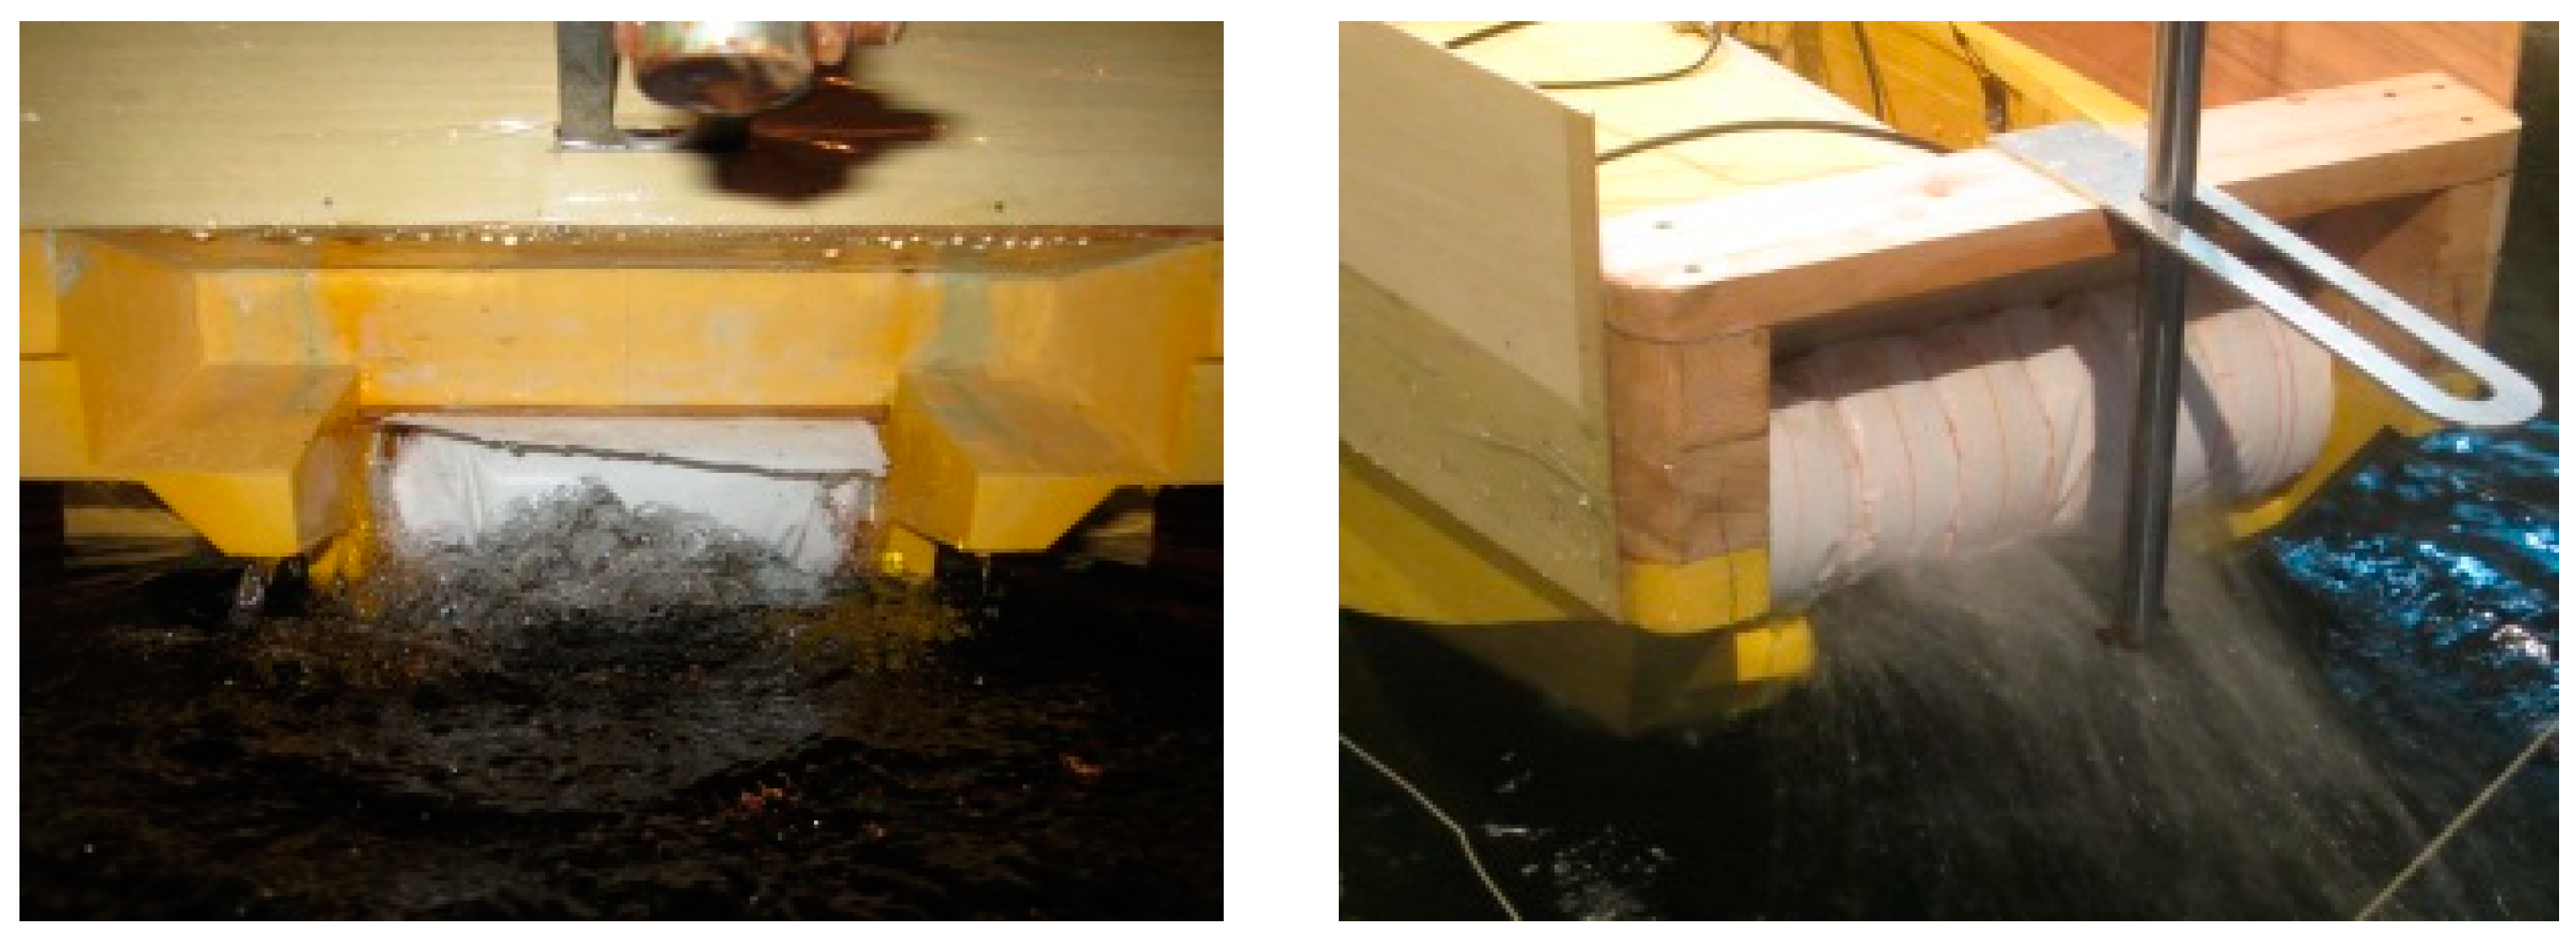
As shown in Figure 6, the air cushion system in model test is comprised of a centrifugal pump (model: TWYX CX-7.5, output power: 5.5 KW) mounted on the carriage to generate air flow, a soft tube to inject air into the hull body, a pressurized chamber above connection deck in which the air is pressurized and guided to the air cushion through vent holes, and two flexible seals mounted in bow and stern region to longitudinally restrict the air cushion (Figure 7).
2.3. Operating Conditions
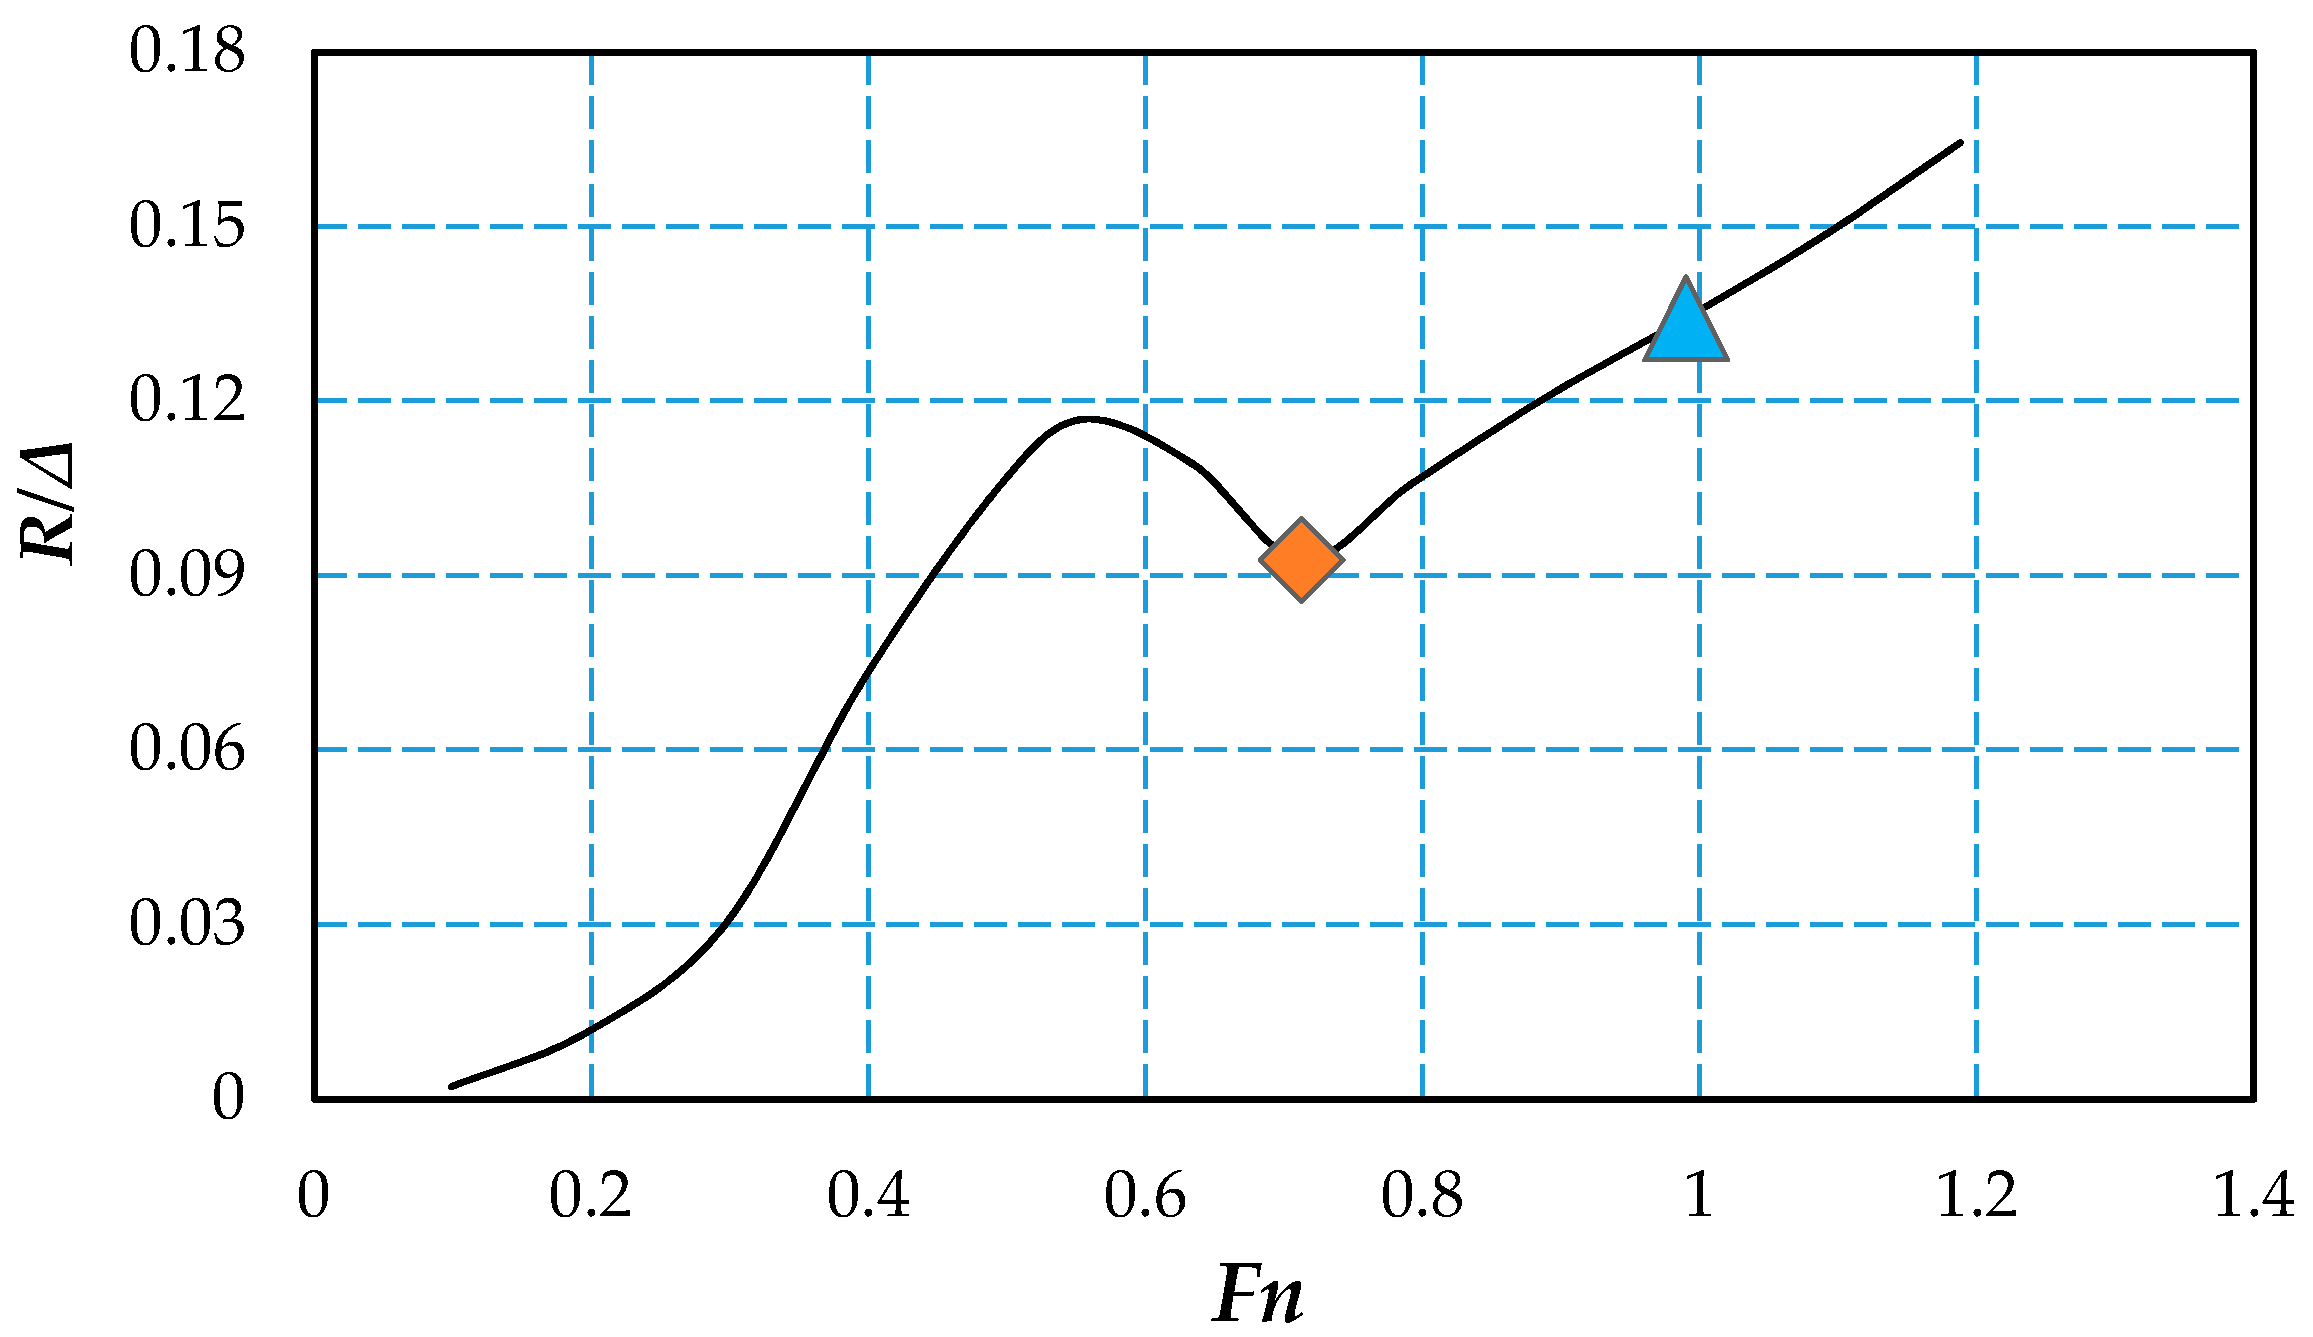
In Figure 8, the non-dimensional resistance (R/Δ) is plotted as a function of Froude number, which is defined by
According the resistance tendency, the sea keeping tests were carried out for Froude numbers of 0.71 and 0.99 (the corresponding velocity is 3.6 m/s and 5.0 m/s), the speeds at which the PACSCAT got over the resistance hump at lower speeds. The selected wave height h is 0.05 m, while the wave length λ varies from 2 to 14 m. The air flow rate is kept constant at 2.5 m3/min during towing.
2.4. Results and Analysis
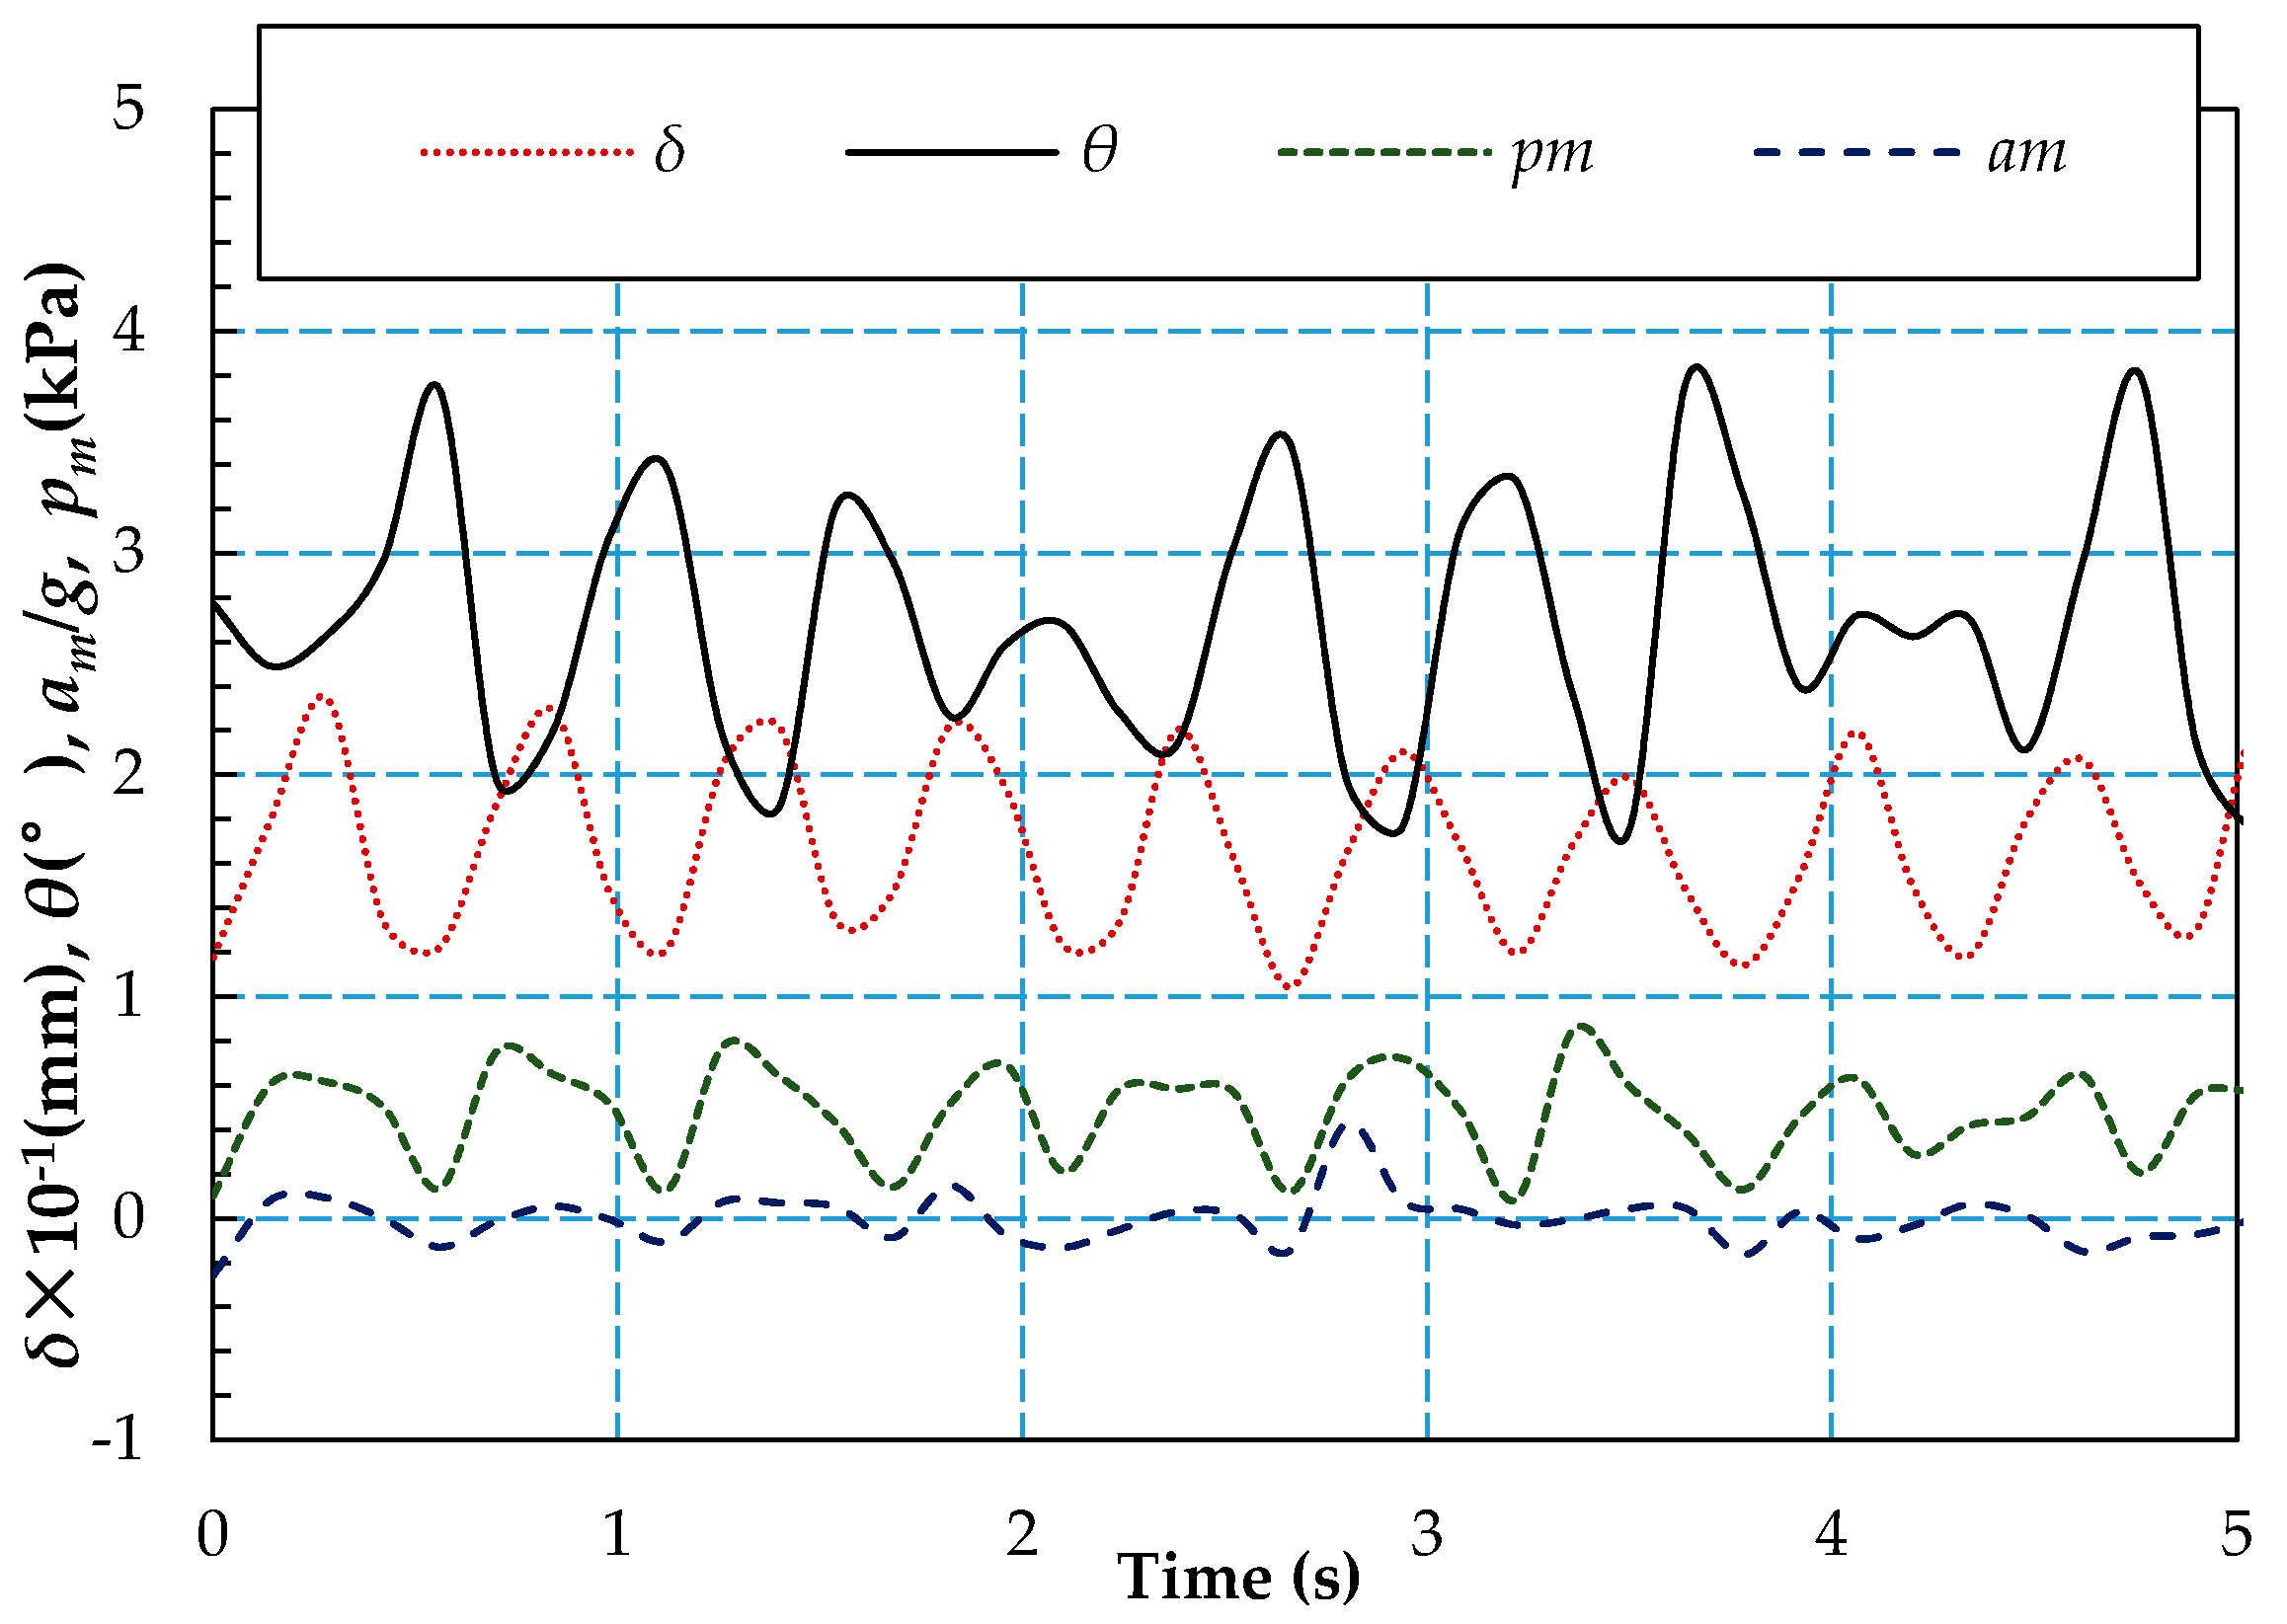
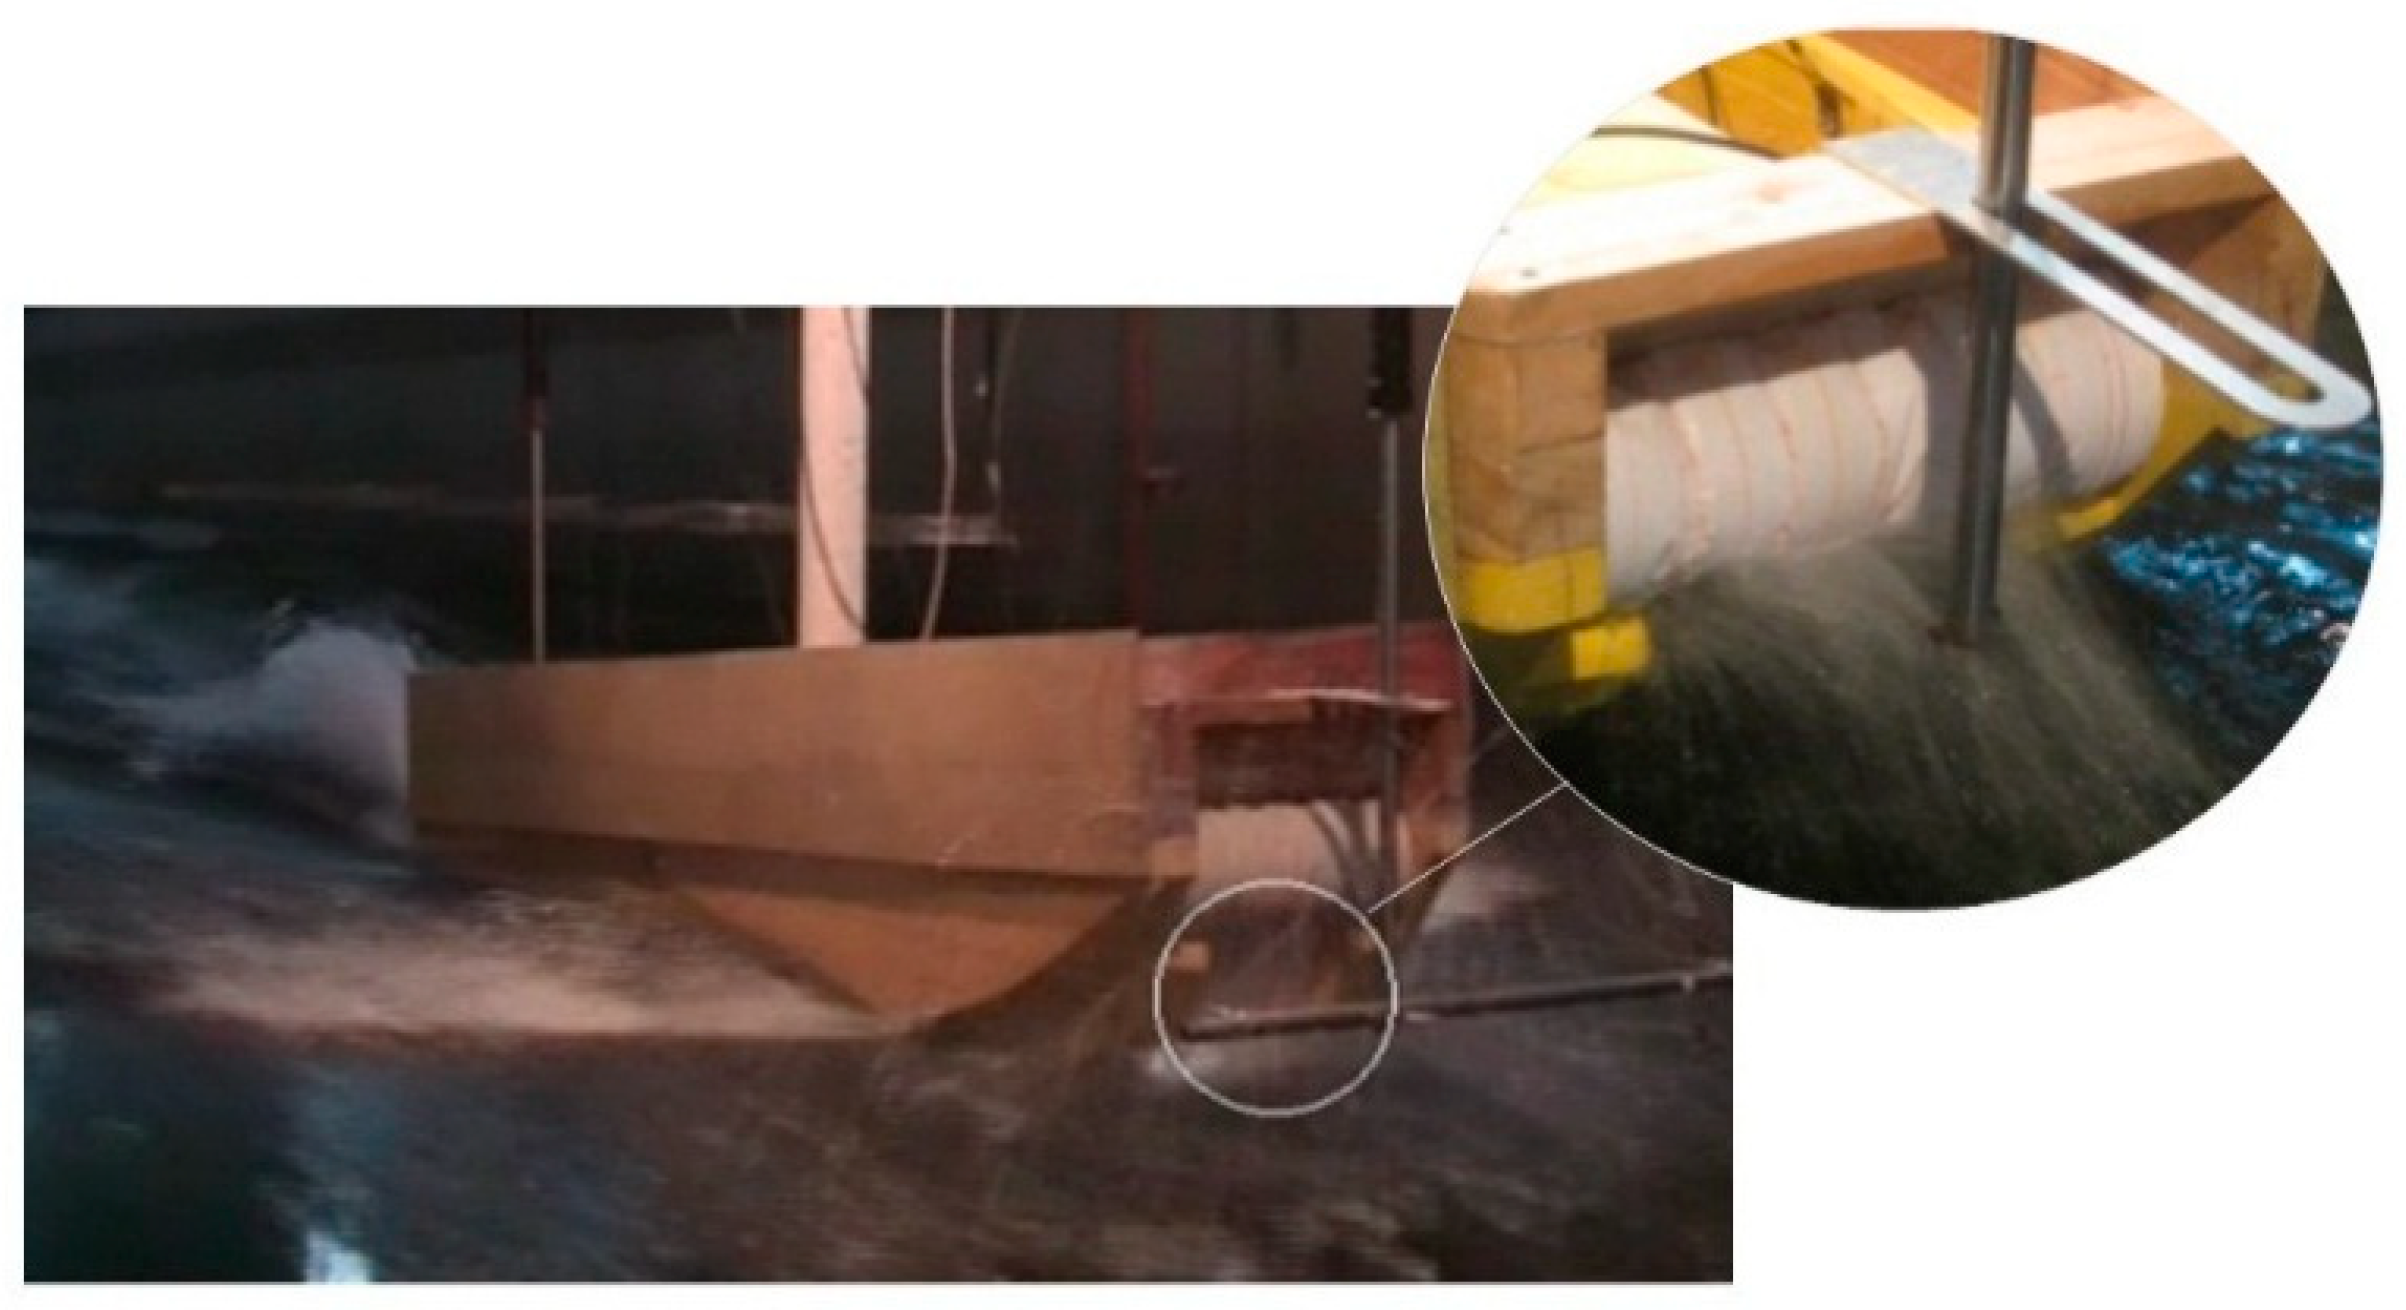
Figure 9 shows the monitored oscillation curves of different motion parameter under the operating condition of λ = 4 m, Fn = 0.71. It can be seen that the heave and pitch have the same rule, while the air cushion pressure of P2 and amidships acceleration show the opposite pattern. Compared with other oscillation curves, the pitch motion has poor periodicity characteristics, and the amplitude variations in different periods are relatively larger. Thus, it can be concluded that the longitudinal behavior of this ship type is easily affected by the encountered waves. In terms of the experiment phenomenon, it is found that the spray becomes significant when the bow is raised by the wave surface (as shown in Figure 10), which indicates that high-pressure air flow is escaping forward fast under the bow seals. The massive air leakage could directly lead to a decline of the air-cushion pressure, and the proportion of the hull supported by the air cushion changed, causing the acceleration to change sharply. Therefore, besides the wave effect, the non-uniform air leakage is also a key factor that charges the motion of PACSCAT in waves.
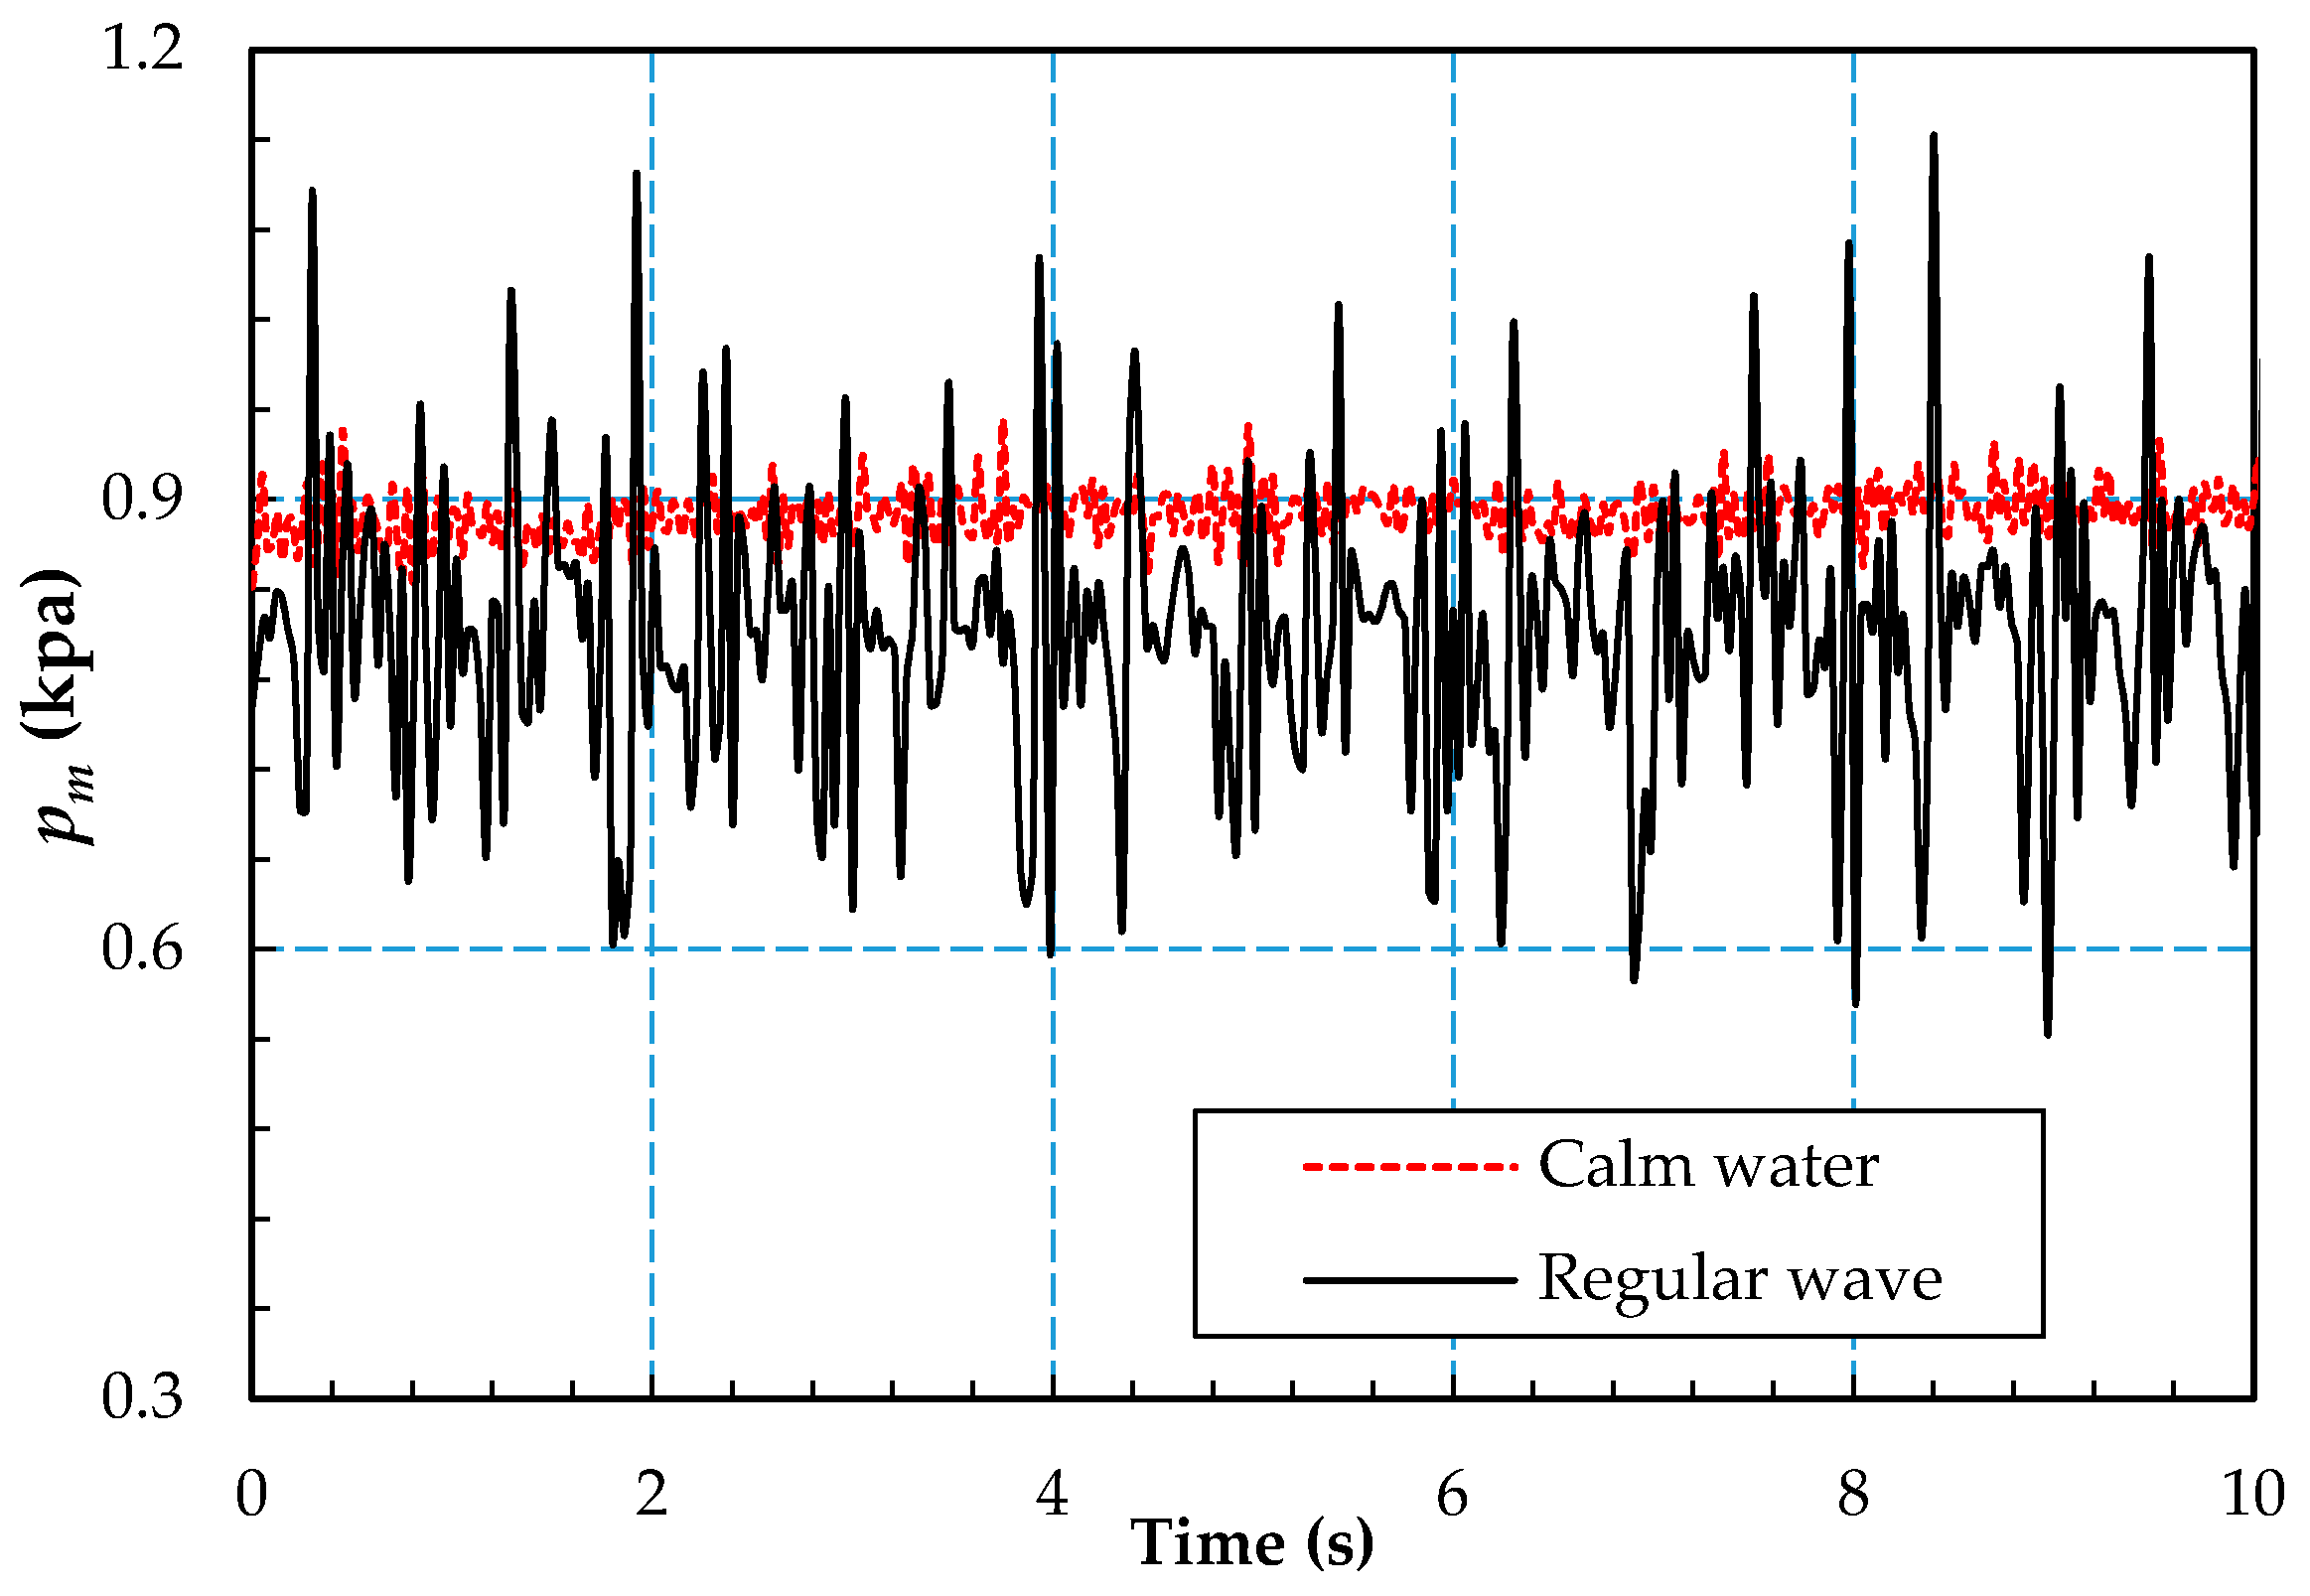
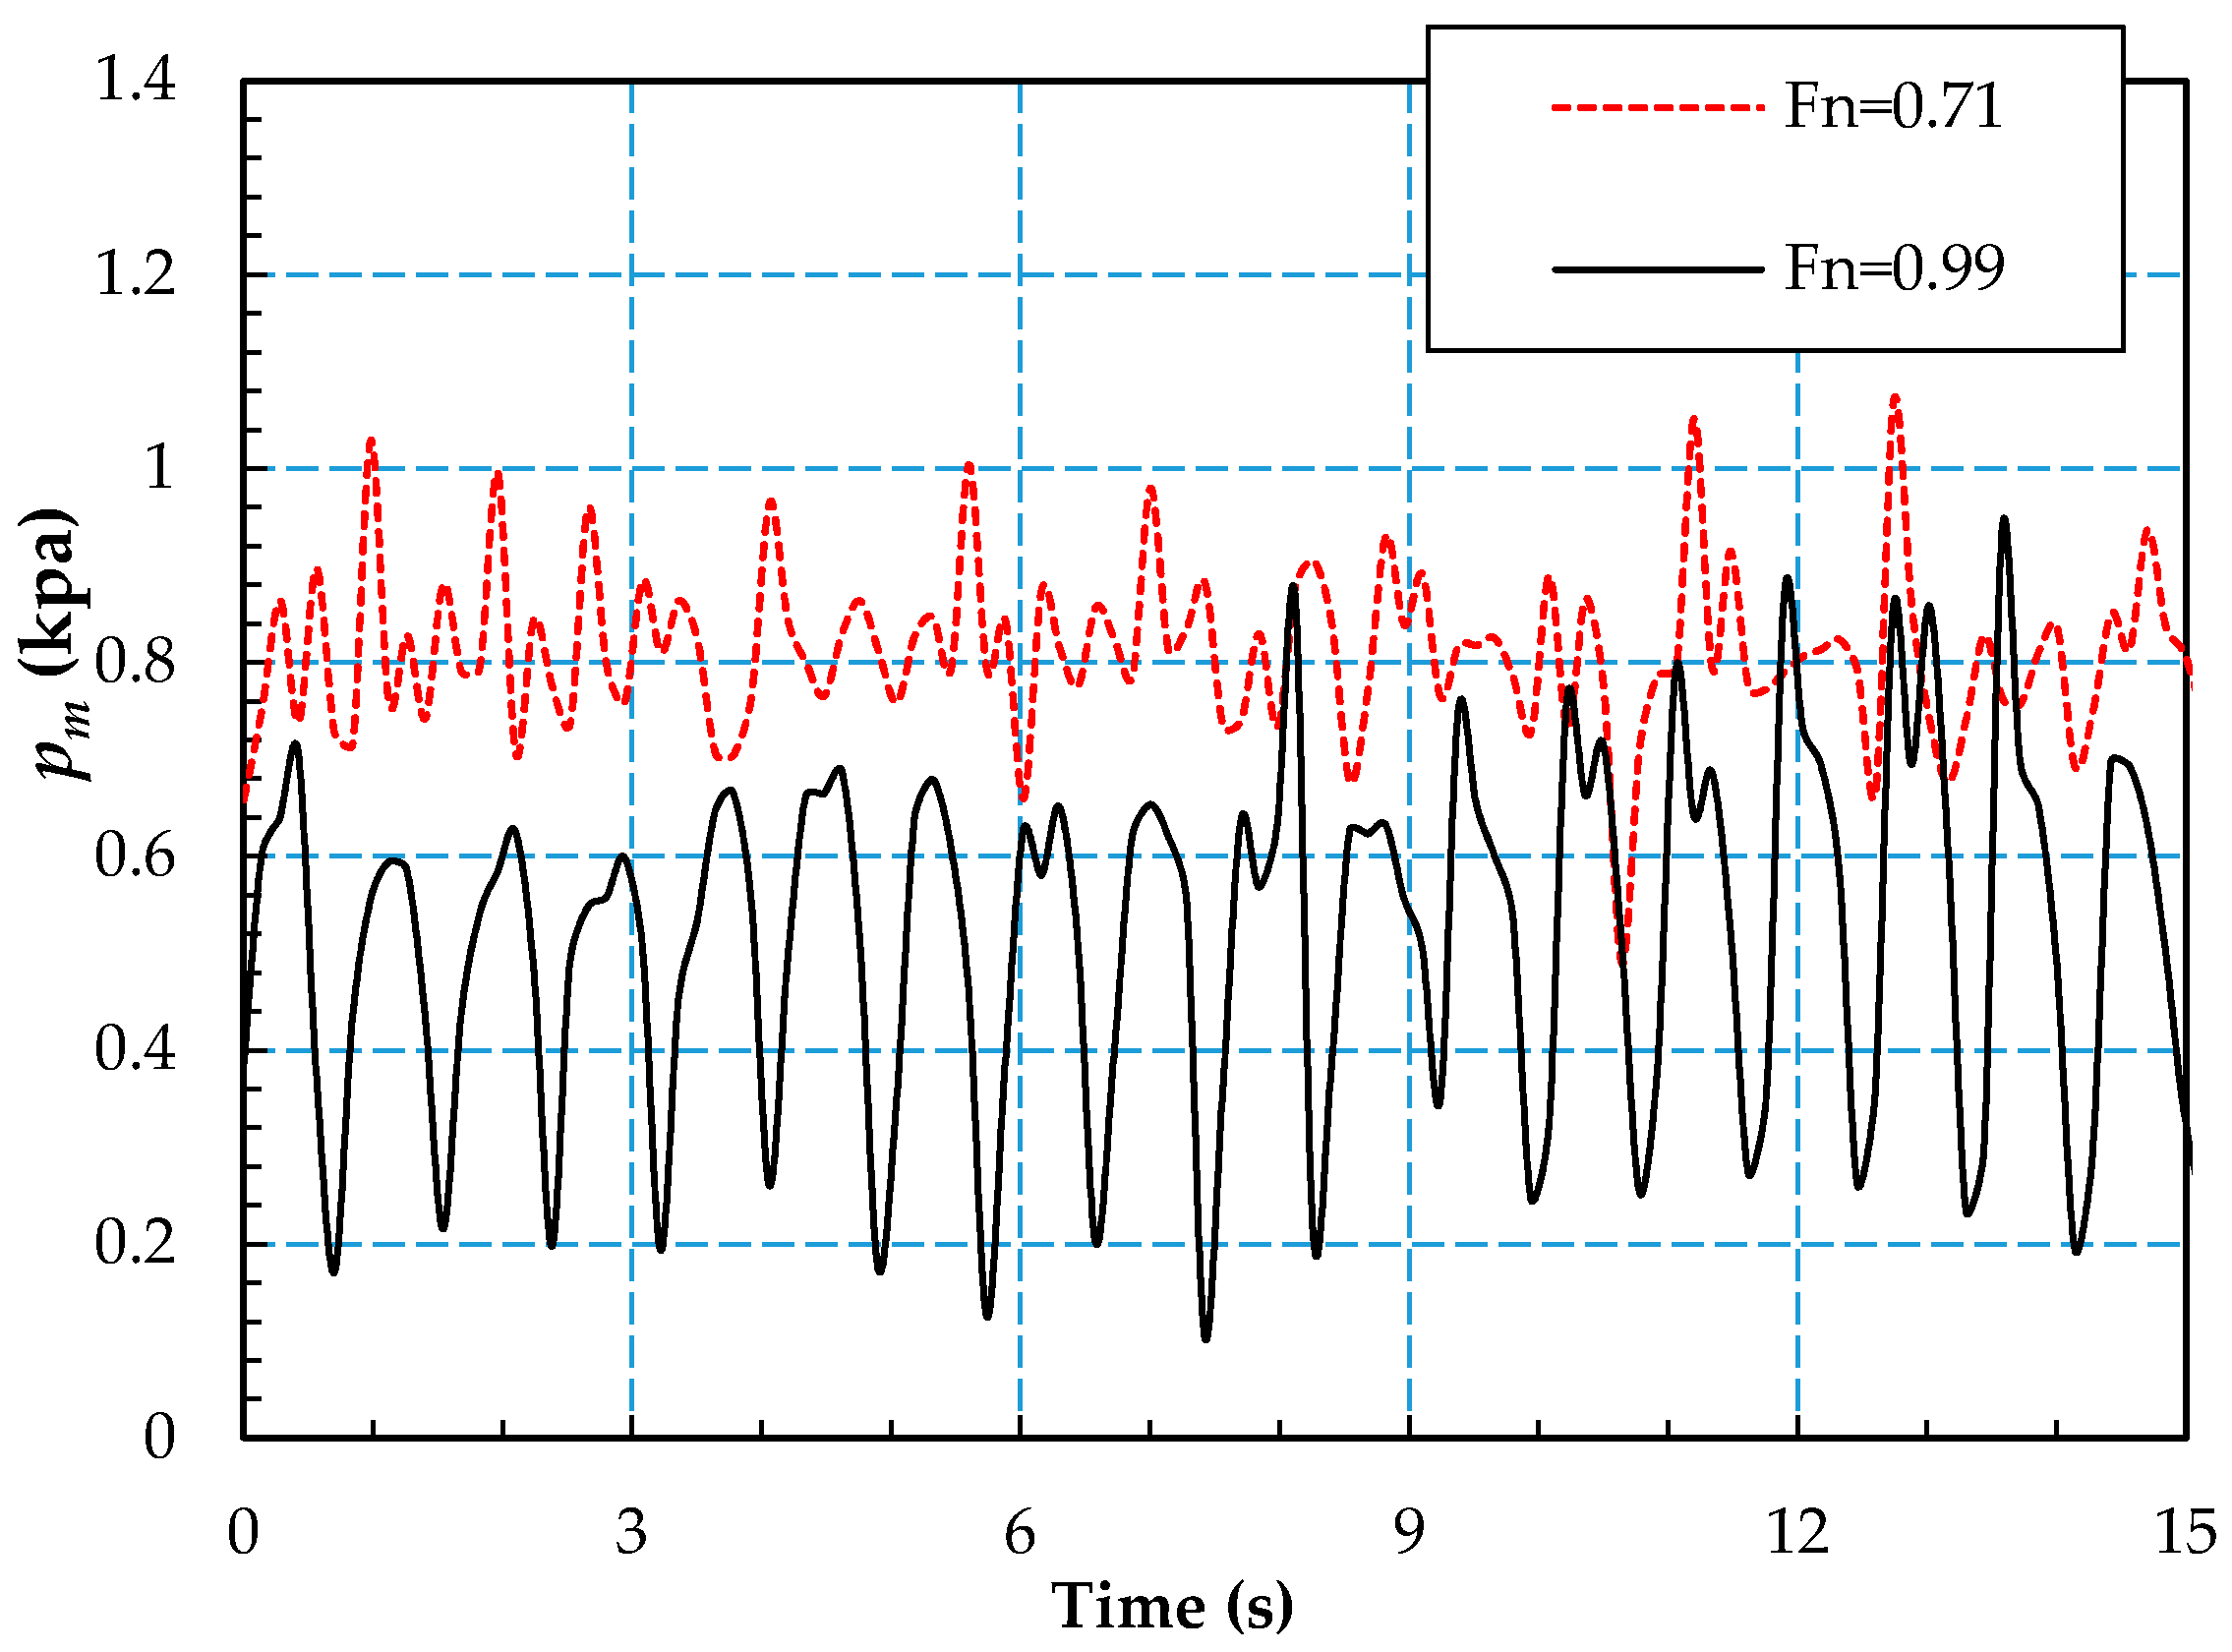
In Figure 11, the midship pressure monitored at a Froude number of 0.71 is compared for PACSCAT in calm water and waves—it can be seen that the pressure oscillation amplitude increases obviously as the deformation of water surface occurs, and the nonlinearity of pressure is enhanced. In Figure 12, the midship pressures at different speeds are compared—as shown in the figure, the pressure value decreases significantly as the speed is increased, indicating that the air leakage becomes severe at higher speeds.
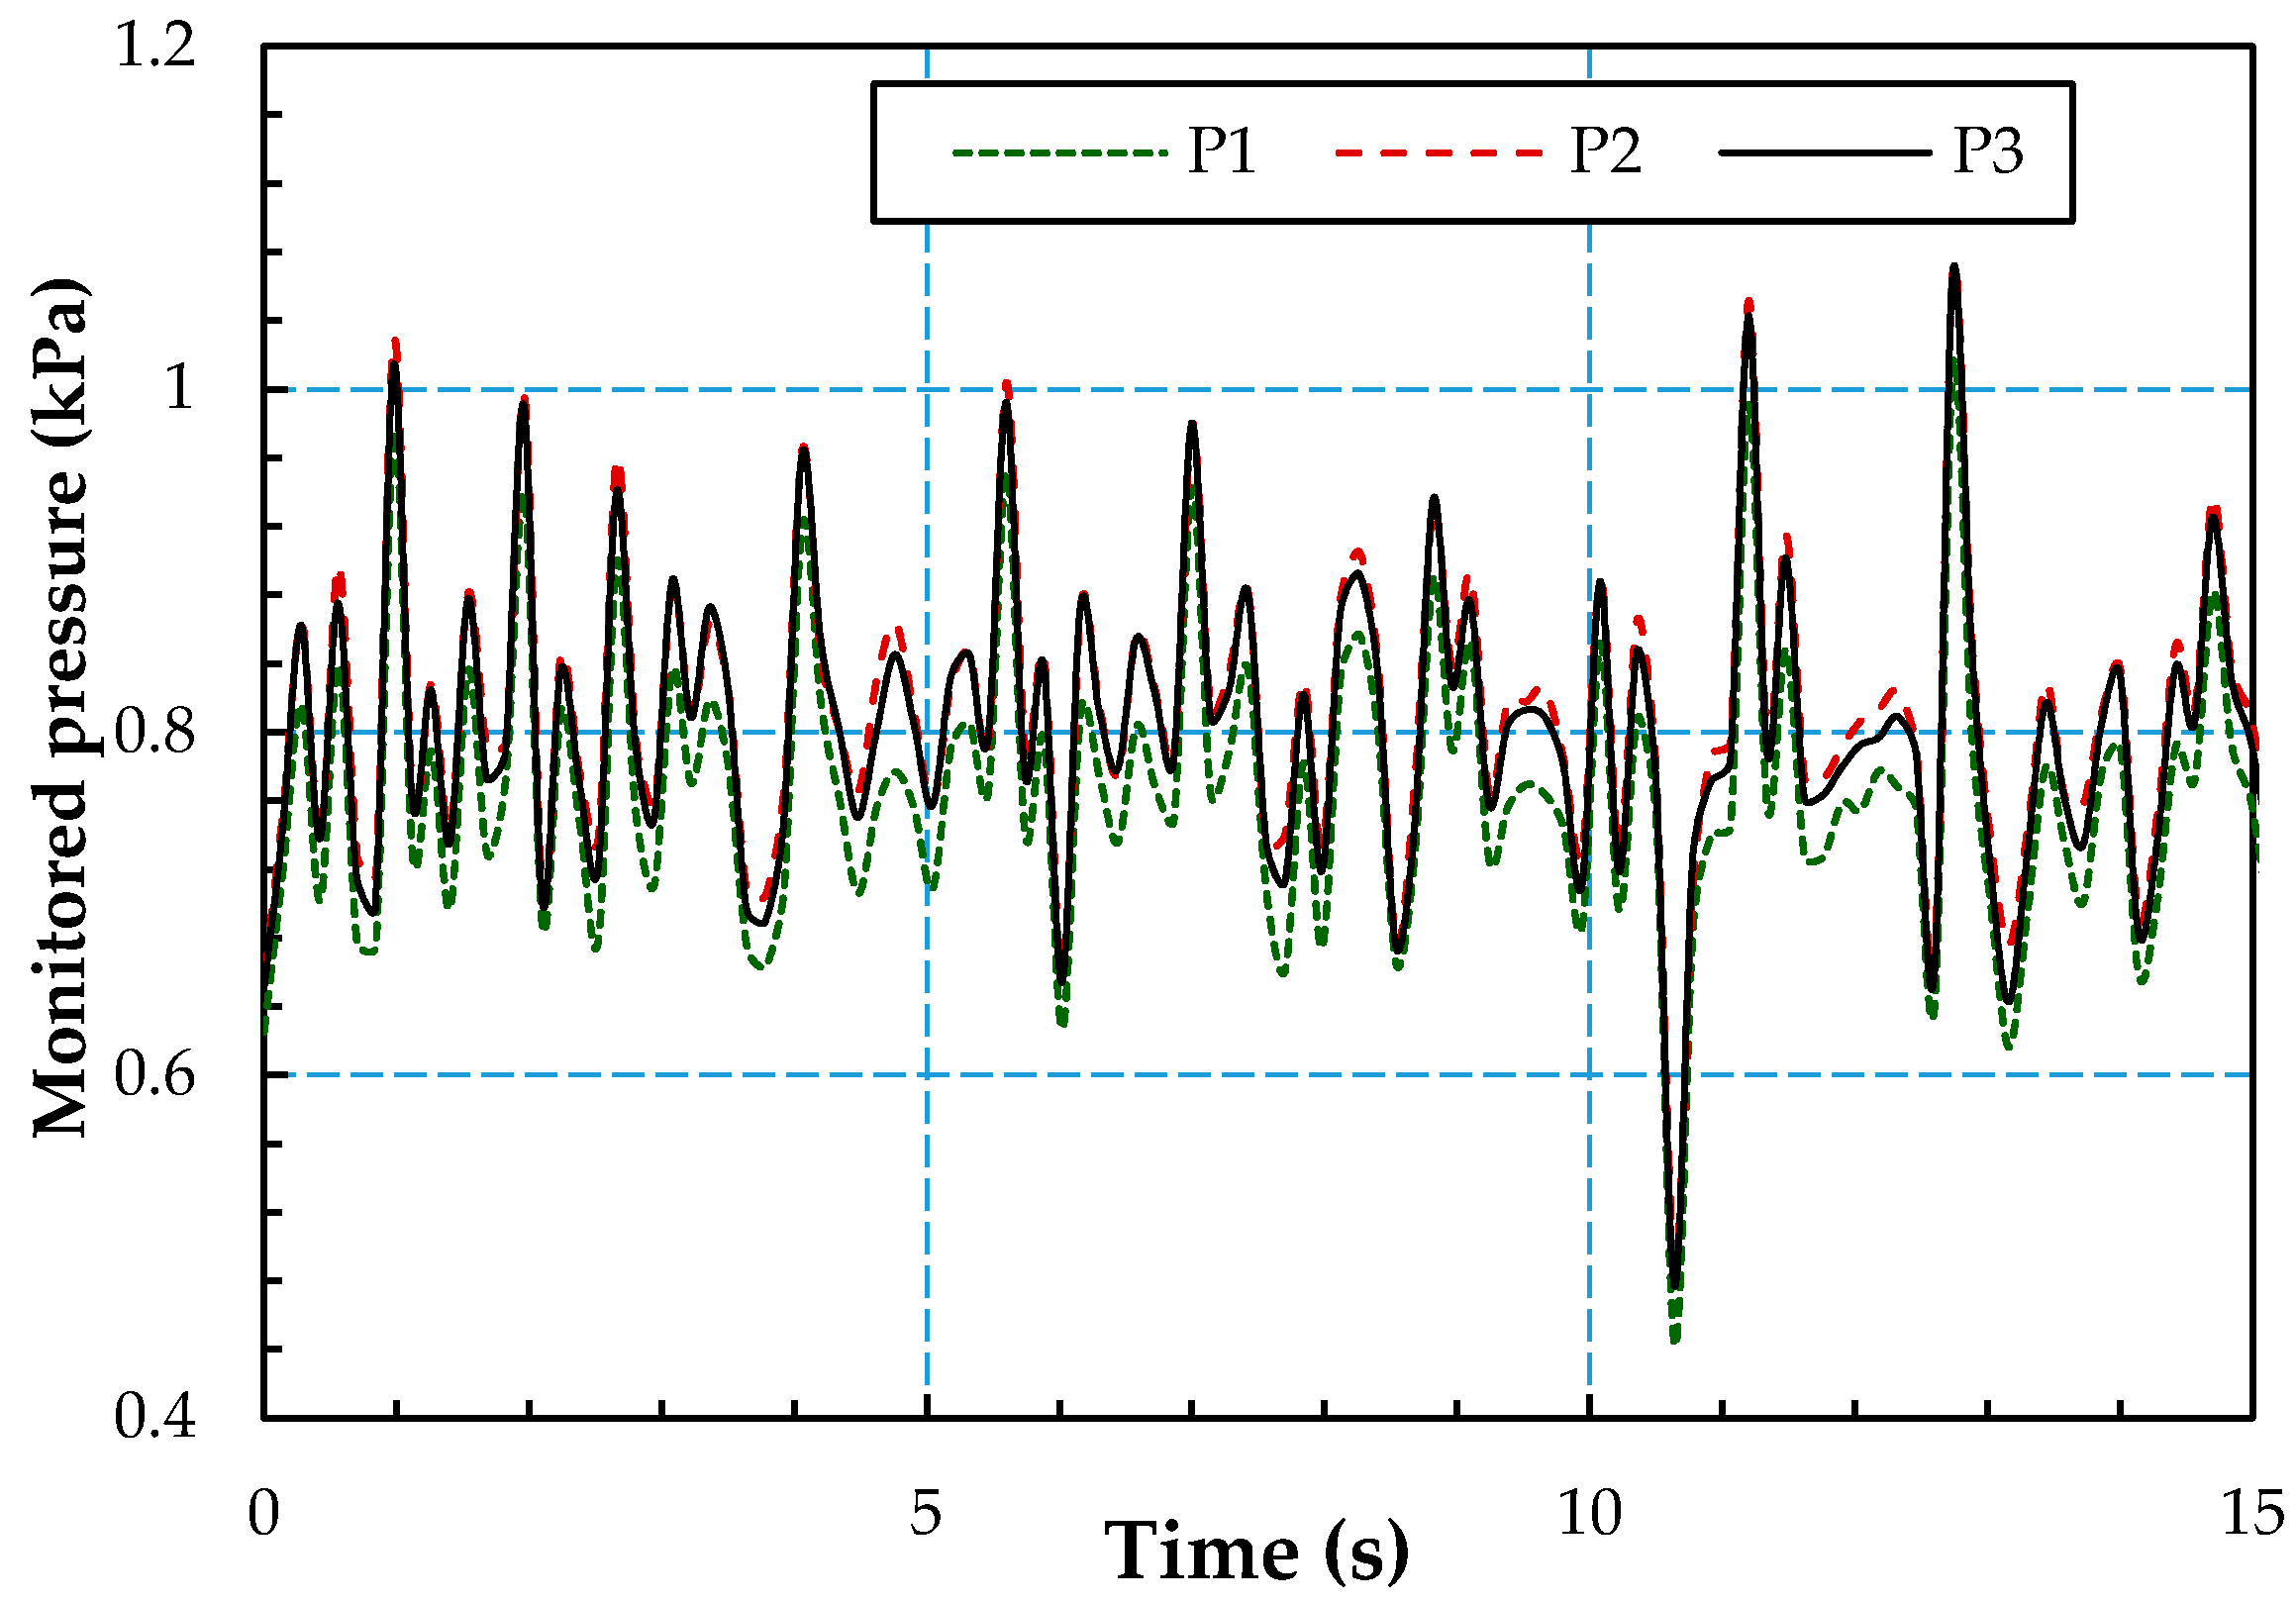
Figure 13 shows the monitor history of air cushion pressure of P1, P2, and P3—it can be seen that, despite the divergence on longitudinal location, the pressure value and evolution tendency of different monitor point are very close. That is to say, when PACSCAT is navigating in waves, the air cushion pressure has a constant distribution pattern in longitudinal direction and, in other words, the longitudinal center of pressure moves slightly.
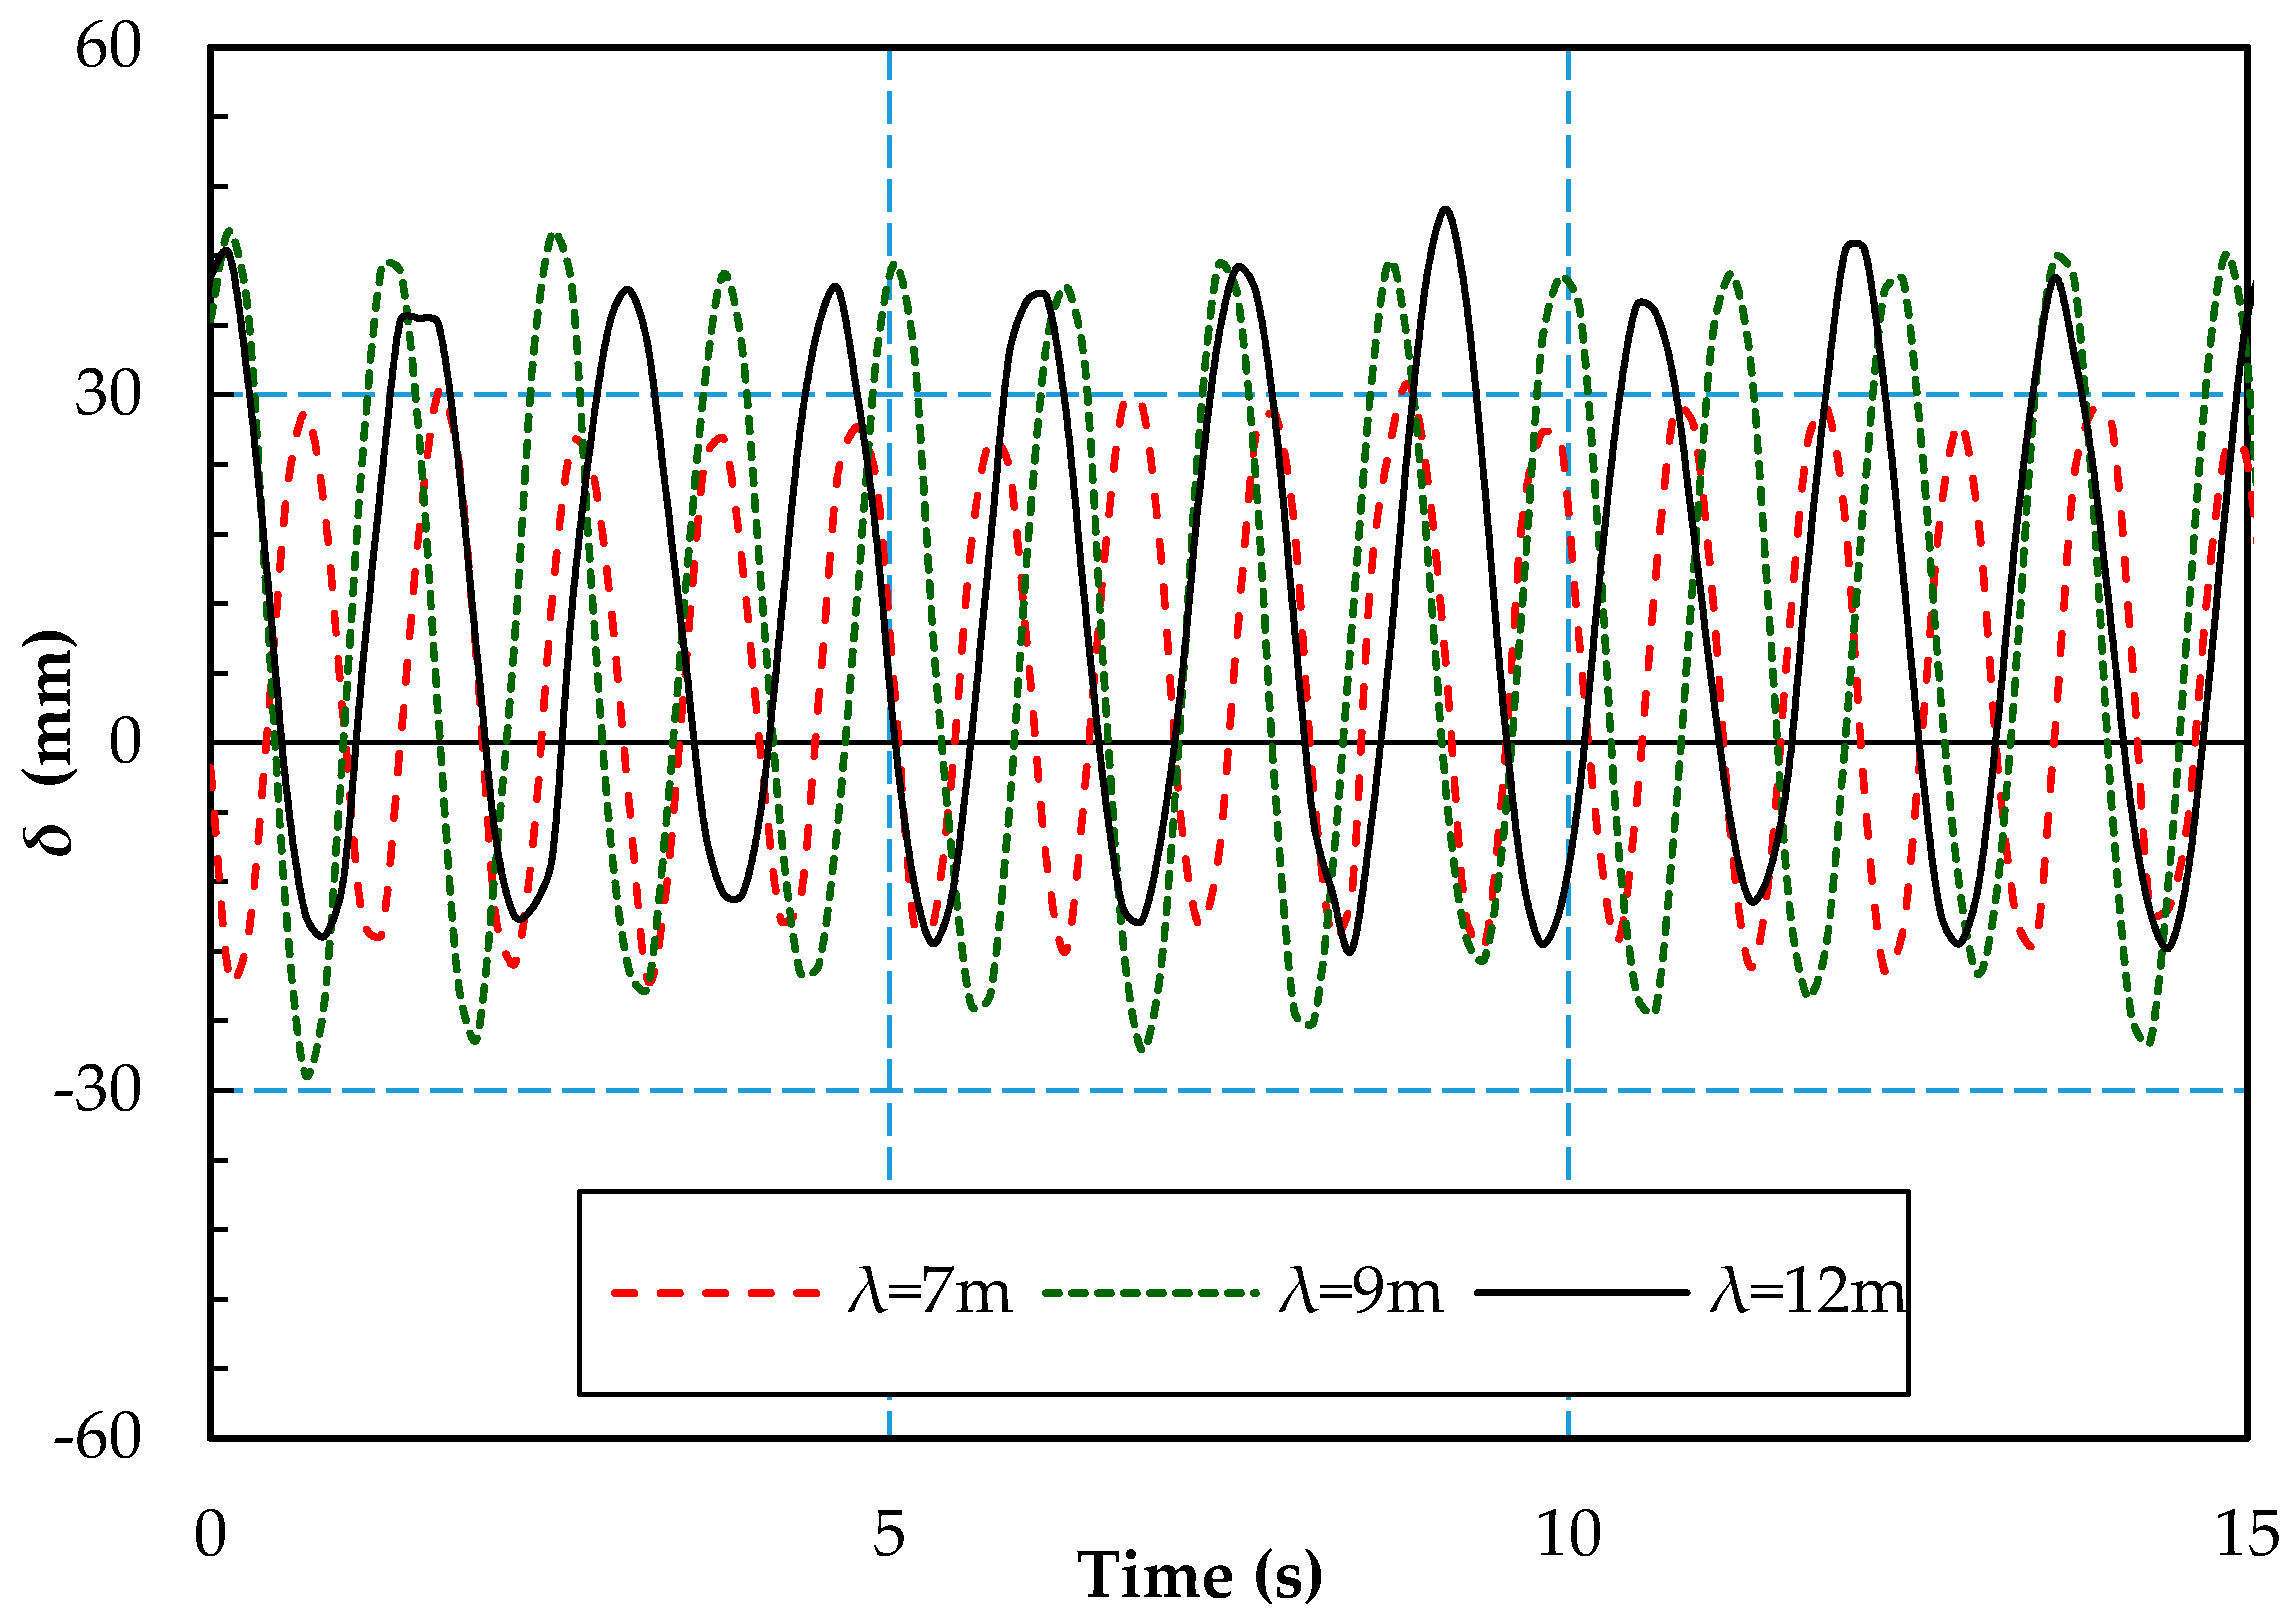
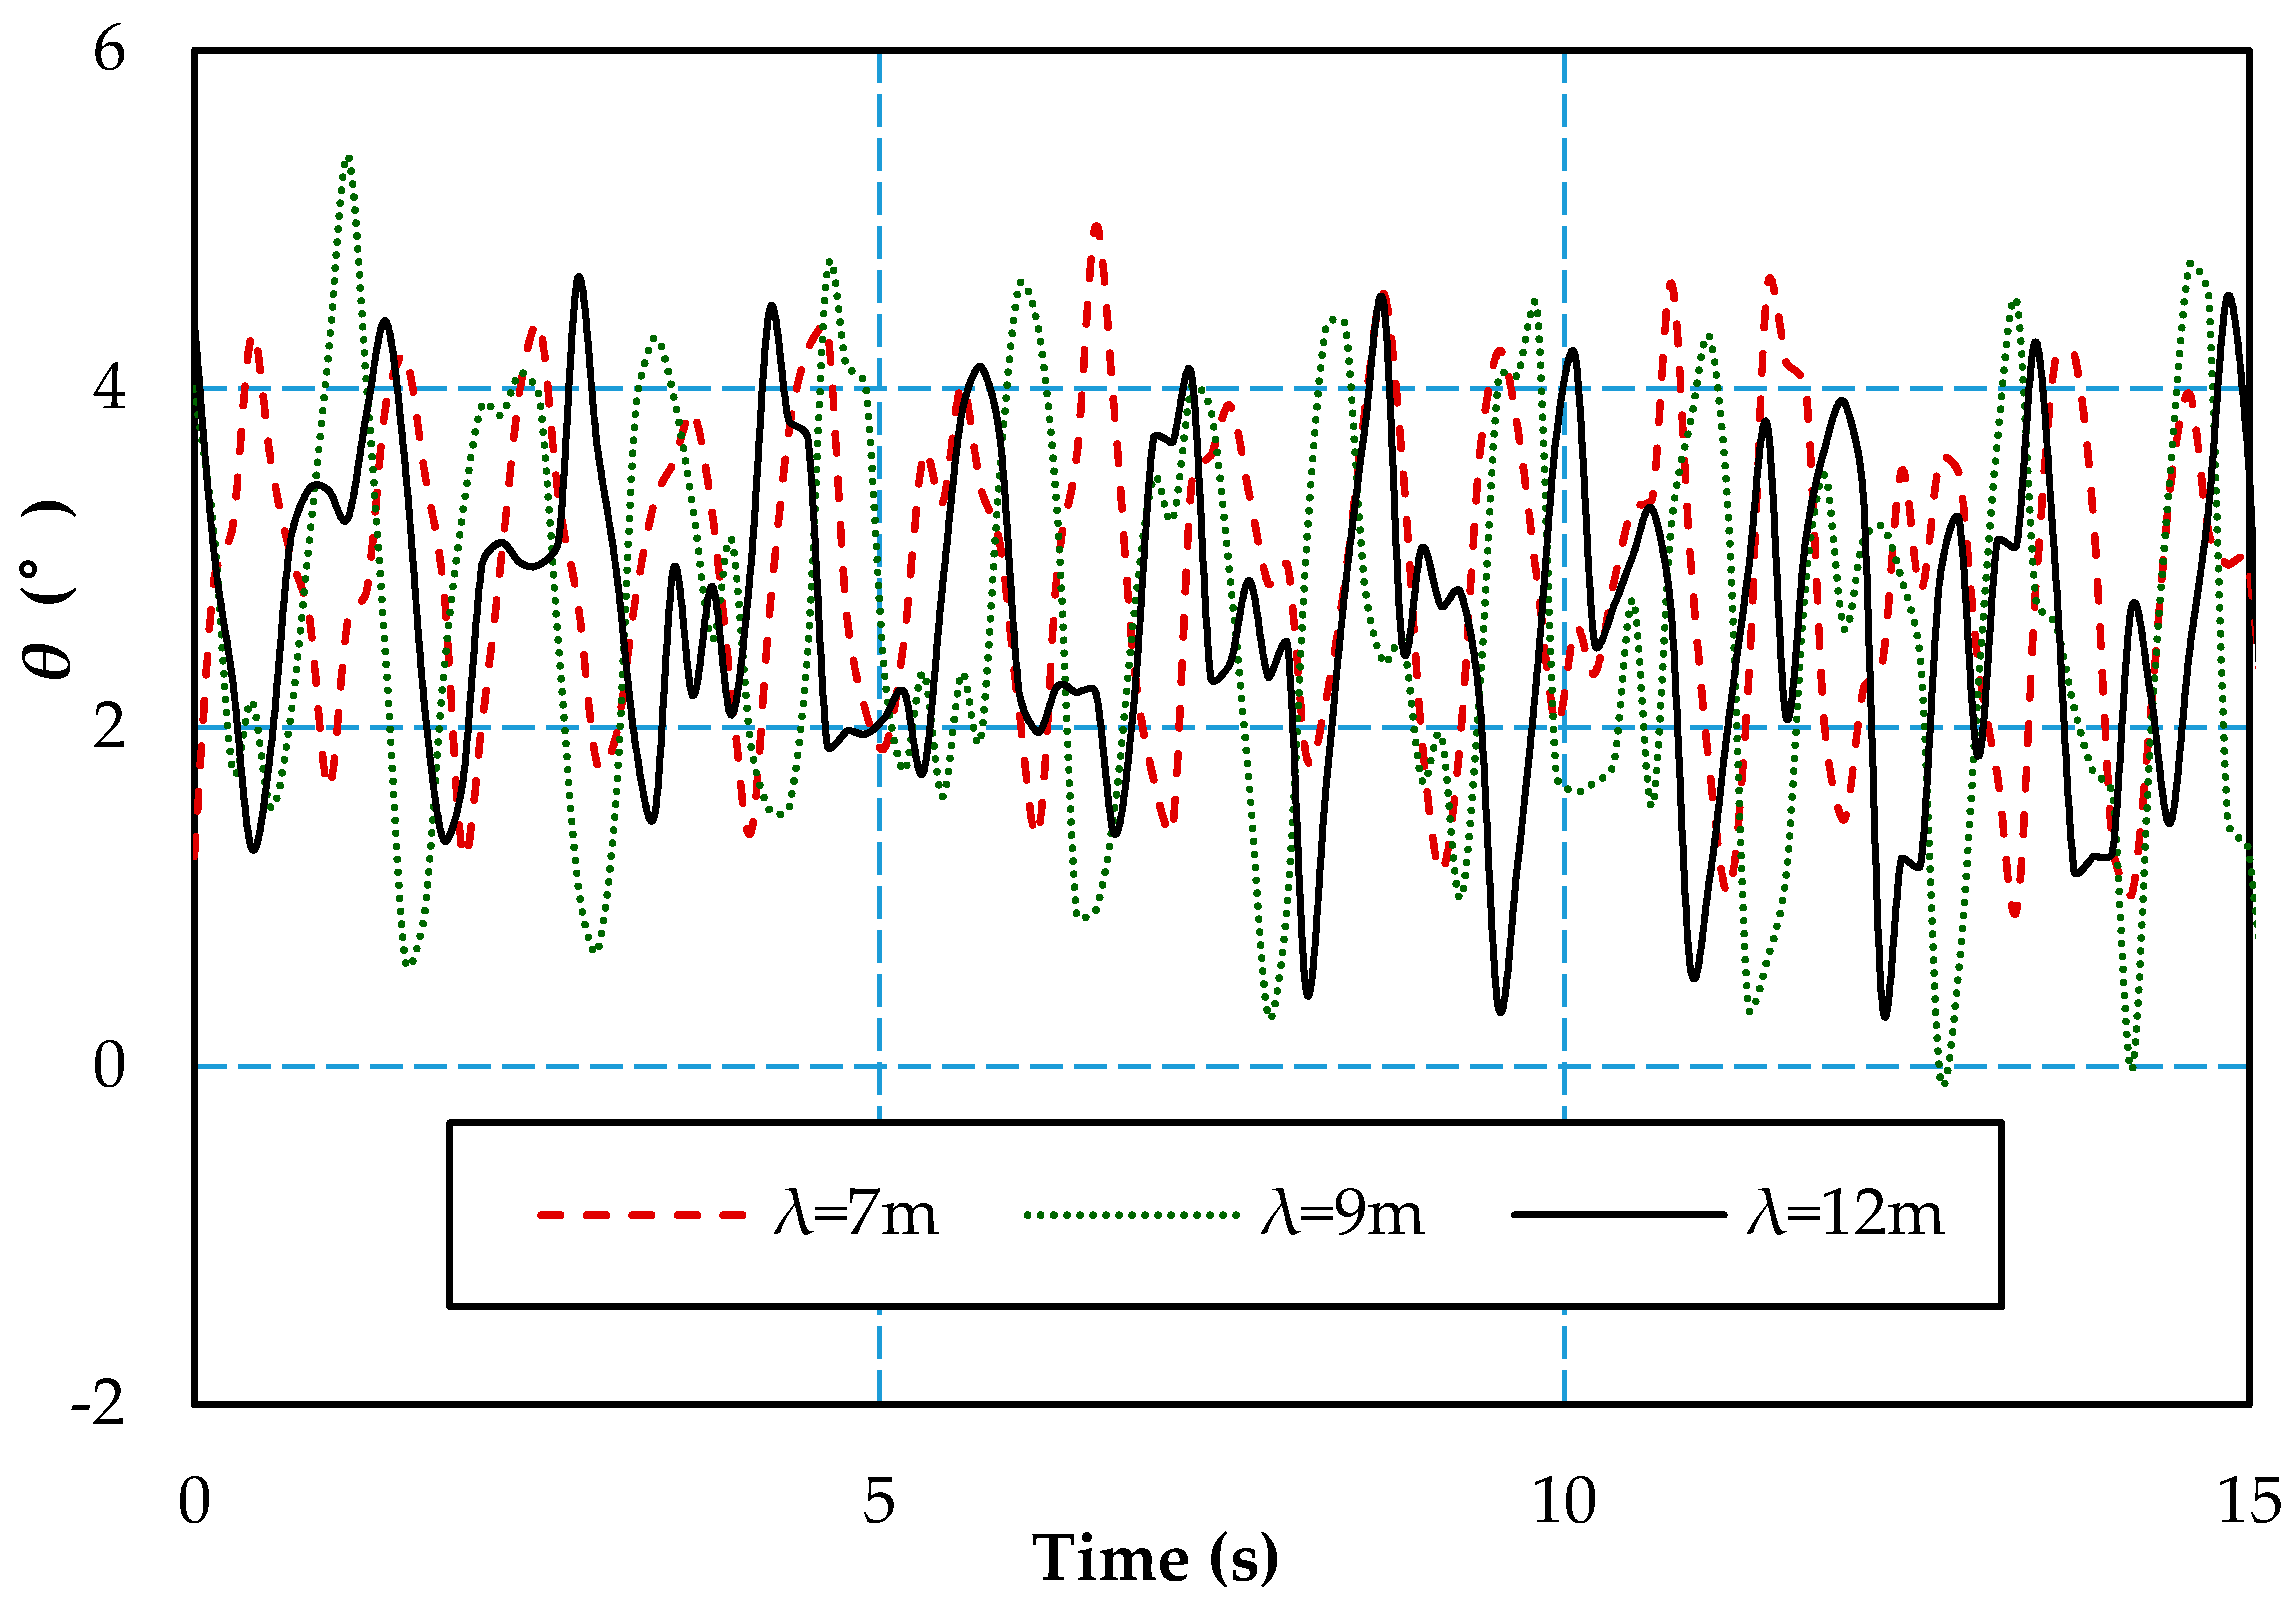
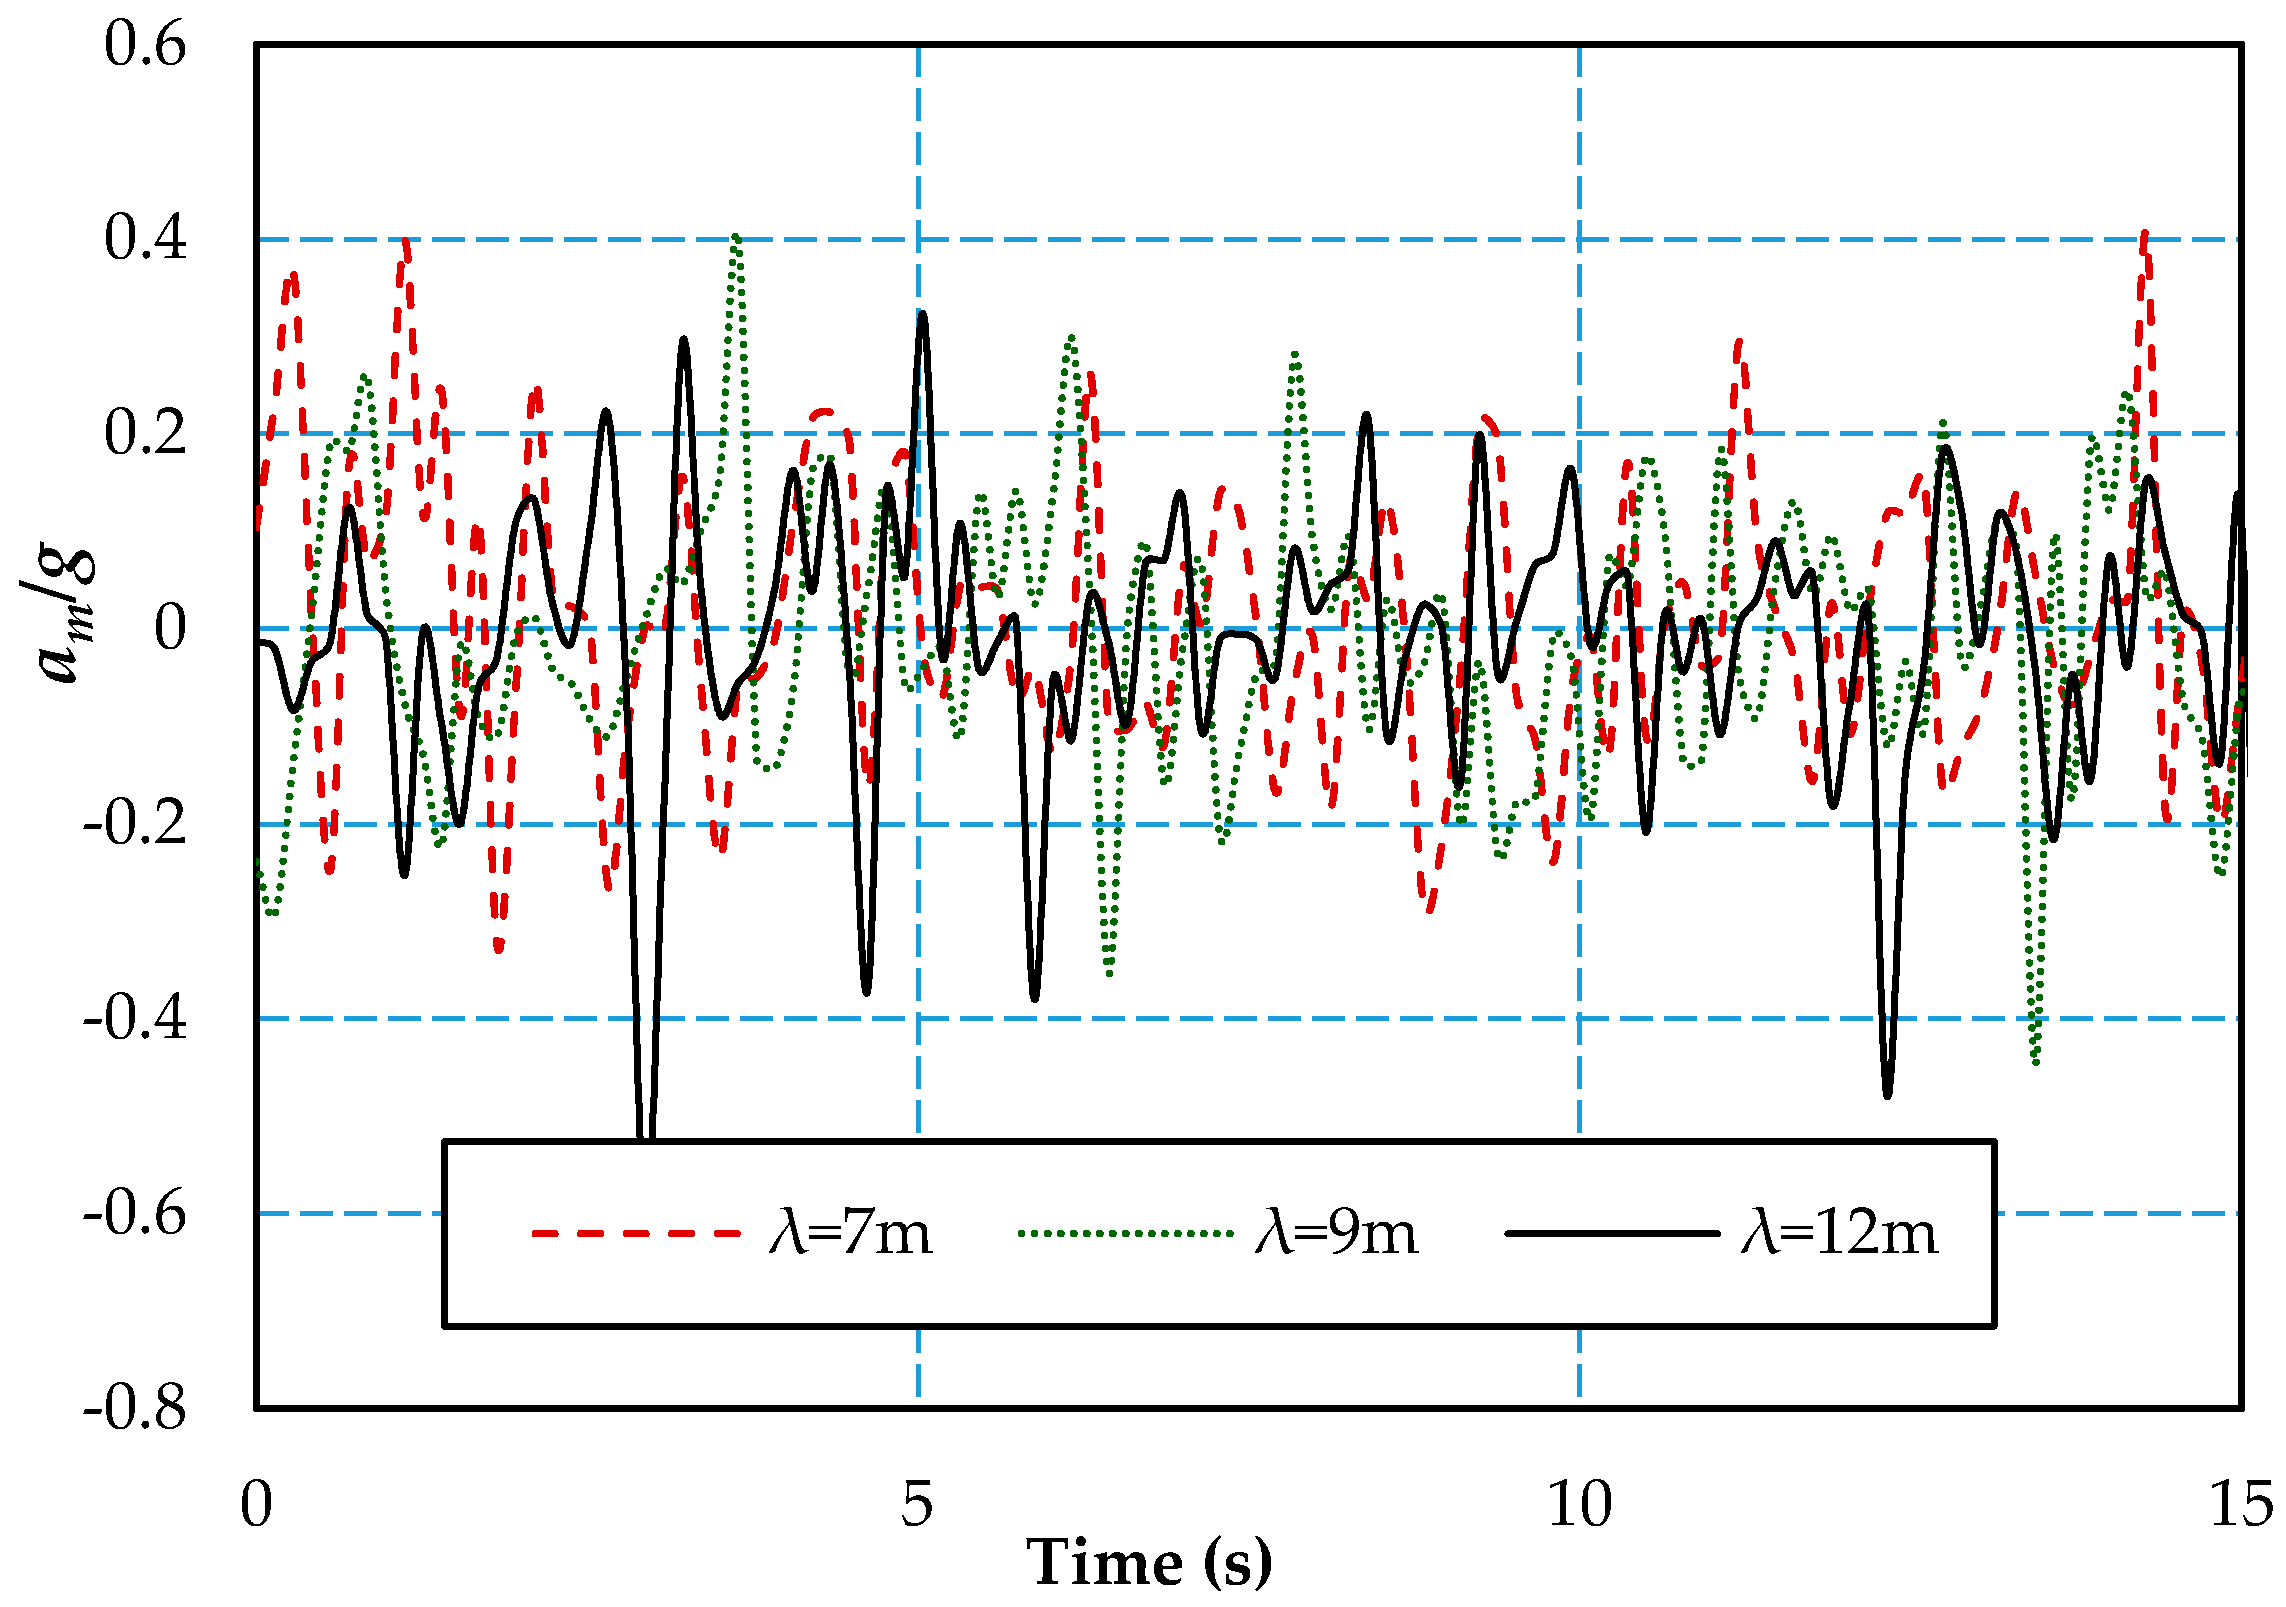
Figure 14, Figure 15 and Figure 16 show the oscillation curves of heave, pitch, and acceleration, respectively, at various wavelengths. By comparison of these motion parameters, it can be seen that the periodic features of heave motion is most evident and regular. While periodic oscillation regularity of the pitch motion is not obvious, in a single period, the monitored value shows sharp fluctuation. Not surprisingly, no periodic features are found for the acceleration.
Table 2 shows the average values of heave, pitch, and pressure in the model test. As can be seen, the average values of heave and pitch increase with the speed, while the values of pressure decrease, and the pressure value reduces to 0.51 kpa at the Froude number Fn = 0.99.
3. Numerical Simulation
3.1. Numerical Methods
The numerical simulation of the PACSCAT model in waves is carried out using the FVM (finite volume method) based CFD software Star-ccm (Star-ccm v 5.04, CD-adapco, Melville, New York, NY, USA). As for the incompressible viscous flow, the Reynolds Navier–Stokes equations method is mainly adopted, which is widely used in engineering applications, and the impact of fluctuating density is ignored. The shear stress transport (SST) turbulence model is used to close the set of governing equations. The volume of fluid (VOF) model is applied to simulate the evolution of the free surface.
In the simulation of waves, the linear plane wave model in sea-keeping tank tests is utilized. The equation for horizontal velocity is as follows:
The equation for vertical velocity is as follows:
The equation for surface elevation is as follows:
where is wave amplitude, is wave frequency, K is wave vector, is magnitude of wave vector, and is vertical distance from the mean water level.
The DFBI (dynamic fluid body interaction) model is introduced as the motion model, two degrees of freedom, heave (degrees of vertical Z motion) and pitch (longitudinal Y rotation), are calculated. The translation equation for the center of mass of the body is defined in the global inertial coordinate system as follows:
where represents the mass of the body, is resultant force acting on the body, and is velocity of the center of mass. The equation of rotation of the body is formulated in the body local coordinate system with the origin in the center of mass of the body:
where M is tensor of the moments of inertia, is angular velocity of the rigid body, and n is resultant moment acting on the body.
3.2. Geometric Simplification and Calculation Domain
The calculated PACSCAT model adopts the same scale as the experimental model. Considering the complexity of internal air transportation between the centrifugal pump and pressurized chamber, the compression process of air flow is ignored, and a series of air intakes on the connection deck are used to directly inflate the air cushion. The bow and stern seals are simplified as rigid walls because the deformation of seals is unpredictable.
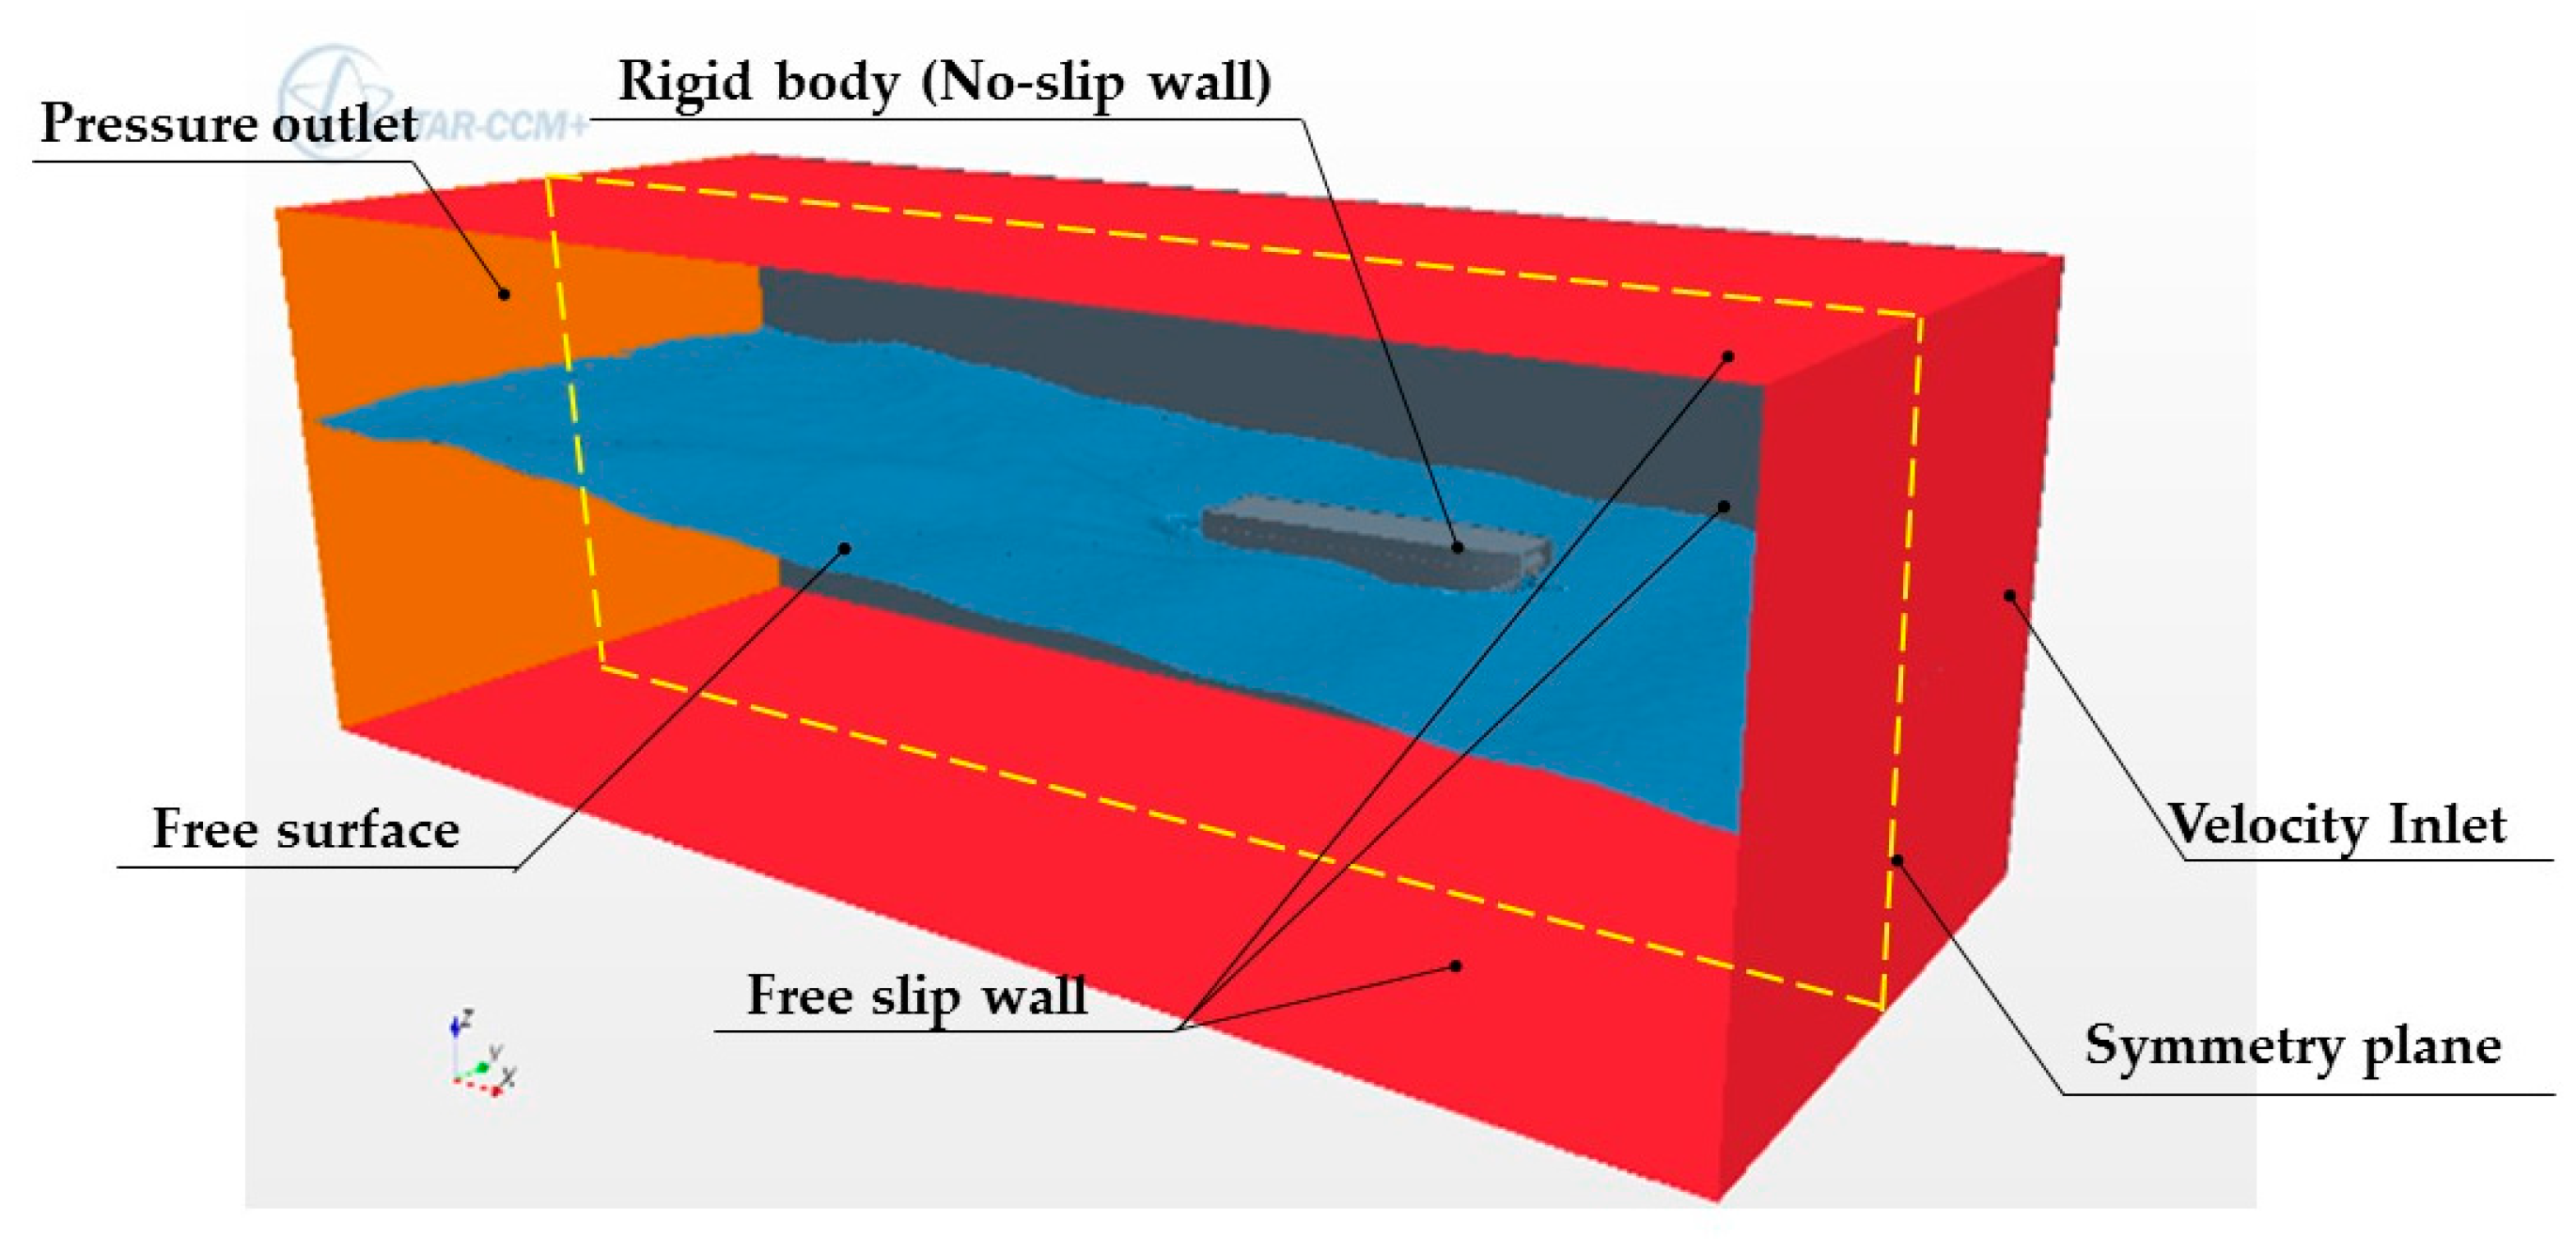
The calculation domain shown in Figure 17 extends for 1 L in front of hull, 3 L behind the hull, 1.5 L to the side. 1.5 L under the free surface, and 0.8 L above the free surface. At the inlet in front of the hull, the velocity (both for water and air) is specified by the velocity of hull, while for the air intake on the connection deck, the velocity is defined as the ratio of air flow rate to the sectional area of air intake. At the outlet, hydrostatic pressure is applied. The symmetry condition is used at the central plane of the hull. The hull body is considered as a rigid body and a no-slip condition is imposed on the hull surface. A free slip condition is used for the other boundaries.
3.3. Mesh Generation and Dependency Analysis
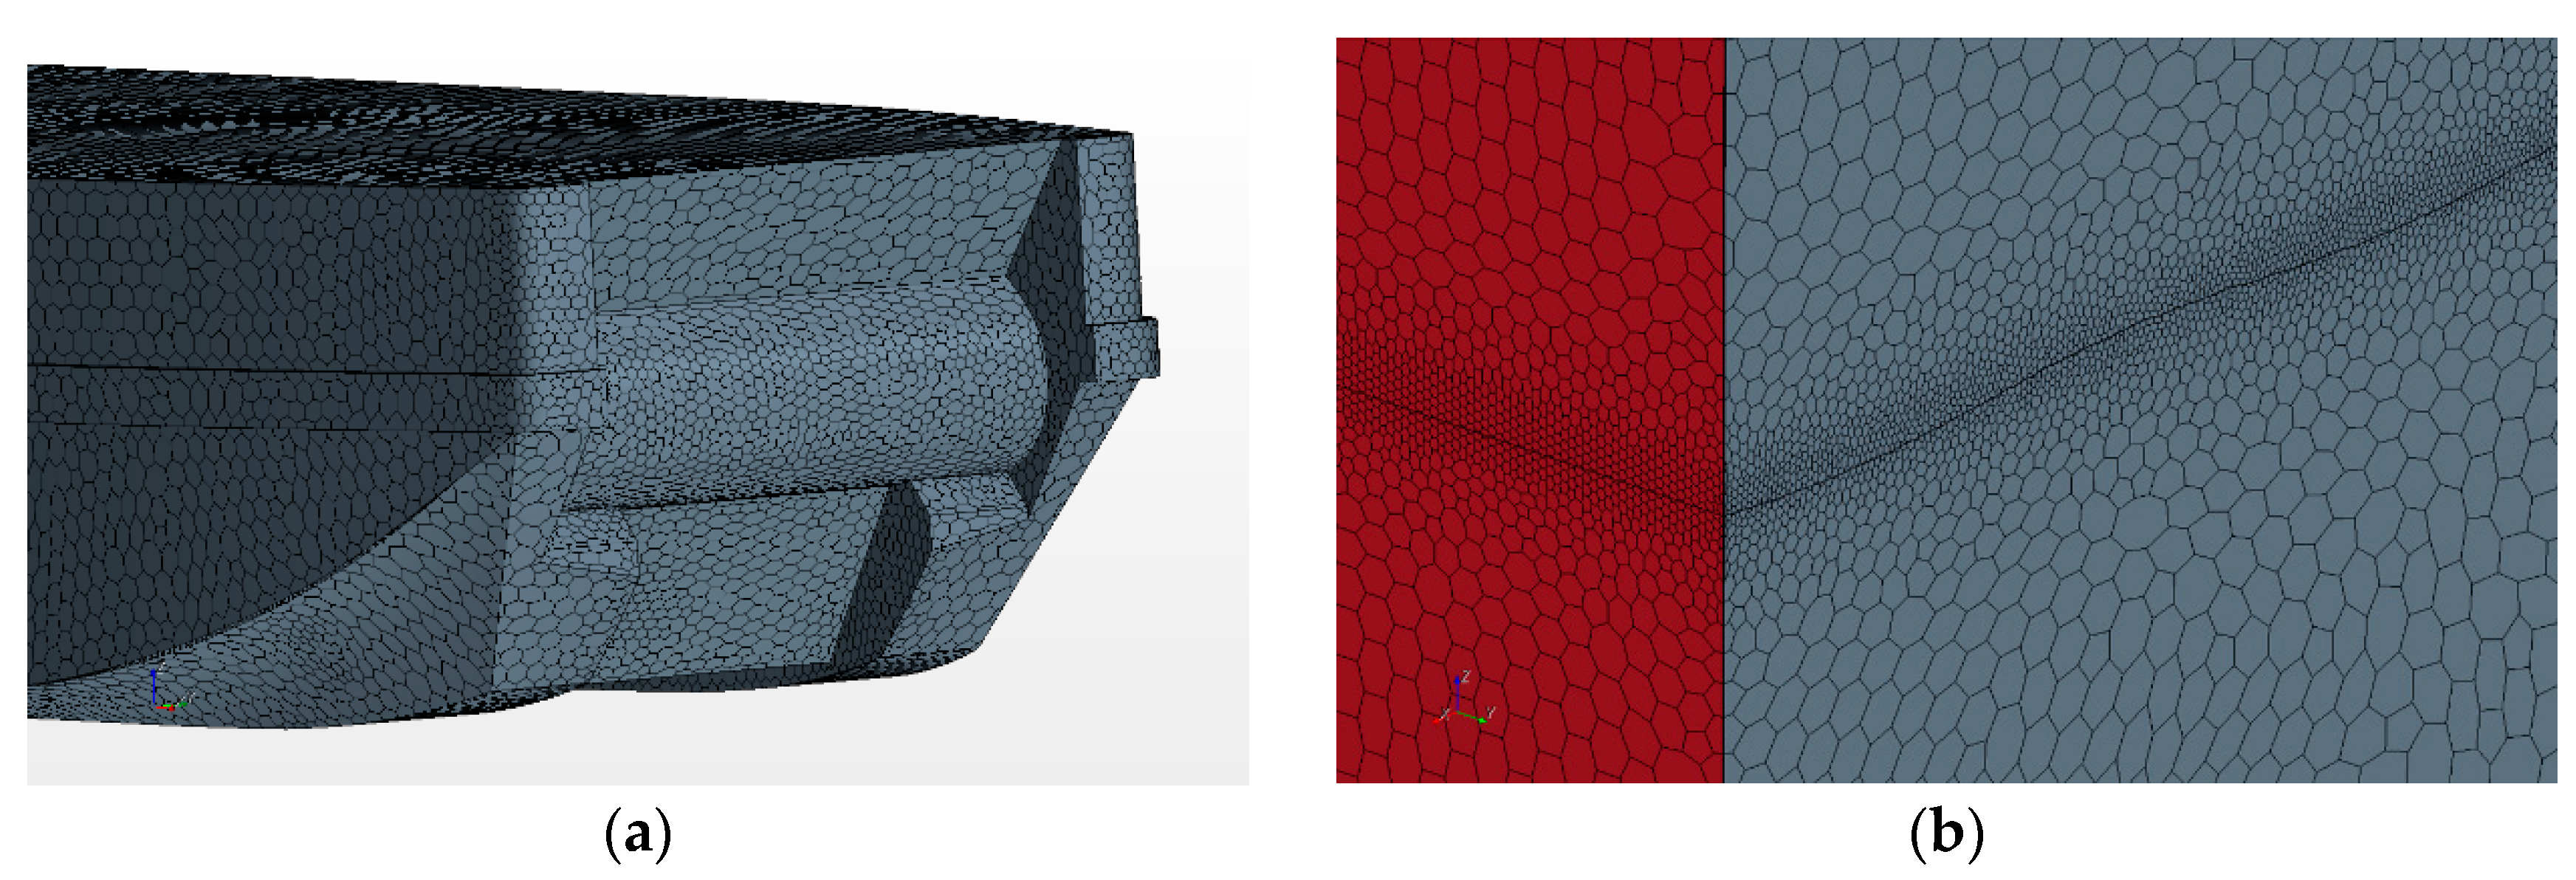
As shown in Figure 18, an unstructured mesh with polyhedral element is used to discretize the calculation domain, the mesh around hull body and free surface is refined to accurately capture the flow in air cushion and the evolution of wave form. For the purpose of avoiding the wave value attenuation caused by spatial discretization error, the mesh size in the Z direction is set as 1/10 of the wave height for the wave-created region. To ensure the convergence of algebraic equations and weaken the impact of wave attenuation caused by discrete-time error, numerical wave tank time steps are selected in the order of 10−3 s. The total simulation time is about 10 periods for different wave lengths, and the residual error adopted is 10−4 for a single time step.
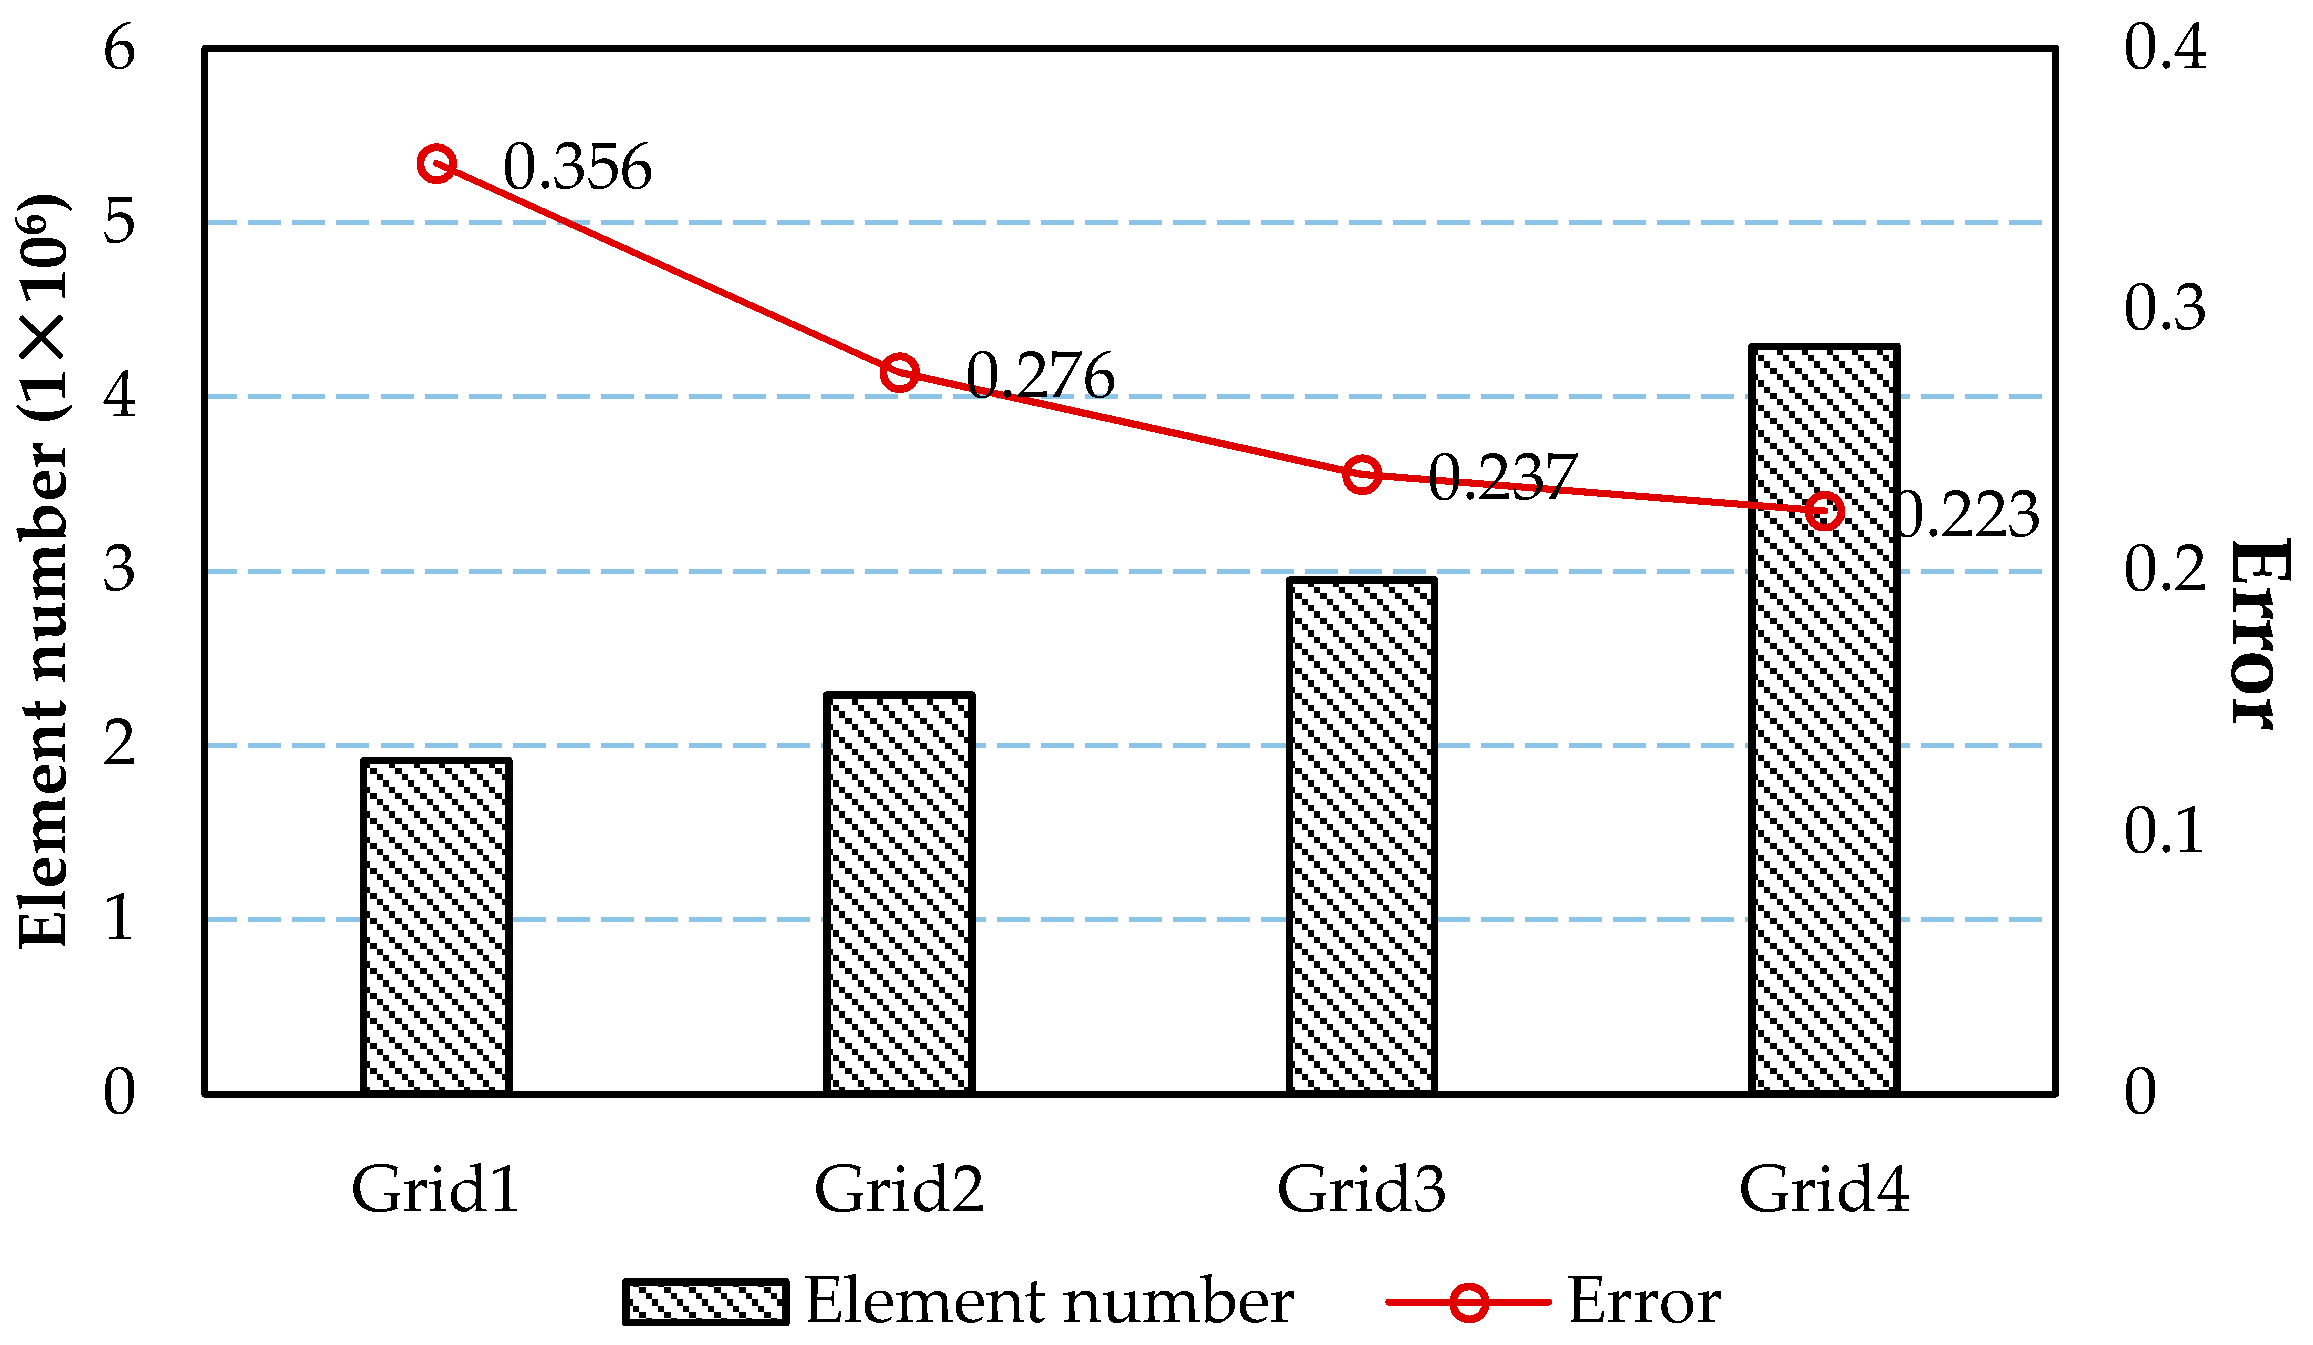
The mesh size plays an important role in the calculation procedure, a fine mesh can always bring credible results, but, at the same time, can increase the computational cost and time consumption because of the large element number. Therefore, to determine the mesh size with acceptable numerical accuracy and element number, mesh convergence studies are carried out for the calculation of calm water resistance at a Froude number of 0.99. According the recommended procedure of ITTC, four mesh plan are created based on a refinement ration of . The total element number and the calculated error (defined by , the subscripts cal and exp denote the calculated and experimental value, respectively) are presented in Figure 19. It can be seen that as the element number increases, the numerical accuracy is evidently improved; when the mesh is as fine as Grid 3, further refinement would lead to a large augment of total element number, however, the improvement in numerical accuracy is no more significant. Therefore, the mesh dependency is confirmed and the mesh plan Grid 3 is selected as the optimum mesh for the following calculation.
3.4. Results and Analysis
Using the numerical tools, the PACSCAT model navigating in waves is simulated, and operation conditions (wave length, wave height, and forward speed) are determined according the experiment procedure. The heave and pitch motion, as well as midship acceleration were recorded, as has been done in the model test. Moreover, detailed flow information, which cannot be observed in the real test, is also presented.
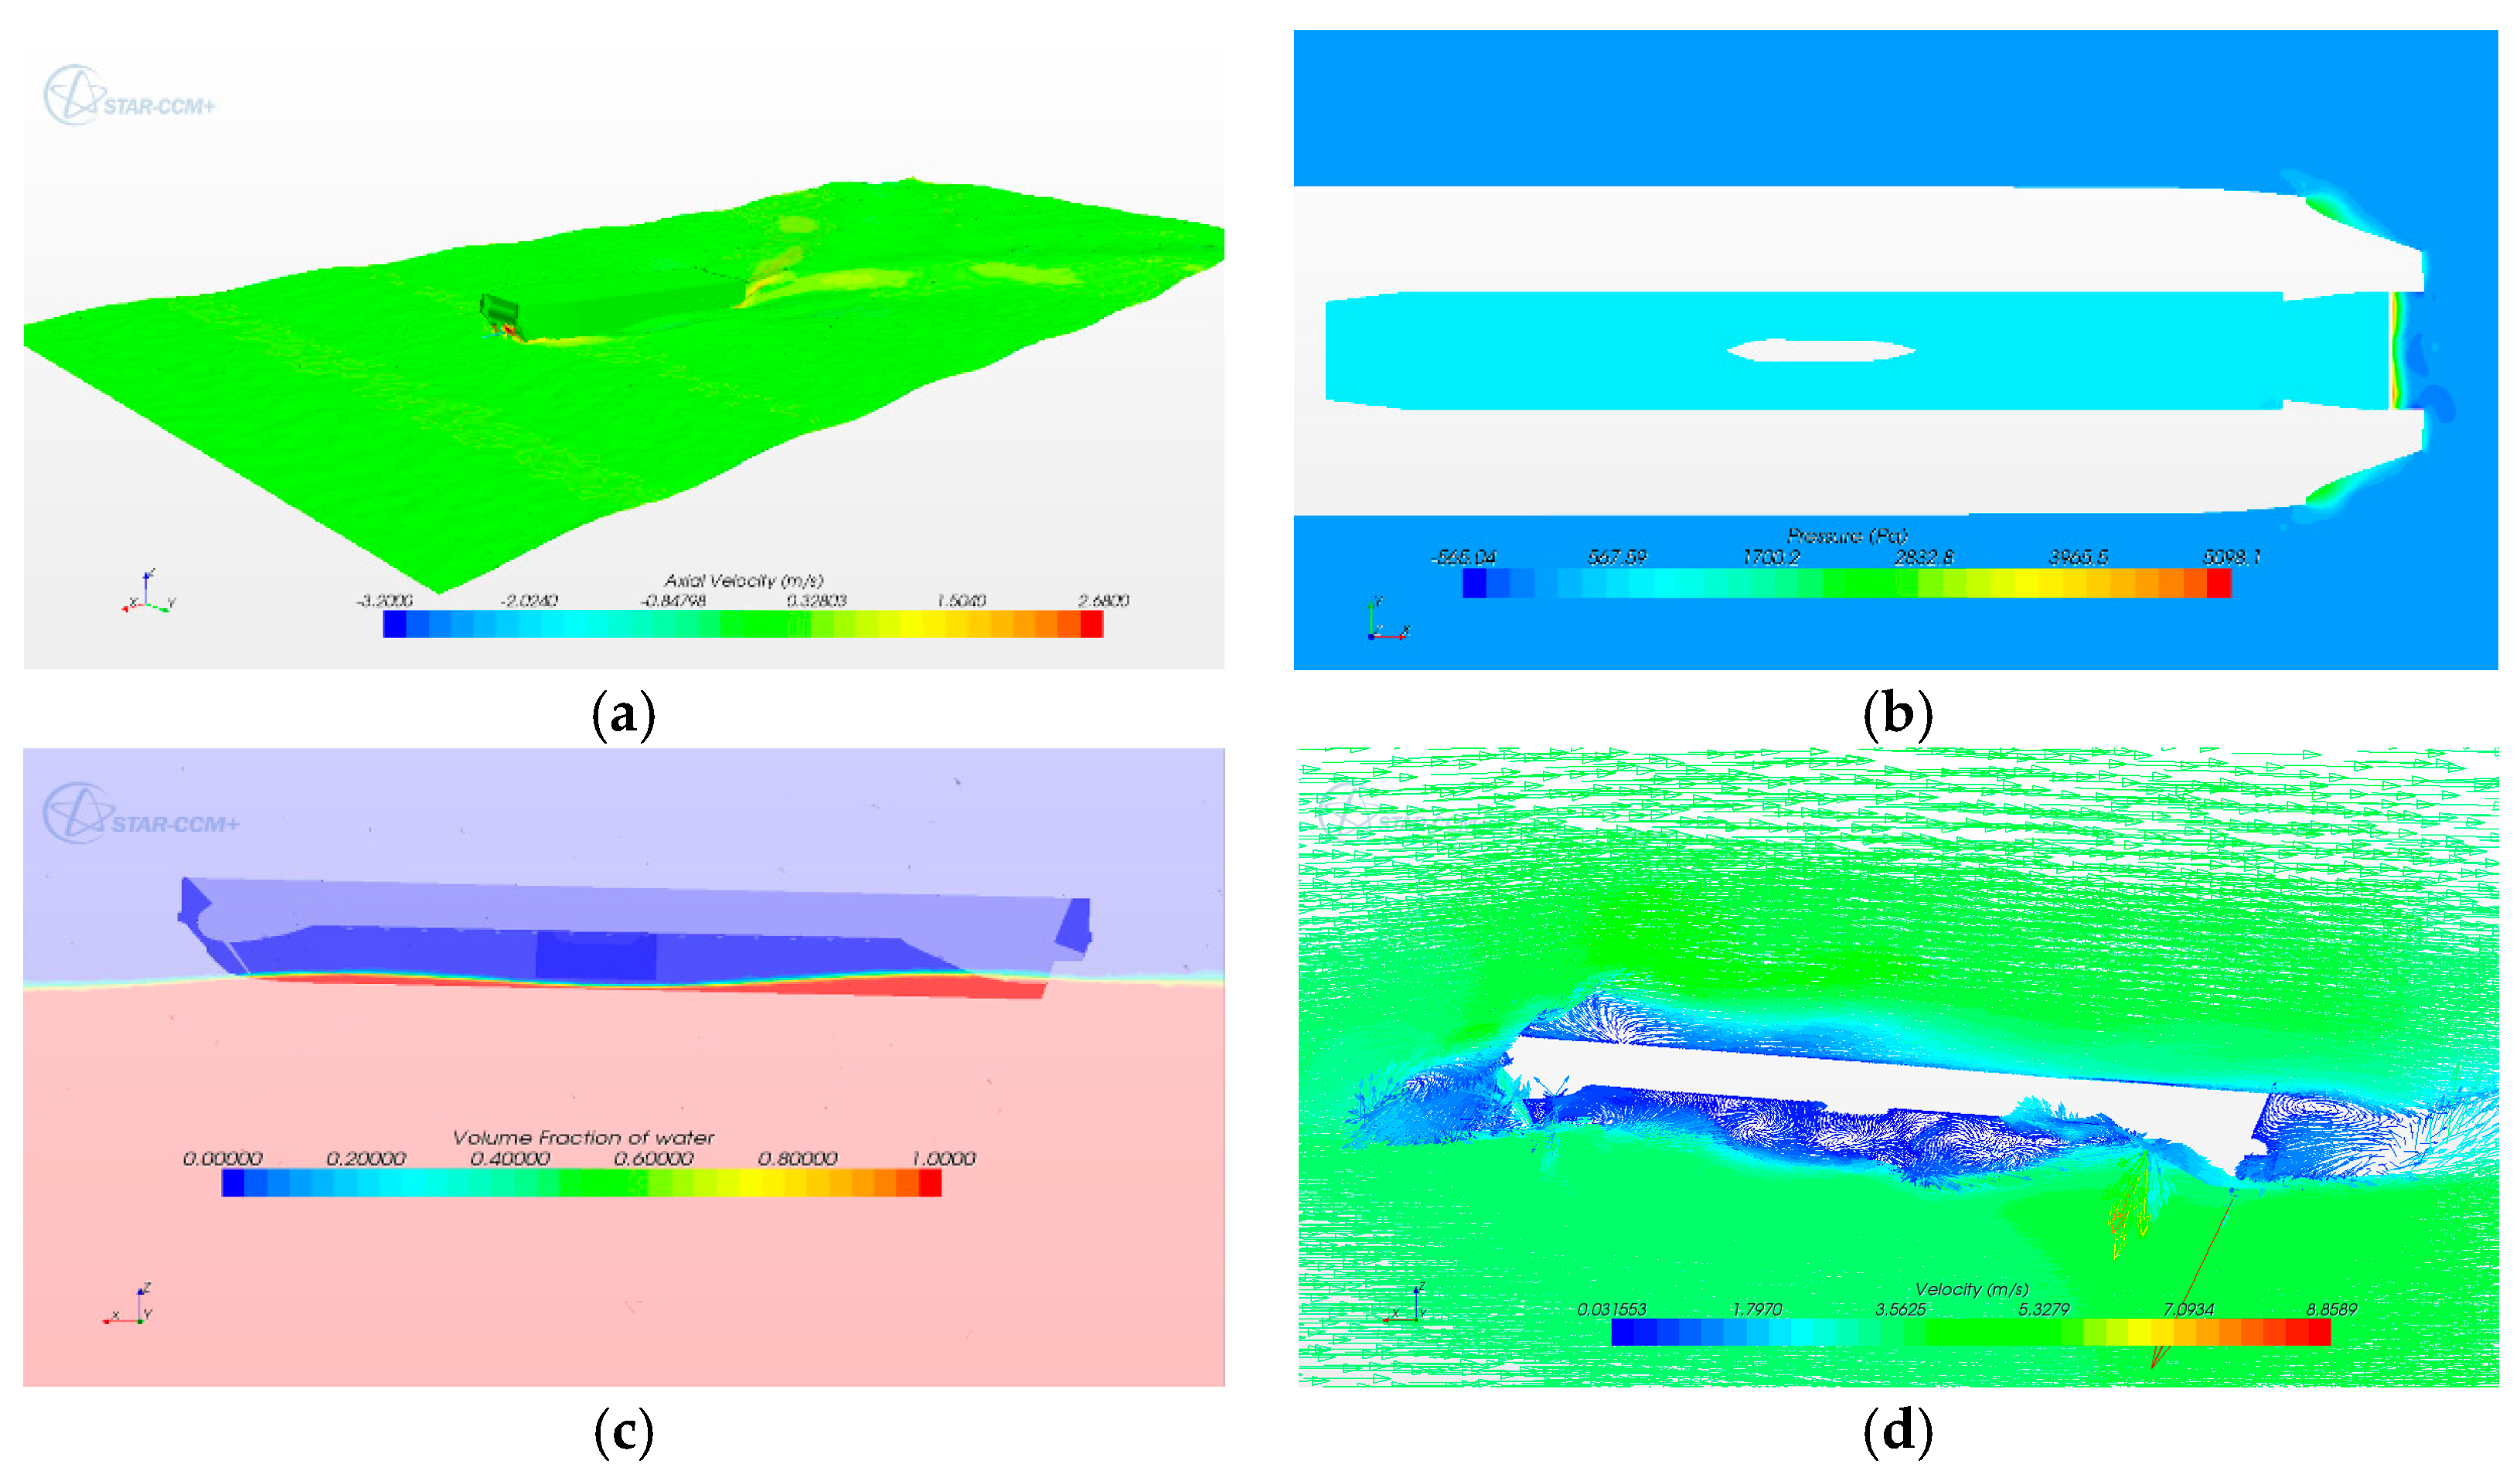
In Figure 20, numerical results of wave evolution, pressure distribution in water plane, longitudinal wave pattern, and velocity distribution in the center plan are performed for the operation condition of λ = 4 m, Fn = 0.71. It can be seen that the rigid bow seal has an obvious obstructing effect on the water, which would create an evident high-pressure region in the outside of bow seal (Figure 20b). As has mentioned in the experimental results, the magnitude of the internal air cushion pressure distributed on the connection deck is uniform, confirming that wave evolution has a slight influence on the longitudinal pressure center on the connection deck. It is interesting to note that the low-speed air whirls represent the main flow pattern in the air cushion (Figure 20d), the presence of which could depress the wave surface under the air cushion, causing the air to leak from the midship of the side-hull.
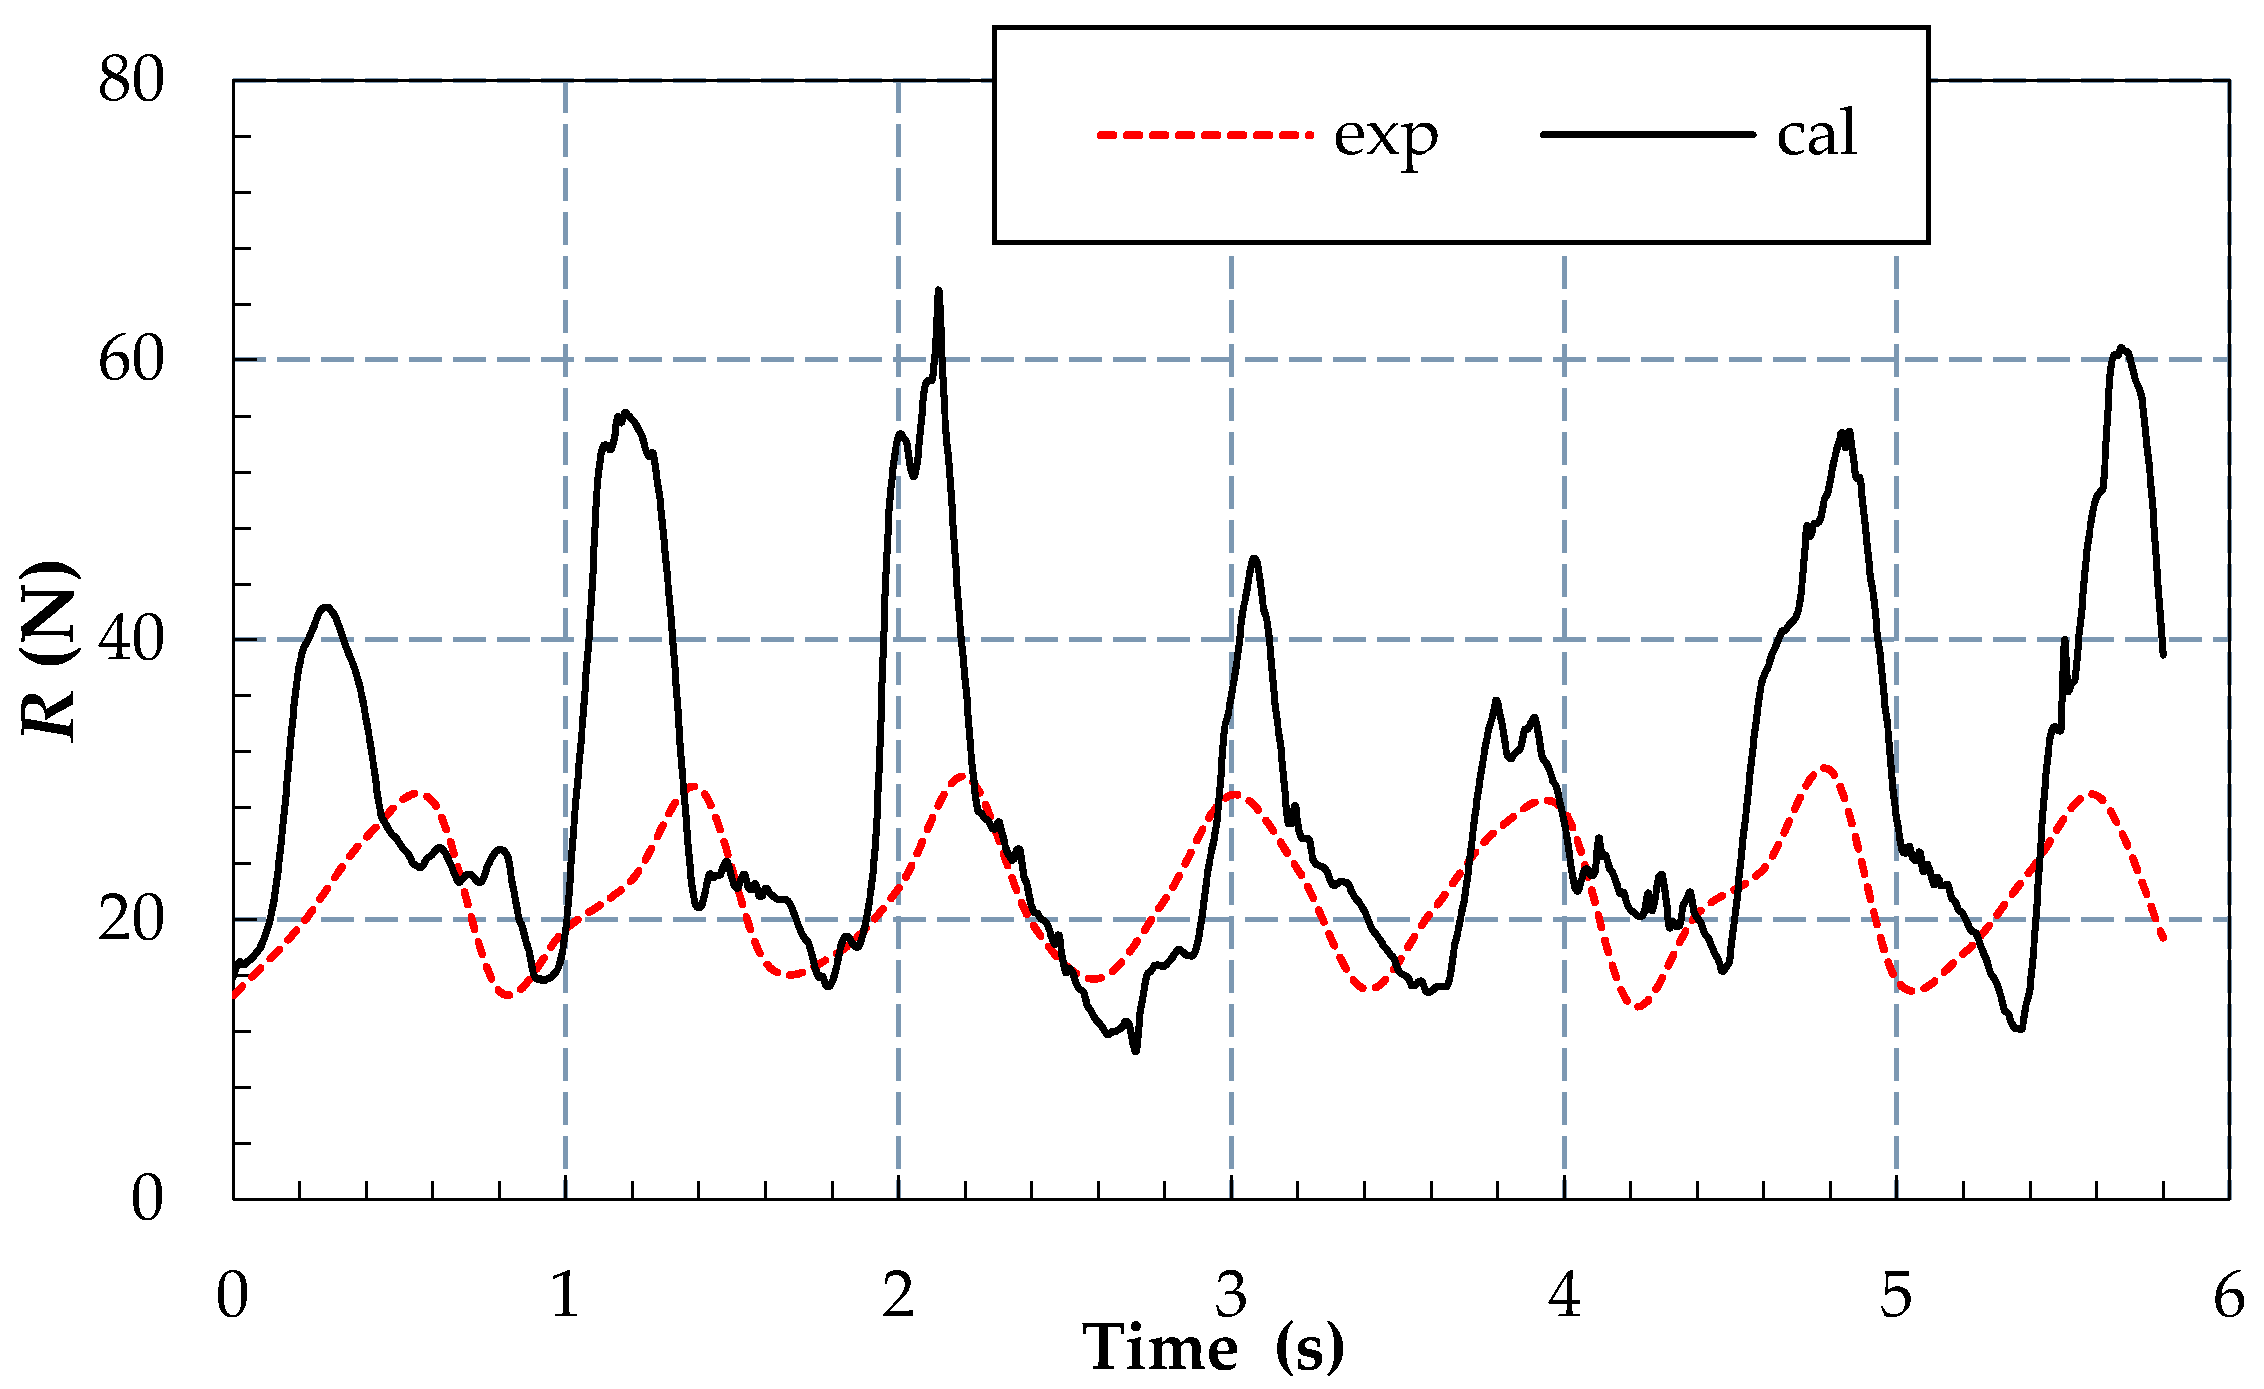
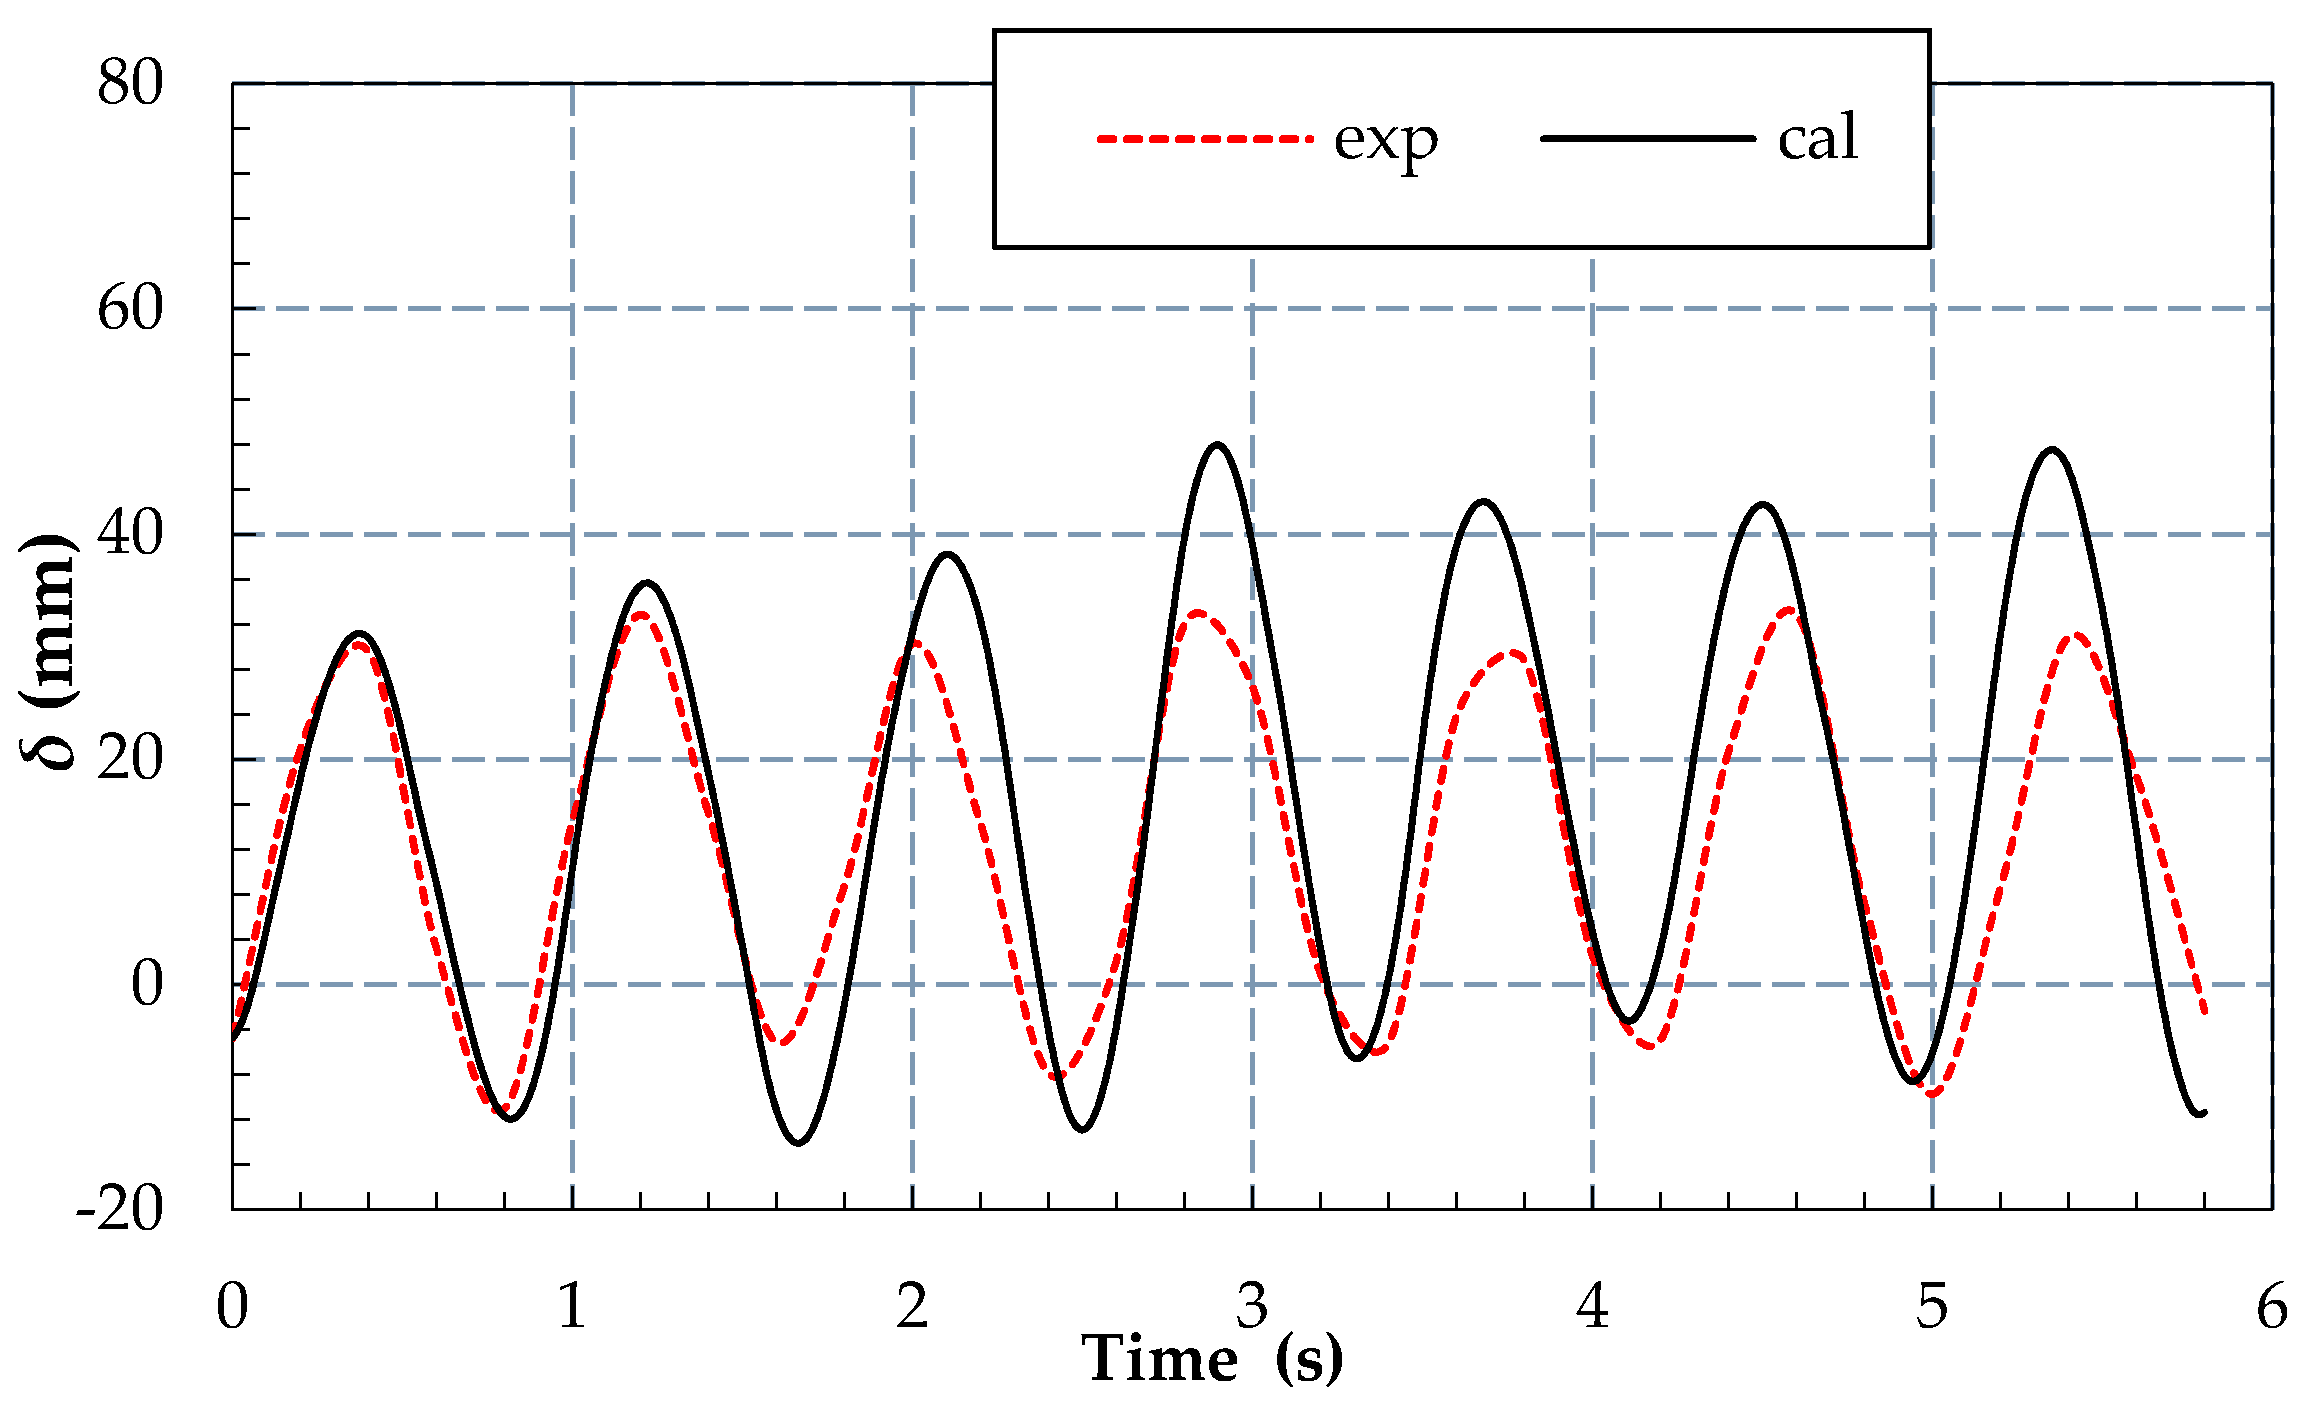
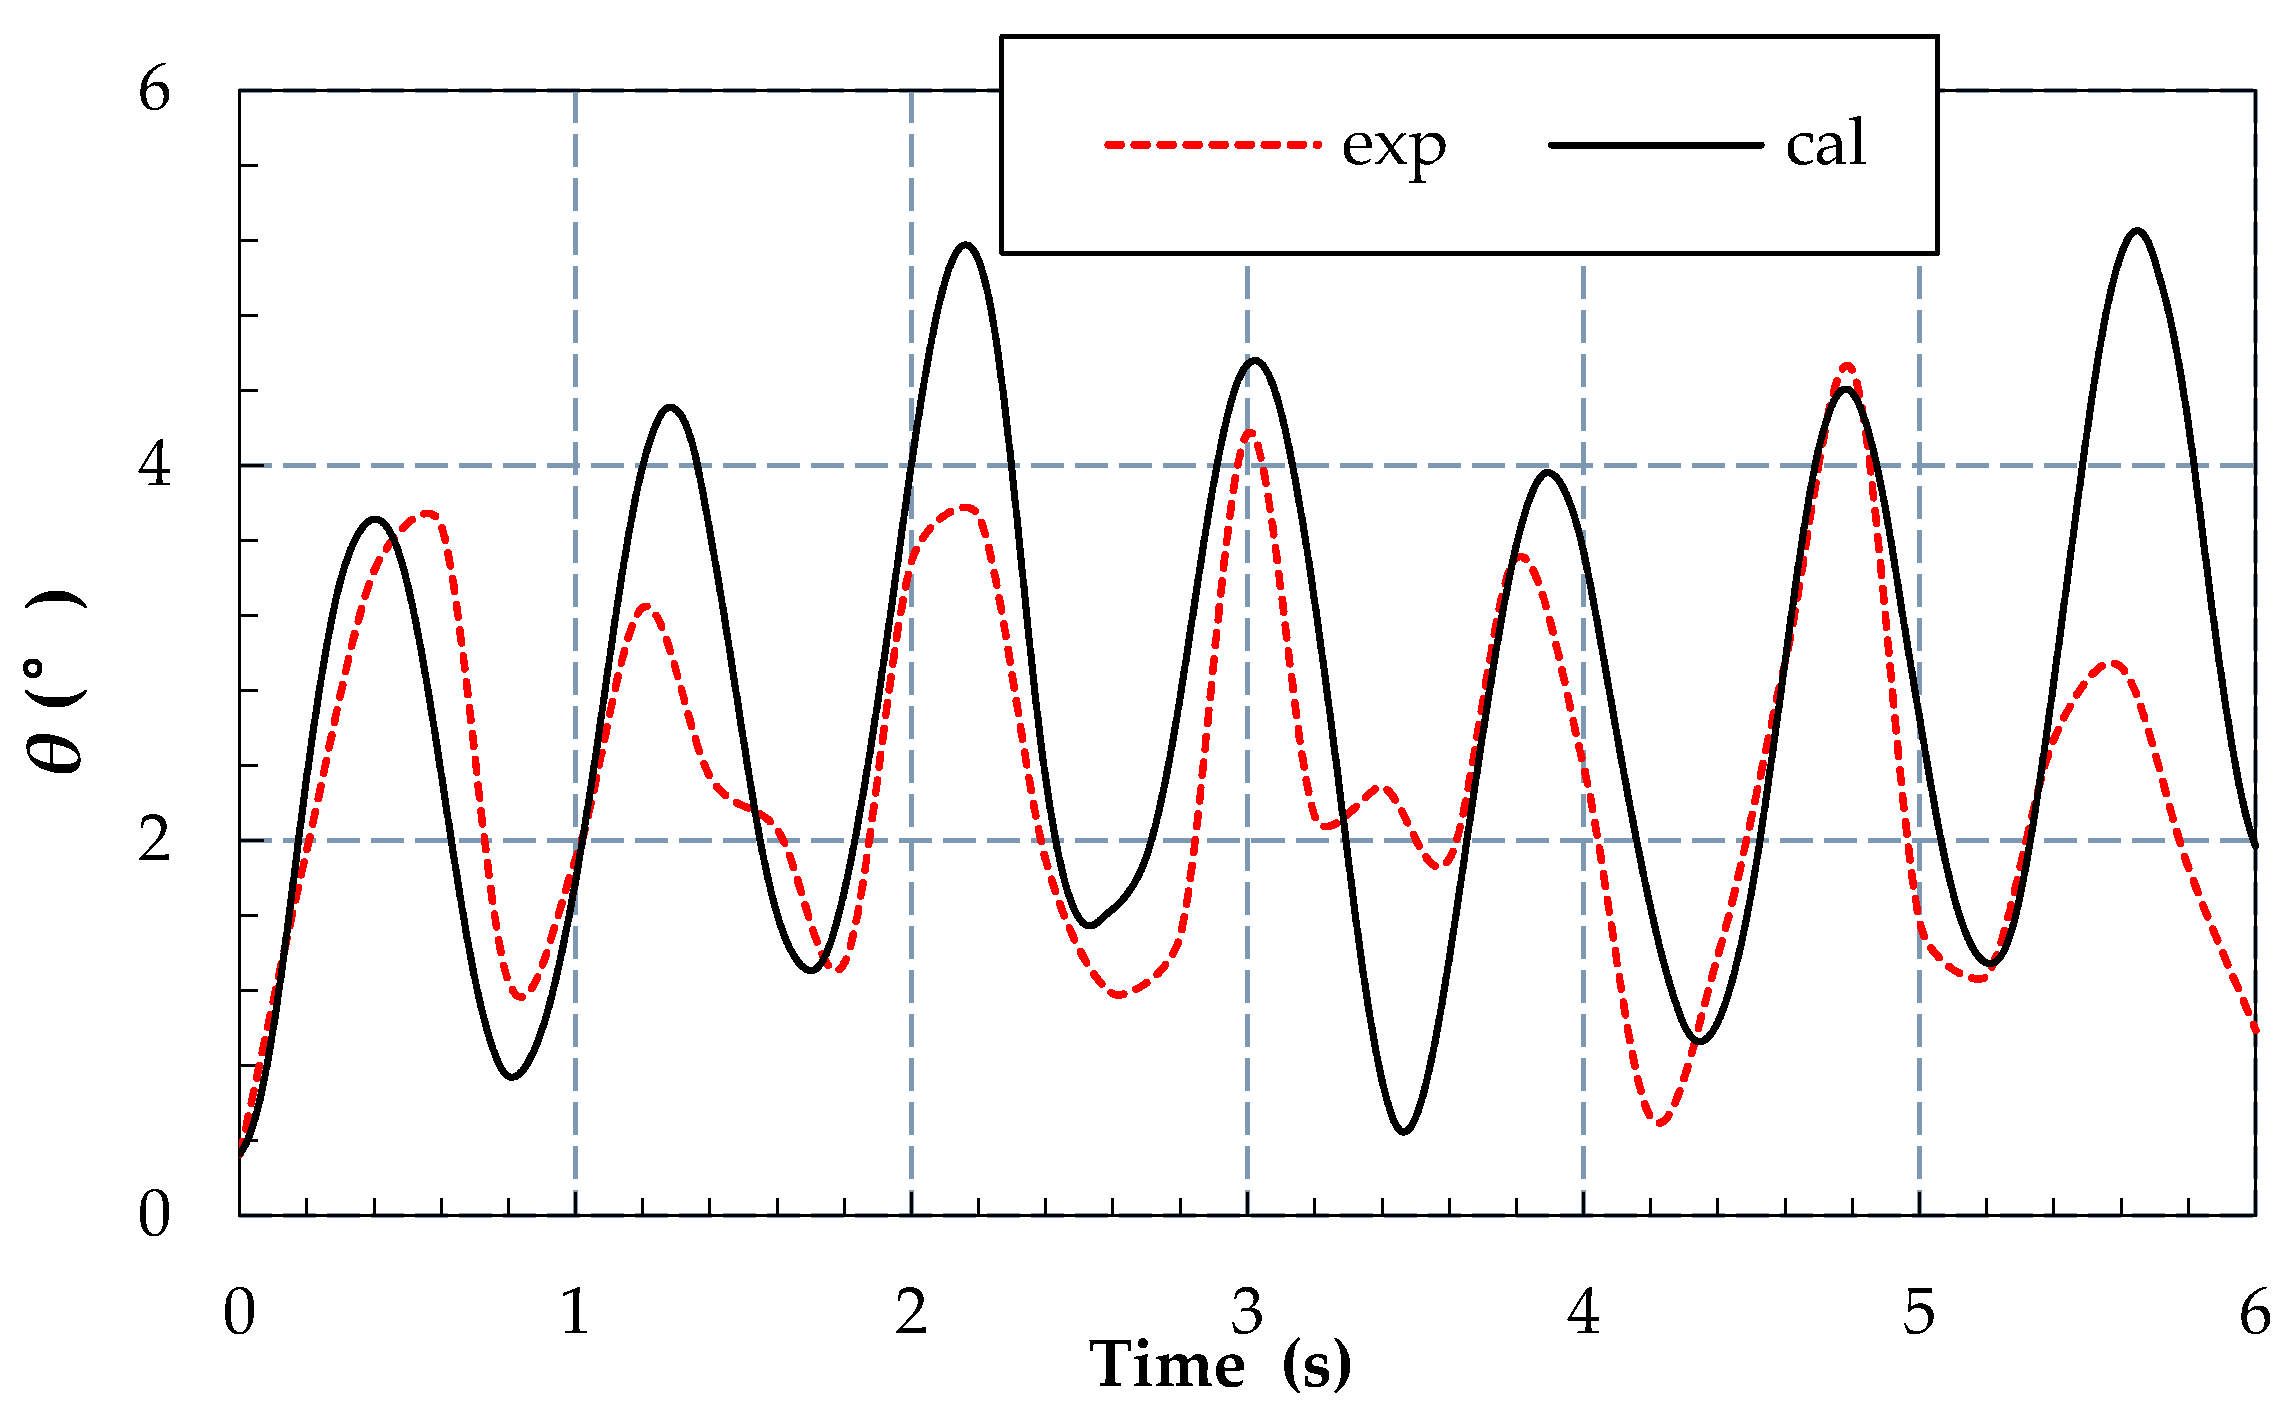
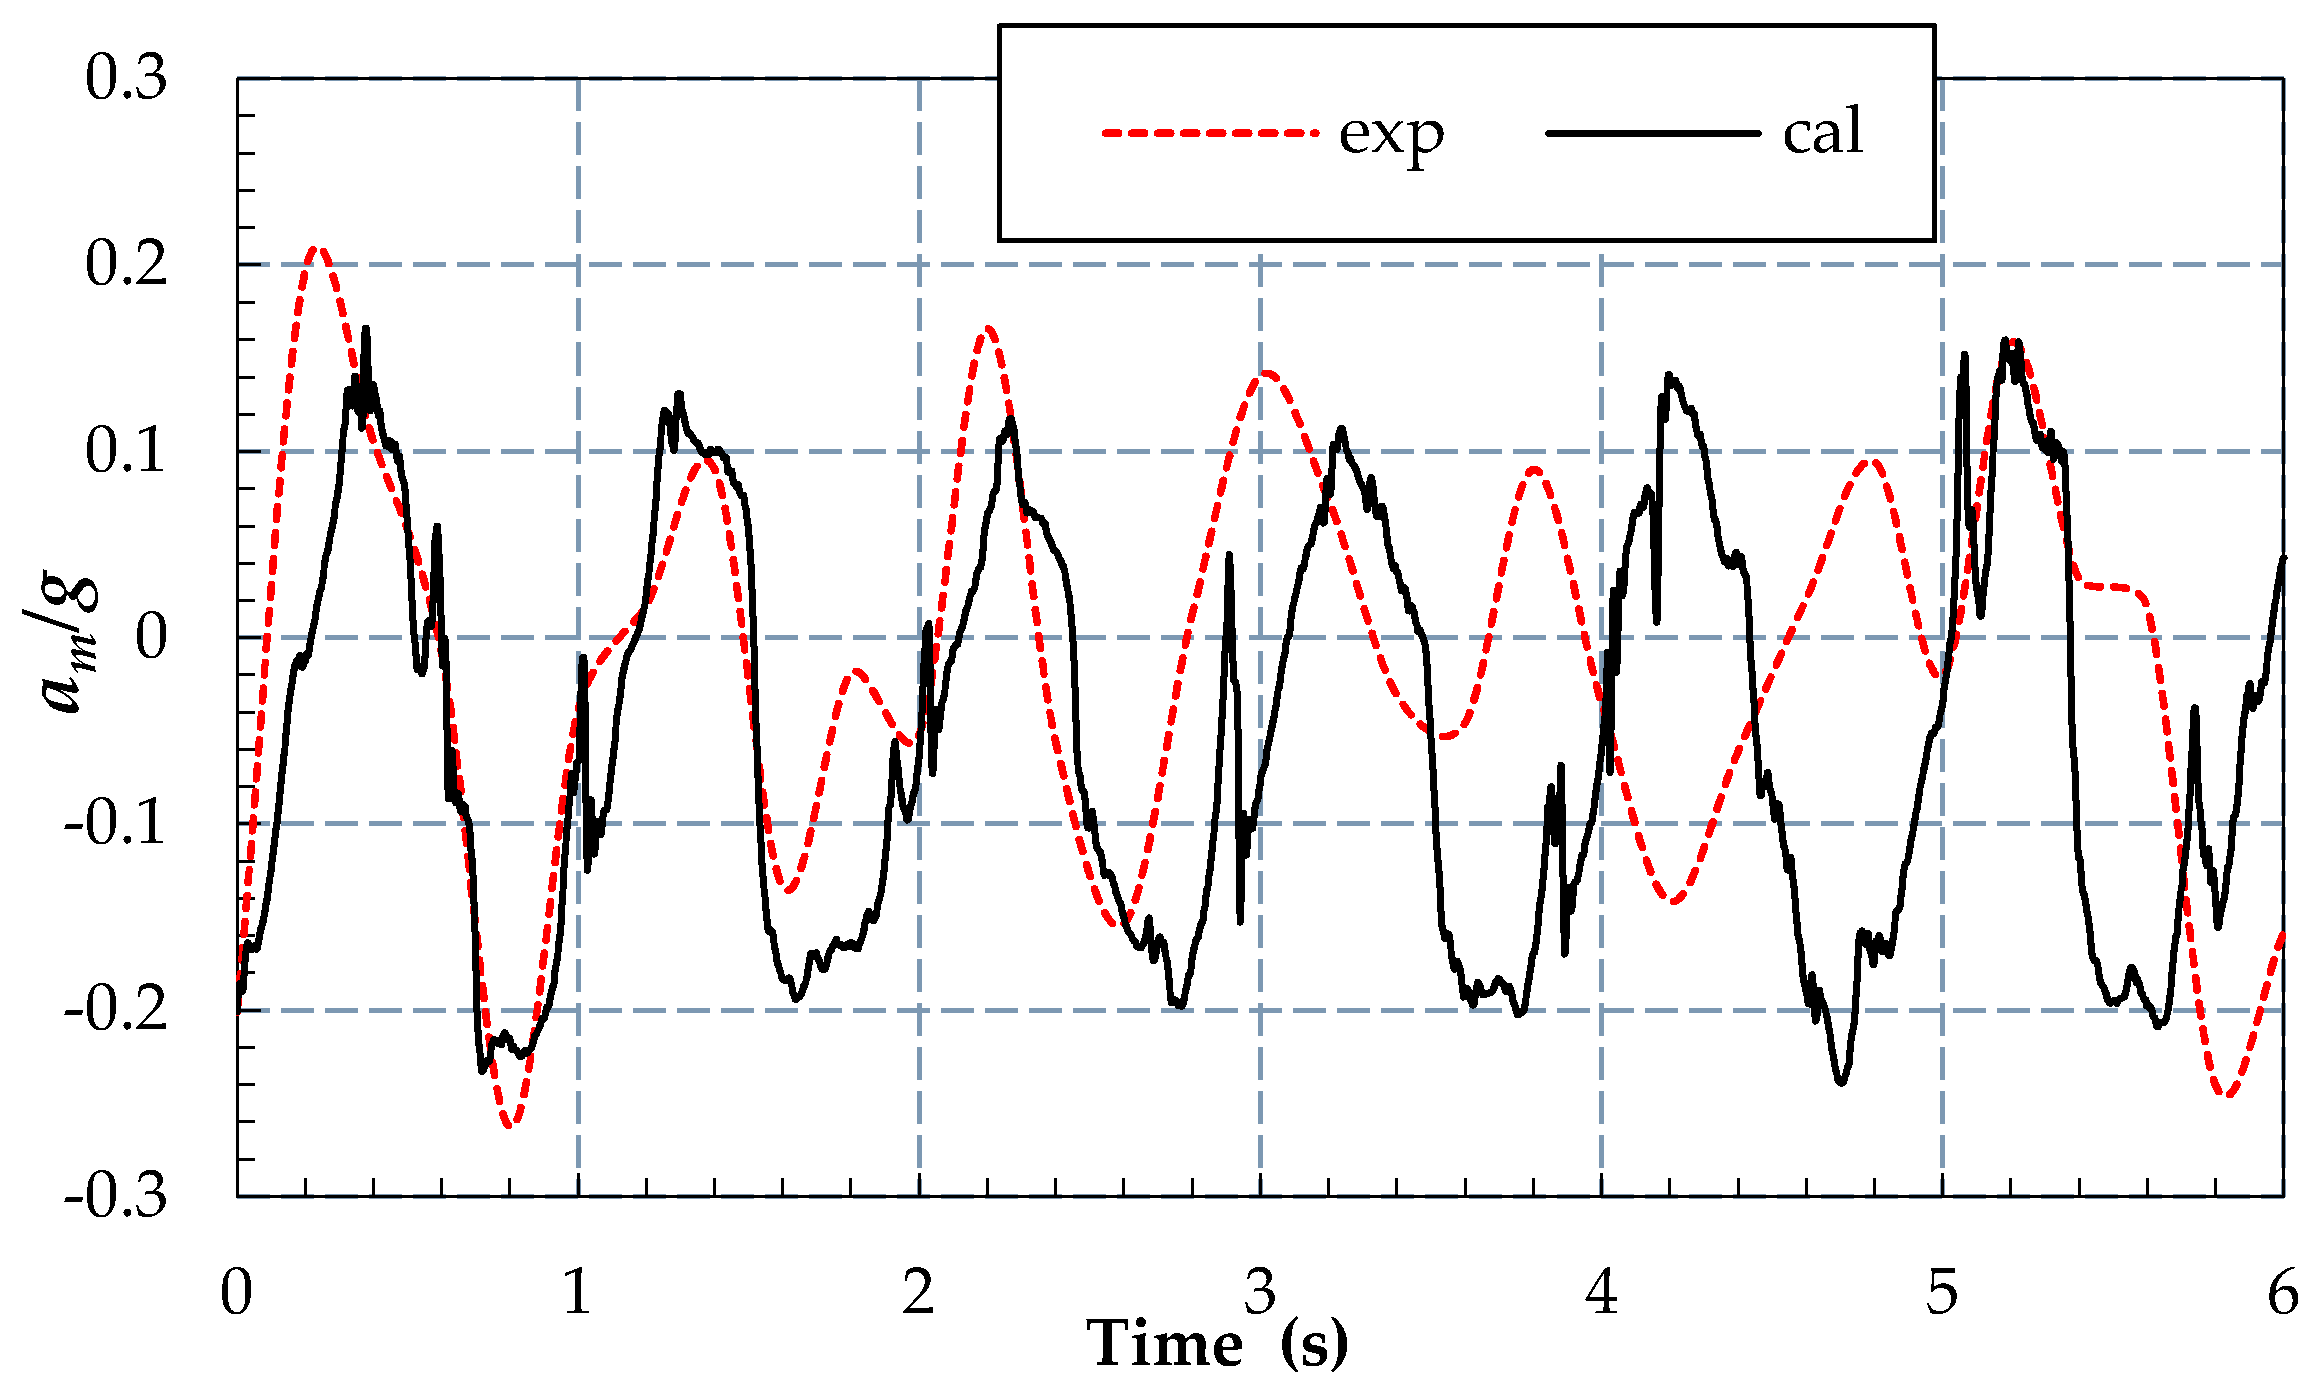
Figure 21 shows the comparison of resistance oscillation curves between numerical results and experimental data for the operation condition of λ = 7 m, Fn = 0.99, in which the caption exp represents the experimental results, while cal represents the calculated results. As the key point concerned here is the magnitude variation in an interval of time, the origin on time axis is set to zero and the two curves are synchronized in a same phase, on which the closet value of hull behavior (pitch and heave) can be found between the experimental and calculated results. As can be seen, the calculated peak resistance is significantly higher than the experimental value. This is mainly because that the flexible bow seals in model test is replaced by a rigid wall during simulation; when a bow-down motion occurs, the rigid bow seal would directly stick in water, creating an evident additional resistance, while the flexible bow seals could deform under the impact of wave surface and, therefore, the water could smoothly flow past it and the influence on resistance is negligible. Figure 22, Figure 23 and Figure 24 show the contrast curves for the motion parameters. It can be seen that the calculated motion parameters show relatively good agreement with the results from the model test. Not only the oscillation amplitude, but also the development tendency are represented in the numerical simulation, which confirms that the numerical method presented a considerable accuracy in the prediction of PACSCAT motion in regular waves.
In Figure 25, Figure 26 and Figure 27, the calculated and experimental motion amplitudes of heave, pitch, and midship acceleration, respectively, are plotted as functions of encountered frequency ωe. It can be seen from the heave curves that the curve hump, which located at the nature frequency, moves to the high-frequency region as the speed is increased. The difference between the calculation and experiment is not obvious at the high-frequency region (ωe > 8), but the predicted natural frequency of heave is a little higher than the experimental value. Compared with the response curves of pitch, the calculated results show good agreement at the Froude number of 0.71, but departure severely at higher speeds, while they fail to capture the natural frequency as well. For the acceleration, the divergence becomes evident in the hump region for the calculated speeds.
Table 3 shows the amplitudes of different motion parameters at different speeds acquired in numerical simulation.
4. Conclusions
In this study, the motion characteristics of PACSCAT in regular waves are investigated by both model test and numerical simulation. On the basis of the presented results, the following conclusions can be drawn:
- (1)
- As the wave length is increased, the air-cushion pressure shows converse laws with heave and pitch motions, but has a consistent trend with the midship acceleration. The heave and pitch motions possess evident periodicity, while oscillation of air-cushion pressure and acceleration is nonlinear.
- (2)
- Simplification of flexible seals as a rigid wall would cause a large error in the resistance calculation in waves, further improvement is essential to take the deformation of seals into consideration.
- (3)
- The monitored pressure value in the towing test and numerical simulation confirm that the wave evolution has no significant influence on the distribution pattern of air-cushion pressure.
- (4)
- The numerical method shows good agreement in predicting the periodicity of different motion parameters, while the calculated amplitude responses of heave and midship acceleration only have considerable accuracy in the high-frequency region (we > 8) and an obvious error is detected in the prediction of pitch amplitude response.
Author Contributions
Conceptualization, J.Y. and Z.L.; Methodology, J.Y.; Software, J.Y. and Z.G.; Validation, J.Y. and Z.G.; Formal analysis, J.Y. and Z.L.; Investigation, J.Y.; Resources, P.L.; Data curation, J.Y. and Z.G.; Writing—original draft preparation, J.Y.; Writing—review and editing, J.Y. and Z.G.; Visualization, J.Y. and Z.G.; Supervision, Z.L.; Project administration, Z.L.; funding acquisition, Z.L. and P.L.
Funding
This research was funded by National Science of Foundations grant numbers 51409069 and 51409054.
Conflicts of Interest
The authors declare no conflict of interest. The funders had no role in the design of the study; in the collection, analyses, or interpretation of data; in the writing of the manuscript; or in the decision to publish the results.
Nomenclature
| Real-time value of midship acceleration (m/s2) | |
| Time-average value of midship acceleration (m/s2) | |
| Amplitude of heave midship acceleration (m/s2) | |
| Air cushion beam (m) | |
| Beam overall (m) | |
| Waterline beam in non-cushionborne mode (m) | |
| Block coefficient | |
| Froude number | |
| g | Gravitational acceleration (m/s2) |
| Air cushion height (m) | |
| Wave height (m) | |
| Air cushion length (m) | |
| Length overall (m) | |
| Waterline length in non-cushionborne mode (m) | |
| Midship pressure magnitude (kPa) | |
| Air flow rate (m3/min) | |
| Resistance (N) | |
| Average draft in non-cushionborne mode (m) | |
| Average draft in cushionborne mode (m) | |
| Speed of PACSCAT model (m/s) | |
| Deadrise angle (°) | |
| Real-time value of heave (mm) | |
| Time-average value of heave (mm) | |
| Amplitude of heave motion (mm) | |
| Real-time value of pitch (°) | |
| Time-average value of pitch (°) | |
| Amplitude of heave pitch (°) | |
| Wave length (m) | |
| Encountered frequency (rad/s) | |
| ∆ | Displacement (N) |
References
- Yun, L.; Bliault, A. Theory and Design of Air Cushion Craft; Hodder Headline Group: London, UK, 2000. [Google Scholar]
- Clements, R.J.; Wilson, P.A.; Lewthwaite, J.C.; Molland, A.F.; Ivanov, P. The potential for the use of a novel craft, PACSCAT (partial air cushion supported catamaran). In Proceedings of the FAST 2005 the 8th International Conference on Fast Sea Transportation, St. Petersburg, Russia, 27–30 June 2005. [Google Scholar]
- Manhar, R.D. SES Seakeeping Motion in Transforming Near-Shore Head Seas. In Proceedings of the 11th International Conference on Fast Sea Transportation FAST 2011, Honolulu, HI, USA, 26–29 September 2011; Volume 9. [Google Scholar]
- Tore, U.; Odd, M.F. Cobblestone effect on SES. In Fluid Dynamics Problems of Vehicles Operating near or in the Air-Sea Interface; North Atlantic Treaty Organization: Amsterdam, The Netherlands, 1998; Volume 10, pp. 1–10. [Google Scholar]
- Joost, C.M. Motions and Added Resistance due to Waves of Surface Effect Ships. In Fluid Dynamics Problems of Vehicles Operating near or in the Air-Sea Interface; North Atlantic Treaty Organization: Amsterdam, The Netherlands, 1998; Volume 10, pp. 1–11. [Google Scholar]
- Lawrence, J.D. Near-Field Hydrodynamics of a Surface-Effect Ship. J. Ship Res. 2012, 56, 183–196. [Google Scholar]
- Reynolds, A.J.; West, R.P.; Brooks, B.E. Heaving and pitching response of a hovercraft moving over regular waves. J. Mech. Eng. Sci. 1972, 14, 340–352. [Google Scholar] [CrossRef]
- Wu, T.F.; Yun, L.; Cheng, Y.N. Coupled roll and heave motion of Surface effect ship in beam seas. Ship Build. China 1978, 8, 6–17. [Google Scholar]
- Guo, Z.Q.; Ma, Q.W.; Yang, J.L. A seakeeping analysis method for a high-speed partial air cushion supported catamaran (PACSCAT). Ocean Eng. 2015, 110, 357–376. [Google Scholar] [CrossRef]
- Guo, Z.Q.; Qin, H.D.; Ma, Q.W. A study on hydrodynamics of the air cushion of a high-speed PACSCAT. Eur. J. Mech. B. Fluids 2018, 72, 353–363. [Google Scholar] [CrossRef]
- Guo, Z.Q.; Ma, Q.W.; Qin, H.D. A novel 2.5D method for solving the mixed boundary value problem of a surface effect ship. Appl. Ocean Res. 2018, 78, 25–32. [Google Scholar] [CrossRef]
- Guo, Z.Q.; Ma, Q.W.; Sun, H.B. A seakeeping analysis method for T-Craft. In Proceedings of the 7th International Conference on Fluid Mechanics, Qingdao, China, 24–27 March 2015. [Google Scholar]
Figure 1.
Cross sections of (a) partial air cushion support catamaran (PACSCAT) and (b) a sidewall hovercraft.
Figure 1.
Cross sections of (a) partial air cushion support catamaran (PACSCAT) and (b) a sidewall hovercraft.

Figure 2.
Non-dimensional resistance of PACSCAT and a sidewall hovercraft versus Froude number [1].
Figure 2.
Non-dimensional resistance of PACSCAT and a sidewall hovercraft versus Froude number [1].

Figure 3.
Twelve meter medium-sized boat on the sea.

Figure 4.
Hull geometry of PACSCAT.

Figure 5.
Sketch of experimental setup.

Figure 6.
Air cushion system.

Figure 7.
Bow seal and stern seals.

Figure 8.
Test speeds on the curve of non-dimensional resistance versus Froude number.

Figure 9.
The monitored history of heave and pitch motion, acceleration, and pressure value measured in midship.
Figure 9.
The monitored history of heave and pitch motion, acceleration, and pressure value measured in midship.

Figure 10.
Spray under the bow seals when the hull is rising.

Figure 11.
Midship pressure monitored in calm and regular waves.

Figure 12.
Midship pressure monitored in waves for different speeds.

Figure 13.
Pressure oscillation curves of different monitor points for Fn = 0.71.

Figure 14.
Oscillation curves of heave in different wavelengths.

Figure 15.
Oscillation curves of pitch in different wavelengths.

Figure 16.
Oscillation curves of amidships acceleration in different wavelengths.

Figure 17.
Calculation domain.

Figure 18.
Mesh generation on (a) hull body and (b) free surface.

Figure 19.
Results of mesh convergence study.

Figure 20.
Numerical results of (a) wave evolution; (b) pressure distribution in water plane; (c) longitudinal wave pattern; (d) velocity distribution in the center plane.
Figure 20.
Numerical results of (a) wave evolution; (b) pressure distribution in water plane; (c) longitudinal wave pattern; (d) velocity distribution in the center plane.

Figure 21.
Cycle oscillation resistance contrast curves for the operation condition of λ = 7 m, Fn = 0.99.
Figure 21.
Cycle oscillation resistance contrast curves for the operation condition of λ = 7 m, Fn = 0.99.

Figure 22.
Cycle oscillation heave contrast curves for the operation condition of λ = 7 m, Fn = 0.99.
Figure 22.
Cycle oscillation heave contrast curves for the operation condition of λ = 7 m, Fn = 0.99.

Figure 23.
Cycle oscillation pitch contrast curves for the operation condition of λ = 7 m, Fn = 0.99.
Figure 23.
Cycle oscillation pitch contrast curves for the operation condition of λ = 7 m, Fn = 0.99.

Figure 24.
Cycle oscillation acceleration contrast curves for the operation condition of λ = 7 m, Fn = 0.99.
Figure 24.
Cycle oscillation acceleration contrast curves for the operation condition of λ = 7 m, Fn = 0.99.

Figure 25.
The contrast curves of heave response of (a) Fn = 0.71 and (b) Fn = 0.99.


Figure 26.
The contrast curves of pitch response of (a) Fn = 0.71 and (b) Fn = 0.99.

Figure 27.
The contrast curves of amid-ships acceleration response of (a) Fn = 0.71 and (b) Fn = 0.99.
Figure 27.
The contrast curves of amid-ships acceleration response of (a) Fn = 0.71 and (b) Fn = 0.99.


Table 1.
Main dimensions of the PACSCAT model.
| Symbol | Value | Symbol | Value |
|---|---|---|---|
| 3 (m) | 0.695 (m) | ||
| 0.7 (m) | 0.581 (m) | ||
| 0.14 (m) | 2.6 (m) | ||
| 0.1 (m) | 0.26 (m) | ||
| 18 (°) | 0.22 (m) | ||
| 2.83 (m) | ∆ | 1422.5 (N) |
Table 2.
Navigation attitude in various cushion Froude numbers.
| λ (m) | Fn = 0.71 | Fn = 0.99 | ||||
|---|---|---|---|---|---|---|
| 2 | 7.4 | 2.78 | 0.71 | 15.4 | 2.56 | 0.51 |
| 4 | 5.2 | 3.04 | 0.72 | 12.2 | 3.64 | 0.53 |
| 6 | 6.5 | 4.03 | 0.76 | 10.8 | 3.94 | 0.52 |
| 7 | 6.4 | 3.74 | 0.76 | 12.6 | 3.26 | 0.53 |
| 8 | 5.2 | 3.39 | 0.74 | 11 | 3.52 | 0.5 |
| 9 | 7.9 | 3.15 | 0.77 | 13.3 | 3.37 | 0.52 |
| 10 | 7.3 | 3.37 | 0.75 | 11.6 | 3.59 | 0.52 |
| 12 | 8.4 | 3.35 | 0.79 | 11.9 | 3.13 | 0.5 |
| 14 | 11.2 | 3.32 | 0.8 | 11.9 | 3.28 | 0.49 |
| Avg. | 7.3 | 3.35 | 0.76 | 12.3 | 3.37 | 0.51 |
Table 3.
Calculated values of various amplitude responses.
| λ (m) | Fn = 0.71 | Fn = 0.99 | ||||
|---|---|---|---|---|---|---|
| 2 | 6.17 | 0.28 | 0.10 | 4.80 | 0.29 | 0.15 |
| 4 | 12.40 | 2.14 | 0.18 | 8.85 | 1.50 | 0.25 |
| 6 | 52.15 | 3.84 | 0.31 | 38.00 | 3.34 | 0.34 |
| 7 | 62.90 | 40 | 0.31 | 49.80 | 3.07 | 0.32 |
| 8 | 56.70 | 4.28 | 0.24 | 45.46 | 2.94 | 0.21 |
| 9 | 39.75 | 2.35 | 0.11 | 42.89 | 2.67 | 0.17 |
| 10 | 40.50 | 2.15 | 0.10 | 42.71 | 2.46 | 0.14 |
| 12 | 43.06 | 2.01 | 0.09 | 44.30 | 2.043 | 0.11 |
| 14 | 46.30 | 1.43 | 0.08 | 46.40 | 1.76 | 0.10 |
© 2019 by the authors. Licensee MDPI, Basel, Switzerland. This article is an open access article distributed under the terms and conditions of the Creative Commons Attribution (CC BY) license (http://creativecommons.org/licenses/by/4.0/).
Share and Cite
MDPI and ACS Style
Yang, J.; Lin, Z.; Gao, Z.; Li, P. A Study on the Motion of Partial Air Cushion Support Catamaran in Regular Head Waves. Water 2019, 11, 580. https://doi.org/10.3390/w11030580
AMA Style
Yang J, Lin Z, Gao Z, Li P. A Study on the Motion of Partial Air Cushion Support Catamaran in Regular Head Waves. Water. 2019; 11(3):580. https://doi.org/10.3390/w11030580
Chicago/Turabian StyleYang, Jinglei, Zhuang Lin, Zeyang Gao, and Ping Li. 2019. "A Study on the Motion of Partial Air Cushion Support Catamaran in Regular Head Waves" Water 11, no. 3: 580. https://doi.org/10.3390/w11030580
Note that from the first issue of 2016, this journal uses article numbers instead of page numbers. See further details here.