Article

Analysis of Intra and Interseasonal Rainfall Variability and Its Effects on Pearl Millet Yield in a Semiarid Agroclimate: Significance of Scattered Fields and Tied Ridges

by
Festo Richard Silungwe
1,2,*,
Frieder Graef
1,
Sonoko Dorothea Bellingrath-Kimura
1,2,
Siza Donald Tumbo
3,
Frederick Cassian Kahimba
3 and
Marcos Alberto Lana
1,4
1
Leibniz Center for Agricultural Landscape Research (ZALF), Eberswalder Straße, 84, 15374 Müncheberg, Germany
2
Humboldt Universität zu Berlin, Faculty of Life Sciences, Unter den Linden 6, 10099 Berlin, Germany
3
Department of Engineering Sciences and Technology, Sokoine University of Agriculture, P.O. Box 3003, CHUO KIKUU, Morogoro 3003, Tanzania
4
Crop. Production Ecology, Swedish University of Agricultural Sciences, Ulls väg 16, 75007 Uppsala, Sweden
*
Author to whom correspondence should be addressed.
Water 2019, 11(3), 578; https://doi.org/10.3390/w11030578
Submission received: 1 February 2019 / Revised: 12 March 2019 / Accepted: 17 March 2019 / Published: 20 March 2019
(This article belongs to the Special Issue Water Management for Sustainable Food Production)

Abstract

:
Establishing food security in sub-Saharan African countries requires a comprehensive and high resolution understanding of the driving factors of crop production. Poor soil and adverse climate conditions are among the major drivers of poor regional crop production. Drought and rainfall variability challenges are not fully being addressed by rainfed producers in semiarid areas. In this study, we analysed the spatiotemporal rainfall variability (STRV) and its effects on pearl millet yield using two seasons of data collected from 38 rain gauge stations scattered randomly in farm plots within a 1500 ha area of semiarid central Tanzania. The STRV effects on pearl millet yield under flat and tied ridge management were analysed. Our results show that seasonal rainfall can vary significantly for neighboring fields at distances of less than 200 m, which impacts yield. The STRV for daily rainfall was found to be more critical than for total seasonal rainfall amounts. Scattering fields can help farmers avoid total harvest loss by obtaining at least some yield from the areas that received adequate rain. The use of tied ridges is recommended to conserve soil moisture and improve yields more than flat cultivation in semiarid areas.

Graphical Abstract

1. Introduction

Spatiotemporal rainfall variability (STRV) and drought are among the primary challenges in rainfed agricultural communities [1,2]. STRV and drought both limit crop production and increase crop yield uncertainties among farmers. The situation is particularly severe in semiarid areas in sub-Saharan Africa (SSA) [3,4], exacerbating chronic food insecurity [5,6,7,8,9,10]. To address such challenges in these areas, the literature accentuates the importance of adopting more water-saving technologies through the efficient storage and use of water [11]. Several studies described STRV on different scales [12,13,14,15,16]; however, these studies rarely demonstrated the potential relationship between STRV and yield variability among farmer fields located within the same agricultural watershed. Rainfall studies in the forms of trend analyses and spatial variability over large areas are numerous, but these studies have limited connections to local agricultural challenges. These studies have rarely prioritized farmer risk management strategies, including crop upgrading strategies (UPS) [17], which are important for understanding the cycle of annual harvest losses, either partially or totally, for farmers in semiarid areas.
The population is increasing annually in the SSA region; therefore, the production of staple food crops has been emphasized to meet the increasing food demand. Pearl millet is an important crop in the region. With drought tolerance characteristics, pearl millet crops provide cultivation opportunities for farmers in drier areas. However, pearl millet production can significantly increase if the water needs of the crop are improved and vice versa. Historical data from the Food and Agriculture Organization Statistical Databases of the United Nations (FAOSTAT) indicate that the production of pearl millet in the SSA region has declined over the last two decades (FAOSTAT was visited on 10 December 2018), which can be directly attributed to poor soil and weather conditions, among other factors. The weather conditions are more severely challenging to most farmers, with spatiotemporal variation in rainfall frequently reported [18,19,20]. The current practices which are being used to address STRV are limited and the influence of STRV on crop yields at higher resolutions is poorly understood.
Since crop yield can vary even within a single farm due to different individual or combined factors, ranging from soil, weather, topography, and management [21,22], studies are required to provide a comprehensive understanding of the harvest losses at the village and farm levels for pearl millet crops, which would aid in providing practical recommendations to improve crop production. Yield losses in small plots accumulate when there are a considerable number of plots, thus reducing small area losses is advantageous for farmers in dry areas. Eventually, too many farmers with significant annual yield losses results in serious food shortages [23]. In the food shortage context, our research aim was to analyse high-resolution spatiotemporal data on daily rainfall, seasonal rainfall, and pearl millet yield to understand their variability and potential reasons for crop yield variability. Therefore, we specifically aimed to (1) analyze the spatiotemporal rainfall variabilities in neighboring fields, (2) evaluate the significance of rainfall variability on pearl millet yields among farmers, and (3) evaluate the effectiveness of tied ridges and scattering fields in reducing the risks of harvest loss.

2. Materials and Methods

2.1. Study Area

The study was conducted in the Dodoma Region of central Tanzania (Figure 1). The region lies between latitudes 4°7′′ and 7°21′′ S and between 36°43′′ and 35°5′′ E. The region has a population of 2.084 million people [24]. Most of the region is semiarid with low and erratic rainfall, which averages less than 600 mm per year. We selected the village of Idifu as our case study area, as more than 70% of the land is annually cultivated for pearl millet crops [23].

2.2. Spatiotemporal Rainfall Data Collection

Rainfall data were collected from November 2016 to May 2018, which included two growing seasons. Season one was from November 2016 to May 2017 (SES1) and season two was from November 2017 to May 2018 (SES2). We collected the data from 38 rain gauges randomly located in a rectangular section of Idifu (Figure 2). The rain gauge positions were defined using the K-means clustering algorithm method [25], then displayed in quantum geographic information system (QGIS) and modified onsite depending on the site conditions and features. Distances between rain gauges were limited to a minimum of 150 m between any pair of rain gauges and varied as shown in the rectangular area of 2.5 by 6 km (1500 ha) to cover a portion that contained many of the village farmers. We recorded the daily rainfall using manual rain gauges. Farmers living close to each location were identified, and at least one farmer was trained how to record the daily rainfall at 8:00 a.m. daily with the supervision of an agricultural field officer. The numbers of rainy days (events) were counted as any nonzero readings from an accumulated rainfall measurement recorded each day throughout the season.

2.3. Pearl Millet Yield Data

To evaluate the variability in pearl millet yield among farmers, we collected yield data from 38 locations representative of the rain gauges shown in Section 2.2. Pearl millet (Okoa variety) was planted in all locations by all farmers under flat cultivation (a common practice by most farmers in the village) and under tied ridges. The tied ridges (in situ) rainwater harvesting practice is among the four soil management strategies recommended as most suitable in semiarid areas [17]. Tied ridges are long, narrow, and elevated strips of land (a ridge) crossed by earthbands within the furrow called ties (Figure 3). The practice is well described in literature [17]. Over 80 farmers across the study area had adopted tied ridge practices at more than 20 spatial rain gauge positions. For each location, we collected yield data from farmers for 2–4 plots with areas of 100 m2 over two seasons from both flat and tied ridges practices.

2.4. Soil Physical and Chemical Properties

Since yield variability is highly influenced by the soil properties, we used a local soil map and underlying data from the physical and chemical properties of the soil [26]. In general, the farmers’ soils matched with respect to classification and fertility but were noticeably different in terms of texture with predominantly higher sand content [26]. As shown in the soil map (Figure 2), these soils were chromic lixisol loamic (CLL), chromic lixisol hypereutric (CLH), chromic lixisol (CL), haplic acrisol loamic (HA), and sodic vertisol hypereutric (SVH). The majority of the plots were on HA (71%), followed by CLL (14%), CL (8%), SVH (6%), and CLH (1%) soils.

2.5. Data Analysis

We calculated the rainfall variability in terms of (1) the daily and seasonal amounts, (2) number of rainy days, and (3) total seasonal amounts. We recorded the start and end dates of the rainy season (onset and cessation dates). We used natural neighbor kriging interpolation in QGIS to describe the seasonal rainfall patterns and analyse the spatial rainfall variability. We calculated the variation coefficient of daily and seasonal rainfall amounts and for the number of events.
We determined the probability of an event covering the entire study site (P100) and the probability of covering at least half of the study site (P50) using daily rainfall events for both seasons:
P 100 = Number   of   rainfall   events   recorded   by   all   38   rain   gauge   stations Total   number   of   rainfall   events   per   season
P 50 = Number   of   rainfall   events   recorded   by   at   least   half   of   the   38   rain   gauge   stations Total   number   of   rainfall   events   per   season
Using Statgraphics Centurion XVII software (Statgraphics Technologies, Inc., The Plains, VA, USA), we also performed an analysis of variance (ANOVA) of daily rainfall for both seasons. We used the Kruskal–Wallis test to compare the medians when there were some significant non-normalities in the daily rainfall data [27].
We performed a kriging analysis for each daily rainfall event for both seasons using QGIS. From kriging maps, we performed a variogram cloud analysis using the variogram cloud tool in QGIS for every daily rainfall event to determine their variance related to distances between rain gauges (Appendix A). We modified the approach from [12], who used a defined set of transects from a kriging map of daily rainfall and assigned the mean differences of rainfall along transects to the distances between gauges. The variogram cloud analysis was used to determine the variance, semivariance, and covariance of the rainfall in all directions (360 degrees) by applying the moment of inertia to the data. We performed a regression analysis for the rainfall differences and their distances (Appendix B). Then, we calculated the correlation coefficients for maximum rainfall differences and their associated distances.
We used the Statgraphics Centurion XVII software to map the seasonal yield of pearl millet. Then, we determined the relationships between rainfall variability and pearl millet yield variability among farmers using a simple linear regression model.
We individually tested how both variables (rainfall (mm) and number of events) influence the yield for both seasons. We used the R-squared statistic to indicate how the fitted linear model explains the influence of rainfall and events on pearl millet yield.
We determined the effect of soil type at the study sites on yield variability by performing an ANOVA, comparing the average yields in different soils. We analyzed the effects of tied ridges compared to flat cultivation. We checked the within variation by computing the coefficients of variation (CVs).

3. Results

3.1. Spatiotemporal Rainfall Variability

3.1.1. Average Daily Rainfall and Variability

There were 15 rainfall events in SES1 and 31 events in SES2; the difference in events was significant between the two seasons. This situation involves considerable risks associated with rainfed agriculture for this semiarid area, showing that strategies are required that can absorb these wide variations that occur within a 1500 ha field. The daily intraseasonal average spatial rainfall per event variability (ASREV) was significantly different in both seasons, similar to the interseasonal average spatial distribution of rainfall per rain gauge (Table 1). Generally, for most rain gauge stations, higher ASREVs were recorded during SES2 than SES1 (Figure 4).
In SES1, the probability that the rainfall covered the entire village (P100) was zero, whereas the probability of at least half the village (P50) being covered by rainfall was 42% (Table 2). No rainy days were observed for the entire village in SES1. In SES2, the probability of rain for the entire village was more than 40%, whereas the chance for at least half the village (P50) being rained on during one event was 87% (Table 2). These results show that for every 10 rainfall events, at least four events would cover the entire village and approximately nine events would cover at least half the village.
From the daily rainfall amounts in SES1, the calculated CV was higher (39.6–435.38%) than the seasonal rainfall (14.5%). For SES2, the daily rainfall CVs were between 12.62 and 329.67%, while the seasonal total rainfall was 10.18%, which indicates the significant daily rainfall variability compared to seasonal variability. Figure 5 shows that the daily rainfall in SES1 and SES2 was not normally distributed during many events.
We observed points far outside of the boxes (Figure 5), indicating unusually lower or high rainfall values within the same events, again indicating high spatial variability. However, SES1 shows higher unusual variability than SES2.
Both scenarios, SES1 and SES2, explain the risk of averaging the spatial rainfall per event for fields. We observed significant variations in the gauge station rainfall recorded for all events, and these variations accumulated over the entire season. Consequently, some locations had accumulated deficits resulting in severe shortages in the rainfall amount required to support crop growth, and hence, posing a high risk to crop production. In this study, we found that the accumulated seasonal rainfall amounts recorded over the entire field were significantly different among rain gauges (Table 1). The SES1 rainfall onset varied significantly over five different dates: 14 December 2016; 2 January 2017; 8 January 2017; 15 January 2017; and 30 January 2017. The cessation dates did not vary much as most of the plots (87%) received the least rainfall simultaneously. In contrast, in SES2, we observed that all rain gauges in the field recorded the same rainfall onset and cessation dates, although the rainfall amounts on particular dates varied significantly among gauges (p < 0.05).

3.1.2. Seasonal Rainfall Variability

For both seasons, the total seasonal rainfall varied significantly among rain gauges and between seasons within the study site (Figure 6). In SES1 (Figure 6a), the number of total events per rain gauge ranged between 6 and 12, with the total amount of rainfall ranging between 120.1 and 226.6 mm. The average seasonal spatial distribution of rainfall per rain gauge for SES1 was 161.9 mm. For SES2 (Figure 6b), the number of rainy days per rain gauge ranged between 23 and 29, with rainfall ranging between 382 and 576.2 mm. The average seasonal spatial distribution of rainfall per rain gauge was 437.6 mm. The total seasonal rainfall for both seasons, as expected, was highly correlated (r = 0.97) with the events (Figure 7). The intraseasonal correlations were far lower than both seasons combined.

3.1.3. Rainfall Variability with Distance between Pairs of Gauges

To understand the relationship between different farmer fields across the study site, we calculated random distances for rain gauge pairs and rainfall variability using a variogram cloud analysis in QGIS. In Appendix A, we present different distances and rainfall variances for pairs of rain gauges randomly picked in different directions (angles). The greatest variance under closely spaced rain gauges occurred at the shortest distance of 164.4 m during SES2. The maximum variance between rain gauges in the area was 27,192.0 mm2 during SES1. This difference shows that it is possible for a high rainfall season to have a significant variation between a closely (164.4 m) spaced pair of rain gauges. However, higher variation occurred during SES1 with low rainfall (27,192.0 mm2). In general, the average variance was higher in SES1 (3110.4 mm2) than in SES2 (901.8 mm2), which implies that, even for total seasonal rainfall, the variation was high under low rainfall in SES1 and low under comparatively high rainfall in SES2.

3.2. Effects of Spatiotemporal Rainfall Variability on Pearl Millet Grain Yield

The average yields of pearl millet were 360.53 and 637.66 kgDWha−1 for SES1 and SES2, respectively (Table 3). In both seasons, the spatial intraseasonal yields were significantly different among farmers. Higher variability was observed in SES2 than SES1 (Figure 8), with higher yields also recorded in SES2 than in SES1. The maximum grain yields for individual locations were 912 kgDWha−1 and 1633 kgDWha−1 for SES1 and SES2, respectively (Table 4). The rainfall pattern observed in Figure 6 is correlated with the yield pattern in Figure 8, indicating that, for the two seasons, the pearl millet yield was correlated with the recorded amount of seasonal rainfall.
From the correlation analysis, we found that rainfall was moderately weakly but positively correlated with yield in terms of both rainfall amount and rainfall events (Figure 9). However, the rainfall events were more correlated with yield than the total seasonal rainfall amounts in both seasons. In low rainfall SES1, the yield was found to have a small but positive correlation with the rainfall events (r = 0.37). A moderately low but positively correlated coefficient (r = 0.34) was found between the yield and rainfall amount in SES1. In the wetter SES2, the yield was found to have a low but positive correlation to both events (r = 0.03) and seasonal rainfall amount (r = 0.02), which means that if the rainfall (during crop growth) is well-distributed, a considerable amount of rainfall can be used by the crops to enhance the yields. We observed a yield increase with better rainfall distribution in SES1; however, the trend appeared negligible or nonsignificant in SES2, which is attributed to a more uniform spatiotemporal seasonal rainfall and event distribution than SES1. Although the variability in seasonal rainfall during SES2 was significant, the rainfall amount was enough to meet most of the pearl millet crop water requirement. The crop water requirement was estimated to be approximately 366.2 mm in Dodoma, which is less than most of the recorded seasonal rainfall amounts. The seasonal rainfall amounts and events were moderately weakly but positively correlated with the pearl millet yield (r = 0.43 and 0.44, respectively) (Figure 9). The regression lines for combined seasons showed much stronger correlations than individual seasonal correlations. Thus, apart from variability in rainfall amount and timing, factors other than rainfall may contribute to yield variability.

3.3. Yield Variability by Soil and the Influence of the Tied Ridge Management Strategy

3.3.1. Yield Variations among Soil Types

The yield data were collected from plots with either flat or tied ridge management strategies spatially scattered over different soil types in the village. There were differences among the average yields for different soils. The average yield from plots with CLL soils was slightly higher (573.1 kgDWha−1), followed by CL (497.9 kgDWha−1), HA loamic (477.9 kgDWha−1), and SVH (415.6 kgDWha−1). However, from a single-factor ANOVA comparison, we found that the yields among the soils were not significantly different (Table 4). In contrast, the pearl millet yield variability within individual soils varied with CV between 60.3 and 72.5%, and these differences were statistically significant (Table 4). In this context, the pearl millet yield at the study site was not influenced by the soil type.

3.3.2. Yield Variations between Flat and Tied Ridge Cultivations

Tied ridges increased the yields more than flat cultivation and nearly doubled the yields in both seasons (Table 5). The reason for this difference could be due to the tied ridge’s ability to prolong soil moisture during the crop growth period, improving the efficiency of rain water usage. However, tied ridge cultivation also increased the yield variations among farmers. We found high yield spatial variability for both SES1 (CV = 40.2%) and SES2 (CV = 44.7%) for tied ridges, which differed from SES1 (CV = 30.59%) and SES2 (CV = 18.7%) under flat cultivation (Table 5). The variations in both seasons were significantly different under tied ridges, but the variations did not differ under flat cultivation (Table 5). This difference may imply that for different soils, tied ridges have a variable advantage in terms of improving pearl millet yield. This difference may also indicate that the ability of the tied ridges to prolong soil moisture affected other factors, such as soil fertility level variations, field slopes, previous crops, and organic matter in the scattered plots, all of which support crop growth differently.

4. Discussion

Poor and erratic rainfall is challenging rainfed agricultural production in semiarid areas, such that farmers may experience total harvest loss [
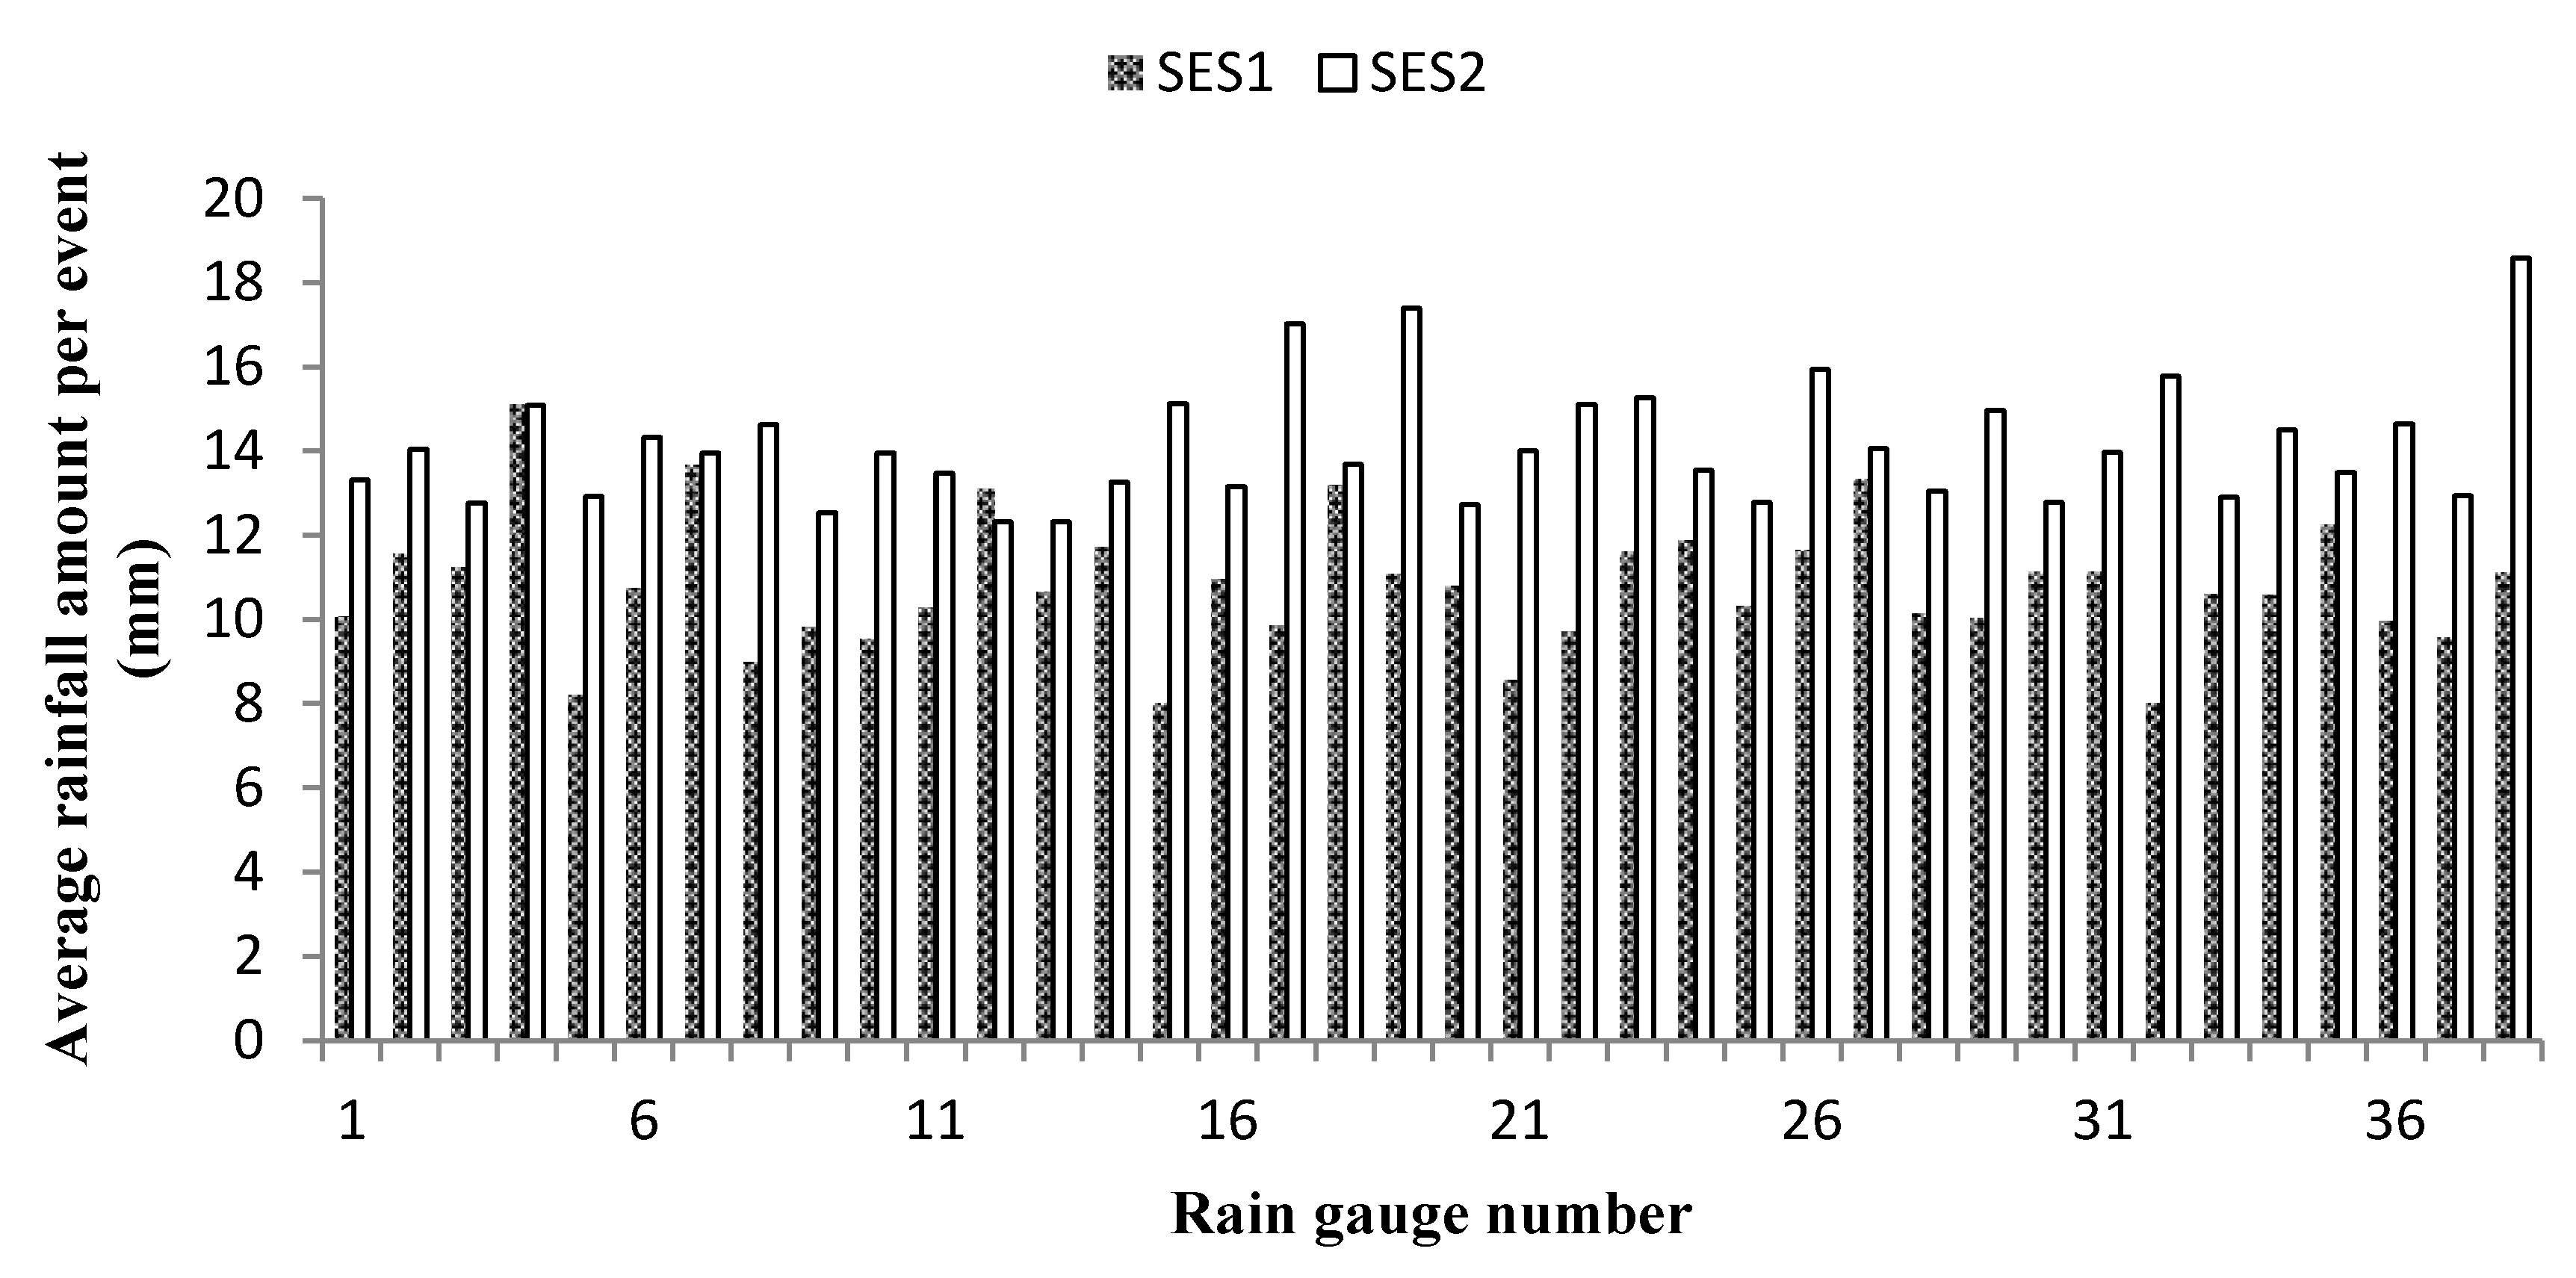
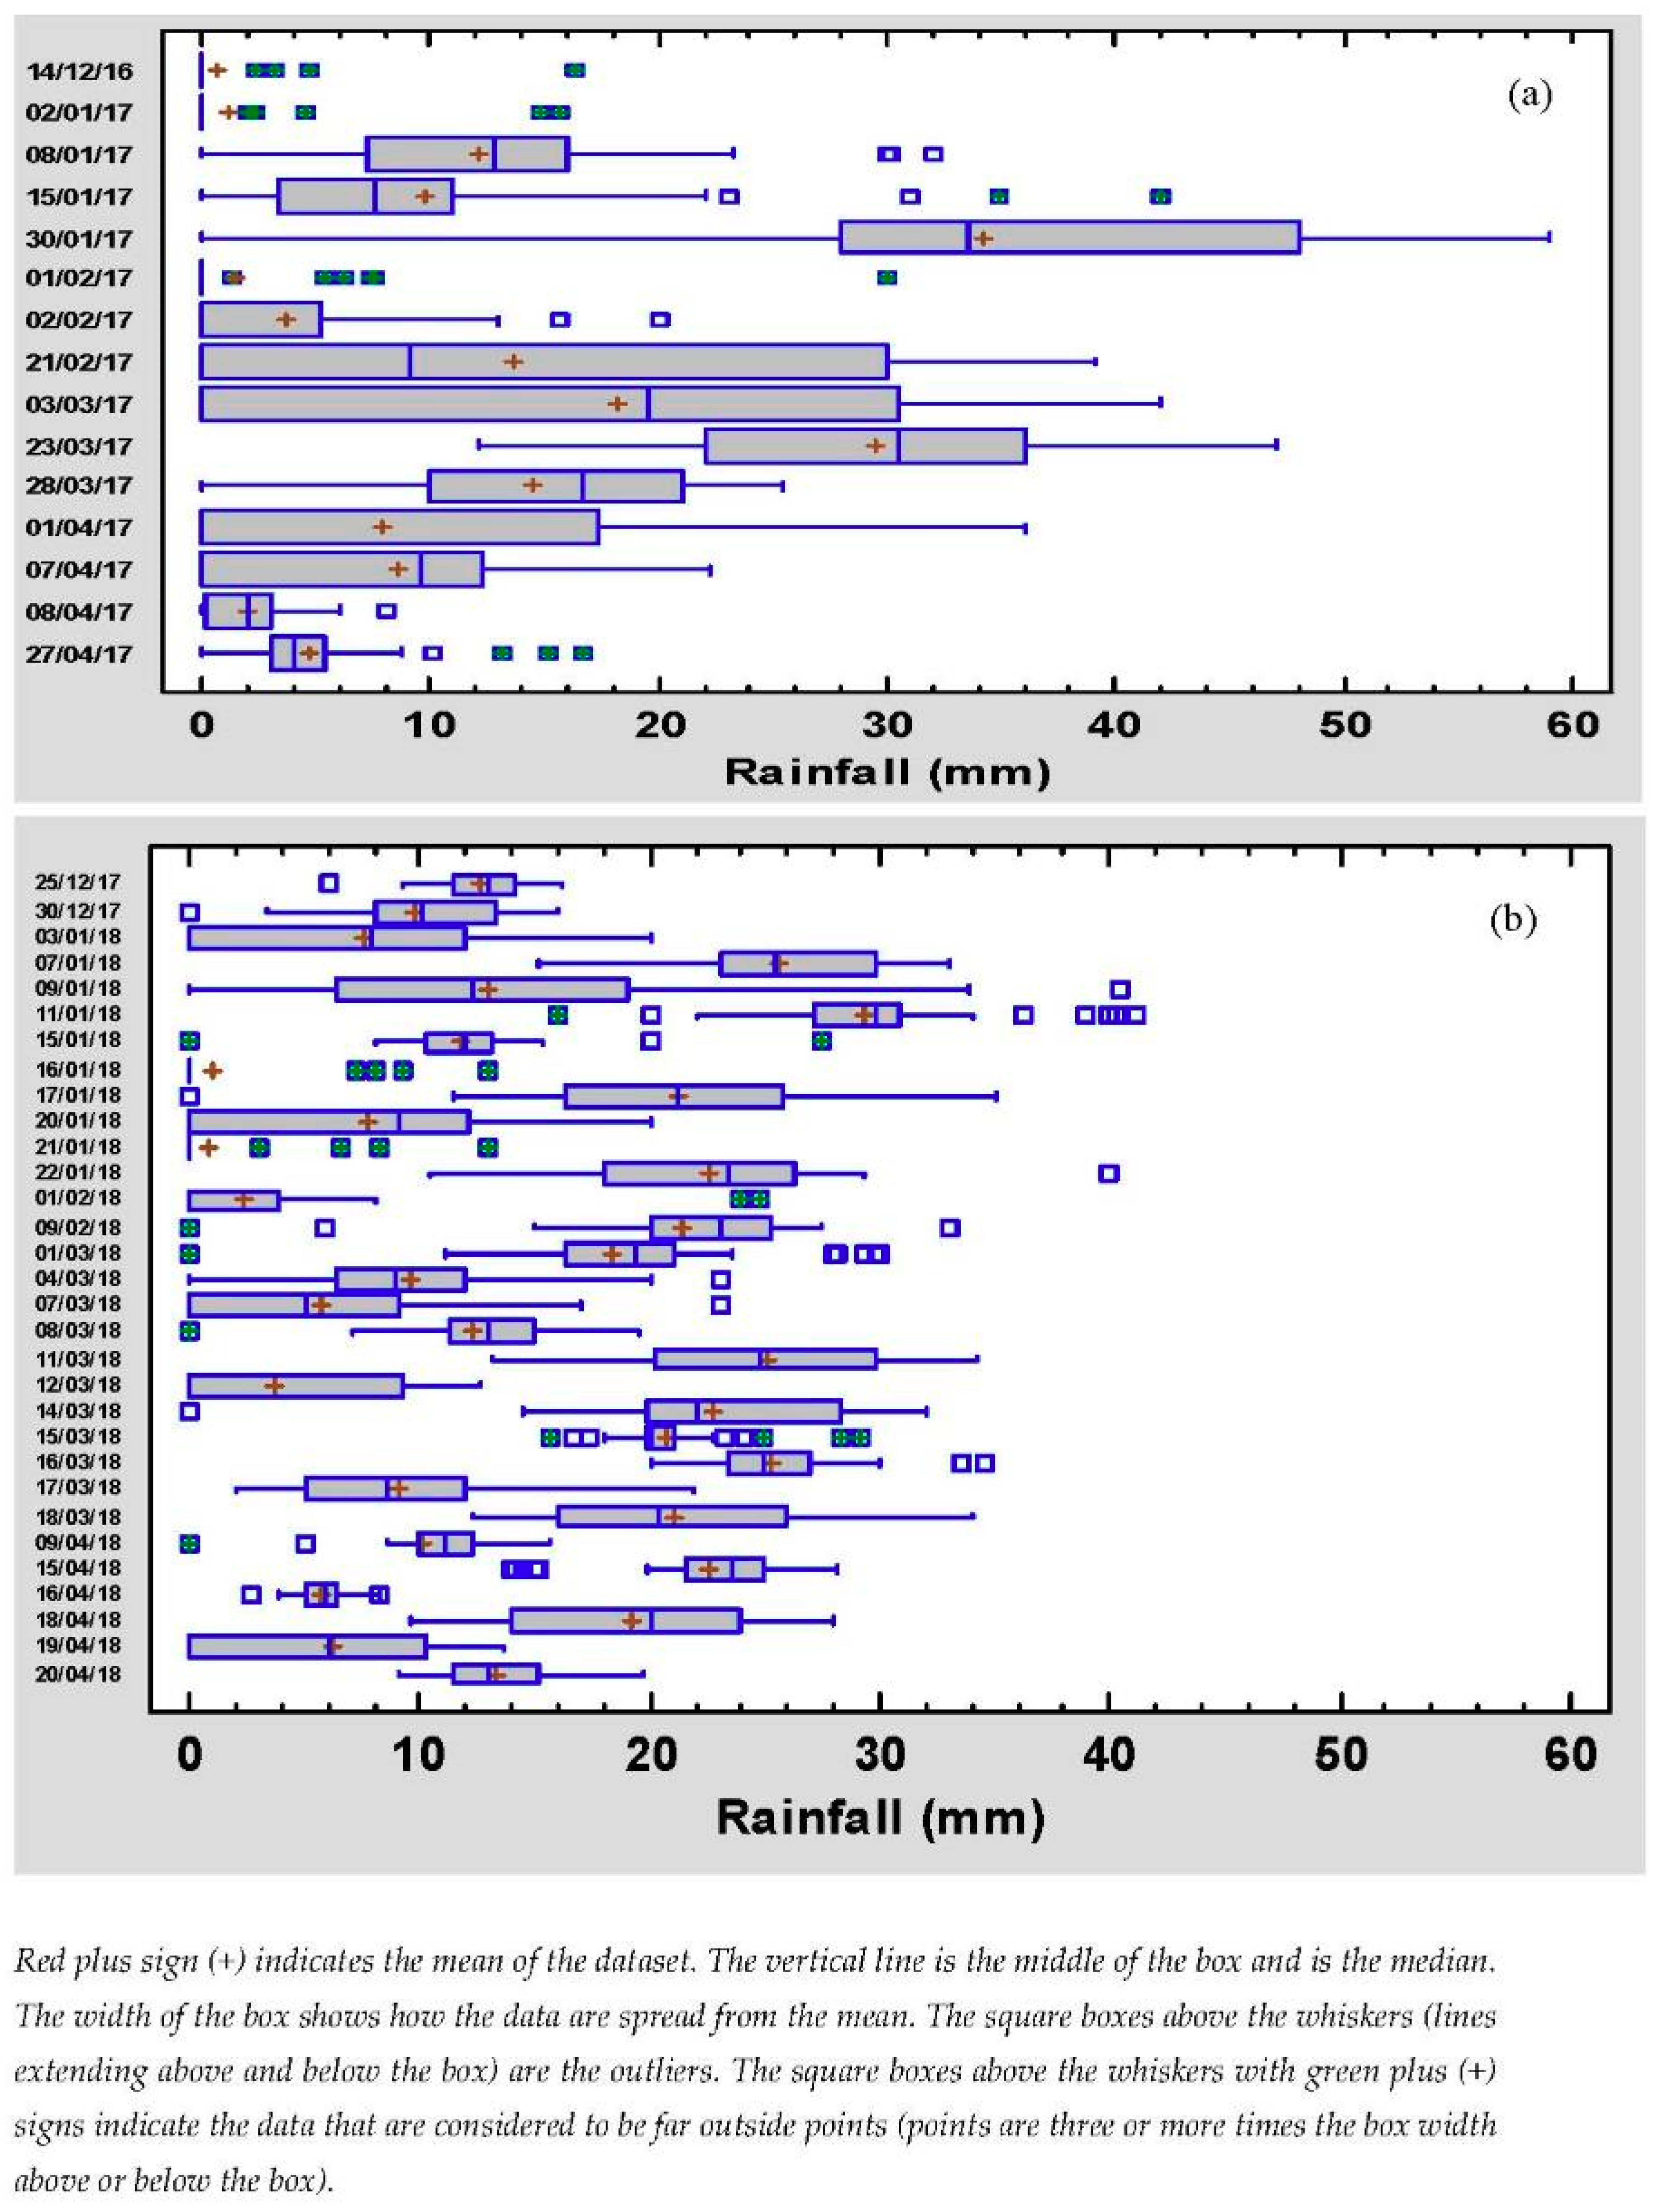
12]. From our analysis, we found that rainfall can vary significantly in both space and time within a small area between neighboring fields, which agrees with the results reported by other studies [12,28,
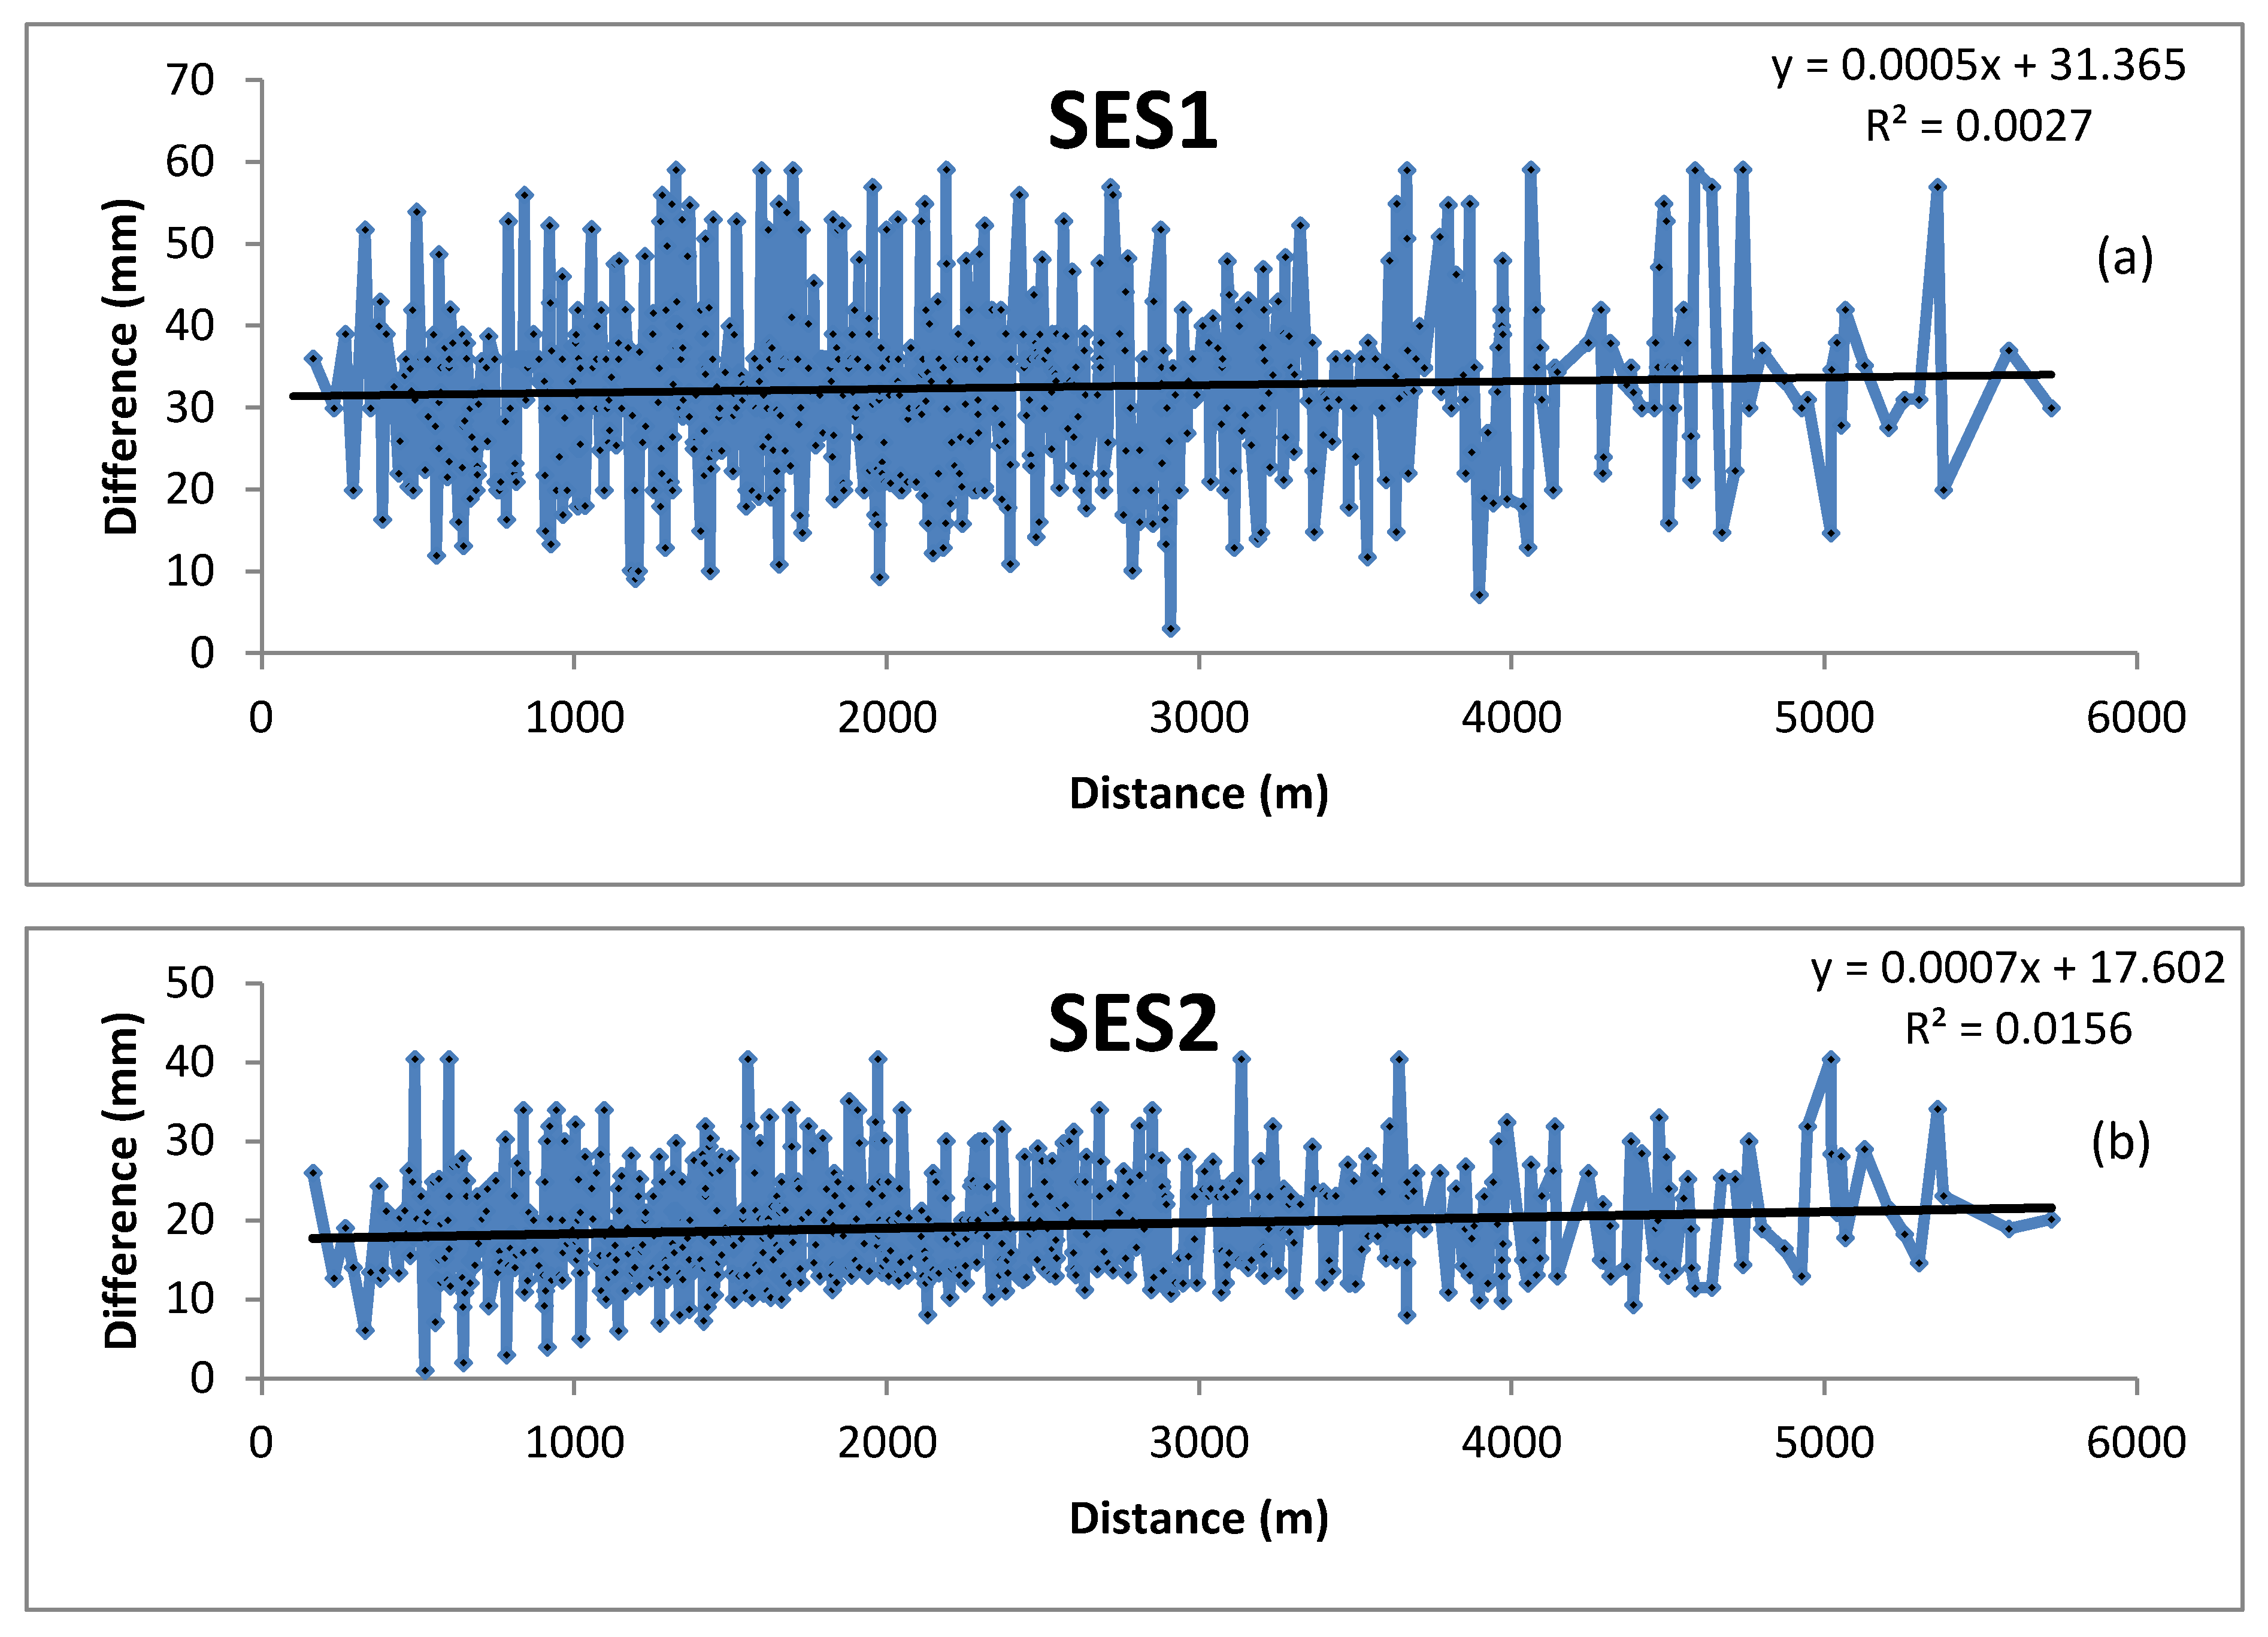
29]. The variations can be significantly different within a small area (1500 ha study area) in terms of events, rainfall amount per event, total seasonal rainfall amount, and onset and cessation dates. When the total number of seasonal rainfall events is low, the chance of having a lower seasonal rainfall amount and poor distribution is high and vice versa, as we observed during both seasons. Other studies indicated the potential effects of extreme floods and drought events [
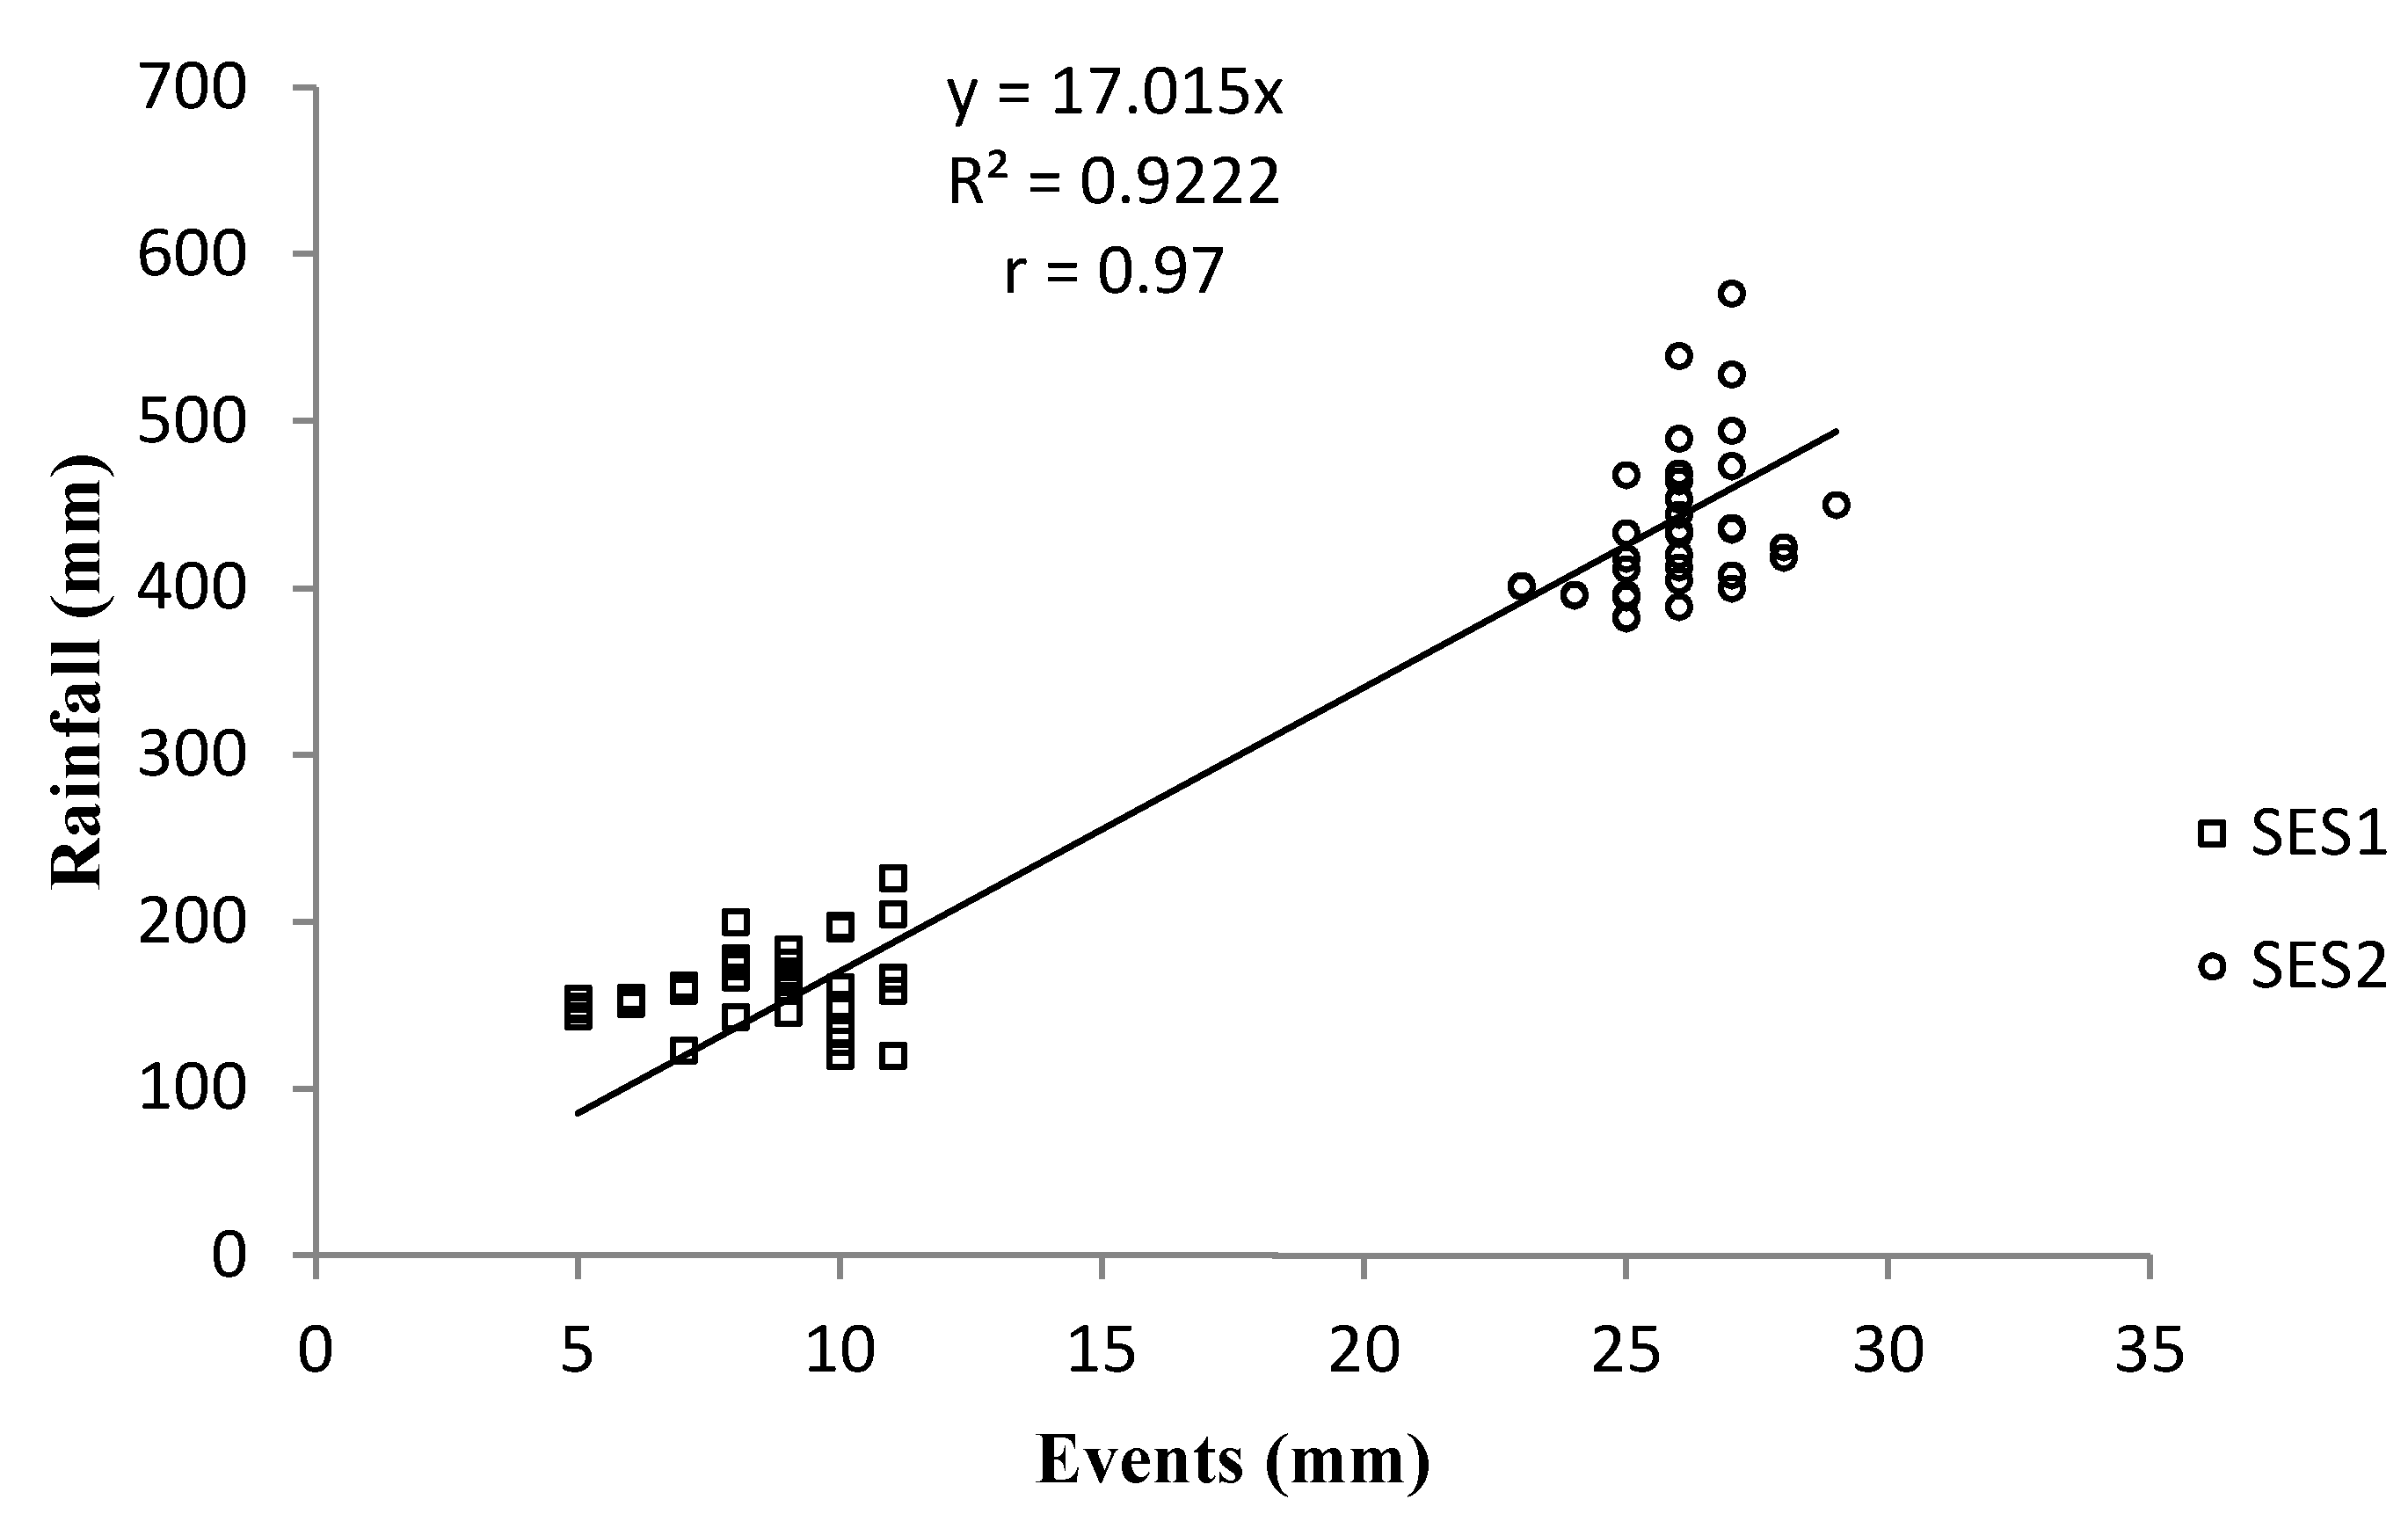
18]. For instance, few high rainfall events may result in high total seasonal rainfall amounts with poor distribution (during the seasonal crop growth period). In this study, the numbers of events were highly correlated with the seasonal rainfall amount, and the two seasons of data showed significant temporal variability. This situation is common in semiarid areas [18,
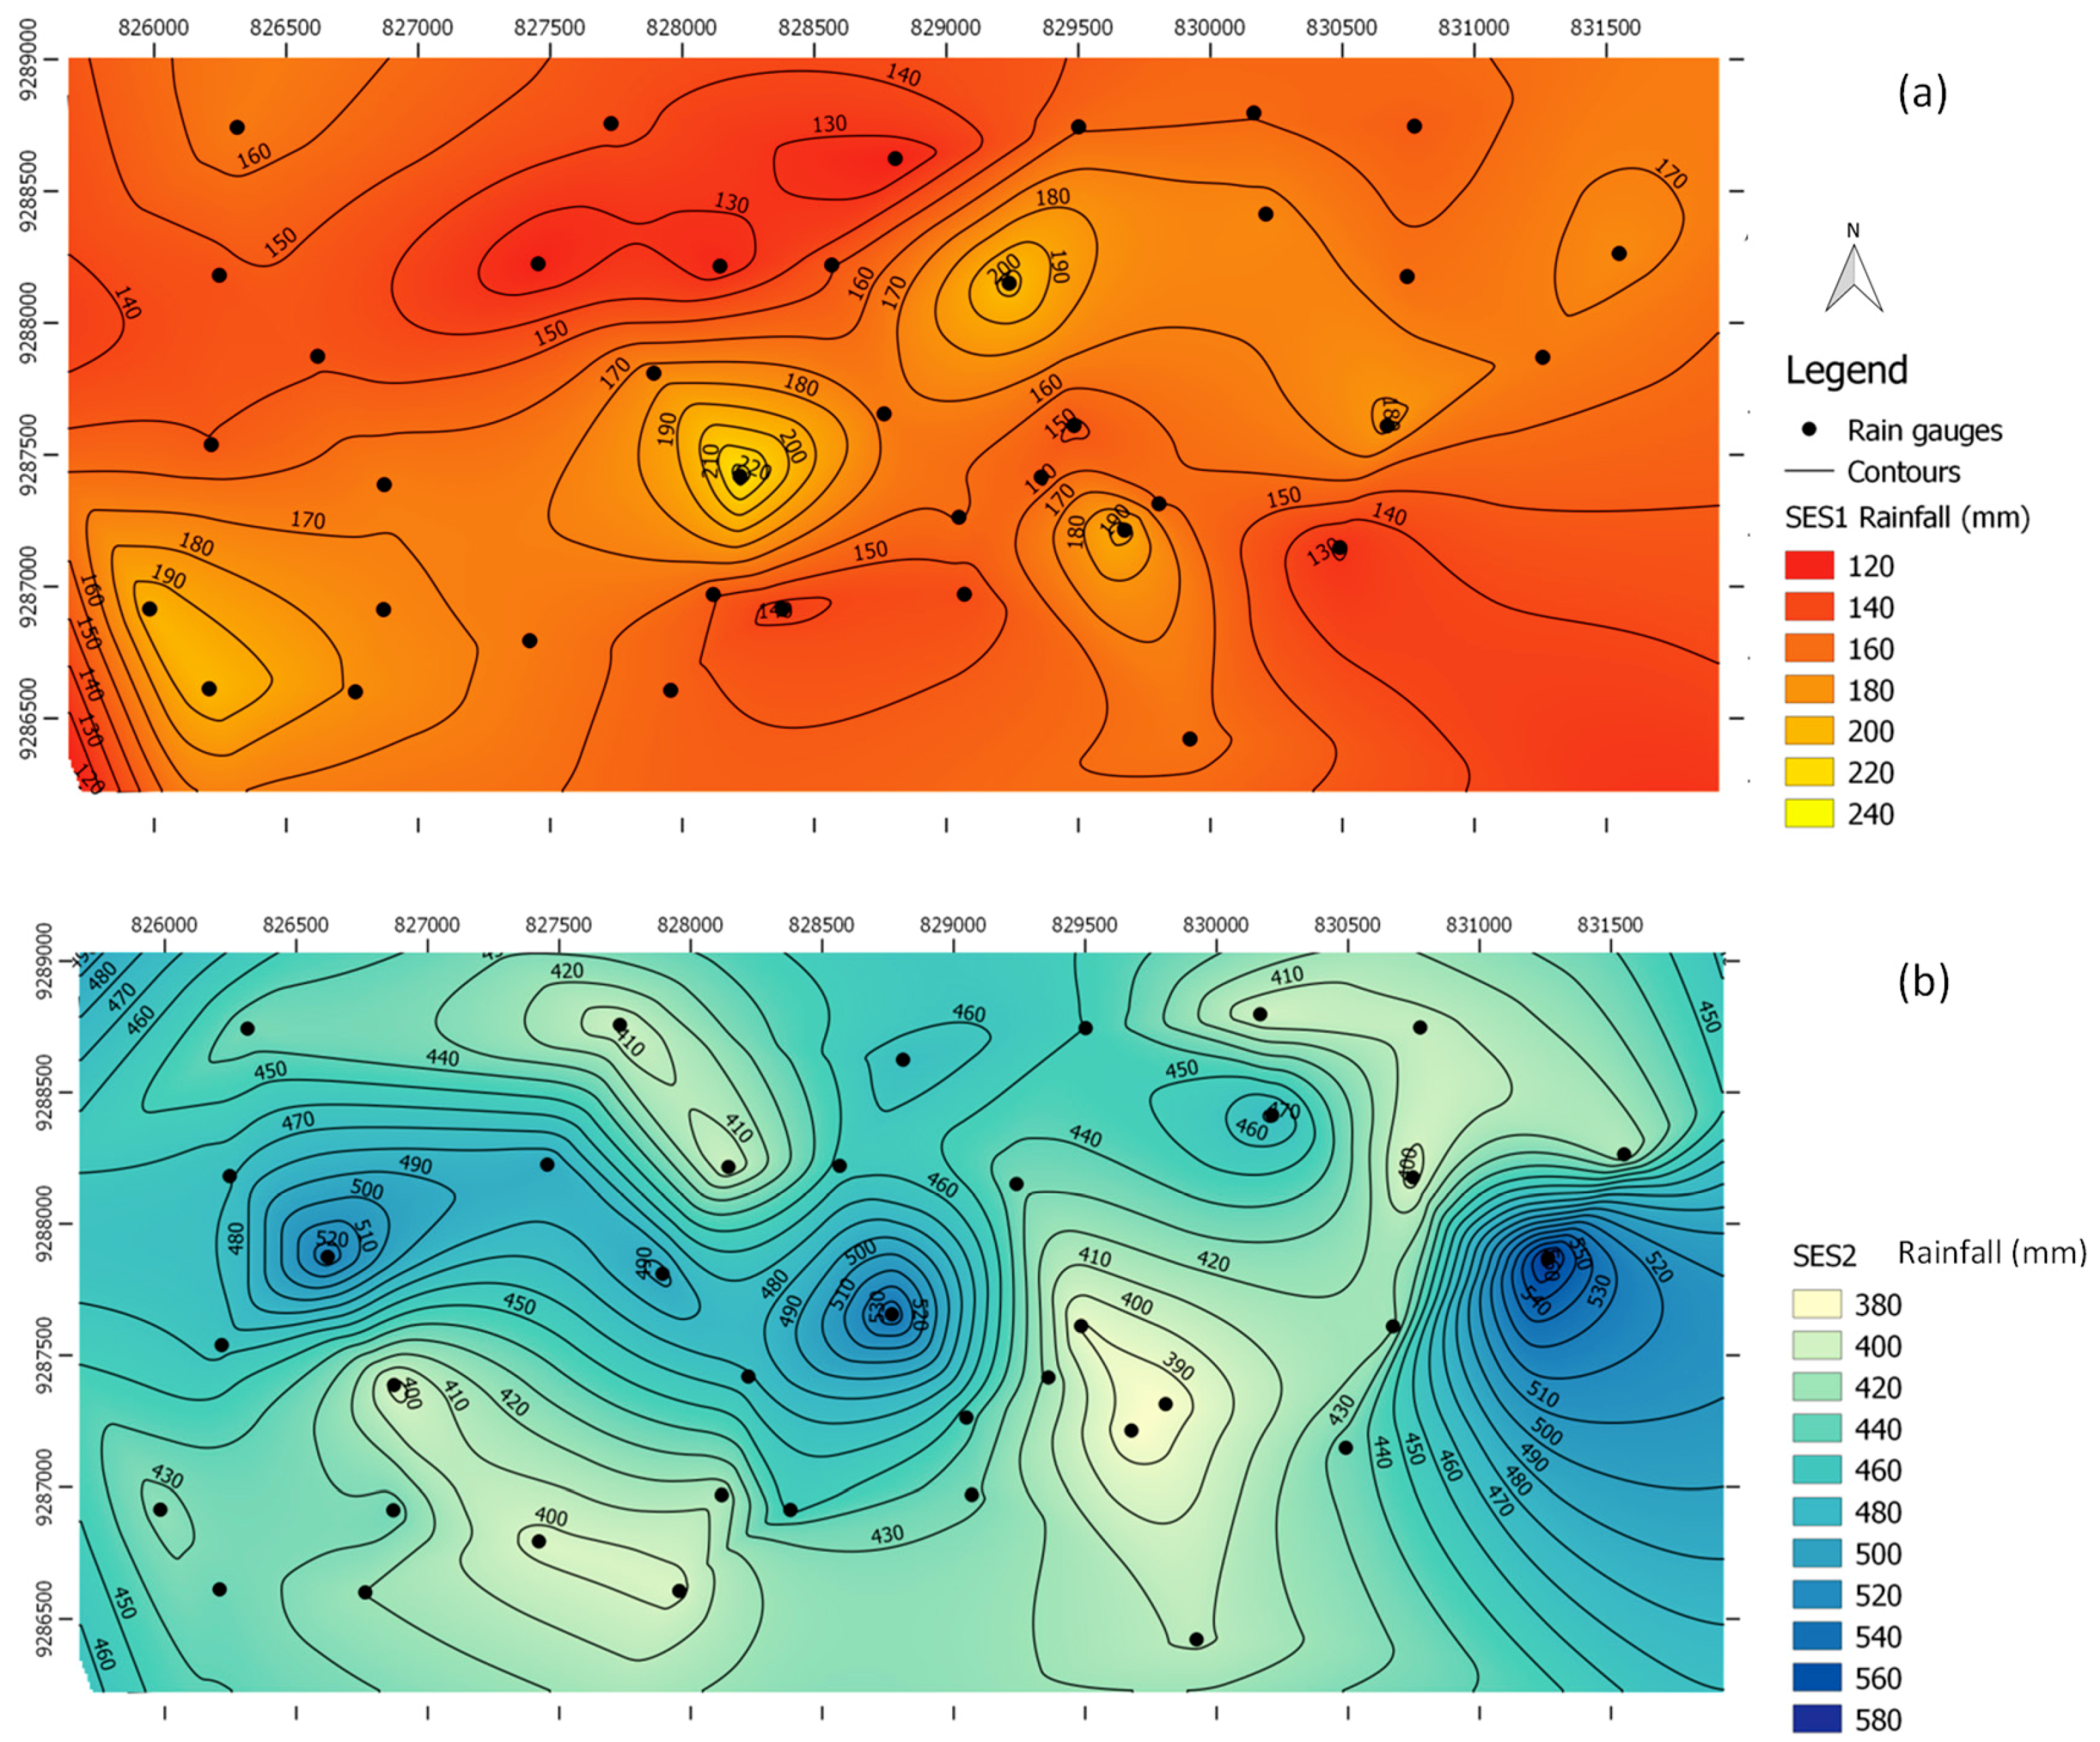
20]. For both seasons, the spatial distribution of rainfall per event varied significantly within the area. The variation increased with poor total seasonal rainfall, and increased with a nonsignificant linear trend with a distance among rain gauges in the area. Other studies, such as Gao et al. [30], found that the rainfall spatial variation was obvious during the winter dry season. Graef and Haigis [12] reported that the variations along two different transects in Sahel were nearly equal, and the mean differences in the variations increased with the distance between gauges (from ±1.8 mm at 1 km, ±3.5 mm at 2 km, to ±5.7 mm at 3.2 km). The variability increase with distance may be inconsistent when larger areas are considered due to the inherently high local spatial variability behavior of rainfall [30]. In our findings, the correlation coefficient between spatial rainfall differences was found to be weak, which justifies the tendency for examination on larger scales. Buytaert et al. also found that rain gauges separated at a distance of less than 4 km were highly correlated despite having high spatial variability in average rainfall [29].
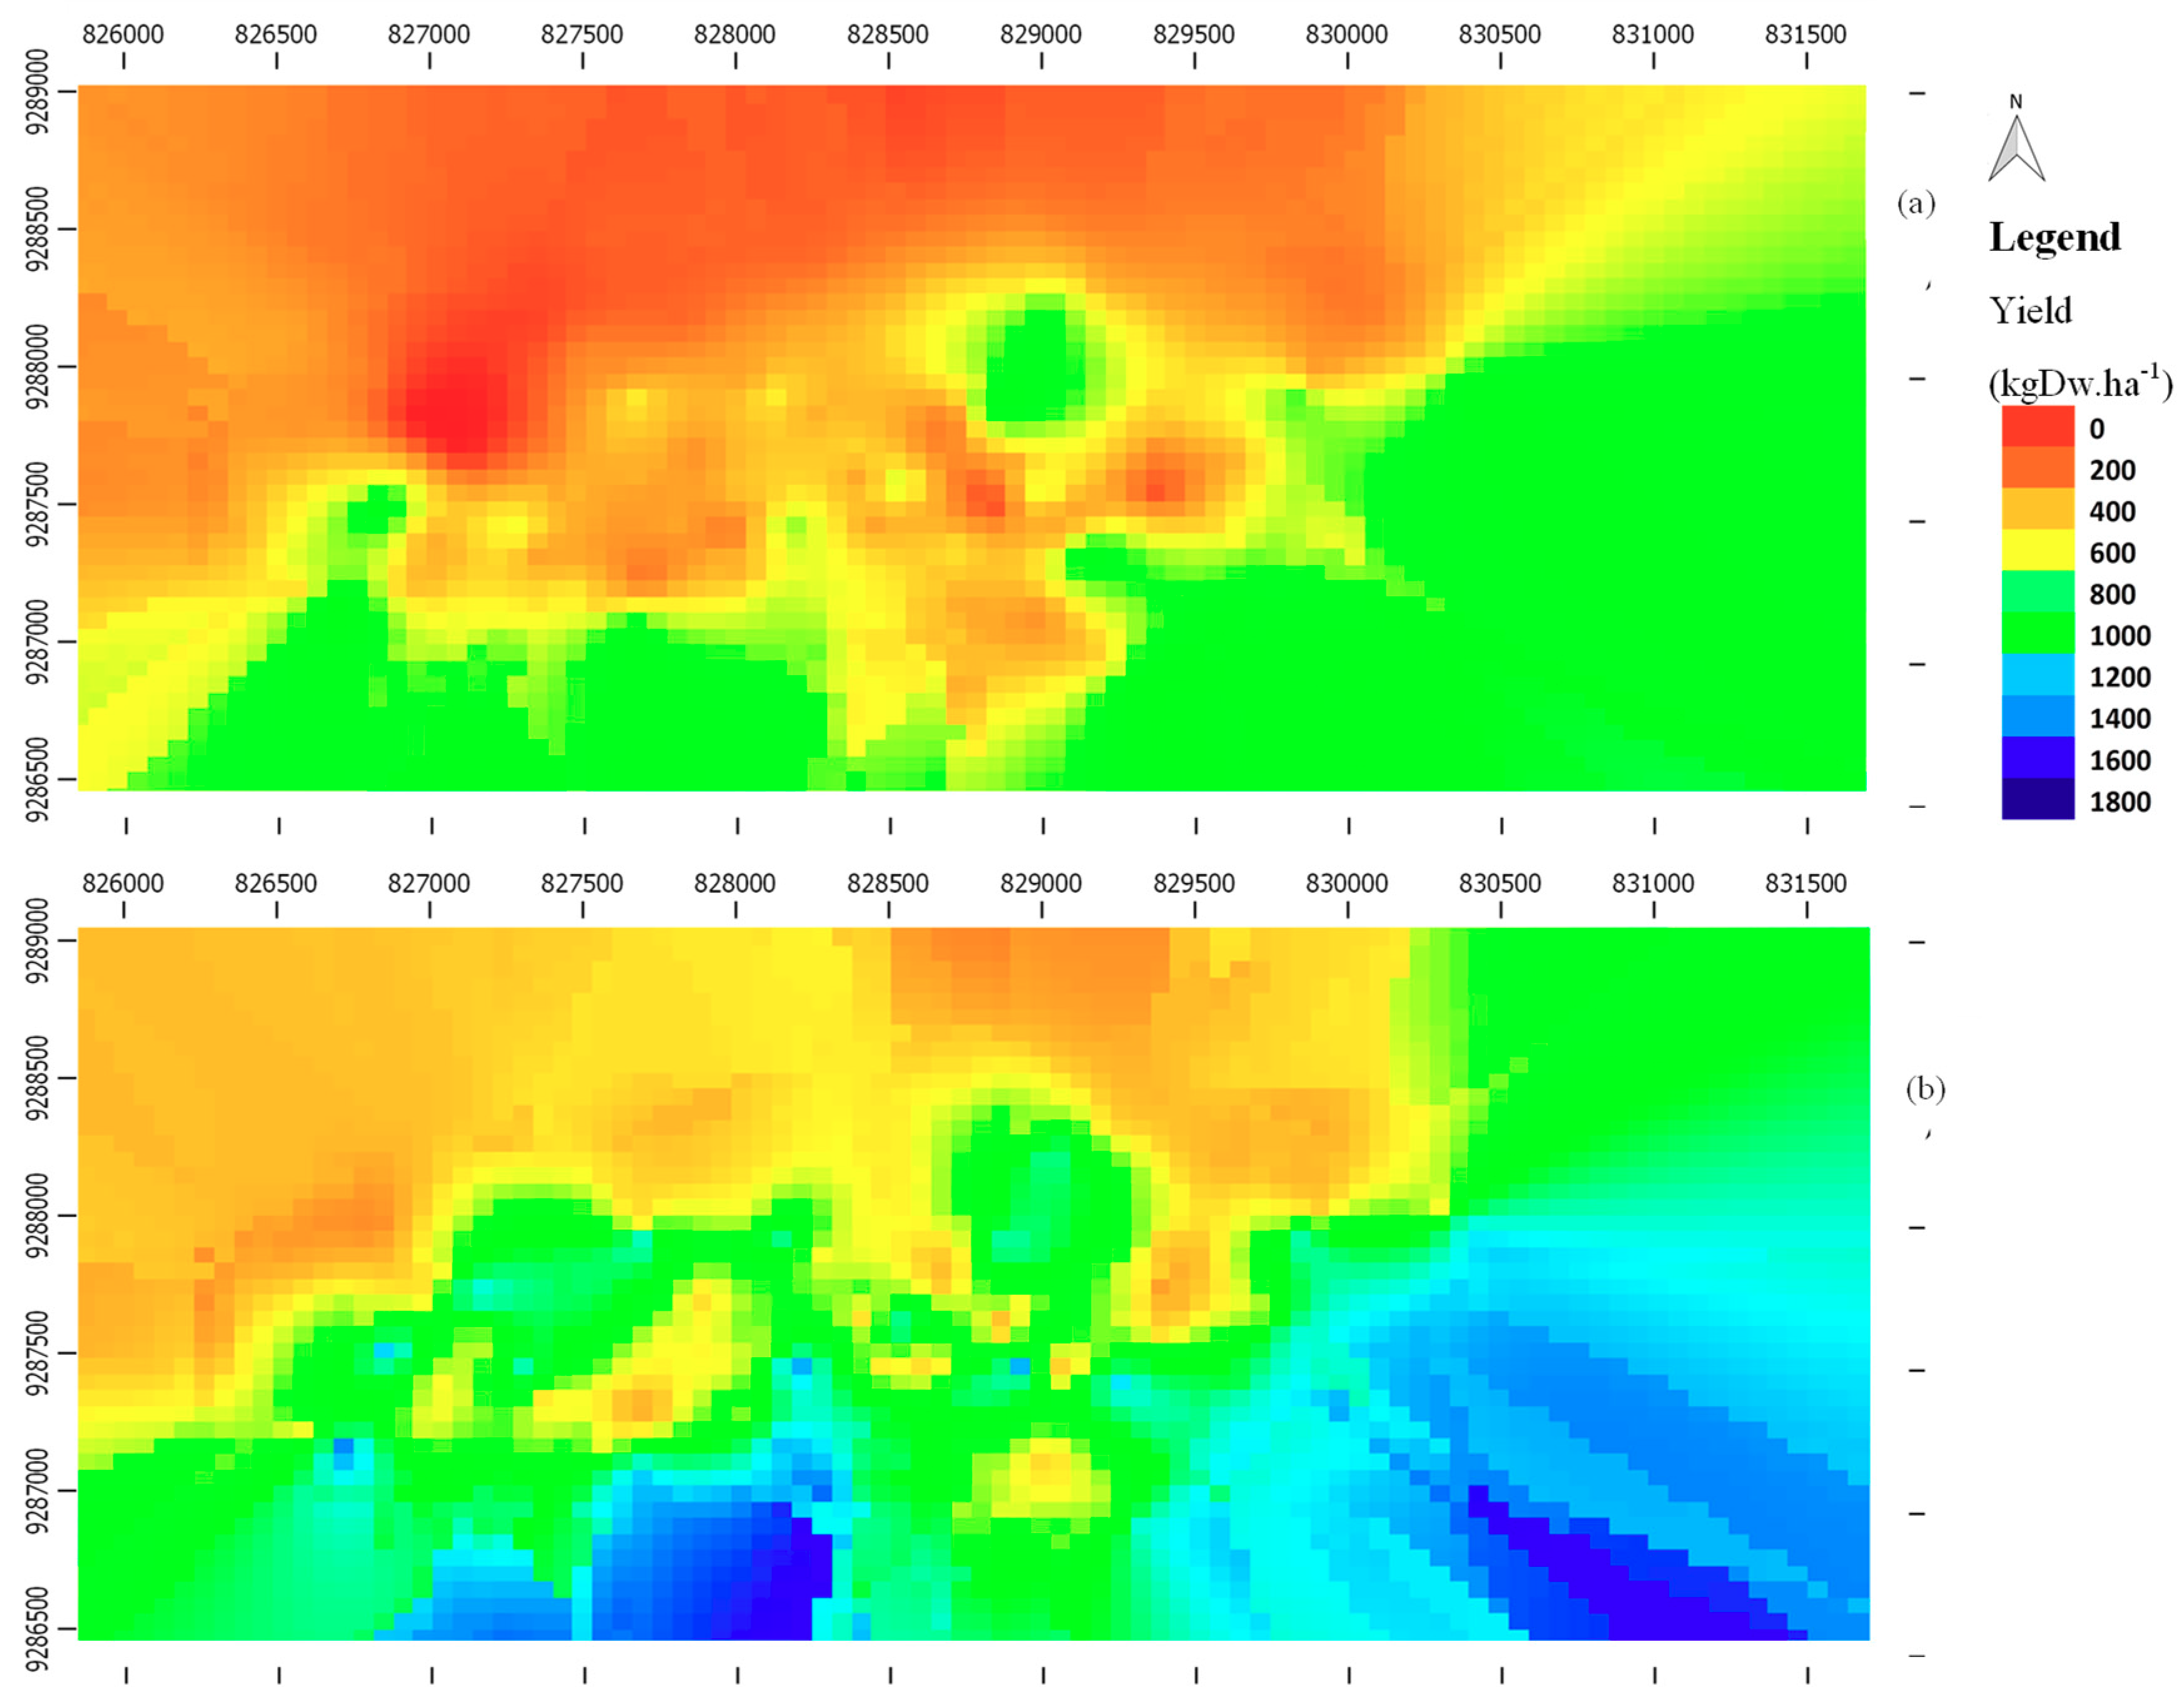
The rainfall variability directly impacted the farmer’s seasonal pearl millet yield. The collected yield discrepancies from different spatial plots within the study area indicate that field scattering is an effective strategy for reducing the probability of total seasonal harvest loss. Previous case studies from the Sahel region show that scattered fields reduce the yield disparity while enhancing the stability of pearl millet yield between households [12,
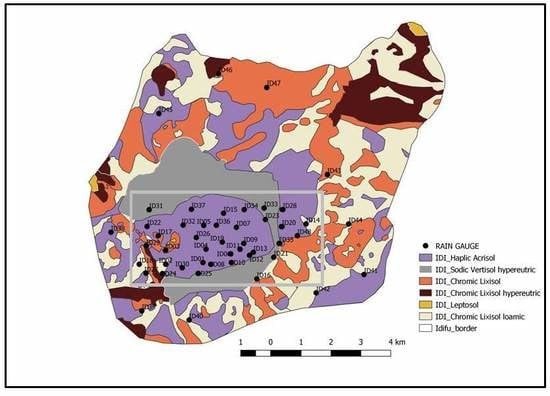
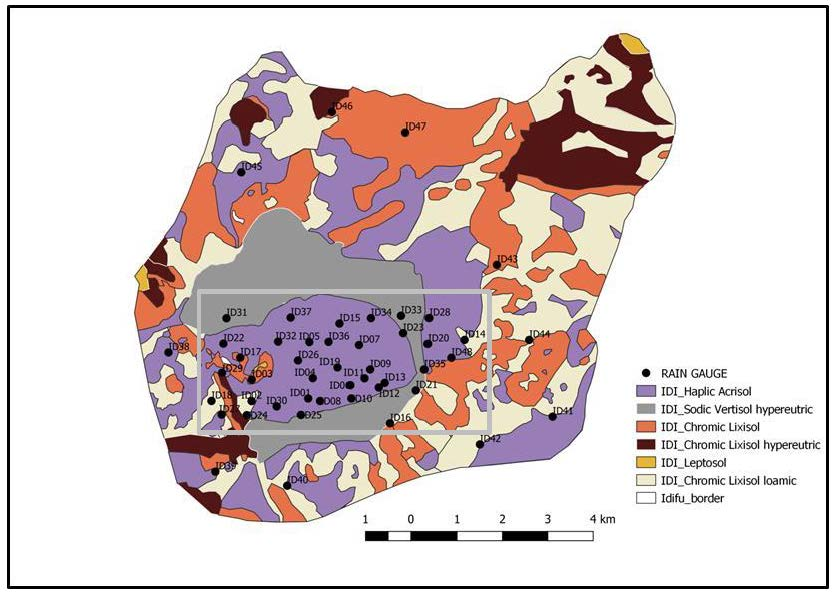
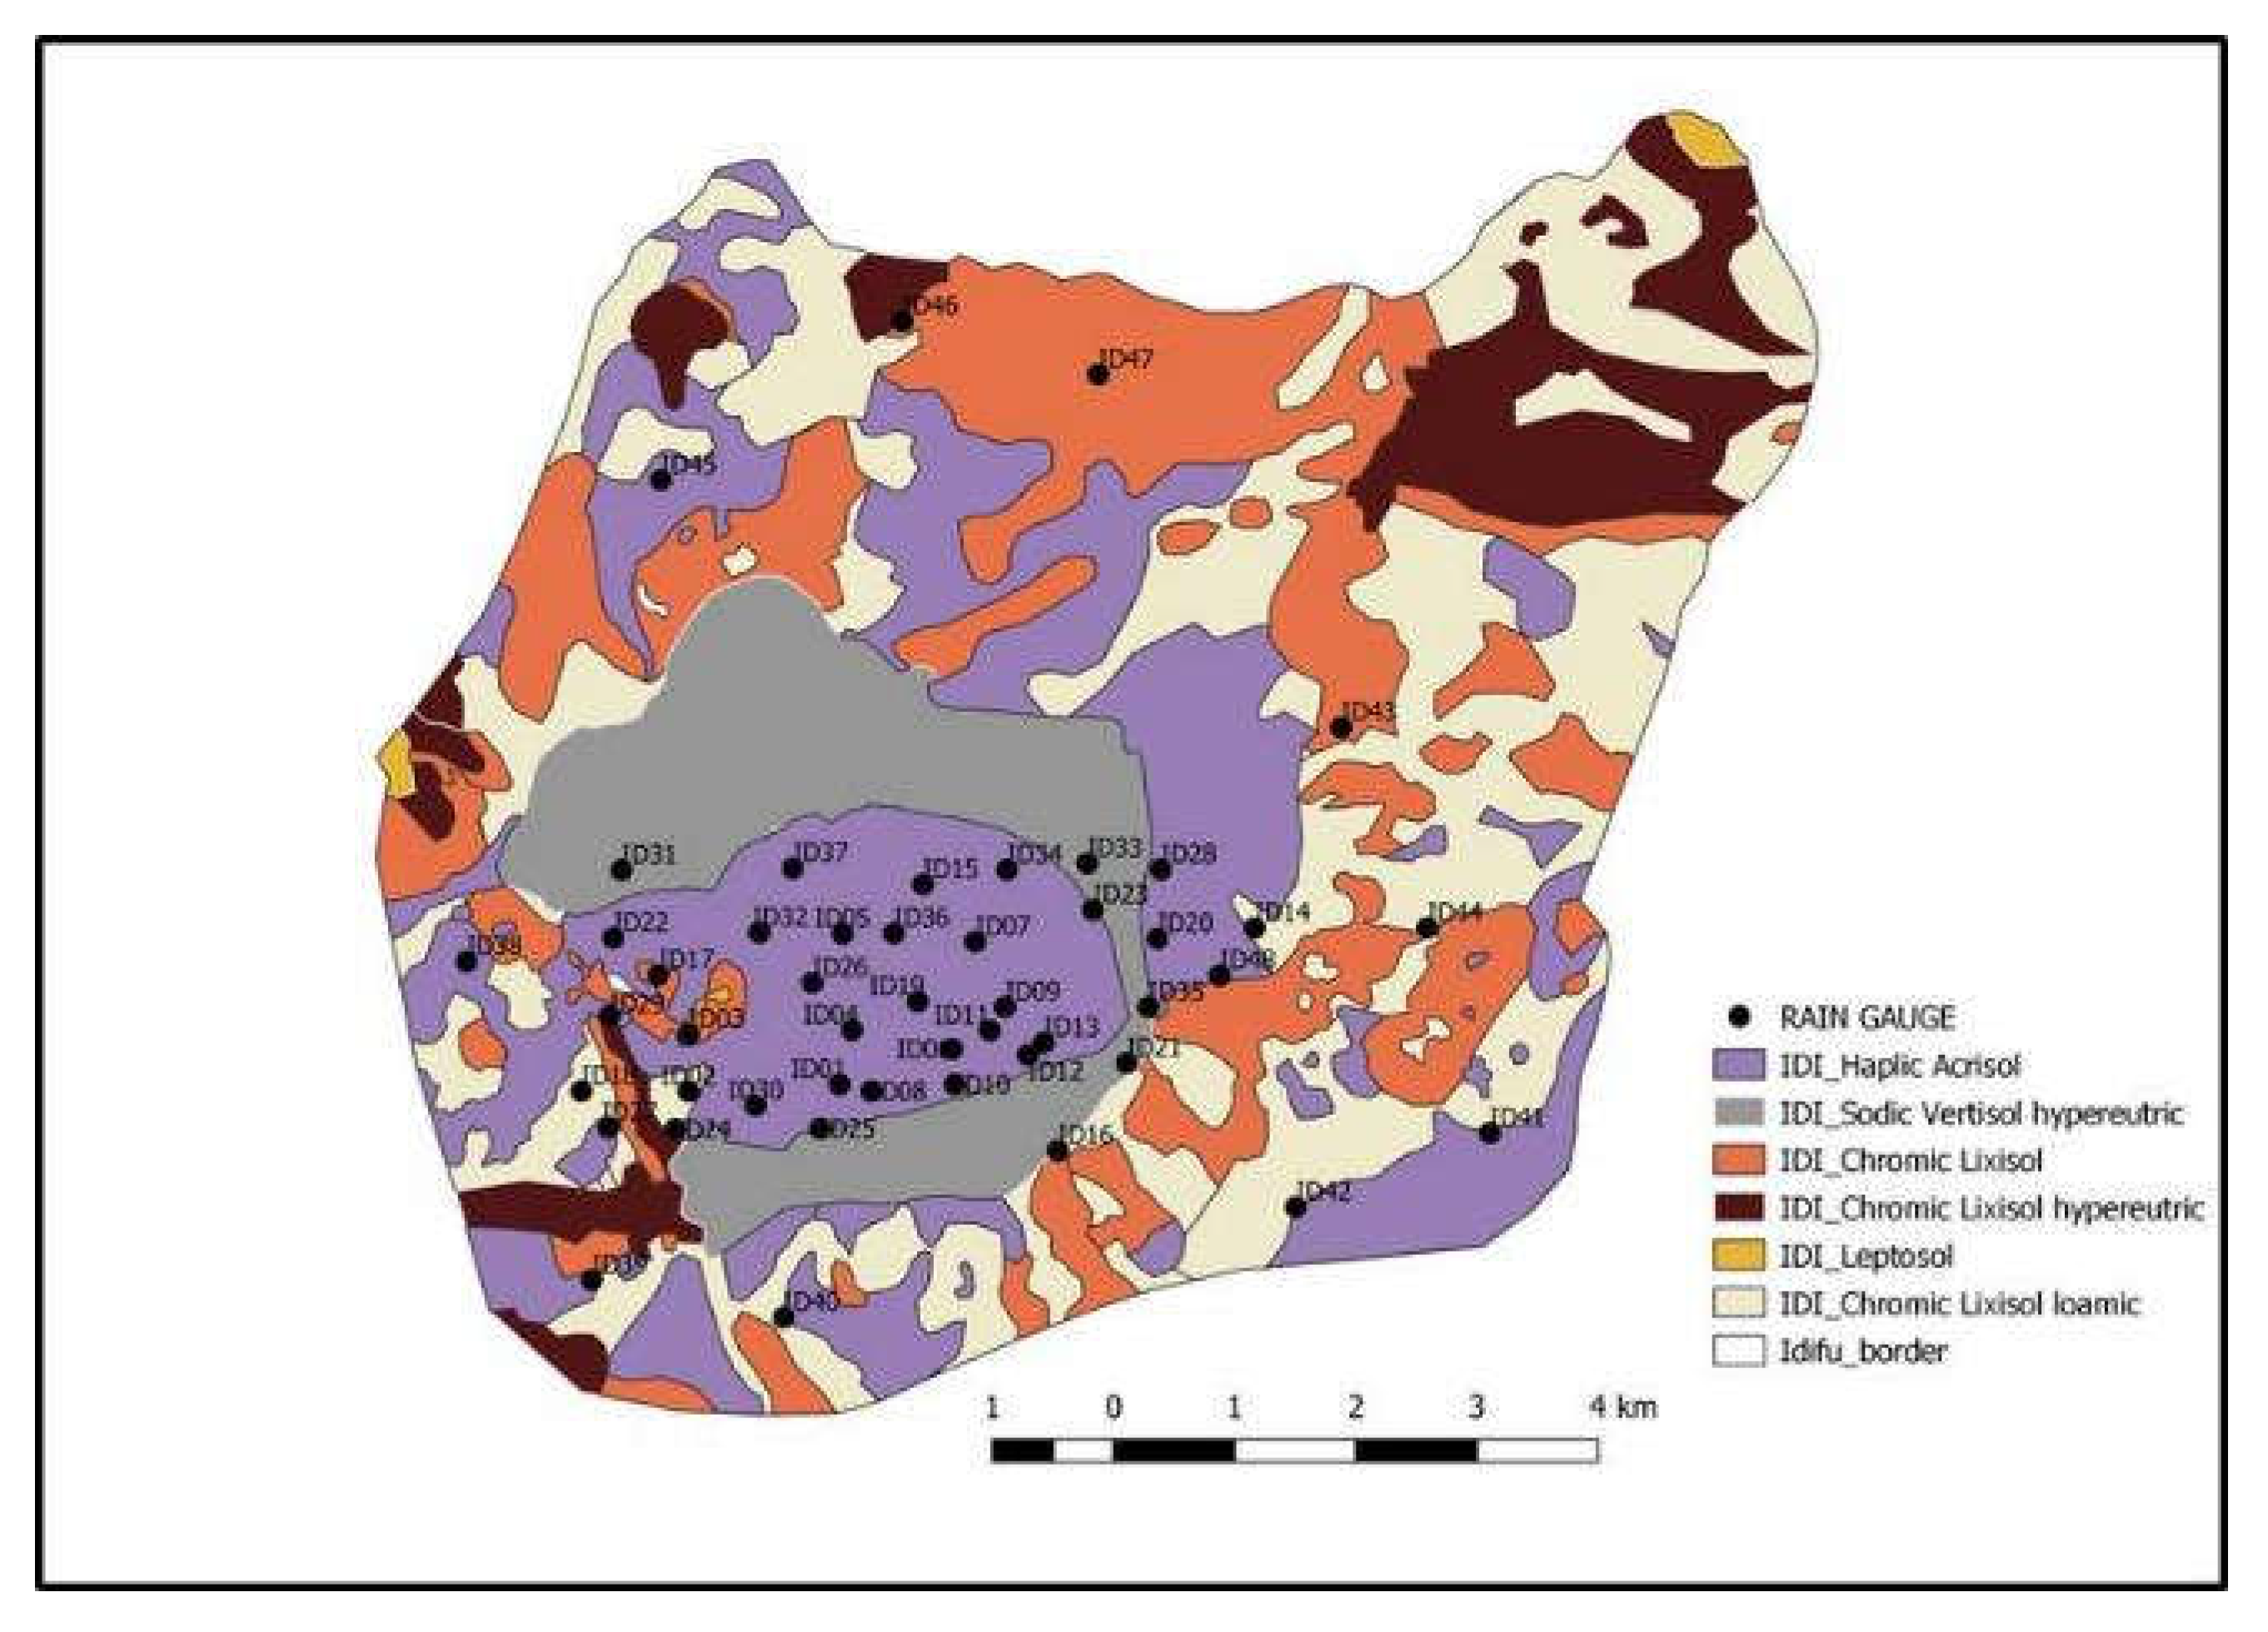
31]. A similar conclusion can be drawn in this study. Thus, a farmer with scattered fields across the study area has a good chance of stable seasonal crop harvest than the one who has all fields concentrated in the same area. The strategy promotes the spatially efficient use of rainfall. For areas with high variations in soil properties, the choice of locations of the scattered fields should consider the quality of soil to reduce the risk associated with soil. Although, in this study the scattered fields in the area were mostly located on soils with similar properties spatially (HA soils), this is not expected to be the case for many areas. There are findings suggesting that yields are poor on gravelly soils and two to three times greater on clay soils [22]. Another study recorded higher yields on under clay soils than sandy soils [32]. However, from the study that checked spatial variability pattern of yields and soils in a 1 ha field, the authors found that soil variables explained 30% of the total yield variation of pearl millet [33]. Thus, to produce higher yields, proper management is required especially in sandy soils. The soil analysis in the Idifu area indicated that the soil has a higher sand content [26] which means creates a risk of lower yields. In addition to the careful selection of soil for the scattered fields practice, overall good crop management is recommended to improve yields of pearl millet.
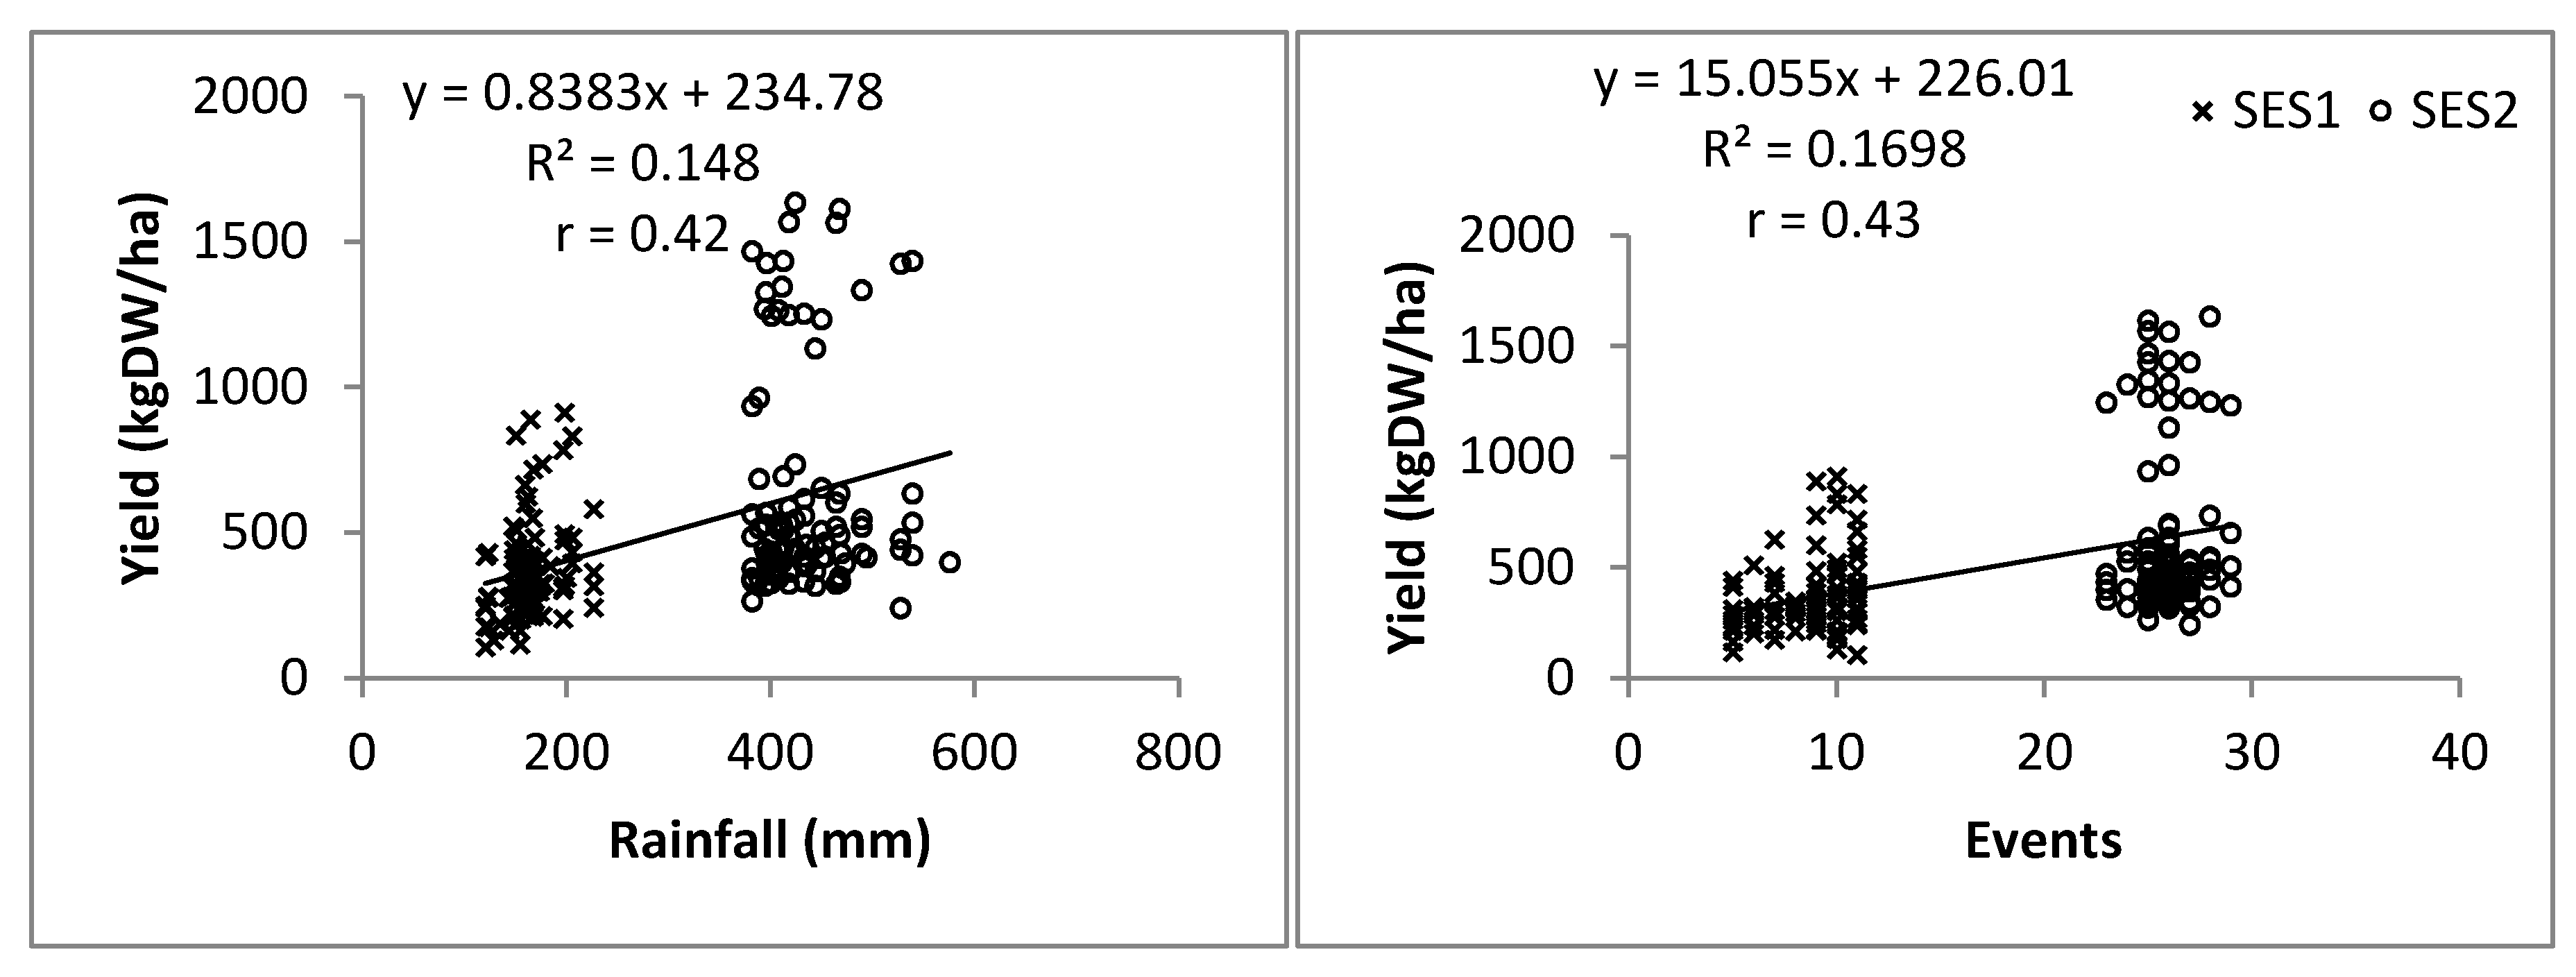
The yield was consistently correlated with both the rainfall amounts and the number of events in a season. However, if the crop water requirement is met in timing and amount, other factors, such as soil and crop management, may be the risk sources. In most cases, yield would vary depending on soil properties [34,35,36]; however, we found no statistical evidence of yield variability for different soils in this study site, possibly due to the insignificant effect of soil interactions with other climatic variables. As established by a previous study, the farmers’ soils in Idifu matched in terms of classification and fertility but were noticeably different in terms of texture with predominantly higher sand content [26]. Other studies found yield discrepancies even at the within-field scale, as some parts of the field may produce more of a crop relative to the rest of the field, indicating microscale interactions between climate, soil, topography, and management [21]. Generally, soils with higher content of swelling clay and silt better retain and release soil moisture; therefore, under adverse limited rainfall conditions, these properties provide a buffer to crop production [37]. Previous studies suggest that the effect of tied ridges is much more pronounced under limited rainfall in high clay content soils than in sandy soils [37]. In wetter seasons, tied ridges have limited advantages in crop production under clay soils especially when rainfall exceeds its retention capacity. The provision of drainage is important under clay soils. Conversely, sandy soils possess good drainage properties, which make tied ridges useful in dry season and less destructive in wetter seasons.
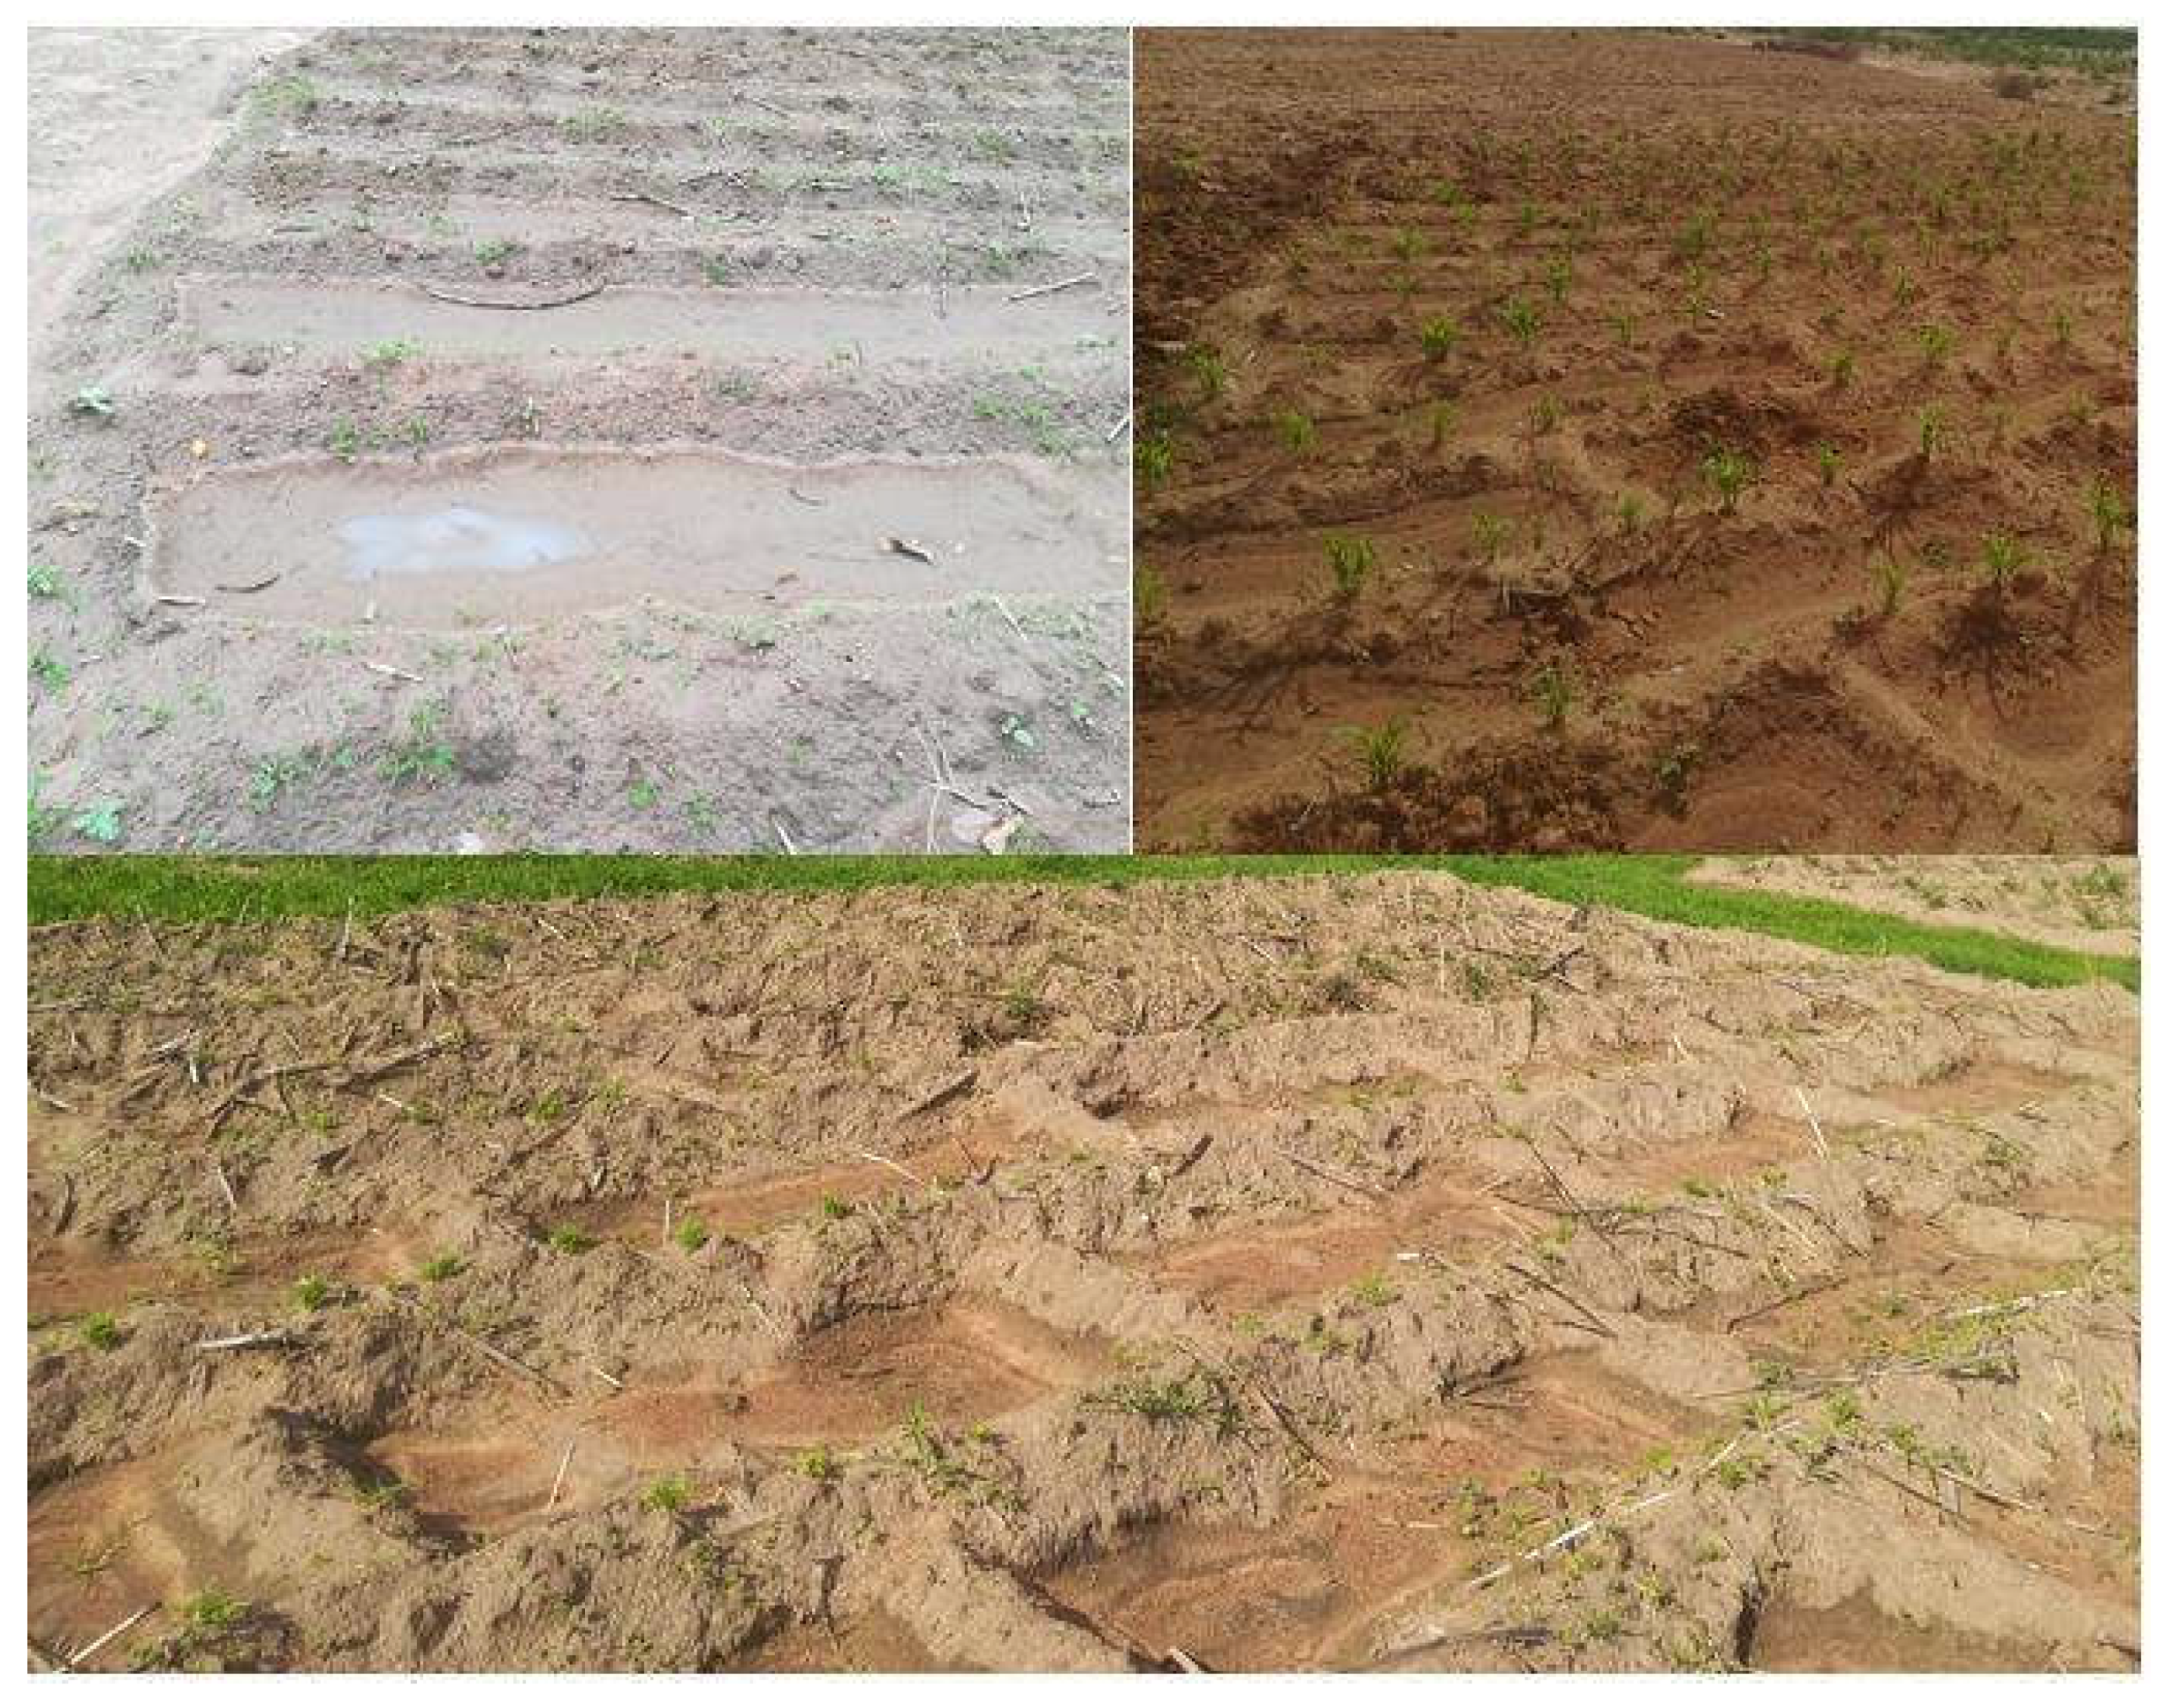
In contrast, tied ridge cultivation increased the pearl millet yield significantly more than the flat cultivation by prolonging soil moisture from harvested rainfall. Therefore, farmers should use this in situ rainwater harvesting (tied ridges) method in their scattered fields to reduce harvest losses and to manage the high rainfall variability. Elsewhere in semiarid areas, the practice has been successful for other cereals, such as maize [38,39,40] and sorghum [2,39]. However, in our study, we found that tied ridges increased spatial yield variability. While yield varied in both flat and tied ridge management situations, the CV of the tied ridges was higher. Further studies on the interactions among plants, soil, terrain, and climatic factors should focus on combining management strategies, such as the use of field scattering with tied ridges and fertilization, to increase yields and reduce spatial yield variability. Field scattering according to different soil types may also be a solution to manage yield variability but is often limited by the number and distance of farmers’ fields or the types and features of existing soils. Farmers can retain the advantage of not losing the entire harvest if these farmers scatter their fields randomly or purposely within their area. We consider the exploration of the effects of certain factors, such as variable planting dates, to be important. For instance, the variable onset and secession dates have implications for a farmer’s decision about when to plant [18]. A modelling study performed in the region on maize production suggested that farmers should better fine-tune the dates that are more likely to enhance crop yield [41]. Similar studies for pearl millet may assist in identifying the best planting dates for achieving the best potential yield.

5. Conclusions

Rainfall in SSA can vary significantly among neighboring fields within a small area, with a distance of less than 200 m between fields, impacting crop yields. The variability in daily rainfall amounts in space is more determinant on crop yield than the total seasonal rainfall variability. The rainfall spatiotemporal variability over such a small distance can result in significant yield variability among farmers. Scattering fields can help farmers to avoid the risk of losing an entire season’s harvest by enabling farmers to obtain at least some seasonal yield from locations that received sufficient rain. The use of tied ridges as an infield rain water harvesting system helps to improve yields more than flat cultivation. We recommend this technique as one of the strategies to help farmers reduce yield losses in semiarid areas.

Author Contributions

F.R.S. was involved in conceptualizing the idea, data collection and analysis, experimentation, writing method, implementation, data presentation, writing the original draft paper, and organizing co-authors views. F.G. streamlined the concept, helped in fund acquisition, revised the design of the paper, contributed to its writing, provided additional literature, supervised the whole writing process and administration of the project that financed the work. S.D.B.-K. contributed during conceptualization of the idea, funding acquisition, supported data collection by providing additional resources (moisture measuring tools), and supervision. S.D.T. contributed by revising the idea, assisted in supervising data collection, and provided the reviews to the original draft. F.C.K. contributed during data collection, revised methodology, provided the resource during field work, and supervised the field work. M.A.L. assisted with the conceptualization of the work, supervision of data collection and analysis, revised the method, and completed an overall review of the paper.

Funding

The research conducted in this study was funded the German Federal Ministry of Agriculture and Food (BMEL) in the form of the PhD program of the Federal Office of Agriculture and Food (BLE). The preparation and publication of this article is funded by the Leibniz Center for Agricultural Landscape Research (ZALF).

Acknowledgments

The authors are grateful to the agricultural field officer Fadhili Mbaga for the assistance during data collection and all famers in Idifu village. We also thank the three anonymous reviewers for their valuable comments on an earlier version of the manuscript.

Conflicts of Interest

The authors declare no conflict of interest. The funders had no role in the design of the study; in the collection, analyses, or interpretation of data; in the writing of the manuscript, or in the decision to publish the results.

Appendix A

Table A1. Variogram cloud analysis from QGIS for annual rainfall variance in SES2.
SES1SES2
Distance (m)Direction Angle (Degrees)DifferenceVarianceCovarianceVarianceCovariance
164.4552.340.204915.21346.968.6
231.71212.4429.3858.52182.346.942.9
267.29102.1140.81664.6−43.3262.4165.9
292.97175.9811.8139.2161.4324−43.6
329.77198.8715.6243.4549.722.6307.9
347.0263.9626.2686.4278.246.9−11.4
374.59122.5835.91288.82408.71802−152.7
377.54143.3411.5132.3449.14.81662.1
386.54353.2473.15343.6−1093.822815.8
397.86203.9116.1259.22216.114.423.6
423.0889.43532809−81.8691.7305.2
437.56132.716.4414453.1158.8−19.3
440.94154.286.643.64465.82430.5−416.3
457.18102.7935.71274.52401.933.1−7.1
460.112.7255.53080.3−627.15700.3−486.7
470.28210.7915.223126.7858.5331.4
473.970.3139.61568.2955.522.6162.3
477.42211.6993.58742.3−2163.92672.9−584.2
482.79309.5359.43528.41233.15.5127.3
483.99324.1695.19044−705.42723.3
488.99216.32164.927,192−5072.381153.6
495.3621.2416.1259.2603.93058.1−760.3
The positive and negative covariance values show that rainfall may increase or decrease with distance in either direction. Distance, randomly chosen distances (m) between two rain gauges, which are compared within a 0–500 m range.

Appendix B

Figure A1. Rainfall variation in space with distance for (a) SES1 and (b) SES2.
Water 11 00578 g0a1

References

  1. Granados, R.; Soria, J.; Cortina, M. Rainfall variability, rainfed agriculture and degree of human marginality in North Guanajuato, Mexico. Singap. J. Trop. Geogr. 2017, 38, 153–166. [Google Scholar] [CrossRef]
  2. Bayu, W.; Rethman, N.F.G.; Hammes, P.S. Effects of tied-ridge, nitrogen fertilizer and cultivar on the yield and nitrogen use efficiency of sorghum in semi-arid Ethiopia. Arch. Agron. Soil Sci. 2012, 58, 547–560. [Google Scholar] [CrossRef]
  3. van Ittersum, M.K.; Cassman, K.G.; Grassini, P.; Wolf, J.; Tittonell, P.; Hochman, Z. Yield gap analysis with local to global relevance—A review. Field Crops Res. 2013, 143, 4–17. [Google Scholar] [CrossRef] [Green Version]
  4. Hoffmann, M.P.; Haakana, M.; Asseng, S.; Höhn, J.G.; Palosuo, T.; Ruiz-Ramos, M.; Fronzek, S.; Ewert, F.; Gaiser, T.; Kassie, B.T.; et al. How does inter-annual variability of attainable yield affect the magnitude of yield gaps for wheat and maize? An analysis at ten sites. Agric. Syst. 2017. [Google Scholar] [CrossRef]
  5. Rockstrom, J. Making the best of climatic variability: Options for upgrading rainfed farming in water scarce regions. Water Sci. Technol. 2004, 49, 151–156. [Google Scholar] [CrossRef] [PubMed]
  6. Vanacker, V.; Linderman, M.; Lupo, F.; Flasse, S.; Lambin, E. Impact of short-term rainfall fluctuation on interannual land cover change in sub-Saharan Africa. Glob. Ecol. Biogeogr. 2005, 14, 123–135. [Google Scholar] [CrossRef]
  7. Cooper, P.J.M.; Dimes, J.; Rao, K.P.C.; Shapiro, B.; Shiferaw, B.; Twomlow, S. Coping better with current climatic variability in the rain-fed farming systems of sub-Saharan Africa: An essential first step in adapting to future climate change? Agric. Ecosyst. Environ. 2008, 126, 24–35. [Google Scholar] [CrossRef] [Green Version]
  8. Waongo, M.; Laux, P.; Kunstmann, H. Adaptation to climate change: The impacts of optimized planting dates on attainable maize yields under rainfed conditions in Burkina Faso. Agric. For. Meteorol. 2015, 205, 23–39. [Google Scholar] [CrossRef] [Green Version]
  9. Sithole, N.J.; Magwaza, L.S.; Mafongoya, P.L. Conservation agriculture and its impact on soil quality and maize yield: A South African perspective. Soil Tillage Res. 2016, 162, 55–67. [Google Scholar] [CrossRef]
  10. Bekele, D.; Alamirew, T.; Kebede, A.; Zeleke, G.; Melese, A.M. Analysis of rainfall trend and variability for agricultural water management in Awash River Basin, Ethiopia. J. Water Clim. Chang. 2017, 8, 127–141. [Google Scholar] [CrossRef]
  11. Wang, X.C.; Qadir, M.; Rasul, F.; Yang, G.T.; Hu, Y.G. Response of Soil Water and Wheat Yield to Rainfall and Temperature Change on the Loess Plateau, China. Agronomy 2018, 8, 101. [Google Scholar] [CrossRef]
  12. Graef, F.; Haigis, J. Spatial and temporal rainfall variability in the Sahel and its effects on farmers’ management strategies. J. Arid Environ. 2001, 48, 221–231. [Google Scholar] [CrossRef]
  13. Satyanarayana, P.; Srinivas, V.V. Regional frequency analysis of precipitation using large-scale atmospheric variables. J. Geophys. Res. 2008, 113. [Google Scholar] [CrossRef] [Green Version]
  14. Batisani, N.; Yarnal, B. Rainfall variability and trends in semi-arid Botswana: Implications for climate change adaptation policy. Appl. Geogr. 2010, 30, 483–489. [Google Scholar] [CrossRef]
  15. Nasseri, M.; Zahraie, B. Application of simple clustering on space-time mapping of mean monthly rainfall pattern. Int. J. Climatol. 2011, 31, 732–741. [Google Scholar] [CrossRef] [Green Version]
  16. Liu, Y.; Liu, L. Rainfall feature extraction using cluster analysis and its application on displacement prediction for a cleavage-parallel landslide in the Three-Gorges Reservoir area. Nat. Hazards Earth Syst. Sci. Discuss. 2016, 1–15. [Google Scholar] [CrossRef]
  17. Silungwe, F.R.; Graef, F.; Bellingrath-Kimura, S.D.; Tumbo, S.D.; Kahimba, F.C.; Lana, M.A. Crop Upgrading Strategies and Modelling for Rainfed Cereals in a Semi-Arid Climate—A Review. Water 2018, 10, 356. [Google Scholar] [CrossRef]
  18. Munishi, P.K.T. Analysis of Climate Change and its Impacts on Productive Sectors, Particularly Agriculture in Tanzania; Sokoine University of Agriculture: Morogoro, Tanzania, 2009; p. 72. [Google Scholar]
  19. Kassile, T. Trend Analysis of Monthly Rainfall Data in Central Zone. J. Math. Stat. 2013, 9, 1–11. [Google Scholar] [CrossRef]
  20. Mkonda, M.Y.; He, X.H. Are Rainfall and Temperature Really Changing? Farmer’s Perceptions, Meteorological Data, and Policy Implications in the Tanzanian Semi-Arid Zone. Sustainability 2017, 9, 1412. [Google Scholar] [CrossRef]
  21. Maestrini, B.; Basso, B. Drivers of within-field spatial and temporal variability of crop yield across the US Midwest. Sci. Rep. 2018, 8, 14833. [Google Scholar] [CrossRef]
  22. Falconnier, G.N.; Descheemaeker, K.; Van Mourik, T.A.; Giller, K.E. Unravelling the causes of variability in crop yields and treatment responses for better tailoring of options for sustainable intensification in southern Mali. Field Crops Res. 2016, 187, 113–126. [Google Scholar] [CrossRef]
  23. Kahimba, F.C.; Mbaga, S.; Mkoko, B.; Swai, E.; Kimaro, A.A.; Mpanda, M.; Liingilie, A.; Germer, J. Analysing the Current Situation Regarding Biophysical Conditions and Rainfed Crop, Livestock- and Agroforestry Systems: A Baseline Report; 031A249A; Trans-SEC Consortium: Müncheberg, Germany, 2015; p. 42. [Google Scholar]
  24. URT. National Sample Census of Agriculture 2007/2008 Small Holder Agriculture: Regional Report—Dodoma Region “[Volume Va],” United Republic of Tanzania; Regional Administration and Local Governments: Dodoma, Tanzania, 2012; p. 319.
  25. Li, Y.; Wu, H. A Clustering Method Based on K-Means Algorithm. Phys. Procedia 2012, 25, 1104–1109. [Google Scholar] [CrossRef] [Green Version]
  26. Reinhardt, N.; Herrmann, L. Fusion of indigenous knowledge and gamma spectrometry for soil mapping to support knowledge-based extension in Tanzania. Food Secur. 2017, 9, 1271–1284. [Google Scholar] [CrossRef]
  27. Chan, Y.; Walmsley, R.P. Learning and Understanding the Kruskal-Wallis One-Way Analysis of Variance-by-Ranks Test for Differences Among Three or More Independent Groups. Phys. Ther. 1997, 77, 1755–1762. [Google Scholar] [CrossRef] [PubMed]
  28. Sucozhañay, A.; Célleri, R. Impact of Rain Gauges Distribution on the Runoff Simulation of a Small Mountain Catchment in Southern Ecuador. Water 2018, 10, 1169. [Google Scholar]
  29. Buytaert, W.; Celleri, R.; Willems, P.; De Bievre, B.; Wyseure, G. Spatial and temporal rainfall variability in mountainous areas: A case study from the south Ecuadorian Andes. J. Hydrol. 2006, 329, 413–421. [Google Scholar] [CrossRef] [Green Version]
  30. Gao, R.Z.; Li, F.L.; Wang, X.X.; Liu, T.X.; Du, D.D.; Bai, Y. Spatiotemporal variations in precipitation across the Chinese Mongolian plateau over the past half century. Atmos. Res. 2017, 193, 204–215. [Google Scholar] [CrossRef]
  31. Akponikpe, P.B.; Minet, J.; Gérard, B.; Defourny, P.; Bielders, C.L. Spatial fields’ dispersion as a farmer strategy to reduce agro-climatic risk at the household level in pearl millet-based systems in the Sahel: A modeling perspective. Agric. For. Meteorol. 2011, 151, 215–227. [Google Scholar] [CrossRef]
  32. Bagayoko, M.; Maman, N.; Palé, S.; Sirifi, S.; Taonda, S.; Traore, S.; Mason, S. Microdose and N and P fertilizer application rates for pearl millet in West Africa. Afr. J. Agric. Res. 2011, 6, 1141–1150. [Google Scholar]
  33. Stein, A.; Brouwer, J.; Bouma, J. Methods for comparing spatial variability patterns of millet yield and soil data. Soil Sci. Soc. Am. J. 1997, 61, 861–870. [Google Scholar] [CrossRef]
  34. Usowicz, B.; Lipiec, J. Spatial variability of soil properties and cereal yield in a cultivated field on sandy soil. Soil Tillage Res. 2017, 174, 241–250. [Google Scholar] [CrossRef]
  35. Miller, M.P.; Singer, M.J.; Nielsen, D.R. Spatial variability of wheat yield and soil properties on complex hills. Soil Sci. Soc. Am. J. 1988, 52, 1133–1141. [Google Scholar] [CrossRef]
  36. Cox, M.; Gerard, P.; Wardlaw, M.; Abshire, M. Variability of selected soil properties and their relationships with soybean yield. Soil Sci. Soc. Am. J. 2003, 67, 1296–1302. [Google Scholar] [CrossRef]
  37. Belay, A.; Gebrekidan, H.; Uloro, Y. Effect of tied ridges on grain yield response of Maize (Zea mays L.) to application of crop residue and residual N and P on two soil types at Alemaya, Ethiopia. S. Afr. J. Plant Soil 1998, 15, 123–129. [Google Scholar] [CrossRef]
  38. Wright, J.P.; Posner, J.L.; Doll, J.D. The effect of tied ridge cultivation on the yield of maize and a maize cowpea relay in the gambia. Exp. Agric. 1991, 27, 269–279. [Google Scholar] [CrossRef]
  39. Mesfin, T.; Tesfahunegn, G.B.; Wortmann, C.S.; Nikus, O.; Mamo, M. Tied-ridging and fertilizer use for sorghum production in semi-arid Ethiopia. Nutr. Cycl. Agroecosyst. 2009, 85, 87–94. [Google Scholar] [CrossRef]
  40. Kiboi, M.N.; Ngetich, K.F.; Diels, J.; Mucheru-Muna, M.; Mugwe, J.; Mugendi, D.N. Minimum tillage, tied ridging and mulching for better maize yield and yield stability in the Central Highlands of Kenya. Soil Tillage Res. 2017, 170, 157–166. [Google Scholar] [CrossRef]
  41. Lana, M.A.; Vasconcelos, A.C.F.; Gornott, C.; Schaffert, A.; Bonatti, M.; Volk, J.; Graef, F.; Kersebaum, K.C.; Sieber, S. Is dry soil planting an adaptation strategy for maize cultivation in semi-arid Tanzania? Food Secur. 2018, 10, 897–910. [Google Scholar] [CrossRef]
Figure 1. Location of the study site.
Water 11 00578 g001
Figure 2. Soil pattern and rain gauge positions at the Idifu study site.
Water 11 00578 g002
Figure 3. Tied ridges prepared by different farmers in semiarid Dodoma.
Water 11 00578 g003
Figure 4. Average rainfall amounts per event for SES1 and SES2.
Water 11 00578 g004
Figure 5. Distribution of daily rainfall (mm) in (a) SES1 and (b) SES2.
Water 11 00578 g005
Figure 6. Isohyets of the total seasonal rainfall (mm) during (a) SES1 and (b) SES2.
Water 11 00578 g006
Figure 7. Total rainfall (mm) for two seasons related to the number of events.
Water 11 00578 g007
Figure 8. Spatial distribution of pearl millet yield (kgDWha−1) for (a) SES1 and (b) SES2.
Water 11 00578 g008
Figure 9. Combined relationships between two seasons of yields (kgDWha−1), seasonal rainfall (mm) amounts, and number of events.
Water 11 00578 g009
Table 1. Analysis of average spatial rainfall (mm) per event within and between seasons.
SeasonNo. of GaugesAverage (mm)SD (mm)CV (%)Minimum (mm)Maximum (mm)p-Value (within)p-Value (between)
SES13810.791.5614.58.015.10.00 *0.00 *
SES23814.111.4410.212.318.60.00 *
Note: CV is the coefficient of variation. Statistically significant at 0.05 level is denoted by a star (*). The average values were calculated by averaging the daily rainfall (mm) for all events in a season to a single value per rain gauge, and then the variations among rainfall averages (mm) for all 38 rain gauges were tested.
Table 2. Probabilities of daily rainfall coverage.
SeasonNo. of GaugesAverage Number of EventsP100P50
SES13890.000.42
SES238250.560.87
Note: The P100 and P50 values were calculated using daily rainfall data from 38 stations. P100 is a probability that for each rainfall event, all 38 rain gauges would record daily rainfall. P50 is a probability that for each rainfall event, at least half of the 38 rain gauges recorded daily rainfall. The values were obtained by dividing the maximum possible number of events in a season recorded in any rain gauge out of 38 total gauges by the minimum possible number of events at that gauge.
Table 3. Standard deviation, mean, CV, and p-values for pearl millet yield (kgDWha−1).
SeasonNo. of PlotsAverage (kgDWha−1)SD (kgDWha−1)CV (%)Minimum (kgDWha−1)Maximum (kgDWha−1)p-Value (within Season)p-Value (between Seasons)
SES198360.53170.647.321059120.00 *0.00 *
SES2101637.66381.2659.7923916330.00 *
Note: Statistically significant at 0.05 level is denoted by a star (*). For each of the 38 rain gauge positions, we collected samples from a minimum of two plots to a maximum of four plots with flat cultivation and with tied ridges cultivation.
Table 4. Comparison of yield variation according to soils.
Soil TypeNo. of PlotsAverage (kgDWha−1)SD (kgDWha−1)CV (%)Minimum Yield (kgDWha−1)Maximum Yield (kgDWha−1)Range (kgDWha−1)p-Value (within Soil)p-Value (among Soils)
CL16497.9360.8572.47216142412080.00 *0.38
CLL28573.1345.7660.33214163314190.00 *
HA141477.9320.8864.75105161215070.00 *
SVH14415.6266.2164.05130124711170.00 *
Note: Statistically significant at 0.05 level is denoted by a star (*). CL—chromic lixisol, CLL—chromic lixisol loamic, HA—haplic acrisol loamic, and SVH—sodic vertisol hypereutric.
Table 5. Overall comparison of yield variations for flat cultivation and tied ridges.
Cultivation PracticeNumber of PlotsAverage (kgDWha−1)SD (kgDWha−1)CV (%)Minimum (kgDWha−1)Maximum (kgDWha−1)Range (kgDWha−1)p-Value (within Treatment)p-Value (between Treatments)Season
Flat58288.588.2630.5105.04743690.370.00 *SES1
Tied Ridges40470.72189.2940.2163.09127490.04 *
Flat59418.078.1518.7239.05673280.180.00 *SES2
Tied Ridges42946.2442344.7343.0163312900.00 *
Note: Statistically significant at 0.05 level is denoted by a star (*).

