Long-Term Changes of Hydrological Variables in a Small Lowland Watershed in Central Poland


1
Department of Hydraulic Engineering, Warsaw University of Life Sciences–SGGW, Nowoursynowska 159, 02-776 Warsaw, Poland
2
Department of Geography, University of Zurich, Winterthurerstrasse 190, 8057 Zürich, Switzerland
3
Department of Civil, Environmental, Architectural Engineering and Mathematics, Università degli Studi di Brescia, Via Branze 43, 25121 Brescia, Italy
*
Author to whom correspondence should be addressed.
Water 2019, 11(3), 564; https://doi.org/10.3390/w11030564
Submission received: 2 February 2019
/
Revised: 12 March 2019
/
Accepted: 13 March 2019
/
Published: 19 March 2019
(This article belongs to the Section Hydrology)
Abstract
:Climate-induced changes in small watersheds are still not well researched because long-term datasets are usually missing for these watersheds. Such studies can, however, improve our understanding of the watershed response to climatic changes at such a small scale being transparent. In this study, we investigate trends in temperature, precipitation and river-flow characteristics in a small watershed, typical for Central Poland, with 53 years of observations (1963–2015) using the Mann-Kendall test. Particularly, we examine whether any trends in hydro-meteorological variables can be identified, and if any associated changes in water resources in this region can already be observed. We found that this short period already allows for detecting some changes in hydro-meteorological variables. These changes could be characterized by a significant increase in the mean annual air temperature on a daily basis, and a significant decrease in the mean annual discharge on a daily basis and in the minimum annual discharge on a daily basis. Yet, no significant trend could be detected for the total annual precipitation, the maximum summer rainfall, and the maximum annual discharge on a daily basis. These findings indicate that water resources are decreasing in this region, which affects natural habitats, agriculture and local communities.
1. Introduction
Global atmospheric circulation is becoming more dynamic, and climate changes are becoming more and more observable, in many parts of the world. As the hydrological cycle is strongly related to the atmospheric temperature, precipitation, wind and radiation forcing, changes in these variables usually cause changes in the water cycle. Consequently, an increase in extreme weather events, such as floods and droughts, has been observed in many parts of the world, leading to an increasing number of people being affected globally [1,2]. Recent research indicates that in many regions the intensity of extreme rainfalls is increasing [3,4,5], which, among other things, leads to a higher erosion rate and an increasing magnitude and frequency of floods. In other regions, however, heavy rainfalls show more variable spatial patterns [6], indicating that the impact of climate variability on the hydrological cycle needs to be investigated in detail at a local scale in different geographical regions.
In the above context, current climate model projections suggest that, in some parts of the world, e.g., East Asia, water availability will increase [7,8]. In contrast to that, decreasing trends in low and median river flows are commonly observed in Asia Minor and Central Europe [9,10]. Thus, at a global scale the runoff is projected to increase in Northern Europe, North Asia and Canada, whereas a decrease is expected in Southern Europe, Central America and the Northwestern United States, and North and South Africa [11]. It is often, however, not clear whether climatic (i.e., a temperature rise) or direct anthropogenic factors (i.e., land-use changes and water-management practices) have a greater influence on changes in the hydrological cycle at a local scale [12].
For a better understanding of these changes and for effective managing of water resources, hydro-meteorological investigations in river watersheds have been carried out around the world. However, most of these studies focused rather on a large watershed scale due to the data availability [13,14]. In contrast, not much research has been devoted to small watersheds, in which there is a shortage of long-term datasets [15] that are needed for climate impact studies [16]. Yet, small watersheds present a very interesting research study. Due to their small spatial scale, factors possibly affecting the hydrological cycle are usually more transparent than in larger watersheds. Moreover, small watersheds are less affected by human activities, or these activities can be better identified, than in larger watersheds, which enables to focus on the climate change impacts only, provided that long-term observations are available [17]. Thus, long-term studies on changes in climatic and hydrological variables in such small watersheds can help to improve our understanding of the watershed response to climatic changes. Therefore, more research in this respect is needed at a local scale.
In this study, we investigate trends in climatic and hydrological variables in such a small watershed located in Central Poland. The available dataset covers the period of 53 years (1963–2015), which is rare for such a small watershed, and was analyzed for trends in temperature, precipitation and river-flow characteristics. This watershed represents a typical small lowland watershed for central Poland and thus any changes detected at a local scale can be treated as representative for this region. The novelty of our research lies in analyzing changes in water resources for a specific, valuable from a touristic and ecological point of view, region and making an attempt to indicate the reasons for these changes in the context of climate change. Results from this study should help in understanding the dynamics of hydrological cycle and the need for effective managing of water resources in this catchment and in the whole region. In particular, the aim of this study was to determine (a) whether any trends in climatic and hydrological variables can be observed at a scale of small watershed with already about 50 years of observations; and (b) if any associated changes in water resources can already be observed in this region at such a small scale.
2. Materials and Methods
2.1. Study Area and Data
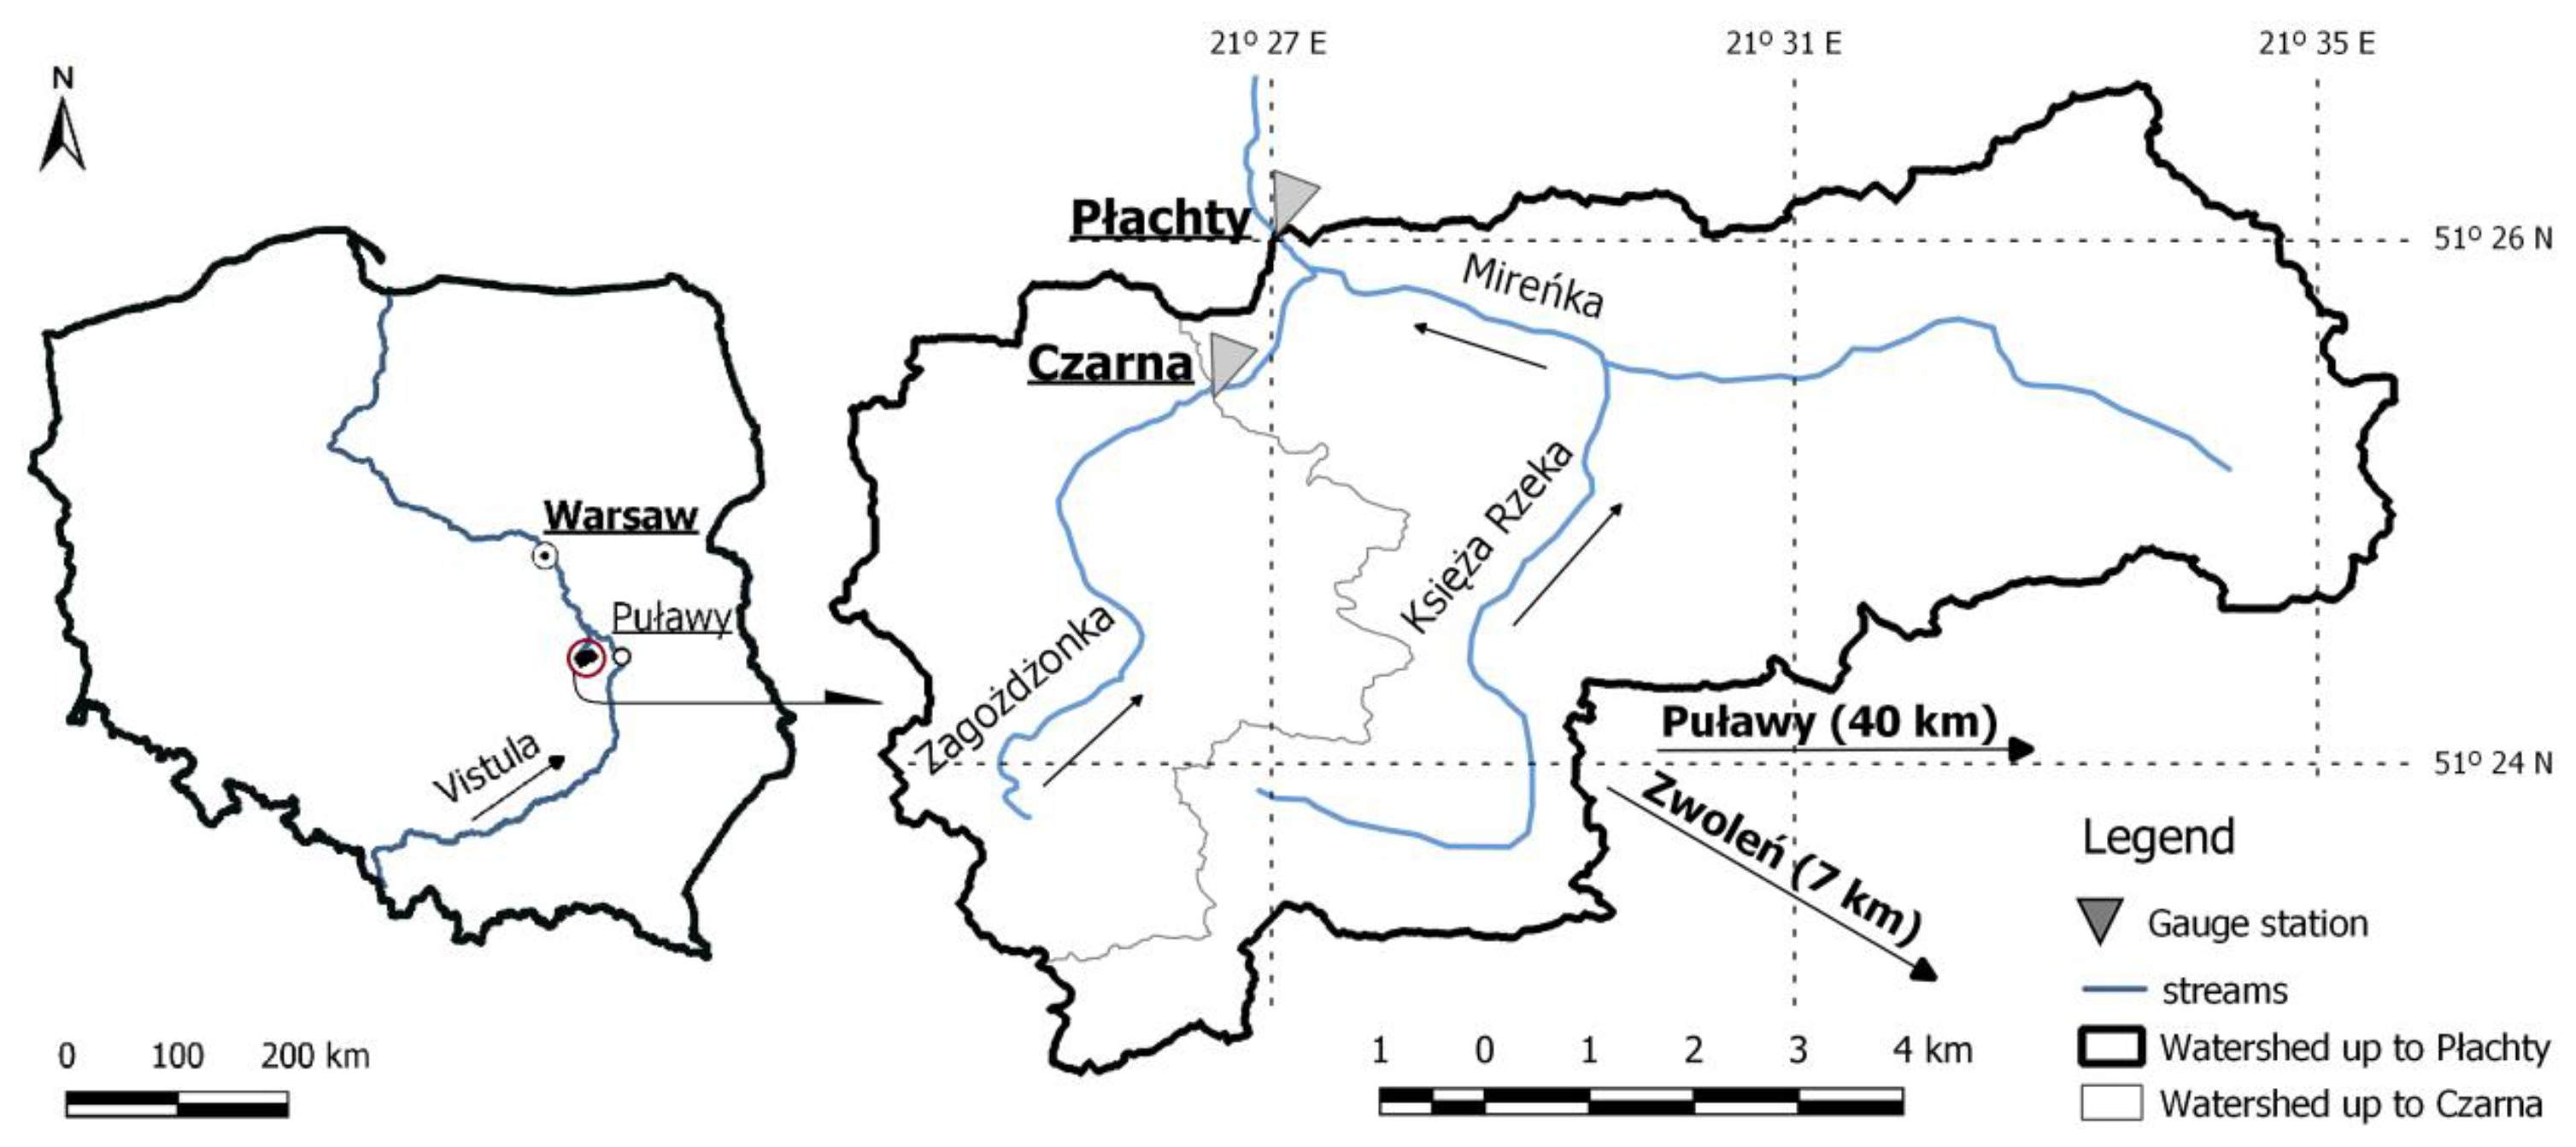
The study area is a small agricultural lowland watershed of Zagożdżonka River, located in the center of Poland, about 100 km south of Warsaw—see Figure 1. Two gauging stations (Czarna and Płachty) are placed within it. The watershed area up to the Czarna station equals 23.4 km2 and to the Płachty station 82.4 km2. This watershed is rather flat, with an elevation ranging from 147.5 to 184.5 m.a.s.l. The mean slope of the main stream varies from 2.5 to 3.5‰. Thus, this watershed can be assumed to be a typical small lowland watershed for this region.
Since the beginning of the observation period, the watershed area has been dominated by agriculture and forest, and only the ratio of land use has changed. In the 1980s, arable land accounted for 47% and forests for 40% [18]. Nowadays, more than half of the analyzed area (60%) is covered by forests and 25% by small grain plants and potatoes, whereas pastures occupy 11% of the watershed, and the remaining 4% consists of settlements and reservoirs [19]. The soil structure of this watershed is dominated by loamy sands.
Since the summer of 1962, the discharge of Zagożdżonka River has been monitored by the Department of Water Engineering of Warsaw University of Life Sciences-SGGW. All measurements are done according to the standard methodology recommended by the Polish Institute of Meteorology and Water Management-National Research Institute [20,21]. The related research conducted in this watershed has tightly focused on, among other things, rainfall-runoff processes, soil erosion, sediment yield and reservoir sedimentation [18,22,23], sediment properties and water quality [24], and water resources availability [25].
Air temperature was not measured directly in the watershed but was provided for this region by the Institute of Meteorology and Water Management—National Research Institute (IMGW-PIB) from Puławy station, which is located about 40 km east of the center of the watershed. Due to the lowland landscape of the region, low and rather smooth variations in air temperature are expected, and thus this station can be assumed as representative for the studied watershed. For the period 1951–2015, the mean annual air temperature on a daily basis was 8.1 °C. The warmest recorded year was 2015 (10.2 °C) and the coolest was 1956 (6.2 °C).
Precipitation has been recorded in this watershed since 1983. In detail, daily rainfall was collected by using a standard manual Hellmann rain gauge (collecting area 200 cm2, placed at a height of 1 m). The device was checked daily by the meteorological station staff. In winter seasons the snow collected in the rain gauge was melted and the volume/depth of the water equivalent was estimated. Precipitation records from the period before installing the rain gauge, i.e., for the period 1963–1982, were taken for the purpose of this study from IMGW-PIB for the nearest rain gauge, i.e., Zwoleń station (located about 12 km south-east of the Czarna gauging station). For the period of observation, i.e., 1983–2015, precipitation sums were recorded directly at the Czarna and the Płachty gauging stations. For assessing the representativity of precipitation records from the IMGW station (Zwoleń), records from this station were compared with records taken directly in the watershed during the overlapping period of recording, i.e., 1983–2009. This comparison confirmed that annual data from Zwoleń can be assumed as representative for the Zagożdżonka watershed. This may, however, not be the case for instant values, which should be verified if needed. Based on the entire observation period (1963–2015), the mean annual precipitation was estimated as 612 mm. The wettest year was 1974 (941 mm) and the driest 1991 (413 mm).
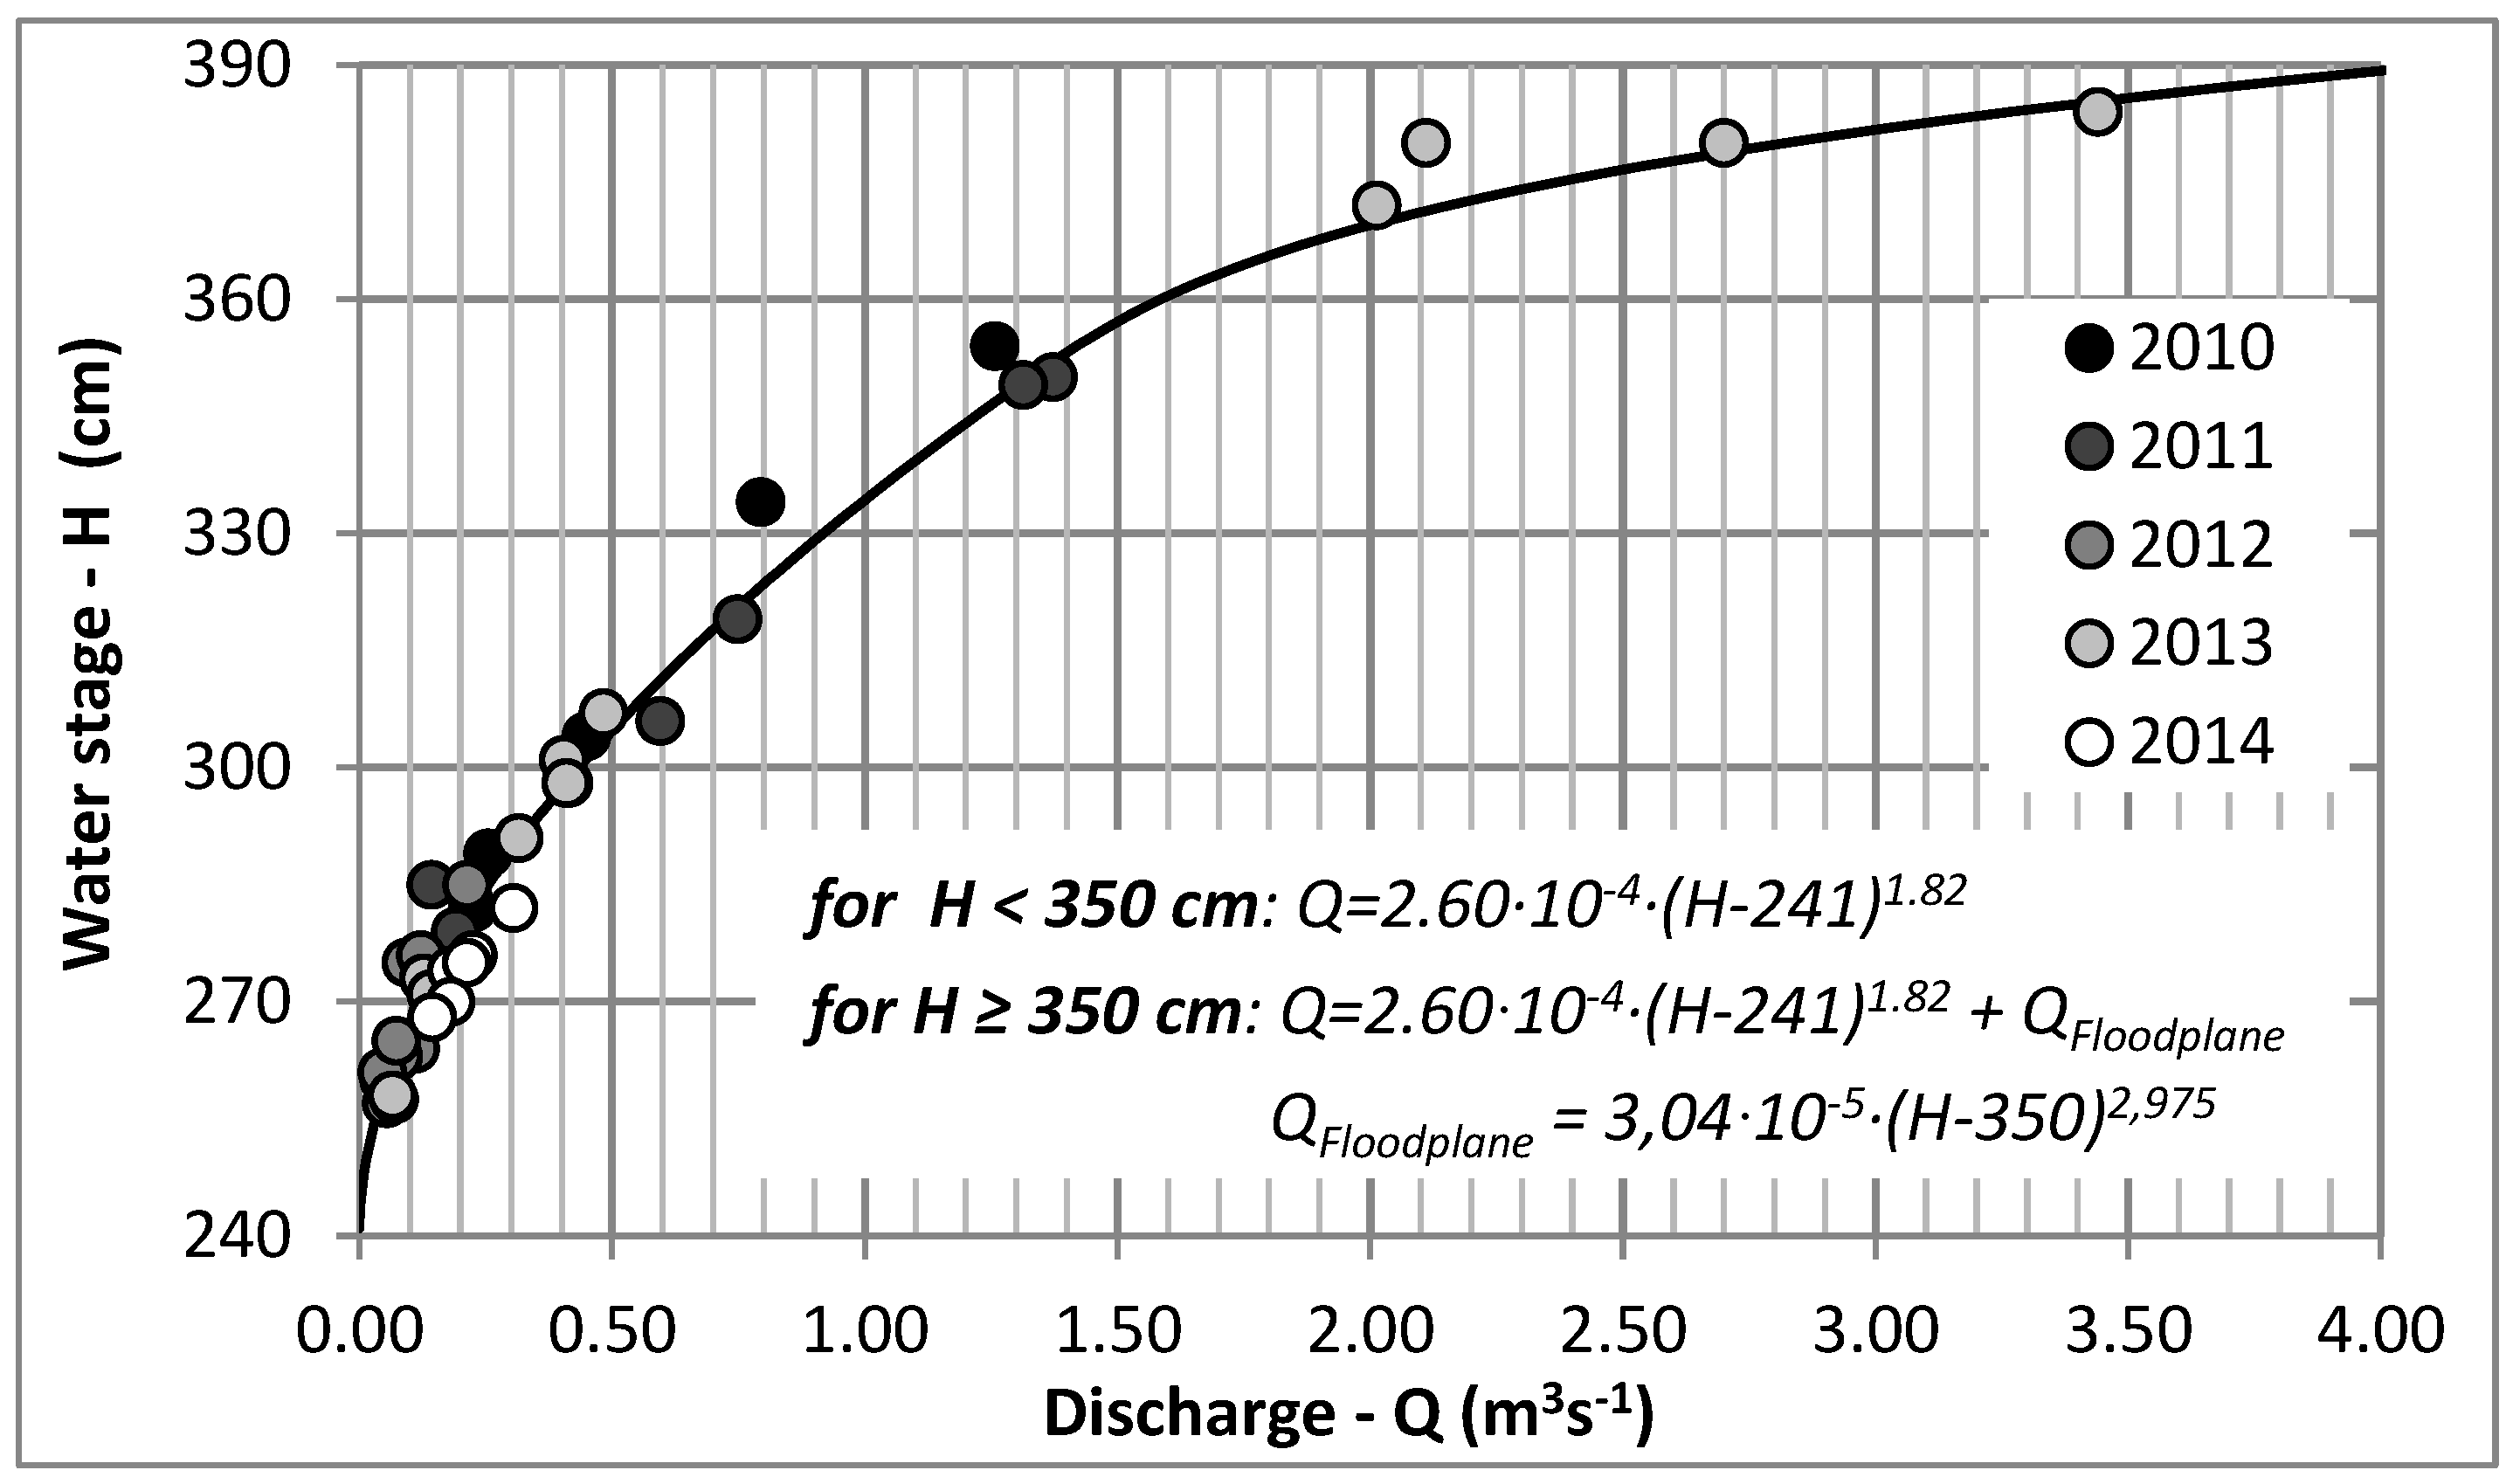
Water levels at the Płachty gauging station—see Figure 2—were collected in different ways, depending on the period, i.e., by traditional daily staff gauge readings (continuously since 1963), by a mechanical water stage recorder (since the 1980s), and with an electronic pressure logger (since 2002). Recorded water levels were used to estimate river discharge by means of a rating curve. For precise estimation of river flow the rating curve was established and verified based on hydrometric measurements conducted ca. 8–12 times per year. The hydrometric measurements included water stage reading and estimating the corresponding discharge, on the basis of the cross-section area and flow velocity measurements. An example rating curve is shown in Figure 3. The period of rating curve validity has been established based on analysis of water stage hydrograph and the changes in water stage-discharge relations. The mean annual discharge on a daily basis at the Płachy station for 1962–2015 is 0.276 m3·s−1.
Although the way of measuring the discharge records or the position of the precipitation station have been changed over the analyzed time window, we include all available data in the study to extend the data length as far as possible. This is important for climate impact studies, where data length may be a critical factor for observing any changes in the watershed.
2.2. Analyzed Hydro-Meteorological Variables
From the available dataset, the following hydro-meteorological variables have been chosen and computed for studying trends in the watershed:
- mean annual air temperature on a daily basis, which gives overall information on temperature changes in the analyzed region and indicates possible changes in the hydrological cycle, e.g., due to an increased evaporation,
- total annual precipitation, which together with evaporation determines the runoff in the watershed,
- maximum summer one-, two- and three-days’ rainfall, which are responsible for summer flood events (data with a higher temporal resolution, e.g., one hour, were not available),
- minimum annual discharge on a daily basis, which indicates the drought period and low water availability,
- mean annual discharge on a daily basis, used for assessing quantity of water resources,
- maximum summer discharge on a daily basis, caused by extreme summer rainfalls,
- maximum annual discharge on a daily basis, used for an estimation of the T-year flood (if no trend in dataset is detected).
None of the analyzed variables was autocorrelated over the studied period (autocorrelation coefficient less than 0.5).
2.3. Trend Analysis
To assess the significance of trends in the time series of selected hydro-meteorological variables, we chose the Mann-Kendall test [26,27], which is often used for trend analysis in hydrological variables [17]. It is a nonparametric test, in which the null hypothesis assumes that there is no significant trend in data series. The trend is significant if the null hypothesis cannot be accepted. The acceptance region at the significance level α = 0.05 is determined by the interval −1.96 ≤ Z ≤ 1.96 (no significant trend), whereas the rejection region is given by Z < −1.96 (significant decreasing trend) and Z > 1.96 (significant increasing trend), where Z is a normalized test statistic [28]:
where:
S—Mann-Kendall statistic, xj—sequential data value, n—length of the dataset.
For variables with a significant trend detected, further analysis of temporal variations was performed using a linear relationship:
where: y—dependent variable (e.g., temperature in °C), a—slope of a regression line (e.g., °C∙year−1), x—independent variable, year, b—theoretical value of the dependent variable in year zero (first year of observation).
This analysis enables establishing the magnitude of the identified significant trend.
3. Results and Discussion
For the study watershed and the analyzed period of 53 years, significant trends were found for three of seven considered meteorological and hydrological variables, i.e., for the temperature, the mean annual and minimum annual discharge (see Table 1).
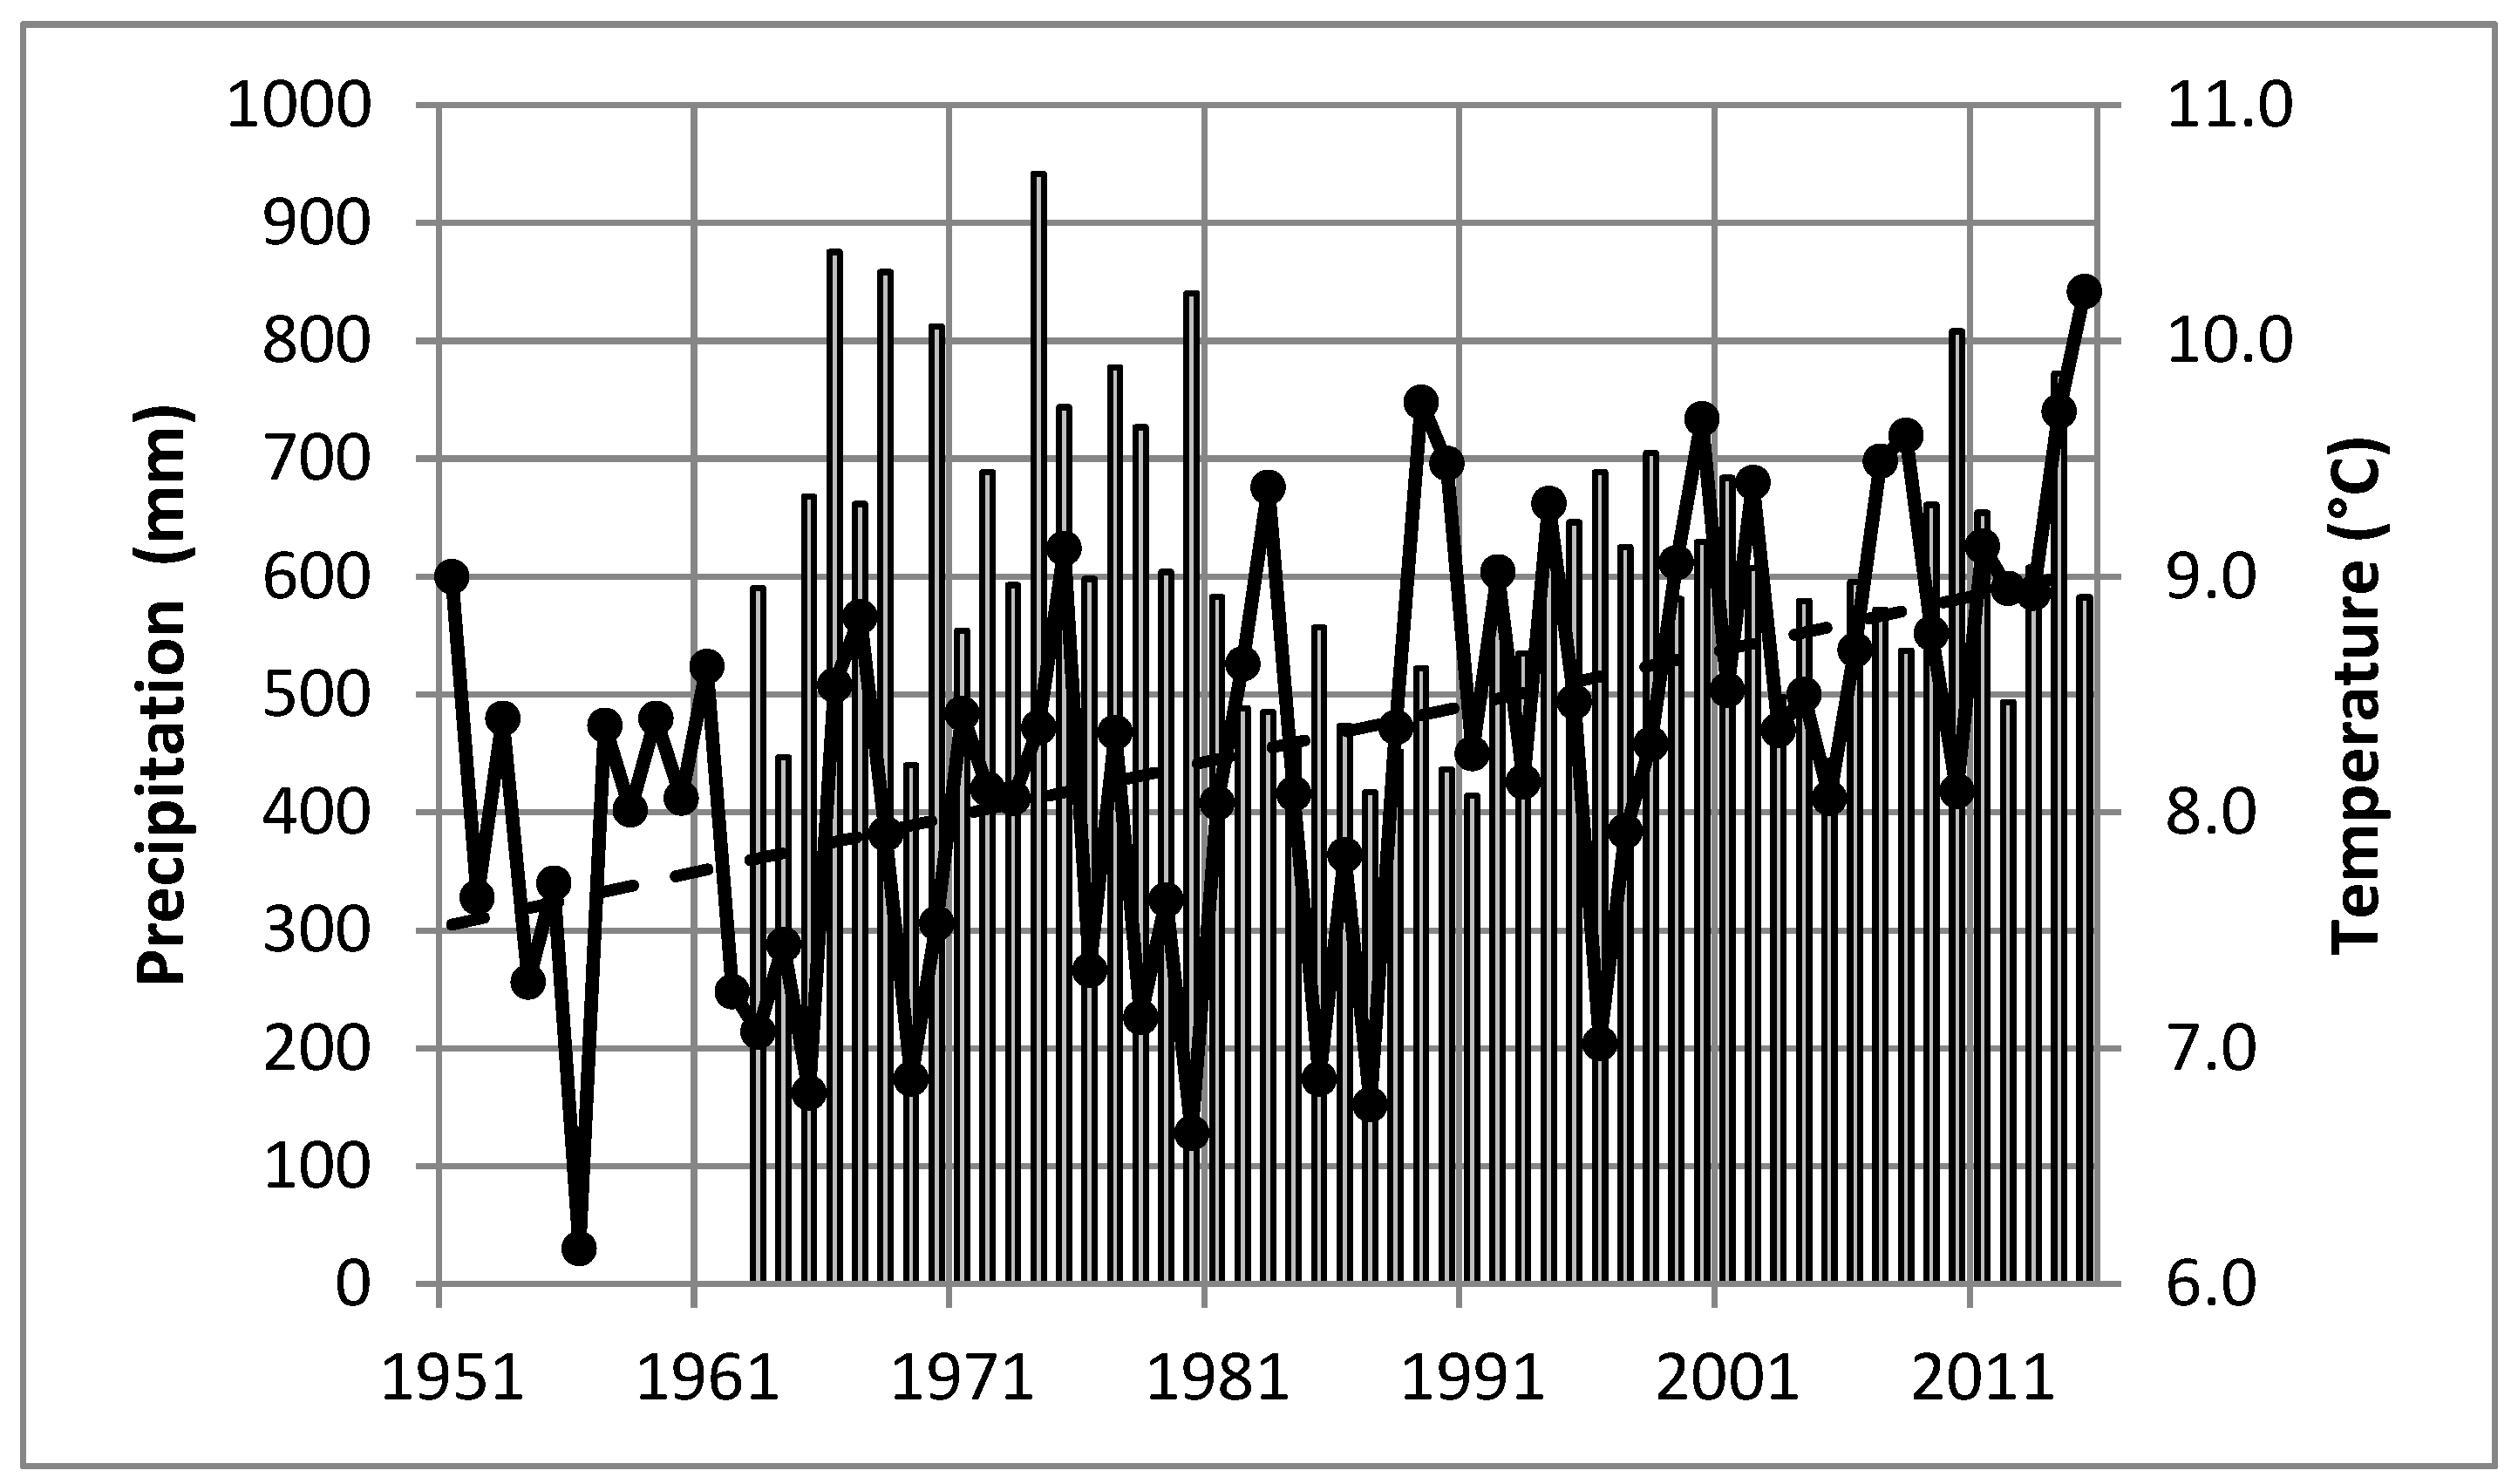
Specifically, trends in temperature were investigated in four sub-periods: 1951–2015 (full dataset for Puławy station, i.e., 65 years), 1963–2015 (which corresponds to the length of the dataset available for precipitation and discharge records, i.e., 53 years), 1951–1980 (first part of the dataset, i.e., 30 years) and 1981–2015 (second part of the dataset, i.e., 35 years). Although no change was found for the period 1951–1980, for all other periods a significant increase was estimated. This is in agreement with general temperature trends estimated for Poland based on the years 1951–2000 [29]. One reason for no trend observed in the first period, 1951–1980, could be that this period, with an average temperature of 7.8 °C, was by 0.6 °C cooler than the period 1981–2015 (average temperature equal to 8.4 °C). In the period 1981–2015, the mean annual daily temperature was increasing by 0.03 °C∙year−1, whereas the total rise of the average temperature during 65 years was estimated as 1.5 °C (see Figure 4). We also found the natural variations observed in annual temperatures to be regular, i.e., hot and cooler years were alternating. However, since the beginning of 1980s both of these cycles (hotter and cooler) have been getting warmer. The last two decades of the 20th century and the first decade of the 21st century are also considered to be the warmest decades in the 230-year history of meteorological observations conducted by IMGW-PIB at the meteorological station in Warsaw [30].
In contrast to the temperature, no clear changes were detected for annual precipitation and for maximum summer rainfall. However, fluctuations of dry and wet periods could still be observed, as shown in Figure 4 and Figure 5. Moreover, the period 1963–1980 was estimated as wetter than the period 1981–2015, with the average annual total precipitation equal to 690 mm and 572 mm, respectively. No significant trend found for precipitation over the entire analyzed period may indicate that either this trend was not present or the data length was still too short to clearly identify a significant trend [31]. These findings are in agreement with other trend studies conducted for Poland that also did not show any trends in annual precipitation totals over the period 1951–2000 [29,32]. Similarly to annual precipitation totals, no trends were found for the maximum summer one-, two-and three-days’ rainfall.
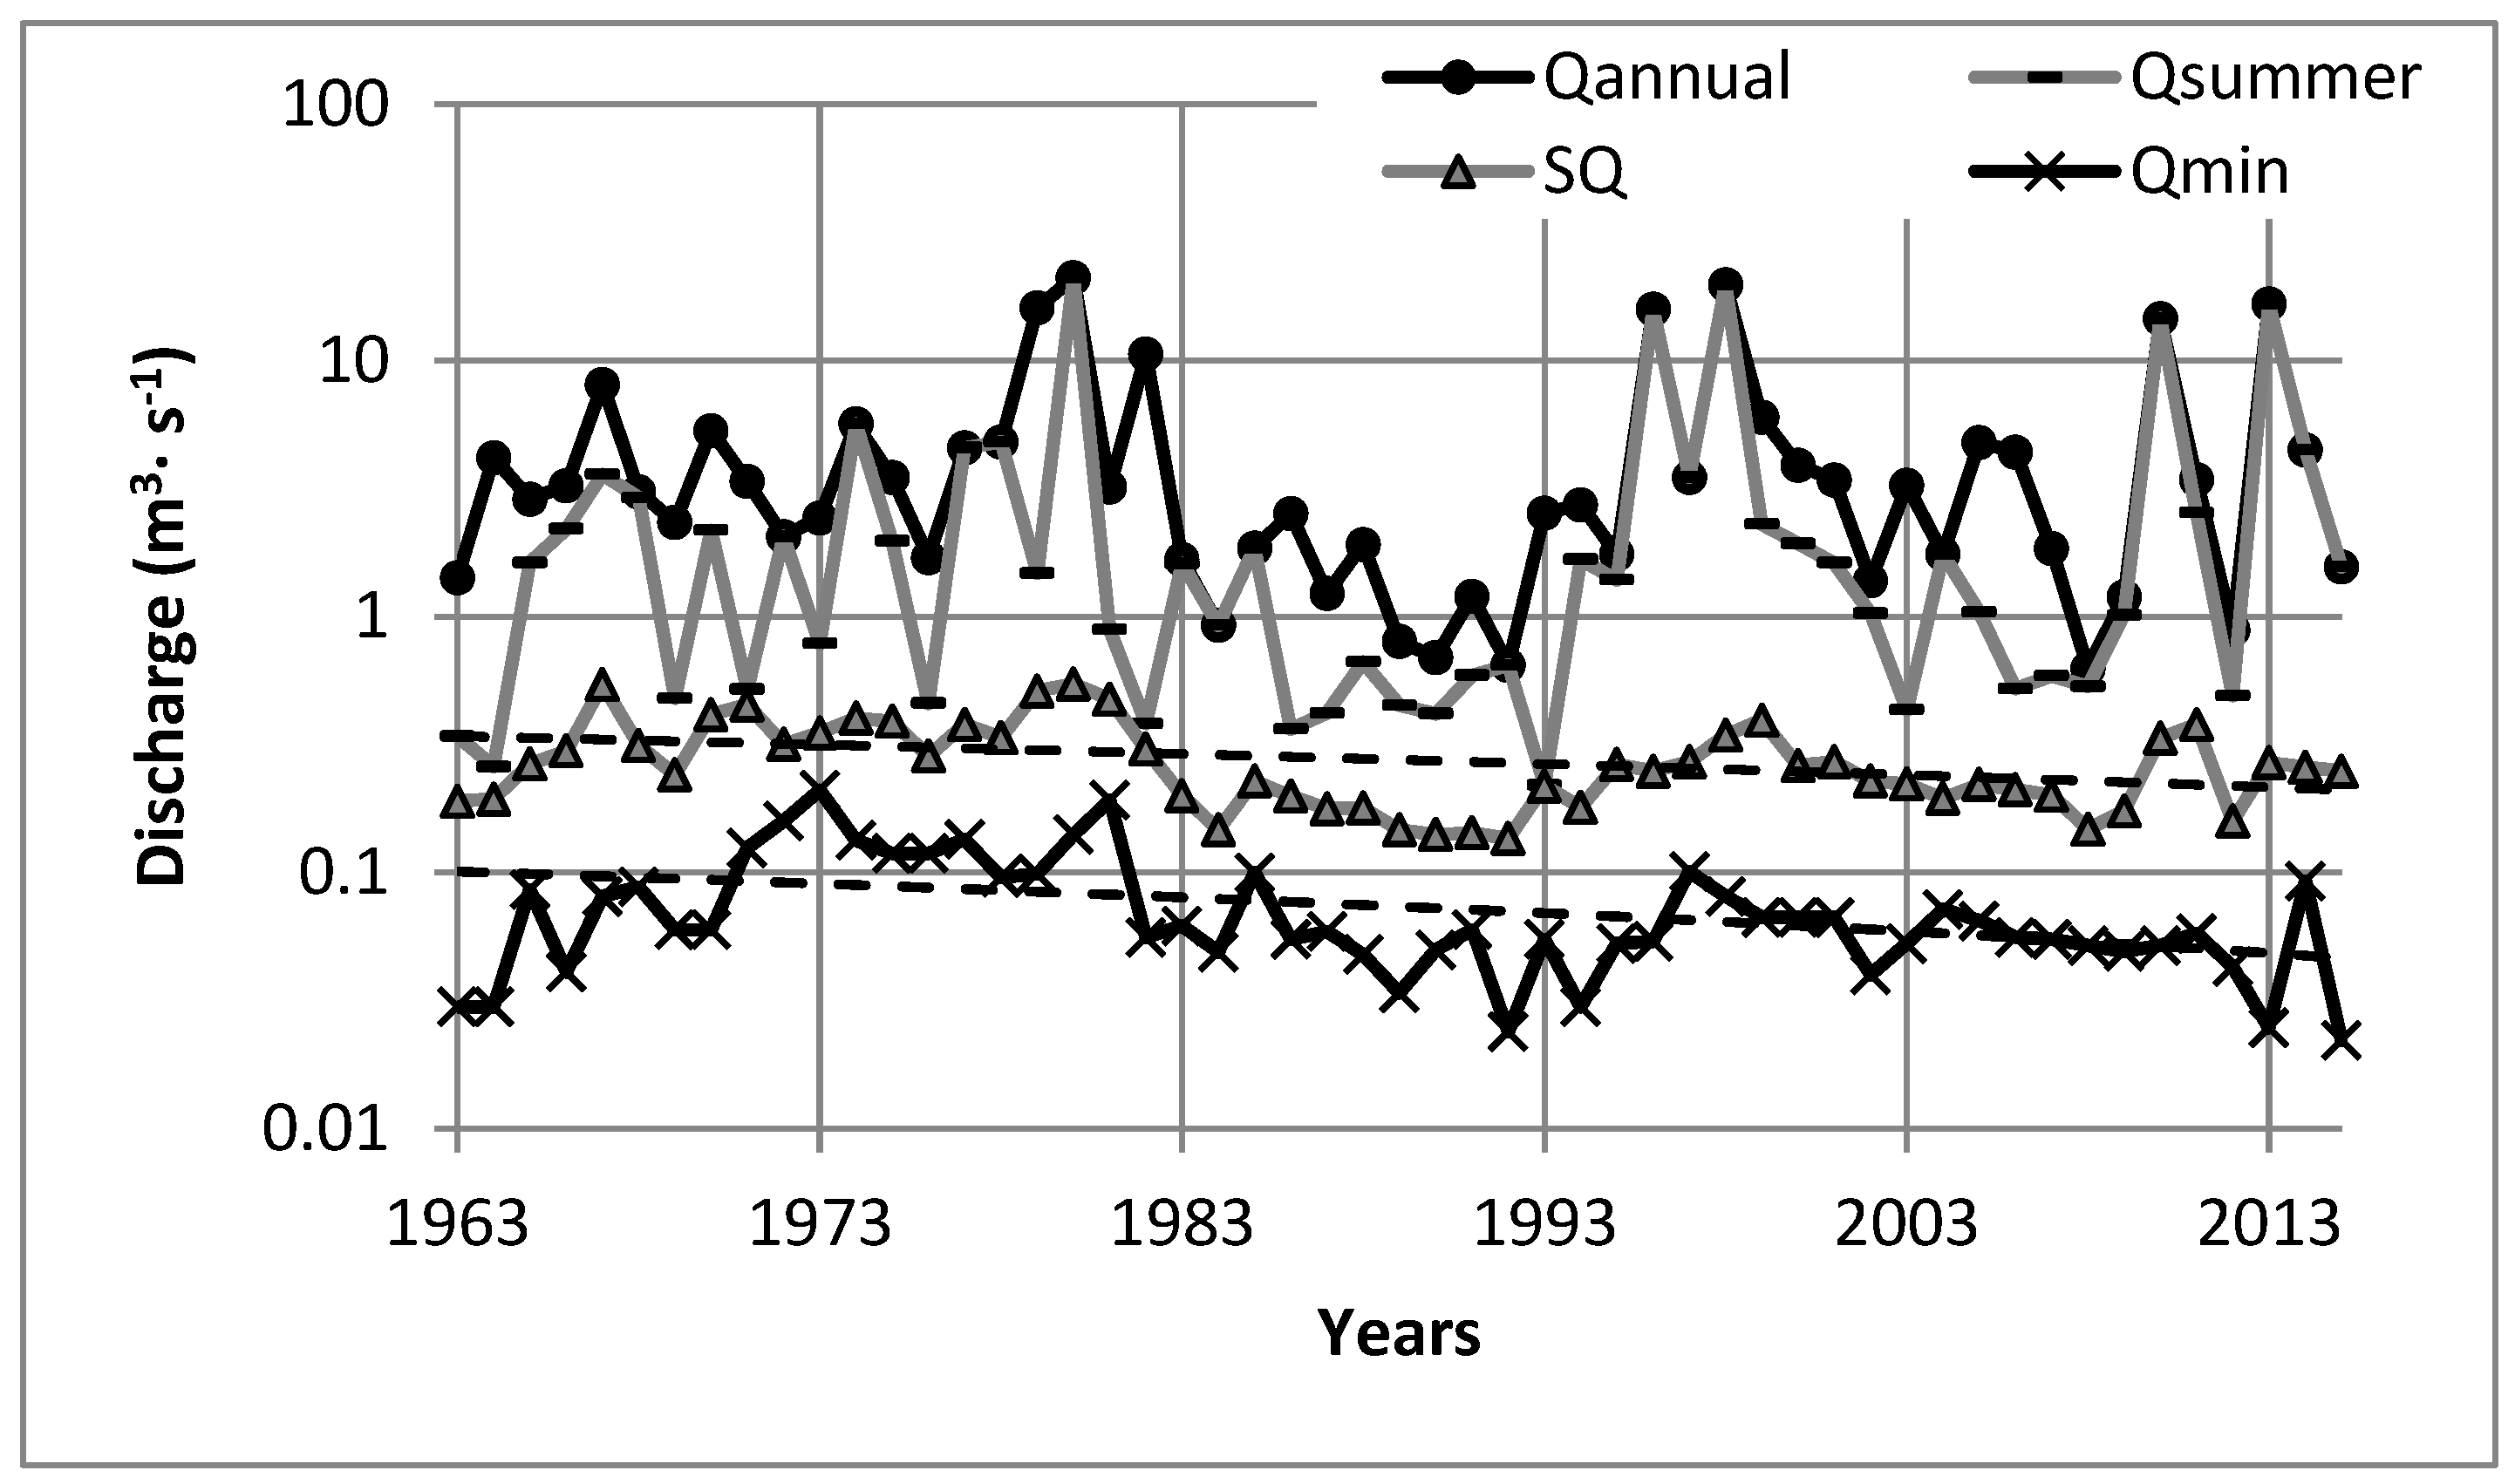
These two meteorological variables (precipitation and temperature) have a relevant impact on the hydrological cycle. An increase in the air temperature causes potentially a higher evaporation rate (not analyzed in this study). A higher evaporation rate together with relatively lower precipitation totals (based on the comparison between two studied periods, i.e., 1963–1980 and 1981–2015) are expected to decrease river flows in this watershed. Based on our results, although no significant trend could be estimated for the maximum annual discharge, the mean annual and minimum annual discharges were significantly decreasing by 2.5 L s−1 per year (about 1% of the mean annual discharge) and 1.1 L s−1 per year, respectively (see Figure 6). It can be seen from Figure 6 that these changes, similar to the changes observed in the air temperature, seem to begin in the 1980s. These findings indicate that the observed increase in the air temperature in this watershed affected particularly low-to-mean flow conditions, both of which are critical for the water availability from ecological, human and economic perspectives.
It should be noted, however, that the management of the watershed has also changed over the last 40 years—see Section 2.1. Namely, arable lands have been left partially as fallow and wastelands have been transformed into woodlands (leading to an increase in forest cover of 20% over this period), and thus the water intake by trees has most likely increased. Therefore, the land-use change could potentially be, apart from the climatic change, the next significant factor affecting river flows in this watershed. Such an observed decreasing trend in the minimum annual discharge may have consequences in severe droughts, being critical for the aquatic biosphere and agriculture in this region. This finding requires, however, further investigation to exclude/confirm the influence of other factors on the discharge, e.g., irrigation, land-use changes (crop structure, aging of the forest). As the annual maximum discharges were found to be stationary, the frequency and magnitude of floods in this watershed may be assumed constant over the analyzed period.
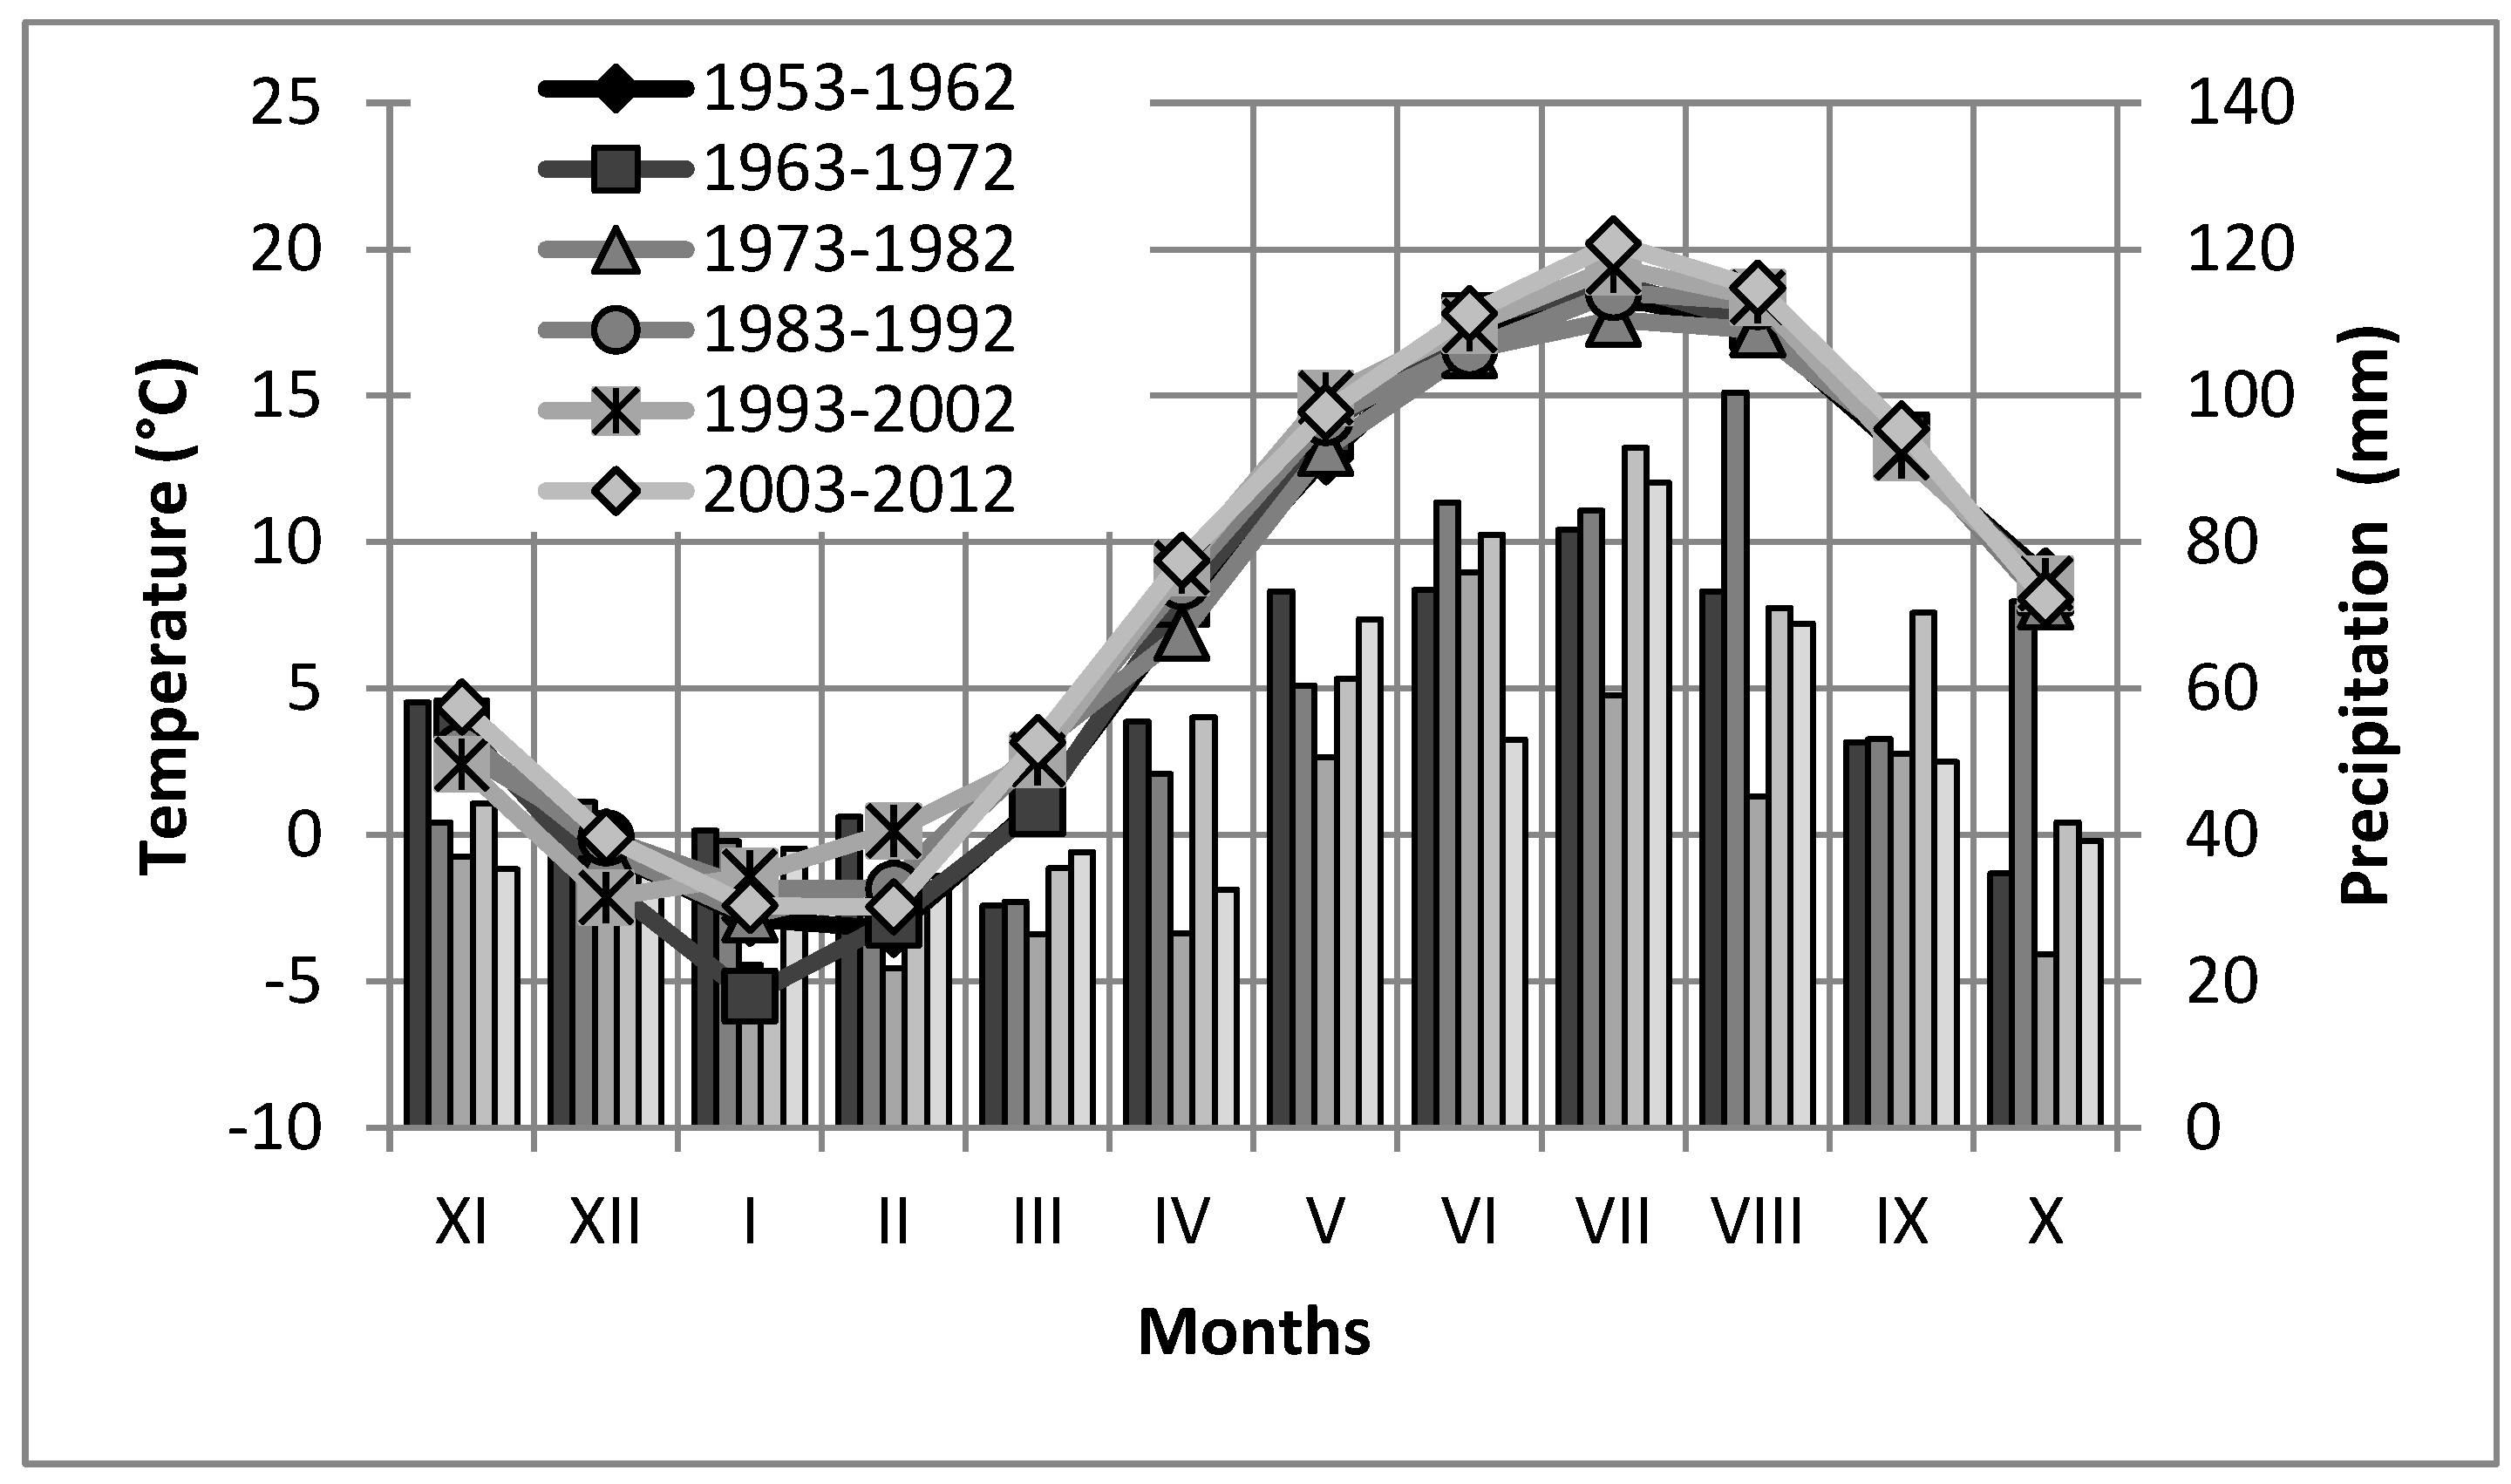
Additional insights can be gained from Figure 7 and Figure 8, which show the monthly distribution of the analyzed variables over the observation decades. Although there was no clear change in monthly values observed, similar patterns to those described above may be noticed particularly for temperature and minimum discharge. The lowest discharges simultaneously with the highest temperatures and rainfalls were observed from May to September. This period is also the most important for a balanced water resource management from an agriculture perspective, due to a high water intake in these months. Looking at river flows, the most water-rich month was March, most likely due to spring snowmelts occurring in the watershed. To face this issue with a low water availability during the agriculture season, one could consider constructing detention ponds or retention lakes along the river. Such ponds can store water during high flows occurring in early spring and release it during low flows in the late spring and summer [33,34], when more water is needed to gratify the minimum flow required for the aquatic biosphere and agricultural needs.
Overall, the results from the long-term analysis of hydro-meteorological variables in the Zagożdżonka River indicate a decrease in water resources in this watershed. In addition, results from this watershed, being a typical small lowland watershed in this region, can be deemed representative for other small lowland watersheds in Central Poland, with a similar land-use type or land-use change history over the last decades. The results also show that some changes due to climate change or land-use change may be detected in such a small watershed with already about 50 years of hydro-meteorological observations available. The distinction between the exact factor driving changes in water resources (land use or climate change), which occurred simultaneously in this watershed, was however not possible to distinguish with the variables analyzed in this study. For this purpose, additional driving factors/variables should be investigated [35] in the future study.
It has to be stressed, however, that all the analyses conducted in this study were based on the daily data only, as hourly records were not available in this watershed. This is not critical for analysis of trends in annual variables such as annual precipitation totals or annual daily air temperature. Yet, a detection of some trends may be indeed limited due to the data resolution, especially for the maximum flows or short intense summer rainfalls. Thus, further investigations are needed and should focus on analyzing variables (particularly rainfall and discharge) in shorter time steps, e.g., hourly or 10 min, if long-term data become available.
4. Conclusions
In this study, we investigated trends in climatic and hydrological variables in a small watershed, typical for Central Poland, with 53 years of observations. We generally found that such a short period already allows for detecting some changes in hydro-meteorological variables in this small watershed. These changes could be characterized by: (a) a significant increase in the mean annual air temperature on a daily basis over the period 1951–2015 (1.5 °C∙65 years−1); in the sub-period 1951–1980 no trend was detected, and in the period 1981–2015 a significant increase was observed; and (b) a significant decrease in the mean annual discharge on a daily basis (−2.5 L∙s−1∙year−1) and in the minimum annual discharge on a daily basis (−1.1 L∙s−1year−1). No significant trend could be established for the total annual precipitation, the maximum summer rainfall, or the maximum annual discharge. The observed changes could be attributed either to climatic or to land-use changes. A distinction between these two factors was, however, not possible in this study. Overall, these findings indicate that water resources are decreasing in this region, which may have serious consequences in future for natural habitats, agriculture and local communities. If the trend of decreasing water resources continues, counteracting means should be taken in order to mitigate the increasing lack of water in this watershed, particularly during the highest water intake period (agriculture season). For this purpose, we recommend constructing detention ponds, floodplains, or bioretention basins to retain water during high flows at the end of the snow melting season and to release it during low flows in late spring and summer.
Author Contributions
A.K. and A.S. designed the study. A.K. performed the analysis and wrote the first draft of the manuscript. A.S., R.R. and K.B. all contributed to reviewing and editing the final version of the manuscript.
Funding
This research was supported by the Polish Ministry of Science and Higher Education. The filed data has been collected within a few national and international research projects, and in the recent years specially: the grant from Island, Lichtenstein and Norway through the EEA Financial Mechanism and the Norwegian Financial Mechanism, the research project N N305 396238 founded by PL-National Science Center (NCN), and the research project KORANET EURRO-KPS founded by PL-National Center for Research and Development (NCBiR). The support provided by the institutions is gratefully acknowledged.
Acknowledgments
The authors would like to give special thanks to Institute of Meteorology and Water Management-National Research Institute (IMGW-PIB) for providing data on temperatures and precipitations. This study has been initiated by COST Short Term Scientific Missions COST-STSM-ES1308-30230.
Conflicts of Interest
The authors declare no conflict of interest.
References
- Andersen, T.K.; Shepherd, M.J. Floods in a Changing Climate. Geogr. Compass 2013, 17, 95–115. [Google Scholar] [CrossRef]
- Scherrer, S.; Fischer, E.; Posselt, R.; Liniger, M.; Croci-Maspoli, M.; Knutti, R. Emerging trends in heavy precipitation and hot temperature extremes in Switzerland. J. Geophys. Res. Atmos. 2016, 121, 2626–2637. [Google Scholar] [CrossRef]
- Fiener, P.; Neuhaus, P.; Botschek, J. Long-term trends in rainfall erosivity-analysis of high resolution precipitation time series (1937–2007) from Western Germany. Agric. For. Meteorol. 2013, 171, 115–123. [Google Scholar] [CrossRef]
- Villafuerte, M.; Matsumoto, J.; Akasaka, I.; Takahashi, H.; Kubota, H.; Cinco, T. Long-term trends and variability of rainfall extremes in the Philippines. Atmos. Res. 2014, 137, 1–13. [Google Scholar] [CrossRef]
- Pai, D.; Sridhar, L.; Badwaik, M.; Rajeevan, M. Analysis of the daily rainfall events over India using a new long period (1901–2010) high resolution (0.25 degrees × 0.25 degrees) gridded rainfall data set. Clim. Dyn. 2015, 45, 755–776. [Google Scholar] [CrossRef]
- Villarini, G.; Smith, J.; Baeck, M.; Vitolo, R.; Stephenson, D.; Krajewski, W. On the frequency of heavy rainfall for the Midwest of the United States. J. Hydrol. 2011, 400, 103–120. [Google Scholar] [CrossRef]
- Tolentino, P.; Poortinga, A.; Kanamaru, H.; Keesstra, S.; Maroulis, J.; David, C.; Ritsema, C. Projected Impact of Climate Change on Hydrological Regimes in the Philippines. PLoS ONE 2016, 11. [Google Scholar] [CrossRef]
- Yu, Z.; Gu, H.; Wang, J.; Xia, J.; Lu, B. Effect of projected climate change on the hydrological regime of the Yangtze River Basin, China. Stoch. Environ. Res. Risk Assess. 2018, 32, 1–16. [Google Scholar] [CrossRef]
- Cigizoglu, H.; Bayazit, M.; Onoz, B. Trends in the maximum, mean, and low flows of Turkish rivers. J. Hydrometeorol. 2005, 6, 280–290. [Google Scholar] [CrossRef]
- Banasik, K.; Hejduk, L. Long-term Changes in Runoff from a Small Agricultural Catchment. Soil Water Res. 2012, 7, 64–72. [Google Scholar] [CrossRef]
- Milly, P.; Dunne, K.; Vecchia, A. Global pattern of trends in streamflow and water availability in a changing climate. Nature 2005, 438, 347–350. [Google Scholar] [CrossRef]
- Ranzi, R.; Caronna, P.; Tomirotti, M. Impact of Climatic and Land Use Changes on River Flows in the Southern Alps. In Sustainable Water Resources Planning and Management Under Climate Change; Kolokytha, E., Oishi, S., Teegavarapu, R., Eds.; Springer: Singapore, 2017; pp. 61–83. [Google Scholar]
- Szolgayova, E.; Parajka, J.; Bloschl, G.; Bucher, C. Long term variability of the Danube River flow and its relation to precipitation and air temperature. J. Hydrol. 2014, 519, 871–880. [Google Scholar] [CrossRef]
- Su, L.; Miao, C.; Kong, D.; Duan, Q.; Lei, X.; Hou, Q.; Li, H. Long-term trends in global river flow and the causal relationships between river flow and ocean signals. J. Hydrol. 2018, 563, 818–833. [Google Scholar] [CrossRef]
- Sikorska, A.; Scheidegger, A.; Banasik, K.; Rieckermann, J. Bayesian uncertainty assessment of flood predictions in ungauged urban basins for conceptual rainfall-runoff models. Hydrol. Earth Syst. Sci. 2012, 16, 1221–1236. [Google Scholar] [CrossRef] [Green Version]
- Holko, L.; Holzmann, H.; de Lima, M.; de Lima, J. Hydrological research in small catchments—An approach to improve knowledge on hydrological processes and global change impacts. J. Hydrol. Hydromech. 2015, 63, 181–182. [Google Scholar] [CrossRef]
- Dery, S.; Stahl, K.; Moore, R.; Whitfield, P.; Menounos, B.; Burford, J. Detection of runoff timing changes in pluvial, nival, and glacial rivers of western Canada. Water Resour. Res. 2009, 45. [Google Scholar] [CrossRef] [Green Version]
- Banasik, K. Land use Effect on Watershed Sediment Yield. Ph.D. Thesis, Warsaw University of Life Sciences-SGGW, Warsaw, Poland, 1983. [Google Scholar]
- Wasilewicz, M.; Hejduk, A.; Kaznowska, E.; Glegoła, M. Zmiany użytkowania małej zlewni nizinnej w ostatnich 45 latach w kontekście obserwowanych wieloletnich zmian odpływu (Changes in the landuse structure of a small lowland catchment in the last 45 years). In Proceedings of the 3rd National Hydrological Congress, WULS-SGGW, Warsaw, Poland, 21 September 2018. [Google Scholar]
- Kurowska-Łazarz, R.; Szulc, W.; Woźniak, B.; Piotrowska, M.; Drożdżyńska, J. Vademecum. Pomiary i Obserwacje Meteorologiczne; IMGW-PIB: Warsaw, Poland, 2015; pp. 9–23. [Google Scholar]
- Szumiejko, F.; Wdowikowski, M.; Hański, A.; Kańska, A.; Mielke, M.; Aneszko, J.; Jankowska, I.; Wydrych, M. Vadeemecum. Pomiary i Obserwacje Hydrologiczne; IMGW-PIB: Warsaw, Poland, 2015; pp. 13–31. [Google Scholar]
- Banasik, K.; Walling, D. Predicting sedimentgraphs for a small agricultural catchment. Nordic Hydrol. 1996, 27, 275–294. [Google Scholar] [CrossRef]
- Banasik, K.; Gorski, D.; Popek, Z.; Hejduk, L. Estimating the annual sediment yield of a small agricultural catchment in central Poland. In Erosion and Sediment Yields in the Changing Environment; Collins, A.V.G., Horowitz, A.X.L., Stone, M., Walling, D., Eds.; IAHS Publ.: Wallingford, UK, 2012; Volume 256, pp. 267–275. [Google Scholar]
- Banasik, K.; Hejduk, L.; Hejduk, A.; Kaznowska, E.; Banasik, J.; Byczkowski, A. Long-term variability of runoff from a small catchment in the region of the Kozienice Forest. Sylwan 2013, 157, 578–586. [Google Scholar]
- Banasik, K.; Hejduk, A. Ratio of basin lag times for runoff and sediment yield processes recorded in various environments. In Sediment Dynamics from the Summit To the Sea; Xu, Y., Allison, M., Bentley, S., Collins, A., Erskine, W.V.G., Horowitz, A., Stone, M., Eds.; IAHS Publ.: Wallingford, UK, 2014; Volume 367, pp. 163–169. [Google Scholar]
- Mann, H. Nonparametric tests against trend. Econometrica 1945, 13, 245–259. [Google Scholar] [CrossRef]
- Kendall, M. Rank Correlation Measures; Charles Griffin: London, UK, 1975. [Google Scholar]
- Yue, S.; Pilon, P.; Cavadias, G. Power of the Mann-Kendall and Spearman’s rho tests for detecting monotonic trends in hydrological series. J. Hydrol. 2002, 259, 254–271. [Google Scholar] [CrossRef]
- Deirmendzic, J.; Kozuchowski, K.; Zmudzka, E. Changes of air temperature and precipitation in Poland in the period 1951–2000 and their relationship to atmospheric circulation. Int. J. Climatol. 2004, 24, 291–310. [Google Scholar] [CrossRef] [Green Version]
- Adaptation to Climate Change. Available online: http://klimada.mos.gov.pl/ (accessed on 1 October 2018).
- Wilby, R.; Beven, K.; Reynard, N. Climate change and fluvial flood risk in the UK: more of the same? Hydrol. Process. 2008, 22, 2511–2523. [Google Scholar] [CrossRef]
- Pińskwar, I.; Choryński, A.; Graczyk, D.; Kundzewicz, Z.W. Observed changes in extreme precipitation in Poland: 1991–2015 versus 1961–1990. Theor. Appl. Climatol. 2018. [Google Scholar] [CrossRef]
- Krajewski, A.; Sikorska, A.; Banasik, K. Modeling Suspended Sediment Concentration in the Stormwater Outflow from a Small Detention Pond. J. Environ. Eng. 2017, 143. [Google Scholar] [CrossRef]
- Krajewski, A.; Banasik, K.; Sikorska, A. Stormflow and suspended sediment routing through a small detention pond with uncertain discharge rating curves. Hydrol. Res. 2019. [Google Scholar] [CrossRef]
- Dey, P.; Mishra, A. Separating the impacts of climate change and human activities on streamflow: A review of methodologies and critical assumptions. J. Hydrol. 2017, 548, 278–290. [Google Scholar] [CrossRef]
Figure 1.
Locality map of the Zagożdżonka River watershed.

Figure 2.
View of the gauging station at Płachty Stare (photo is looking downstream during an average flow period in April 2015).
Figure 2.
View of the gauging station at Płachty Stare (photo is looking downstream during an average flow period in April 2015).

Figure 3.
Rating curve for gauging station Płachty Stare for 2011–2013 (the dots are water stage-discharge values of the hydrometric measurements conducted in 2010–2014).
Figure 3.
Rating curve for gauging station Płachty Stare for 2011–2013 (the dots are water stage-discharge values of the hydrometric measurements conducted in 2010–2014).

Figure 4.
Mean annual air temperature at the Puławy station in the period 1951–2015 (increasing trend) and total annual precipitation in the watershed of Zagożdżonka River in the period 1963–2015 (no trend).
Figure 4.
Mean annual air temperature at the Puławy station in the period 1951–2015 (increasing trend) and total annual precipitation in the watershed of Zagożdżonka River in the period 1963–2015 (no trend).

Figure 5.
Maximum one-, two-, and three-days’ rainfall in the watershed of Zagożdżonka river in the period 1963–2015; no trend in data series detected.
Figure 5.
Maximum one-, two-, and three-days’ rainfall in the watershed of Zagożdżonka river in the period 1963–2015; no trend in data series detected.

Figure 6.
Maximum annual (Qannual), maximum summer (Qsummer), mean annual (SQ) and minimum annual (Qmin) discharge for the Zagożdżonka watershed upstream of the Płachty gauge station in the period 1963–2015; significant decreasing trends in SQ and Qmin.
Figure 6.
Maximum annual (Qannual), maximum summer (Qsummer), mean annual (SQ) and minimum annual (Qmin) discharge for the Zagożdżonka watershed upstream of the Płachty gauge station in the period 1963–2015; significant decreasing trends in SQ and Qmin.

Figure 7.
Average monthly precipitation (bars) and air temperature (lines) in selected decades.

Figure 8.
Average monthly (solid lines) and minimum average discharge (dashed lines) in selected decades.
Figure 8.
Average monthly (solid lines) and minimum average discharge (dashed lines) in selected decades.


Table 1.
Statistics of the analyzed hydro-meteorological variables.
| Station | Variable | Observation Years (Number of Data Points) | Range | Mean | Standard Deviation | Normalized Test Z Statistic in Equation (1) | Trend (at the Significance Level α = 0.05) | Values of Parameters in Equation (5) | Coefficient of Determination for Equation (5) |
|---|---|---|---|---|---|---|---|---|---|
| 1 | 2 | 3 | 4 | 5 | 6 | 7 | 8 | 9 | 10 |
| Puławy | T | 1951–1980 (30) | 6.2–9.4 | 7.8 | 0.72 | −0.57 | no trend | - | - |
| 1981–2015 (35) | 6.6–10.2 | 8.4 | 0.88 | 2.56 | increasing | a = 0.0340, b = 59.3 | 0.179 | ||
| 1963–2015 (53) | 6.6–10.2 | 8.4 | 0.83 | 4.05 | increasing | a = 0.0318, b=54.8 | 0.305 | ||
| 1951–2015 (65) | 6.2–10.2 | 8.1 | 0.83 | 4.00 | increasing | a = 0.0234, b = 38.1 | 0.252 | ||
| Płachty | Qannual | 0.628–21.0 | 4.58 | 4.96 | −0.63 | no trend | - | - | |
| Qsummer | 1963–2015 (53) | 0.220–21.0 | 3.043 | 4.90 | 0.47 | no trend | - | - | |
| SQ | 0.136–0.545 | 0.276 | 0.106 | −2.21 | decreasing | a = −0.00250, b = 5.27 | 0.132 | ||
| Qmin | 0.022–0.210 | 0.074 | 0.041 | −2.75 | decreasing | a = −0.00110, b = 2.17 | 0.157 | ||
| Zwoleń/Czarna | P | 414–941 | 612.2 | 126.3 | −0.84 | no trend | - | - | |
| P1d | 1963–2015 (53) | 17.5–98.6 | 39.5 | 16.7 | −0.69 | no trend | - | - | |
| P2d | 24.5–105 | 49.6 | 19.6 | −0.51 | no trend | - | - | ||
| P3d | 26.2–121 | 56.9 | 23.3 | −0.58 | no trend | - | - |
T—mean annual air temperature (°C); Qannual–max. annual discharge (m3∙s−1); Qsummer–max. summer discharge (m3∙s−1); SQ—mean annual discharge (m3∙s−1); Qmin–minimum annual discharge (m3∙s−1); P—annual total precipitation (mm); P1d—max. summer one day rainfall (mm); P2d—max. summer two days rainfall (mm); P3d–max. summer three days rainfall (mm).
© 2019 by the authors. Licensee MDPI, Basel, Switzerland. This article is an open access article distributed under the terms and conditions of the Creative Commons Attribution (CC BY) license (http://creativecommons.org/licenses/by/4.0/).
Share and Cite
MDPI and ACS Style
Krajewski, A.; Sikorska-Senoner, A.E.; Ranzi, R.; Banasik, K. Long-Term Changes of Hydrological Variables in a Small Lowland Watershed in Central Poland. Water 2019, 11, 564. https://doi.org/10.3390/w11030564
AMA Style
Krajewski A, Sikorska-Senoner AE, Ranzi R, Banasik K. Long-Term Changes of Hydrological Variables in a Small Lowland Watershed in Central Poland. Water. 2019; 11(3):564. https://doi.org/10.3390/w11030564
Chicago/Turabian StyleKrajewski, Adam, Anna E. Sikorska-Senoner, Roberto Ranzi, and Kazimierz Banasik. 2019. "Long-Term Changes of Hydrological Variables in a Small Lowland Watershed in Central Poland" Water 11, no. 3: 564. https://doi.org/10.3390/w11030564
Note that from the first issue of 2016, this journal uses article numbers instead of page numbers. See further details here.