Interaction of Surface Water and Groundwater Influenced by Groundwater Over-Extraction, Waste Water Discharge and Water Transfer in Xiong’an New Area, China


Abstract
:1. Introduction
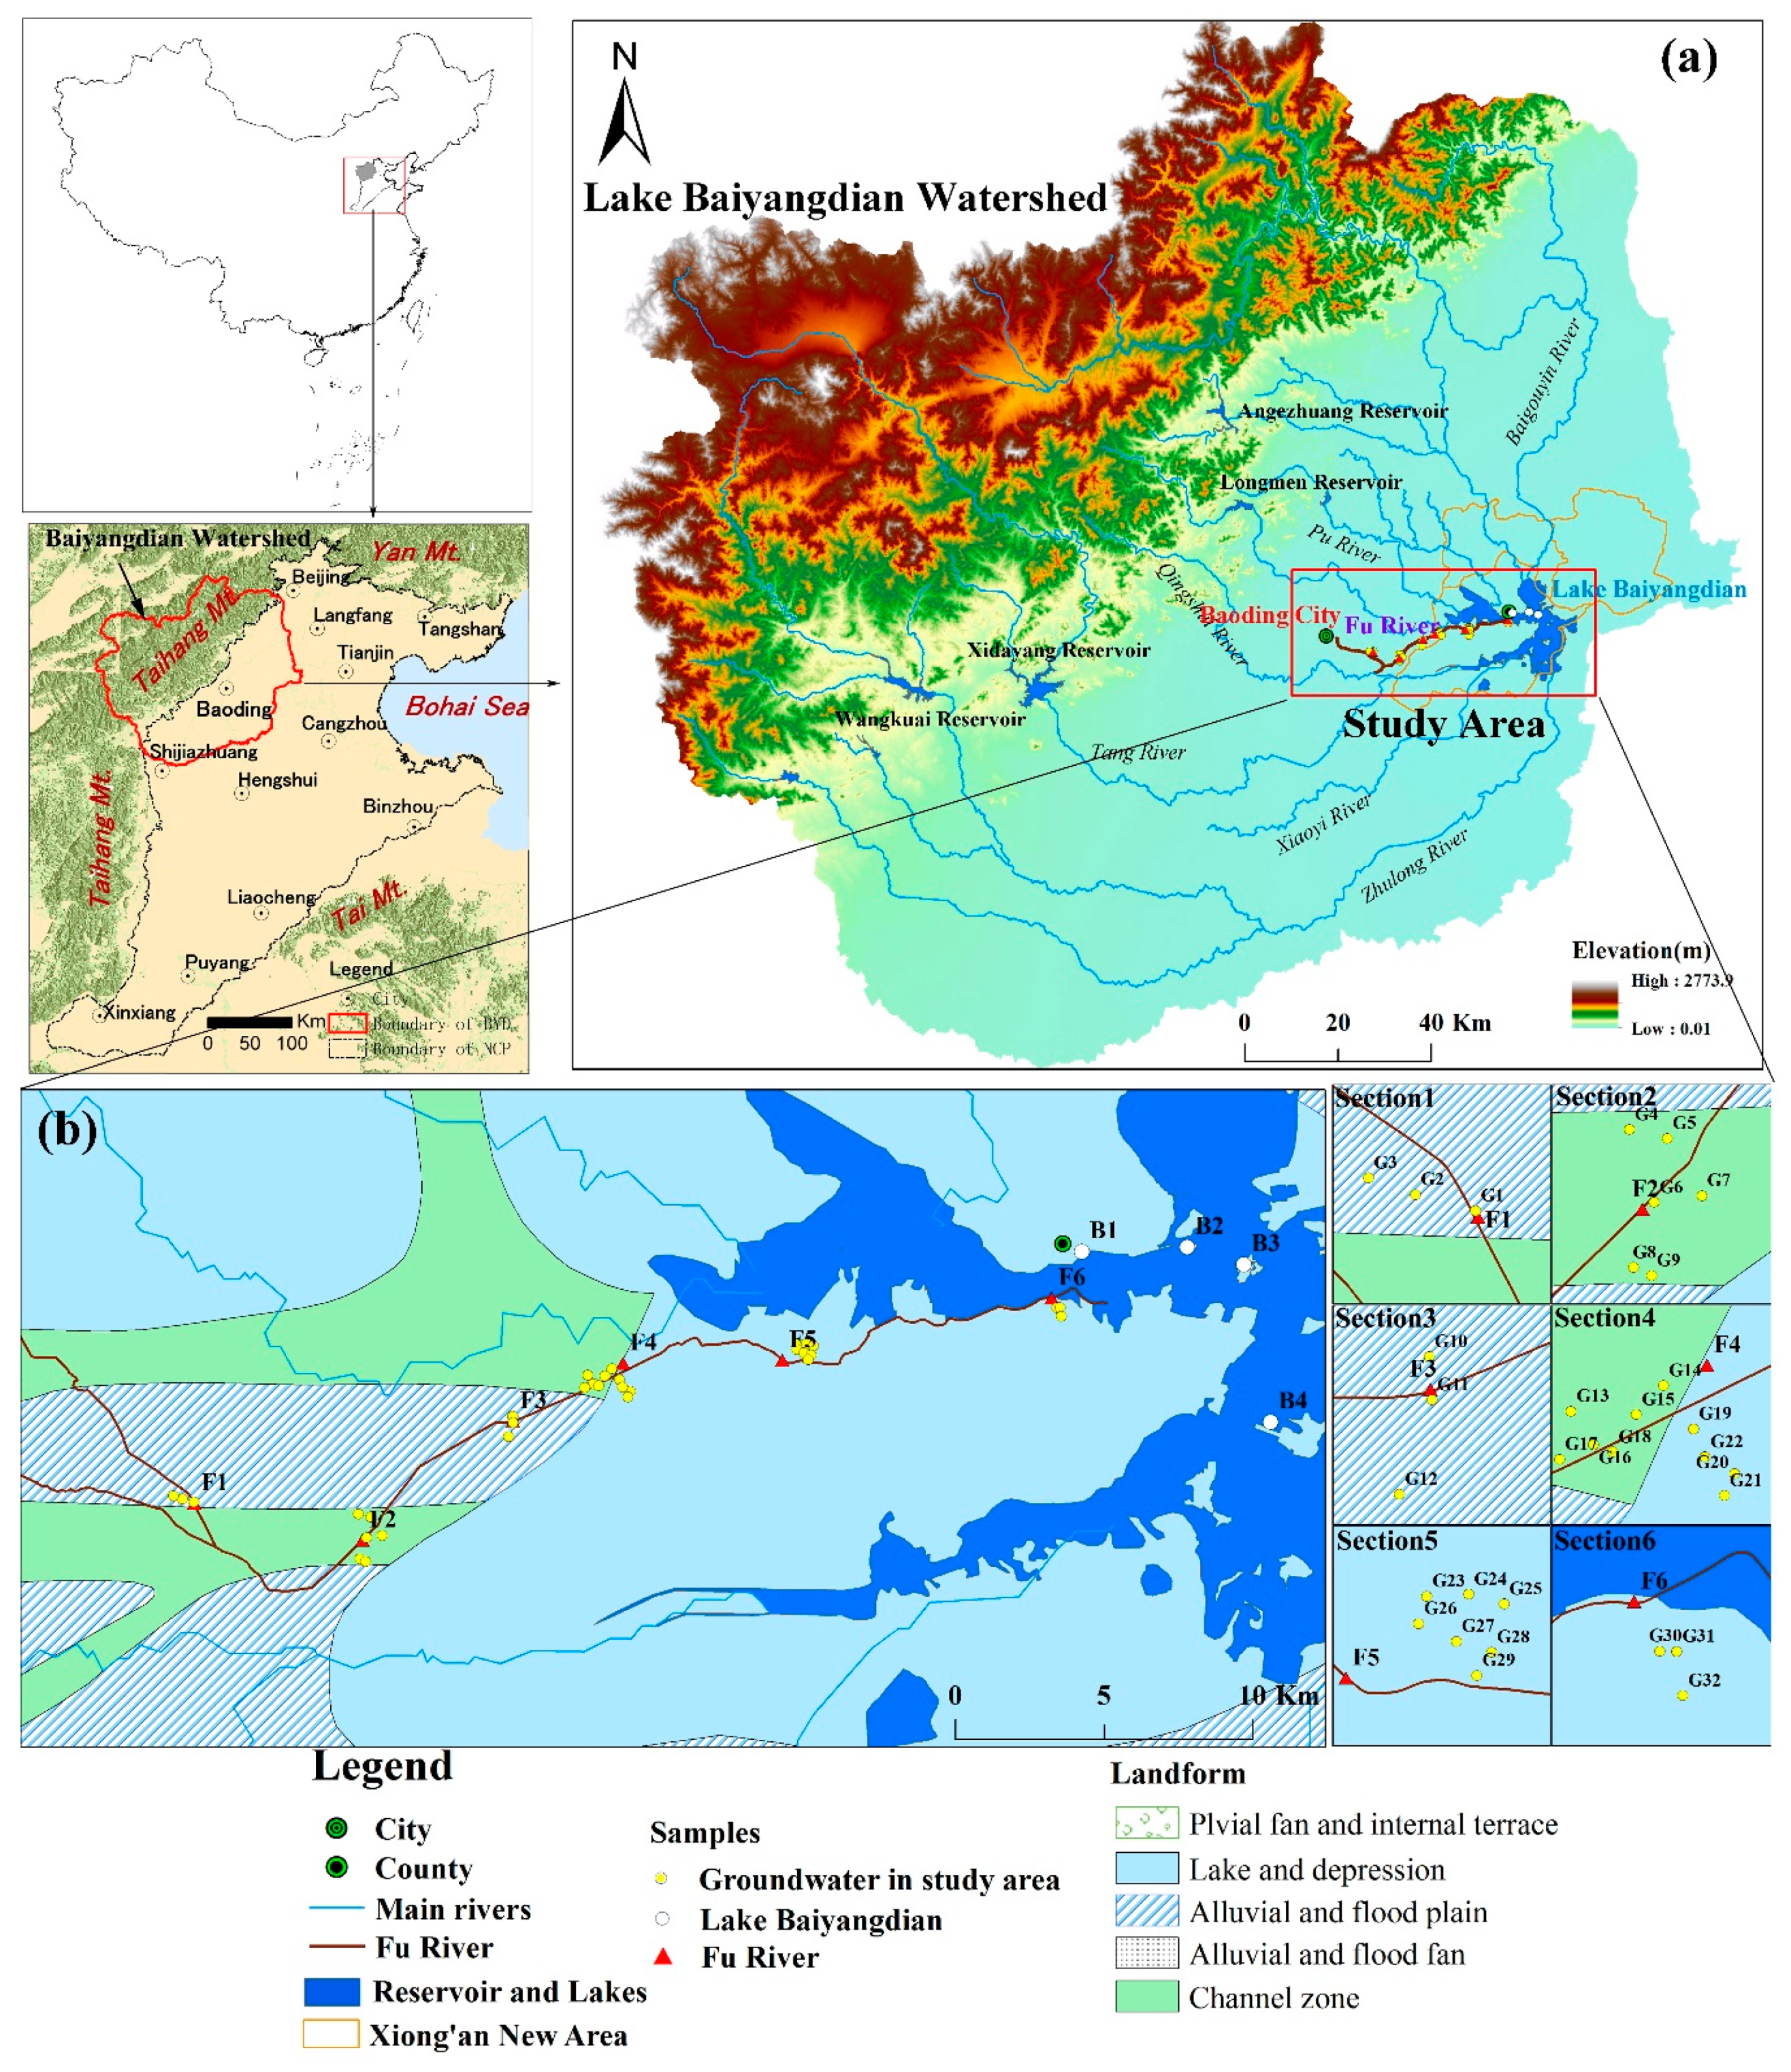
2. Study Area
2.1. Site Description
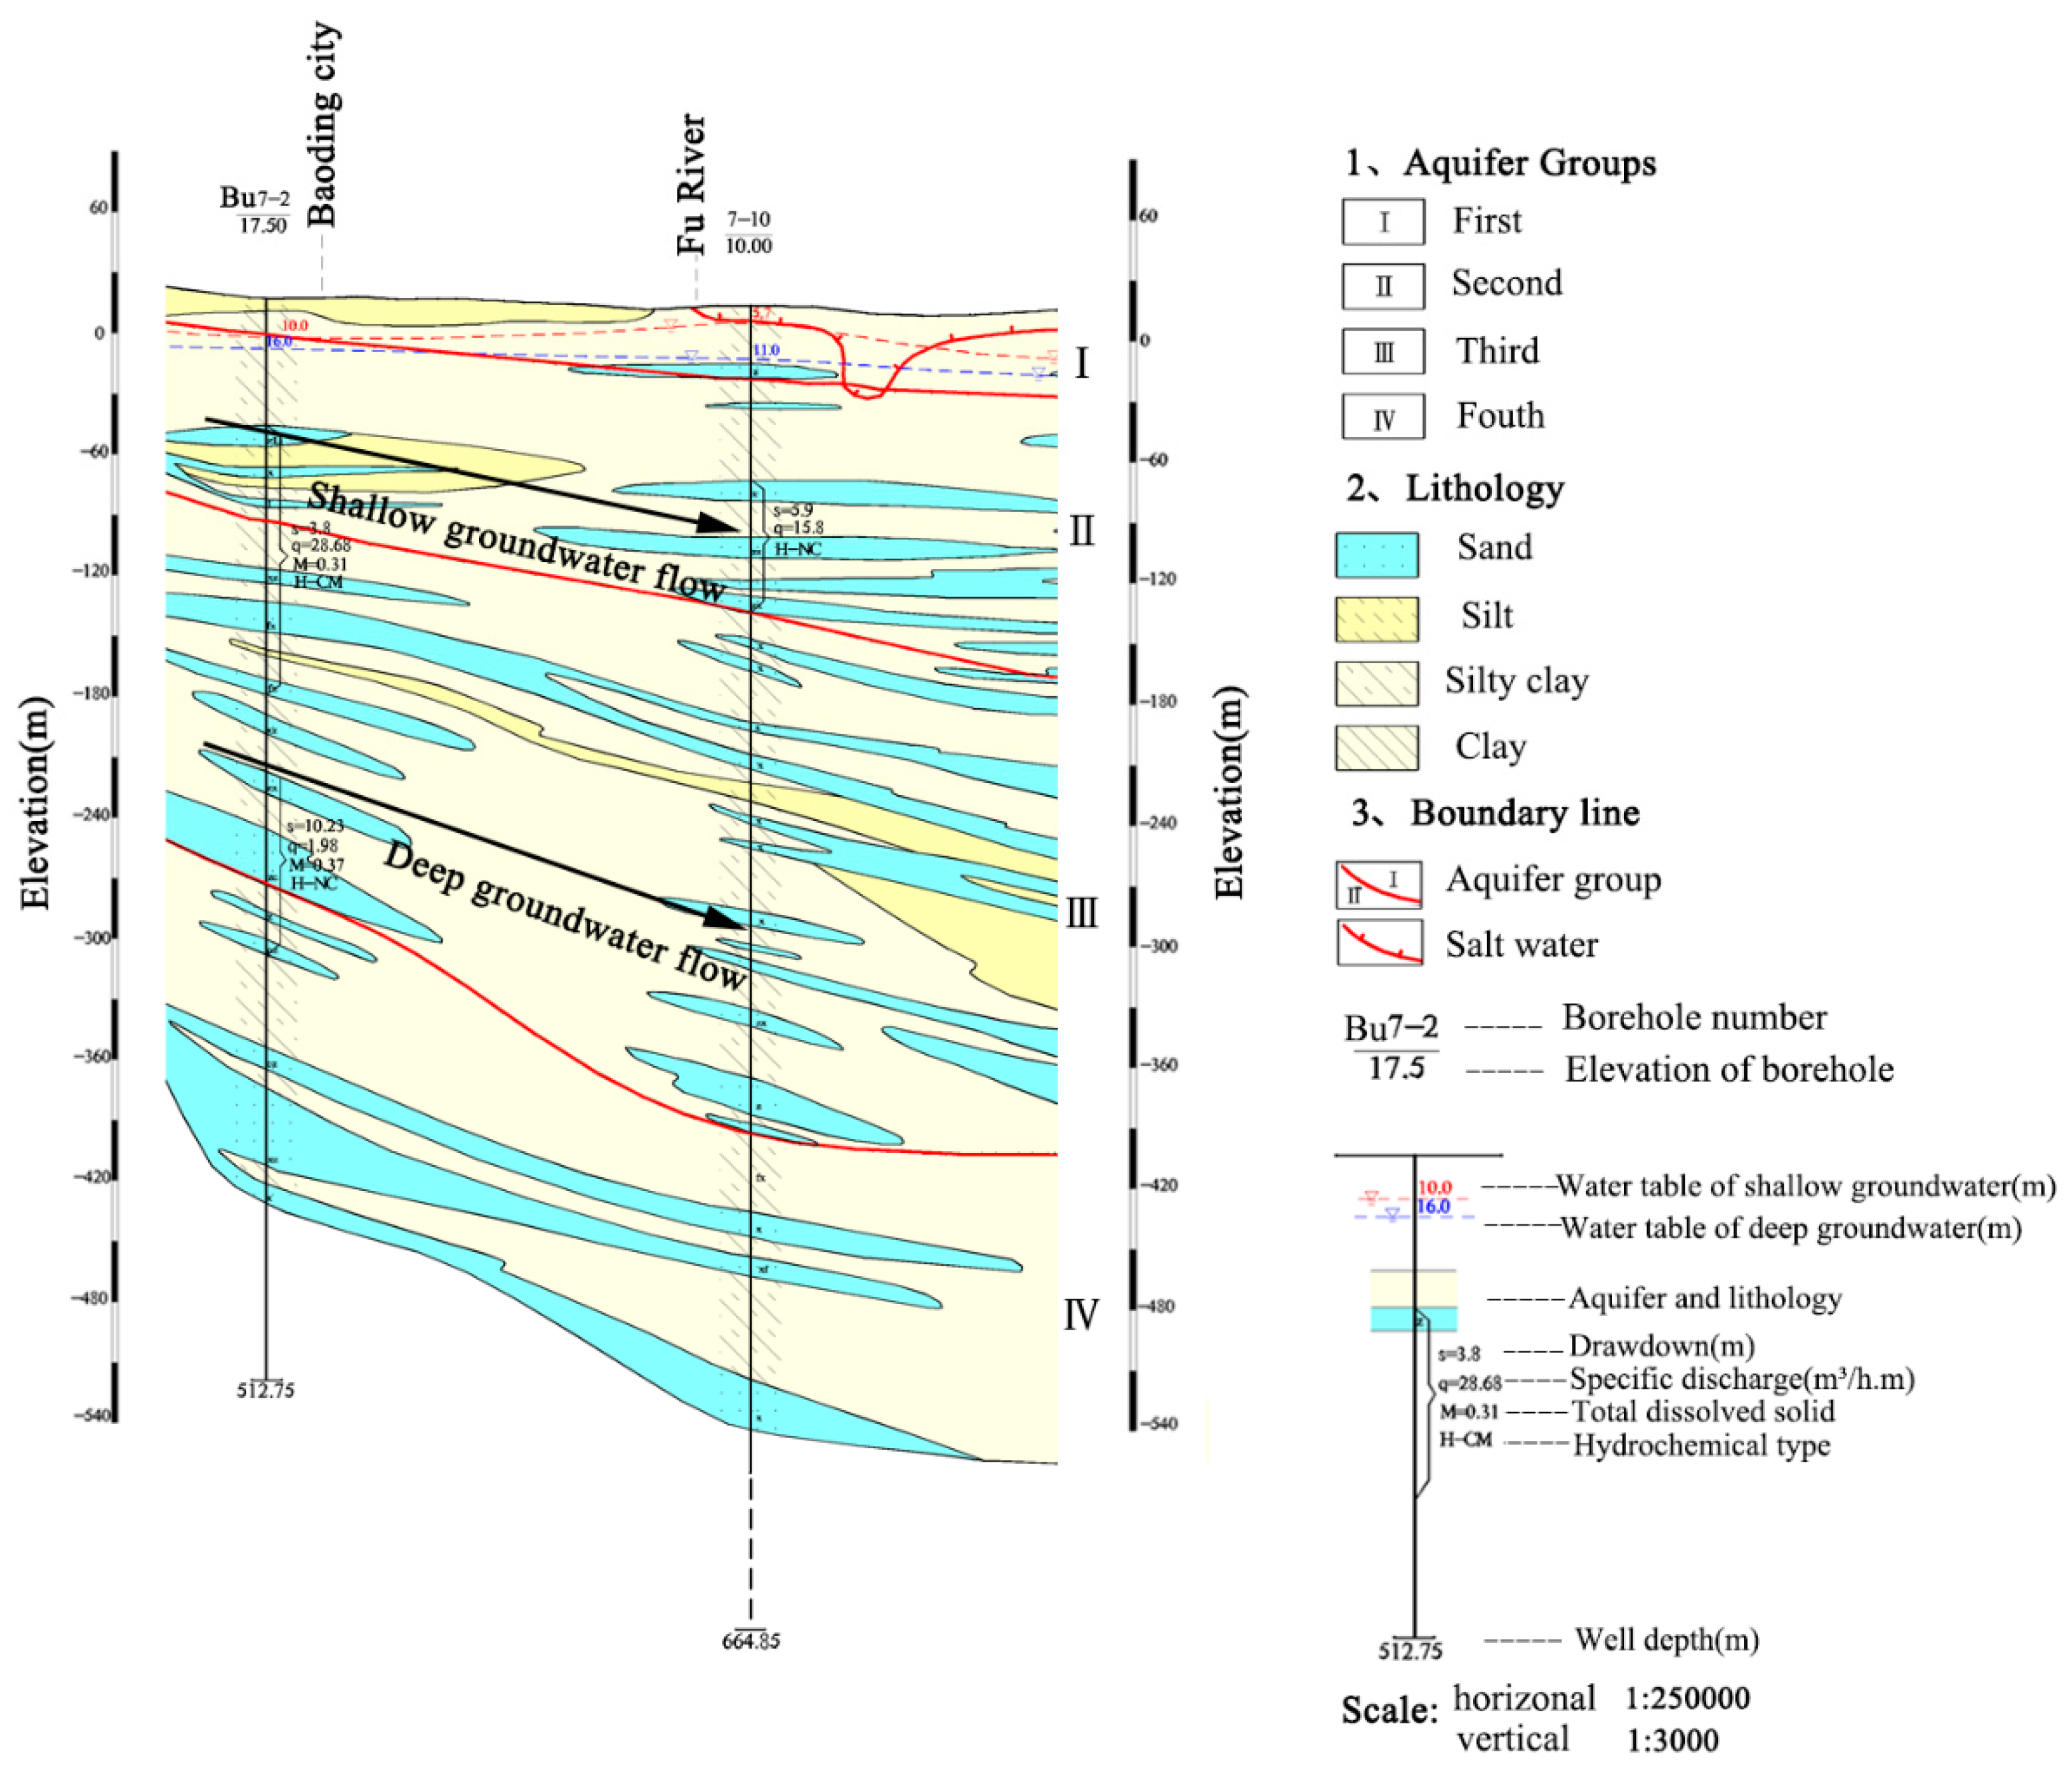
2.2. Hydrogeology
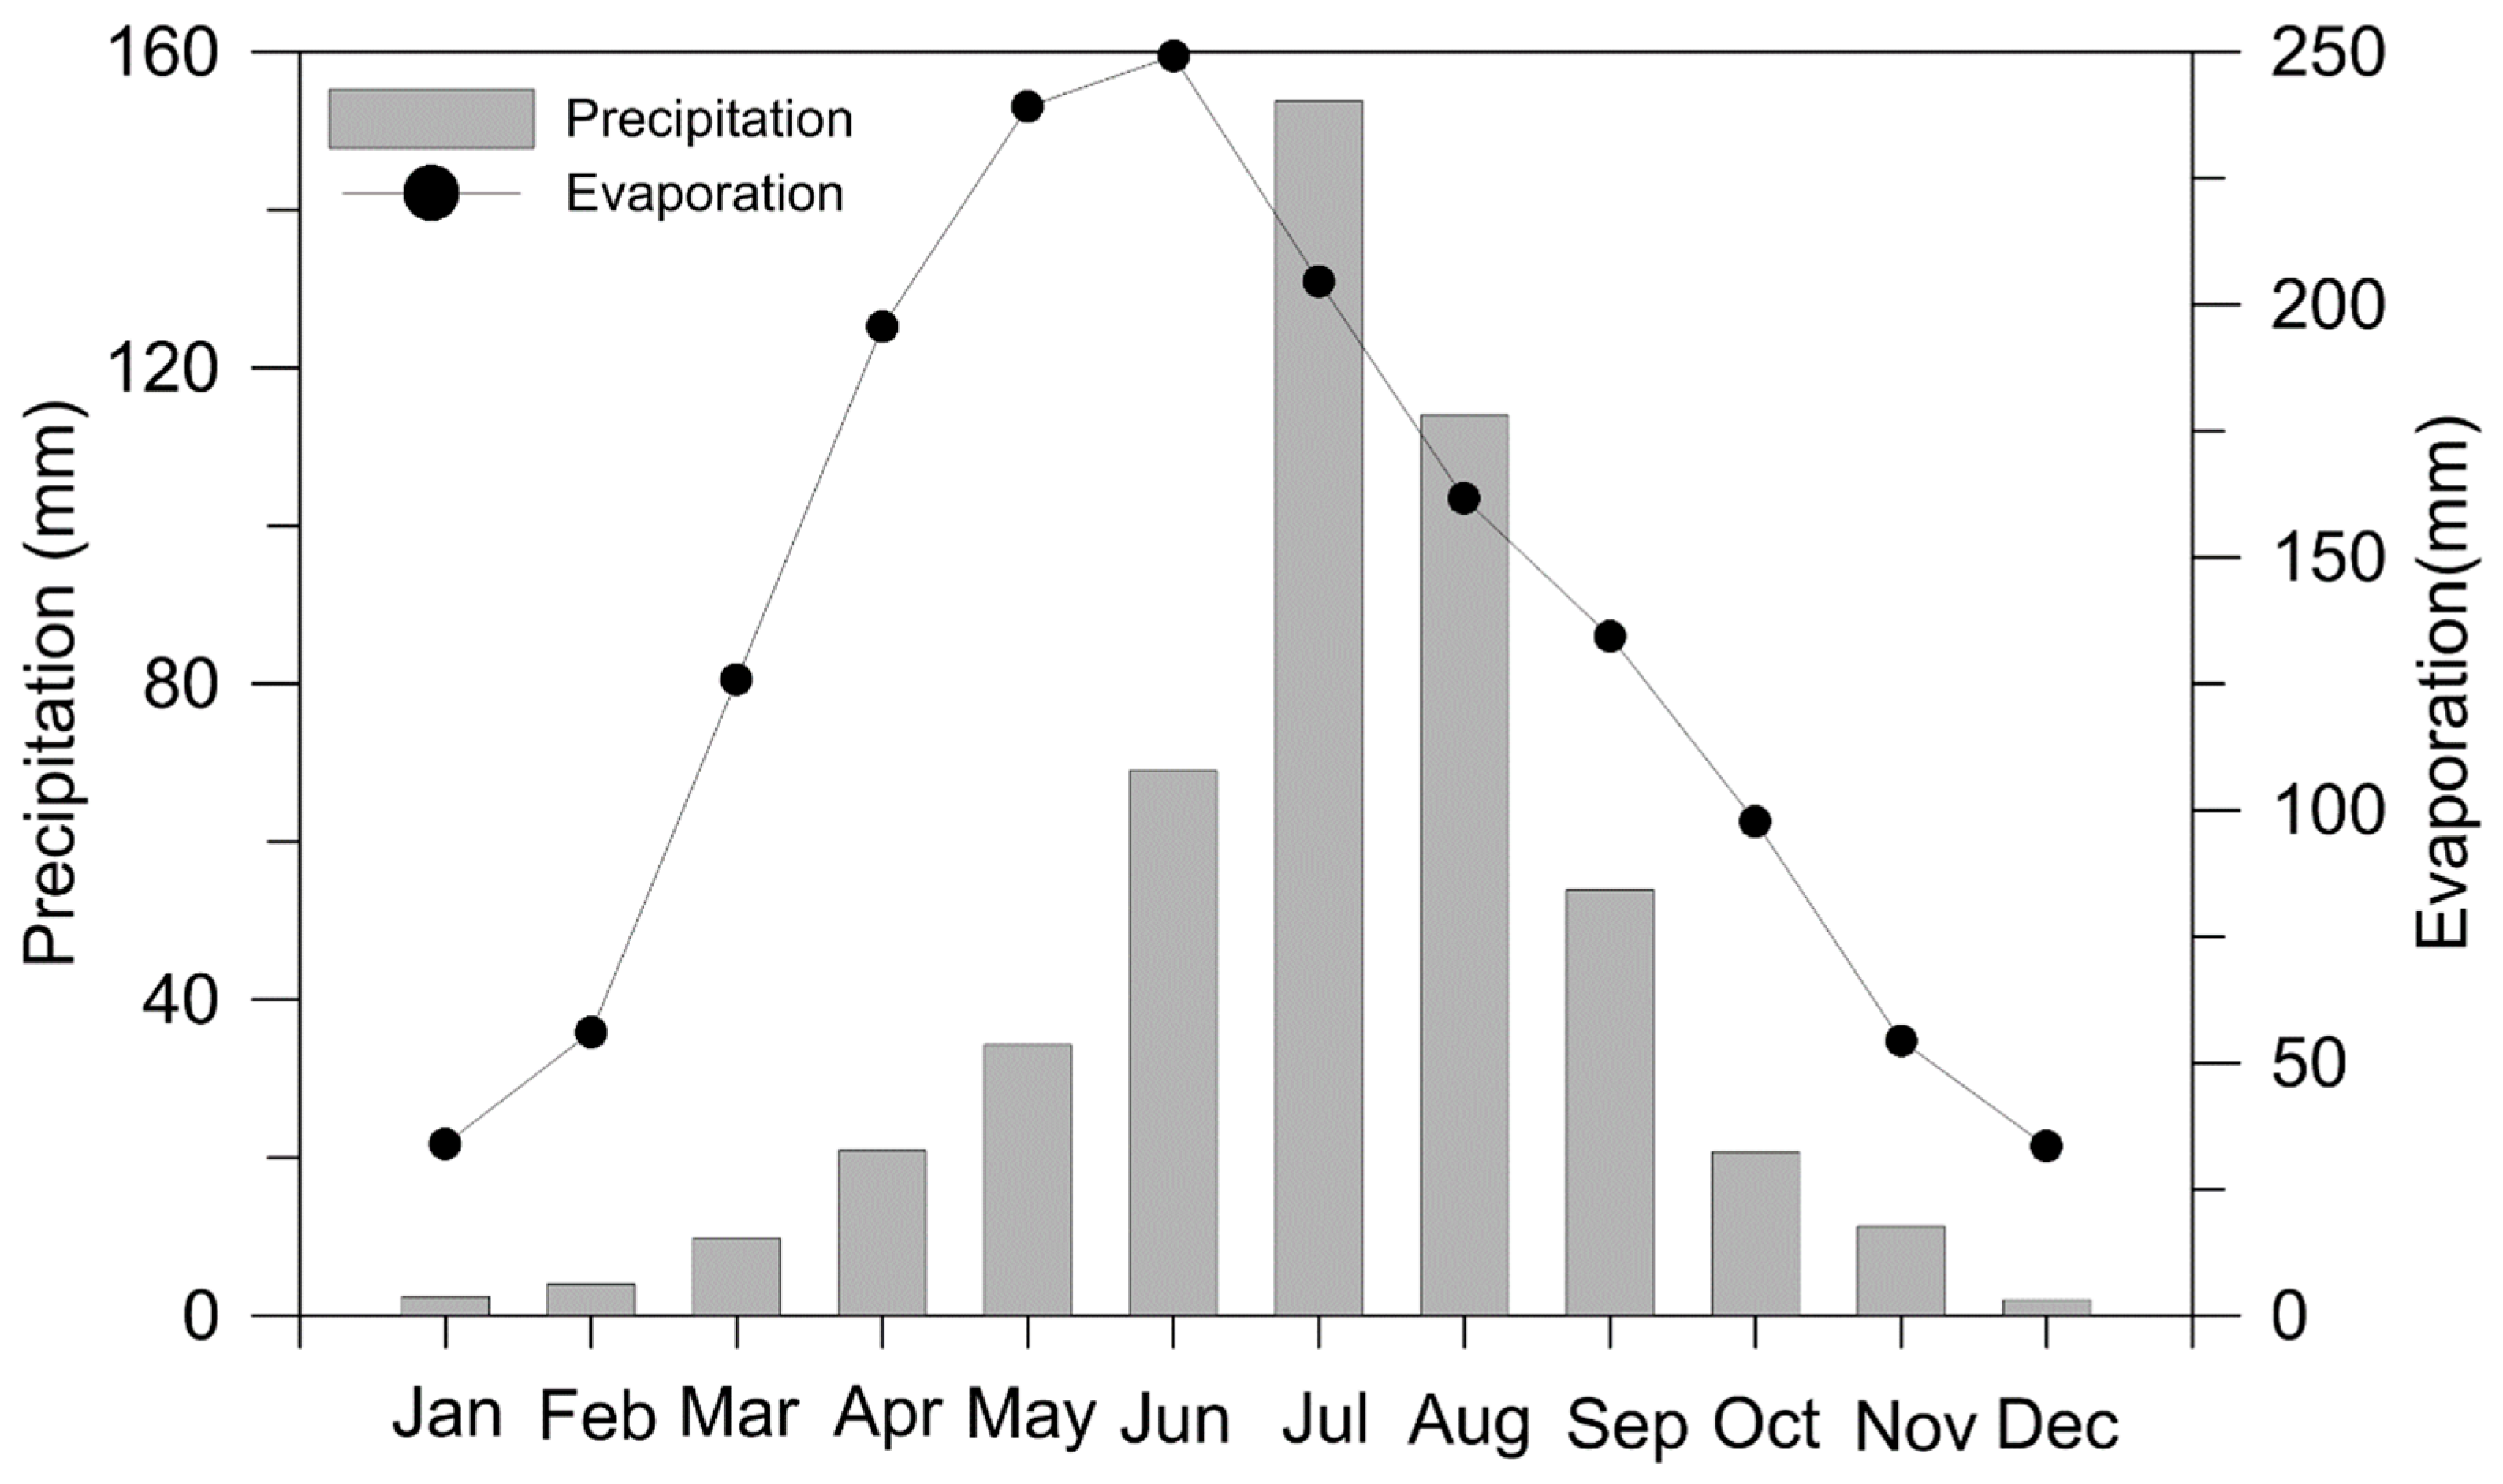
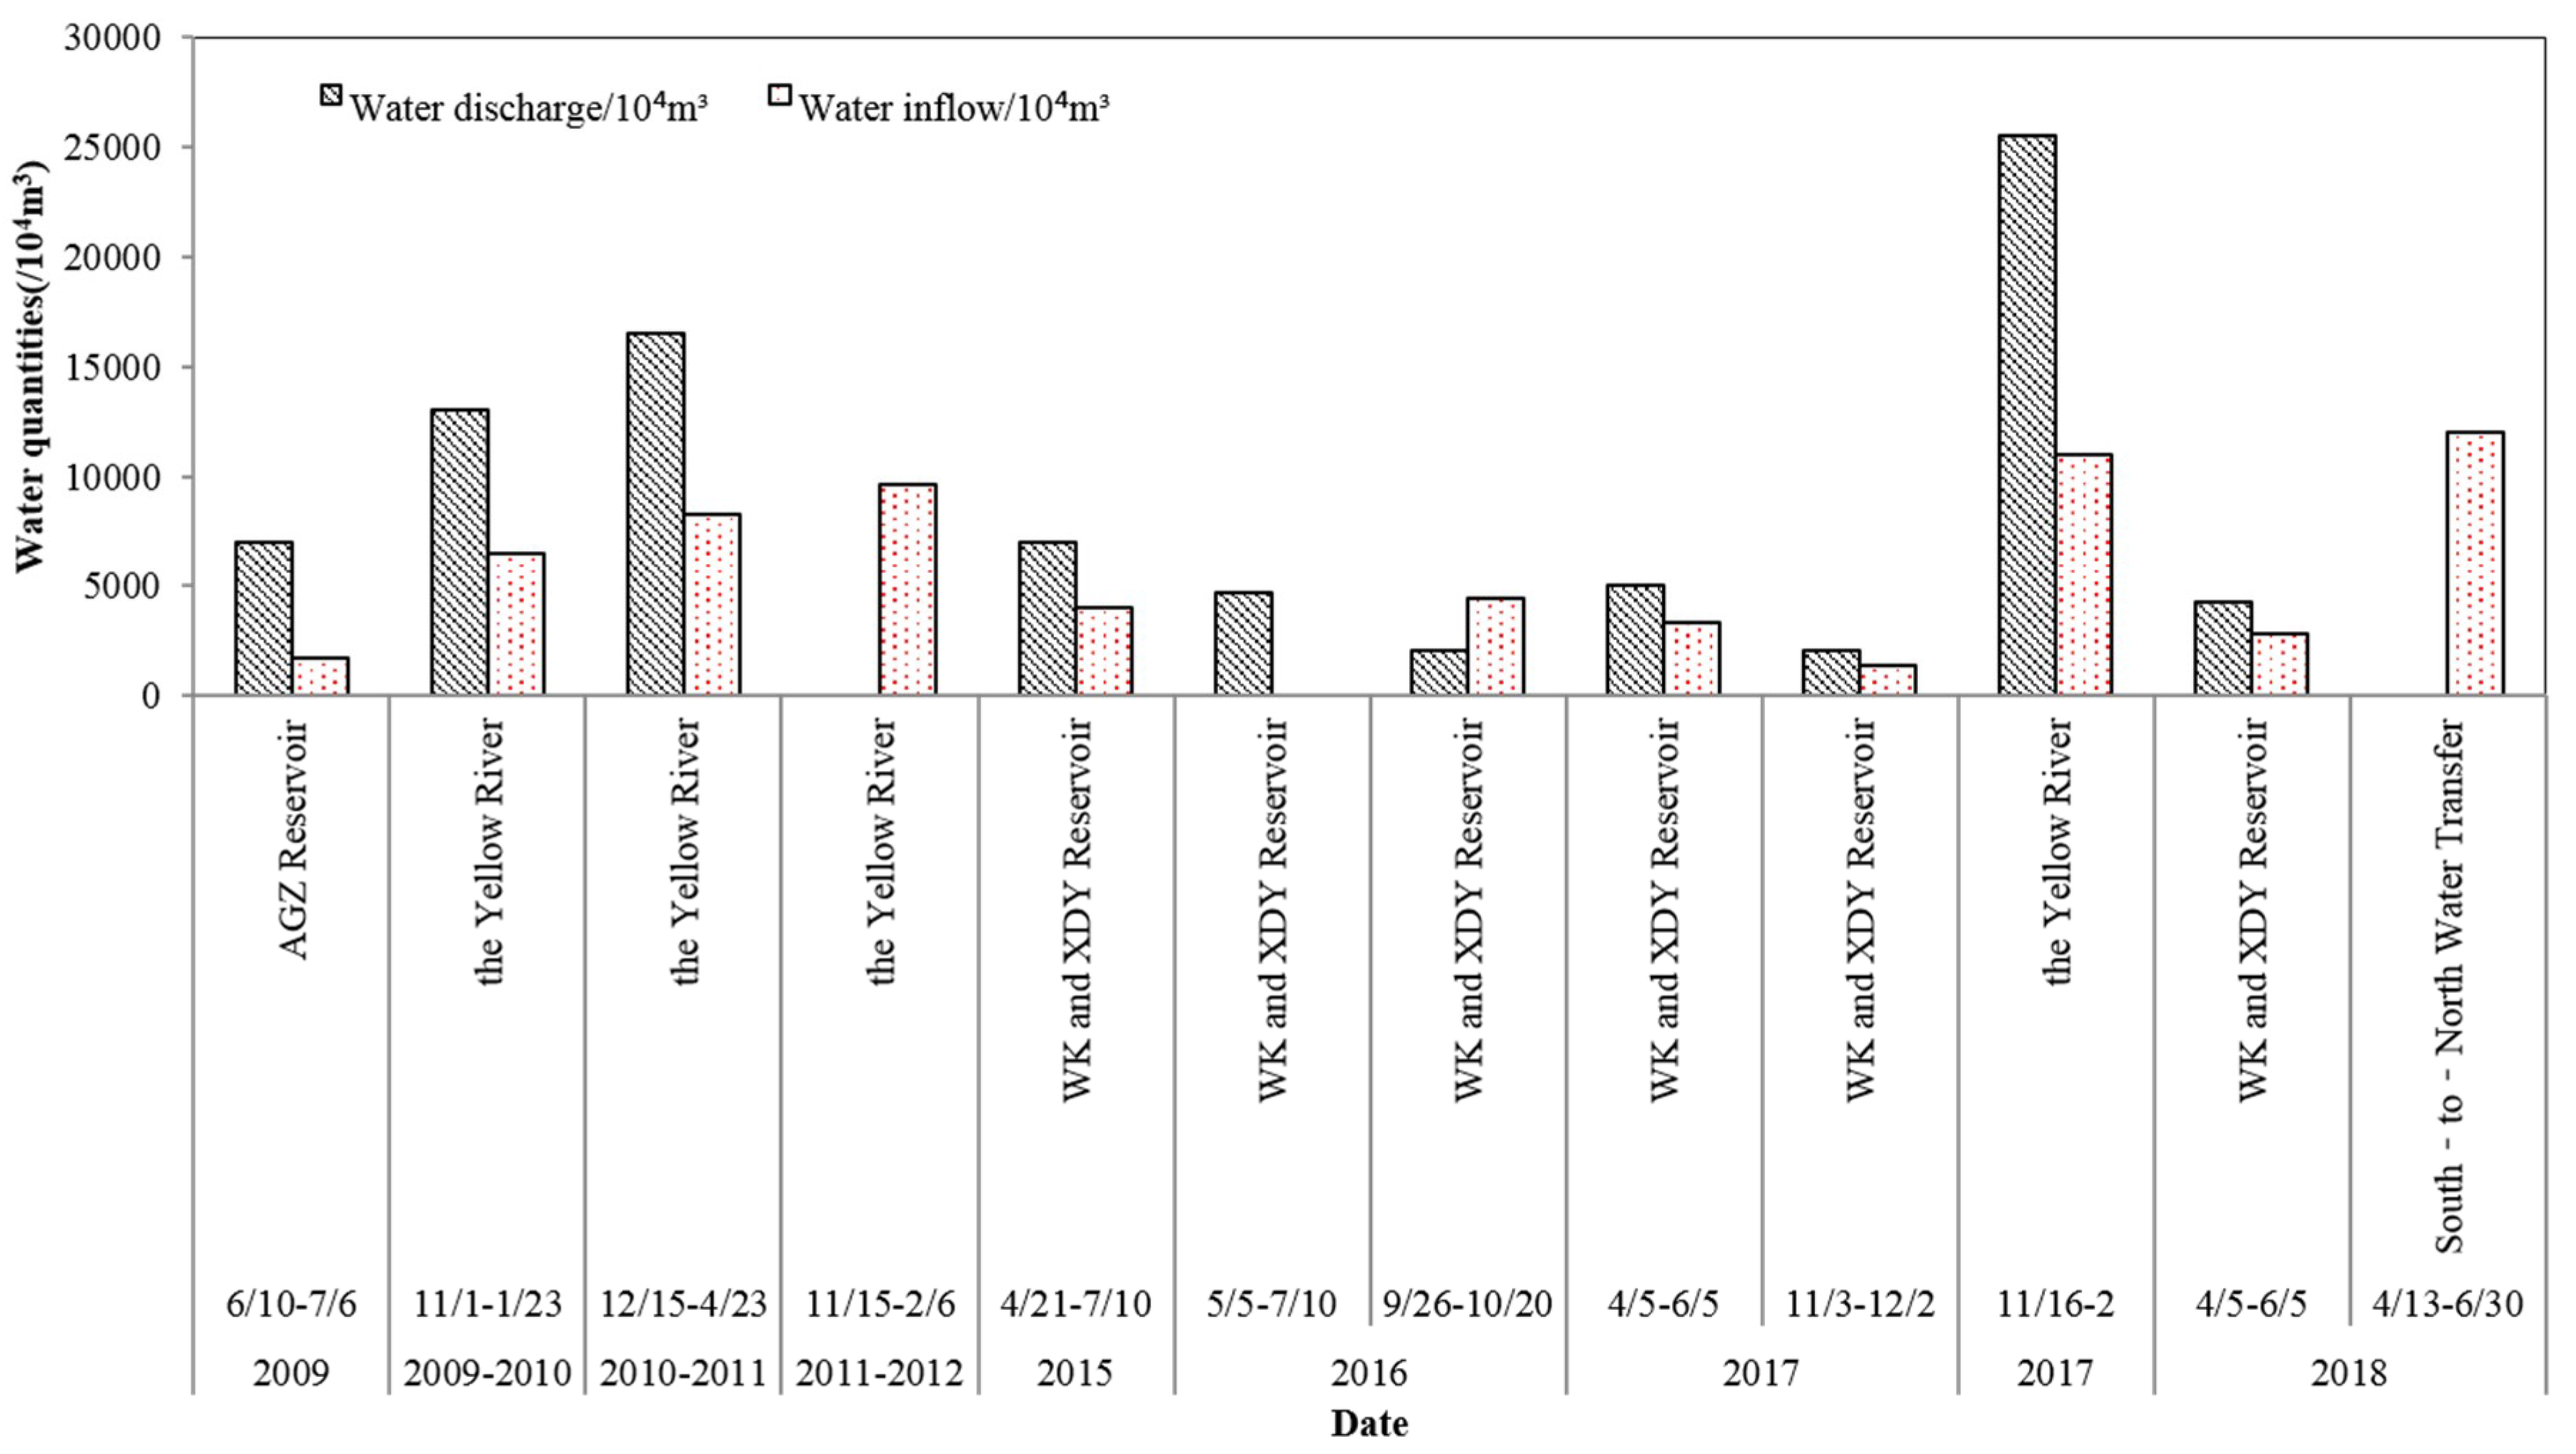
2.3. Hydrological Setting
3. Materials and Methods
3.1. Water Sampling and Laboratory Analyses
3.2. Rayleigh Evaporation Model
3.3. End-Member Mixing Analysis (EMMA)
4. Results and Discussion
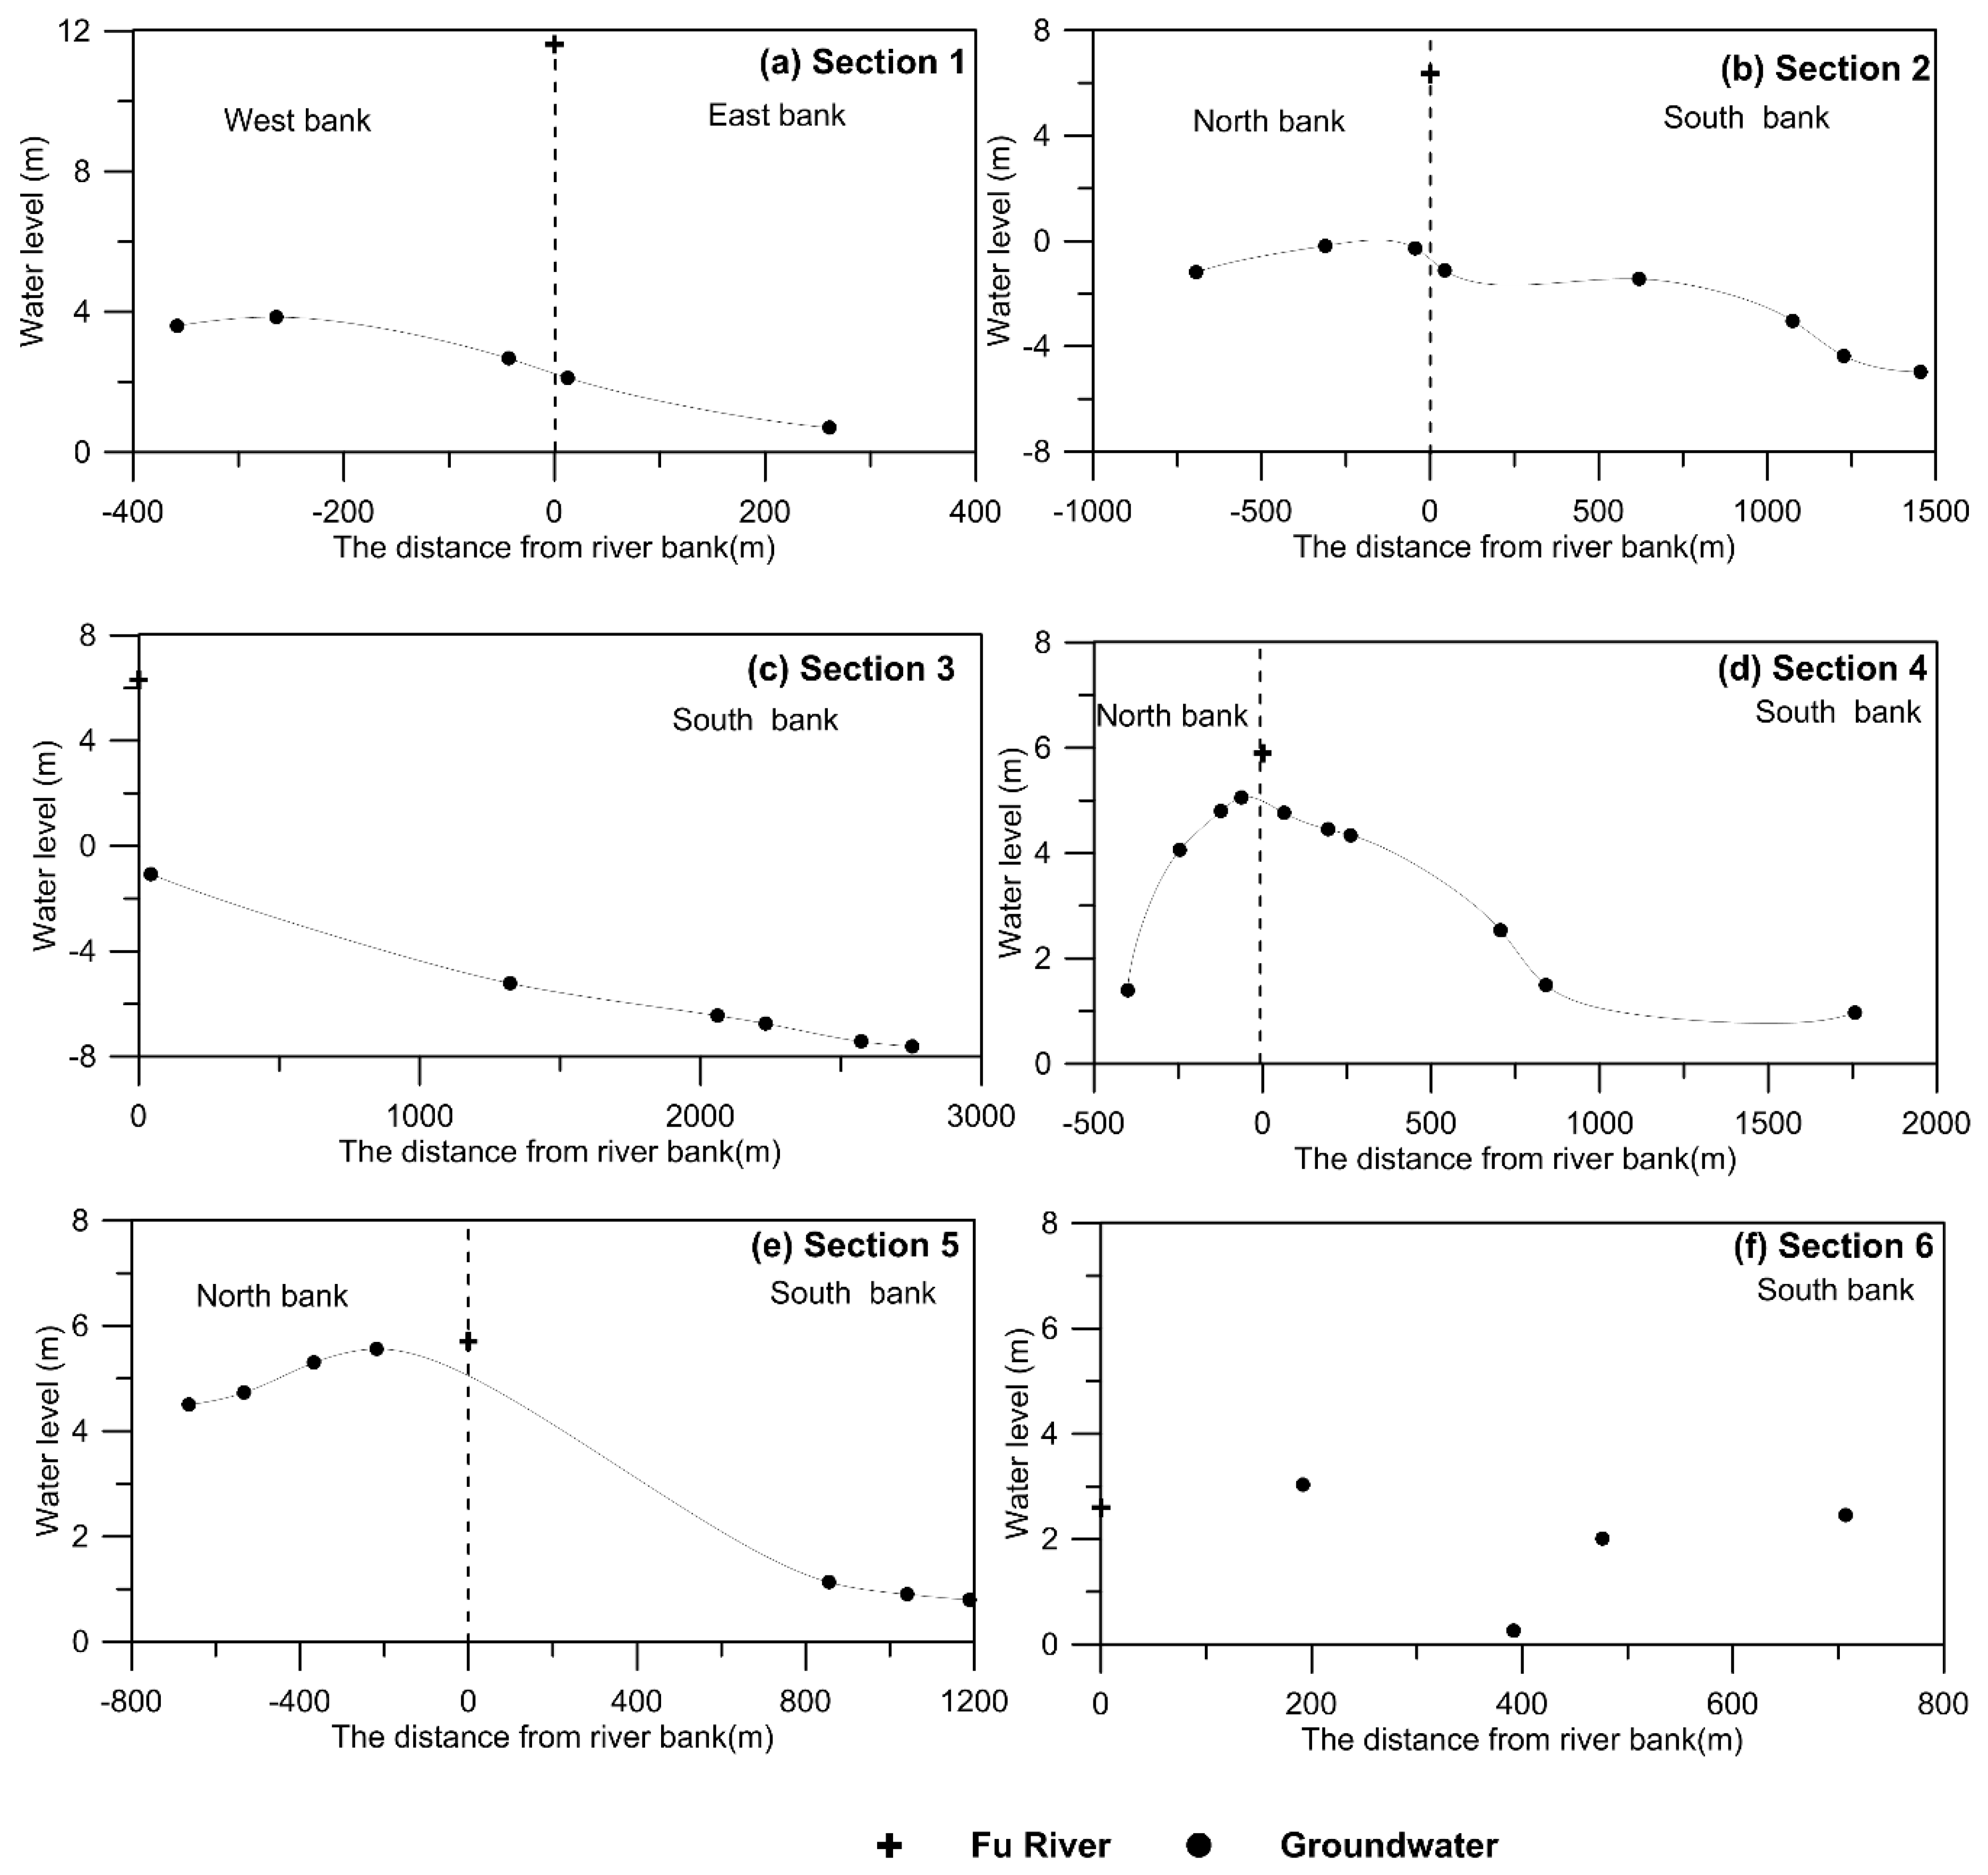
4.1. River Water Level and Groundwater Table
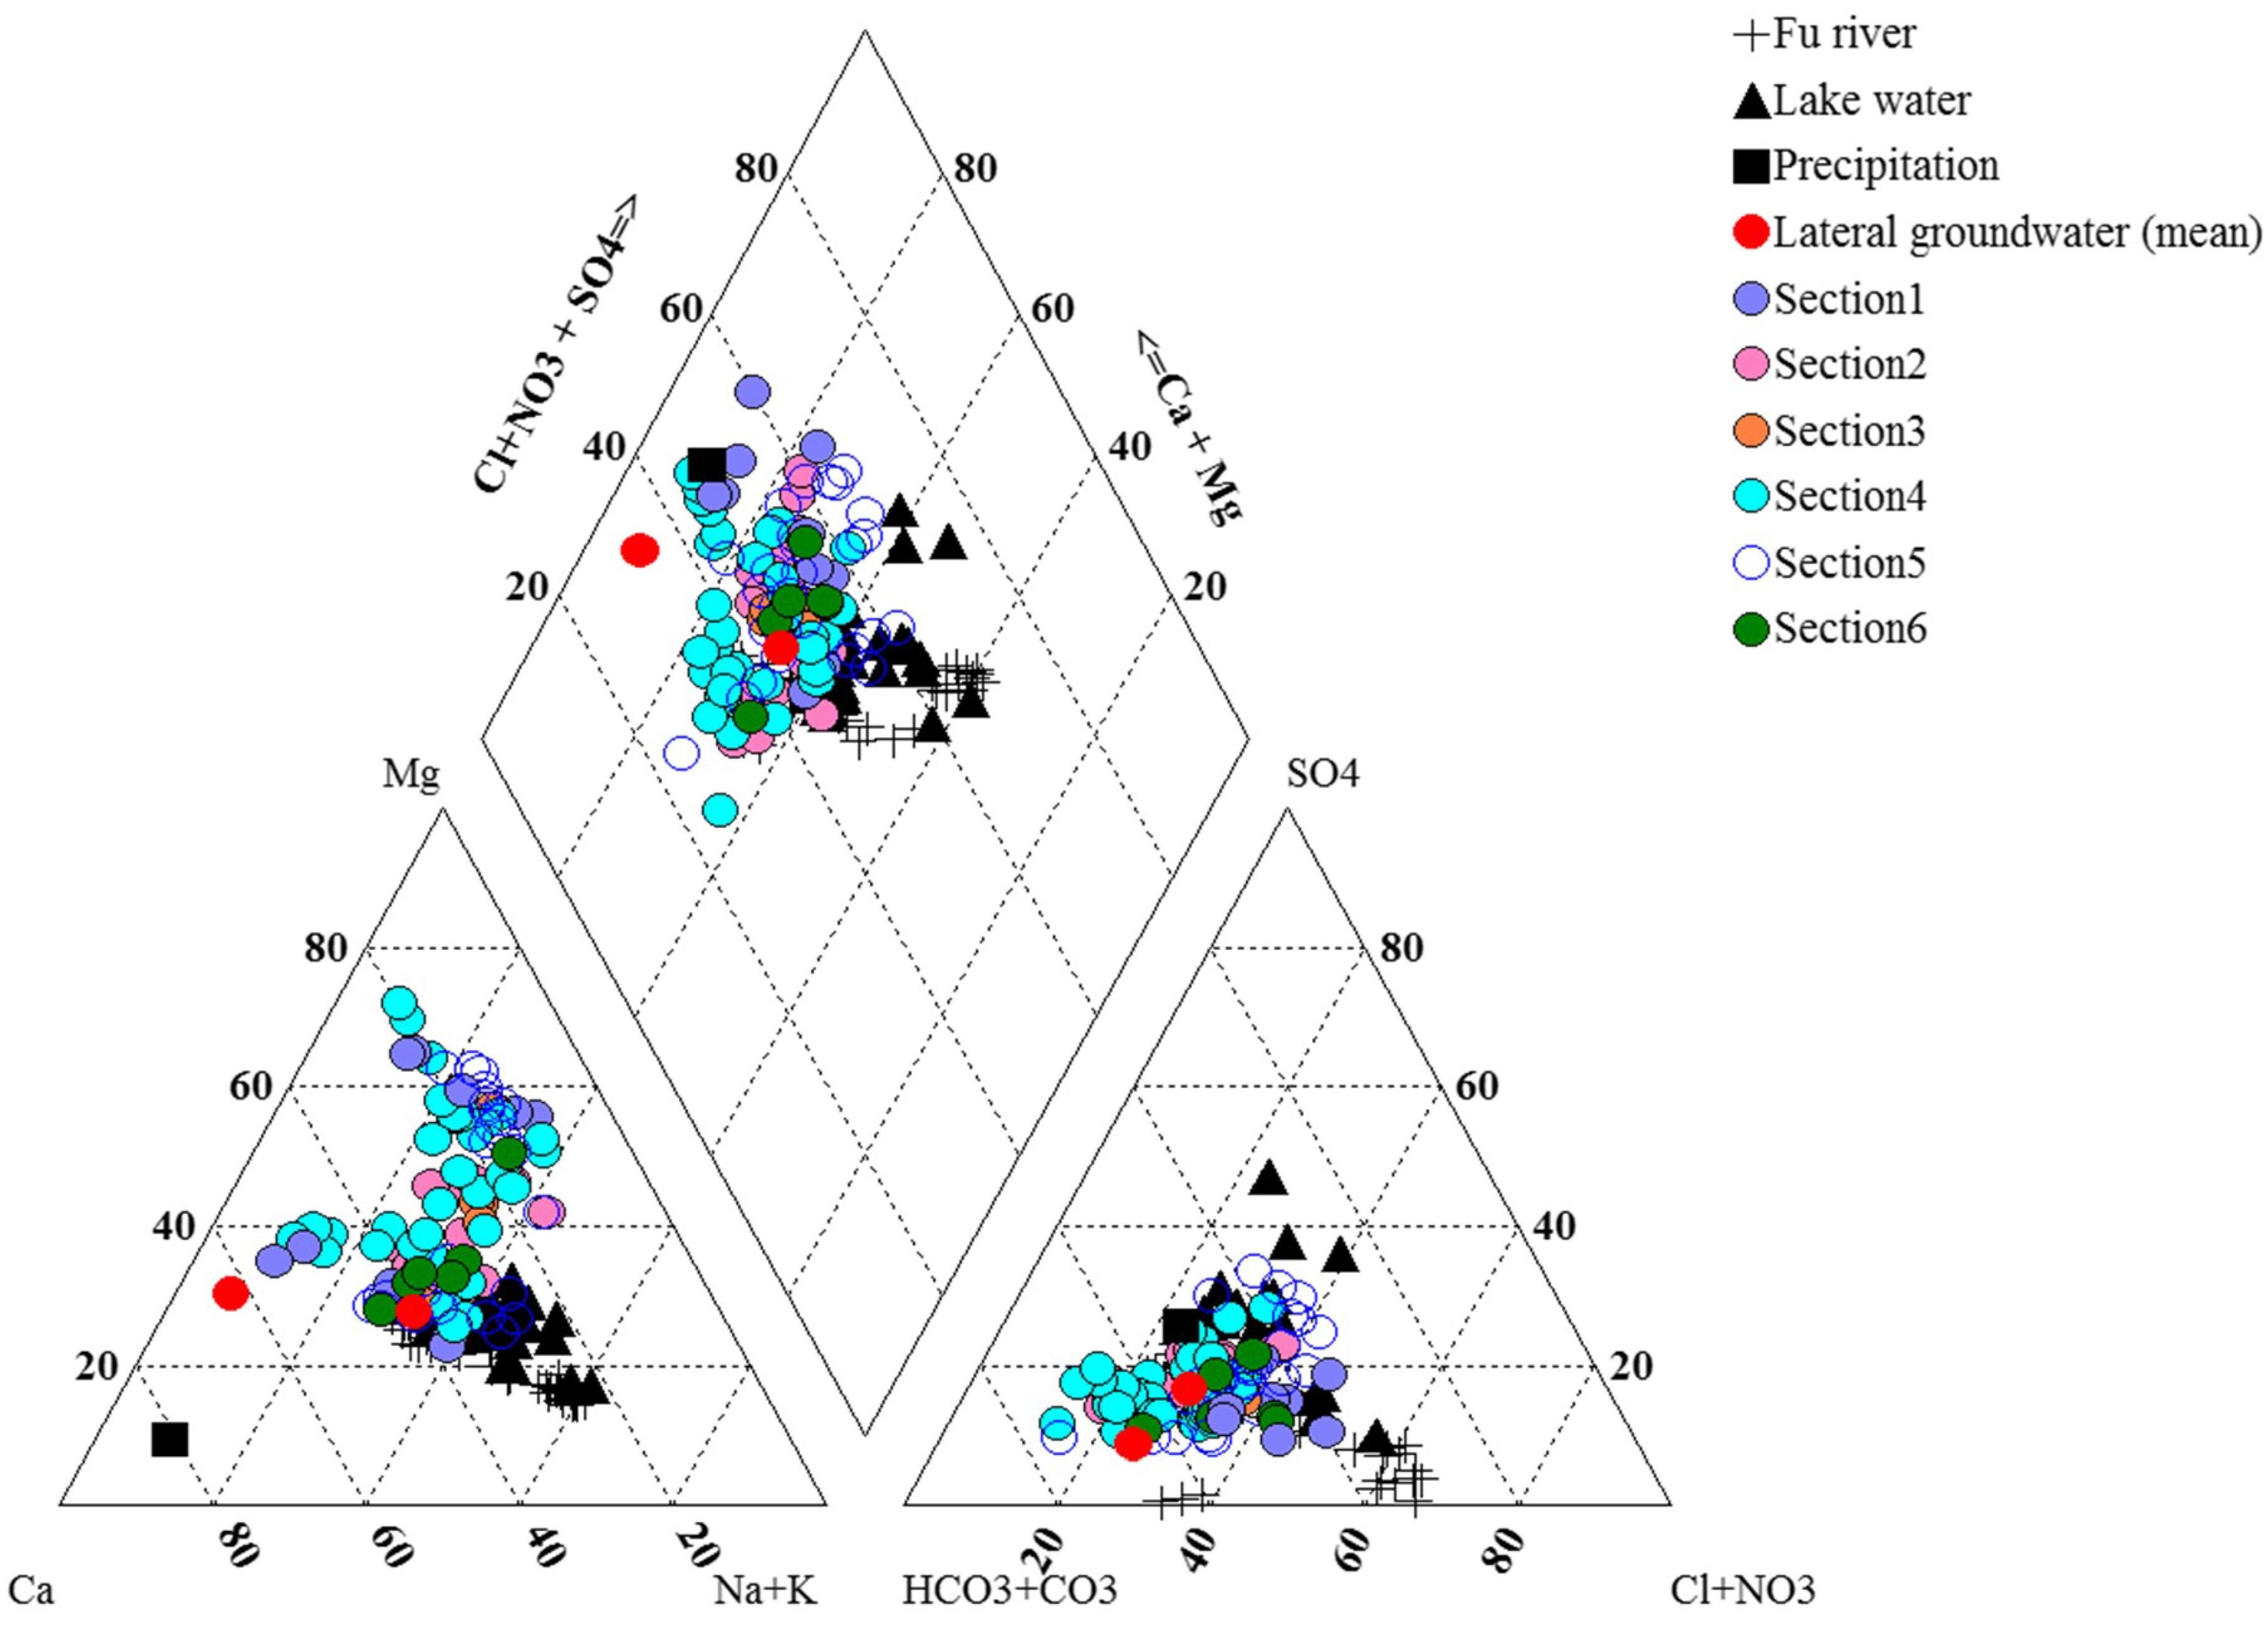
4.2. Hydrochemical Characteristics
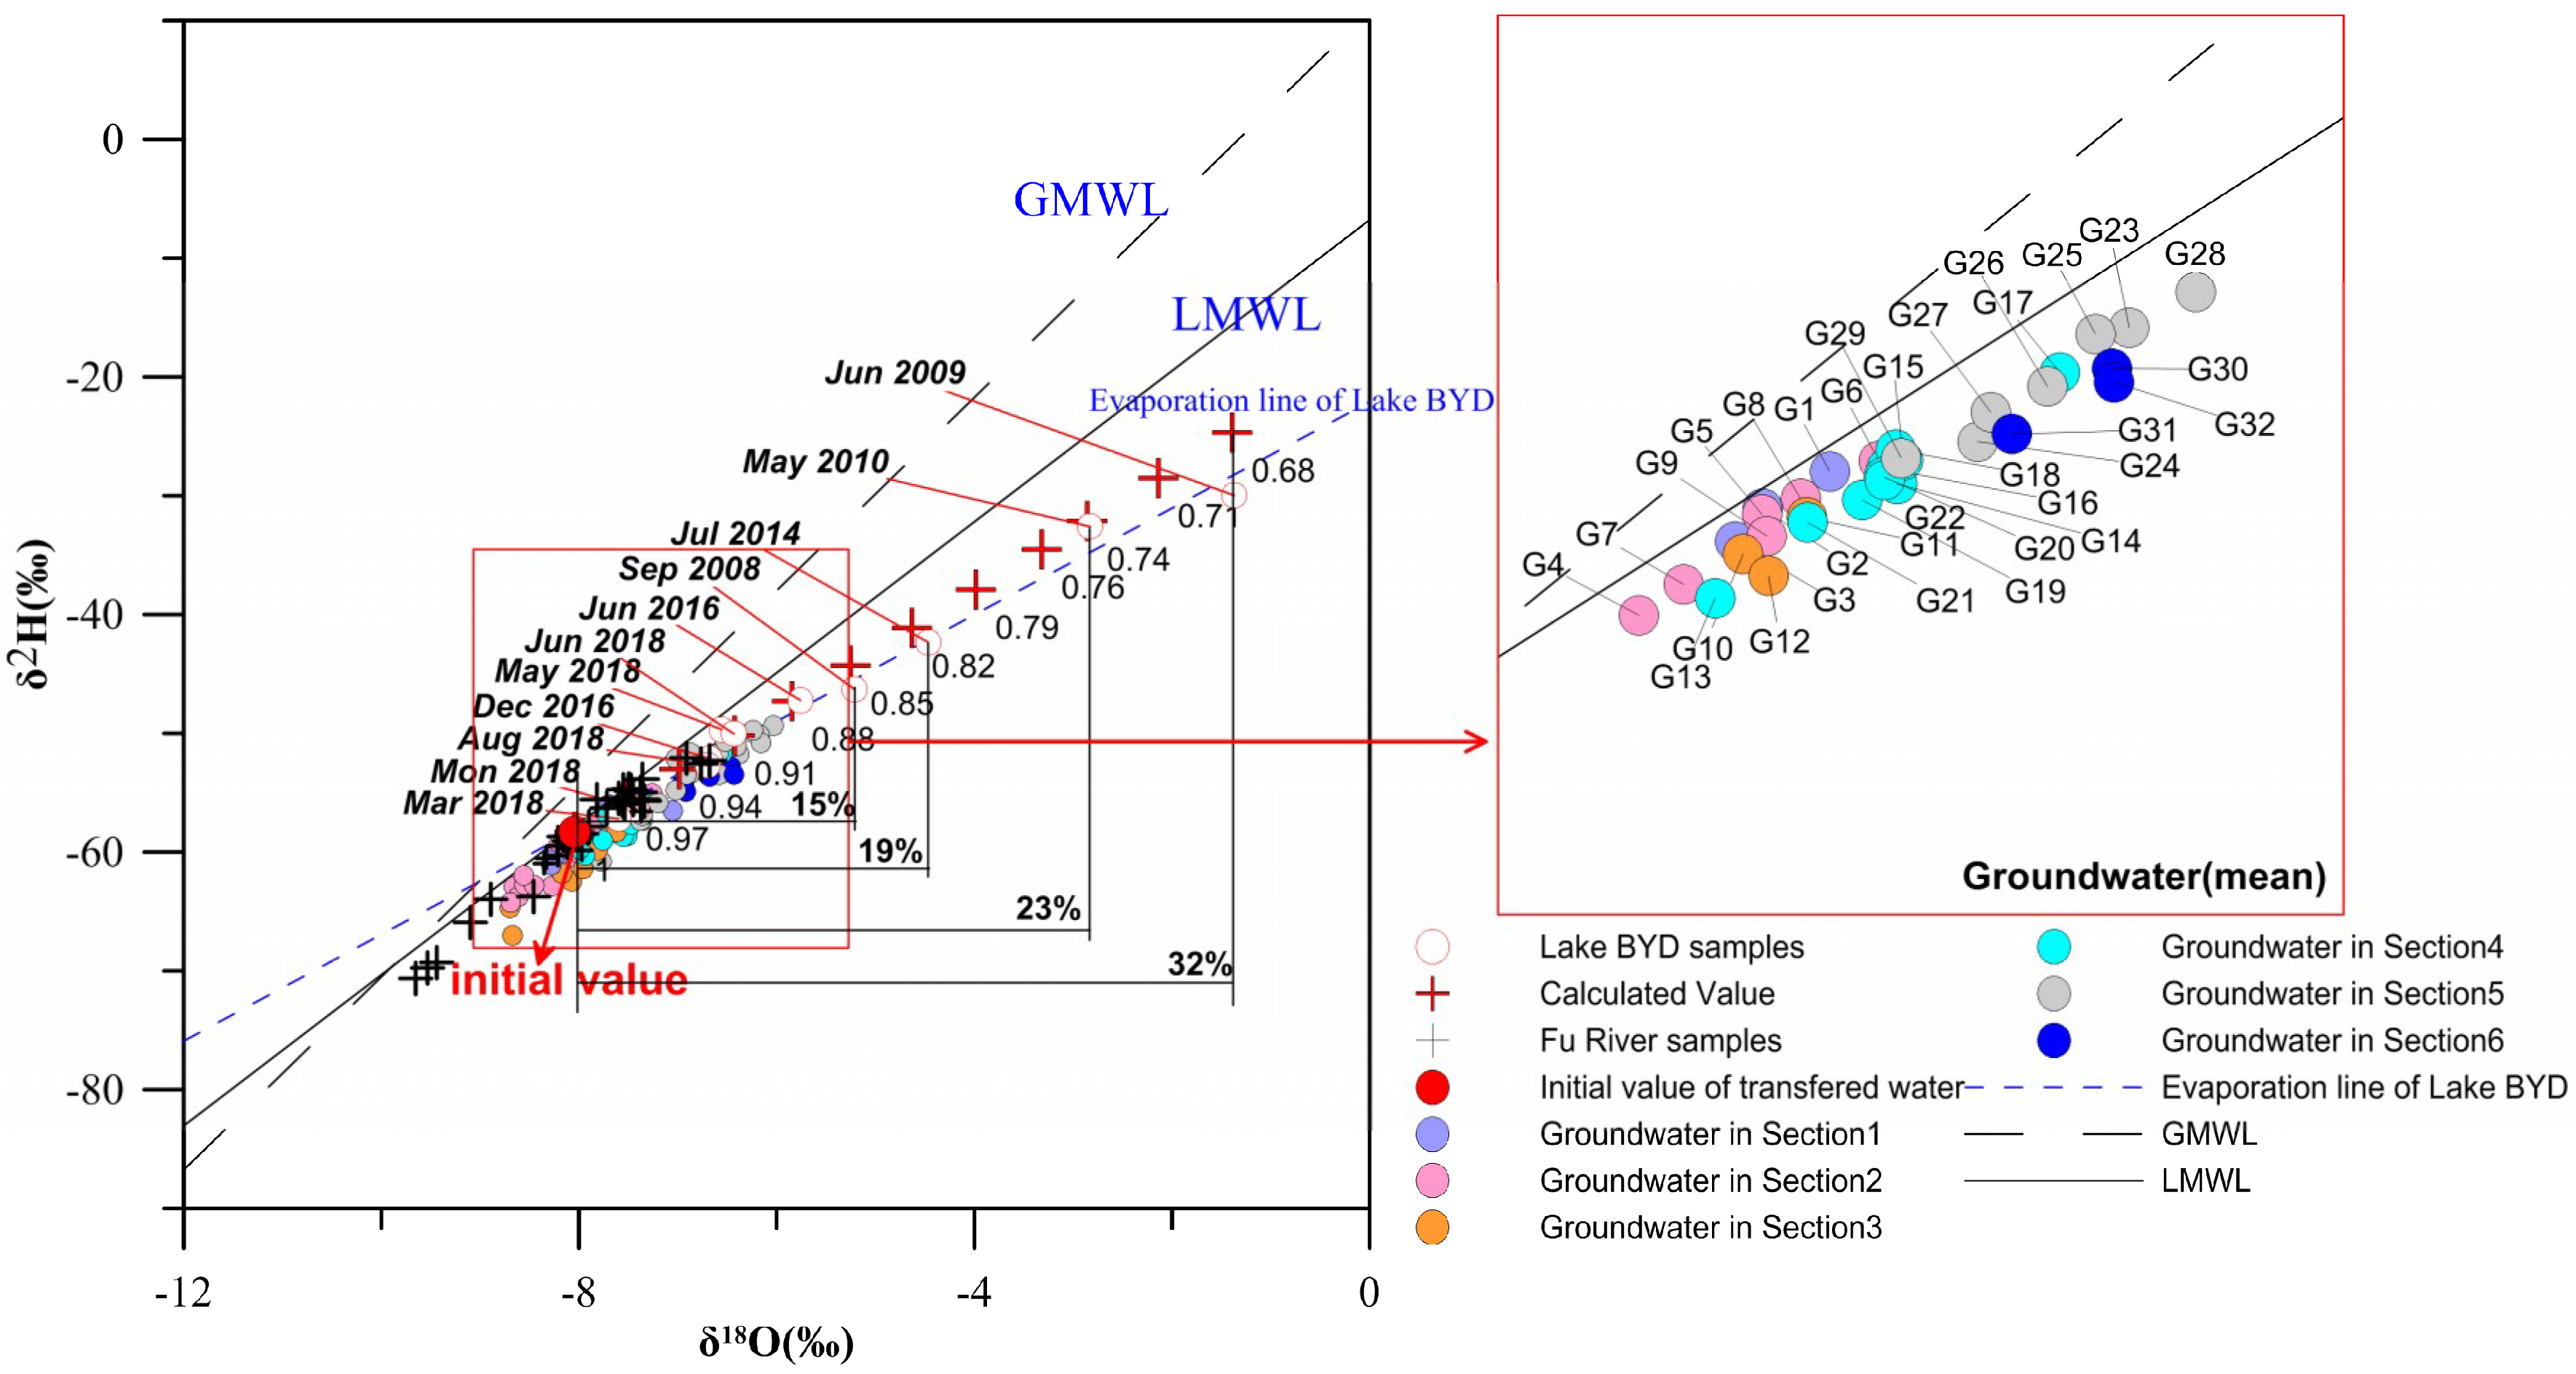
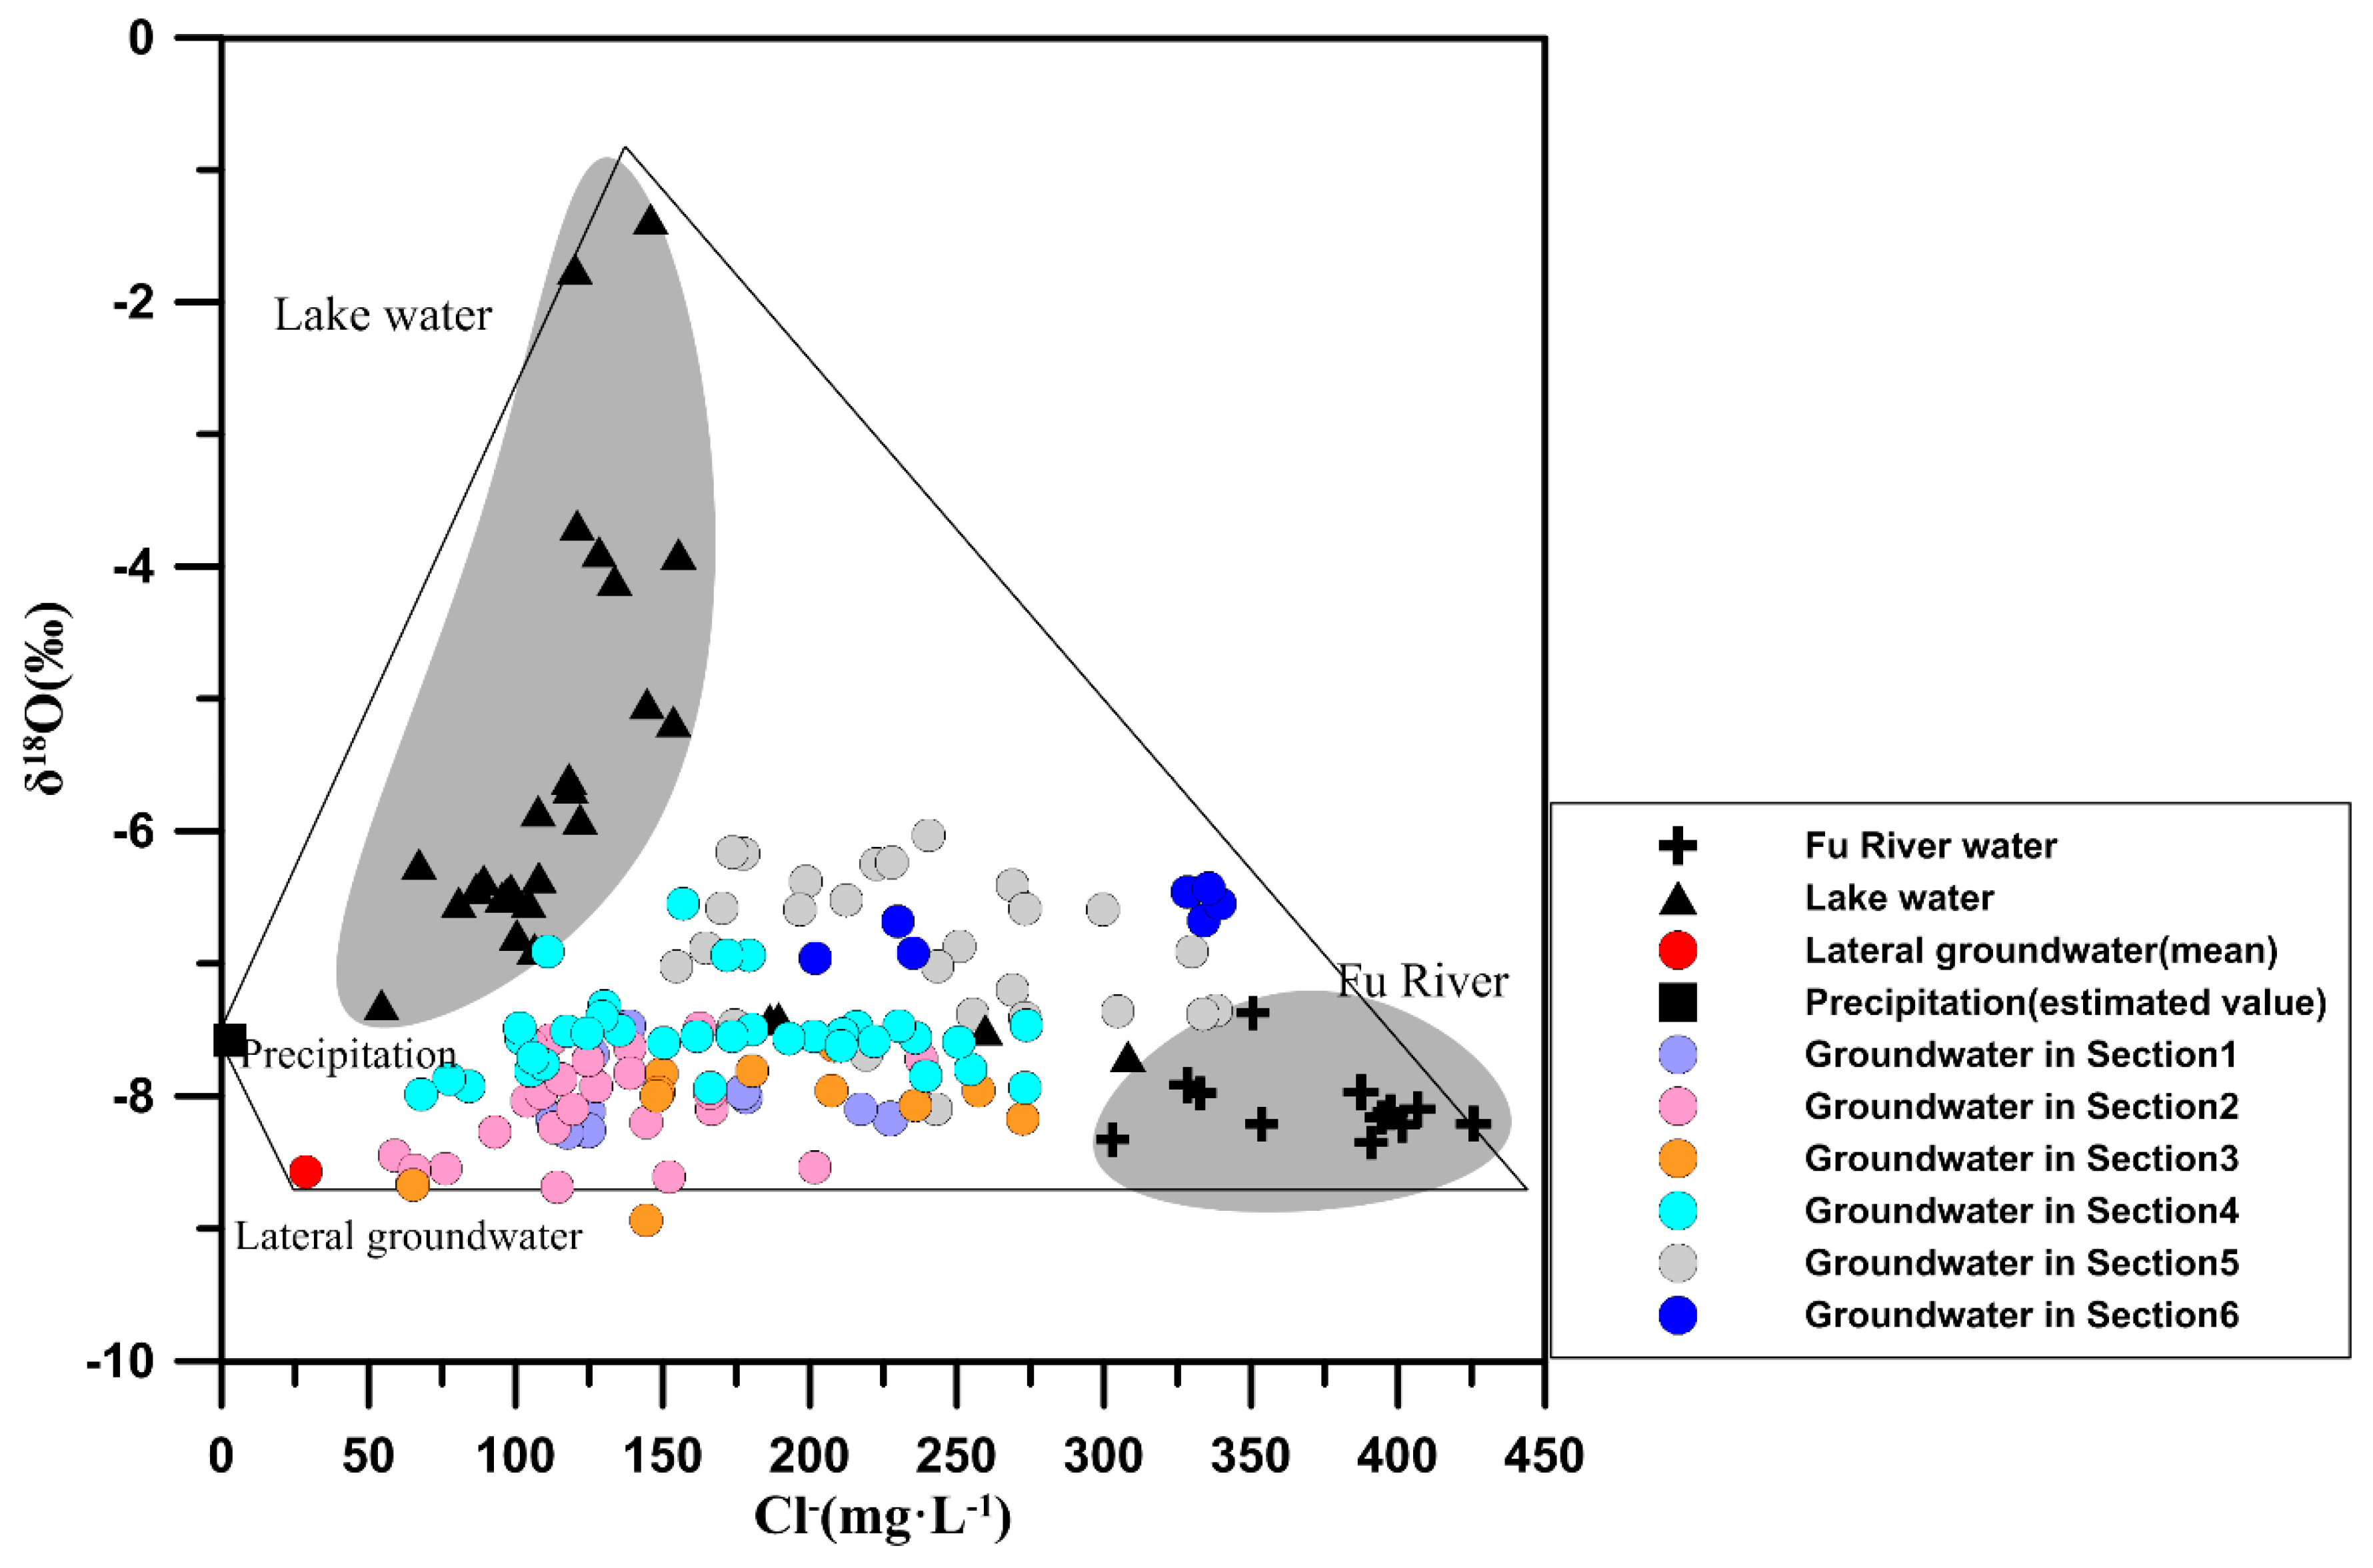
4.3. Isotopic Composition and Evaporation Estimates
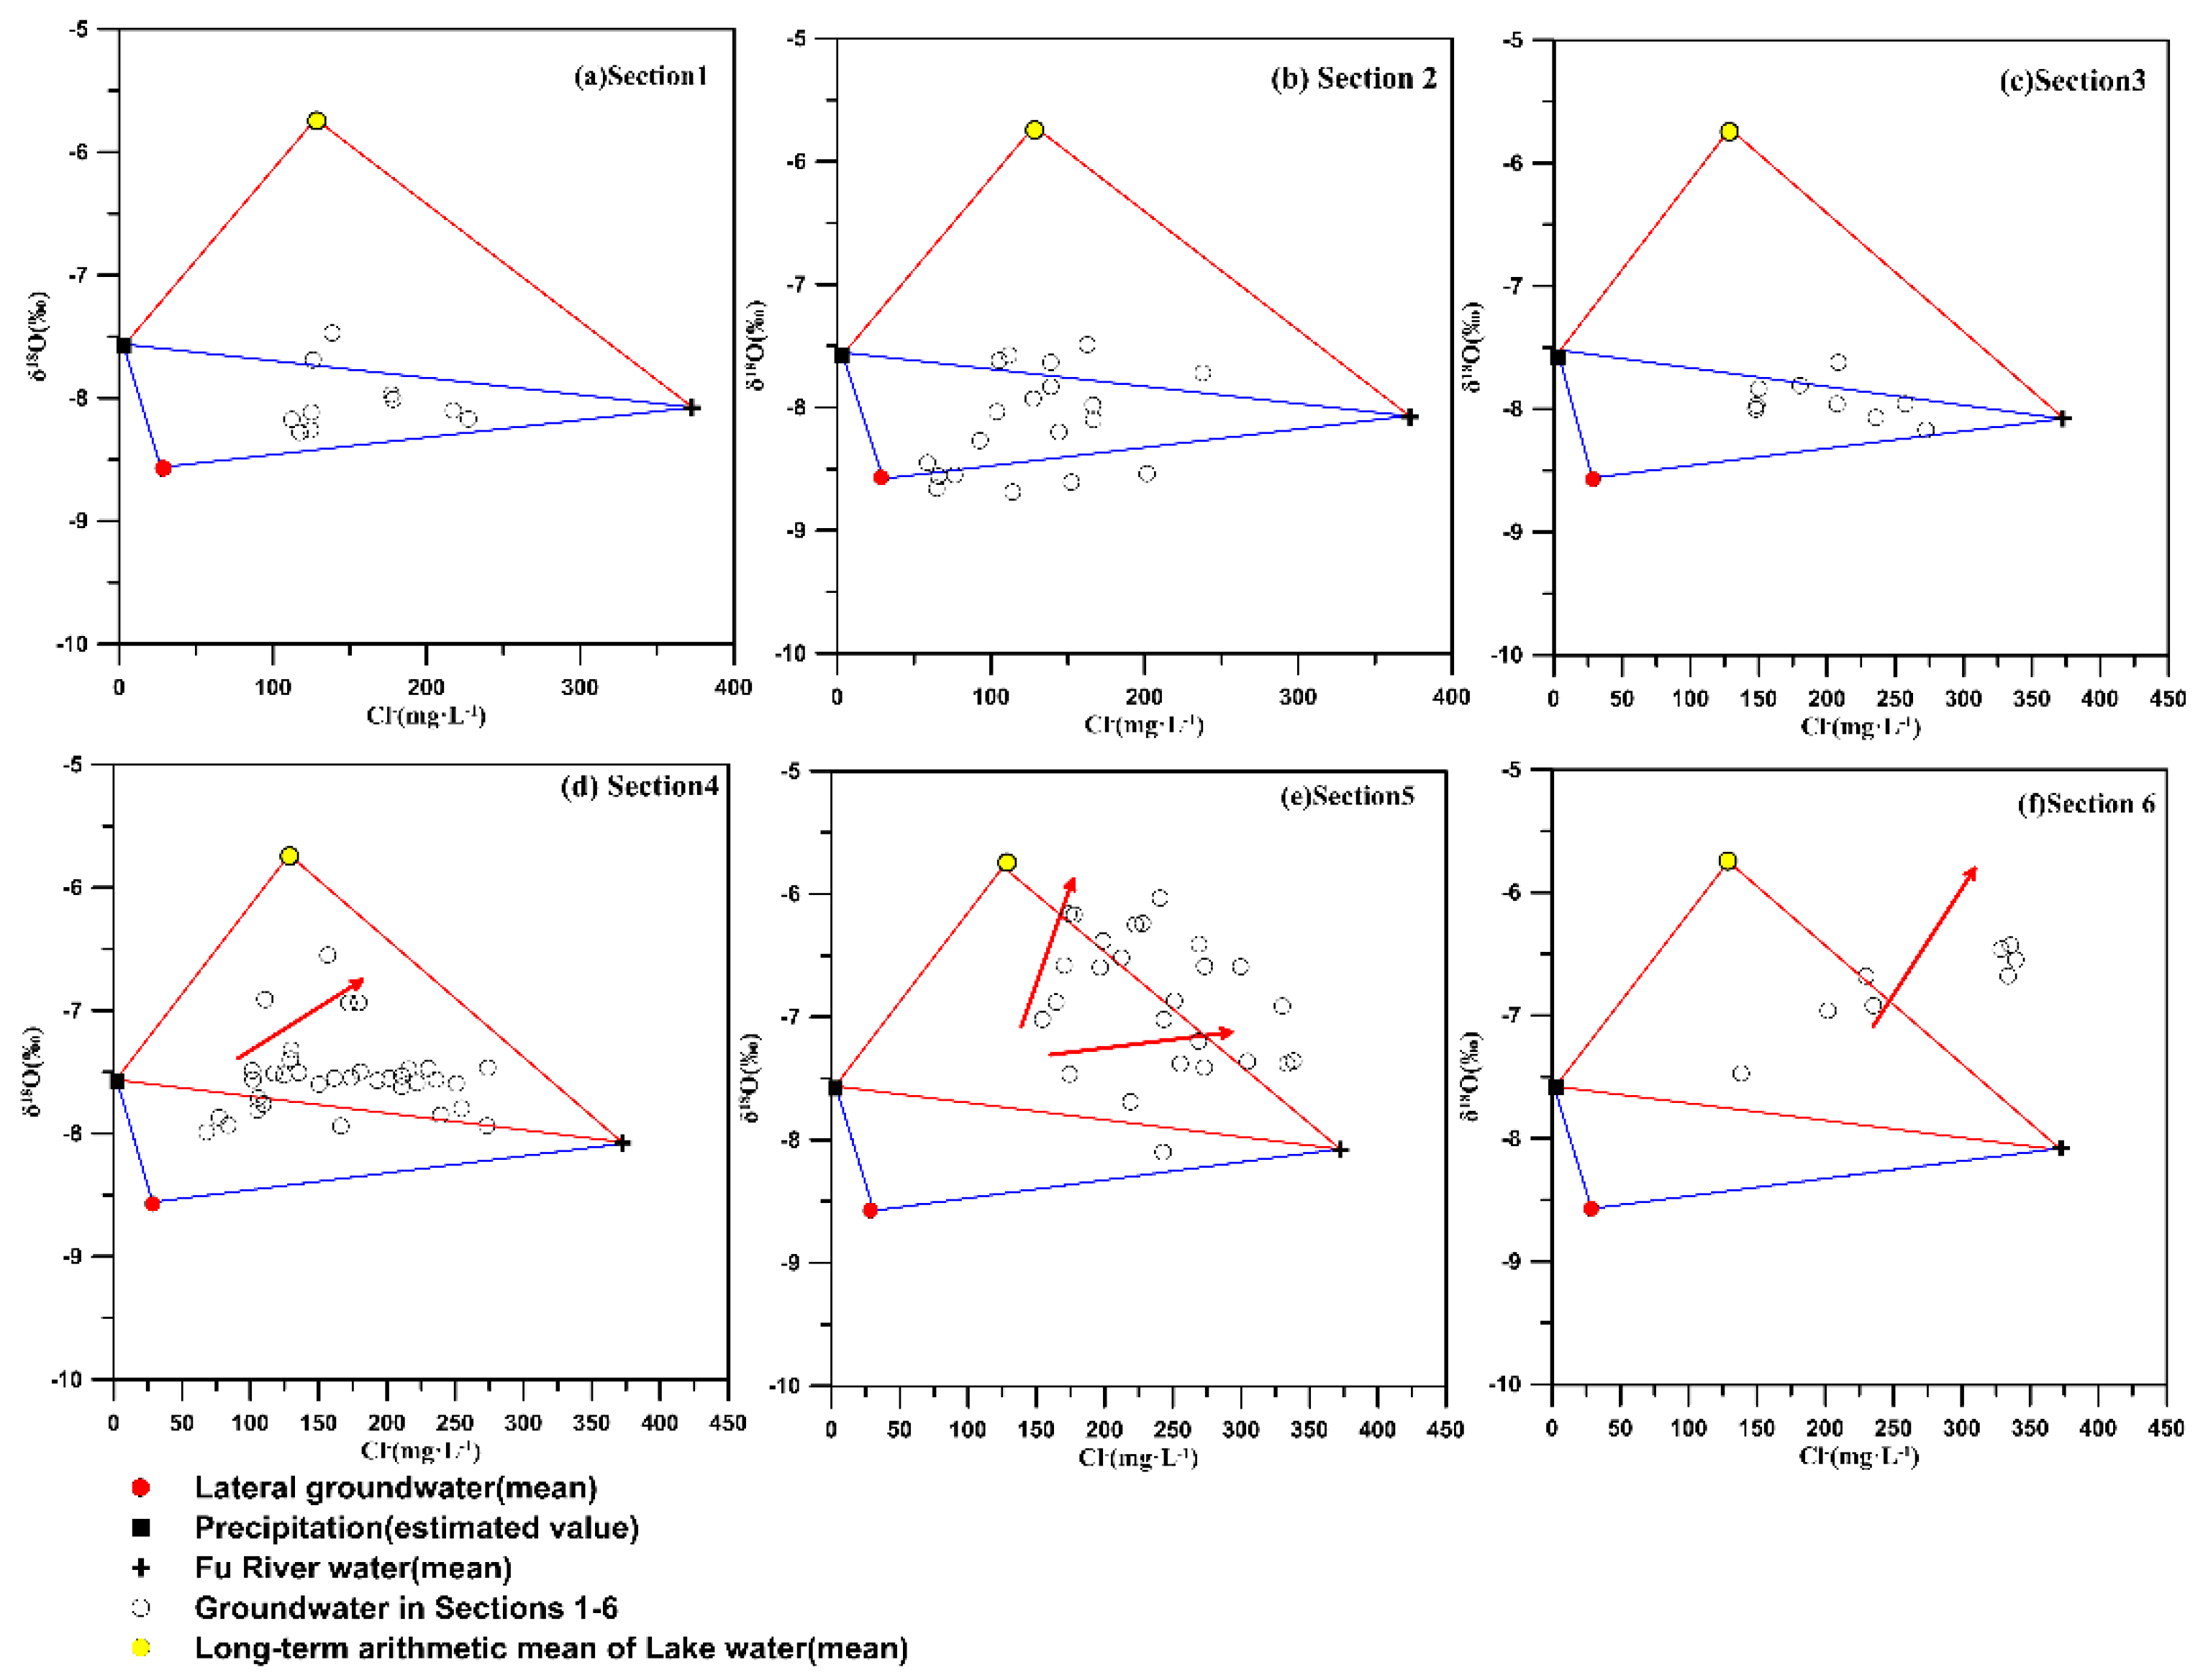
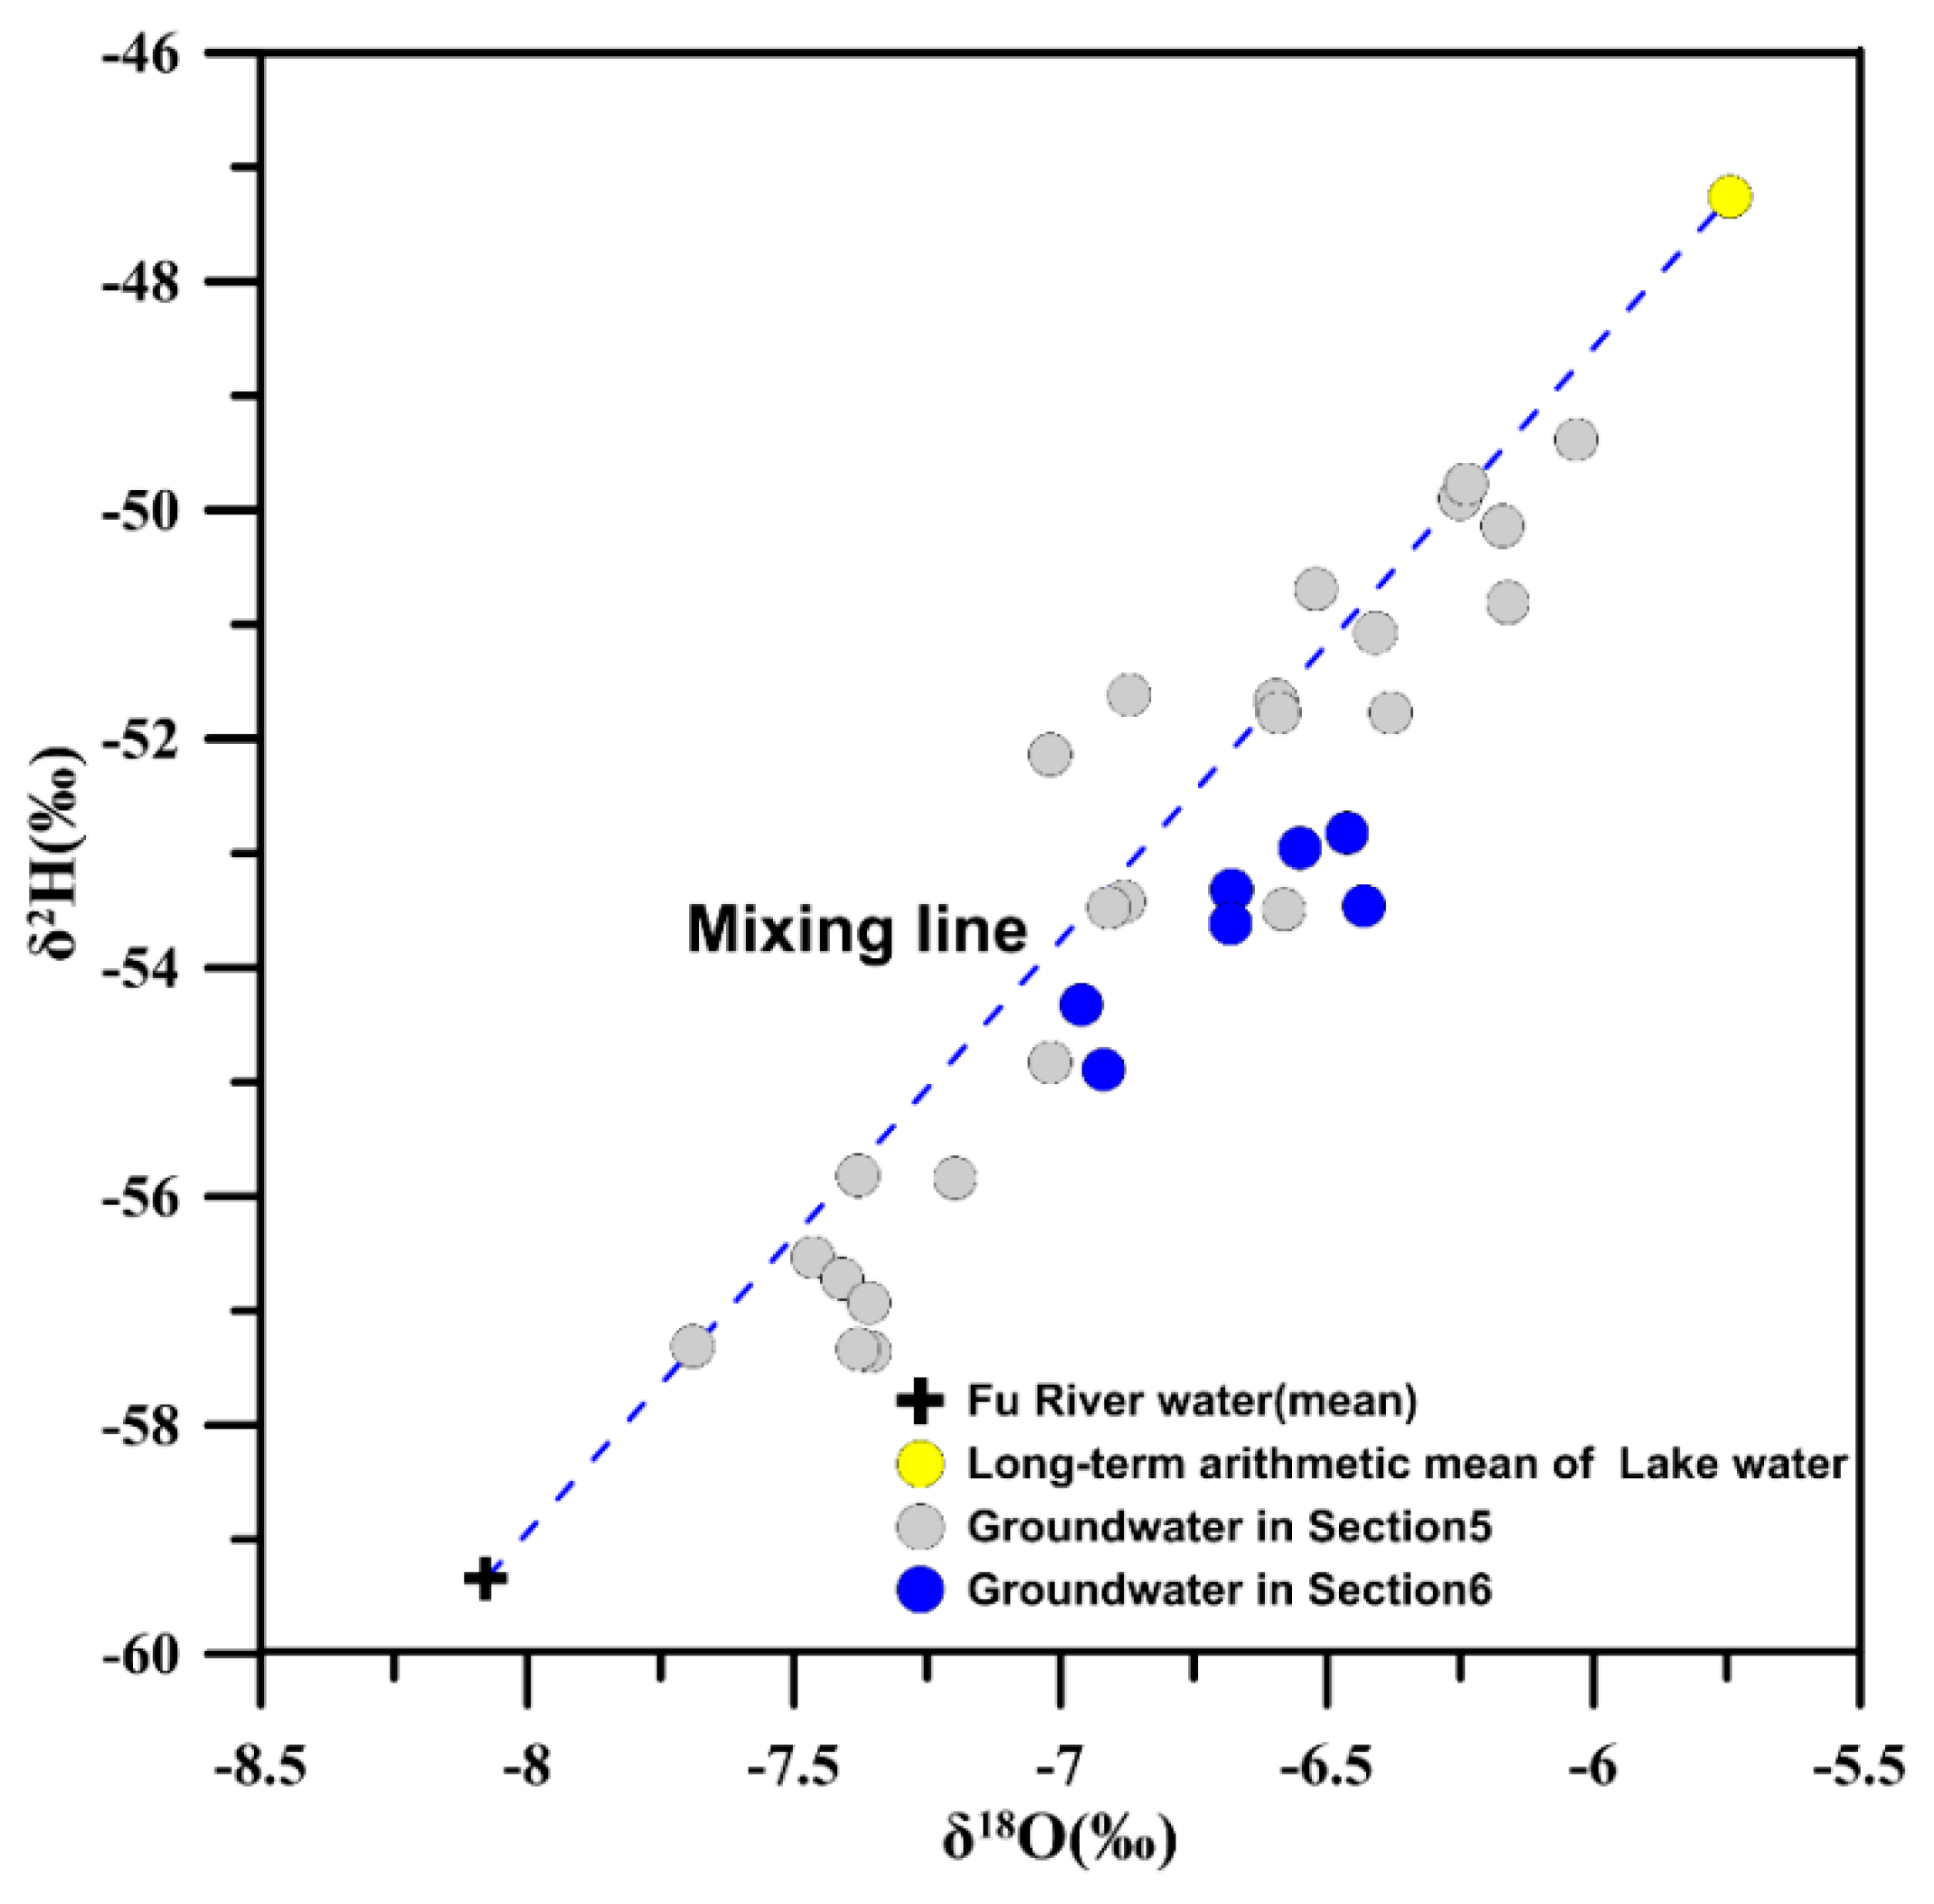
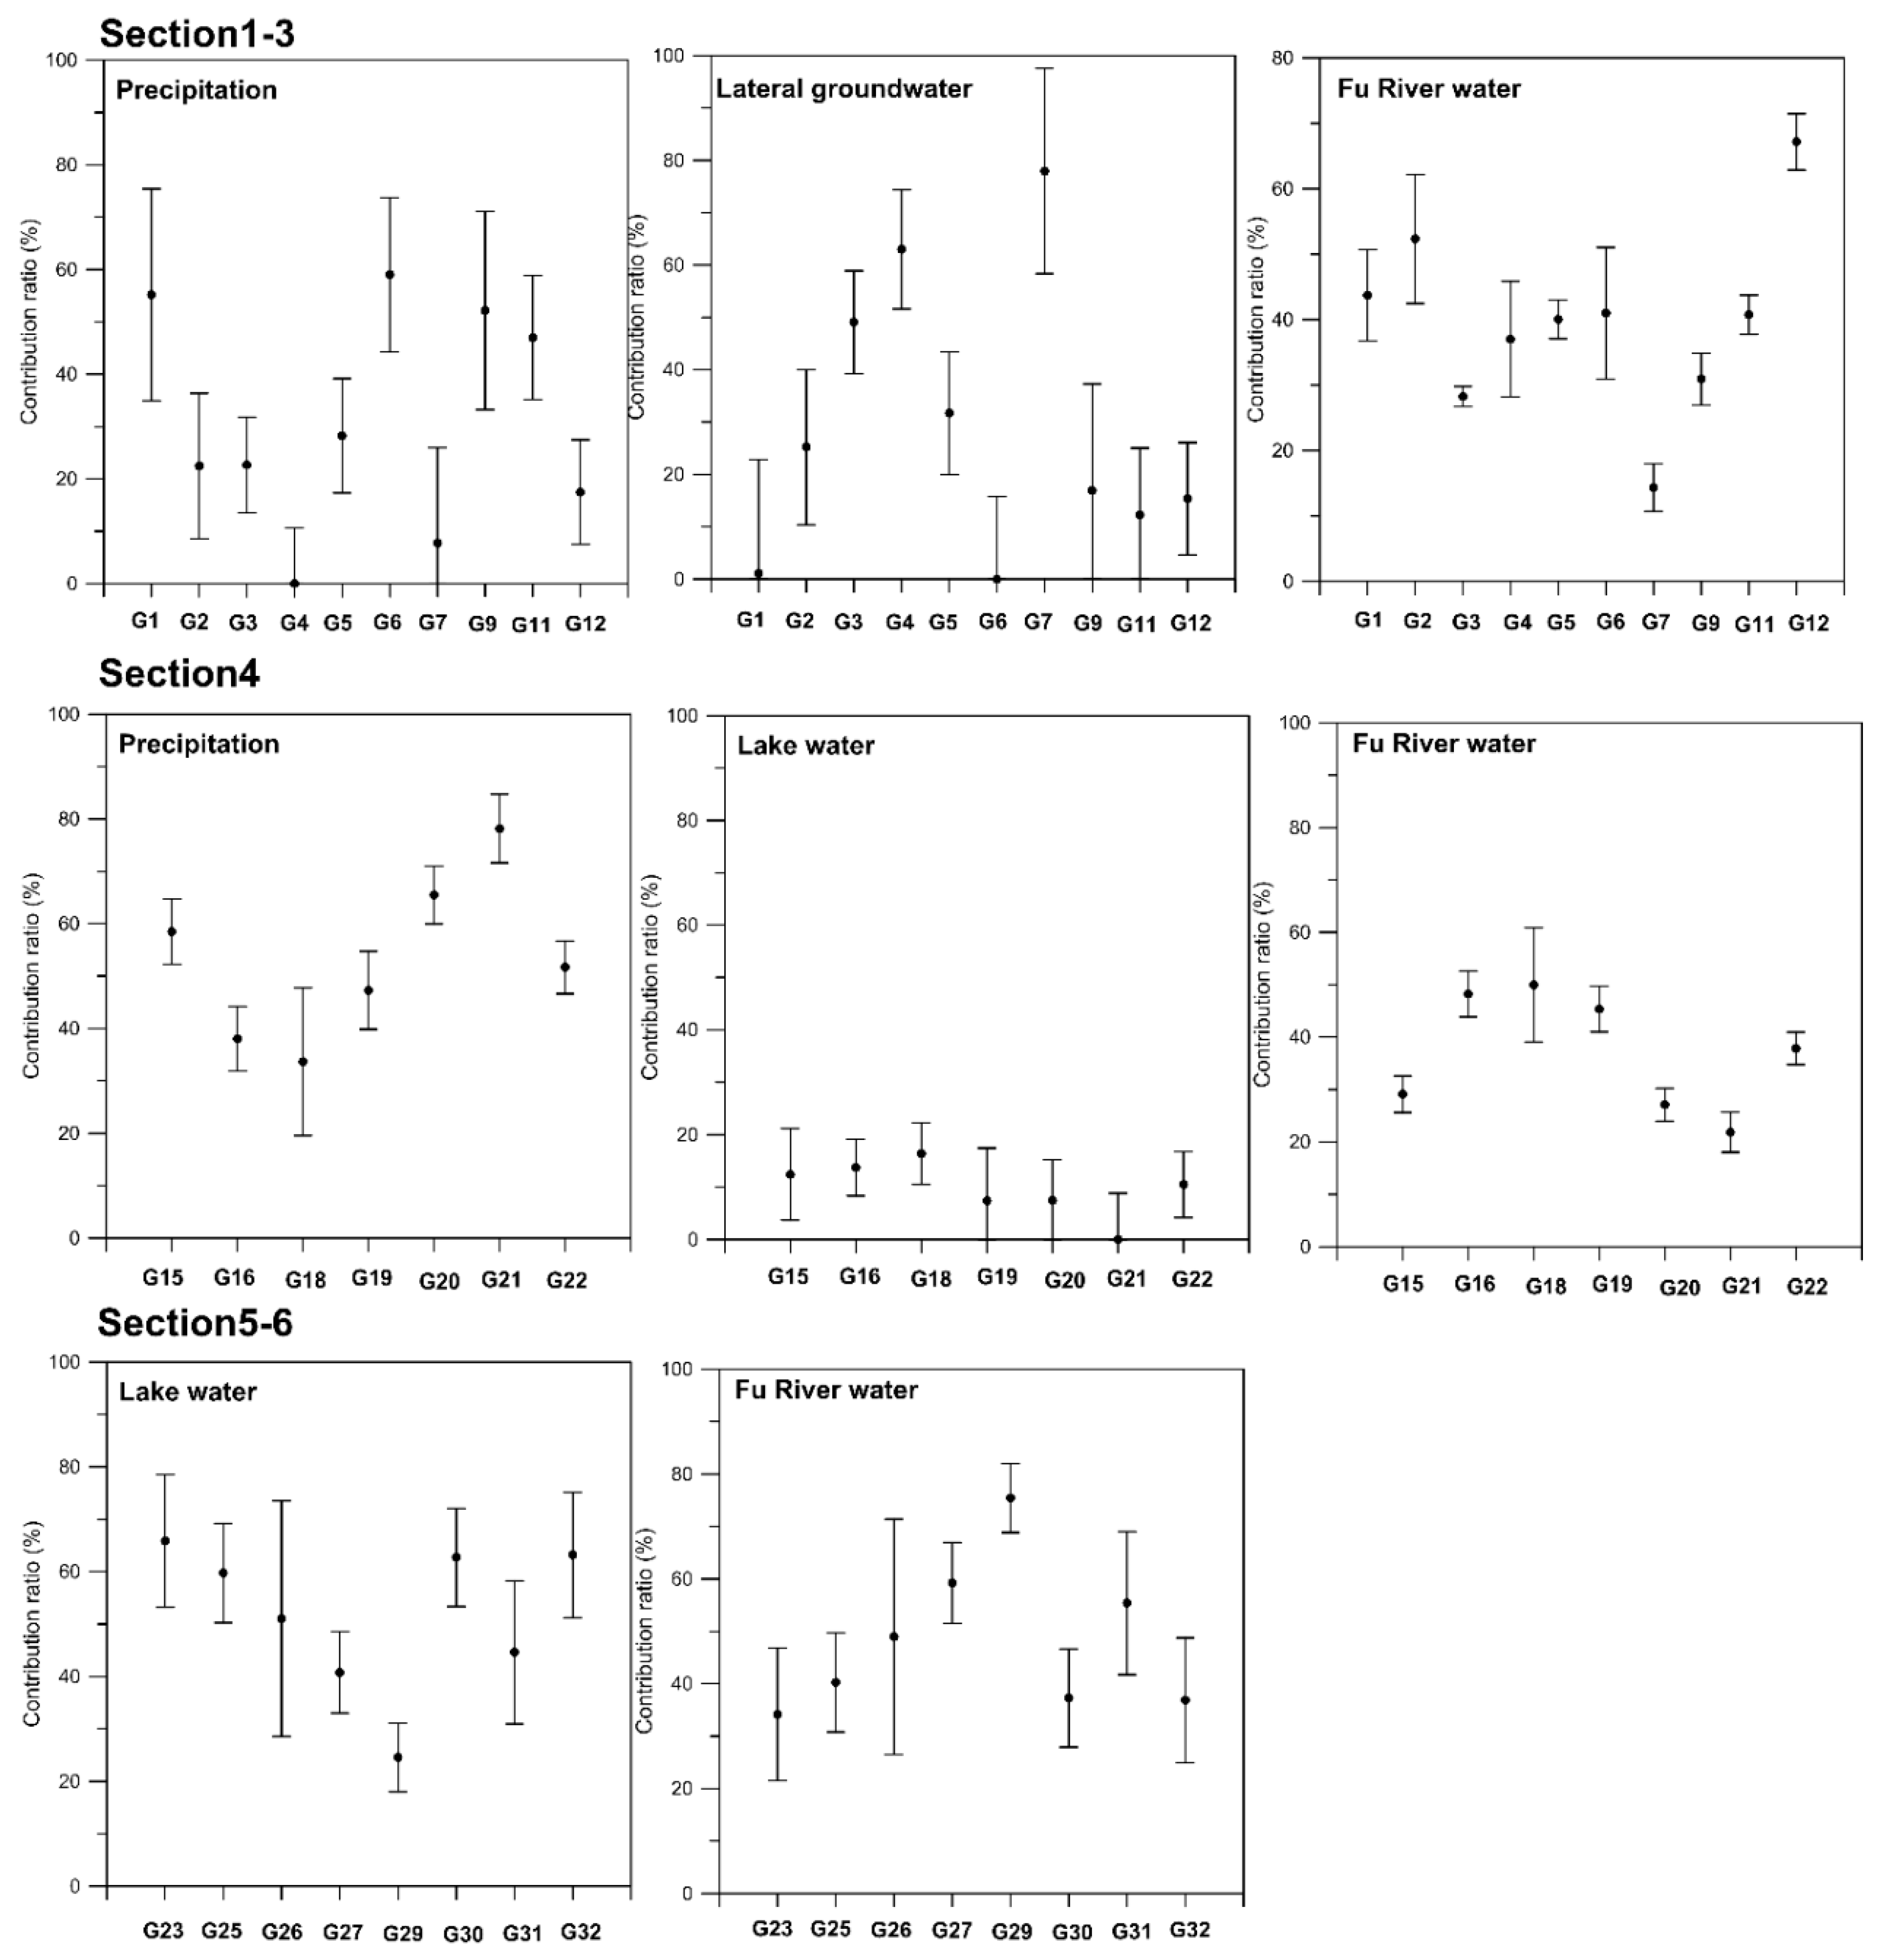
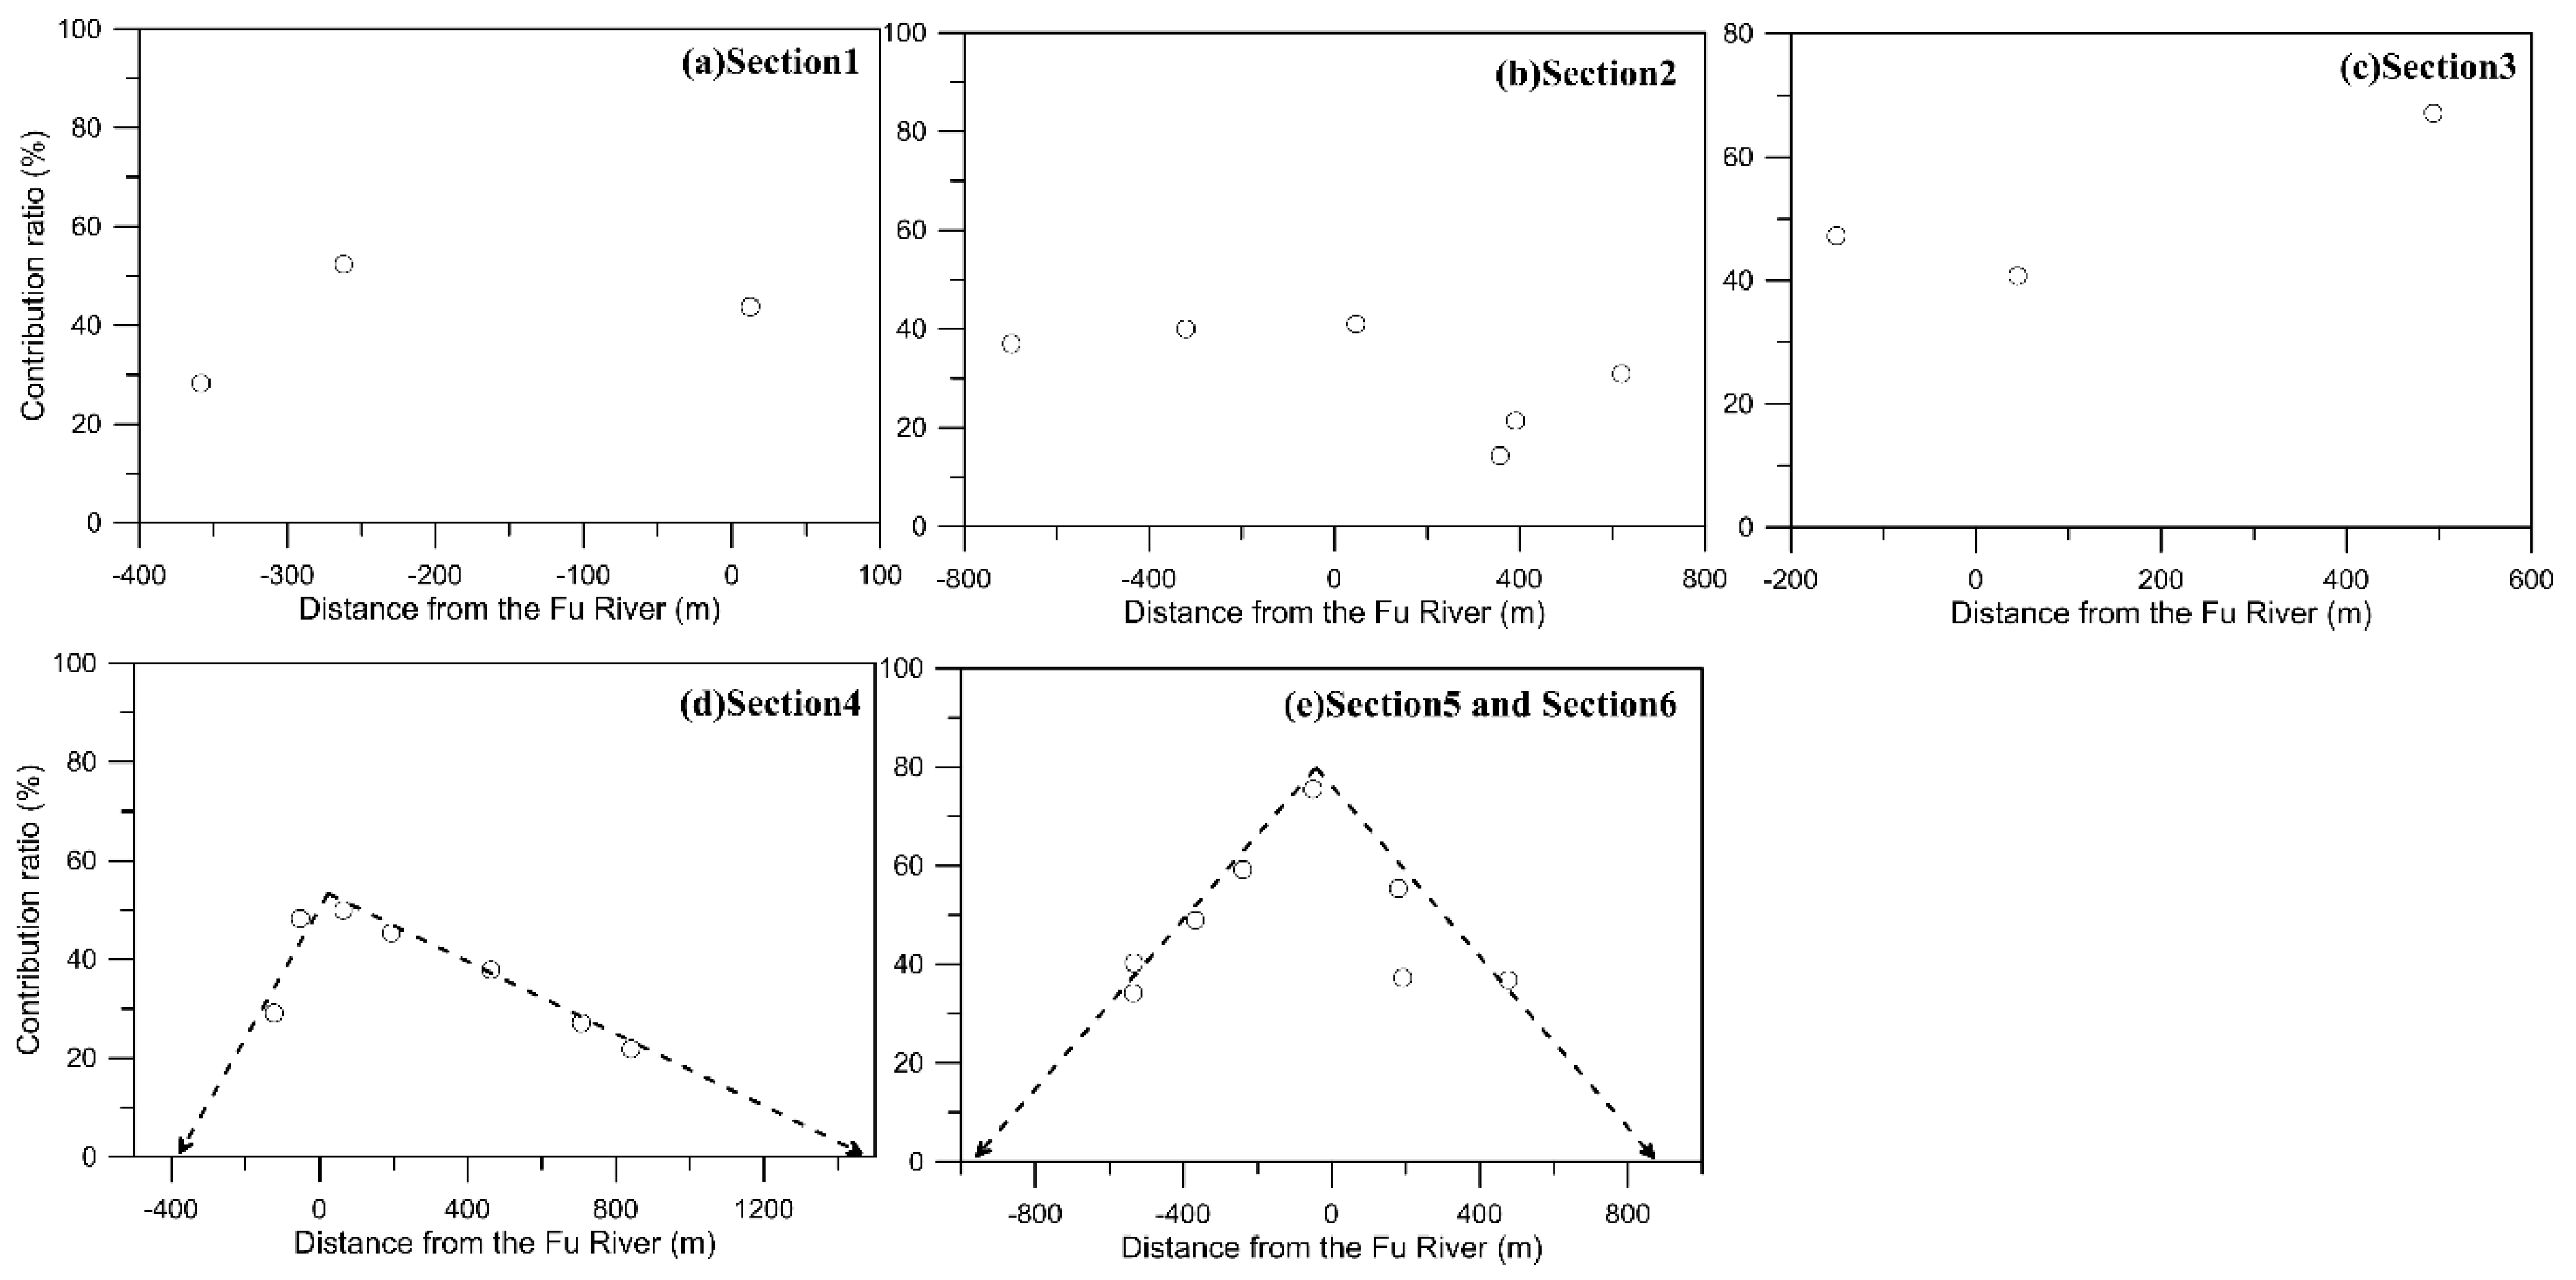
4.4. Application of End-Member Mixing Analysis
4.5. Anthropogenic Impact on Surface Water–Groundwater Interaction
5. Conclusions
Supplementary Materials
Author Contributions
Funding
Acknowledgments
Conflicts of Interest
References
- Winter, T.C. Recent advances in understanding the interaction of groundwater and surface water. Rev. Geophys. 1995, 33, 985–994. [Google Scholar] [CrossRef]
- Sophocleous, M. Interactions between groundwater and surfacewater: The state of the science. Hydrogeol. J. 2002, 10, 52–67. [Google Scholar] [CrossRef]
- Banks, E.W.; Simmons, C.T.; Love, A.J.; Shand, P. Assessing spatial and temporal connectivity between surface water and groundwater in a regional catchment: Implications for regional scale water quantity and quality. J. Hydrol. 2011, 404, 30–49. [Google Scholar] [CrossRef]
- Kalbus, E.; Reinstorf, F.; Schirmer, M. Measuring methods for groundwater and surface water interactions: A review. Hydrol. Earth Syst. Sci. 2006, 10, 873–887. [Google Scholar] [CrossRef]
- Winter, T.C. Ground Water and Surface Water: A Single Resource; US Geological Survey: Reston, VA, USA, 1999.
- Menció, A.; Galán, M.; Boix, D.; Mas-Pla, J. Analysis of stream–aquifer relationships: A comparison between mass balance and Darcy’s law approaches. J. Hydrol. 2014, 517, 157–172. [Google Scholar] [CrossRef]
- Woessner, W.W. Stream and fluvial plain ground water interactions: Rescaling hydrogeologic thought. Groundwater 2000, 38, 423–429. [Google Scholar] [CrossRef]
- Chen, Y.-J.; Li, W.-H.; Chen, Y.-I.; Liu, J.Z.; He, B. Ecological effect of synthesized governing in Tarim River valley. China Environ. Sci. 2007, 27, 24–28. (In Chinese) [Google Scholar]
- Kløve, B.; Ala-Aho, P.; Bertrand, G.; Gurdak, J.J.; Kupfersberger, H.; Kværner, J.; Muotkab, T.; Mykrä, H.; Preda, E.; Rossi, P.; et al. Climate change impacts on groundwater and dependent ecosystems. J. Hydrol. 2014, 518, 250–266. [Google Scholar] [CrossRef] [Green Version]
- Yang, L.; Song, X.; Zhang, Y.; Yuan, R.; Ma, Y.; Han, D.; Bu, H. A hydrochemical framework and water quality assessment of river water in the upper reaches of the Huai River Basin, China. Environ. Earth Sci. 2012, 67, 2141–2153. [Google Scholar] [CrossRef]
- Goudie, A. The Human Impact on the Natural Environment; Blackwell: Oxford, UK, 2006. [Google Scholar]
- McArthur, J.M.; Sikdar, P.K.; Hoque, M.A.; Ghosal, U. Waste-water impacts on groundwater: Cl/Br ratios and implications for arsenic pollution of groundwater in the Bengal Basin and Red River Basin, Vietnam. Sci. Total Environ. 2012, 437, 390–402. [Google Scholar] [CrossRef] [PubMed] [Green Version]
- Schirmer, M.; Leschik, S.; Musolff, A. Current research in urban hydrogeology—A review. Adv. Water Resour. 2013, 51, 280–291. [Google Scholar] [CrossRef]
- Wang, S.; Tang, C.; Song, X.; Wang, Q.; Zhang, Y.; Yuan, R. The impacts of a linear wastewater reservoir on groundwater recharge and geochemical evolution in a semi-arid area of the Lake Baiyangdian watershed, North China Plain. Sci. Total Environ. 2014, 482–483, 325–335. [Google Scholar] [CrossRef] [PubMed]
- Sakakibara, K.; Tsujimura, M.; Song, X.; Zhang, J. Spatiotemporal variation of the surface water effect on the groundwater recharge in a low-precipitation region: Application of the multi-tracer approach to the Taihang Mountains, North China. J. Hydrol. 2017, 545, 132–144. [Google Scholar] [CrossRef]
- De Vries, J.J.; Simmers, I. Groundwater recharge: An overview of processes and challenges. Hydrogeol. J. 2002, 10, 5–17. [Google Scholar] [CrossRef]
- Shivanna, K.; Kulkarni, U.P.; Joseph, T.B.; Navada, S.V. Contribution of storms to groundwater recharge in the semi-arid region of Karnataka, India. Hydrol. Process. 2004, 18, 473–485. [Google Scholar] [CrossRef]
- Li, F.; Pan, G.; Tang, C.; Zhang, Q.; Yu, J. Recharge Source and Hydrogeochemical Evolution of Shallow Groundwater in a Complex Alluvial Fan System, Southwest of North China Plain. Environ. Geol. 2008, 55, 1109–1122. [Google Scholar] [CrossRef]
- Qin, D.; Qian, Y.; Han, L.; Wang, Z.; Li, C.; Zhao, Z. Assessing impact of irrigation water on groundwater recharge and quality in arid environment using CFCs, tritium and stable isotopes, in the Zhangye Basin, Northwest China. J. Hydrol. 2011, 405, 194–208. [Google Scholar] [CrossRef]
- Yangui, H.; Zouari, K.; Trabelsi, R.; Rozanski, K. Recharge mode and mineralization of groundwater in a semi-arid region: Sidi Bouzid plain (Central Tunisia). Environ. Earth Sci. 2011, 63, 969–979. [Google Scholar] [CrossRef]
- Craig, H. Isotopic variations in meteoric waters. Science 1961, 133, 1702–1703. [Google Scholar] [CrossRef] [PubMed]
- Dansgaard, W. Stable isotopes in precipitation. Tellus 1964, 16, 436–468. [Google Scholar] [CrossRef]
- Song, X.; Liu, X.; Xia, J.; Yu, J.; Tang, C. The study on the relationship between surface water and groundwater in the Huaisha river catchment based on environmental isotopes. Sci. China Ser. D 2007, 37, 102–110. (In Chinese) [Google Scholar]
- Eriksson, E.; Khunakasem, V. Chloride concentration in groundwater, recharge rate and rate of deposition of chloride in the Israel Coastal Plain. J. Hydrol. 1969, 7, 178–197. [Google Scholar] [CrossRef]
- Scanlon, B.R.; Healy, R.W.; Cook, P.G. Choosing appropriate techniques for quantifying groundwater recharge. Hydrogeol. J. 2002, 10, 347. [Google Scholar] [CrossRef]
- Subyani, A.M. Use of chloride-mass balance and environmental isotopes for evaluation of groundwater recharge in the alluvial aquifer, Wadi Tharad, western Saudi Arabia. Environ. Geol. 2004, 46, 741–749. [Google Scholar] [CrossRef]
- Liu, Y.; Yamanaka, T. Tracing groundwater recharge sources in a mountain–plain transitional area using stable isotopes and hydrochemistry. J. Hydrol. 2012, 464–465, 116–126. [Google Scholar] [CrossRef]
- Wakui, H.; Yamanaka, T. Sources of groundwater recharge and their local differences in the central part of Nasu fan as revealed by stable isotope. Groundw. Hydrol. 2006, 48, 263–277, (In Japanese with English abstract). [Google Scholar] [CrossRef]
- Nakaya, S.; Uesugi, K.; Motodate, Y.; Ohmiya, I.; Komiya, H.; Masuda, H.; Kusakabe, M. Spatial separation of groundwater flow paths from a multi-flow system by a simple mixing model using stable isotopes of oxygen and hydrogen as natural tracers. Water Resour. Res. 2007, 43, 252–258. [Google Scholar] [CrossRef]
- Wu, Q.; Wang, G.; Zhang, W.; Cui, H.; Zhang, W. Estimation of Groundwater Recharge Using Tracers and Numerical Modeling in the North China Plain. Water 2016, 8, 353. [Google Scholar] [CrossRef]
- Zhang, G.; Fei, Y.; Liu, C.; Yan, M.; Wang, J. Adaptation between irrigation intensity and groundwater carrying capacity in North China Plain. Trans. Chin. Soc. Agric. Eng. 2013, 29, 1–10, (In Chinese with English abstract). [Google Scholar]
- Wang, S.; Shao, J.; Song, X.; Zhang, Y.; Huo, Z.; Zhou, X. Application of MODFLOW and geographic information system to groundwater flow simulation in North China Plain, China. Environ. Geol. 2008, 55, 1449–1462. [Google Scholar] [CrossRef]
- Song, X.F.; Li, F.D.; Yu, J.J.; Tang, C.-Y.; Yang, C.; Liu, X.; Sakura, Y.; Kondoh, A. Characteristics of groundwater cycle using deuterium, oxygen-18 and hydrochemistry in Chaobai River Basin. Geogr. Res. 2007, 26, 1–21. (In Chinese) [Google Scholar]
- Moiwo, J.P.; Yang, Y.; Li, H.; Han, S.; Yang, Y. Impact of water resource exploitation on the hydrology and water storage in Baiyangdian Lake. Hydrol. Process. 2010, 24, 3026–3039. [Google Scholar] [CrossRef]
- Hu, S.S.; Zheng, H.X.; Liu, C.M.; Wang, Z.; Yu, J. Assessing the impacts of climate variability and human activities on streamflow in the water source area of Baiyangdian Lake. Acta Geogr. Sin. 2012, 67, 62–70. (In Chinese) [Google Scholar] [CrossRef]
- Wang, S.; Tang, C.; Song, X.; Yuan, R.; Wang, Q.; Zhang, Y. Using major ions and δ15N-NO3− to identify nitrate sources and fate in an alluvial aquifer of the Baiyangdian lake watershed, North China Plain. Environ. Sci. Process. Impacts 2013, 15, 1430–1443. [Google Scholar] [CrossRef] [PubMed]
- Yang, Y.; Watanabe, M.; Zhang, X.; Zhang, J.; Wang, Q.; Hayashi, S. Optimizing irrigation management for wheat to reduce groundwater depletion in the piedmont region of the Taihang Mountains in the North China Plain. Agric. Water Manag. 2006, 82, 25–44. [Google Scholar] [CrossRef]
- Zhang, Y.; Wang, G.; Wang, S.; Yuan, R.; Tang, C.; Song, X. Hydrochemical characteristics and geochemistry evolution of groundwater in the plain area of the Lake Baiyangdian watershed, North China Plain. J. Groundw. Sci. Eng. 2018, 6, 220–233. [Google Scholar]
- Li, C.; Zheng, X.; Zhao, F.; Wang, X.; Cai, Y.; Zhang, N. Effects of Urban Non-Point Source Pollution from Baoding City on Baiyangdian Lake, China. Water 2017, 9, 249. [Google Scholar] [CrossRef]
- Cui, B.; Li, X.; Zhang, K. Classification of hydrological conditions to assess water allocation schemes for Lake Baiyangdian in North China. J. Hydrol. 2010, 385, 247–256. [Google Scholar] [CrossRef]
- Liu, C.; Xie, G.; Huang, H. Shrinking and drying up of Lake Baiyangdian wetland: A natural or human cause? Chin. Geogr. Sci. 2006, 16, 314–319. [Google Scholar] [CrossRef]
- Wang, S.; Yuan, R.; Tang, C.; Song, X.; Currell, M.; Yang, Z.; Sheng, Z. Combination of CFCs and stable isotopes to characterize the mechanism of surface water-groundwater interaction in a headwater basin of the North China Plain. Hydrol. Process. 2018, 32, 1571–1587. [Google Scholar] [CrossRef]
- Chen, W. Landform Environment and Its Formation in North China; Science Press: Beijing, China, 2008. (In Chinese) [Google Scholar]
- Yuan, R.-Q.; Wang, S.-Q.; Song, X.; Tang, C. Changes in flow and chemistry of groundwater heavily affected by human impacts in the Baiyangdian catchment of the North China Plain. Environ. Earth Sci. 2017, 76, 571. [Google Scholar] [CrossRef]
- Zhang, Z.; Fei, Y.; Chen, Z.; Zhao, Z.; Xie, Z.; Wang, Y.; Miao, J.; Yang, L.; Shao, J.; Jin, M.; et al. Investigation and Assessment of the Sustainable Use of Groundwater in North China Plain; Geological Publishing House: Beijing, China, 2009. (In Chinese) [Google Scholar]
- Qiu, R.; Li, Y.; Yang, Z.; Shi, J. Influence of water quality change in Fu River on Wetland Baiyangdian. Front. Earth Sci. China 2009, 3, 397–401. [Google Scholar] [CrossRef]
- Jun, Y. Research on Drought Reduction Theory and Method in Basin-with Baiyangdian River Basin as the Case Study; China Institute of Water Resources and Hydropower Research: Beijing, China, 2017. (In Chinese) [Google Scholar]
- Coplen, T.B. Guidelines and recommended terms for expression of stable-isotope-ratio and gas-ratio measurement results. Rapid Commun. Mass Spectrom. 2011, 25, 2538–2560. [Google Scholar] [CrossRef] [PubMed] [Green Version]
- Gat, J.R. Oxygen and Hydrogen isotopes in the hydrologic cycle. Annu. Rev. Earth Planet. Sci. 1996, 24, 225–262. [Google Scholar] [CrossRef]
- Butler, T.W., II. Application of multiple geochemical indicators, including the stable isotopes of water, to differentiate water quality evolution in a region influenced by various agricultural practices and domestic wastewater treatment and disposal. Sci. Total Environ. 2007, 388, 149–167. [Google Scholar] [CrossRef] [PubMed]
- Clark, I.; Fritz, P. Environmental Isotopes in Hydrogeology; CRC Press: Lewis, NY, USA, 1997. [Google Scholar]
- Majoube, M. Fractionnement en oxygene-18 et en deuterium entre l’eau et sa vapeur. J. Chem. Phys. 1971, 197, 1423–1436. [Google Scholar] [CrossRef]
- Horita, J.; Wesolowski, D.J. Liquid-vapor fractionation of oxygen and hydrogen isotopes of water from the freezing to the critical temperature. Geochim. Cosmochim. Acta 1994, 58, 3425–3437. [Google Scholar] [CrossRef]
- Gonfiantini, R. Environmental isotopes in lake studies. In Handbook of Environmental Isotope Geochemistry; Fritz, P., Fontes, J.-C., Eds.; Elsevier: Amsterdam, The Netherlands, 1986; pp. 113–168. [Google Scholar]
- Phillips, D.L.; Gregg, J.W. Uncertainty in source partitioning using stable isotopes. Oecologia 2001, 127, 171–179. [Google Scholar] [CrossRef] [PubMed]
- Yuan, R.Q.; Song, X.F.; Wang, P.; Zhang, Y.; Wang, S.; Tang, C.Y. Impacts of percolation in Baiyangdian Lake on groundwater. Adv. Water Sci. 2012, 23, 751–756. (In Chinese) [Google Scholar]
- Edmunds, W.M.; Guendouz, A.H.; Mamou, A.; Moulla, A.; Shand, P.; Zouari, K. Groundwater evolution in the Continential Intercalaire aquifer of southern Algeria and Tunisia: Trace element and isotopic indicators. Appl. Geochem. 2003, 18, 805–822. [Google Scholar] [CrossRef]
- Möller, P.; Rosenthal, E.; Geyer, S.; Flexer, A. Chemical evolution of saline waters in the Jordan–Dead sea transform and in adjoining areas. Int. J. Earth Sci. 2007, 96, 541–566. [Google Scholar] [CrossRef]
- Cheng, J. The existed problems & counter measures on utilization of water conservancy & hydropower of the Tanghe river valley. Groundwater 2003, 25, 49–51. (In Chinese) [Google Scholar]


| Type | Number | Item | pH | EC | Ca2+ | Mg2+ | Na+ | K+ | Cl− | SO42− | NO3− | HCO3− | TDS |
|---|---|---|---|---|---|---|---|---|---|---|---|---|---|
| /μS·cm−1 | /mg·L−1 | /g·L−1 | |||||||||||
| Fu River water | 23 | Min | 7.12 | 1010.7 | 84.8 | 33.4 | 118.4 | 17.7 | 151.7 | 6.4 | 26.2 | 300.6 | 0.70 |
| Max | 7.99 | 1682.0 | 110.8 | 43.2 | 261.7 | 32.1 | 425.7 | 119.0 | 74.5 | 506.9 | 1.15 | ||
| Mean | 7.67 | 1285.9 | 93.6 | 36.5 | 191.8 | 22.7 | 290.5 | 70.5 | 51.1 | 376.1 | 0.94 | ||
| C.V. (%) | 2.92 | 14.5 | 8.3 | 7.3 | 28.3 | 15.3 | 32.2 | 46.6 | 29.0 | 15.5 | 0.01 | ||
| Lake water | 28 | Min | 7.10 | 676.0 | 44.7 | 21.9 | 49.2 | 5.2 | 54.4 | 56.5 | 0.0 | 160.7 | 0.38 |
| Max | 8.92 | 1297.0 | 82.7 | 49.3 | 214.4 | 19.5 | 308.2 | 391.9 | 34.0 | 385.8 | 0.96 | ||
| Mean | 8.11 | 966.8 | 63.9 | 33.3 | 104.6 | 12.6 | 128.6 | 121.3 | 5.7 | 282.6 | 0.61 | ||
| C.V. (%) | 4.25 | 19.5 | 13.9 | 20.5 | 36.1 | 25.8 | 42.2 | 55.7 | 130.2 | 17.1 | 0.02 | ||
| Groundwater | 107 | Min | 6.43 | 746.8 | 29.3 | 33.0 | 41.4 | 0.0 | 58.8 | 65.3 | 0.0 | 324.7 | 0.53 |
| Max | 7.96 | 2600.3 | 242.2 | 249.4 | 296.5 | 19.5 | 339.4 | 464.6 | 291.4 | 1692.4 | 1.92 | ||
| Mean | 7.45 | 1356.2 | 109.6 | 106.7 | 136.4 | 3.6 | 186.9 | 159.0 | 39.7 | 584.5 | 1.03 | ||
| C.V. (%) | 3.31 | 23.9 | 44.4 | 42.7 | 41.0 | 84.5 | 37.7 | 48.9 | 121.6 | 31.0 | 0.03 | ||
| Type | δ18O (‰) | δ2H (‰) | ||||||
|---|---|---|---|---|---|---|---|---|
| Min | Max | Mean | C.V. (%) | Min | Max | Mean | C.V. (%) | |
| Fu River water | −8.4 | −7.3 | −8.0 | −3.9 | −61 | −54 | −58 | −3 |
| Lake water | −7.7 | −1.4 | −5.7 | −28.3 | −57 | −28 | −47 | −17 |
| Groundwater | −8.7 | −6.0 | −7.5 | −8.4 | −64 | −49 | −57 | −6 |
| Section | ID | Distance | PW (%) | LGW (%) | BYD (%) | FR (%) |
|---|---|---|---|---|---|---|
| Sections 1–3 | G1 | 12.4 | 55.2 | 1.1 | / | 43.7 |
| G2 | −262.1 | 22.5 | 25.2 | / | 52.3 | |
| G3 | −358.1 | 22.7 | 49.1 | / | 28.2 | |
| G4 | −698.1 | 0 | 63.0 | / | 37 | |
| G5 | −320.8 | 28.2 | 31.7 | / | 40 | |
| G6 | 46 | 59.0 | 0.0 | / | 41 | |
| G7 | 357.2 | 7.7 | 77.9 | / | 14.3 | |
| G9 | 619.8 | 52.1 | 16.9 | / | 30.9 | |
| G11 | 44.6 | 47.0 | 12.3 | / | 40.7 | |
| G12 | 493.9 | 17.5 | 15.4 | / | 67.2 | |
| Section 4 | G15 | −122.9 | 58.5 | / | 12.4 | 29.1 |
| G16 | −51.6 | 38.0 | / | 13.7 | 48.2 | |
| G18 | 64.3 | 33.6 | / | 16.4 | 50.0 | |
| G19 | 194.4 | 47.3 | / | 7.4 | 45.3 | |
| G20 | 706.1 | 65.5 | / | 7.4 | 27.1 | |
| G21 | 840.7 | 78.2 | / | 0.0 | 21.8 | |
| G22 | 462.7 | 51.7 | / | 10.5 | 37.8 | |
| Sections 5–6 | G23 | −535.5 | / | / | 65.8 | 34.2 |
| G25 | −533.2 | / | / | 59.7 | 40.3 | |
| G26 | −367.2 | / | / | 51.0 | 49.0 | |
| G27 | −239.7 | / | / | 40.8 | 59.2 | |
| G29 | −51.2 | / | / | 24.6 | 75.4 | |
| G30 | 191.9 | / | / | 62.7 | 37.3 | |
| G31 | 179.9 | / | / | 44.6 | 55.4 | |
| G32 | 476.4 | / | / | 63.2 | 36.8 |
© 2019 by the authors. Licensee MDPI, Basel, Switzerland. This article is an open access article distributed under the terms and conditions of the Creative Commons Attribution (CC BY) license (http://creativecommons.org/licenses/by/4.0/).
Share and Cite
Zhu, M.; Wang, S.; Kong, X.; Zheng, W.; Feng, W.; Zhang, X.; Yuan, R.; Song, X.; Sprenger, M. Interaction of Surface Water and Groundwater Influenced by Groundwater Over-Extraction, Waste Water Discharge and Water Transfer in Xiong’an New Area, China. Water 2019, 11, 539. https://doi.org/10.3390/w11030539
Zhu M, Wang S, Kong X, Zheng W, Feng W, Zhang X, Yuan R, Song X, Sprenger M. Interaction of Surface Water and Groundwater Influenced by Groundwater Over-Extraction, Waste Water Discharge and Water Transfer in Xiong’an New Area, China. Water. 2019; 11(3):539. https://doi.org/10.3390/w11030539
Chicago/Turabian StyleZhu, Meijia, Shiqin Wang, Xiaole Kong, Wenbo Zheng, Wenzhao Feng, Xianfu Zhang, Ruiqiang Yuan, Xianfang Song, and Matthias Sprenger. 2019. "Interaction of Surface Water and Groundwater Influenced by Groundwater Over-Extraction, Waste Water Discharge and Water Transfer in Xiong’an New Area, China" Water 11, no. 3: 539. https://doi.org/10.3390/w11030539